Article

Practical Grid-Based Spatial Estimation of Number of Electric Vehicles and Public Chargers for Country-Level Planning with Utilization of GIS Data

by
Pokpong Prakobkaew
and
Somporn Sirisumrannukul
*
Department of Electrical and Computer Engineering, Faculty of Engineering, King Mongkut’s University of Technology North Bangkok, Bangkok 10800, Thailand
*
Author to whom correspondence should be addressed.
Submission received: 8 April 2022 / Revised: 10 May 2022 / Accepted: 19 May 2022 / Published: 24 May 2022

Abstract

:
This research proposes an approach to estimate the number of different types of electric vehicles for a vast area or an entire country, which can be divided into a large number of small areas such as a subdistrict scale. The estimation methodology extensively utilizes the vehicle registration data in conjunction with Thailand’s so-called EV30@30 campaign and GIS-based road infrastructure data. To facilitate the analysis, square grids are built to form cells representing the number of electric vehicles in any specific area of interest. This estimated number of electric vehicles is further analyzed to determine the energy consumption, calculate the recommended number of public chargers, and visualize an increase in the substation loads from those charging stations. The effectiveness of the proposed methods is demonstrated using the whole area of Thailand, consisting of five regions with a total area of 513,120 km2. The results show that the trucks contribute the most energy consumption while taxis rely on a lot of public chargers. The total energy consumption is about 79.4 GWh per day. A total of 12,565 public fast chargers are needed across the country to properly support daily travel, around half of them being located in the metropolitan area.

1. Introduction

The electric vehicle (EV) is one of the most efficient ways to address a variety of environmental issues, including air pollution and climate change. Furthermore, compared to a conventional car, the EV has higher energy efficiency and lower maintenance costs [1]. There are also many other advantages that can attract people’s interest. Many people, however, are still hesitant to acquire or convert their internal combustion engine vehicles (ICEVs) to EVs due to a lack of public charging stations [2]. Furthermore, investors are concerned that investing in public fast-charge points may not yield a desirable return if there are only a few users. The chicken and egg dilemma arose in the early stages of EV adoption, and Thailand [3], like many other countries, is experiencing this situation [4].
The EV fast charger is a costly piece of equipment with a low return on investment [5]. Because the overall utilization rate of EV chargers is projected to be low, installing too many of them may result in financial difficulty. Not only that, but if no energy storage system or charging management system is in place when too many chargers are utilized at the same time, the electric distribution systems nearby may be overburdened [6]. Therefore, estimating EV charging demand is an effective way for both the private sector and the government to deal with the aforementioned problem. A private company can use the estimation to plan how many chargers should be installed in their charging stations now and in the future. It is possible that the expense of upgrading would be higher than the cost of building the large one in the first place. Meanwhile, the government can use the estimation to make suitable decisions, such as determining how much budget is needed for various incentive programs or infrastructure development planning.
This paper proposed a methodology for grid-based spatial estimation that can accommodate a large or wide geographical area such as a country for the purpose of policy formulation and implementation of national-level charging infrastructure planning within limited data. We utilized car registration information as a key in the estimation while leveraging GIS data. The number of chargers was then obtained by calculating the charging demand and, as a result, the number of EVs in the area. Most importantly, to make the obtained results more practically useful in various applications, grids were created with fixed-sized square cells for small-scale spatial applications. The center position of each cell was used to represent the estimated number of EVs in small-size grids (grids with a size of 5 × 5 km2 across the country) to reduce computational power requirements.
The developed model covers all types of vehicles (e.g., motorcycles, buses, and trucks), considering driving behaviors and the likelihood of the need for public recharging. The methodology is demonstrated by a case study that considers the total number of EVs based on the Thailand EV30@30 plan, around 4.1 million units of every EV type combined. The estimation of the energy consumption of all types of EVs and the recommended number of public chargers in all five regions of Thailand is in accordance with electric power utilities’ service areas of Thailand (metropolitan, central, north, northeast, and south). Under the assumption that charging stations should be connected to the nearest substation, the Voronoi diagram was proposed to analyze the MW loading of electrical substations.
The proposed methodologies and the case study allowed the following key contributions to be reached for the proposed estimated number of EVs, corresponding energy consumption, and the recommended number of public chargers in each of the predefined subareas for the whole country of Thailand.
  • The number of EVs was estimated using the subdistrict-level vehicle registration information because it was the highest data resolution that we could acquire due to the constraint on data privacy regulation.
  • The road GIS data was utilized to provide more reasonable results for small-scale specific areas since the data would represent the actual vehicle usage, and the vehicle registration information itself could only provide the overall vehicle density for a vast area. Therefore, the estimated number of EVs based on the overall vehicle density alone would not be appropriate for some rugged or inaccessible areas such as forest and mountain areas.
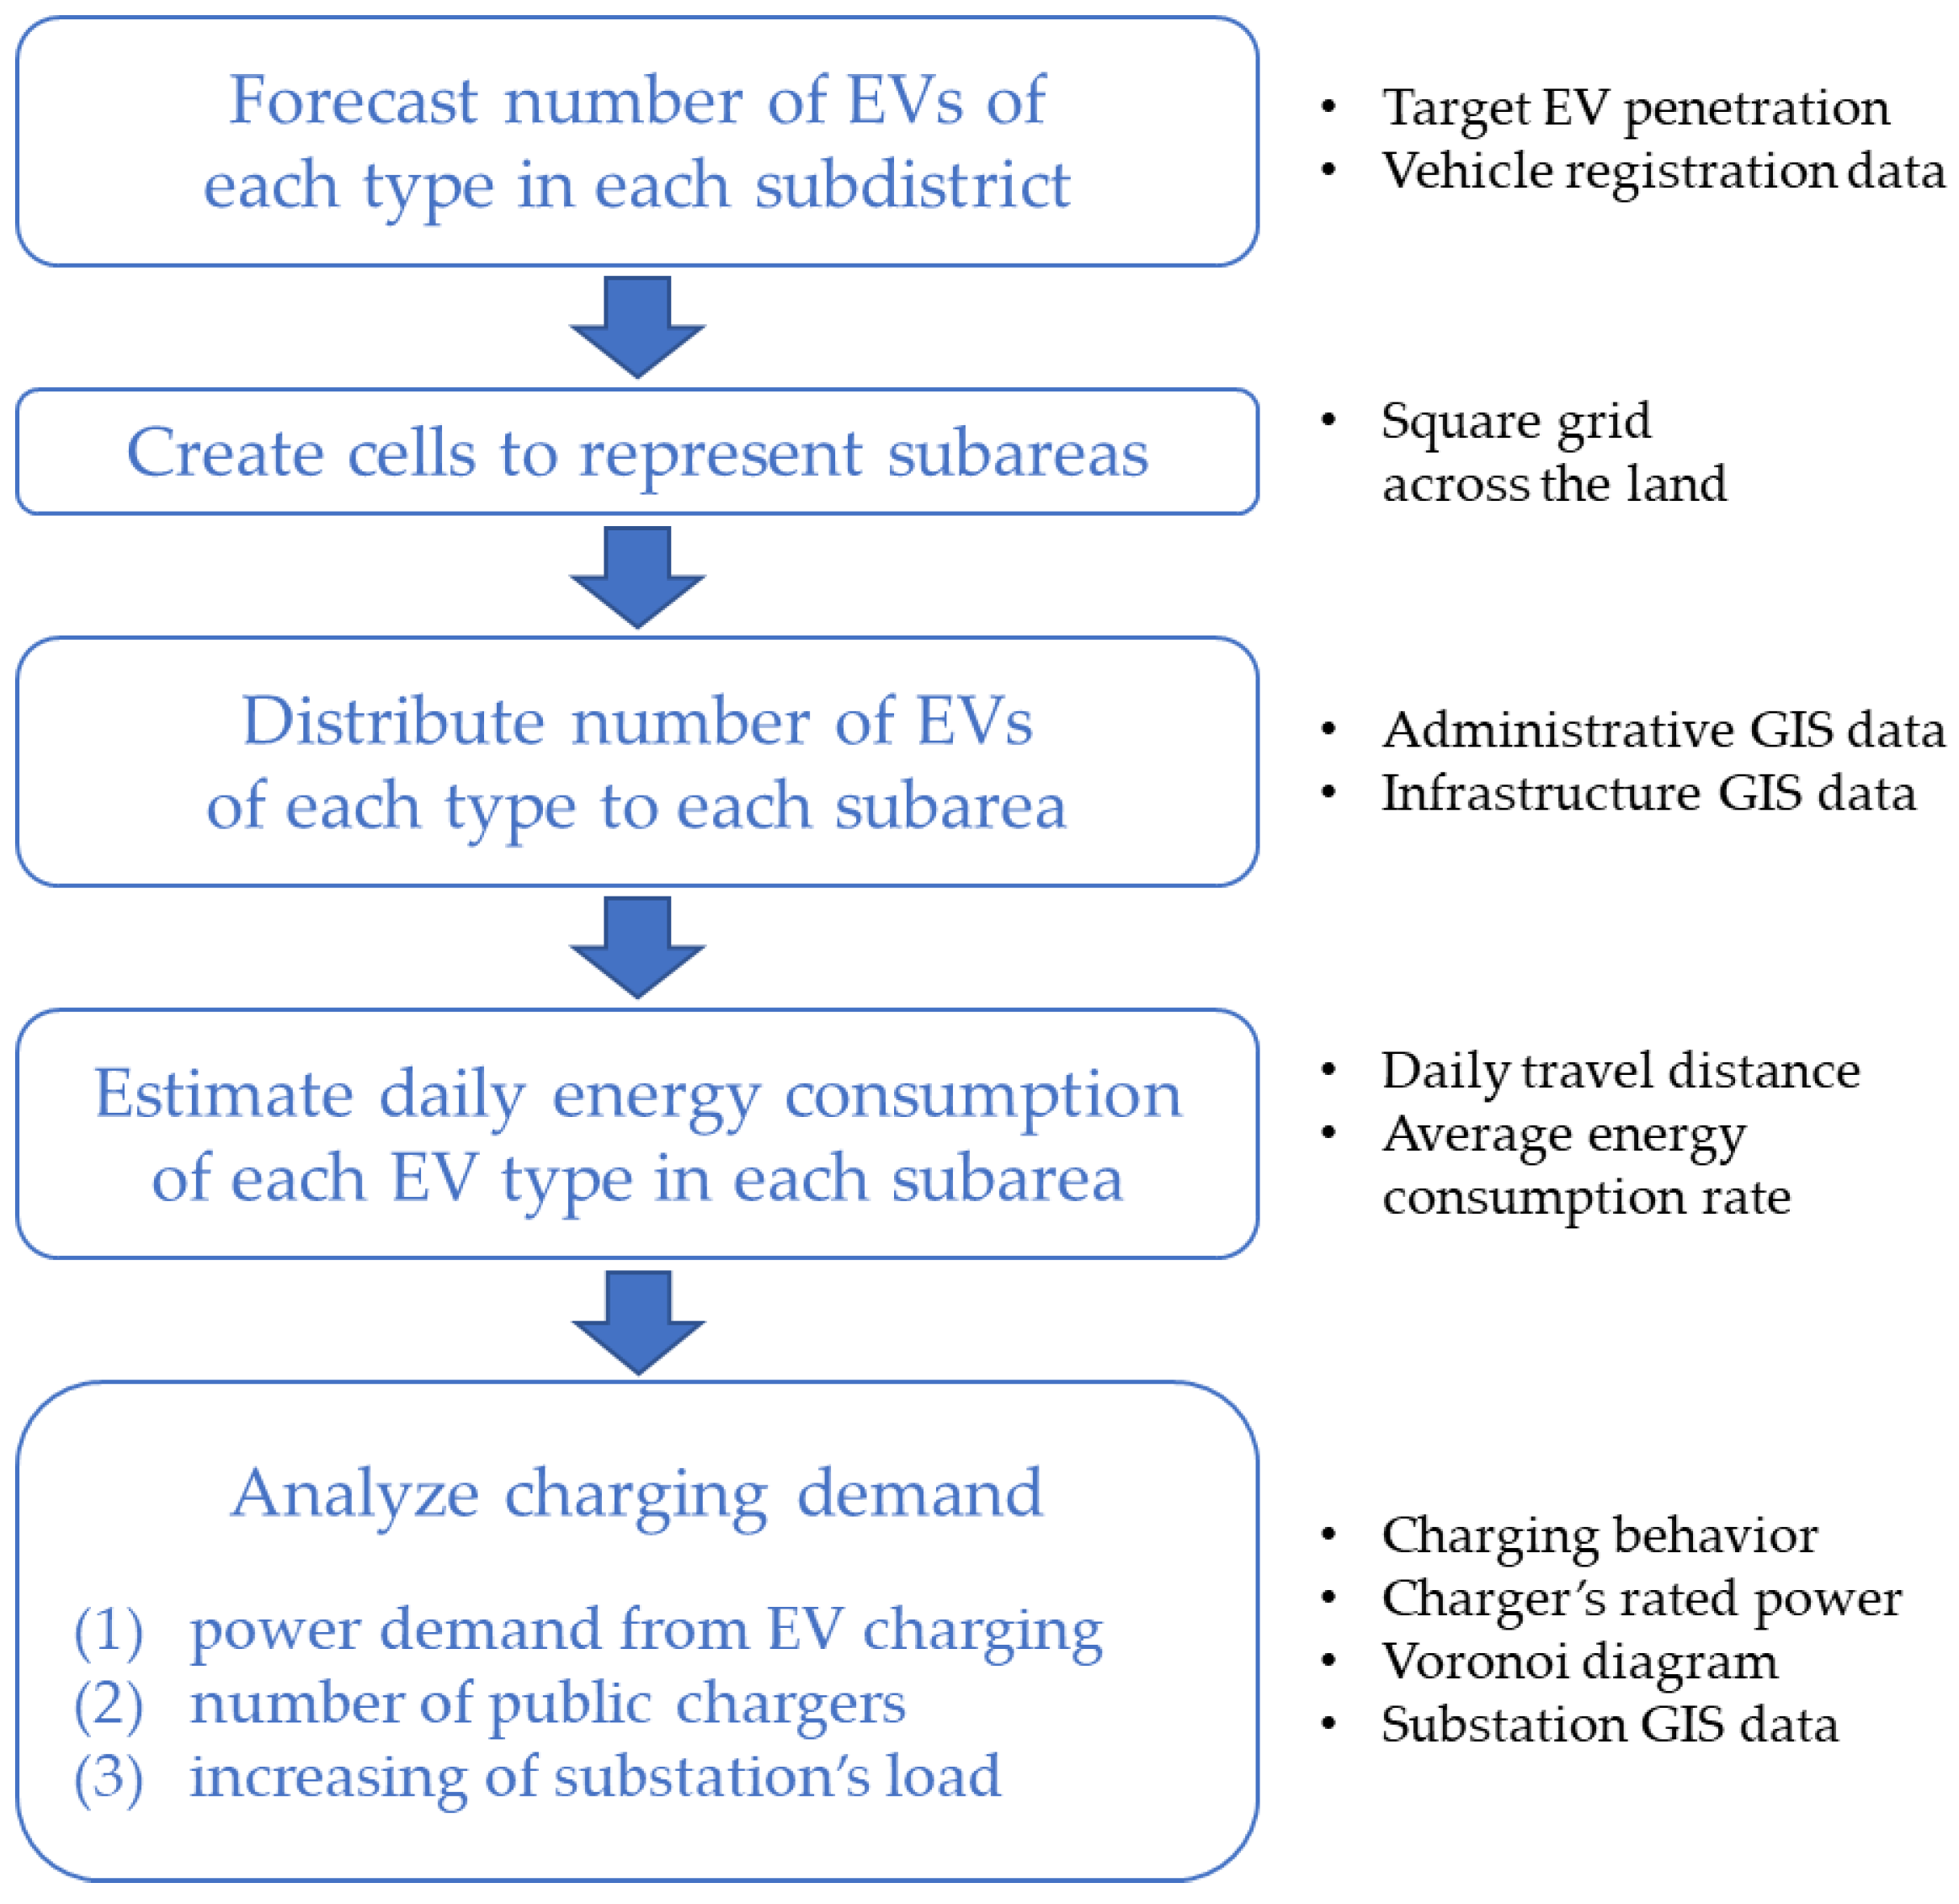
  • Grids with fixed-sized square cells were created for small-scale spatial applications use in mind, making forecast results more practically useful in various works. Additionally, not only would it help policymakers to easily understand and visualize, but the flexibility in setting the grid size according to the specific application also reduced the unnecessary computational burden, particularly in large-scale implementation.
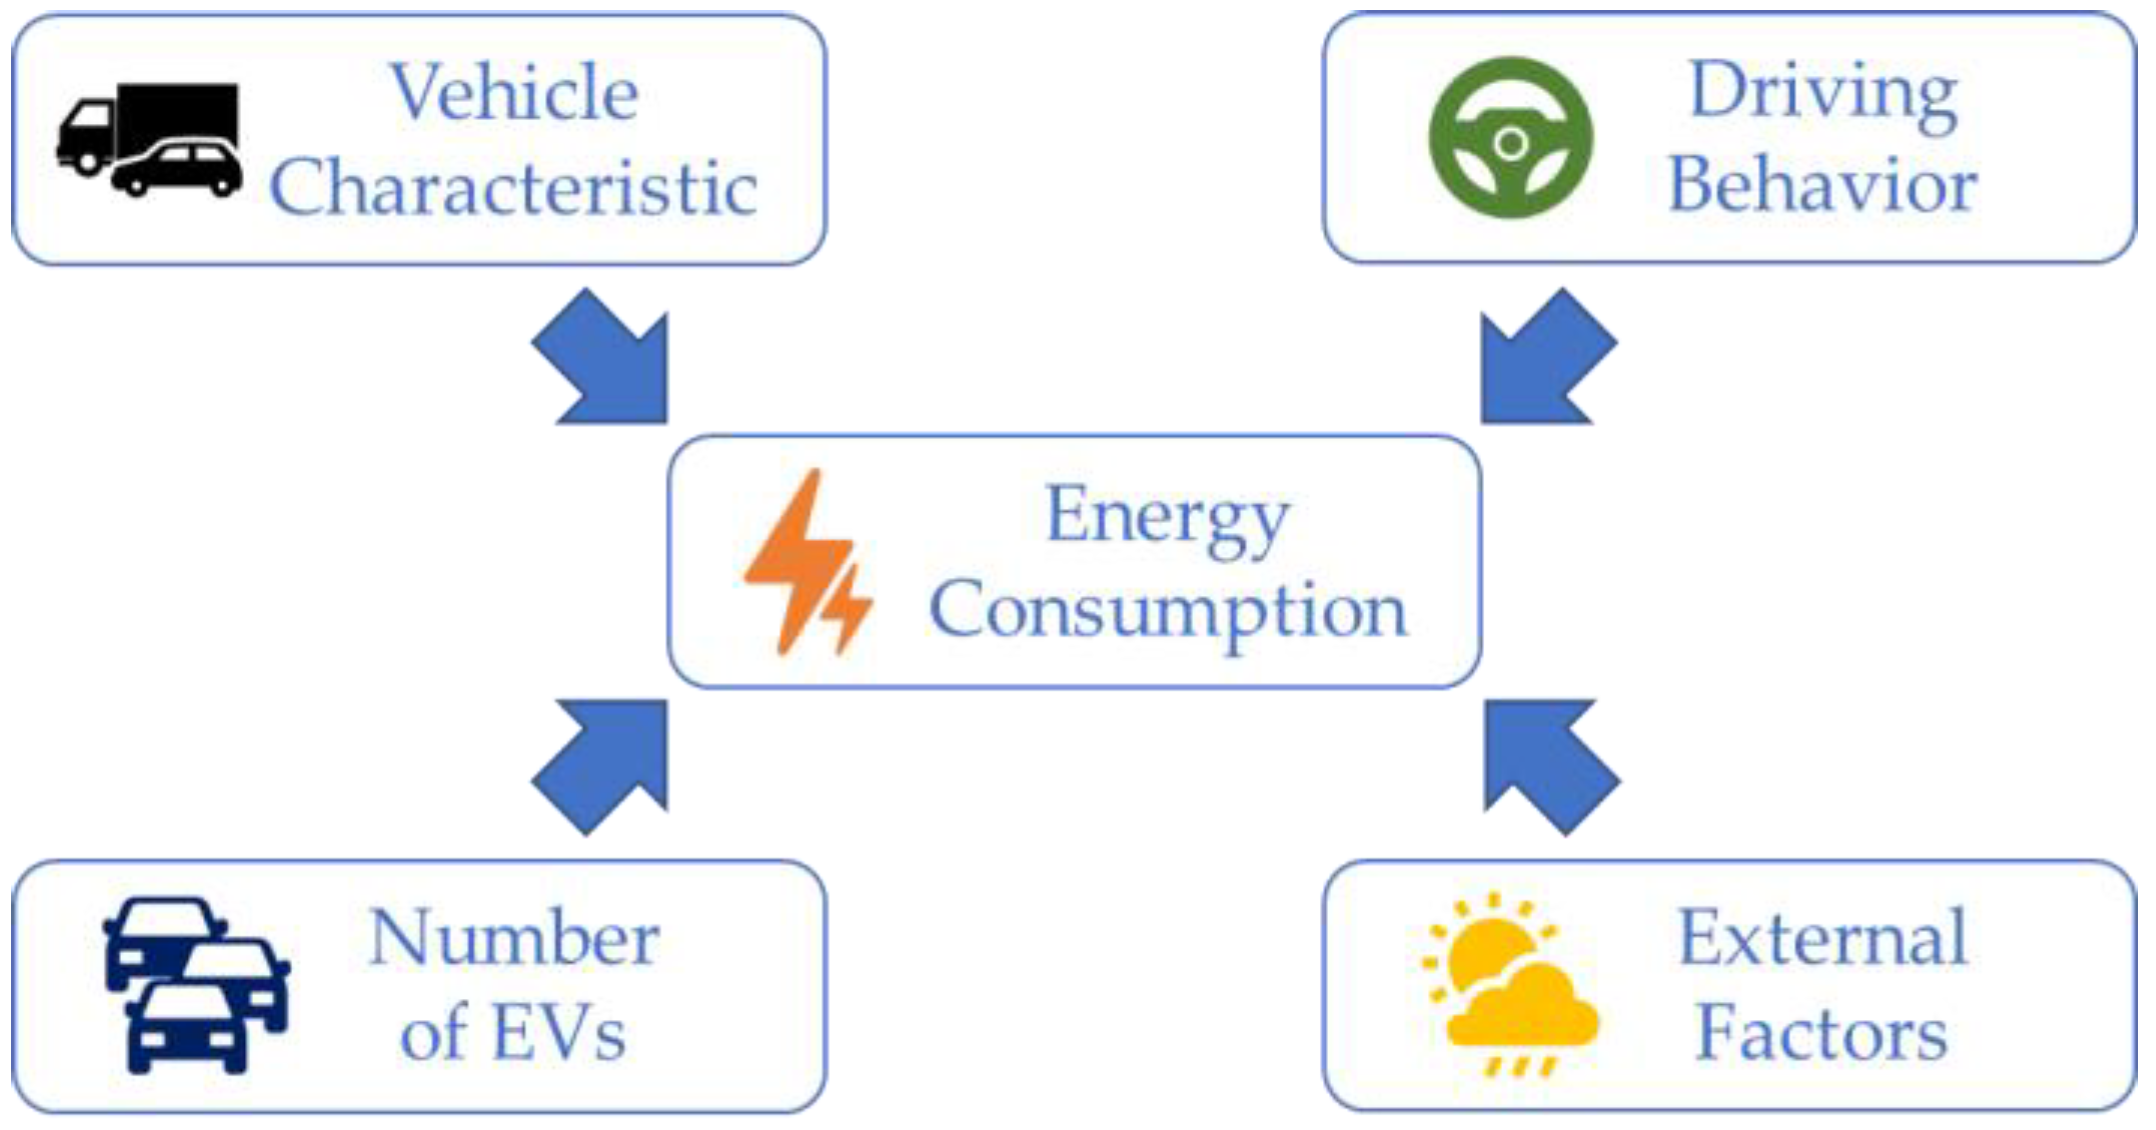
  • The estimation of energy consumption of EVs was determined by three factors: (1) the number of EVs, (2) the characteristics of EVs, and (3) the driving behavior of EV users. Each type of EV would have different details for each of the factors; for example, buses and trucks have significantly higher energy consumption rates and average daily mileage than others.
  • The probability of charging locations and plug-in time was also taken into account because it would affect the public charger demand. The personal EVs tend to be recharged in residential premises after work in the evening whereas, in EVs such as taxis, recharging can occur in charging stations at any time of the day.
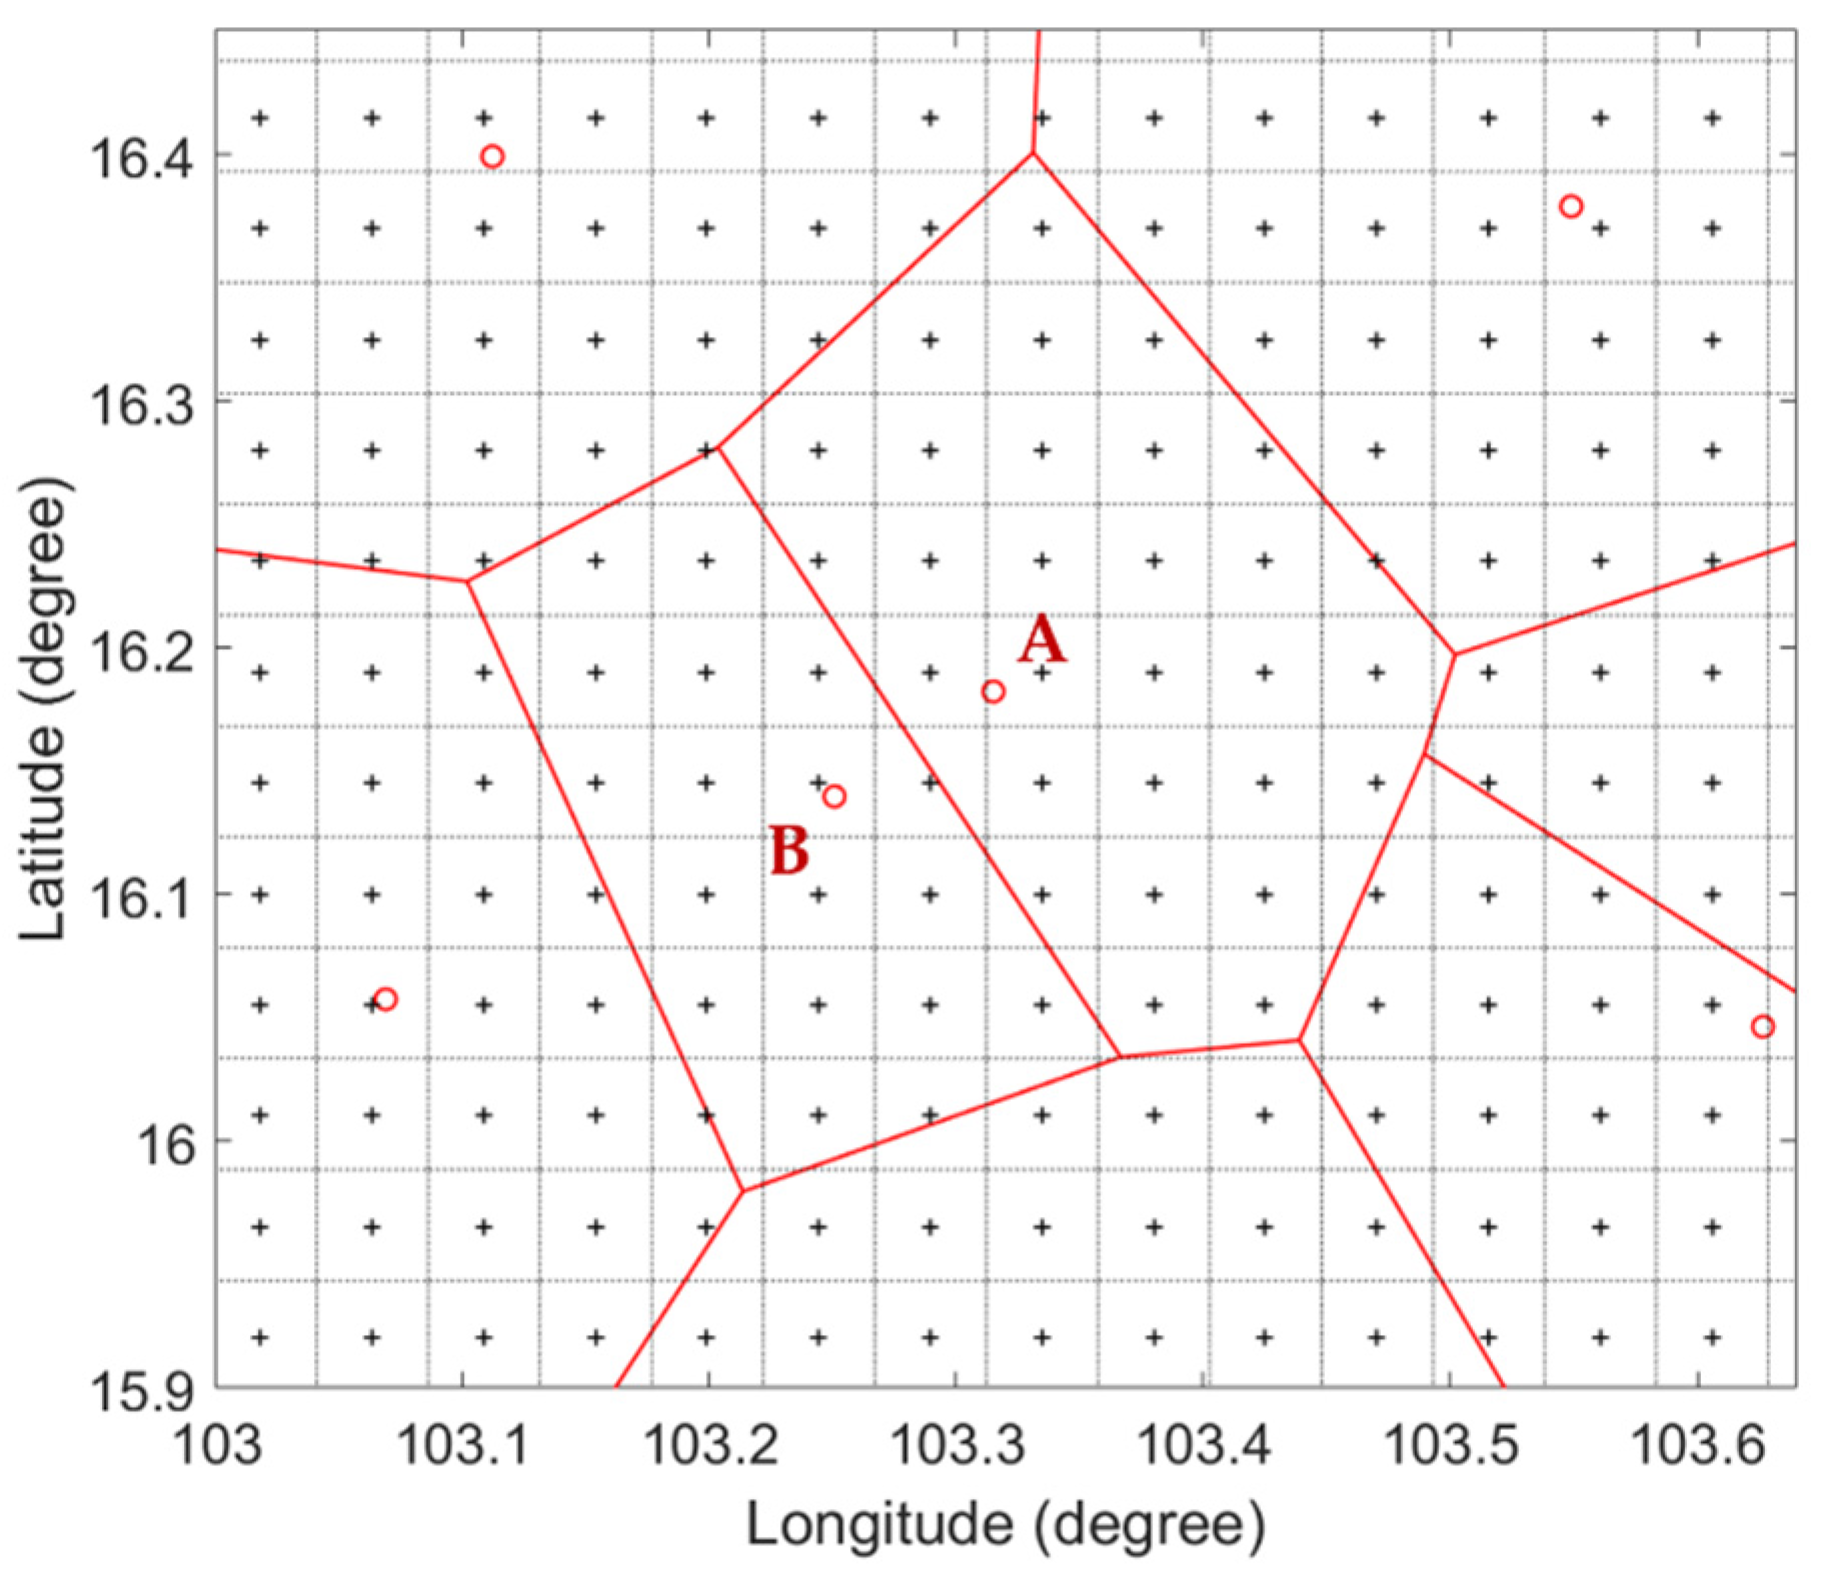
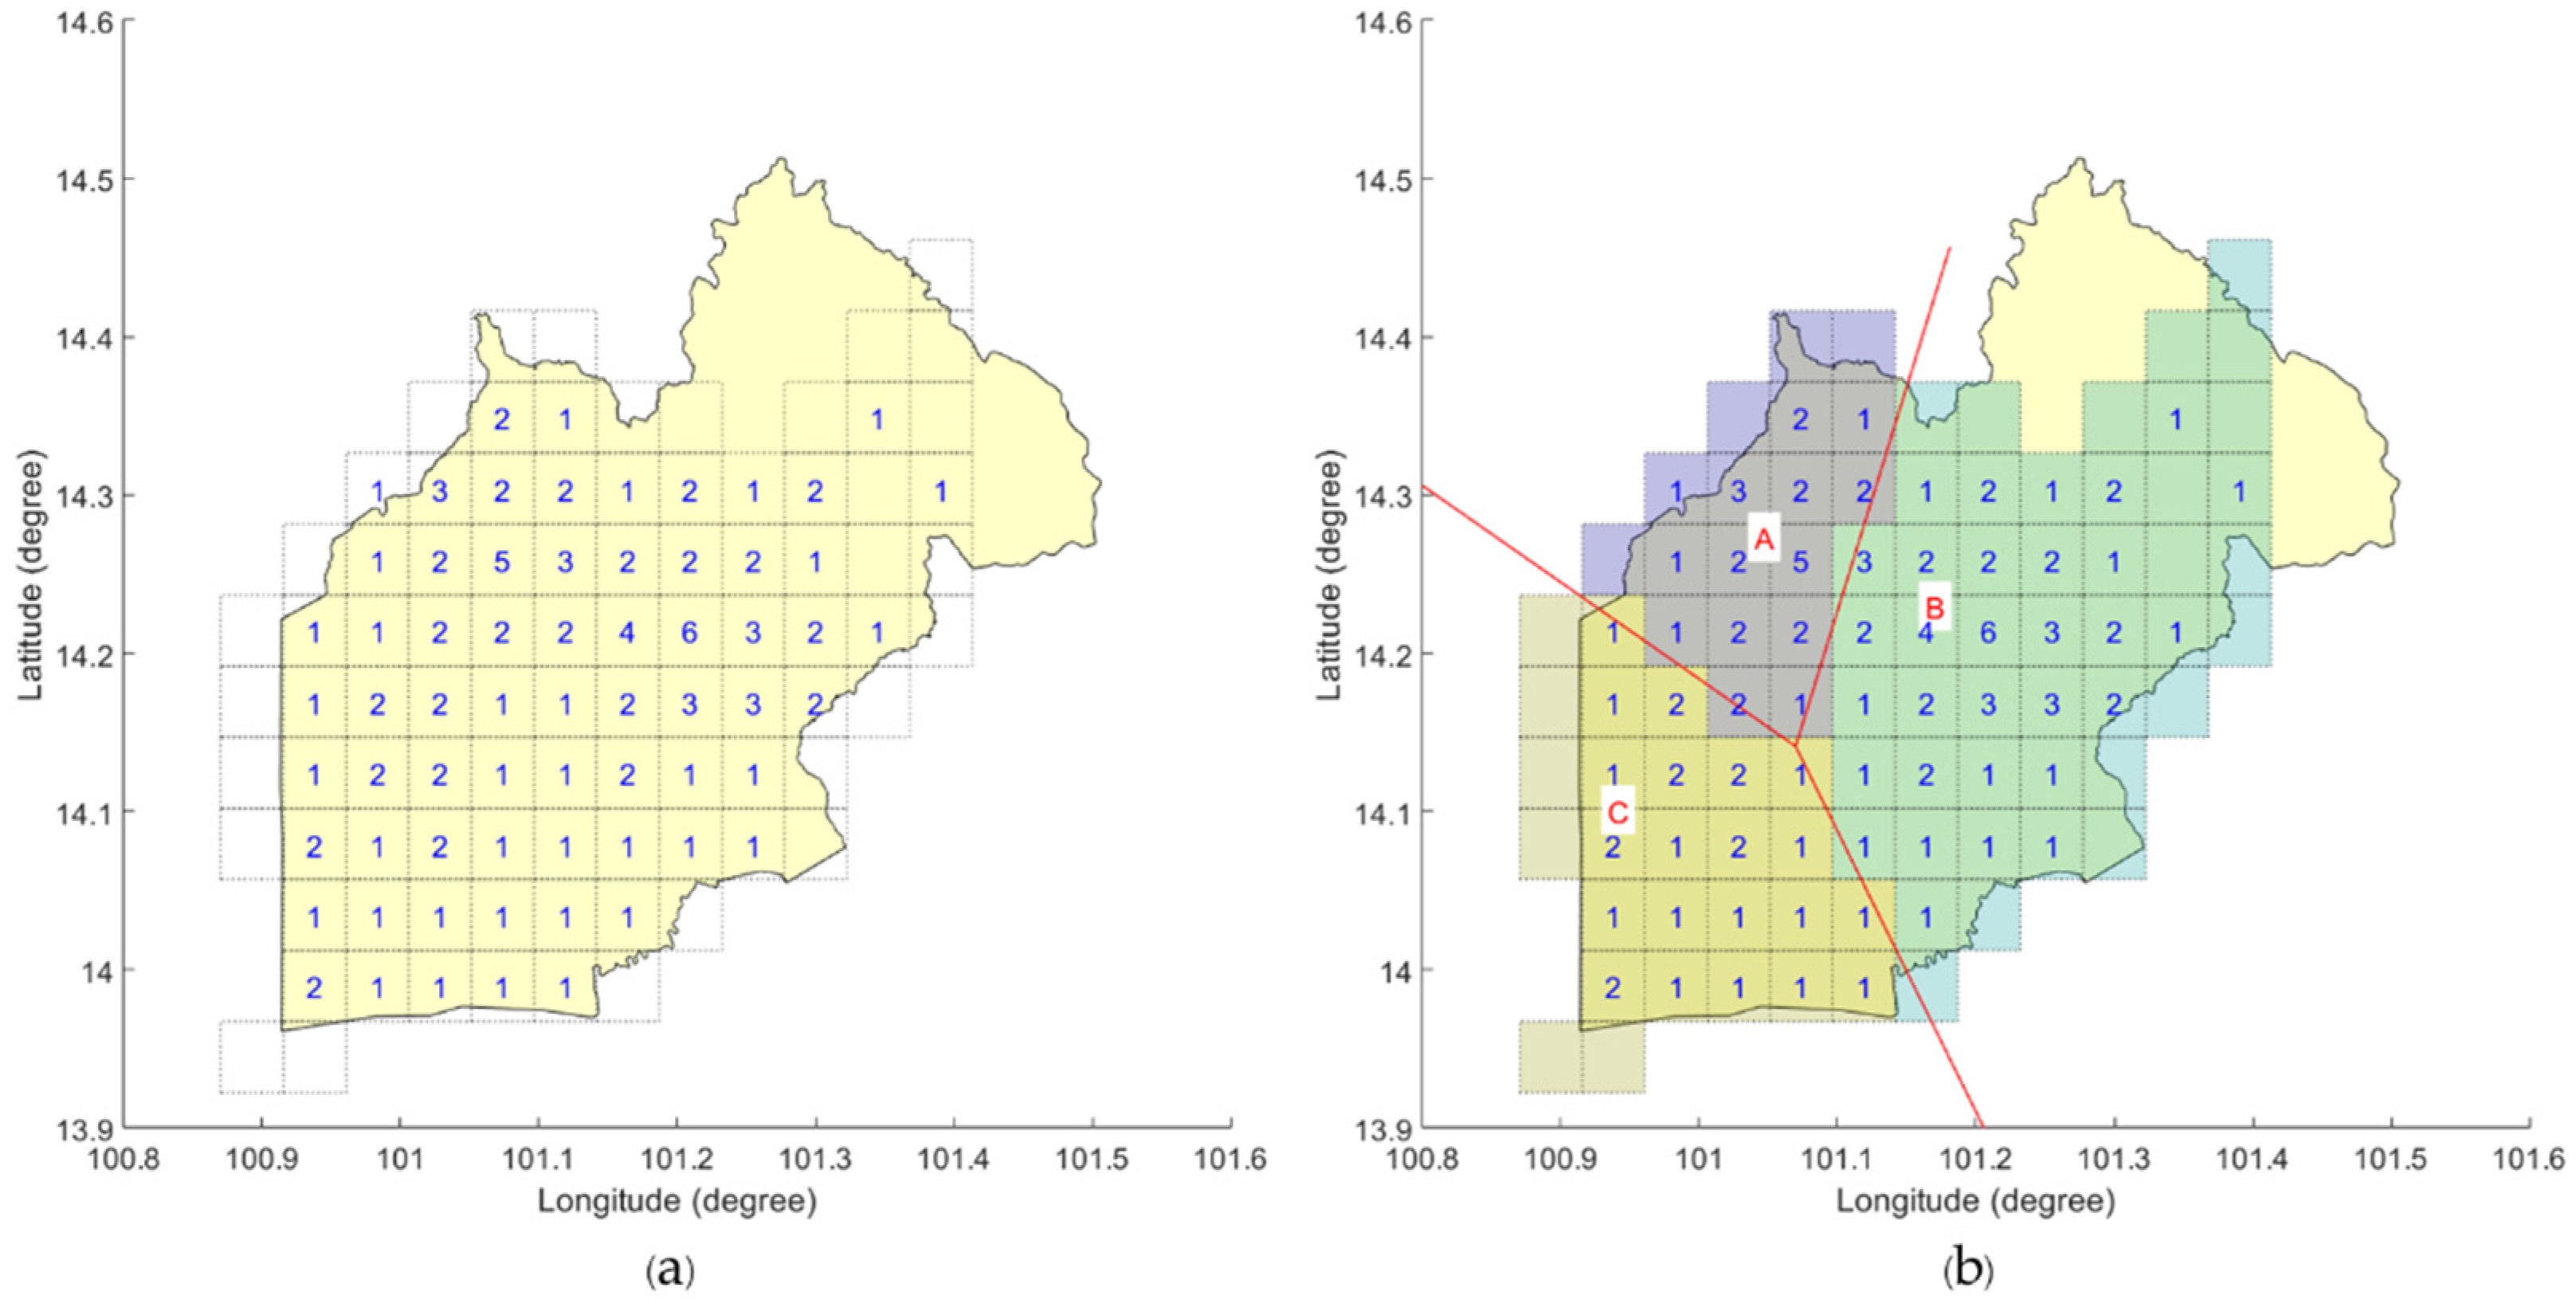
  • Under the assumption that charging stations should be connected to the nearest substations, a Voronoi diagram was proposed to analyze the MW loading of each substation. Therefore, the application of Voronoi is very beneficial for the planning of electrical infrastructure reinforcement to support the mass deployment of EVs in the future.

2. Literature Review

The electrification of transportation can create energy savings while reducing carbon dioxide emissions [7]. On the other hand, the increasing EV penetration may put a burden on the electrical systems, especially the impact of fast-charging stations on distribution networks [8,9,10]. Therefore, there have been many research publications that come with various approaches to utilize the full benefit of EVs while mitigating the negative effects. Methods were introduced for increasing the potential of EVs as a resource [11,12,13], integrating with other systems such as renewable energy systems [14] or even gas storage systems [15]. The preparation to cope with high EV penetration in the future was suggested, such as optimization of allocation and size of charging stations [16,17,18], charging demand analysis [19,20], and charging management for reducing peak demand [21,22]. However, the parameters and the assumptions usually are location-specific and may not be suitably applied to others.
The geospatial analysis techniques have been widely used in infrastructure and location planning, including EV charging station planning [23]. The approaches were dependent on the purpose and acquirable data. Additionally, there are numerous types of data that can be utilized. For example, the population density data and the proportion of EV owners per population can be used together to compute the number of fast-charging stations [24], while the geographic information system (GIS) data can be used to determine the optimal location of those charging stations [25]. The geographic maps may also aid in charging load simulation since the charging profile varies according to the types of places [26]. More detailed information, such as the vehicle tracking data and the traffic in the various areas, will lead to more accurate forecasting results [27].
The user behaviors and the physical properties of EVs must be considered when analyzing the charging demand to obtain a more reliable estimation. It was shown in [28] that different initialization parameters could produce significantly different results. When focusing on the public charging demand, travel patterns are one of the driving behaviors that should be considered to predict how much energy is needed to support daily EV consumption [29,30,31], and the charging behavior is another key to inferring where the charging sessions will probably occur [31,32]. The usefulness of charging demand analysis is not only for infrastructure construction planning but also useful in resource management strategies as well [33].
The number of EVs has been recently increasing rapidly, while planning, policymaking, or taking action may require a lot of time. Therefore, a high accuracy estimation of the number of EVs and charging demand should be undertaken in the first place. A Monte Carlo simulation method with the target of EV penetration could provide those desired results while requiring massive input data [34]. The EV ownership prediction of each vehicle type was also used to improve the results instead of using just the rough overall EV penetration assumption [35]. It was claimed in [36] that the estimation should be undertaken in a small-scale area if it would be used in electrical power distribution system infrastructure construction and reinforcement planning (e.g., electrical substation) since the problem tended to occur at the low voltage system first when the penetration of EVs was high.
From all the articles reviewed, we discovered that, first, geospatial analysis has been focused primarily on applying to specific locations and is reliant on significant volumes of data. As a result, it may not be suitable for country-level applications where only a few data become accessible, especially at the beginning of EV adoption. Second, the studies were conducted in a specific location with a limited or small-sized area, preventing them from analyzing a vast geographical area and providing suitable strategic policy formulation in EV charging infrastructure. Third, the study results for EV user behaviors were area specific. Due to the granularity of the data and its contextual difference, this may not be appropriate to apply directly to other specific areas such as Thailand. Finally, the charging demand projection frequently used a certain analysis based on a single model of electric cars, despite the fact that all types of vehicles can contribute to energy consumption sharing for the purpose of integrated planning between the policy and electric sectors.

3. Grid-Based Electric Vehicles Estimation

The estimation of the future number of EVs can be considered a cornerstone for effective support planning, such as planning a reasonable amount of EV subsidies within a budget framework, planning to improve and develop electrical infrastructure to support charging EVs in various locations, determining support areas for investment in public EV charging stations that are not redundant, or even formulating various policies related to commercial and industrial sectors.
Estimating the number of EVs is generally possible based on statistical data on the number of different vehicle types; for example, the cumulative registration data of ICEVs along with the determination of penetration levels or the projection from the increase in yearly sales of EVs. Considering the difference in an area’s socio-economic characteristics or other factors, estimating the total number of EVs at the country level for infrastructure planning for supporting the EVs may not be suitable for actual localized uses due to the resolution and consistency of the dataset.
At present, Thailand is still in the early stages of the adoption of EVs in various sectors. Cumulative sales and registrations of new EVs are expected to increase rapidly over time in the coming years due to various government support policies that are gradually being released, especially with EVs such as sedans and motorcycles. In this regard, the government has clearly set a concrete target for the use of EVs according to the so-called EV30@30 target. This EV30@30 campaign sets a collective aspirational goal to reach 30% sales share for EVs by 2030 by supporting the market for various types of zero-emission vehicles (including battery-electric, plug-in hybrid, and fuel cell vehicles). In this campaign, it is expected to have EVs of around 5,400,000 units [37] and various supports in the automotive sector and EV charging infrastructure.
To obtain results useful for planning and an appropriate, effective scope of support, the estimation of the number of EVs must therefore be consistent with Thailand’s EV30@30 target. The key idea of estimating the number of EVs in each area will be considered from two main factors:
  • Target penetration is an overall goal for the number of EVs in the future. It can be either a fixed number of EVs or a percentage of penetration versus a cumulative number of vehicles, which is dependent on the target estimation scenario.
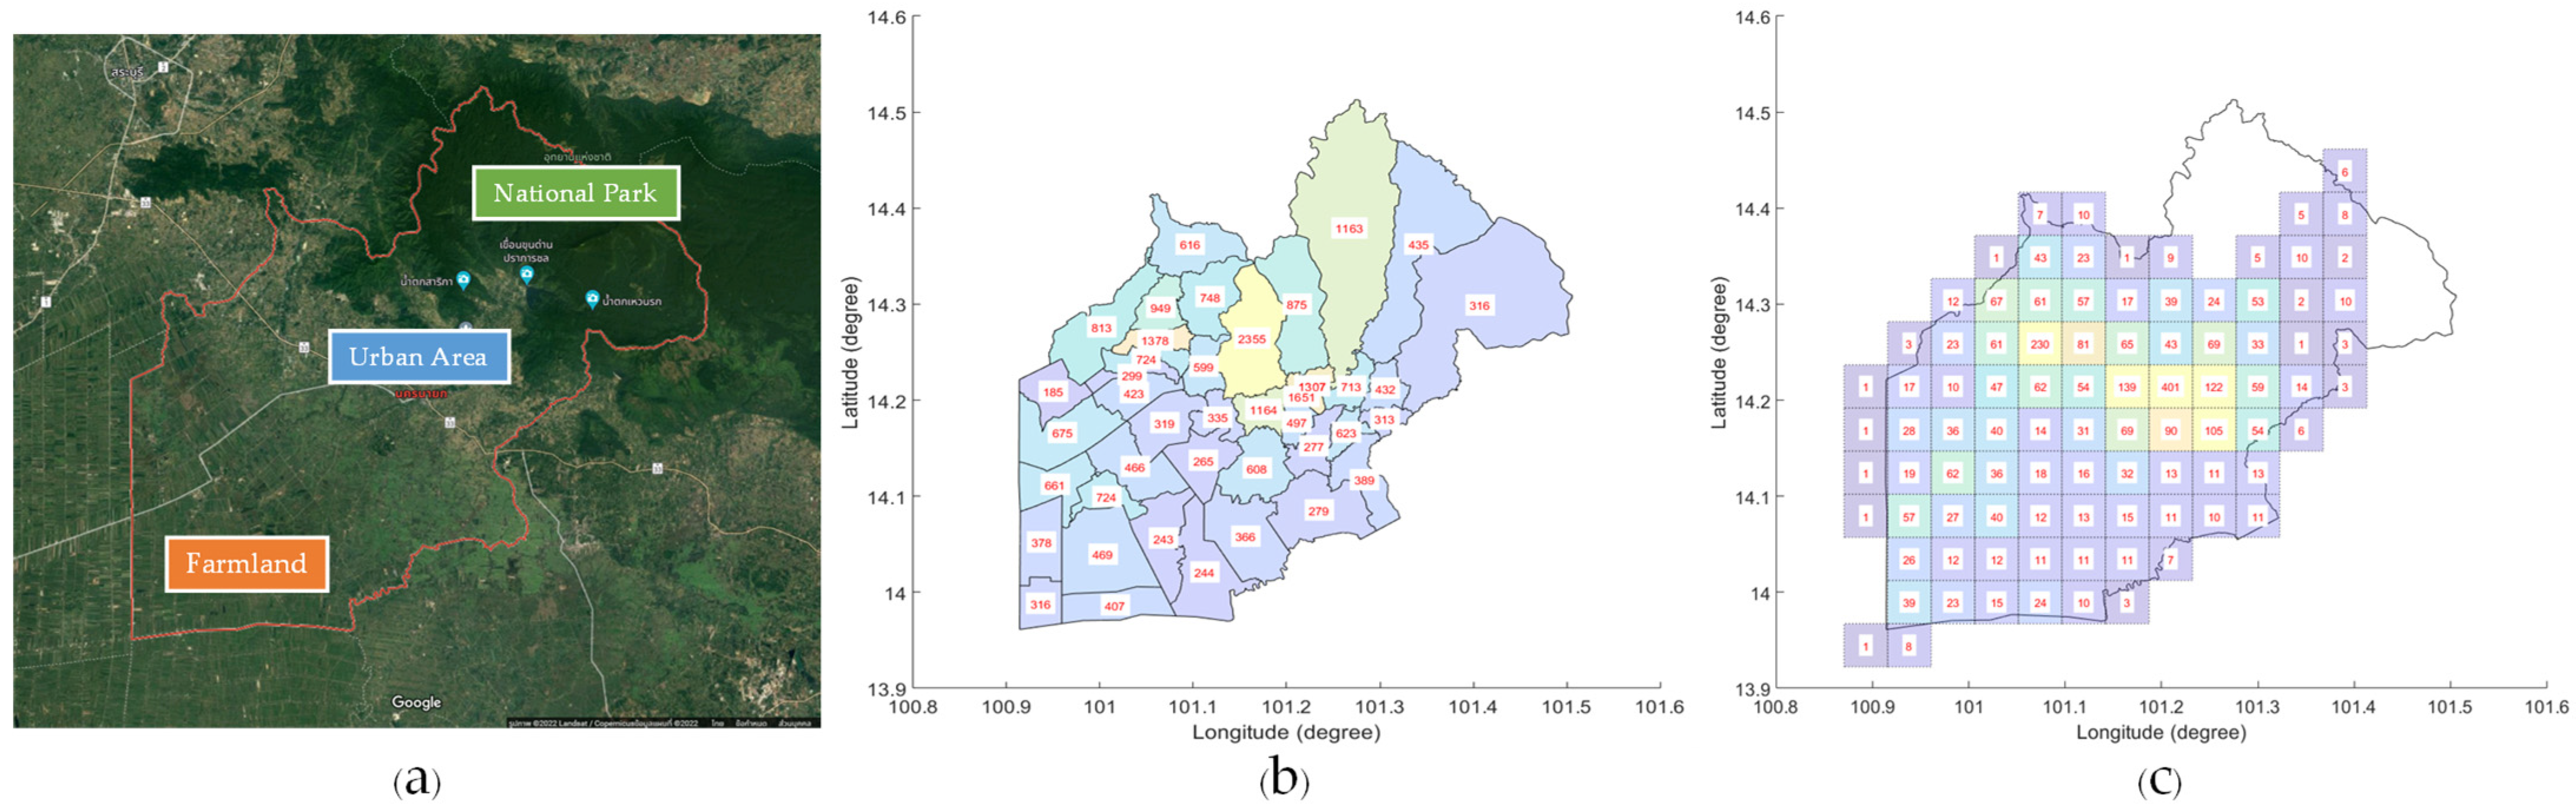
  • The cumulative number of vehicles in one particular area is a statistical data record of the number of different types of vehicles in that area since the estimation of the number of EVs is proportional to vehicles in that area while reflecting the features of those areas in different characteristics. Different areas have different types of vehicle usage; for example, rural areas or island areas may have a higher proportion of motorcycle use than cars compared to urban areas.
While a target number of EVs can be easily determined based on assumptions or a clear target scenario, the number of vehicles in a subarea in some areas of Thailand cannot be accurately determined due to the limit of data resolution. As an illustration, in the case of Ban Na Subdistrict in Tak province of Thailand, with an area size of approximately 2100 km2, there were only 95 sedans and pickup trucks in 2021. This number of vehicles is consistent with the mountainous terrain of the province, so it would be inappropriate to use the entire area of the subdistrict as representative of the future number of EVs, both in terms of driving and charging those EVs.
The proposed methodology starts with the estimation of the total numbers of each type of EVs in a whole scenario’s area by using the target numbers of EVs or overall penetration percentage in an area of interest with the vehicle registration statistical data. Given a predefined resolution (e.g., 5 × 5 km2), subareas can be created. Cells are generated to represent the subareas to facilitate calculation and analysis. The number of EVs will then be distributed across the subareas based on the EV density in each of the subareas and GIS data. Next, the charging energy consumption in the subareas will be estimated to obtain the power demand, a recommended number of public chargers for supporting extensive future usage of EVs, and the load increase that needs to be supplied from nearby substations. Finally, the Voronoi diagram is utilized to aid the substation’s load increasing estimation. Figure 1 depicts a summary of the steps taken to arrive at the final result and conclusion.
Because administrative areas may not properly represent the addresses of future EVs, we need to choose a different type of data instead, and there are many interesting types of data to serve this purpose, such as data on electricity consumption in each area, residential information of vehicle owners, building or infrastructure information. In this research, we chose road infrastructure GIS data because they can be considered the most reliable dataset, are easy to access, and have no concern for personal privacy information. In addition, the road infrastructure data can reflect the fact that where there are cars, there are roads. The GIS data we used in this research were obtained from OpenStreetMap, the editable crowdsourced geographic database. Therefore, to obtain a reasonable number of EVs, the projected number of EVs based on the subdistrict (considered as the smallest area unit) address of registries was matched to the road data. To begin with, the density of EVs in that area is first calculated using
V R D i = E V s i ( j = 1 N r L i , j × W i , j )
where V R D i is vehicle–road density of subdistrict i , E V s i is the expected number of EVs in subdistrict i , L i , j is the length of road j in subdistrict i , W i , j is the weight of road j in subdistrict i , and N r is the total number of roads in subdistrict i . Each district has its own clearly distinguished roads. If any road crosses over different subdistricts, the road will be dissected into multiple road segments by the boundary of the associated subdistricts.
To be realistically consistent with the fact that major roads with more lanes tend to accommodate more vehicles compared to minor ones, each road line is assigned a different weight according to the OpenStreetMap-classified road type. For this purpose, the weights of motorways and trunk roads are 4, primary roads and secondary roads are 2, and tertiary roads and unclassified roads are 1.
In case any subdistricts do not have any connected main roads, for example, a subdistrict that is a small island, the density of EVs depends on its area size, as defined by
V A D i = E V s i A i
where V A D i and A i are vehicle–area density of subdistrict i and area of subdistrict i , respectively. This equation can also be used instead if only a quick overview estimation is required since it is not concerned with the topography or where the roads are located.
Because the size and the shape of areas classified by registration are completely different but connected, the expected estimation results should be collectively useful at country-level planning. Therefore, a square grid is created to produce multiple identical cells to represent a subarea for scalable purposes. The estimated number of EVs in each cell can be determined from
E V a = E V R S a + E V N S a
where E V a is the total estimated number of EVs in cell a , E V R S a is the estimated number of EVs of subdistricts with road connection, and E V N S a represents the subdistricts without road connection. Because it is possible that each cell may cover some parts of several subdistricts, some districts may contain several roads while some others may not (e.g., small islands). Therefore, those two mentioned parameters are separately calculated by
E V R S a = i = 1 N r s a j = 1 N r a , i V R D a , i × L a , i , j × W a , i , j
E V N S a = k = 1 N n s a V A D a , k × A a , k
For those subdistricts with road connection in cell a , V R D a , i is vehicle–road density of subdistrict i , L a , i , j is length of road j in subdistrict i , W a , i , j is weight of road j in subdistrict i , N r s a is total number of subdistricts with road connection, and N r a , i is total number of roads in subdistricts with road connection i . In a similar manner, for those subdistricts without road connection in cell a , V A D a , k is vehicle–area density of subdistrict k , A a , k is area of intersection between subdistrict k and cell a , and lastly, N n s a is total number of subdistricts without road connection.
This proposed approach to predicting the number of different types of electric vehicles in any specific area can be undertaken using a typical personal computer. Because the main calculation is in an iterative manner, the computing duration depends mainly on the size of the target area and how many roads stay inside. If the memory resource of the computing device becomes limited, we suggest that the estimation should be done at the possible smallest area, and the individual results are then combined.
Because the data may come from multiple sites and there are so many subdistricts, each of which also has a large number of roads and road segments, the following data pre-processing is recommended:
  • The vehicle registration information should be organized according to acquirable boundary GIS data as the vehicle registration information is easier to manipulate. Suppose the vehicle registration information is inconsistent with the boundary, such as in the case of new registration zoning. In that case, the total vehicles within the boundary could be reevaluated in such a way similar to the estimation of the number of EVs in the cells.
  • The road GIS data obtained from OpenStreetMap is country-level data. The road data should then be at least divided into province-level data. Removing the unassociated road data from the target estimation area can reduce the computation burden in the process of determining which roads are in the target area.
  • Only the road that crosses over the subdistrict boundary needs to be dissected into multiple road segments. The actual road is simply not a straight line, and consists of a lot of small straight roads. Instead of checking all of those small straight roads, the bounding box of road GIS data can be used by overlaying them with the subdistrict boundary to quickly determine which road is likely to cross over the subdistrict and needs to be dissected.

4. Charging Demand and Utilizing Method

4.1. Energy Consumption Estimation

It is well known that huge amounts of energy are used for transportation sectors. When ICEVs are replaced by EVs, a foreseeable increase in electricity consumption becomes inevitable. Therefore, understanding the rising electricity consumption will assist the work of planners and operators.
The concept of energy consumption estimation shown in Figure 2 involves the following relevant factors:
  • Number of EVs: of course, as more and more EVs are adopted, the demand for electric energy must also increase accordingly.
  • Characteristics of EVs: heavy-duty vehicles tend to have more energy consumption than light-duty ones [38]. Improving EV technology with high energy efficiency and low energy consumption rate will reduce the demand for electrical energy.
  • Driving behavior of EV users: driving style [39], heating, ventilation, air conditioning (HVAC) use [40], and vehicle loading may increase the energy consumption. However, the most influential variable that affects energy consumption is the distance traveled.
  • External factors: there are numerous factors that affect the energy consumption rate of EVs [41], including weather conditions, traffic jams, terrains, etc.
The daily energy consumption can be calculated mathematically given by
E t = E V s × D a v g × E c o n
where E t is total energy consumption, E V s is number of EVs, D a v g is average vehicle travel distance per day, and E c o n is average vehicle energy consumption per distance. This total energy consumption is the key to the estimation of the total number of public chargers in the area.

4.2. Power Demand Estimation

While significantly reducing charging power demand is practically difficult, charging power demand becomes manageable through various strategies such as load shifting, load shaving, or renewable energy integration with energy storage. In order to be able to manage the peak power demand properly, understanding the load characteristics of different types of EV charging is important.
Figure 3 shows the concept of power demand estimation for battery recharging influenced by the following three factors:
  • Energy consumption: when there is high energy consumption for EVs, there must be a high-power demand to support such a daily energy use.
  • Energy management: uncontrolled charging can put a huge burden on the grid, even during off-peak times. If EV users coincidentally charge their EVs, especially when using faster chargers, this uncontrolled charging may result in a very high demand for electricity in a very short period of time. To mitigate this negative effect, energy management that integrates chargers with energy storage offers an attractive solution for peak demand reduction.
  • Charging behavior: each EV user has different driving purposes, which will result in different charging behaviors as well. For example, EV users rarely need to rely on public fast-charging services for daily short-distance commuting.
In general, the smaller the charging timeframes, the higher the average power demand. The recharging of personal EVs such as sedans, pickup trucks, and motorcycles normally takes place in the residence after work in the evening of the day. This daily behavior can encourage users to choose the TOU electricity tariff (in Thailand, the off-peak period runs from 10.00 p.m. to 09.00 a.m. on weekdays, excluding weekends and holidays) for cost minimization. However, EV charging sessions may take 6–8 h to fully charge with a slow charger [42]. Therefore, the charging time frame may end before the off-peak period ends.
Electric taxis and electric motorcycles taxis are primarily recharged by public stations at any time of the day. While taxis use fast-charging station services to increase their income potential, motorcycles are limited to slow charging due to their characteristics. With reference to Thailand’s current business model, charging electric buses mostly takes place inside garages during the night. Taking advantage of the TOU tariff is a viable solution for cost savings as their daily power demand and energy consumption is relatively high. Because electric trucks are not widely used in Thailand at present, it is unlikely that public charging stations will be installed exclusively for electric truck services. Therefore, we assume that there is a high probability that charging sessions of electric trucks will take place at any time of the day within the company’s garages or the distribution centers.

4.3. Recommended Number of Public Chargers

The adequacy of public chargers is one of the key factors in users’ decisions to switch from ICEVs to EVs. The Thai government has prioritized ensuring there will be enough public chargers by establishing policies and implementing various pilot projects to support the installation of charging stations adequately and extensively.
Because investing in charging stations is capital intensive and the charging station business usually requires a long payback period, if subsidy policies are improper and more than necessary, it not only affects the budget but also causes a burden on the electricity network. A public charging station with one fast charger can have a high-power requirement of hundreds of kilowatts.
There are several factors that need to be considered when investing in a charging station business, especially in terms of cost-effectiveness. The following factors are included in the model:
  • Charging demand: the number of chargers must be sufficient to support charging needs in public areas.
  • Charger power rating: the higher the power rating, the less charging time and, therefore, more services for EV users. However, the cost-effectiveness and the impact on the grid become issues that must be addressed for high-power charger installations.
  • Utilization: charging station investors would like to have a high utilization rate. If the utilization rate of the station is low, the likelihood of queuing for the service is reduced. Therefore, the determination of the utilization rate is subjective and depends primarily on the characteristic of the area.
The total number of chargers should be sufficient to ensure meeting the charging demand at peak hours [43]. Consequently, the recommended number of public chargers can be estimated using Equation (7) for the case where the power demand for each charging period has already been further analyzed (i.e., with behavior-based simulation) or Equation 8 for approximation if only energy consumption is known. Note that the utilization factor used in both equations does not need to be equal.
P C = P p P c × % u f
P C = E p P c × t o × % u f
where P C is recommended number of public EV chargers, P p is peak power demand of the public charging station,   E p is total energy consumption of the public charging station, P c is charging power of the EV charger, % u f is the utilization factor, and t o is the charging station service hours.

4.4. Substation Load Analysis with Voronoi Diagram

Thailand’s transportation sector has consumed around 35% of total final energy consumption [44]. If all vehicles are electrified, their total energy consumption tends to be higher than the residential sector’s energy consumption. It is inevitable that the local electrical infrastructure needs to be improved to support future EV usage. However, the load from EV charging is not rising too suddenly, and the utilities have time to prepare. Substation load analytics can provide support for the planning process.
Substation reinforcement planning can be achieved in numerous ways [45]. Substation capacity should be able to accommodate a high penetration of EVs in the future. Upgrading the existing ones or adding new ones are two possible options that can be chosen based on the associated costs. The former method may be less expensive than the latter, especially in densely populated areas where land prices are high [46]. However, because the power demand of the fast-charging station is enormous, constructing a new substation on a new site may provide a better option in the long run when considering the limitation on upgrading and the benefit from the distribution loss reduction.
Distribution line network data could be used in analytics, but it may take an excessive computation time since distribution systems are very complex. To simplify the process while the given results are still reasonable, the assumption that the loads will be supplied by their nearest substation is applied. While mathematical concepts such as the Euclidean geometry and the Manhattan distance [47,48] for grouping the loads with substations may be easily computed, the Voronoi diagram [49], a method utilizing the Euclidean plane in partitioning an area into regions or subareas in accordance with the nearest point, can be utilized to accelerate computations for a broader target optimization region. When the center of a cell represents the subarea, the charging demand will be clearly distributed to their nearest substation. For example, substation B in Figure 4 must support the charging demand of 18 subareas.

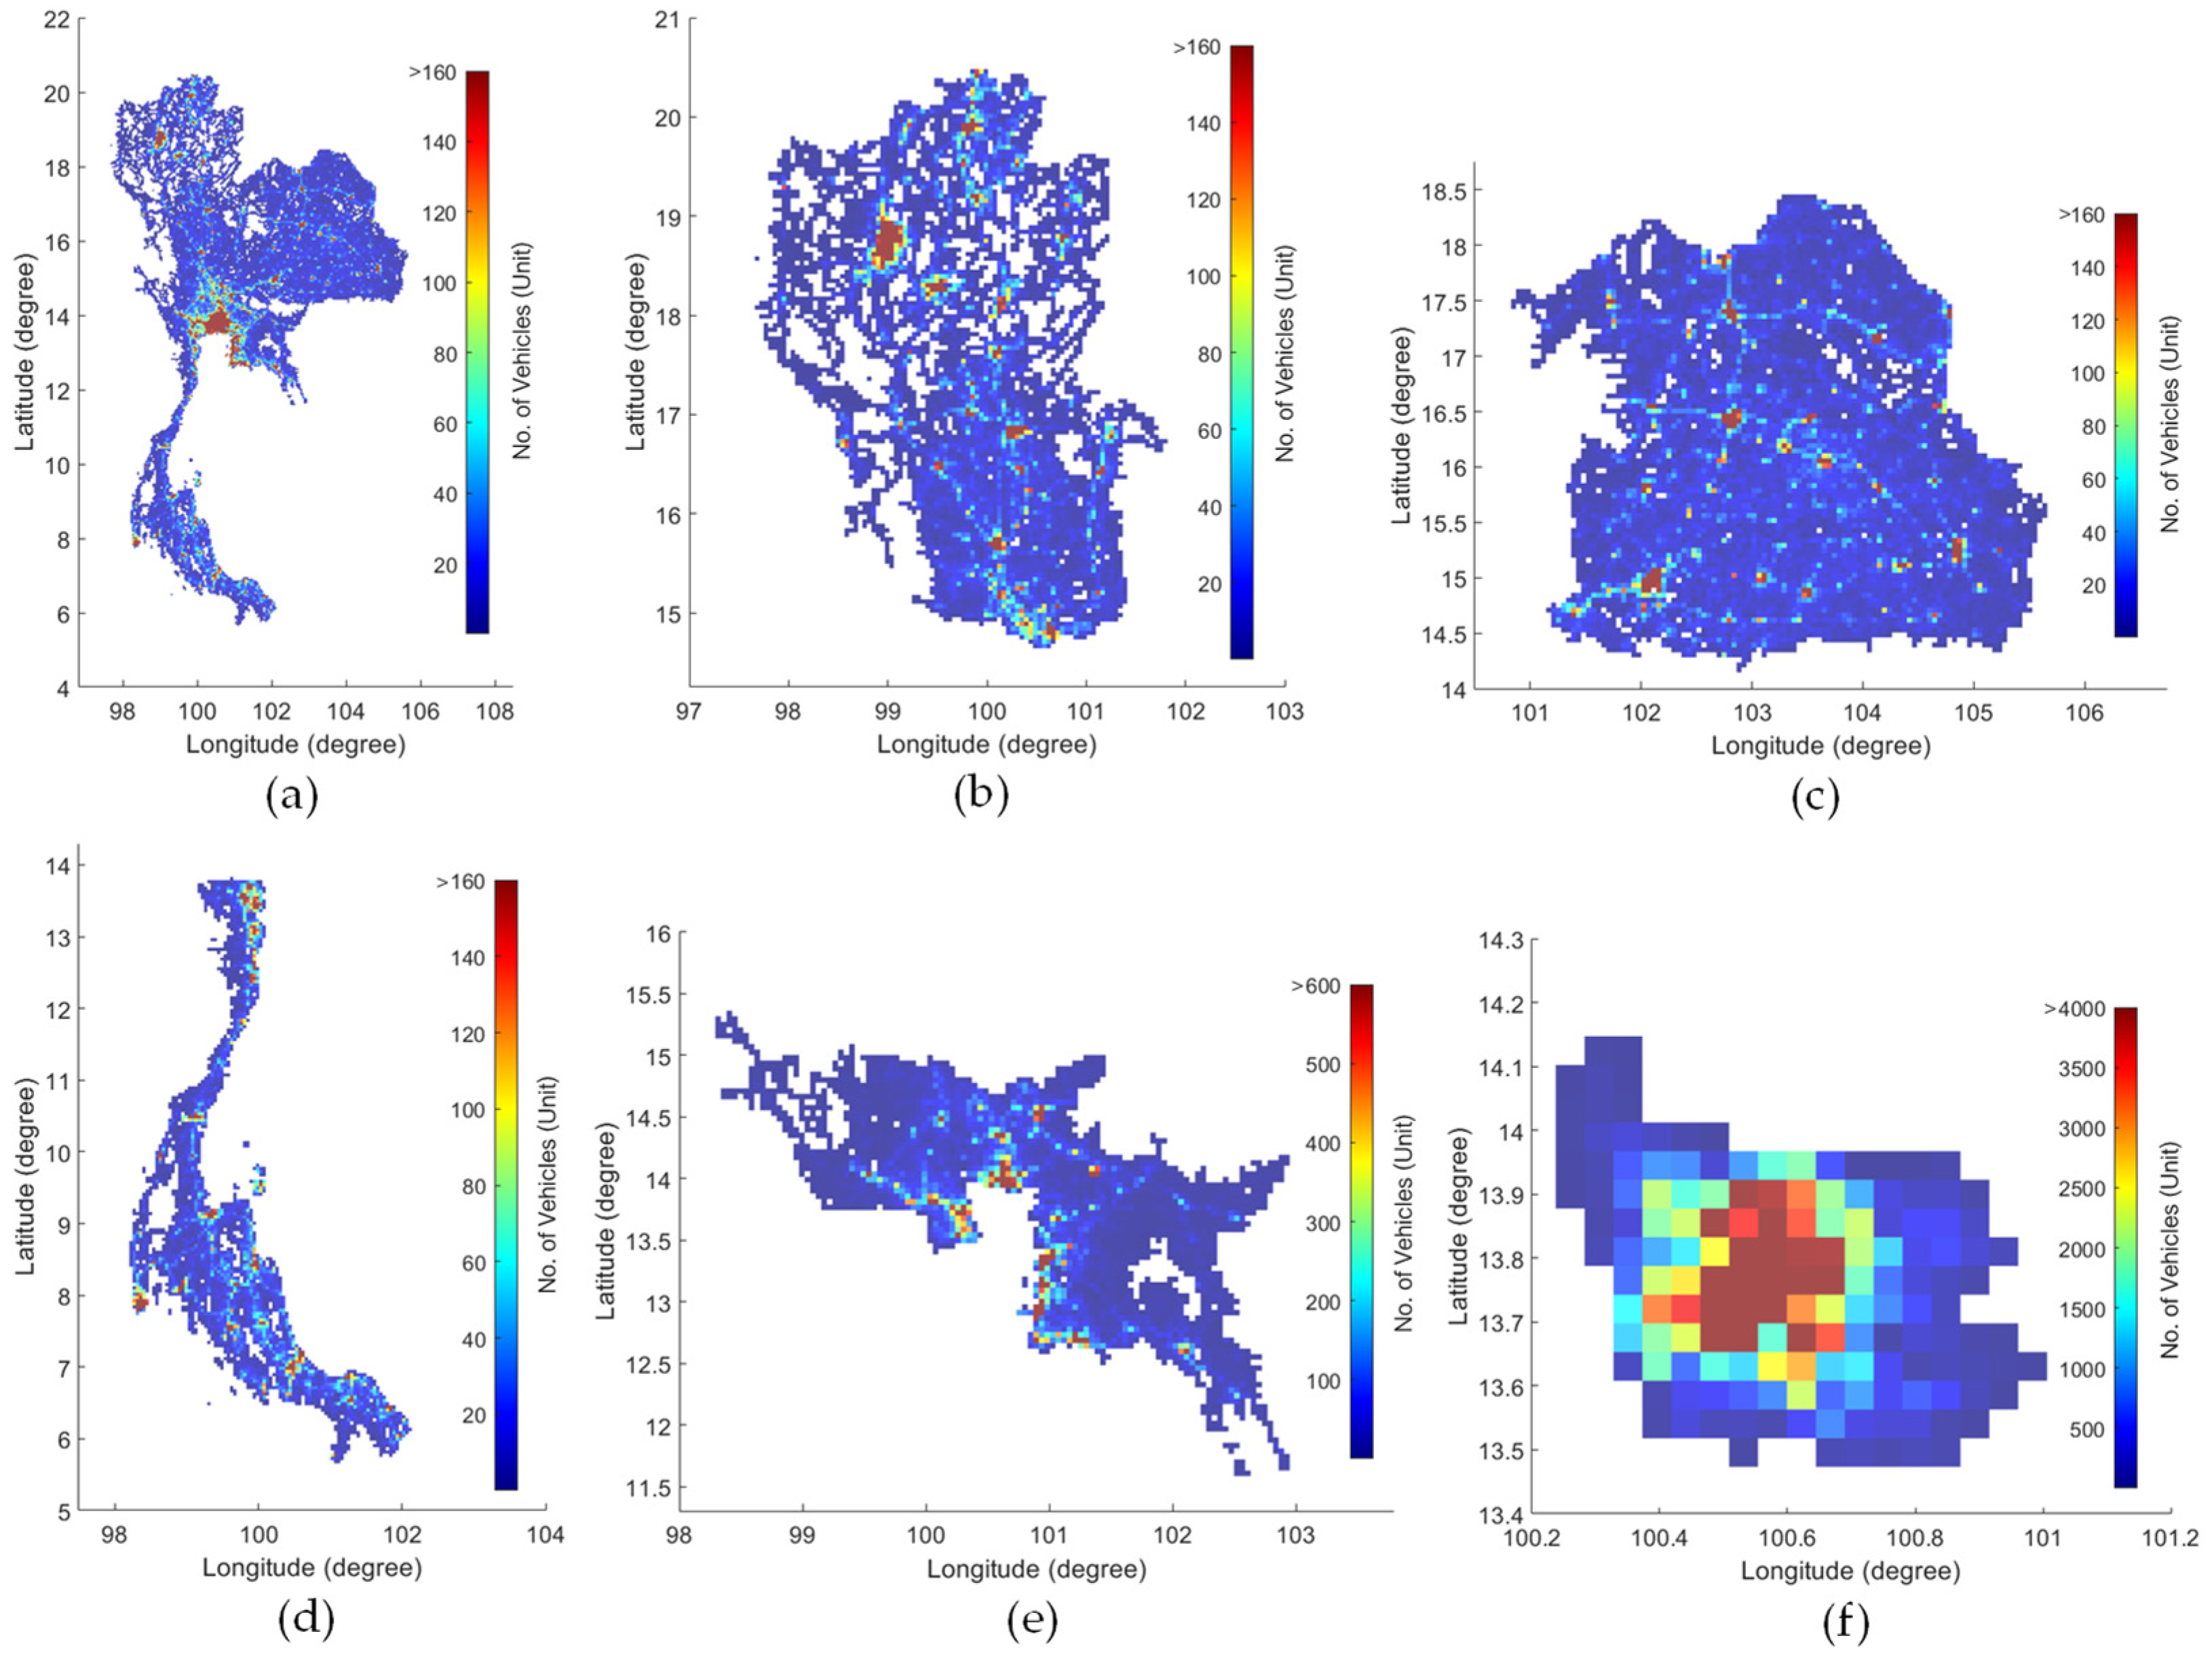
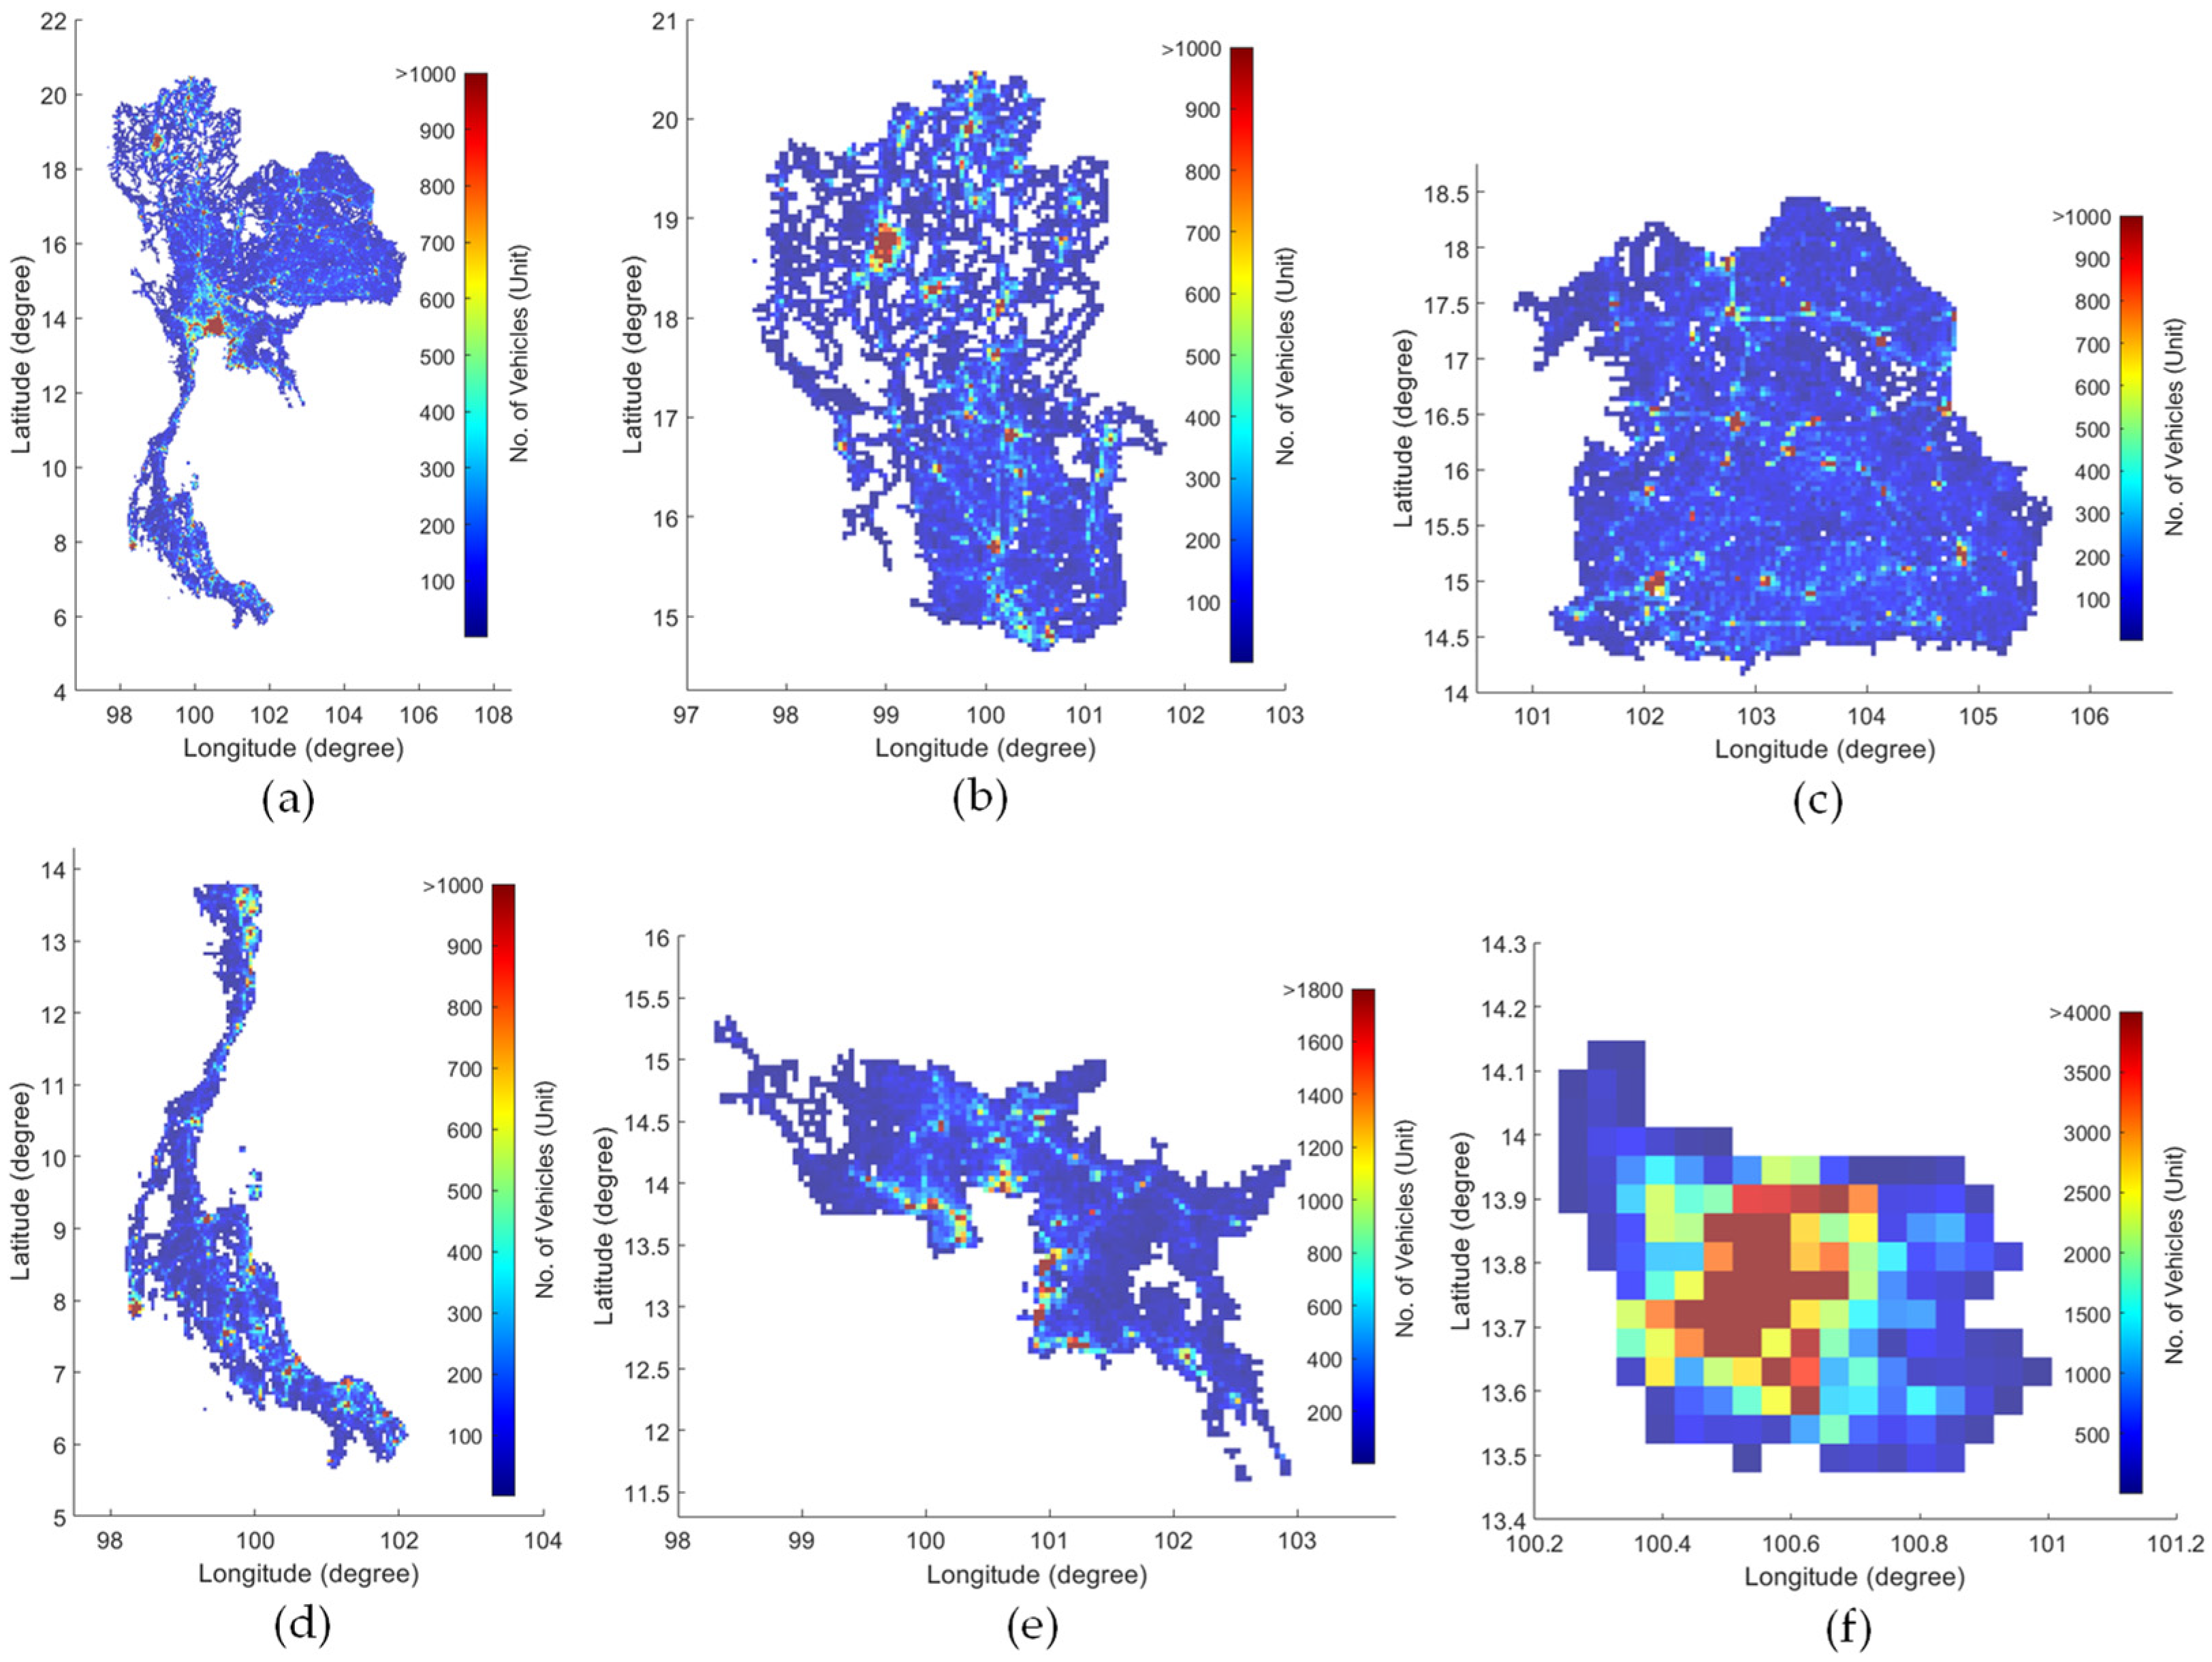
5. Results and Discussion

According to the registration information of EVs of the Department of Land Transport of Thailand, if considering only the types of vehicles that will be put forward for electrification according to Thailand’s EV30@30 target (passenger car, pickup truck, motorcycle, bus, and truck), we found that the motorcycle was most widely used in Thailand (52.18% of the total number of motor vehicles), followed by private cars with a size of no more than 7 seats (26.12%). The vehicle usage proportion of other vehicle types is shown in Figure 5.
Distribution systems in Thailand have been taken care of by the Metropolitan Electricity Authority (MEA) and Provincial Electricity Authority (PEA). MEA is responsible for providing power supply in Bangkok, Nonthaburi, and Samutprakarn. Thailand’s other 74 provinces are supplied by PEA. The electricity provision of PEA is separated into four regions according to the geography of Thailand, consisting of north, east, northeast, and south. Therefore, to facilitate our computation, we divided the whole country into a total of 5 areas according to the above-mentioned areas of responsibility.
From Figure 6, we can see that MEA’s service area, although considerably smaller than PEA’s, has the largest number of vehicles, and about half of all passenger cars have been registered in the area. Meanwhile, PEA’s service area tends to have a larger percentage of motorcyclists compared to passenger cars. More detail can be seen in Table 1.
As previously mentioned, according to Thailand’s EV30@30 campaign, it is anticipated that by 2030 Thailand will have a total of 5,410,000 EVs, comprising 2,050,000 electric passenger cars and pickup trucks, 3,200,000 motorcycles, and 160,000 buses and trucks. This research used this number of EVs in each category as the reference in the calculation.
The target number of EVs and the proportion of each vehicle type in each area were used to analyze the number of EVs in the future. In this research, a 5-km-wide grid was built across the whole of Thailand to define clear and easy-to-analyze subareas. The estimation of the number of EVs in each cell was then performed separately for each vehicle type, as each type of EV had a different purpose.
Take Nakhon Nayok province, which is located in Central PEA, as an example. We can see in Figure 7 that the area of Khao Yai National Park has a significantly low number of cars (all types of fuel) compared to its area size, while the farmland has some. As the western side of the province has the major road cut through it with residential areas along its side, the number of cars is higher. Of course, the center of the urban area has seen the greatest number of cars. The estimated number of EVs was found by multiplying by the EV penetration ratio based on the target scenario’s number of EVs and the total number of cars in the area. This same concept was applied to the whole country for all types of vehicles. The results of the number of EVs in each region are shown in Figure 8 and Figure 9.
Once the number of EVs of each type in each cell is known, the power demand in each cell could be predicted using different variables. It was reported that the energy consumption rate of electric sedans was around 150–200 Wh/km while the minivan and the pickup truck were around 250–300 Wh/km [50]. While the energy consumption rate of electric motorcycles was varied [38], the rate of 60 Wh/km was used in this case study. The electric bus had an energy consumption rate of as much as 1300 Wh/km [51]. The electric rigid truck (e.g., Volvo FL Electric model) had an energy consumption rate of 1000 Wh/km [52].
The assumptions for the energy consumption estimation are summarized in Table 2 where D a v g is average vehicle travel distance per day and E c o n is average vehicle energy consumption per distance. The result of the regional energy consumption estimation is summarized in Table 3.
We can observe that the total daily energy consumption generated by charging events of all types of EVs would reach 79.4 GWh per day. There is an interesting point that while MEA’s service area is significantly smaller than the other regions, the energy consumption can be comparable to the Central PEA’s service area, which is the region with the highest energy consumption. Meanwhile, the power demand from electric trucks is much higher than that of other EVs, although they are small in number (see Figure 5). Due to the high driving distance per day as well as having the second-highest energy consumption rate among different types of EVs, charging electric trucks often consume very high power in the hundreds of kilowatts. Therefore, a charging management system should be in place to minimize the impacts that may occur on the electrical system.
The obtained charging energy consumption estimation results can be fulfilled in various locations. For example, the estimation of the number of chargers for private areas such as homes does not have to be calculated based on charging demand. Because, in general, EV users already have chargers installed in their homes, it is not surprising to envisage that the number of such chargers will be close to the number of EVs. However, this is not the case for public chargers, where one charger can be deployed to serve dozens of EVs within a day. In this research, we focused on the recommended minimum number of 50 kW public fast chargers, a widely used standard power in Thailand, to support the charging of electric cars. We assumed that the probability of charging a private EV in the public charging station was 5%, which would result in a reduction in the energy consumption from private vehicles, while taxi charging sessions always took place at the public station, or in other words, the chance of charging taxis at public stations was 100% and charging session could occur throughout the day. The overall utilization rate of 11% [53] was used in this calculation.
The recommended numbers of fast public chargers in different regions are shown in Table 4, from which we can see that there should be a total of 12,565 chargers across the country. The service area of MEA occupies the largest number of chargers, and the taxi is very demanding for the public charging station compared to its number. These chargers should be installed evenly to provide coverage, primarily focusing on areas with high charging requirements.
The advantage of subarea charging demand estimation is that the results can be used for a wide range of applications. Figure 10a shows an example of the distribution of predicted public chargers across Nakhon Nayok province in 2030. A total of 111 public fast chargers with a total daily public charging energy demand of 14.37 MWh were distributed into cells based on the estimated total energy consumption of each cell.
Identifying the number of chargers in each subarea will enable government agencies to formulate appropriate policies to reduce redundant construction of unnecessary charging stations or be used in conjunction with subsidies to create public EV charging stations in areas not yet covered [54]. Meanwhile, the distribution system operators can use the simulation results in planning and reinforcement of transmission lines and substations to timely support public charging stations that often have high power requirements.
Figure 10b illustrates the use of the Voronoi diagram to indicate the extent of the substation’s serving subareas to nearby public fast chargers under the assumption that a public charging station is connected to the nearest substation. It can be observed that substation B is responsible for supplying power to 57 fast chargers or equivalently the maximum power demand of 2.85 MW, and this increasing power demand will be a top-up on the peak load of the current substation as the worst-case scenario. Therefore, this figure will be very useful for the distribution system operators to determine whether a reinforcement scheme is needed for substations in their service area.
Throughout the entire process, from the estimation of the number of EVs to the energy consumption analysis, the major advantage of this proposed approach is its flexibility while requiring minimum input data. To be concise, the vehicle registration information can be acquired from a government agency, and the geographic information can be accessed from open-source sites such as OpenStreetMap. This area-based concept can be adaptable to be used in any large target area. The value of the parameters can come from assumptions, research publications, or area-specific technical reports.
Therefore, this approach is suitable for countries or regions that are in the initial phase of EV adoption since the number of EVs is still quite low and the availability of EV usage data is very limited. Other factors such as population income can directly affect EV adoption, especially when the price of EVs is still higher than the price of ICEVs [55]. Those factors should be further investigated to improve the accuracy of the proposed model. As for the estimation of numbers of public chargers, it can be performed for country-level scenarios without manually selecting Point-of-Interest to suggest exactly where charging stations should be located. Therefore, the results can only be used for visualizing the public charger demand and cannot identify where the charging stations should be constructed.

6. Conclusions

This paper presented a comprehensive grid-based spatial estimation methodology applicable for a very large or wide geographical area with different EV types (e.g., passenger cars, motorcycles, and buses) with different usage characteristics. The integration of the registration data and GIS data played a major role in predicting the number of EVs based on a practical assumption that areas with dense road routes would have a large number of vehicles since the road infrastructure itself can represent which terrain EVs can be used on. Some rural areas, such as forests or mountains, do not even need a charging station since no road is connected. Because this estimation methodology is flexible and does not require much data, this work can be a practically useful tool for countries with limited resources that are initially adopting EVs.
The appropriate grid cells, as small as 5 × 5 km2, were created to represent the estimated number of EVs and could help reduce computational resources and facilitate further analysis. The increasing electricity consumption from EV charging was able to be further determined by the obtained estimated number of EVs. From the simulated results of the whole country of Thailand, we found that the total daily energy consumption is about 79.4 GWh. The metropolitan area needs a lot of energy to support daily EV usage even though its size is very small compared to the other regions, while the taxis heavily contributed to the public charging station demand. In addition, even though the estimated number of electric trucks was small, their daily energy consumption was much greater than all other types of EVs combined. If the transportation sectors were electrified, the government should find a coping strategy beforehand. Therefore, we strongly recommend that planning for the installation of an electric truck depot should be undertaken in such a way as to reduce potential impacts on the electric power network.
With this charging demand estimation result, the required number of public chargers sufficient to support the local electric car usage can be calculated. A total of 12,565 public fast chargers are required across the country, around half of which are needed to support the metropolitan area. This estimated number of public chargers will be useful in policy formulation, electric power utility planning, or investment decisions. This research also presented the application of the Voronoi diagram under the assumption that charging stations should be connected to the nearest substations to identify what load increase that substations would carry for EV penetration uptake in the future. The result of substation load estimation can be the fundamental information for allocating and sizing the optimal substation planning if a new substation is necessary. As for future applications, this proposed research work can be extended to combine the effect of socio-economic factors for more practical estimation results and integrate the GIS of electric power system data for better prioritization in power system reinforcement planning.

Author Contributions

Conceptualization, P.P. and S.S.; methodology, P.P. and S.S.; software, P.P.; validation, P.P. and S.S.; formal analysis, P.P. and S.S.; investigation, P.P. and S.S.; resources, S.S.; data curation, P.P.; writing—original draft preparation, P.P.; writing—review and editing, S.S.; visualization, P.P.; supervision, S.S.; project administration, S.S.; funding acquisition, S.S. All authors have read and agreed to the published version of the manuscript.

Funding

This research received no external funding.

Institutional Review Board Statement

Not applicable.

Informed Consent Statement

Not applicable.

Data Availability Statement

Not applicable.

Acknowledgments

The authors would like to express their sincere thanks and appreciation to Energy Policy and Planning Office (EPPO) and to King Mongkut’s University of Technology North Bangkok (KMUTNB) for research support and facilities, and to The Office of Transport and Traffic Policy and Planning (OTP) and the Department of Land Transport (DLT) for the comprehensive data used in this research work.

Conflicts of Interest

The authors declare no conflict of interest.

Nomenclature

V R D i Vehicle–road density of subdistrict i
E V s i Expected number of EVs in subdistrict i
L i , j Length of road j in subdistrict i
W i , j Weight of road j in subdistrict i
N r Total number of roads in subdistrict i
V A D i Vehicle–area density of subdistrict i
A i Area of subdistrict i
E V a Total estimated number of EVs in cell a
E V R S a Estimated number of EVs of subdistricts with road connection in cell a
E V N S a Estimated number of EVs of subdistricts without road connection in cell a
V R D a , i Vehicle–road density of subdistrict i within area of cell a
L a , i , j Length of road j in subdistrict i within area of cell a
W a , i , j Weight of road j in subdistrict i within area of cell a
N r s a Total number of subdistricts with road connection within area of cell a
N r a , i Total number of roads in subdistricts with road connection i within area of cell a
V A D a , k Vehicle–area density of subdistrict k within area of cell a
A a , k Intersect area of subdistrict k and cell a
N n s a Total number of subdistricts without road connection within area of cell a
E t Total energy consumption
E V s Number of EVs
D a v g Average vehicle travel distance per day
E c o n Average vehicle energy consumption per distance
P C Recommended number of public EV chargers
P p Peak power demand of public charging station
E p Total energy consumption of public charging station
P c Charging power of EV charger
% u f Utilization factor
t o Charging station service hours

References

  1. Sanguesa, J.A.; Torres-Sanz, V.; Garrido, P.; Martinez, F.J.; Marquez-Barja, J.M. A Review on Electric Vehicles: Technologies and Challenges. Smart Cities 2021, 4, 372–404. [Google Scholar] [CrossRef]
  2. Khan, H.A.U.; Price, S.; Avraam, C.; Dvorkin, Y. Inequitable Access to EV Charging Infrastructure. Electr. J. 2022, 35, 107096. [Google Scholar] [CrossRef]
  3. Thananusak, T.; Punnakitikashem, P.; Tanthasith, S.; Kongarchapatara, B. The Development of Electric Vehicle Charging Stations in Thailand: Policies, Players, and Key Issues (2015–2020). World Electr. Veh. J. 2020, 12, 2. [Google Scholar] [CrossRef]
  4. Arias-Gaviria, J.; Valencia-Hernandez, V.; Arango-Aramburo, S.; Yris, O.M.; Larsen, E.R.; Smith, R. The Chicken and the Egg Dilemma for Charging Infrastructure and Electric Vehicle Diffusion: A Developing World Case Study. Available online: https://www.iaee.org/en/publications/newsletterdl.aspx?id=935 (accessed on 2 January 2022).
  5. Sheng, K.; Dibaj, M.; Akrami, M. Analysing the Cost-Effectiveness of Charging Stations for Electric Vehicles in the U.k.’s Rural Areas. World Electr. Veh. J. 2021, 12, 232. [Google Scholar] [CrossRef]
  6. Sbordone, D.; Bertini, I.; Di Pietra, B.; Falvo, M.C.; Genovese, A.; Martirano, L. EV Fast Charging Stations and Energy Storage Technologies: A Real Implementation in the Smart Micro Grid Paradigm. Electr. Power Syst. Res. 2015, 120, 96–108. [Google Scholar] [CrossRef]
  7. Yuan, M.; Thellufsen, J.Z.; Lund, H.; Liang, Y. The Electrification of Transportation in Energy Transition. Energy 2021, 236, 121564. [Google Scholar] [CrossRef]
  8. Nafi, I.M.; Tabassum, S.; Hassan, Q.R.; Abid, F. Effect of Electric Vehicle Fast Charging Station on Residential Distribution Network in Bangladesh. In Proceedings of the 2021 5th International Conference on Electrical Engineering and Information Communication Technology (ICEEICT), Dhaka, Bangladesh, 18–20 November 2021. [Google Scholar]
  9. Karmaker, A.K.; Roy, S.; Ahmed, M.R. Analysis of the Impact of Electric Vehicle Charging Station on Power Quality Issues. In Proceedings of the 2019 International Conference on Electrical, Computer and Communication Engineering (ECCE), Cox’s Bazar, Bangladesh, 7–9 February 2019. [Google Scholar]
  10. Deb, S.; Tammi, K.; Kalita, K.; Mahanta, P. Impact of Electric Vehicle Charging Station Load on Distribution Network. Energies 2018, 11, 178. [Google Scholar] [CrossRef] [Green Version]
  11. Gautam, A.; Verma, A.K.; Srivastava, M. A Novel Algorithm for Scheduling of Electric Vehicle Using Adaptive Load Forecasting with Vehicle-to-Grid Integration. In Proceedings of the 2019 8th International Conference on Power Systems (ICPS), Jaipur, India, 20–22 December 2019. [Google Scholar]
  12. Kumar Karmaker, A.; Rezwanul Islam, S.M. Energy Transferring Technology for Electric Vehicle Charging Station Considering Renewable Resources. In Proceedings of the 2021 International Conference on Automation, Control and Mechatronics for Industry 4.0 (ACMI), Rajshahi, Bangladesh, 8–9 July 2021. [Google Scholar]
  13. Donadee, J.; Shaw, R.; Garnett, O.; Cutter, E.; Min, L. Potential Benefits of Vehicle-to-Grid Technology in California: High Value for Capabilities beyond One-Way Managed Charging. IEEE Electrif. Mag. 2019, 7, 40–45. [Google Scholar] [CrossRef]
  14. Longo, M.; Foiadelli, F.; Yaïci, W. Electric Vehicles Integrated with Renewable Energy Sources for Sustainable Mobility. In New Trends in Electrical Vehicle Powertrains; IntechOpen: London, UK, 2019; ISBN 9781789850215. [Google Scholar]
  15. Gu, C.; Zhang, Y.; Wang, J.; Li, Q. Joint Planning of Electrical Storage and Gas Storage in Power-Gas Distribution Network Considering High-Penetration Electric Vehicle and Gas Vehicle. Appl. Energy 2021, 301, 117447. [Google Scholar] [CrossRef]
  16. Campaña, M.; Inga, E.; Cárdenas, J. Optimal Sizing of Electric Vehicle Charging Stations Considering Urban Traffic Flow for Smart Cities. Energies 2021, 14, 4933. [Google Scholar] [CrossRef]
  17. Ma, J.; Zhang, L. A Deploying Method for Predicting the Size and Optimizing the Location of an Electric Vehicle Charging Stations. Information 2018, 9, 170. [Google Scholar] [CrossRef] [Green Version]
  18. Yenchamchalit, K.; Kongjeen, Y.; Bhumkittipich, K.; Mithulananthan, N. Optimal Sizing and Location of the Charging Station for Plug-in Electric Vehicles Using the Particle Swarm Optimization Technique. In Proceedings of the 2018 International Electrical Engineering Congress (iEECON), Krabi, Thailand, 7–9 March 2018. [Google Scholar]
  19. Straka, M.; Carvalho, R.; Poel, G.V.D.; Buzna, L. Analysis of Energy Consumption at Slow Charging Infrastructure for Electric Vehicles. IEEE Access 2021, 9, 53885–53901. [Google Scholar] [CrossRef]
  20. Xing, Q.; Chen, Z.; Zhang, Z.; Huang, X.; Leng, Z.; Sun, K.; Chen, Y.; Wang, H. Charging Demand Forecasting Model for Electric Vehicles Based on Online Ride-Hailing Trip Data. IEEE Access 2019, 7, 137390–137409. [Google Scholar] [CrossRef]
  21. Ding, Z.; Teng, F.; Sarikprueck, P.; Hu, Z. Technical Review on Advanced Approaches for Electric Vehicle Charging Demand Management, Part II: Applications in Transportation System Coordination and Infrastructure Planning. IEEE Trans. Ind. Appl. 2020, 56, 5695–5703. [Google Scholar] [CrossRef]
  22. Carrillo, A.; Pimentel, A.; Ramirez, E.; Le, H.T. Mitigating Impacts of Plug-In Electric Vehicles on Local Distribution Feeders Using a Charging Management System. In Proceedings of the 2017 IEEE Transportation Electrification Conference and Expo (ITEC), Chicago, IL, USA, 22–24 June 2017. [Google Scholar]
  23. Kizhakkan, A.R.; Rathore, A.K.; Awasthi, A. Review of Electric Vehicle Charging Station Location Planning. In Proceedings of the 2019 IEEE Transportation Electrification Conference (ITEC-India), Bengaluru, India, 17–19 December 2019. [Google Scholar]
  24. Kongjeen, Y.; Junlakan, W.; Bhumkittipich, K.; Mithulananthan, N. Estimation of the Quick Charging Station for Electric Vehicles Based on Location and Population Density Data. Int. J. Intell. Eng. Syst. 2018, 11, 233–241. [Google Scholar] [CrossRef]
  25. Gkatzoflias, D.; Drossinos, I.; Zubaryeva, A.; Zambelli, P.; Dilara, P.; Thiel, C. Optimal Allocation of Electric Vehicle Charging Infrastructure in Cities and Regions; Publications Office of the European Union: Luxembourg, 2016; ISBN 9789279580079. [Google Scholar]
  26. Shepero, M.; Munkhammar, J. Spatial Markov Chain Model for Electric Vehicle Charging in Cities Using Geographical Information System (GIS) Data. Appl. Energy 2018, 231, 1089–1099. [Google Scholar] [CrossRef]
  27. Huang, D.; Chen, Y.; Pan, X. Optimal Model of Locating Charging Stations with Massive Urban Trajectories. IOP Conf. Ser. Mater. Sci. Eng. 2020, 715, 012009. [Google Scholar] [CrossRef]
  28. Bi, R.; Xiao, J.; Viswanathan, V.; Knoll, A. Influence of Charging Behaviour given Charging Infrastructure Specification: A Case Study of Singapore. J. Comput. Sci. 2017, 20, 118–128. [Google Scholar] [CrossRef]
  29. Namdeo, A.; Tiwary, A.; Dziurla, R. Spatial Planning of Public Charging Points Using Multi-Dimensional Analysis of Early Adopters of Electric Vehicles for a City Region. Technol. Forecast. Soc. Change 2014, 89, 188–200. [Google Scholar] [CrossRef] [Green Version]
  30. Jia, J.; Liu, C.; Wan, T. Planning of the Charging Station for Electric Vehicles Utilizing Cellular Signaling Data. Sustainability 2019, 11, 643. [Google Scholar] [CrossRef] [Green Version]
  31. Xing, Q.; Chen, Z.; Zhang, Z.; Xu, X.; Zhang, T.; Huang, X.; Wang, H. Urban Electric Vehicle Fast-Charging Demand Forecasting Model Based on Data-Driven Approach and Human Decision-Making Behavior. Energies 2020, 13, 1412. [Google Scholar] [CrossRef] [Green Version]
  32. Zhang, J.; Yan, J.; Liu, Y.; Zhang, H.; Lv, G. Daily Electric Vehicle Charging Load Profiles Considering Demographics of Vehicle Users. Appl. Energy 2020, 274, 115063. [Google Scholar] [CrossRef]
  33. Paevere, P.; Higgins, A.; Ren, Z.; Horn, M.; Grozev, G.; McNamara, C. Spatio-Temporal Modelling of Electric Vehicle Charging Demand and Impacts on Peak Household Electrical Load. Sustain. Sci. 2014, 9, 61–76. [Google Scholar] [CrossRef]
  34. Betancur, D.; Duarte, L.F.; Revollo, J.; Restrepo, C.; Díez, A.E.; Isaac, I.A.; López, G.J.; González, J.W. Methodology to Evaluate the Impact of Electric Vehicles on Electrical Networks Using Monte Carlo. Energies 2021, 14, 1300. [Google Scholar] [CrossRef]
  35. Zheng, Y.; Shao, Z.; Zhang, Y.; Jian, L. A Systematic Methodology for Mid-and-Long Term Electric Vehicle Charging Load Forecasting: The Case Study of Shenzhen, China. Sustain. Cities Soc. 2020, 56, 102084. [Google Scholar] [CrossRef]
  36. Olivella-Rosell, P.; Villafafila-Robles, R.; Sumper, A.; Bergas-Jané, J. Probabilistic Agent-Based Model of Electric Vehicle Charging Demand to Analyse the Impact on Distribution Networks. Energies 2015, 8, 4160–4187. [Google Scholar] [CrossRef]
  37. Clear EV Plan Is a Must. Available online: https://www.bangkokpost.com/opinion/opinion/2091151/clear-ev-plan-is-a-must (accessed on 12 January 2022).
  38. Weiss, M.; Cloos, K.C.; Helmers, E. Energy Efficiency Trade-Offs in Small to Large Electric Vehicles. Environ. Sci. Eur. 2020, 32, 46. [Google Scholar] [CrossRef] [Green Version]
  39. Badin, F.; Le Berr, F.; Briki, H.; Dabadie, J.-C.; Petit, M.; Magand, S.; Condemine, E. Evaluation of EVs Energy Consumption Influencing Factors, Driving Conditions, Auxiliaries Use, Driver’s Aggressiveness. World Electr. Veh. J. 2013, 6, 112–123. [Google Scholar] [CrossRef] [Green Version]
  40. Desreveaux, A.; Bouscayrol, A.; Castex, E.; Trigui, R.; Hittinger, E.; Sirbu, G.-M. Annual Variation in Energy Consumption of an Electric Vehicle Used for Commuting. Energies 2020, 13, 4639. [Google Scholar] [CrossRef]
  41. Varga, B.; Sagoian, A.; Mariasiu, F. Prediction of Electric Vehicle Range: A Comprehensive Review of Current Issues and Challenges. Energies 2019, 12, 946. [Google Scholar] [CrossRef] [Green Version]
  42. Botsford, C.; Szczepanek, A. Fast Charging vs. Slow Charging: Pros and Cons for the New Age of Electric Vehicles. In Proceedings of the International Battery Hybrid Fuel Cell Electric Vehicle Symposium (EVS24), Stavanger, Norway, 13–16 May 2009. [Google Scholar]
  43. He, B.; Hou, Y. Research on Estimation Method of the Balance Density of Electric Vehicles Charging Points. In Proceedings of the 2017 IEEE International Conference on Energy Internet (ICEI), Beijing, China, 17–21 April 2017. [Google Scholar]
  44. Thailand, D. Energy Situation of Thailand January 2021. Available online: https://www.dede.go.th/download/stat63/sit2_jan2021.pdf (accessed on 7 January 2022).
  45. Kaewmamuang, K.; Siritaratiwat, A.; Surawanitkun, C.; Khunkitti, P.; Chatthaworn, R. A Novel Method for Solving Multi-Stage Distribution Substation Expansion Planning. Energy Procedia 2019, 156, 371–383. [Google Scholar] [CrossRef]
  46. Balducci, P.J.; Schienbein, L.A.; Nguyen, T.B.; Brown, D.R.; Fathelrahman, E.M. An Examination of the Costs and Critical Characteristics of Electric Utility Distribution System Capacity Enhancement Projects. In Proceedings of the 2005/2006 PES TD, Piscataway, NJ, USA, 10–13 October 2004. [Google Scholar]
  47. Greche, L.; Jazouli, M.; Es-Sbai, N.; Majda, A.; Zarghili, A. Comparison between Euclidean and Manhattan Distance Measure for Facial Expressions Classification. In Proceedings of the 2017 International Conference on Wireless Technologies, Embedded and Intelligent Systems (WITS), Fez, Morocco, 19–20 April 2017. [Google Scholar]
  48. Suwanda, R.; Syahputra, Z.; Zamzami, E.M. Analysis of Euclidean Distance and Manhattan Distance in the K-Means Algorithm for Variations Number of Centroid K. J. Phys. Conf. Ser. 2020, 1566, 012058. [Google Scholar] [CrossRef]
  49. Nielsen, F. On Voronoi Diagrams on the Information-Geometric Cauchy Manifolds. Entropy 2020, 22, 713. [Google Scholar] [CrossRef]
  50. Energy Consumption of Full Electric Vehicles. Available online: https://ev-database.org/cheatsheet/energy-consumption-electric-car (accessed on 11 February 2022).
  51. Beckers, C.J.J.; Besselink, I.J.M.; Nijmeijer, H. The State-of-the-Art of Battery Electric City Buses. In Proceedings of the 34th International Electric Vehicle Symposium and Exhibition (EVS34), Nanjing, China, 25–28 June 2021. [Google Scholar]
  52. Liimatainen, H.; van Vliet, O.; Aplyn, D. The Potential of Electric Trucks—An International Commodity-Level Analysis. Appl. Energy 2019, 236, 804–814. [Google Scholar] [CrossRef]
  53. Here’s How EV Drivers Charge Their Cars across Europe; Virta: Helsinki, Finland, 2021. Available online: https://www.virta.global/blog/how-are-we-charging-a-deep-dive-into-the-ev-charging-station-utilization-rates (accessed on 20 January 2022).
  54. Gopalakrishnan, R.; Biswas, A.; Lightwala, A.; Vasudevan, S.; Dutta, P.; Tripathi, A. Demand Prediction and Placement Optimization for Electric Vehicle Charging Stations. arXiv 2016, arXiv:1604.05472. [Google Scholar]
  55. Krishna, G. Understanding and Identifying Barriers to Electric Vehicle Adoption through Thematic Analysis. Transp. Res. Interdiscip. Perspect. 2021, 10, 100364. [Google Scholar] [CrossRef]
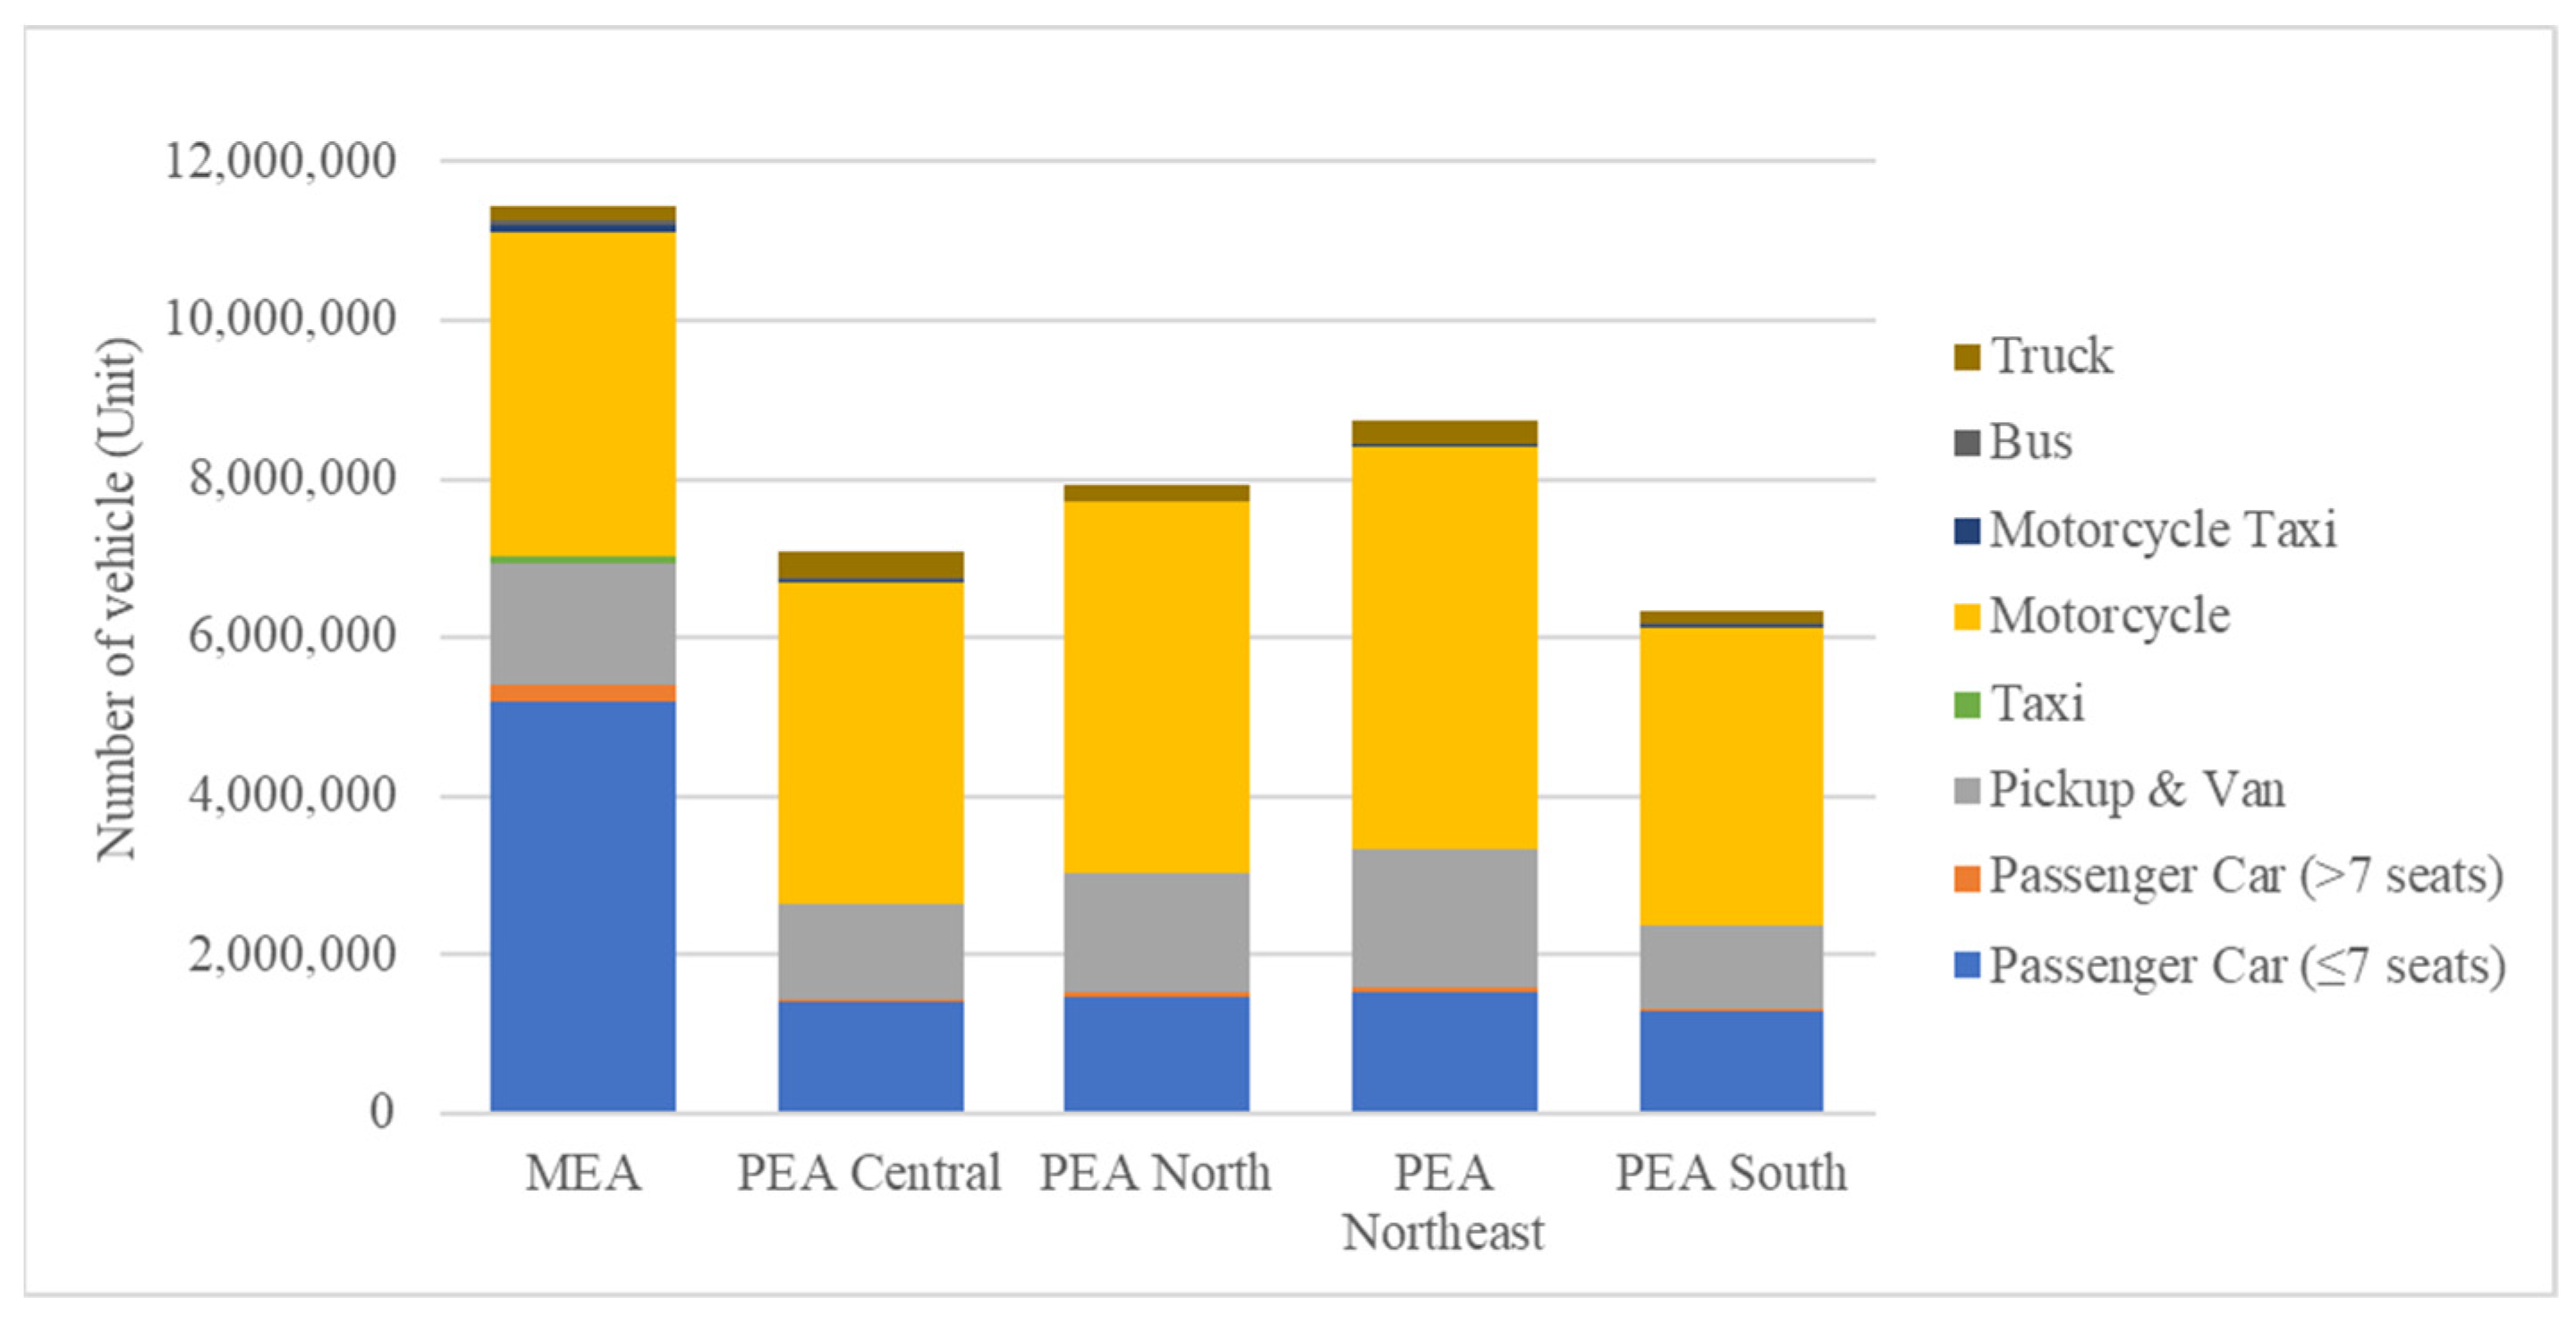
Figure 1. Overview of proposed methodology.
Energies 15 03859 g001
Figure 2. Concept of energy consumption estimation.
Energies 15 03859 g002
Figure 3. Concept of power demand derivation.
Energies 15 03859 g003
Figure 4. Serving areas of substation A and substation B created by using the Voronoi diagram.
Energies 15 03859 g004
Figure 5. Percentage proportion of various vehicle types.
Energies 15 03859 g005
Figure 6. Number of vehicles of each type.
Energies 15 03859 g006
Figure 7. (a) Map of Nakhon Nayok, (b) number of registered passenger cars (≤7 seats) of each subdistrict, and (c) estimated number of electric passenger cars (≤7 seats) of each cell.
Energies 15 03859 g007
Figure 8. Heat maps representing the number of electric passenger cars (≤7 seats) in (a) Thailand, (b) Northern PEA, (c) Northeastern PEA, (d) Southern PEA, (e) Central PEA, and (f) MEA.
Energies 15 03859 g008
Figure 9. Heat maps representing the number of electric motorcycles in (a) Thailand, (b) Northern PEA, (c) Northeastern PEA, (d) Southern PEA, (e) Central PEA, and (f) MEA.
Energies 15 03859 g009
Figure 10. (a) Allocation of public fast chargers based on energy consumption and (b) public fast chargers grouped with substation A, substation B, and substation C by using the Voronoi diagram.
Energies 15 03859 g010
Table 1. Proportion of number of vehicles in each area.
Vehicle TypeProportion of Number of Vehicles (%)
MEACentral PEANorth PEANortheast PEASouth PEA
Passenger car (≤7 seats)47.7312.8413.5814.0611.79
Passenger car (>7 seats)52.6111.9012.9613.928.61
Pickup and van21.6816.9521.3625.1314.88
Taxi89.710.640.881.347.43
Motorcycle18.8518.7821.5723.4117.39
Motorcycle taxi66.3522.362.952.156.19
Bus30.5720.2712.6315.8820.65
Truck17.3527.5217.8324.9412.35
Table 2. Parameters for energy consumption estimation.
Vehicle Type D a v g (km) E c o n (Wh/km)
Passenger car (≤7 seats)50175
Passenger car (>7 seats)50275
Pickup and van50275
Motorcycle2060
Taxi300175
Motorcycle taxi12060
Bus601300
Truck3601000
Table 3. Energy consumption for each vehicle type.
Vehicle TypeEnergy Consumption (GWh)
OverallMEACentral PEANorth PEANortheast PEASouth PEA
Passenger car (≤7 seats)10.5975.0581.3611.4391.4901.249
Passenger car (>7 seats)0.6740.3550.0800.0870.0940.058
Pickup and van10.7152.3231.8162.2892.6931.594
Motorcycle3.8120.7190.7160.8220.8930.663
Taxi0.5580.5010.0040.0050.0080.041
Motorcycle taxi0.1670.1110.0370.0050.0040.010
Bus1.3040.3990.2640.1650.2070.269
Truck51.5838.94914.1979.19712.8676.373
Total79.40918.41218.47514.01018.25410.259
Table 4. Recommended number of public chargers.
Vehicle TypeNumber of Public Chargers (Unit)
OverallMEACentral PEANorth PEANortheast PEASouth PEA
Passenger car (≤7 seats)40171916516546565474
Passenger car (>7 seats)25813531343622
Pickup and van40608806898671020604
Taxi42303792283857315
Total12,56567231264148516781415
Publisher’s Note: MDPI stays neutral with regard to jurisdictional claims in published maps and institutional affiliations.

