
A New Relative Permeability Characterization Method Considering High Waterflooding Pore Volume

1
Sinopec Shengli Oilfield Technology Testing Center, Dongying 257062, China
2
Faculty of Engineering, School of Energy, China University of Geosciences, Beijing 100083, China
*
Author to whom correspondence should be addressed.
Energies 2022, 15(11), 3868; https://0-doi-org.brum.beds.ac.uk/10.3390/en15113868
Submission received: 31 March 2022
/
Revised: 6 May 2022
/
Accepted: 19 May 2022
/
Published: 24 May 2022
(This article belongs to the Special Issue Advances in Unconventional Oil and Gas)
Abstract
:In the process of waterflooding development, high waterflooding PVs will make the fluid percolation in the reservoir more complicated, resulting in lower efficiency of waterflooding. High waterflooding PVs will affect the relative permeability and change the seepage law of oil–water two-phase flow in a high water-cut period. In this study, we performed high waterflooding PVs relative permeability experiments using nine natural cores. The unsteady measurement method is used to test the relative permeability curve. The results show that: (1) the relative permeability is affected by the waterflooding PVs, the recovery efficiency of 2000 waterflooding PVs is 10.72% higher than that of 50 waterflooding PVs on the core scale; (2) it makes water mobility increase sharply, while oil phase flow capacity remains low and decreases at high water cut stage. A new relative permeability characterization method considering high waterflooding PVs is established, which is applied to the numerical simulator. It shows that the remaining oil saturation of the high-permeability belt is higher than the calculation results of the traditional numerical simulator. It means that the injected water does not diffuse much into the low-permeability zone of the formation. The modified simulator is validated with the actual China offshore oilfield model. The numerical saturation of the key section of the passing well is in good agreement with the actual logging interpretation results, and the water cut curve fits better in the whole area. The modified simulator could predict oil production accurately after high waterflooding PVs treatment.
1. Introduction
The development of oil and gas reservoirs generally goes through three stages. The first stage is the increased production period. The second is the constant production stage, and the third is characterized by declining production. As the reservoir enters its production decline period, there are several EOR methods available to help the field achieve maximum recovery [1,2]. Increasing the waterflooding PVs is an economical and straightforward technique, considering the economic cost. In the process of actual reservoir water flooding development, which is affected by reservoir heterogeneity, water is injected into the planes and longitudinal high-permeability bands, the water–oil ratio rises sharply, and the waterflooding PVs can reach hundreds or thousands of times in the mainline or near the well area [3,4]. The uneven distribution of waterflooding PVs in the reservoir leads to the invalid circulation of injected water. It has been found that the method of flow diagnosis that has been applied to profile control and water plugging measures, by defining the relationship of the connectivity volume, flux, distribution factors of injection flow, production wells in the reservoir, and Lorentz coefficient, can semi-quantitatively judge the waterflooding PVs in the reservoir and provide well reference for profile control and water plugging [5,6,7,8,9]. The traditional relative permeability test is usually performed under the conditions of 30–50 PV displacement multiple and 50–60% oil displacement efficiency. Laboratory tests in the Shengli oilfield show that the oil recovery efficiency can reach 70–80% by increasing waterflooding PVs and displacement pressure gradient. The oil recovery efficiency of the Daqing oilfield is nearly 100% when the waterflooding PVs are 26,331 PVs [10,11]. After long-term waterflooding, the pore throat structure of loose sandstone reservoirs will change [12]. It is suggested that the formation is formed in large water channels. In the stage of high water cut and high recovery of China’s Bohai SZ oilfield, the coring data of new drilling wells shows that the microscopic pore throat characteristics of the reservoir went through significant changes after long-term waterflooding. The south China sea offshore oil field laboratory experimental study shows that the oil displacement efficiency can be increased from 60.67% in the case of waterflooding (100 PVs) to 71.27% in the case of extra high waterflooding (2000 PVs), and the residual oil saturation can be reduced from 29.56% to 21.72%, indicating that high water-cut oil fields still have great exploitation potential [13,14,15]. Similar characteristics are also found in the Daqing Lasaxing oilfield and some foreign oilfields in the North Sea. The remaining oil saturation of the strongly water washed oil layer is lower than the laboratory experiment results [16,17,18]. A large number of field practice and laboratory physical simulation experiments prove that increasing the waterflooding PVs can effectively improve the oilfield development effect.
However, there are several understandings of the mechanism of high waterflooding PVs in EOR. First, long-term waterflooding can cause a change in the reservoir; the essence of high waterflooding PVs is the long-term reconstruction of underground reservoir conditions. If the sandstone is poorly cemented, long-term waterflooding will cause the migration of particles and clay swelling, even sanding, which can cause physical parameters such as reservoir porosity, permeability, and reservoir microscopic pore structure changes. This affects fluid percolation characteristics in the reservoir [19,20,21,22,23,24]. Second, in the whole process of waterflooding development, the residual oil saturation is not a constant, and the oil displacement efficiency measured in the laboratory at the early stage of development does not represent the ultimate recovery efficiency. High waterflooding PVs will reduce the critical capillary number of the reservoir, thus improving the oil displacement efficiency [17,25]. Third, increasing waterflooding PVs can improve the wettability of reservoir and oil recovery [26]. Either of the above mechanisms or the combination of two or more mechanisms will result in significant changes in the relative permeability curves that describe the characteristics of oil–water two-phase seepage.
Fang Yue et al. [27] conducted water–oil displacement experiments with high waterflooding PVs. They found that under high waterflooding PVs, oil-phase permeability decreased slowly while water-phase permeability increased significantly, and the water-flooding characteristic curve showed an upward “inflection point”. After the “inflection point”, water consumption increased sharply. The higher the permeability, the higher the displacement efficiency, and increasing injection speed can improve oil displacement efficiency. Hong-min Yu [28] found that high water waterflooding PVs relative permeability curve has the characteristic of semi-logarithmic piecewise linear bounded by the turning point of water cut, the relative permeability of oil and water does not change before the turning point, the residual oil saturation decreases after the turning point, and the relative permeability of oil and water extends to the limit. Zhang Wei et al. [13] found that the isotonic point of the relative permeability curve shifts to the right after the high waterflooding PVs, indicating that the water wettability is enhanced, which is beneficial to water flooding. Microscopic remaining oil flow patterns are classified and studied by Chun lei Yu [29] through the micro-glass etching model experiment and computer image recognition processing technology. The results show that the remaining oil flow patterns can be divided into clusters of flow, porous flow, columnar, membrane, and flows in dropwise flow. In five classes considering oil-water and the contact relation between the pore throat, cluster flow accounts for the largest proportion. With the increase in water saturation, the cluster flow gradually transformed into porous flow, columnar flow, membrane flow, and droplet flow. At the same time, the reason for the nonlinear relative permeability curve and the mobility law of oil and water in the ultra-high water cut period is explained from the microscopic point of view.
From the above research results, it can be clearly seen that the physical simulation of waterflooding with high PVs is relatively mature. However, different types of reservoirs with different properties also have significant differences in their production systems [30,31,32,33,34,35]. Therefore, the performance of oil displacement efficiency and relative permeability is also quite different for the high waterflooding PVs treatment. Moreover, the application of the understanding of high waterflooding PVs’ relative permeability in numerical simulation is still unclear. In other words, there are bottlenecks when the in-house experimental results are applied to the field.
The relative permeability in the traditional numerical simulation model can not change automatically according to the actual production strategy and reservoir properties changes. Therefore, we took the natural core of Q oilfield in the Bohai Sea as the research object and carried out high waterflooding PVs experiments. According to the experimental results, the relationship between relative permeability and water saturation (Sw) and waterflooding PVs is established. The knowledge is coupled to the numerical simulator. The effectiveness of the simulator is verified by the latest logging interpretation results of the passing well and the fitting of the water cut in the well area.
2. Experiments
2.1. Experimental Design
Bohai oilfield is a typical fluvial facies reservoir with high permeability and porosity. According to the property variation range of the main reservoir, the law of high waterflooding PVs’ relative permeability of different properties (244~9380 mD) was studied. A total of 9 groups of waterflooding experiments were carried out using typical reservoir cores. The simulated oil viscosity is 28 mPa·s. Standard brine used in the experiments has a salinity of 10,000 mg/L. The test fluid was designed according to the actual reservoir oil and water properties of the Q32-6 oilfield. The waterflooding rate was 1.0 mL/min. The maximum waterflooding PVs is 2000 PVs.
2.2. Sample and Devices
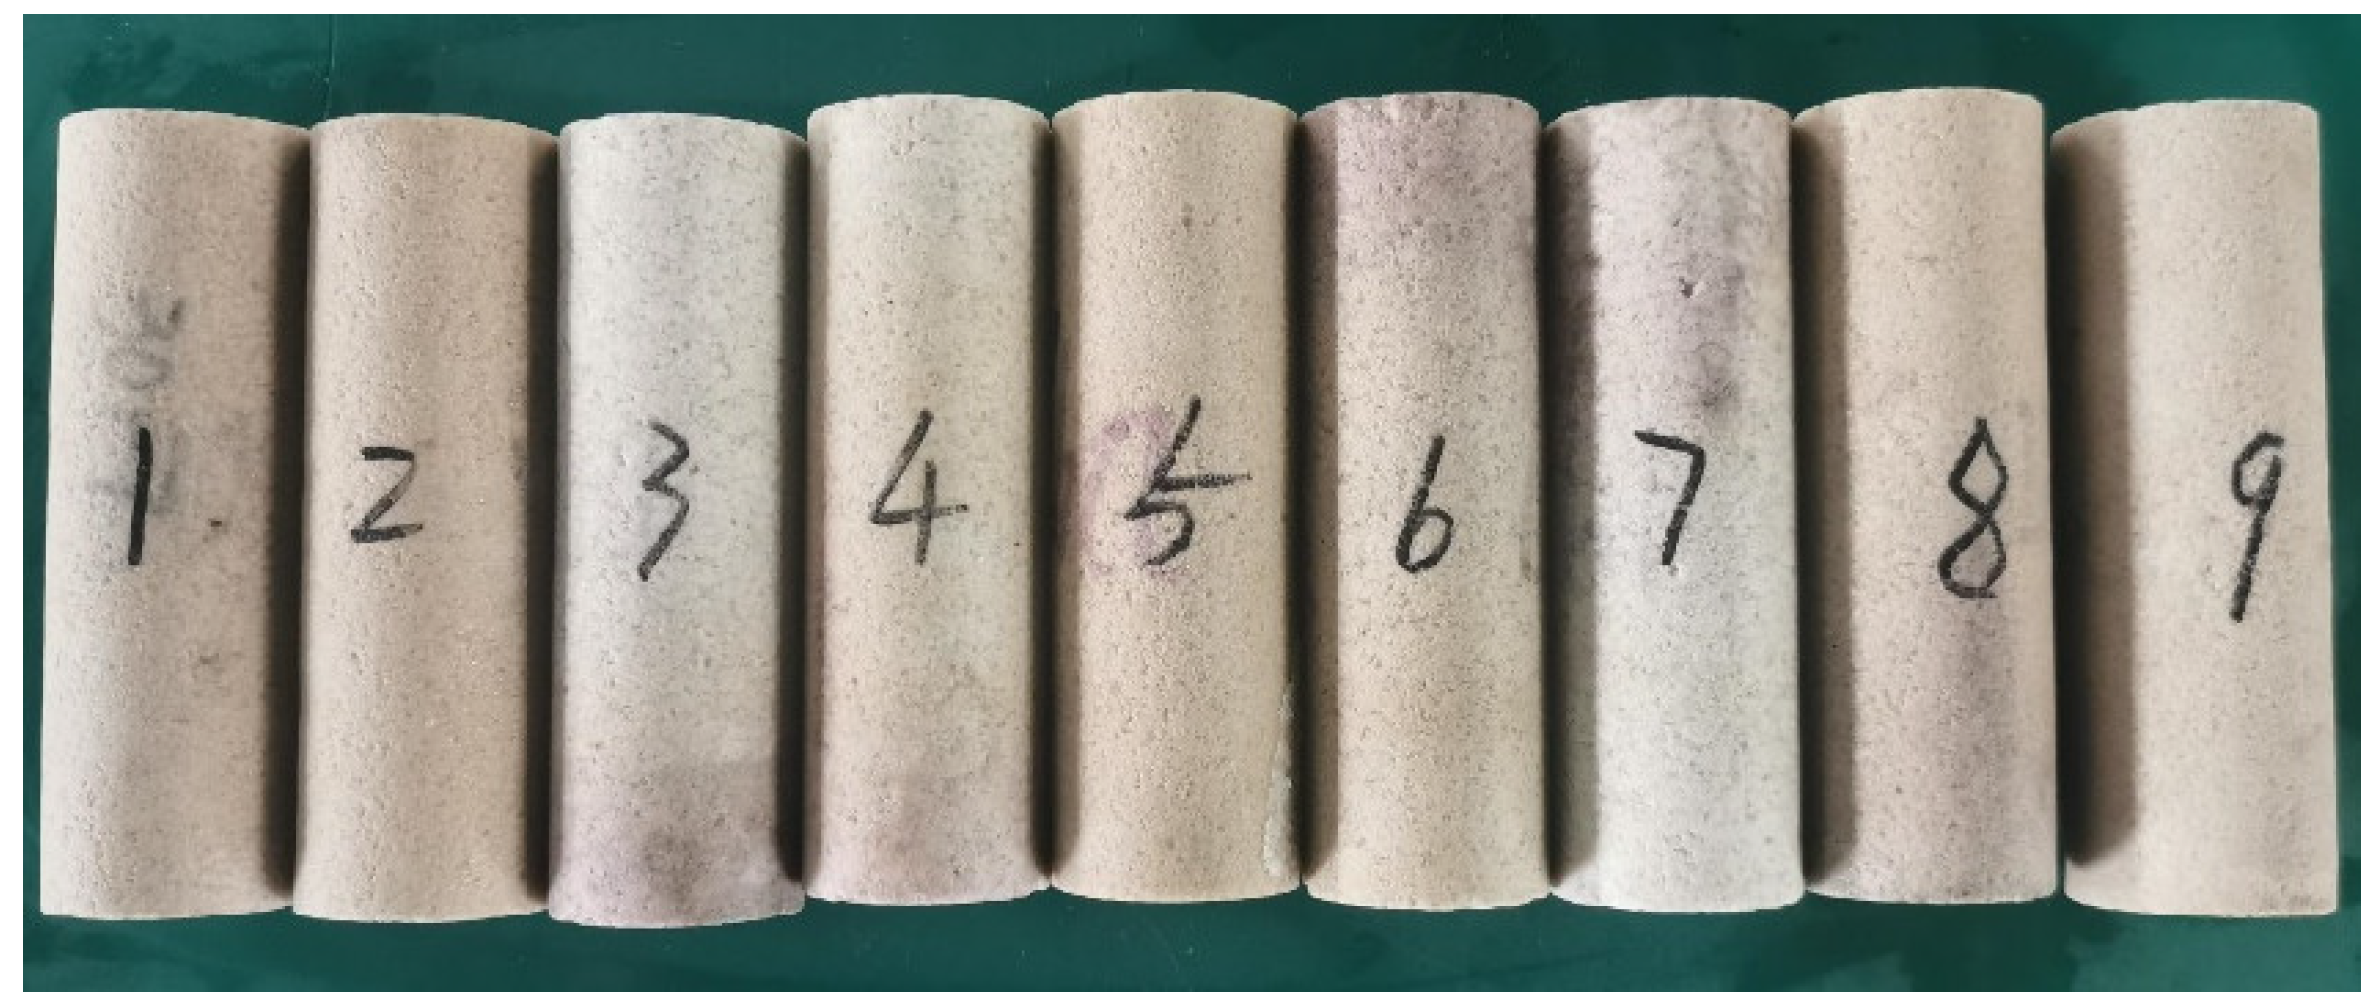
In this study, natural cores with different permeability (244–4814.8 mD) were selected to carry out high waterflooding PVs displacement experiments. We describe the cores used in the experiment in Figure 1. All of these cores are moderately wet. Table 1 shows a summary of cores conditions.
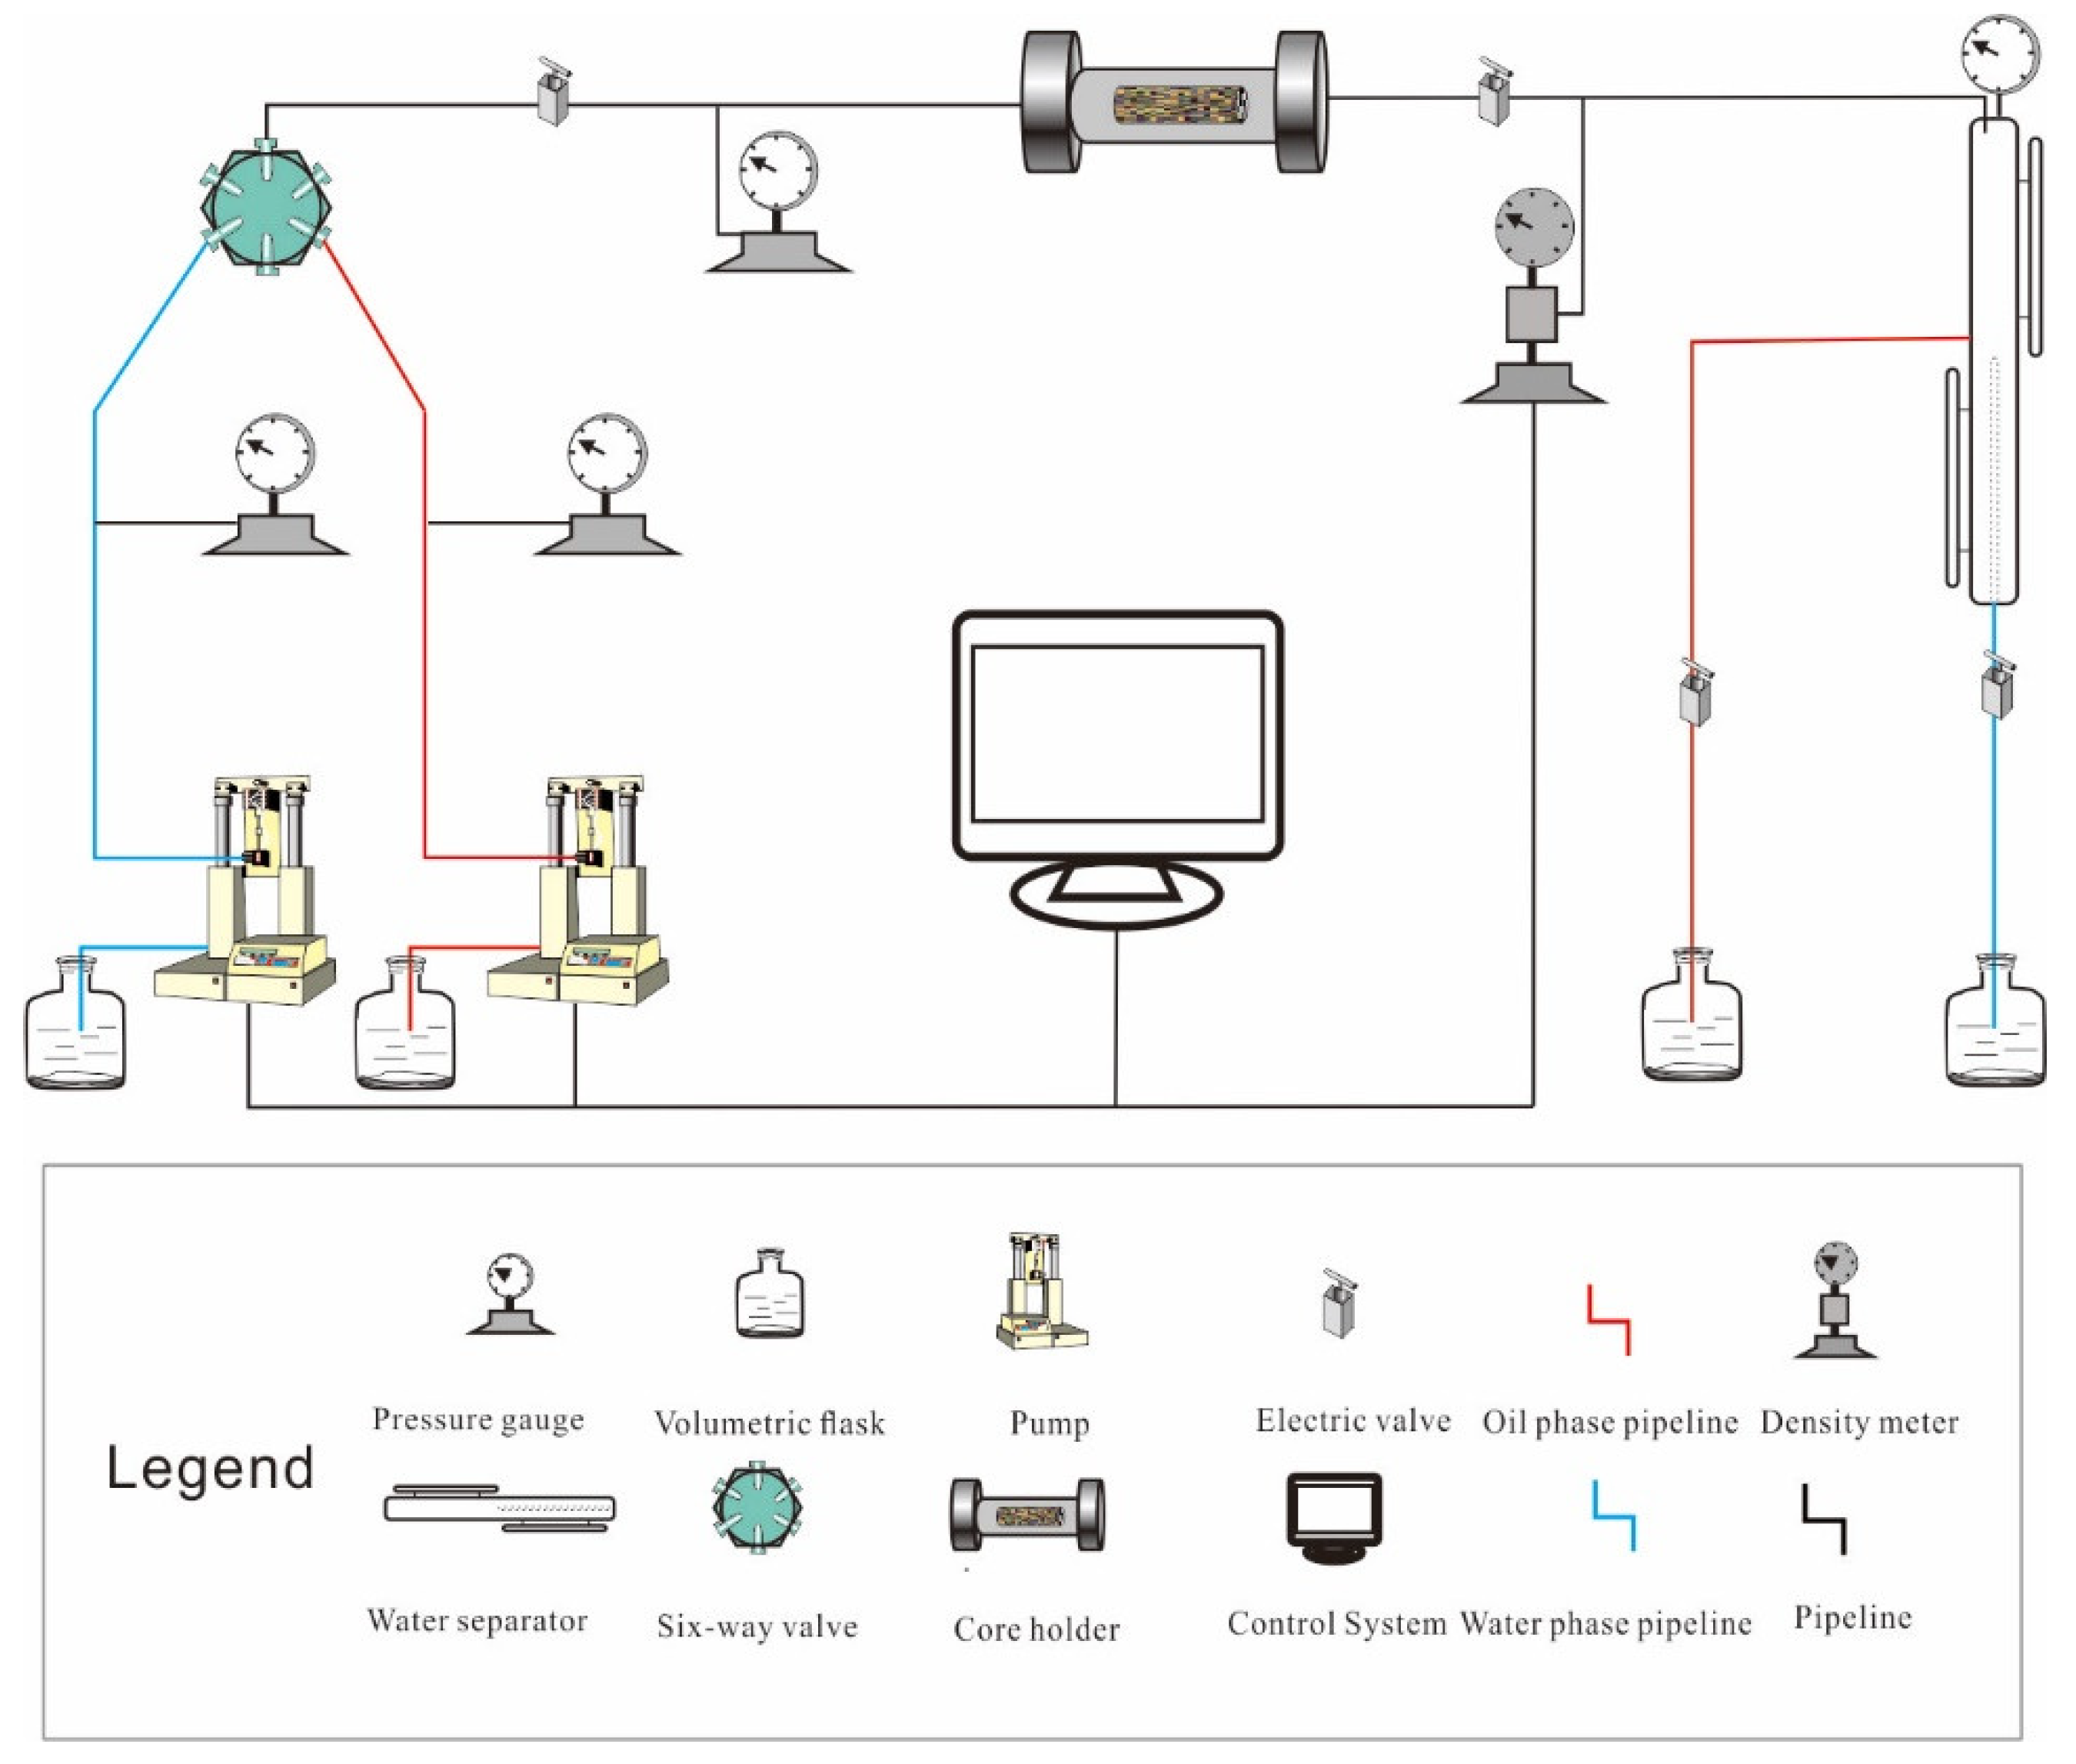
The experimental process consists of five parts: pressure control system, temperature control system, core holder, metering, and data acquisition system (Figure 2).
The relative permeability of different cores at high waterflooding PVs was measured.
2.3. Experimental Procedure
In this experiment, the core is vacuumed and then saturated with standard saltwater, followed by oil flooding to create irreducible water conditions, and finally, continuous water flooding at a specified temperature. The variation of oil and water at the outlet end with time and the displacement pressure difference is recorded. The specific steps are as follows:
A. The simulated formation water is prepared and stands for 1 day, then filtered and loaded into an intermediate container.
B. The cores treated by washing oil and salt are dried, weighed, vacuumed, and saturated with simulated formation water.
C. The core is loaded into the core holder, the irreducible water is established by simulated oil flooding, and the oil phase permeability under the condition of irreducible water is measured.
D. Simulated formation water is used to displace the core with constant speed. The data of breakthrough time, cumulative oil production, cumulative liquid production, displacement velocity, and the displacement pressure difference between the two ends of the core are accurately recorded.
E. At the beginning, encrypt the record and gradually lengthen the time interval of the record with the continuous decrease in oil production. The experiment was finished after a water injection of 2000 PVs.
3. Experimental Result
3.1. High Waterflooding PVs Relative Permeability
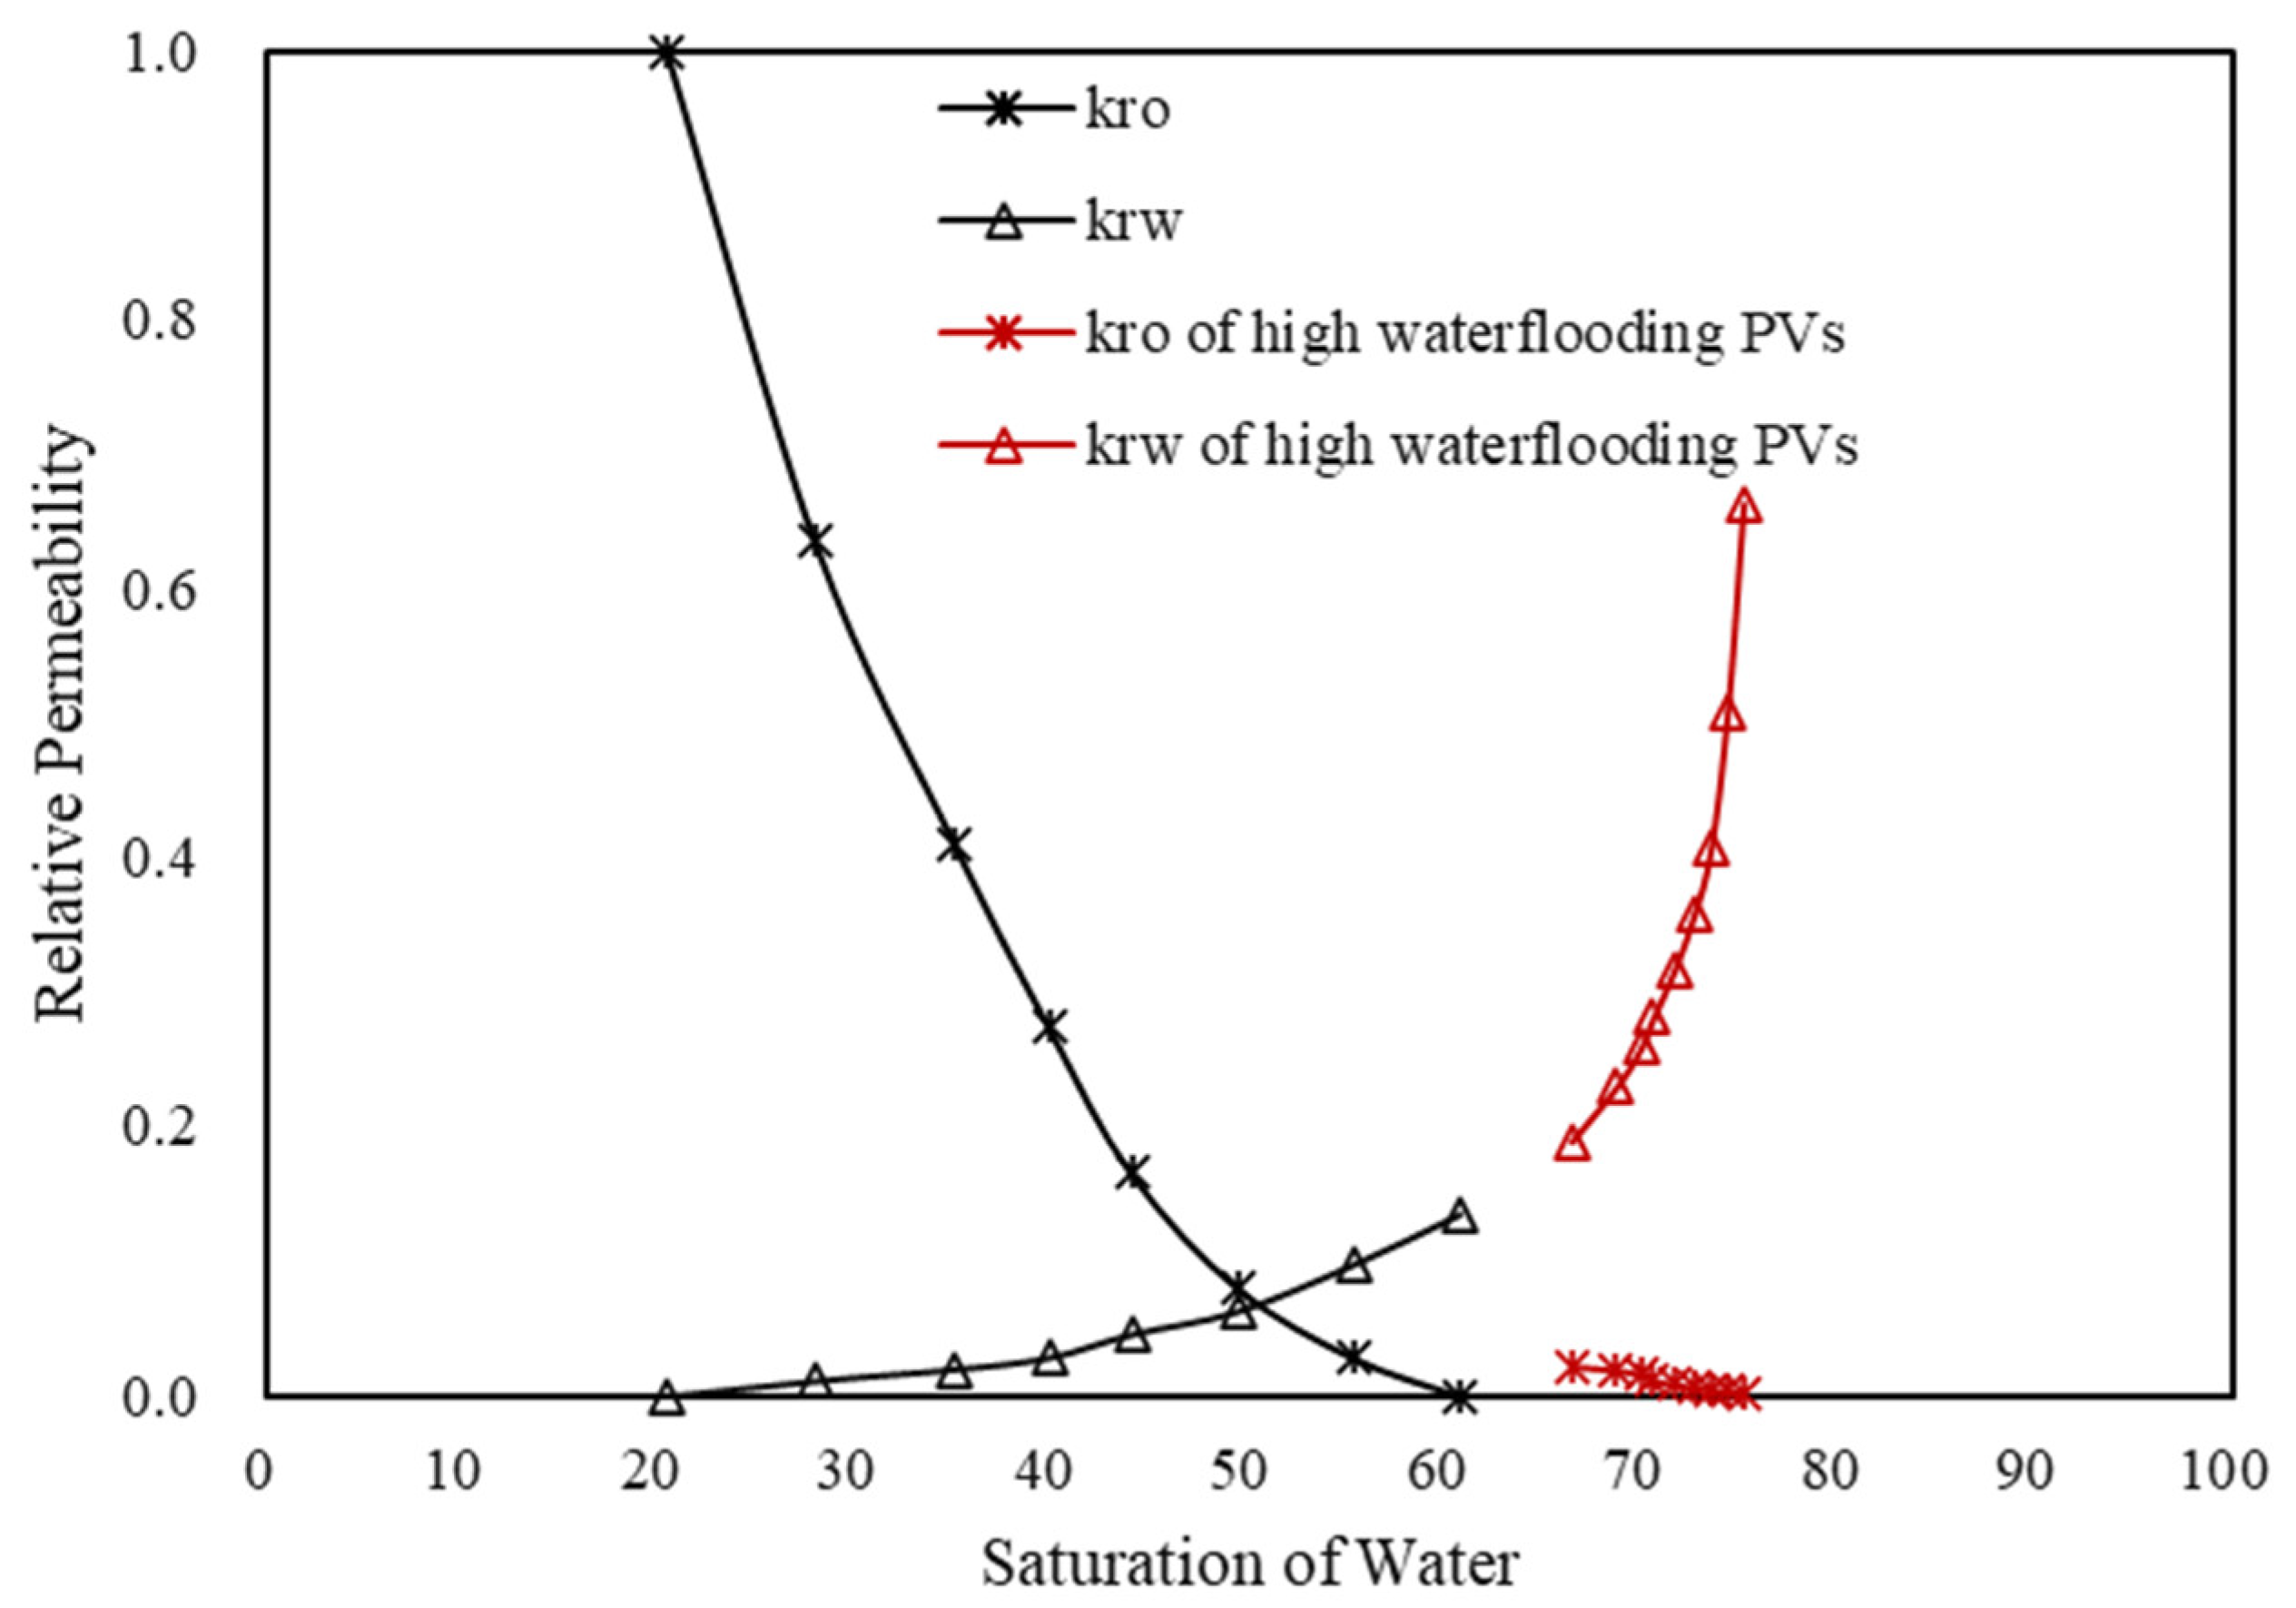
Nine groups of high waterflooding PVs’ relative permeability curves show similar characteristics. Here, we take the relative permeability curve of Core #4 as an example (Figure 3, other high waterflooding PVs relative permeability curves see Appendix A). It can be seen that with the increase in water saturation, the relative permeability of the oil phase decreases slowly, while that of the water phase increases sharply, and the increase in the water phase is much larger than the decrease in the oil phase. As waterflooding PVs increase from 50 PVs to 2000 PVs, water saturation increases from 60.8 to 75.2. If water waterflooding PVs stop at 50 PVs, oil-phase relative permeability is considered 0, and the water saturation is 60.8. Water-phase relative permeability is 13.4. If the waterflooding PVs increase to 2000 PVs, the relative permeability of the water phase increases from 13.4 to 66.4, and the relative permeability of the oil phase still decreases slowly with the water saturation increases from 60.8 to 66.4. During the increase in waterflooding PVs, the mobility of the oil phase is very low, accompanied by a continuous decrease, and the mobility of the water phase increases sharply.
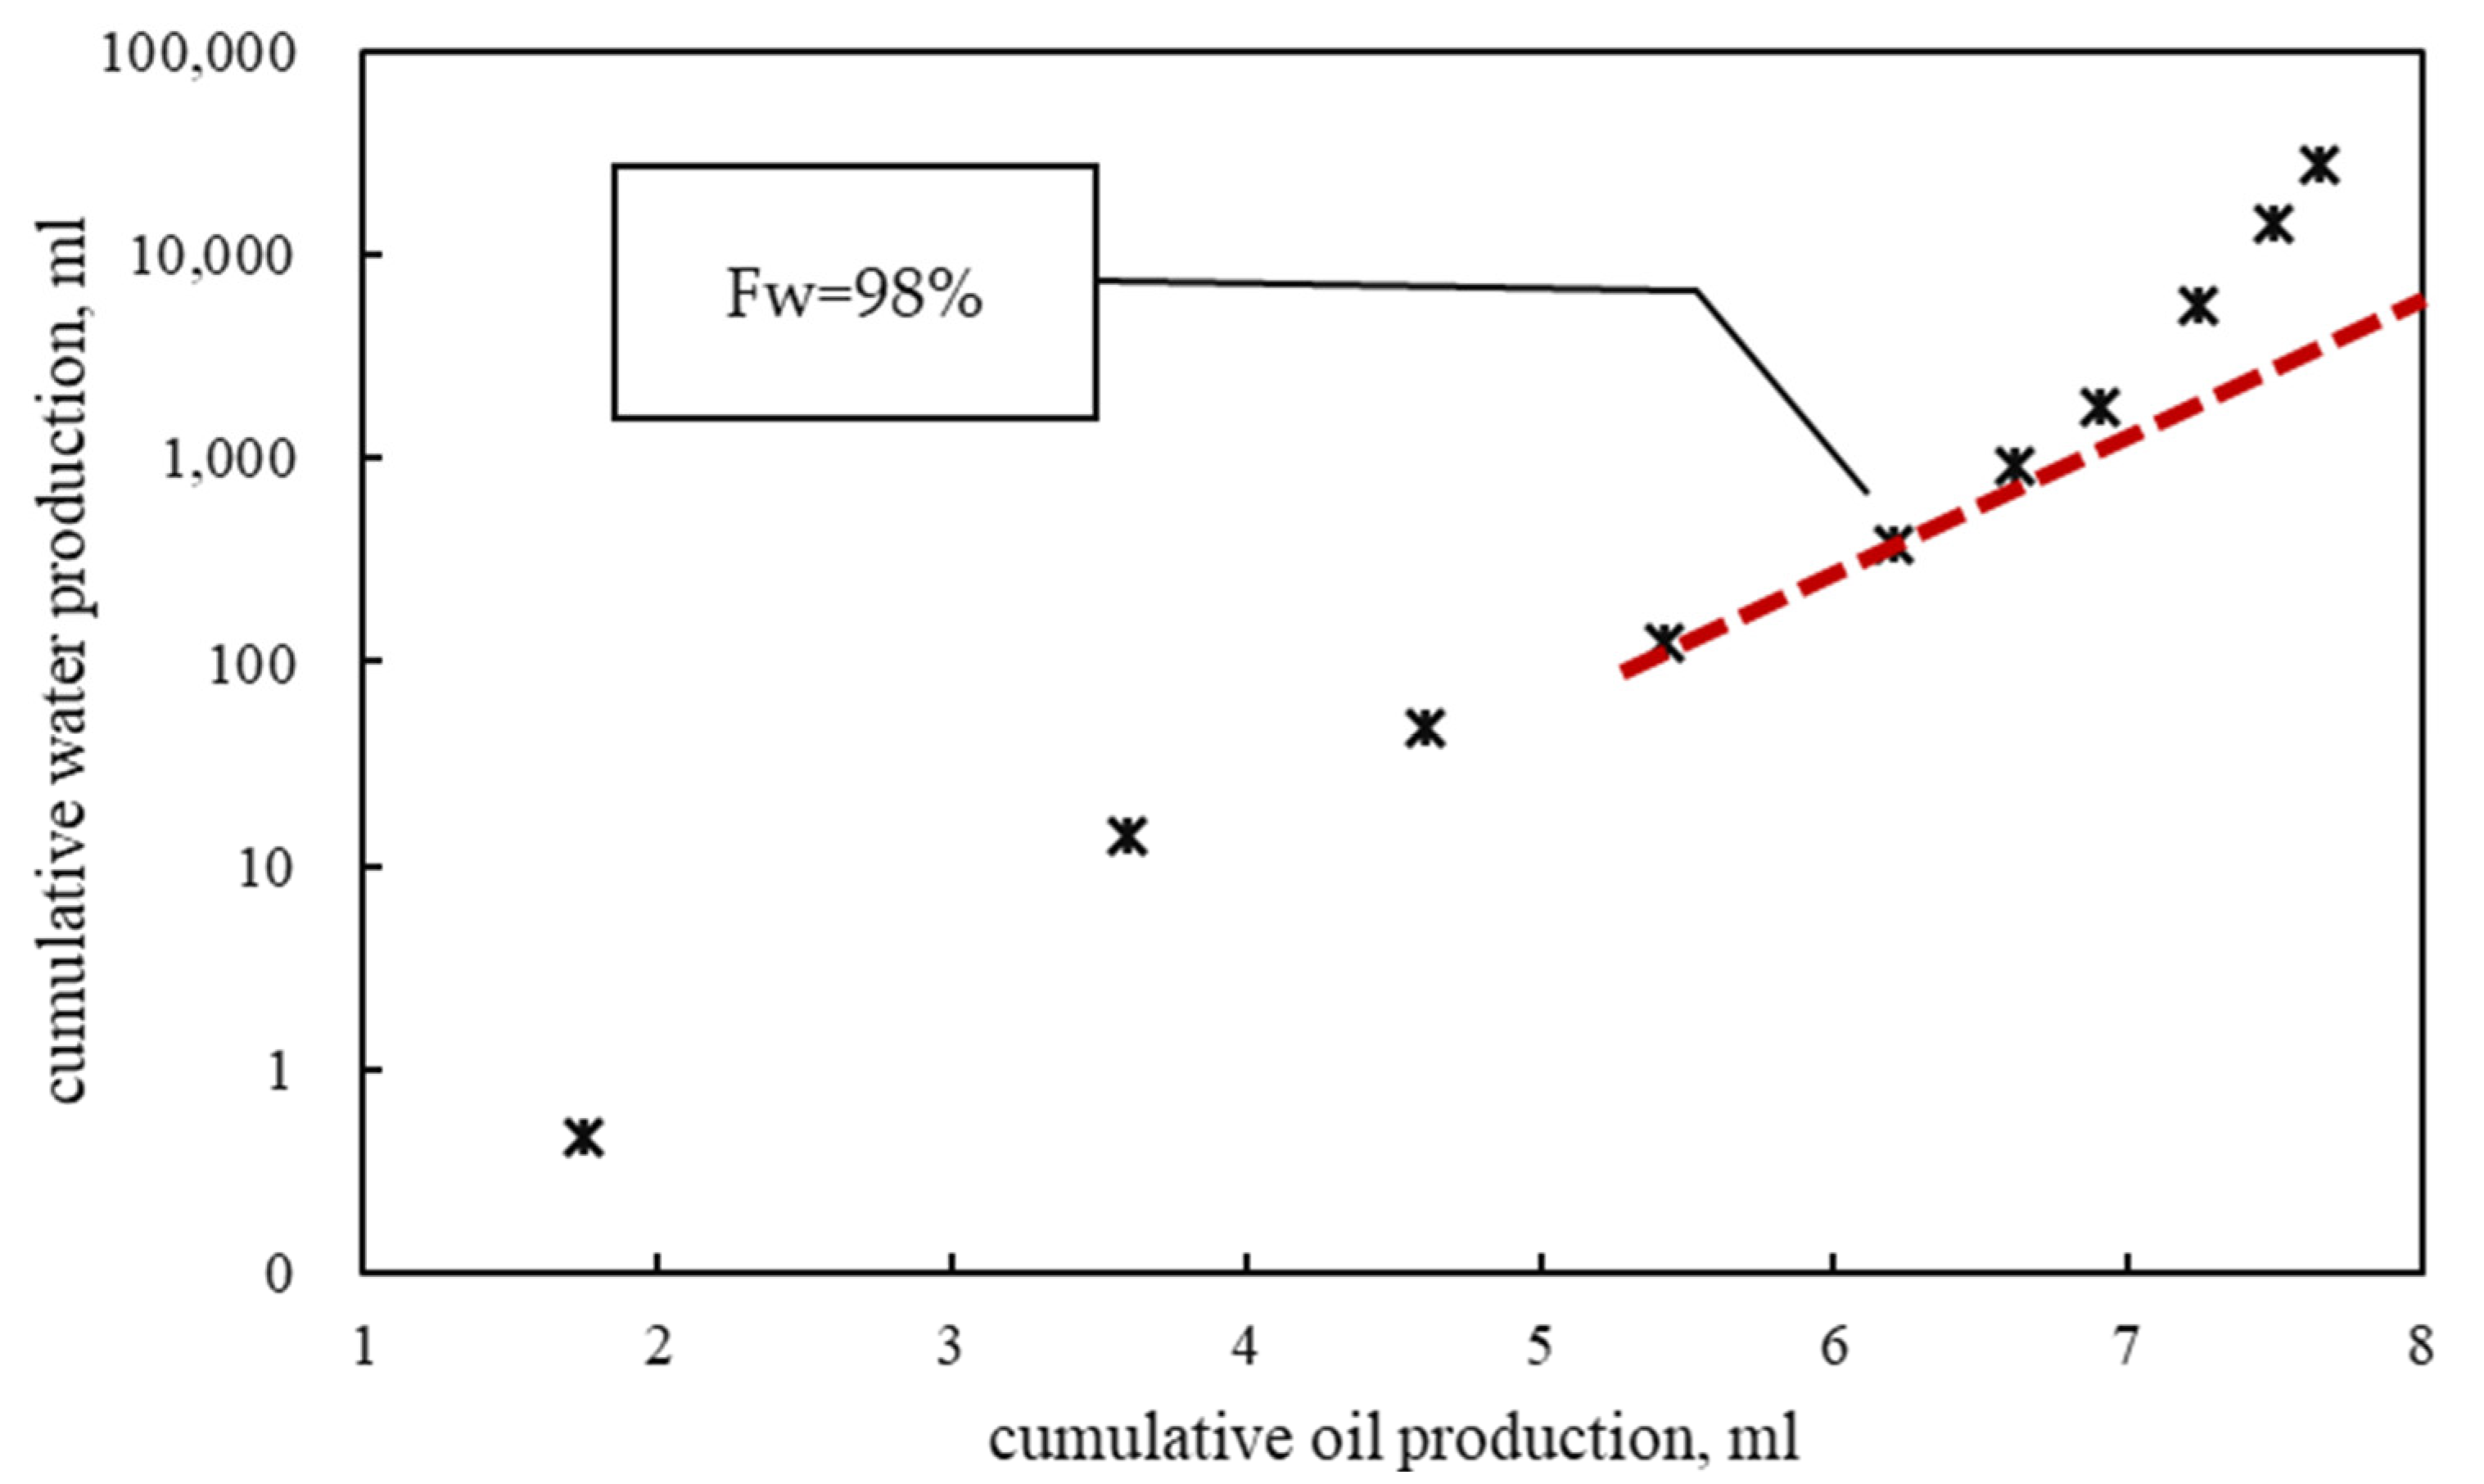
The waterflooding characteristic curve of no. 4 natural core at high waterflooding PVs (2000 PV) was obtained (Figure 4). The waterflooding characteristic curve upturns after the water cut reaches 98%. Before the “inflection point”, the waterflooding PVs is 67.26 PV, the water consumption is 3.36%, the cumulative time is 941.44 min, and the oil displacement efficiency is 55.74%. From the “inflection point” to the end of the experiment, another 1933 PV water was injected, which accounted for 96.64% of the total water consumption. The cumulative time was 27,052 min, and the oil displacement efficiency increased by 13%. It is suggested that after the waterflooding characteristic curve is upturned, the water consumption increases sharply, but the oil displacement efficiency increases slowly, and the development effect gradually deteriorates.
The experimental results of relative permeability at high waterflooding PVs show that increasing waterflooding PVs can improve oil displacement efficiency. However, the mobility of the water phase increases sharply at high waterflooding PVs, especially after the “inflection point” of a waterflooding characteristic curve appears; the same production of oil needs to consume more injection water. Therefore, before the “inflection point” appears in the waterflooding characteristic curve, it is the key to increasing waterflooding recovery efficiency economically and effectively. After the “inflection point”, appropriate measures can be taken to control the profile and plug water in order to improve the oil displacement contribution of injected water. Injection–production correlation analysis and flow diagnosis [5,6,7,8,9] can effectively help to identify high water consumption brands and provide a basis for better waterflooding development of oilfields.
3.2. Relationship between Residual Oil Saturation and Waterflooding PVs
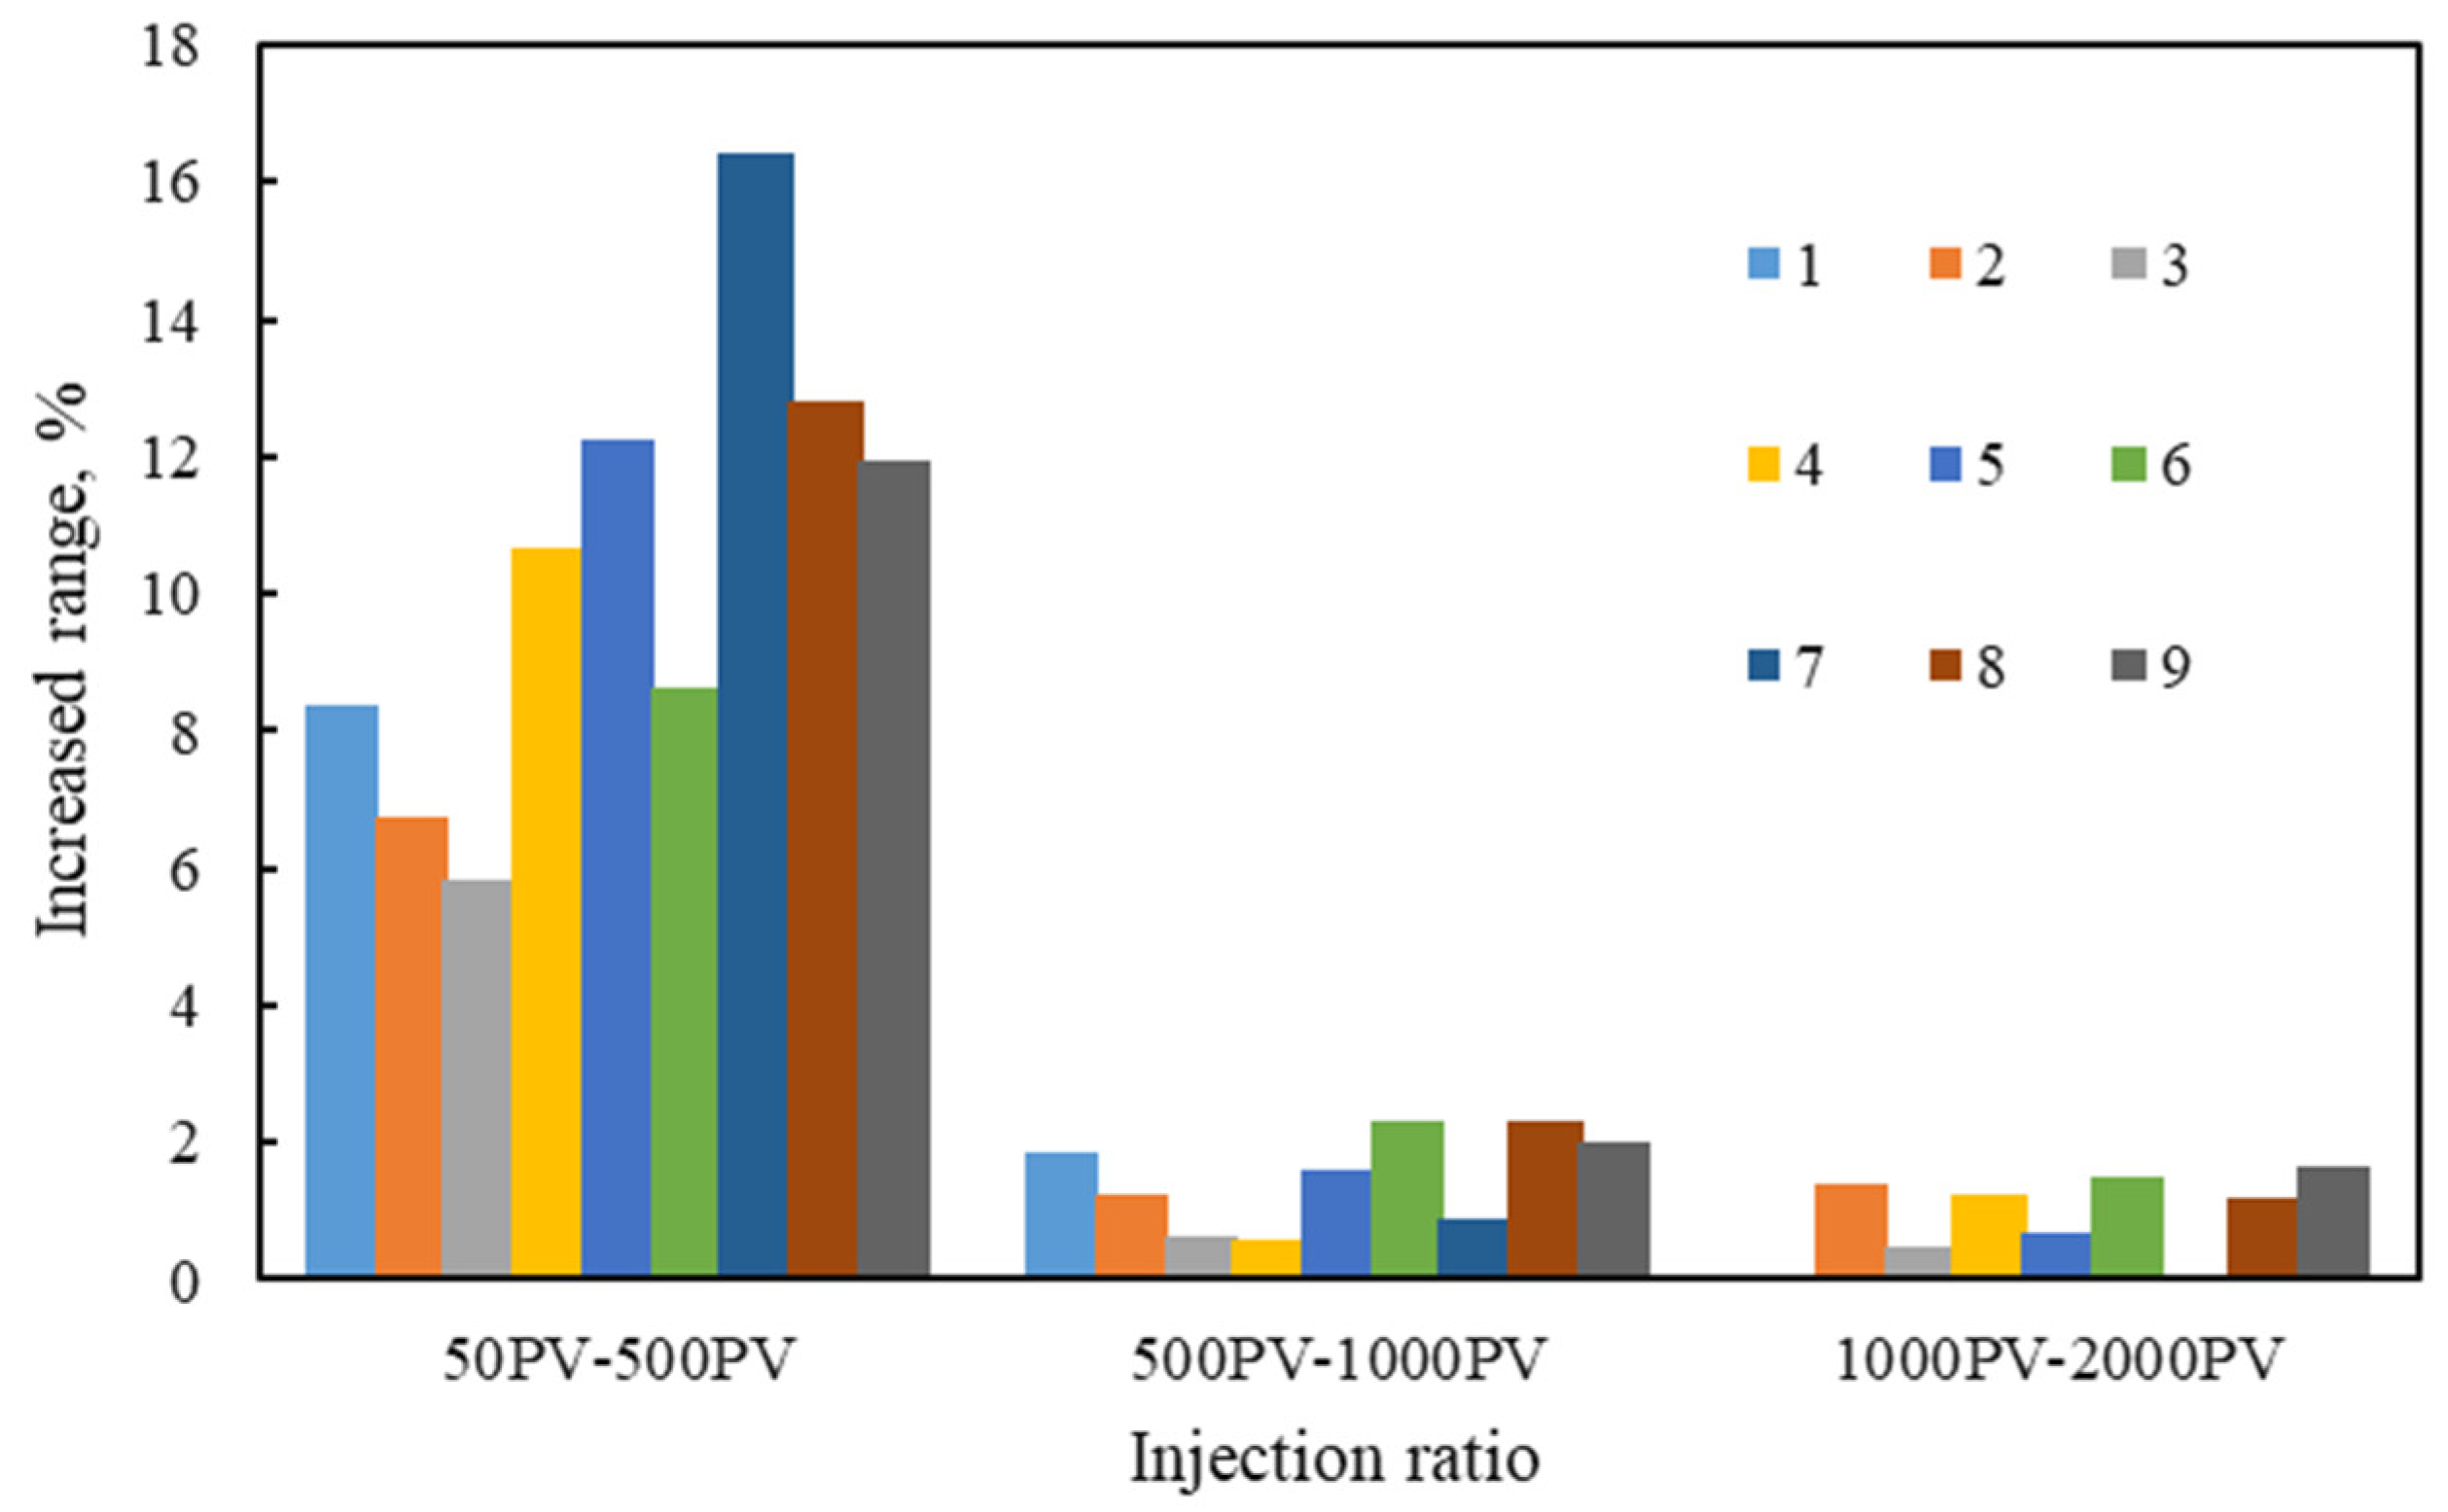
The amplitude of oil displacement efficiency improvement in different waterflooding PVs was counted (Figure 5). When the waterflooding PVs were increased from 50 PV to 500 PV, the average oil displacement efficiency was increased by 10.5%; when the displacement was further increased from 500 PV to 1000 PV, the oil displacement efficiency was increased by 1.5%; when the displacement was further increased from 1000 PV to 2000 PV, the oil displacement efficiency was only increased by 0.9%. The ultimate oil displacement efficiency is closely related to permeability. With the increase in permeability, the final displacement efficiency and the improved range of displacement efficiency increase. In the actual oilfield development process, the oil displacement efficiency under 2000 PV can be regarded as the ultimate displacement efficiency under the waterflooding state.
3.3. Mechanism Analysis
The reason for high waterflooding PVs’ relative permeability of high water cut stage shows these characteristics: (1) With the increase in water saturation in the process of waterflooding, the oil phase is continuously segmented, and the degree of discontinuity is continuously intensified, which is characterized by large quantity, small volume, and strong dispersion. (2) The increase in discontinuity is due to the increase in discontinuous flow patterns, such as cluster flow and porous flow, and the oil flow becomes more and more dispersed. (3) With the increase in water saturation, the proportion of discontinuous flow morphology (droplet flow, membrane flow, columnar flow, and porous flow) continues to increase, while the proportion of continuous flow morphology (cluster flow) gradually decreases. (4) In the continuous phase, the cluster flow has strong mobility and relatively high relative permeability, while the remaining oil of the other four forms has weak mobility and low relative permeability in the discontinuous phase, while the inflection point of the relative permeability curve occurs when the discontinuous phase with low relative permeability begins to develop. In other words, inhibiting the transformation and development of the continuous phase and discontinuous phase and maintaining the proportion of the continuous phase at a certain level can delay the occurrence of the inflection point of the phase permeability curve to some extent, which is helpful in improving the recovery factor [36,37,38,39].
4. Numerical Simulation
According to the experimental results, there is a significant difference between the relative permeability of high waterflooding PVs and the traditional relative permeability, especially in the high water cut stage. Therefore, based on MRST, we introduce the high waterflooding PVs’ relative permeability into the traditional numerical simulator (the new numerical simulator), update the relative permeability curve by automatically converting the injected water multiple, and compare the results with the traditional numerical simulator (a constant phase permeability curve is used in the whole simulation process). We set up a numerical simulation model: a heterogeneous model with high permeability bands along the diagonal distribution. The numerical simulation, calculating results obtained from the modified simulator, is compared with that from a traditional numerical simulator. The basic parameters of the numerical simulation model are shown in Table 2, and the relative permeability curve used in the numerical simulation model is shown in Figure 3.
4.1. High Water Waterflooding PVs Relative Permeability Characterization
MRST (MATLAB Reservoir Simulation Toolbox) is free, open-source software for reservoir modeling and simulation, developed primarily by the Computational Geosciences group in the Department of Mathematics and Cybernetics at SINTEF Digital. It provides a friendly environment for the realization of applications of new understanding or mechanisms on the influence of two-phase flow in the reservoir. It was used to write the empirical formula of residual oil saturation, respectively, into the simulator, which calculates the dynamic residual oil saturation of each grid at each time step and ensures that the value is less than the limit value of residual oil saturation.
The relationship between oil displacement efficiency and residual oil saturation is as follows:
In the numerical simulation, residual oil saturation is mainly used to calibrate key parameters such as the relative permeability curve. When the waterflooding PVs are less than 50, the results of conventional waterflooding experiments and relative permeability can be used, and when the water waterflooding PVs are greater than 50, it is necessary to dynamically characterize the residual oil saturation. After processing the experimental data of each group, the relationship between residual oil saturation and waterflooding PVs is established, and the power function is used as the time-varying expression of residual oil saturation (Figure 6).
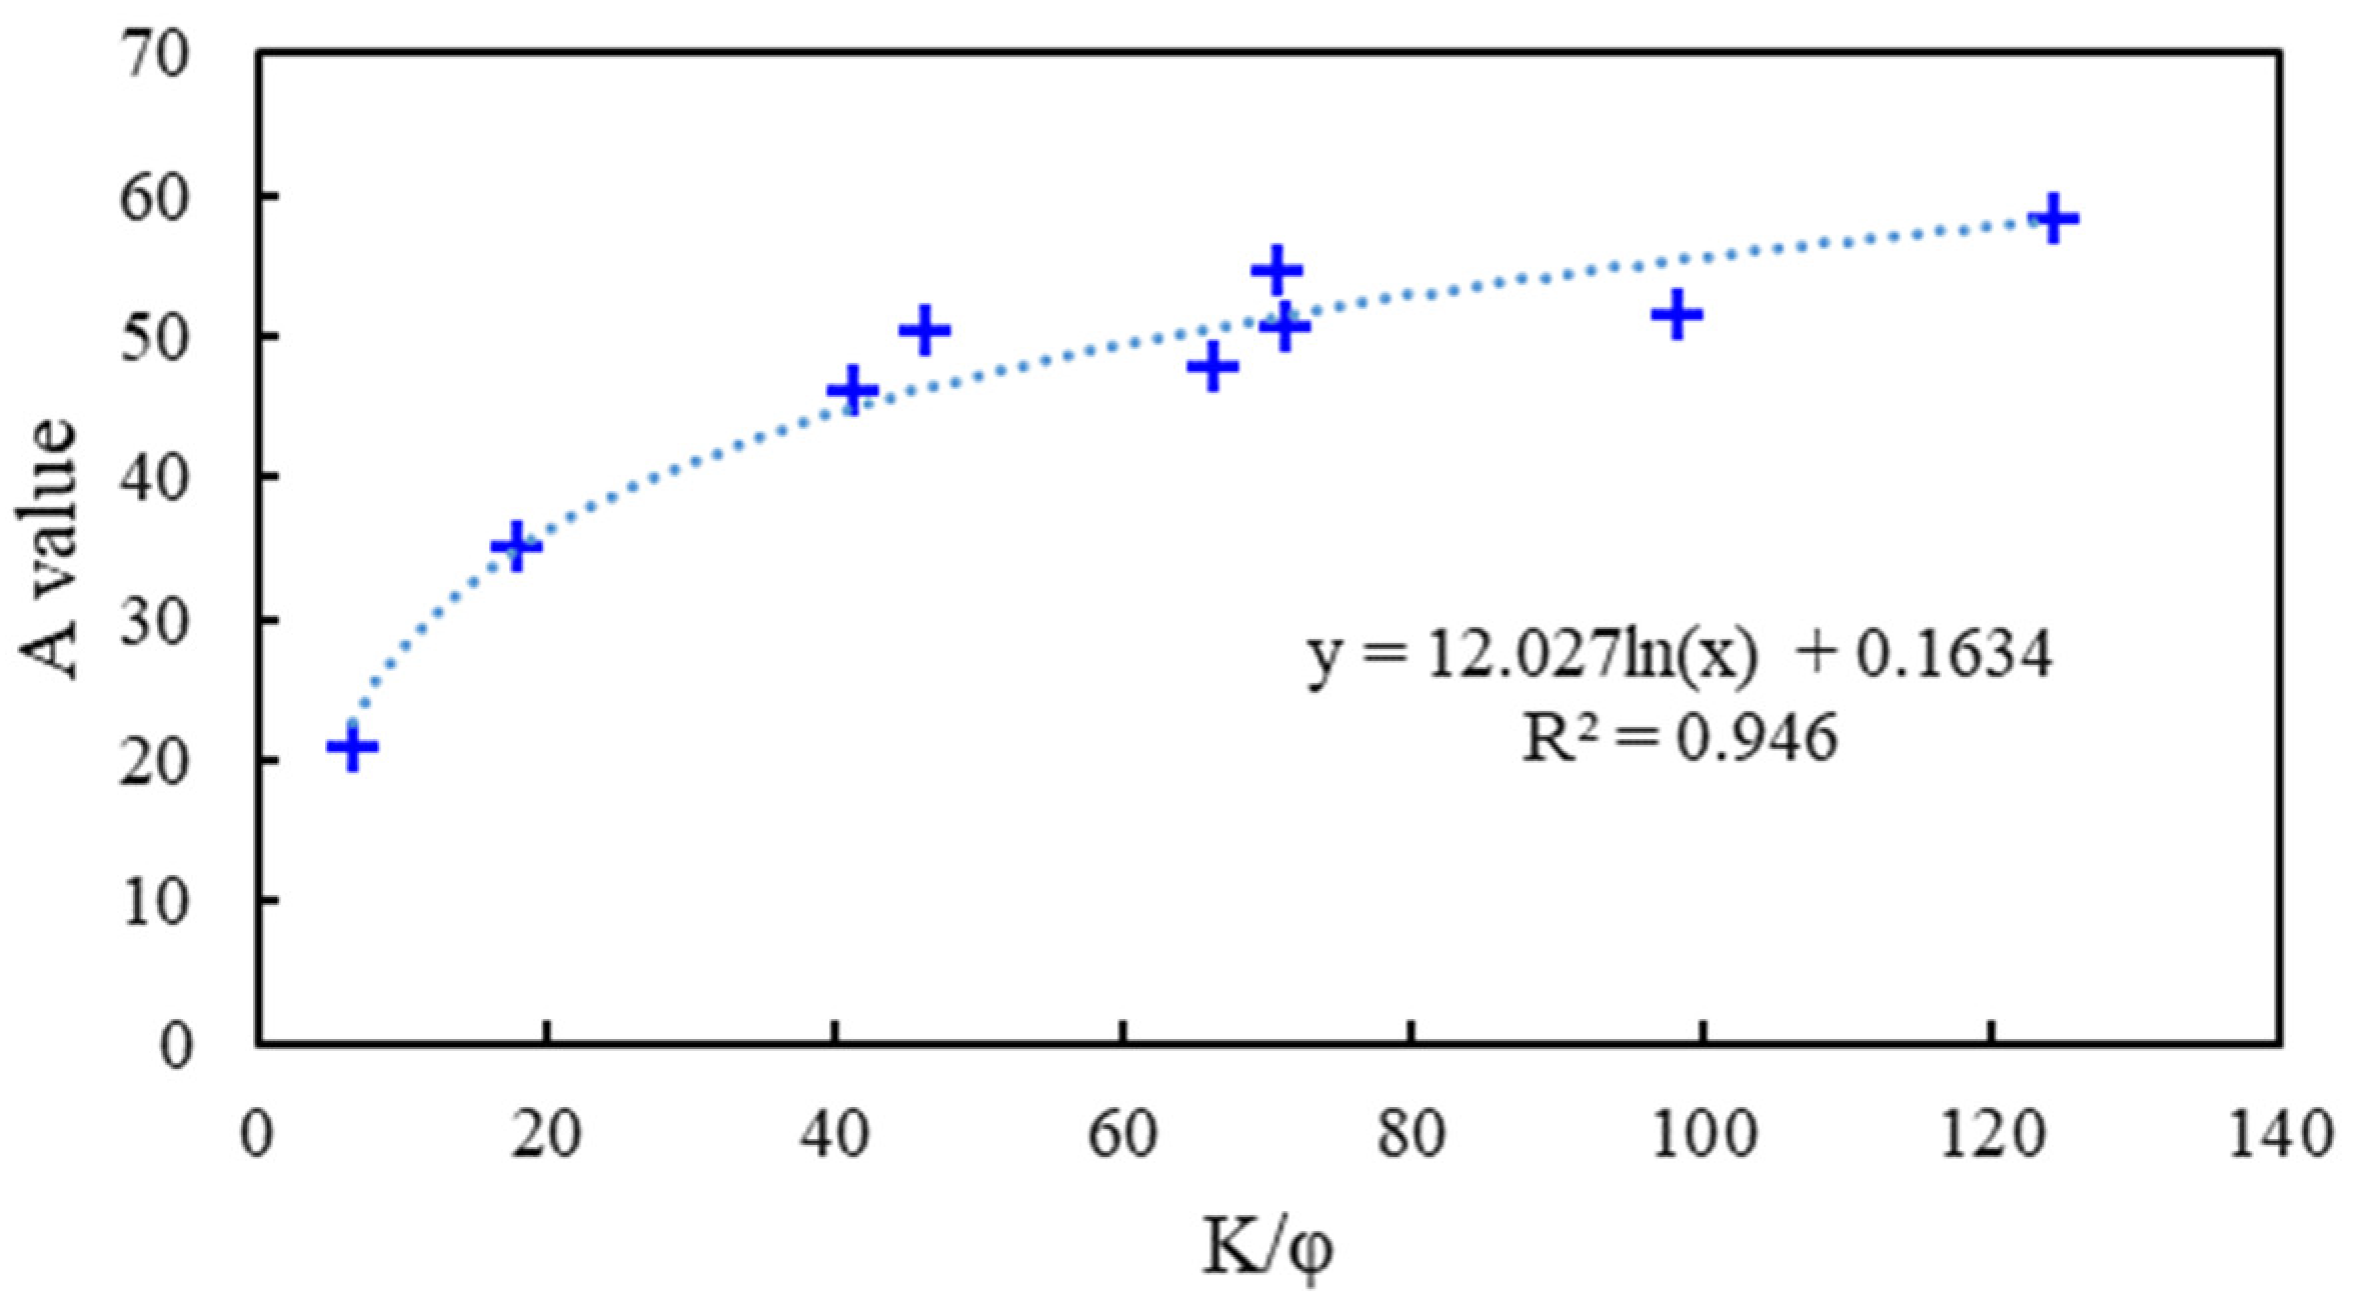
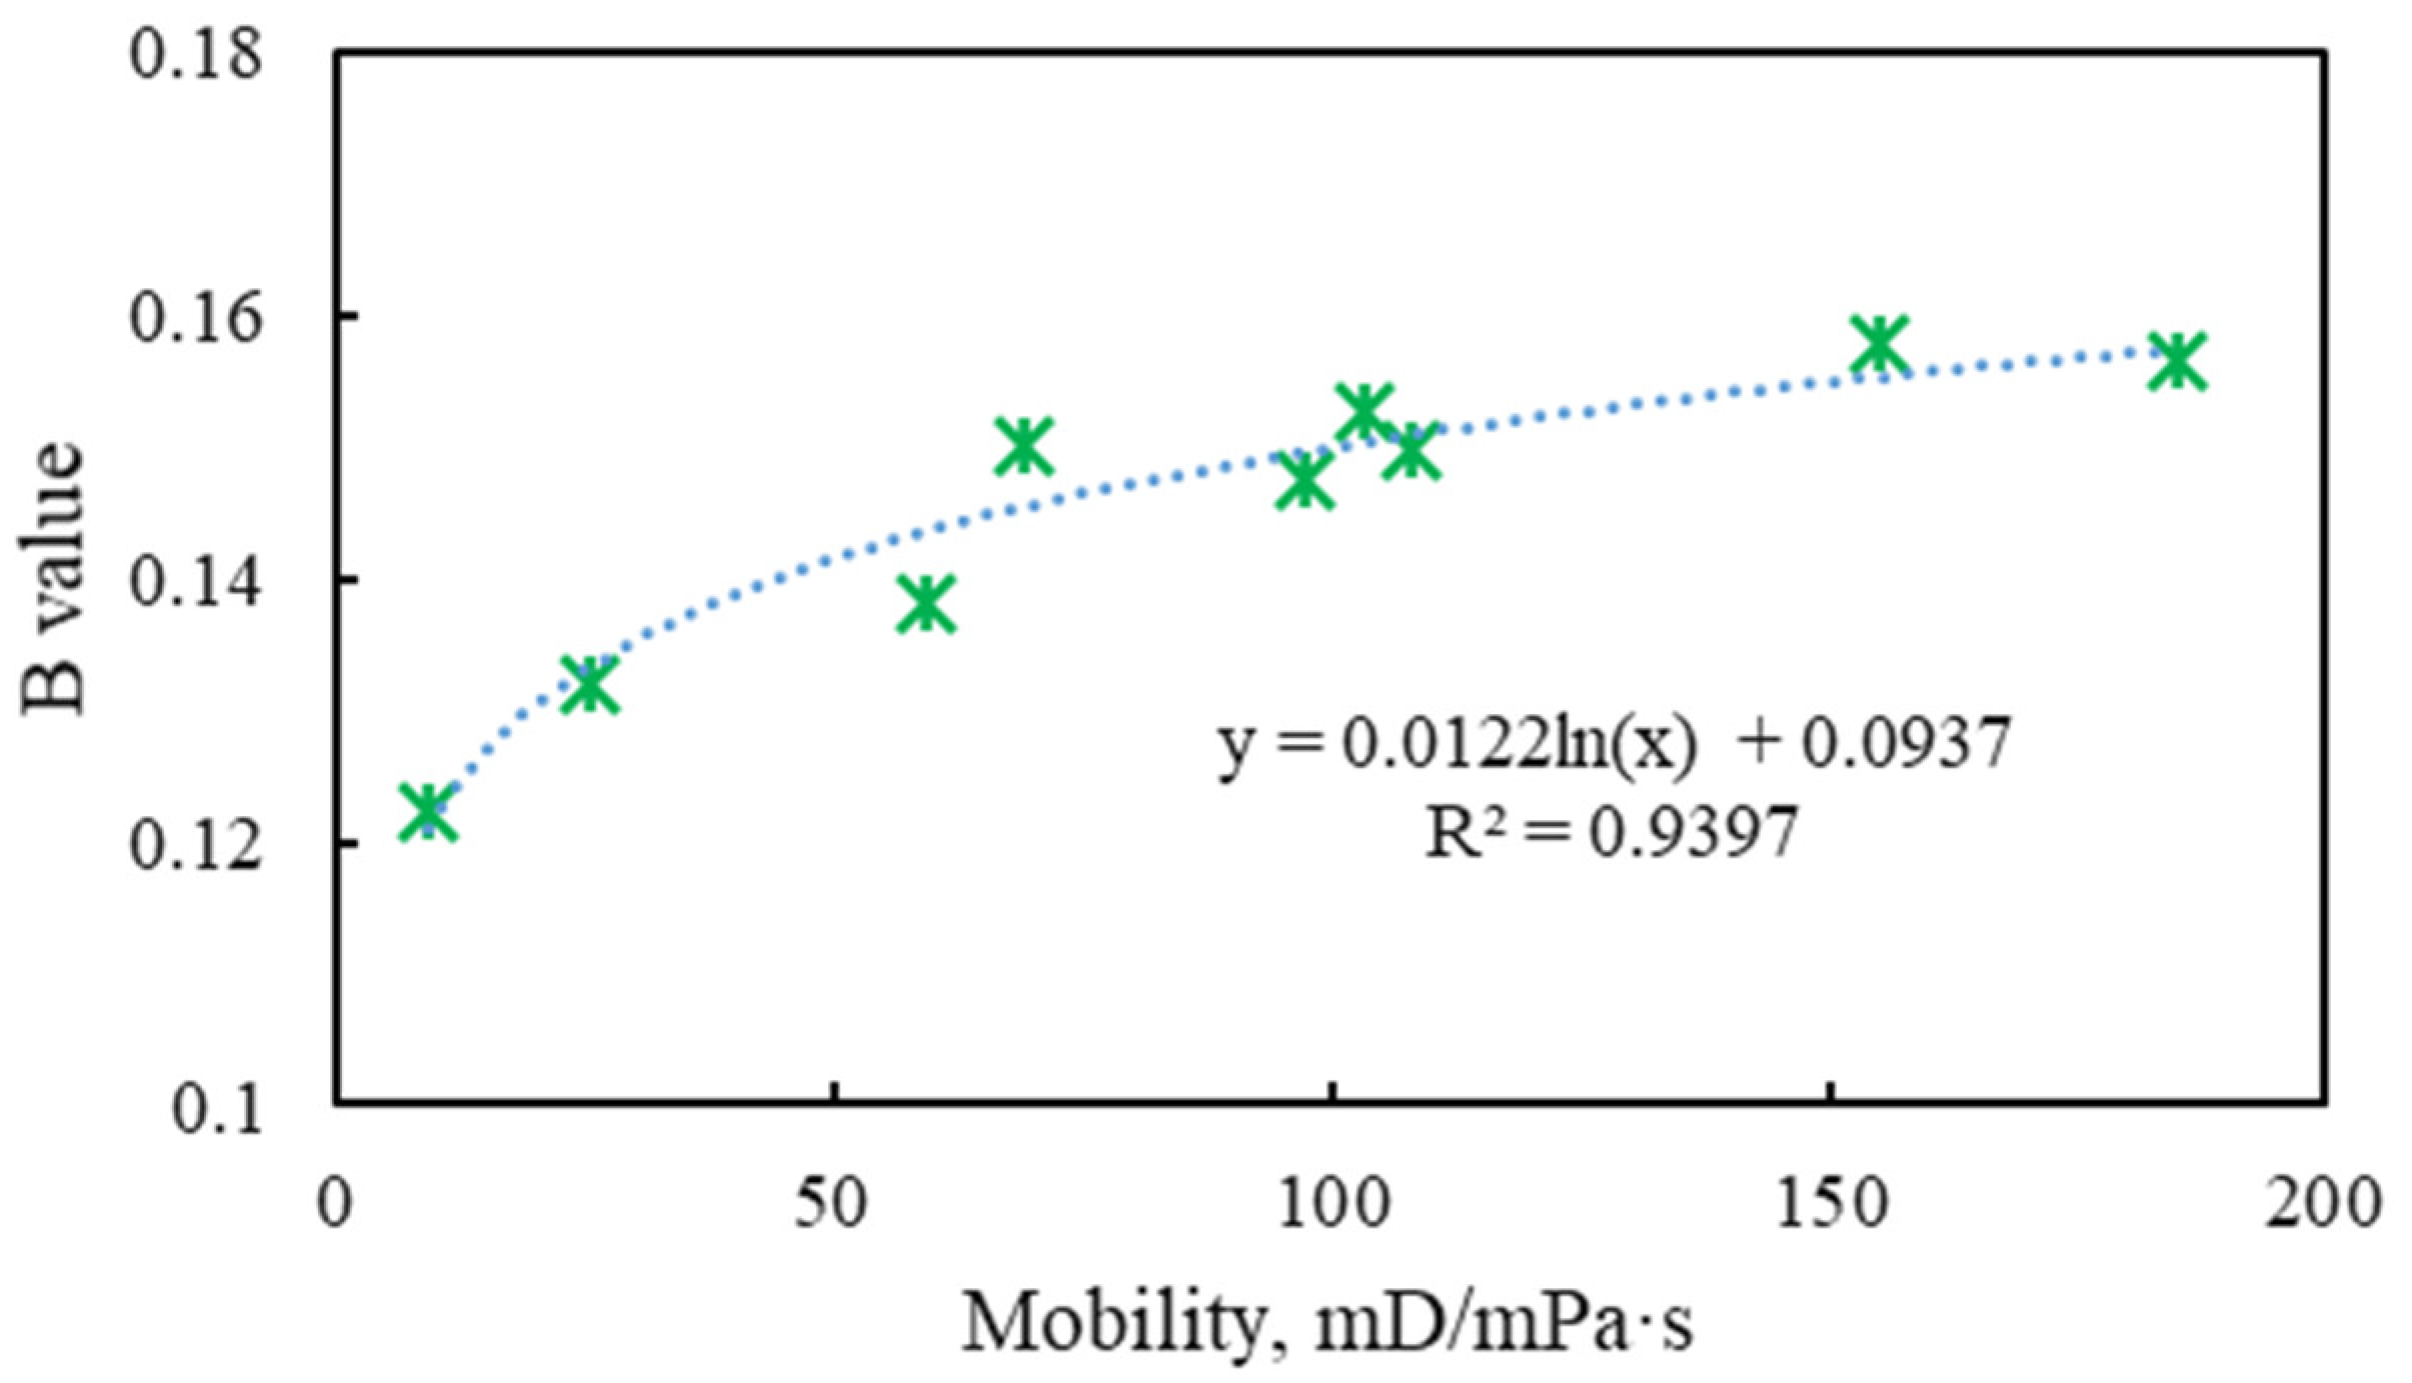
After fitting 9 groups of experimental data, the values of coefficient A and coefficient B under different permeability are obtained. The expressions of parameter A and parameter B with physical properties and mobility parameters are established (Figure 7 and Figure 8).
The empirical formula of residual oil saturation in the oil field is obtained by substituting Equations (3) and (4) into (2).
The actual core experiment and field practice show that there is an extreme value that does not change when the PV number is maximum. Therefore, it is necessary to restrict the extreme value of residual oil saturation. The residual oil saturation under 2000 PV is used as the limit residual oil saturation value.
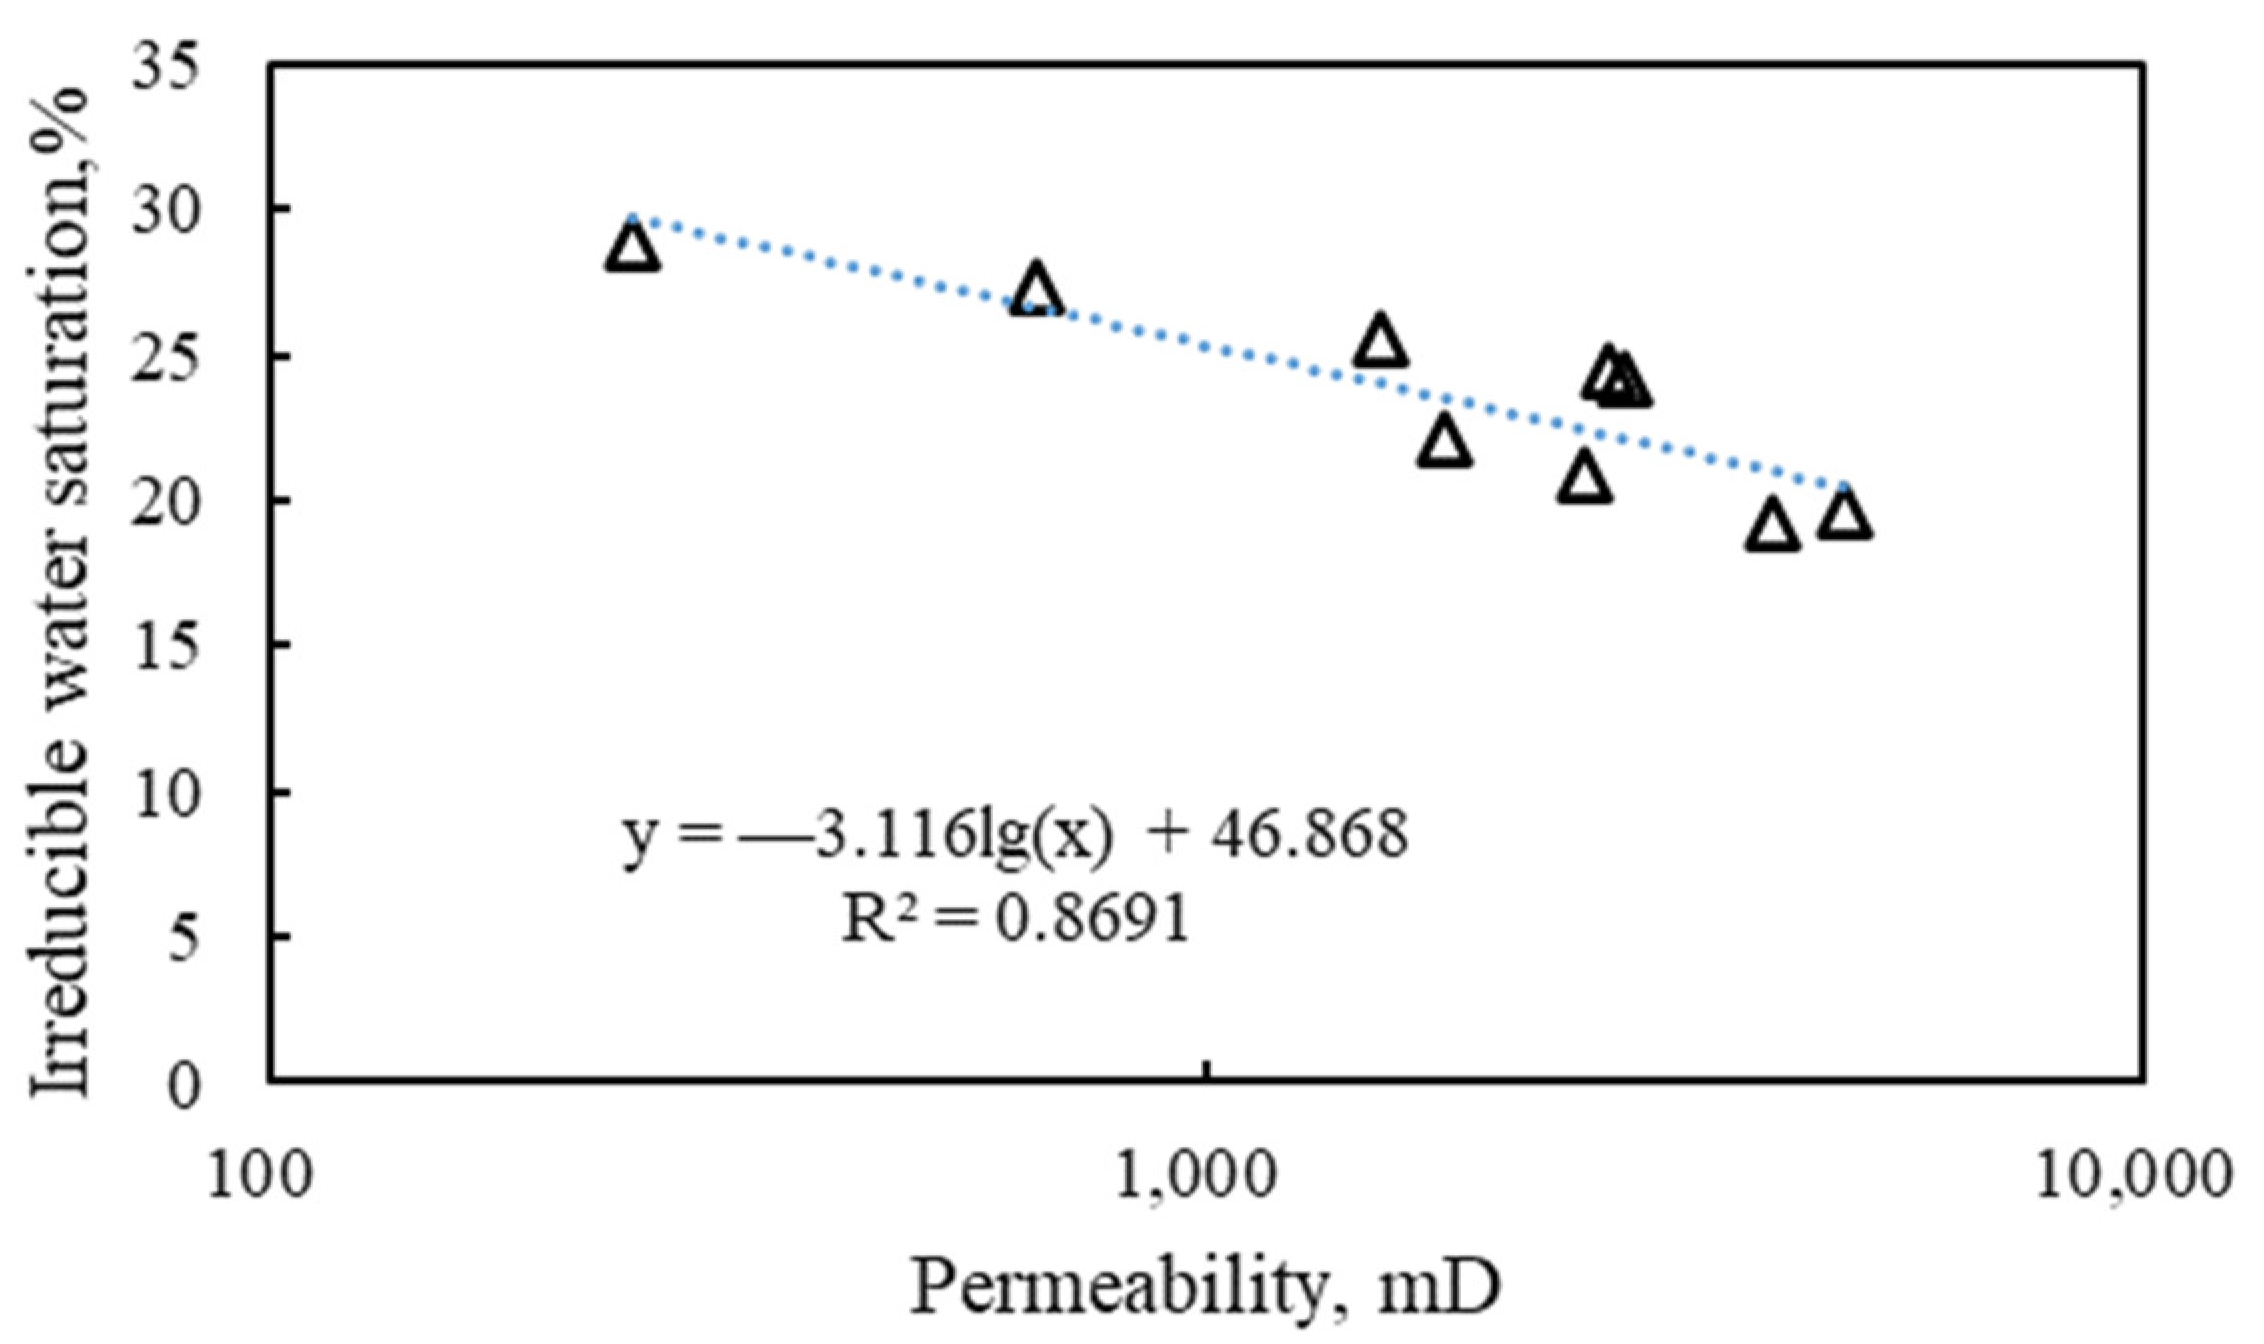
There is a correlation between irreducible water saturation and core permeability (Figure 9). According to the regression relationship of relevant experimental data in the target oil field, the calculation formula of irreducible water saturation is obtained.
The expression of ultimate residual oil saturation in the target oil field can be deduced by simultaneous Equations (1), (2), and (5).
The model was simulated with MRST, which automatically converted the water multiple, corrected the residual oil saturation endpoint, and calculated the phase permeability iteratively at each step. However, the initially written equation often cannot achieve the best fitting state, and the dynamic residual oil saturation formula needs to be modified iteratively according to the historical fitting effect.
4.2. Numerical Simulation with High Waterflooding PVs Relative Permeability
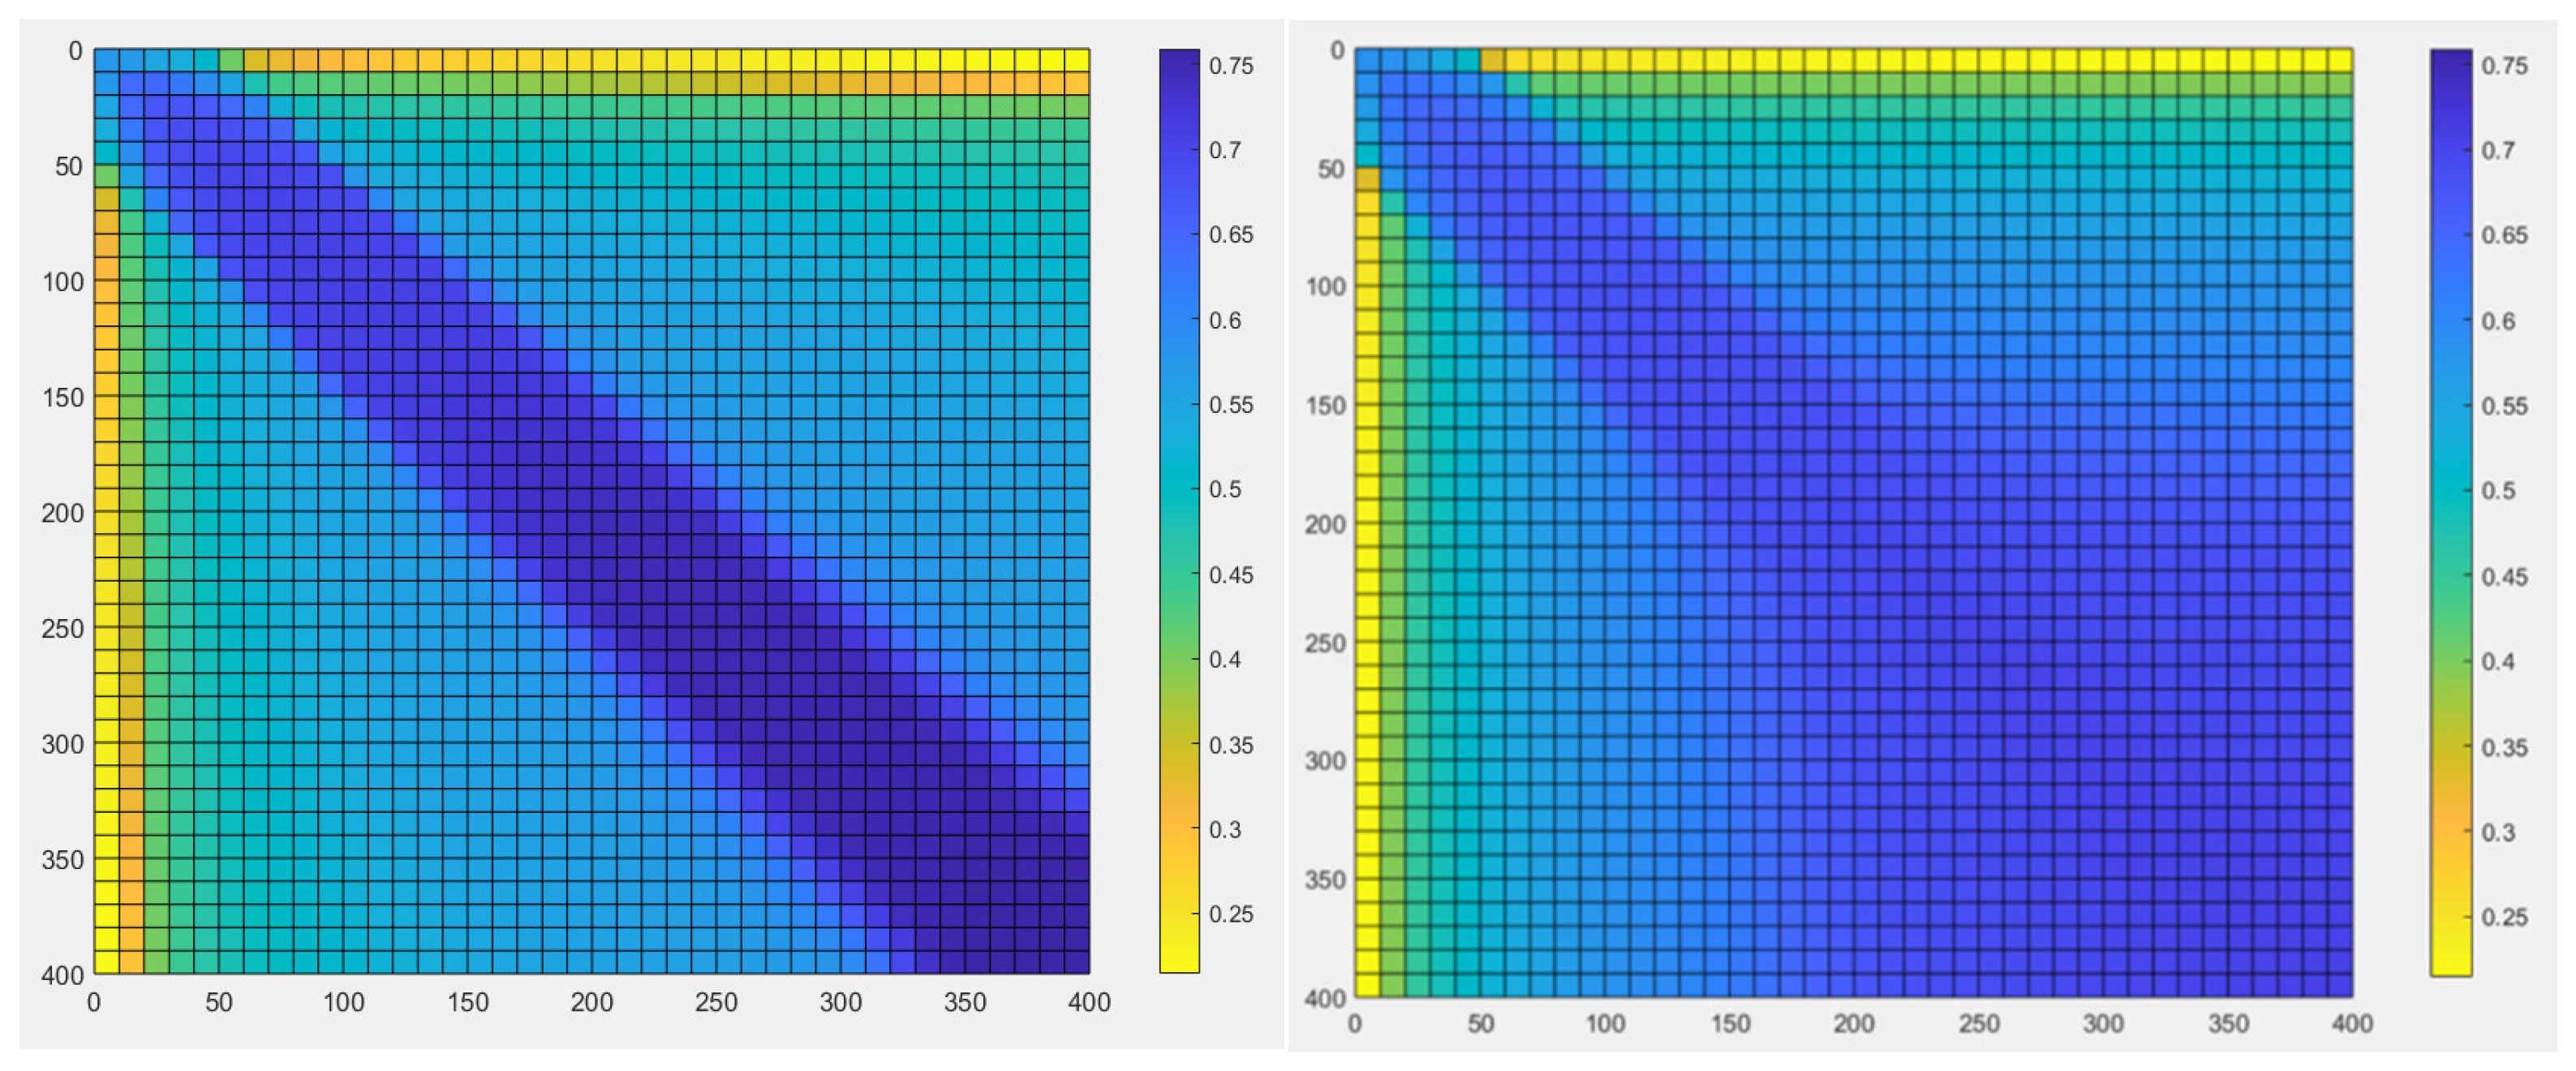
In this section, we study the effect of high waterflooding PVs’ relative permeability on remaining oil saturation. It is indicated that waterflooding is uniform, and the remaining oil is symmetrically distributed along the injection-production wells’ diagonal line in the traditional simulator. The calculation results of the numerical simulator considering the relative permeability of high waterflooding PVs show that the overall oil saturation distribution is more uneven, the water saturation of the high-permeability belt is higher, and the remaining oil saturation of the relatively low-permeability region far from the high-permeability belt is higher than the calculation results of the traditional numerical simulator (Figure 10). This means that the injected water does not flood much into the low-permeability zone of the formation but flows along the high-permeability strip to the production well. In heterogeneous reservoirs, with the continuous enhancement of waterflooding, the high permeability area receives more water and is more likely to be washed out, and the water phase mobility is stronger. The low permeability area does not suffer more erosion due to the increase in water injection, which is consistent with the results of parallel flooding experiments and large 3D physical simulations in the laboratory [31,37,40,41,42]. Thus, the injected water is more inefficient in the process of increasing waterflooding PVs and further enhances reservoir heterogeneity. Because of the above reasons, the actual reservoir sweep area is more complex, and the remaining oil distribution is far more complex than the traditional numerical simulation results.
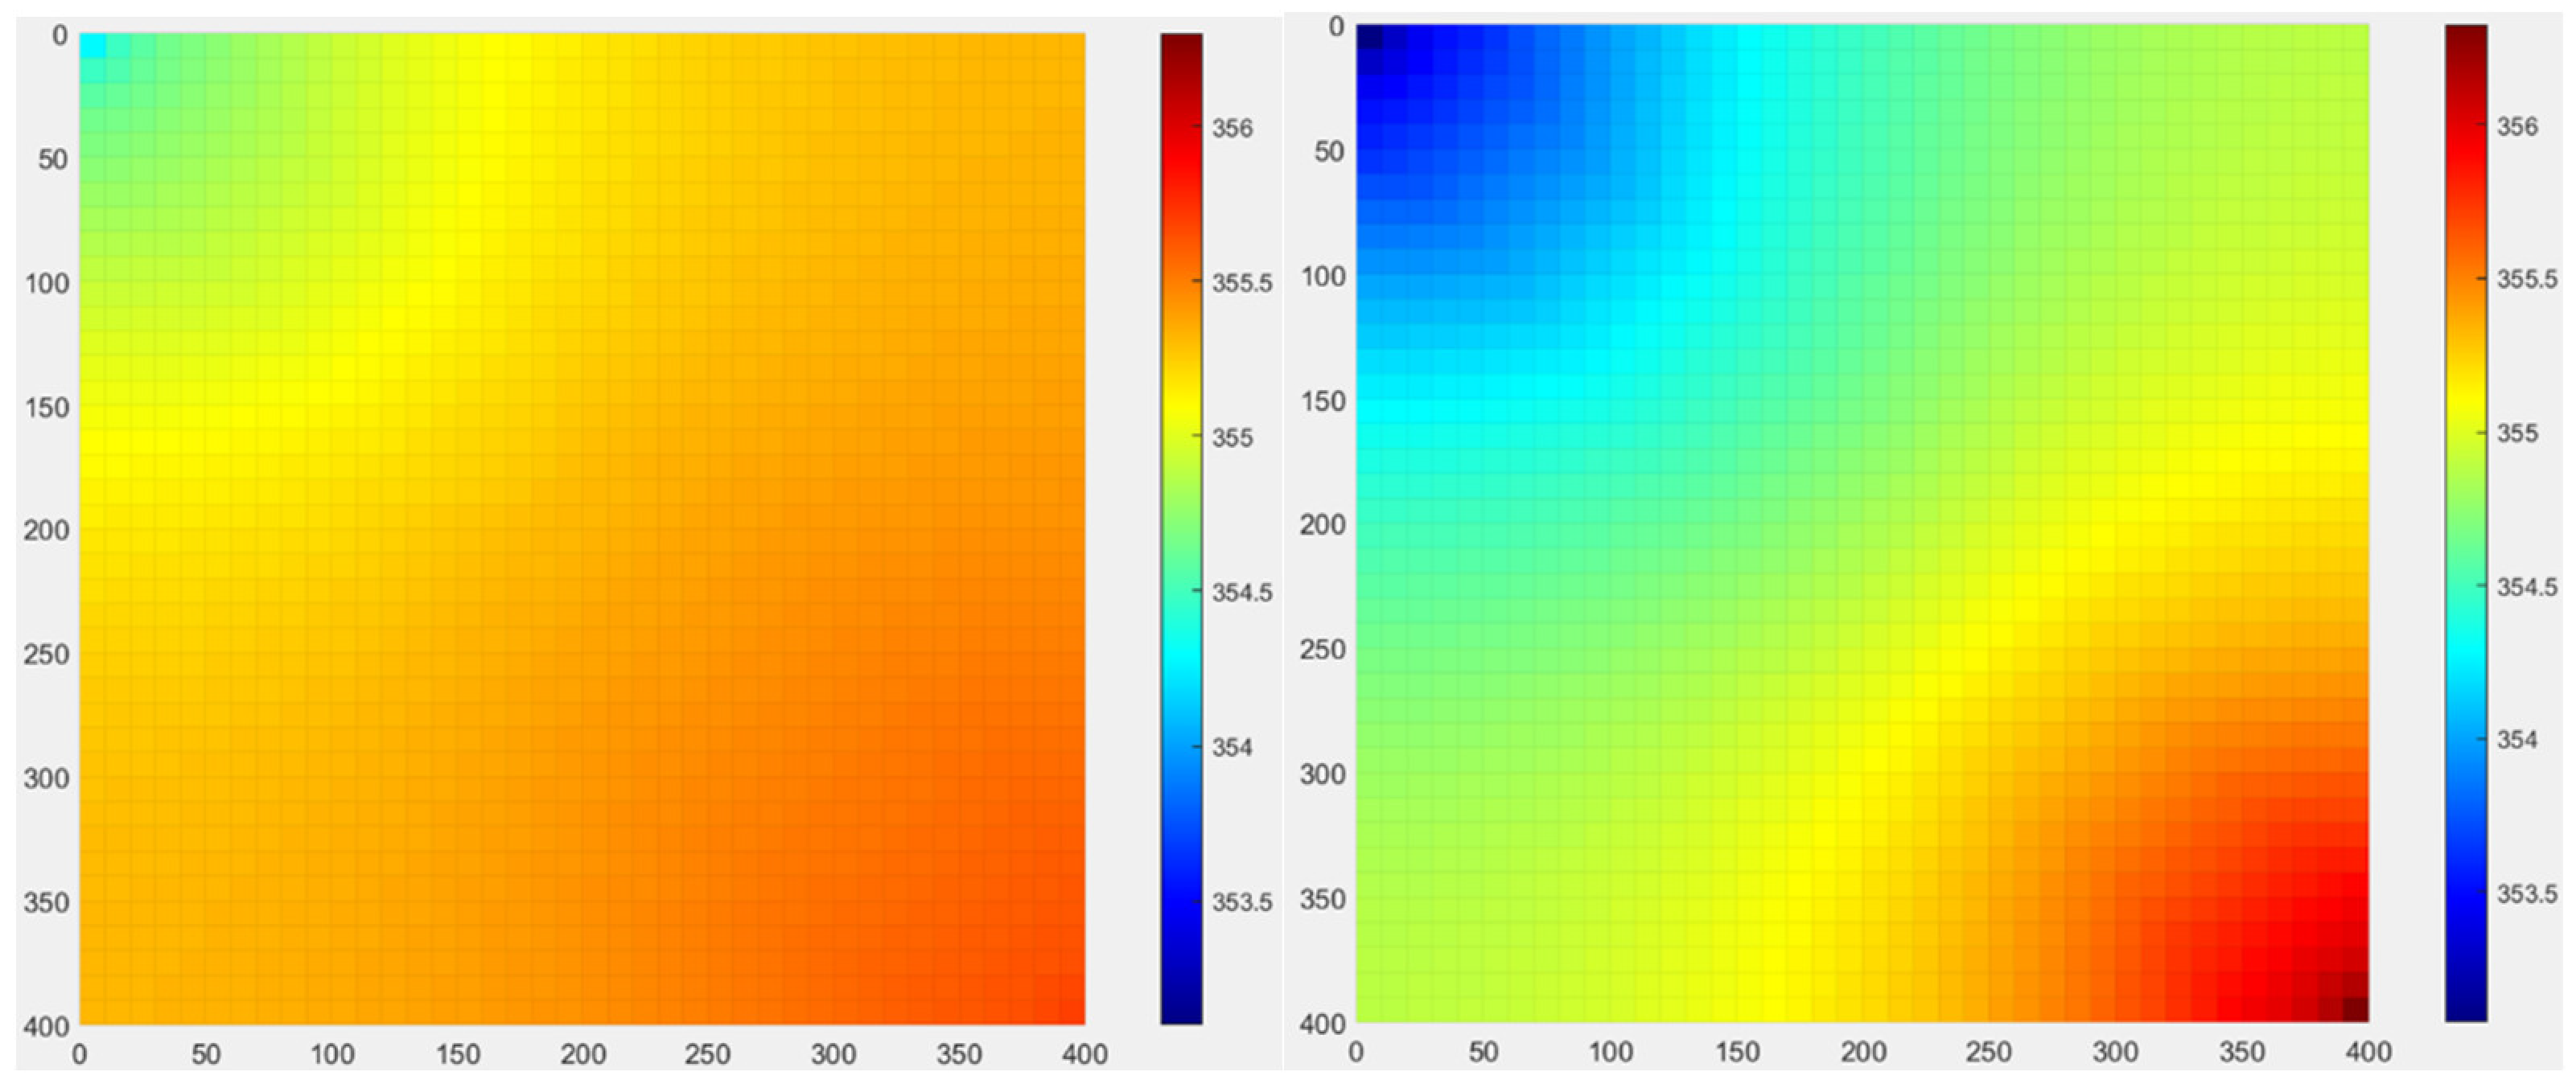
The pressure distribution calculated by the two numerical simulation methods shows that the pressure spreads uniformly from the water injection well to the production well. However, the pressure distribution of the numerical simulation considering the high waterflooding PVs’ relative permeability is more uniform, and the pressure difference between the injection well and the production well is smaller than that of the traditional numerical simulation result, indicating that the injected water can flow well to the oil production well along the high permeability channel, so the pressure propagation is more smooth. There is an obvious high-pressure area near the injection well, and an obvious low-pressure area can also be seen near the production well in the traditional numerical simulation result, indicating that the pressure propagation speed is slow (Figure 11). This is also the reason for the difference in saturation distribution.
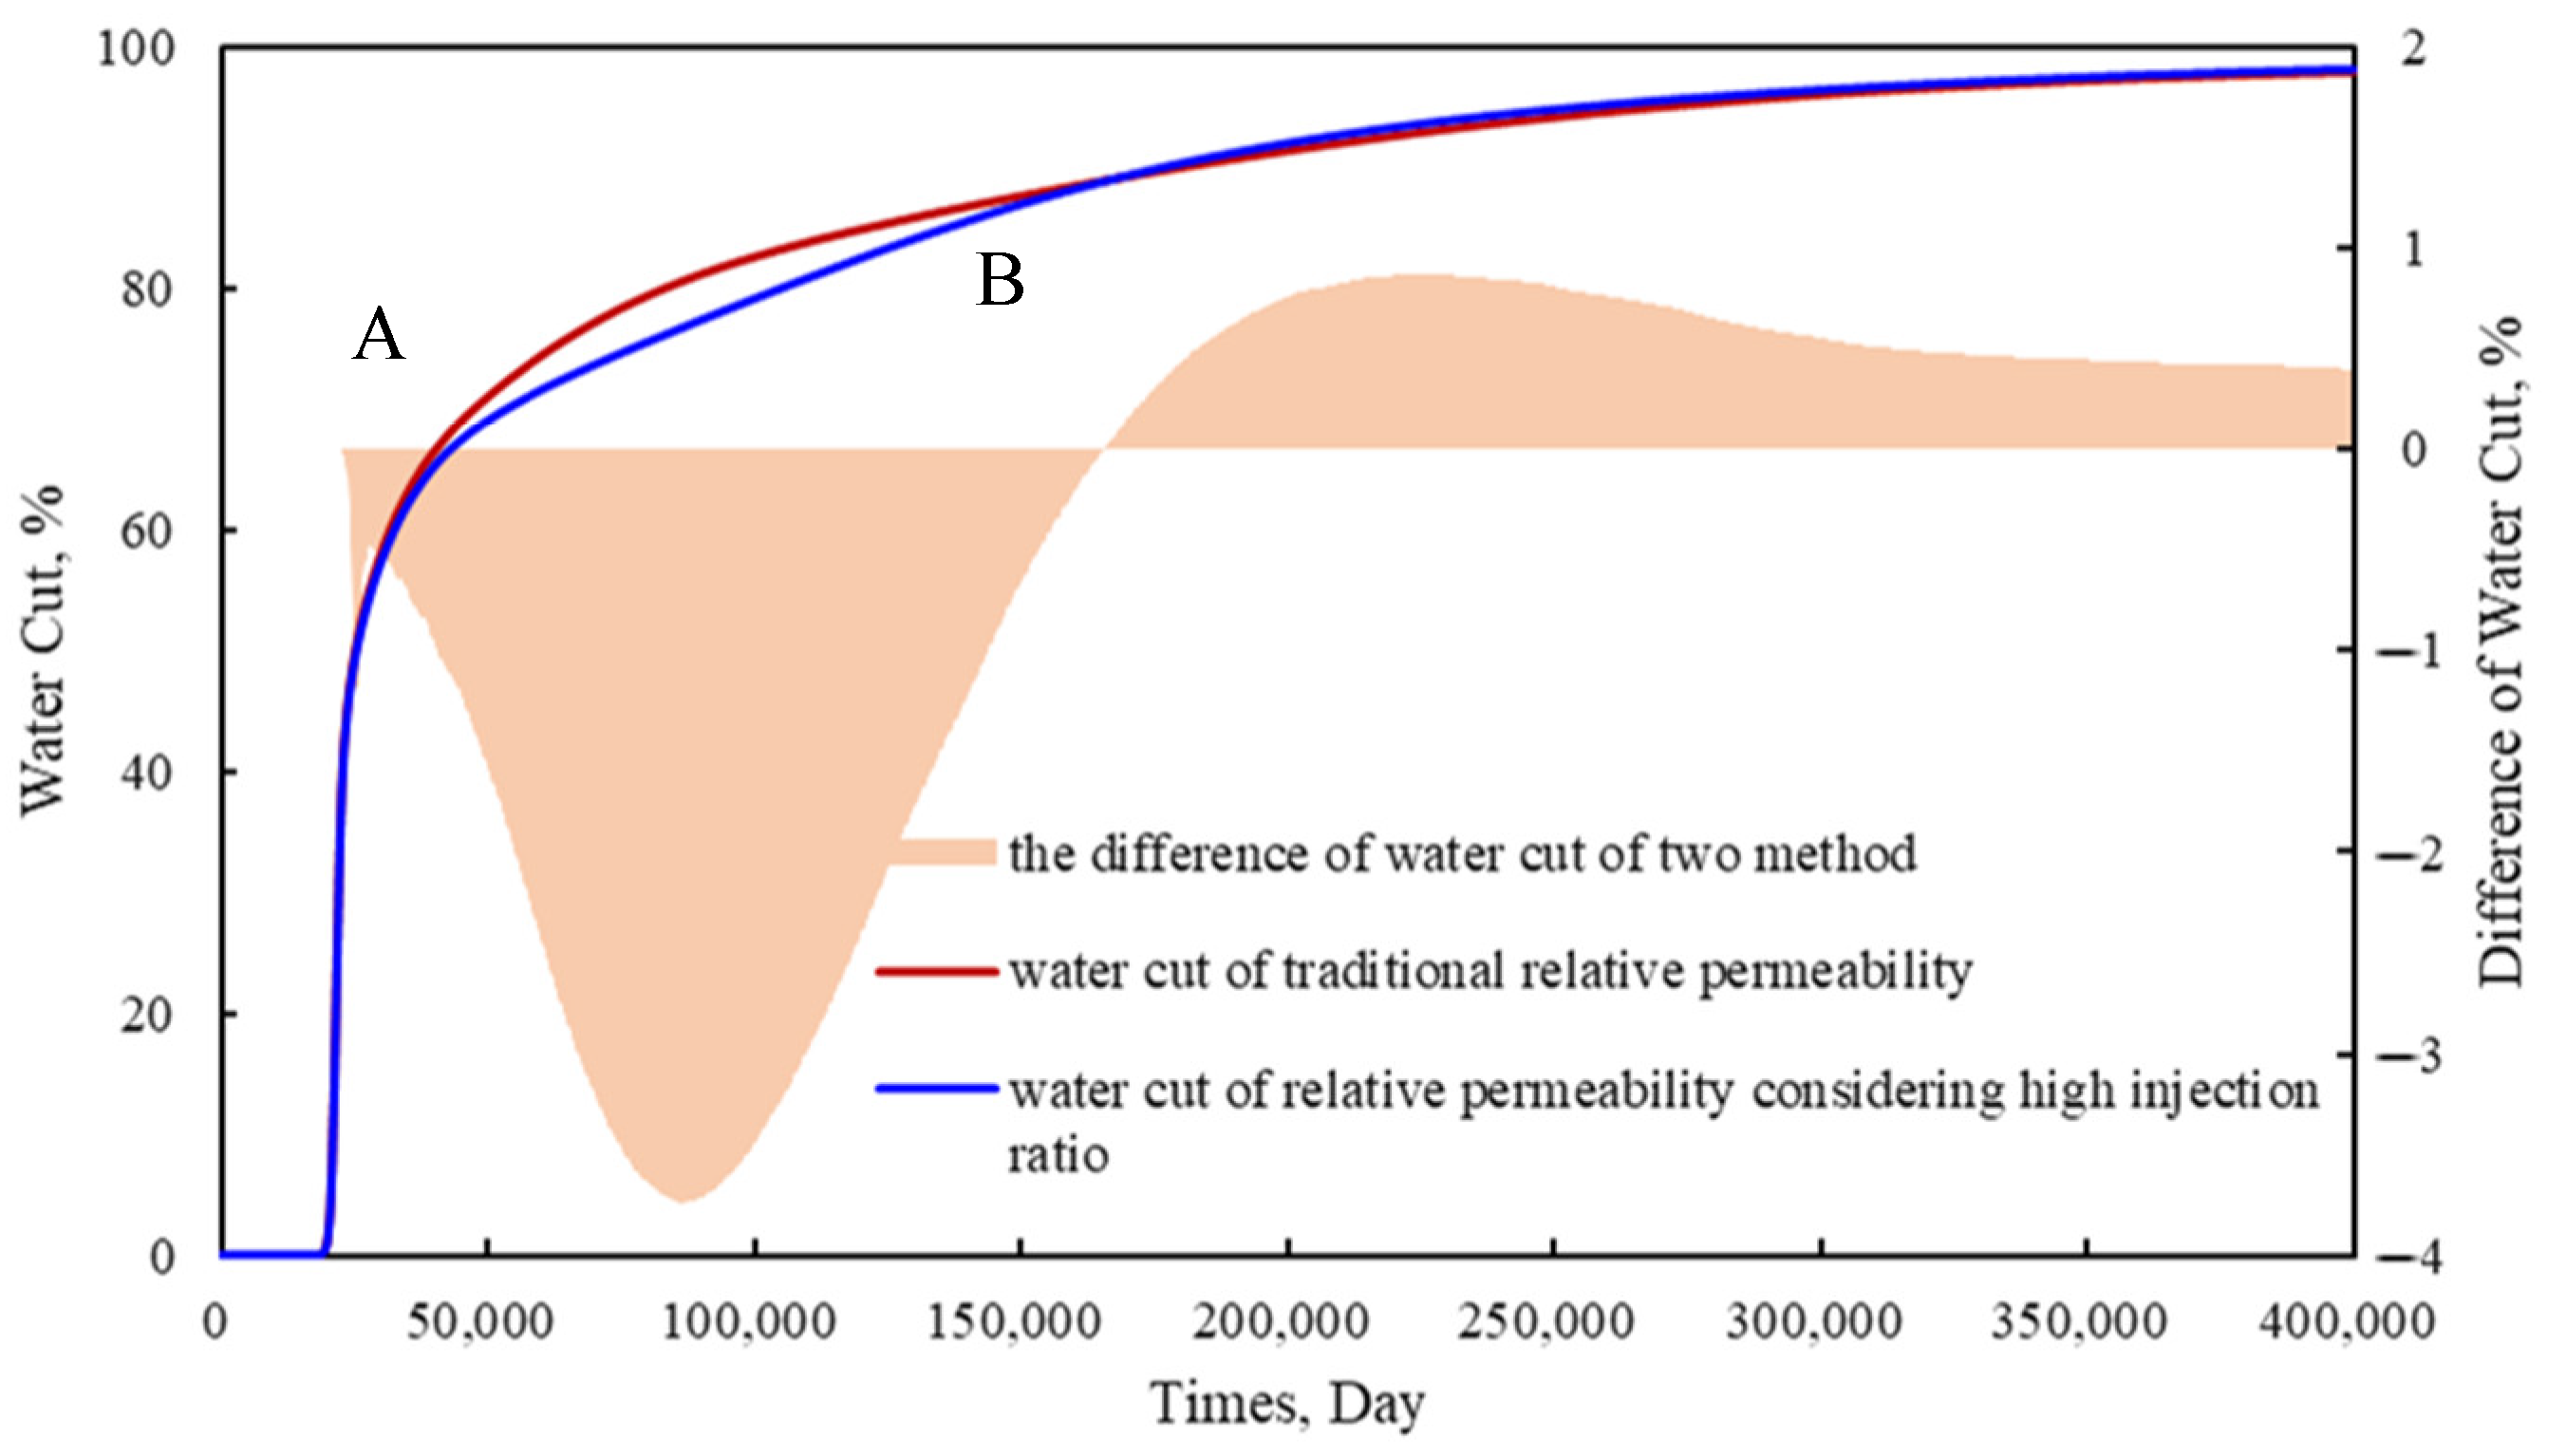
As we have seen, in the initial oil saturation condition, whether considering the high waterflooding PVs’ relative permeability or traditional relative permeability, the calculated results of both simulators are consistent. There is anhydrous oil recovery period, and the water cut rises rapidly until point A. When breakthrough occurs in the production well, the water erosion degree of the high permeability channel will be higher and higher, and far more than the low permeability zone. Therefore, after point A, due to lower residual oil saturation of high waterflooding PVs’ relative permeability, it is true that more injected water flows to production wells along the high permeability belt, and the sweeping speed of the surrounding low permeability area is slow. When considering the relative permeability of high waterflooding PVs, the water cut of the simulation result is lower than that of the traditional numerical simulation (AB section in Figure 12). As the injection multiple continues to increase, the oil displacement efficiency gradually approaches the limit oil displacement efficiency, and the water cut increases gradually, exceeding the water cut calculated by the traditional numerical simulation.
5. Simulation Validations
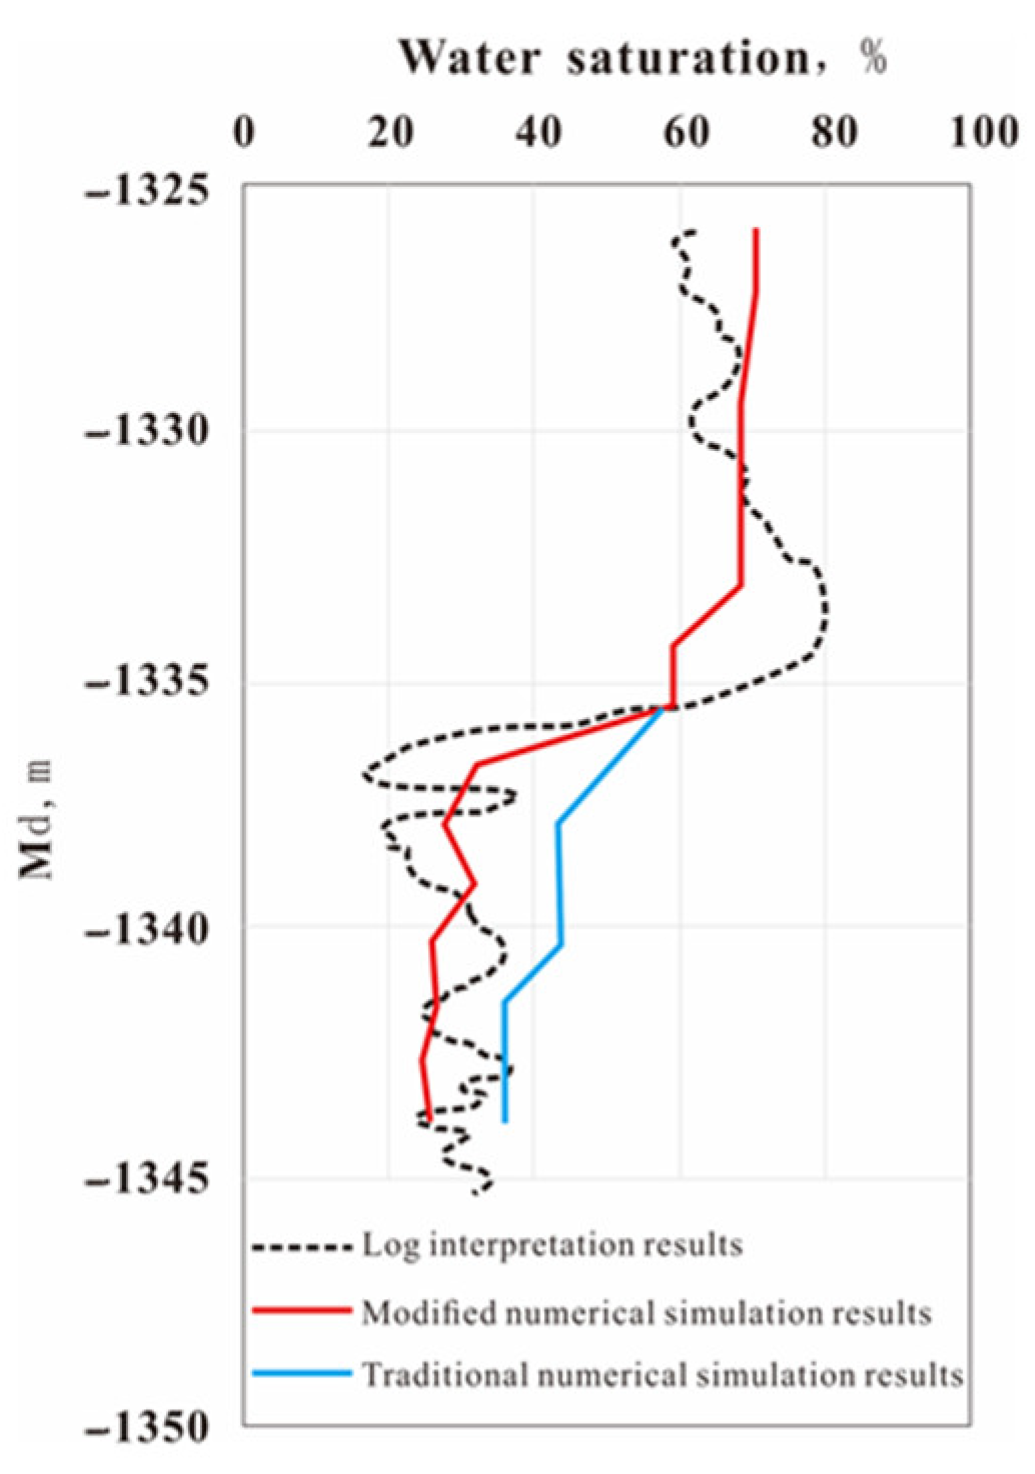
In order to verify the accuracy of the calculation results of the new numerical simulator, we compared the logging interpretation saturation of the target layer of the newly drilled passing well with that of the new numerical simulator and the traditional simulator. Taking the reservoir model of a certain area of the Q32-6 oilfield as an example, a fine numerical simulation considering high waterflooding PVs’ relative permeability was carried out under the condition of small adjustments of local permeability, conductivity, interlayer plugging performance, and other parameters. The coincidence between the oil saturation of the target layer calculated by the new numerical simulator and the logging interpretation of oil saturation is obviously higher than that calculated by the traditional numerical simulator (Figure 13). The water cut of the whole area fit well (Figure 14). Therefore, the modified simulator could provide a more accurate remaining oil saturation prediction for further developing the potential of the reservoir.
6. Conclusions
A total of nine groups of typical cores with different permeability were selected to carry out high waterflooding PVs experiments. The results show that oil displacement efficiency increases 12.9% on average after increasing water waterflooding PVs to 2000 PV, and the potential of the high waterflooding PVs stage cannot be ignored.
The expression of high waterflooding PVs’ relative permeability and dynamic displacement efficiency is obtained. The new understanding of high waterflooding PVs’ relative permeability is introduced into the numerical simulator. It is considered that in heterogeneous reservoirs, the waterflooding PVs in high permeability areas is much larger than that in low permeability areas. As a result, the oil recovery in the high permeability area and the residual saturation in the low permeability area are underestimated.
Taking the saturation of the key section of the passing well as the verification, the saturation of the passing well at the corresponding time point is in good agreement with the actual logging interpretation results, and the water cut curve fits well in the whole area.
Author Contributions
Conceptualization, S.W.; Formal analysis, J.Z.; Investigation, J.Z.; Methodology, H.H. and S.W.; Software, H.H.; Validation, E.S.; Visualization, X.Y.; Writing—original draft, G.Q.; Writing—review & editing, S.W. All authors have read and agreed to the published version of the manuscript.
Funding
This research received no external funding.
Institutional Review Board Statement
Not applicable.
Informed Consent Statement
Not applicable.
Data Availability Statement
Not applicable.
Conflicts of Interest
The authors declare no conflict of interest.
Nomenclature
| Ed | oil displacement efficiency, % |
| Sor | residual oil saturation, % |
| Swirr | irreducible water saturation, % |
| PV | pore volume, mL |
| A | coefficient |
| B | coefficient |
| K | permeability, mD |
| φ | porosity, % |
| μ | viscosity, mpa·s |
| kro | oil relative permeability, decimal |
| krw | water relative permeability, decimal |
| Sorjx | ultimate residual oil saturation, % |
Appendix A. Relative Permeability Curves of No. 1–No. 3 and No. 5–No. 9 Cores
Figure A1.
High waterflooding PVs’ relative permeability curves of other cores.

References
- You, Q.; Wang, H.; Zhang, Y.; Liu, Y.; Fang, J.; Dai, C. Experimental study on spontaneous imbibition of recycled fracturing flow-back fluid to enhance oil recovery in low permeability sandstone reservoirs. J. Pet. Sci. Eng. 2018, 166, 375–380. [Google Scholar] [CrossRef]
- You, Q.; Wen, Q.; Fang, J.; Guo, M.; Zhang, Q.; Dai, C. Experimental study on lateral flooding for enhanced oil recovery in bottom-water reservoir with high water cut. J. Pet. Sci. Eng. 2019, 174, 747–756. [Google Scholar] [CrossRef]
- Hou, X.; Wang, Y.; Yang, Q. A new calculation method for unstable state oil/water relative permeability curve. Pet. Geol. Oilfield Dev. Daqing 2008, 27, 54–56. [Google Scholar]
- Li, L.; Song, K.; Gao, L.; Wang, P. Water Flooding Behavior of High Water-Cut Oilfield. Pet. Drill. Tech. 2009, 37, 91–94. [Google Scholar]
- Shahvali, M.; Mallison, B.; Wei, K.; Gross, H. An alternative to streamlines for flow diagnostics on structured and unstructured grids. SPE J. 2012, 17, 768–778. [Google Scholar] [CrossRef]
- Chen, R. Streamline Tracing and Time of Flight Diagnostics for Waterflooding Optimization: Theory and Application. 2015. Available online: https://hdl.handle.net/1969.1/156392 (accessed on 13 October 2021).
- Møyner, O.; Krogstad, S.; Lie, K.-A. The application of flow diagnostics for reservoir management. SPE J. 2015, 20, 306–323. [Google Scholar] [CrossRef] [Green Version]
- Lie, K.A.; Møyner, O.; Krogstad, S. Application of flow diagnostics and multiscale methods for reservoir management. In Proceedings of the SPE Reservoir Simulation Symposium OnePetro, Houston, TX, USA, 23–25 February 2015. [Google Scholar]
- Zhang, Z.; Geiger, S.; Rood, M.; Jacquemyn, C.; Jackson, M.; Hampson, G.; De Carvalho, F.M.; Marques Machado Silva, C.C.; Machado Silva, J.D.; Costa Sousa, M. A tracing algorithm for flow diagnostics on fully unstructured grids with multipoint flux approximation. SPE J. 2017, 22, 1946–1962. [Google Scholar] [CrossRef]
- Zhou, F.; Liu, Z.; Zhang, C. A practical method for determining the relative permeability of oil and water by steady-state method. Pet. Geol. Eng. 2009, 23, 105–106. [Google Scholar]
- Bing, S. Study on Water Drive Development Characteristics Based on the Oil-Water Two Phase Flow of Ultra-High Water Cut Stage; Southwest Petroleum University: Chengdu, China, 2013. [Google Scholar]
- Wu, Z.; Cui, C.; Hao, Y.; Sun, Y.; Lv, G.; Sun, D.; Zhang, Z. Relative permeability model taking the roughness and actual fluid distributions into consideration for water flooding reservoirs. Arab. J. Sci. Eng. 2019, 44, 10513–10523. [Google Scholar] [CrossRef]
- Zhang, W.; Cao, R.; Luo, D.; Sun, C.; Li, W. Displacement characteristics of high-multiple water drive in marine sandstone reservoirs in the Pearl River Mouth Basin, South China Sea. Pet. Geol. Recovery Effic. 2018, 25, 64–71. [Google Scholar]
- Hu, Z.; Ma, K.; Liu, Z.; Huang, K.; Zhang, J. Research and Application of the Properties Variation Regularity of Water Injection Reservoirs in S Offshore Oilfield. Sci. Technol. Eng. 2014, 14, 164–168. [Google Scholar]
- Wang, X. Influence of Water Injection Multiple on Displacement Efficiency. Henan Sci. 2017, 35, 139–143. [Google Scholar]
- Deng, S.; Wang, N.; Meng, L.; Wu, Z.; Chen, Z. Establishment and Application of The New Two-type Water-Flooding Characteristic Curves at High Water Cut Stage. Pet. Geol. Oilfield Dev. Daqing 2017, 36, 58–63. [Google Scholar] [CrossRef]
- Ji, S.; Tian, C.; Shi, C.; Ye, J.; Zhang, Z.; Fu, X. New understanding on water-oil displacement efficiency in a high water-cut stage. Pet. Explor. Dev. 2012, 39, 362–370. [Google Scholar] [CrossRef]
- Yu, C. A New Prediction Method of Relative Permeability to Reflect Waterflooding Limitation. Spec. Oil Gas Reserv. 2014, 21, 4. [Google Scholar] [CrossRef]
- Chen, D.; Li, J.; Zhu, W.; Xin, Z. Experimental Research on Reservor Parameters Variation After Water Flooding for Offshore Unconsolidated Sandstone Heavy Oil Reservoirs. China Offshore Oil Gas 2016, 28, 54–60. [Google Scholar] [CrossRef]
- Wen, X.; Dai, Z.; Wang, H.; Zhang, X.; Li, H. Physical Properties of Marine Sandstone Reservoir after Long-Term Waterflooding. Spetial Oil Gas Reserv. 2017, 24, 157–161. [Google Scholar] [CrossRef]
- Nie, F. Comparative study on seepage characteristics of core before and after high multiple water flooding in Different facies zones of Dongpu Oilfield. Pet. Geol. Eng. 2017, 31, 87–90. [Google Scholar]
- Jiang, R.; Qiao, X.; Teng, W.; Xu, J.; Sun, Z.; Xie, L. Impact of physical properties time variation on waterflooding reservoir development. Fault-Block Oil & Gas Field 2016, 23, 768–771. [Google Scholar] [CrossRef]
- Ma, K.; Cai, H.; Sun, Z. Nuclear Magnetic Resonance-based Experiment on the Effects of Displacement Velocity and Multiple on the Pore Throat Characteristics and Recovery Factor of Unconsolidated Sandstone Reservoirs. China Offshore Oil Gas 2019, 31, 86–91. [Google Scholar] [CrossRef]
- Tao, S.; Wang, Y.; Tang, D.; Xu, H.; Lv, Y.; He, W.; Li, Y. Dynamic variation effects of coal permeability during the coalbed methane development process in the Qinshui Basin, China. Int. J. Coal Geol. 2012, 93, 16–22. [Google Scholar] [CrossRef]
- Andersen, P.Ø.; Walrond, K.; Nainggolan, C.K.; Pulido, E.Y.; Askarinezhad, R. Simulation interpretation of capillary pressure and relative permeability from laboratory waterflooding experiments in preferentially oil-wet porous media. SPE Reserv. Eval. Eng. 2020, 23, 230–246. [Google Scholar] [CrossRef]
- Dai, Z.; Jiang, J.; Li, H.; Cao, R.; Xin, J.; Luo, D. Wettability experiment of core and mico-mechanism during high-multiple water flooding in heavy oil reservoir. Sci. Technol. Eng. 2019, 33, 1671–1815. [Google Scholar]
- Fang, Y.; Li, H.; Yu, C.; Fan, S.; Hou, X. Seepage characteristics of oil-water two-phase with high injection ratio. Pet. Geol. Eng. 2019, 33, 4. [Google Scholar]
- Yu, H.; Wang, Y.; Nie, J.; Lv, C.; Cui, W.; Zhang, L. Sdudy and Application of a Correction Method for the Relative Permeability Curve of a High Water Injection Multiple. Pet. Drill. Tech. 1900, 46, 104–108. [Google Scholar] [CrossRef]
- Yu, C.; Mi, L.; Wang, C.; Zhao, Y.; Jiang, H.; Tian, Y. Percolation characteristics investigation of microscopic remaining oil in water flooding reservoir with ultra-high water cut. Fault-Block Oil Gas Field 2016, 23, 592–594. [Google Scholar] [CrossRef]
- Li, C.; Wang, S.; You, Q.; Yu, C. A New Measurement of Anisotropic Relative Permeability and Its Application in Numerical Simulation. Energies 2021, 14, 4731. [Google Scholar] [CrossRef]
- Wang, S.; Yu, C.; Sang, G.; Zhao, Q. A new numerical simulator considering the effect of enhanced liquid on relative permeability. J. Pet. Sci. Eng. 2019, 177, 282–294. [Google Scholar] [CrossRef]
- Gram, T.B.; Ditlevsen, F.P.; Mosegaard, K.; Fabricius, I.L. Water-flooding and consolidation of reservoir chalk–effect on porosity and Biot’s coefficient. Geophys. Prospect. 2021, 69, 495–513. [Google Scholar] [CrossRef]
- Cao, R.-Y.; Dai, Z.; Wang, Z.-K.; Wang, Y.-H.; Jiang, J.; Jia, Z.-H. Displacement behavior and mechanism of long-term water flooding in sandstone oil reservoirs. J. Cent. South Univ. 2021, 28, 834–847. [Google Scholar] [CrossRef]
- Zhang, W.-Q.; Wang, Y.-N.; Liu, D.-W.; Deng, Y.; Xu, J.-C.; Gu, F.; Yang, Y.; Dong, R.-J. Water Flooding Characteristics of Carbonate Reservoirs with High Permeability Layer. In Proceedings of the International Field Exploration and Development Conference, Chengdu, China, 23–25 September 2020; Springer: Berlin/Heidelberg, Germany, 2020; pp. 3168–3175. [Google Scholar] [CrossRef]
- Mohammad, R.S.; Tareen, M.Y.K.; Mengel, A.; Shah, S.A.R.; Iqbal, J. Simulation study of relative permeability and the dynamic capillarity of waterflooding in tight oil reservoirs. J. Pet. Explor. Prod. Technol. 2020, 10, 1891–1896. [Google Scholar] [CrossRef] [Green Version]
- Mahmoudzadeh, A.; Fatemi, M.; Masihi, M. Microfluidics experimental investigation of the mechanisms of enhanced oil recovery by low salinity water flooding in fractured porous media. Fuel 2022, 314, 123067. [Google Scholar] [CrossRef]
- Hu, J.; Li, A. Experimental Investigation of Factors Influencing Remaining Oil Distribution under Water Flooding in a 2-D Visualized Cross-Section Model. ACS Omega 2021, 6, 15572–15579. [Google Scholar] [CrossRef]
- Sun, P.; Xu, H.; Zhu, H.; Jia, L.; Hu, X.; Fang, H.; Jiang, H.; Xu, Z.; Jiang, T.; Jiang, X. Investigation of pore-type heterogeneity and its control on microscopic remaining oil distribution in deeply buried marine clastic reservoirs. Mar. Pet. Geol. 2021, 123, 104750. [Google Scholar] [CrossRef]
- Cheng, B.; Li, J.; Jiang, S.; Lu, C.; Su, H.; Yu, F.; Jiang, H. Pore-Scale Investigation of Microscopic Remaining Oil Variation Characteristic in Different Flow Rates Using Micro-CT. Energies 2021, 14, 3057. [Google Scholar] [CrossRef]
- Ge, L.; Meng, Z.; Zhu, Z.; Zhu, X.; Wang, Y. Three-dimensional physical simulation experiment of reasonable initial oil recovery rate for the gas/edge water reservoirs. China Offshore Oil Gas 2019, 31, 99–105. [Google Scholar] [CrossRef]
- Shi, D.; Yue, X.; Ling, S.; Dong, M.; Kong, B. Physical simulation on system of deep profile control and flooding on high water cut reservoir. J. Shenzhen Univ. Sci. Eng. 2018, 35, 179–186. [Google Scholar] [CrossRef]
- Wu, Y. Experimental Research on Interlayer Interference of Thin Iterbed Reservoirs by 3-D Physical Simulation. Res. Explor. Lab. 2017, 36, 25–29. [Google Scholar]
Figure 1.
Cores used in the experiments.

Figure 2.
Schematic representation of the experimental apparatus of the relative permeability measurement.
Figure 2.
Schematic representation of the experimental apparatus of the relative permeability measurement.

Figure 3.
Relative permeability curve of #4 (K = 1793.1 mD).

Figure 4.
Type A waterflood characteristic curve of #4.

Figure 5.
The range of oil displacement efficiency improvement in different water waterflooding PVs.
Figure 5.
The range of oil displacement efficiency improvement in different water waterflooding PVs.

Figure 6.
The relationship between the waterflooding PVs and the residual oil saturation.

Figure 7.
The relationship between the value of coefficient A and the ratio of k/φ.

Figure 8.
The relationship between the value of coefficient B and mobility.

Figure 9.
The relationship between the irreducible water saturation and permeability.

Figure 10.
The water saturation distribution at the 50th time step (The left is the numerical simulation results considering the relative permeability of high waterflooding PVs, and the right is the traditional numerical simulation results).
Figure 10.
The water saturation distribution at the 50th time step (The left is the numerical simulation results considering the relative permeability of high waterflooding PVs, and the right is the traditional numerical simulation results).

Figure 11.
The water saturation distribution at the 50th time step (the left is the numerical simulation results considering the relative permeability of high waterflooding PVs, and the right is the traditional numerical simulation results).
Figure 11.
The water saturation distribution at the 50th time step (the left is the numerical simulation results considering the relative permeability of high waterflooding PVs, and the right is the traditional numerical simulation results).

Figure 12.
The water cut curve of numerical simulation of traditional simulator and simulator that considering high water waterflooding PVs.
Figure 12.
The water cut curve of numerical simulation of traditional simulator and simulator that considering high water waterflooding PVs.

Figure 13.
The comparison between the actual logging interpretation oil saturation curve and the model oil saturation curve of a passing well.
Figure 13.
The comparison between the actual logging interpretation oil saturation curve and the model oil saturation curve of a passing well.

Figure 14.
Fitting results of water cut in the whole well area.


Table 1.
Summary of the experiment samples.
| Core No. | Core Length (cm) | Core Diameter (cm) | Porosity (f) | Permeability (md) | Irreducible Water Saturation (%) | Residual Oil Saturation (%) |
|---|---|---|---|---|---|---|
| 1 | 5.96 | 2.502 | 37.5 | 244.4 | 28.8 | 25.99 |
| 2 | 5.88 | 2.51 | 37 | 659.4 | 27.3 | 24.72 |
| 3 | 6.04 | 2.498 | 37.3 | 1536.6 | 25.6 | 23.21 |
| 4 | 6.33 | 2.5 | 38.9 | 1793.1 | 22.1 | 24.79 |
| 5 | 6.24 | 2.496 | 38.3 | 2531.1 | 20.9 | 21.99 |
| 6 | 5.97 | 2.492 | 38 | 2681.3 | 24.4 | 18.37 |
| 7 | 6.25 | 2.506 | 39.5 | 2811.5 | 24.2 | 18.87 |
| 8 | 5.76 | 2.504 | 41.1 | 4035.3 | 19.3 | 20.26 |
| 9 | 6.14 | 2.497 | 38.7 | 4814.8 | 19.6 | 18.89 |
Table 2.
Simulation model parameters.
| Grid node | 40 × 40 × 1 | Dx (m) | 10 |
| Dy (m) | 10 | Dz (m) | 10 |
| Top deep (m) | 1000 | Initial water saturation (f) | 0.205 |
| Porosity (f) | 0.35 | Permeability (10−3 μm2) | 300/3000 (high permeability band) |
| Water viscosity (mPa·s) | 1 | Oil viscosity (mPa·s) | 28 |
| Exploit scheme | Water flooding | Well pattern | One injection well and one production well |
Publisher’s Note: MDPI stays neutral with regard to jurisdictional claims in published maps and institutional affiliations. |
© 2022 by the authors. Licensee MDPI, Basel, Switzerland. This article is an open access article distributed under the terms and conditions of the Creative Commons Attribution (CC BY) license (https://creativecommons.org/licenses/by/4.0/).
Share and Cite
MDPI and ACS Style
Qi, G.; Zhao, J.; He, H.; Sun, E.; Yuan, X.; Wang, S. A New Relative Permeability Characterization Method Considering High Waterflooding Pore Volume. Energies 2022, 15, 3868. https://0-doi-org.brum.beds.ac.uk/10.3390/en15113868
AMA Style
Qi G, Zhao J, He H, Sun E, Yuan X, Wang S. A New Relative Permeability Characterization Method Considering High Waterflooding Pore Volume. Energies. 2022; 15(11):3868. https://0-doi-org.brum.beds.ac.uk/10.3390/en15113868
Chicago/Turabian StyleQi, Guangfeng, Jingang Zhao, Hu He, Encheng Sun, Xin Yuan, and Shuoliang Wang. 2022. "A New Relative Permeability Characterization Method Considering High Waterflooding Pore Volume" Energies 15, no. 11: 3868. https://0-doi-org.brum.beds.ac.uk/10.3390/en15113868
Note that from the first issue of 2016, this journal uses article numbers instead of page numbers. See further details here.