Article

Evaluation of Power Generation Efficiency of Cascade Hydropower Plants: A Case Study

State Key Laboratory of Hydroscience and Engineering, Tsinghua University, Beijing 100084, China
*
Author to whom correspondence should be addressed.
Energies 2013, 6(2), 1165-1177; https://0-doi-org.brum.beds.ac.uk/10.3390/en6021165
Submission received: 26 November 2012 / Revised: 30 January 2013 / Accepted: 6 February 2013 / Published: 22 February 2013

Abstract

:
Effective utilization of scarce water resources has presented a significant challenge to respond to the needs created by rapid economic growth in China. In this study, the efficiency of the joint operation of the Three Gorges and Gezhouba cascade hydropower plants in terms of power generation was evaluated on the basis of a precise simulation-optimization technique. The joint operation conditions of the Three Gorges and Gezhouba hydropower plants between 2004 and 2010 were utilized in this research in order to investigate the major factors that could affect power output of the cascade complex. The results showed that the current power output of the Three Gorges and Gezhouba cascade complex had already reached around 90% of the maximum theoretical value. Compared to other influencing factors evaluated in this study, the accuracy of hydrological forecasts and flood control levels can have significant impact on the power generating efficiency, whereas the navigation has a minor influence. This research provides a solid quantitative-based methodology to assess the operation efficiency of cascade hydropower plants, and more importantly, proposes potential methods that could improve the operation efficiency of cascade hydropower plants.

Graphical Abstract

1. Introduction

Reservoir operation is one of the most complicated issues in water resource management as many reservoirs have multiple functions such as flood control, power generation, navigation, water supply, sediment control, recreation, etc [1,2]. Various reservoir operation models have been proposed such as the long-term and short-term optimization models [3,4]. However, very few of these models have built-in functions for conducting post-evaluation based on actual operation data.
Indeed, evaluation of the benefits of the joint operation of cascade hydropower plants is a challenge due to its complex nature. For instance, there are potentially conflicting interests during the reservoir joint operation such as structural safety, flood control, water supply, recreation, and ecology [5].
There have been some studies that focus on the optimization of the joint operation in the Three Gorges and Gezhouba cascade complex [6]. However, there is general lack of systematic post-evaluation and integrated assessment data.
Cao and Cai [7] proposed a method to simulate and optimize the power generation process as per actual inflow, in which constraints in operation rules were decided through the establishment of a cascade operation model. The theoretical maximum power output and the actual power output were established under conditions similar to the actual operation conditions. This method provides an approach to assess actual operation efficiency which reflects the variation between actual operation and theoretical optimum operation. However this model did not consider the impact of uncertain factors such as hydrographical conditions.
A new concept, “Potential Hydropower Output” is proposed in this study to address the methodological issues associated with the prior studies on joint operation of cascade hydropower complexes. Potential Hydropower Output is defined as the difference between the maximum power output from simulation and the actual power output during the same period. The first hand operation data of the Three Gorges and Gezhouba cascade complex were utilized for testing the proposed evaluation methodology. Studying the Three Gorges and the Gezhouba cascade complex as one of the largest cascade hydropower complexes is of a great value to the research in reservoir operation as it plays a prominent role in the Yangtze River Basin and surrounding economic zones. The findings provide a useful reference to the operation management of large scale river basins.

2. The Three Gorges and Gezhouba Cascade Complex

The Three Gorges and Gezhouba Cascade Complex is the first cascade hydropower complex on the mainstream of the Yangtze River [8]. The location of the complex is shown in Figure 1. The Yangtze River is the longest river in Asia and the third longest in the world, with a total length of more than 6,300 km. It contains a massive hydropower potential, of which 53.4% can be developed. The Three Gorges cascade hydropower complex, which consists of the Three Gorges Hydropower Plant and the Gezhouba Hydropower Plant, is located near Yichang City in Hubei Province. The total installed capacity of the complex is 25,215 MW, with an average annual output of around 103.9 TWh.
The Three Gorges Hydropower Plant (TGHP) consists of 32 generating units, each with a capacity of 700 MW. In addition, two 50 MW units are installed in the power station as dedicated power supply for the plant. The total installed capacity of these generating units adds up to 22,500 MW. As a result, TGHP is capable of producing an annual average output of 88.2 TWh; making it the largest hydropower plant in the world. The total reservoir storage and flood storage of the Three Gorges reservoir are 39.3 billion m3 and 22.15 billion m3, respectively. The regulation storage is 16.5 billion m3 with seasonal regulation adjustments.
Figure 1. Location of the Three Gorges and Gezhouba Cascade Complex, adapted from [8].
Energies 06 01165 g001
The Gezhouba hydropower complex, located downstream of TGHP, acts as the counter regulation reservoir for the Three Gorges hydropower complex. A natural hydraulic connection exists between the Three Gorges and the Gezhouba cascade reservoirs. The Gezhouba hydropower plant is located 38 km downstream at the lower end of the TGHP in the suburbs of Yichang City. The hydropower plant has 21 generating units installed in the power plants on both right bank and left bank, with a total installed capacity of 2,715 MW and an annual output of 15.7 TWh. The main functions of the cascade complex are flood control, power generation and navigation improvement. Major parameters of the cascade complex are shown in Table 1.
Table 1. List of the characteristic parameters of the Three Gorges Cascade Complex.
ParameterUnitTGPGezhouba
Total storagebillion m339.31.58
Flood control storagebillion m322.15-
Crest levelm18570
Normal pool level (NPL)m17566
Flood control level (FCL)m145.0-
Installed capacityMW22,5002,715
Annual outputTWh88.215.7
Reservoir regulation-SeasonalDaily

3. Methodology for the Evaluation of Power Generation Benefits

The objective of optimizing the joint operation of the Three Gorges and Gezhouba cascade hydropower plants is to maximize power generation benefits. Therefore, it is imperative to undertake post-evaluation which is essentially a process of summarizing, analyzing and assessing operation efficiency when actual operation rules have been executed so that operation outcomes become available. Post-evaluation has two main aims, i.e.: (1) to explore the potential increase of power output by comparing the actual joint operation and theoretical optimization operation; (2) to model effects of major influencing factors during the optimization process. Accordingly, post evaluation can be divided into two components, i.e., integrated evaluation and sensitivity analysis.
As the factors affecting power generation benefits can be expressed as boundary constraints of joint operation models, sensitivity analysis of influencing factors will be conducted by introducing variations to the corresponding boundary constraints [9].

3.1. Integrated Evaluation Model

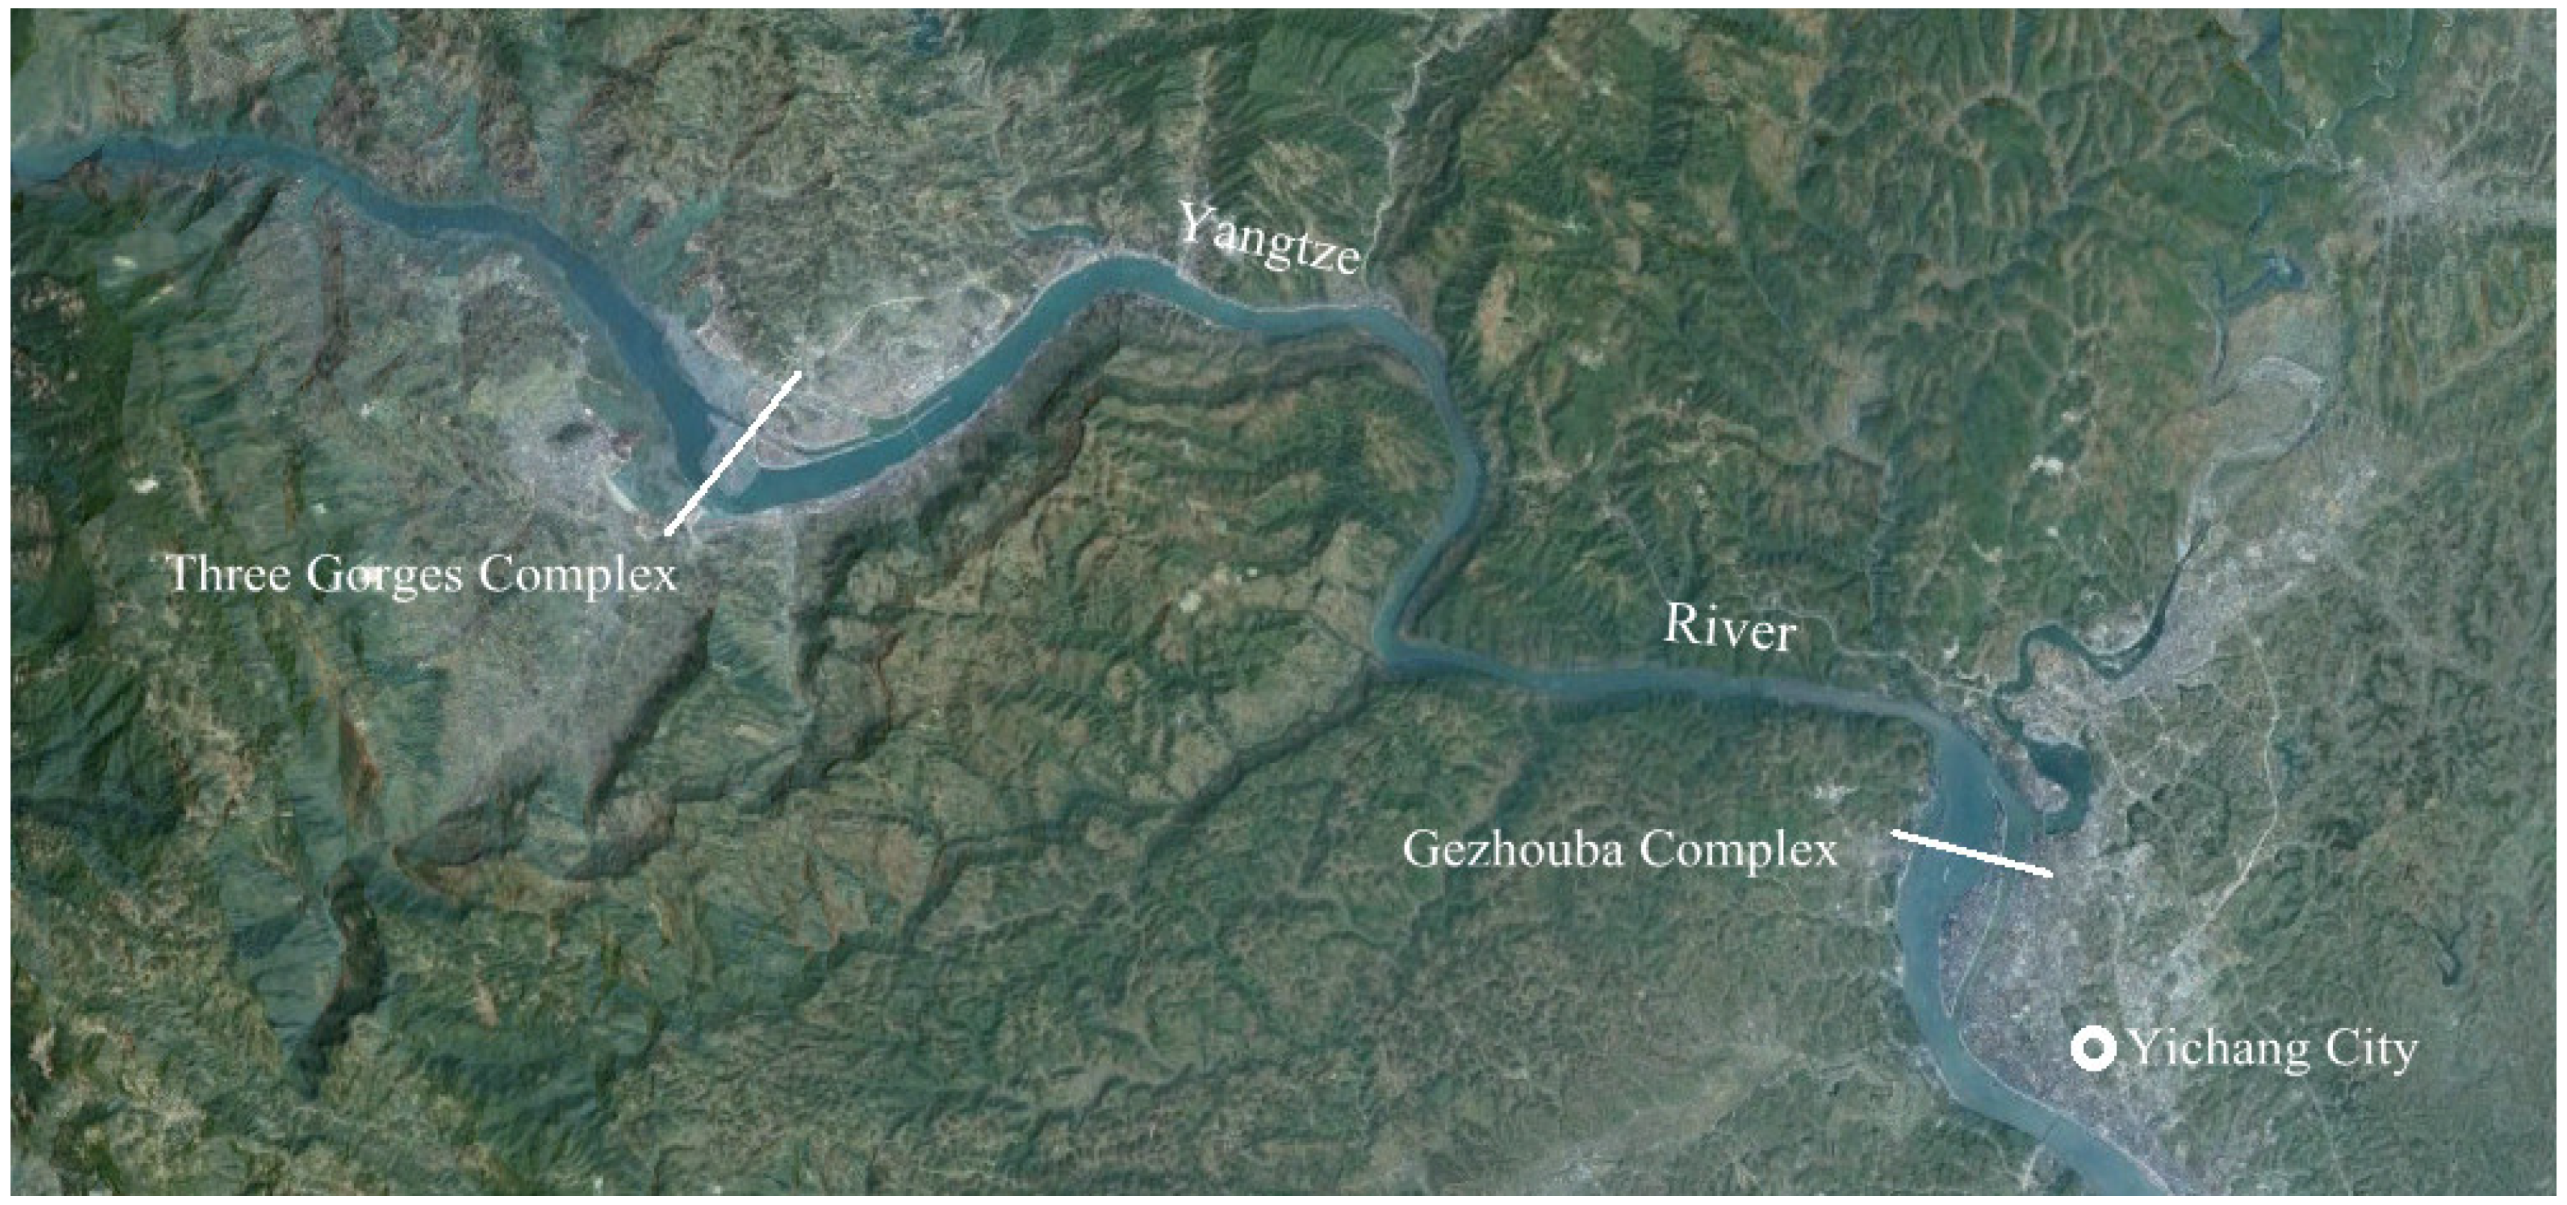
The aim of the integrated evaluation of the joint operation of the Three Gorges and Gezhouba Cascade hydropower plants is to calculate the potential power generation benefits under certain conditions.

3.1.1. Potential Hydropower Output

Potential Hydropower Output is defined as the difference between actual power output and theoretical power output. All hydropower plants are under conditions such that they satisfy the required water demand and initial power demand [10]. Therefore, the evaluation objective is to obtain the difference between the maximum power output from the cascade hydropower complex and actual power output during the same period. The objective function can be described as below:
E p = Max   E E a = t = 1 T P t · Δ t E a , P t = i = 1 N 9.81 · η i , t · Q i , t · H i , t
where T is time horizon; N is the total number of hydropower plants in the cascade plants; i is index for the number of plants; Δ t is time interval (hours); t is the index for the current period; P t is power output during the tth period (kW); η i , t is the hydropower generation efficiency of the ith plant during the tth period; Q i , t is the discharge through the plant turbines of the ith plant during the tth period (m3/s); H i , t is the difference between reservoir water level and tail-race water level for the ith plant during the tth period (m); E is sum of the hydropower generation of the cascade plants (kWh); E a is the actual hydropower output of the cascade plants during the entire period (kWh); E p is the potential hydropower output of cascade plants during the entire period (kWh).

3.1.2. Potential Increasing Percentage of Power Output

A relative index is proposed, which is the potential increasing percentage of power output with the definition given below:
δ = E p / E a
where δ is potential increasing percentage of power output.
This is subject to a number of constraints such as water balance equation, reservoir water level limits, comprehensive utilization of water required at downstream reservoir limits, power generation limits, and boundary conditions limits [7]. Apart from these constraints, we considered the navigation water level limits as one of constraints as well, due to the fact that navigation is one of critical functions provided by cascade hydropower complex [11].
(1) Water balance equation:
V i , t = V i , t 1 + ( I i , t Q i , t EP i , t ) · Δ t
where V i , t is the storage of the reservoir of the ith hydropower plant in the tth period, m3; I i , t is the inflow of the reservoir of the ith hydropower plant in the tth period, m3/s; Q i , t is the average outflow of the reservoir of the ith hydropower plant in the tth period, m3/s; EP i , t is the sum of evaporation and leakage of the reservoir of the ith hydropower plant in the tth period, m3/s.
(2) Reservoir water level limits:
ZL i , t Z i , t ZU i , t
where Z i , t is the water level of the reservoir of the ith hydropower plant in the tth period, m; ZL i , t is the minimum water level of the reservoir of the ith hydropower plant in the tth period, m; ZU i , t is the maximum water level of the reservoir of the ith hydropower plant in the tth period, m.
(3) Comprehensive utilization of water required at downstream reservoir limits:
QL i , t Q i , t QU i , t
where QL i , t is the minimum discharge capacity of the ith hydropower plant for downstream ecological requirements in the tth period, m3/s; QU i , t is the maximum discharge capacity of the ith hydropower plant in the tth period restricted by the downstream flood control limitations, m3/s.
(4) Power generation limits:
{ N i , t NX i , t P L i , t N i , t PU i , t
where N i , t is the output of the ith hydropower plant in the tth period, kW; NX i , t is the installed capacity of the ith hydropower plant in the tth period exclude the units ruined, kW; PL i , t is the firm capacity of the ith hydropower plant in the tth period, kW; PU i , t is the maximum power capacity limit of the ith hydropower plant in the tth period, kW.
(5) Navigation water level limits:
DL i , t D i , t
where D i , t is the water level of the ith hydropower plant during the tth period at the downstream from a particular point, m; DL i , t is the minimum water level limitation for navigation of the ith hydropower plant during the tth period at the downstream from a particular point, m.
(6) Boundary conditions limit:
Z i , 1 = Z i , b , Z i , T + 1 = Z i , e
where Z i , b is the water level of the reservoir of the ith hydropower plant at the first period, m; Z i , e is the water level of the reservoir of the ith hydropower plant at the last time step, m.
The optimization of the joint operation of the cascade complex features multiple dimensions and multiple stages. To deal with multi-dimensional dynamic programming, some algorithms are available such as Discrete Differential Dynamic Programming, Successive Approximation Approach, Genetic Algorithm, and Progressive Optimality Algorithm (POA) [12]. The simplex method is one of the best known algorithms for multi-dimensional constrained optimization [13,14]. Dividing a multi-stage problem into several two-stage problems, POA has been proved to be effective optimization approach, particularly in multi-reservoir systems [15,16,17]. Therefore, POA is selected in this study to solve the proposed model. The detailed description of Progressive Optimality Algorithm can be found in the prior literature [16,17].

3.2. Sensitivity Analysis

Sensitivity analysis is conducted to provide quantitative evidence of how power outputs are sensitive to various influencing factors. Various simulation solutions were compared by changing the boundary constraints corresponding to the influencing factors. Based on these simulation solutions, potential hydropower output is calculated and subsequently compared with outputs achieved under actual constraints. As a result, the extent to which the power outputs can be affected by influencing factors will be determined.
There are a number of complicated factors that affect operation efficiency of the cascade complex. Some of these factors even interact. These factors can be generally placed in the following groups: hydrometeorology conditions, reservoir comprehensive targets, and ecological requirements. Each group consists of a number of factors. The hydrometeorology conditions mainly include the hydrological forecast quality. The reservoir comprehensive targets mainly include flood control, navigation and water supply. This study focuses on three factors, i.e., hydrological forecast quality, flood control and navigation.

3.2.1. Impact of Hydrological Forecast Quality

The hydrological forecast quality can be measured by forecast accuracy and forecast time. The forecast time is usually based on daily or hourly units. Daily forecast is adopted in this study. By simulating run-off series with different levels of forecast accuracy, theoretical power outputs under different accuracy conditions were calculated. Then, the results are compared with those under actual forecast accuracy in order to determine the potential increase in power output. Similarly, analysis of quantitative impacts of forecast time on the power generation is undertaken by calculating potential hydropower outputs under different forecast times.
A deterministic coefficient, DC, is adopted in this study to measure the forecast accuracy [18]. Its definition is given below:
DC = 1 t = 1 n [ Q ct Q 0 t ] 2 t = 1 n [ Q 0 t Q 0 a ] 2
where t is time interval; n is total number of time intervals in the calculating period; Q 0 a is the average flow of actual runoff, m3/s; Q ct is the forecasted runoff (m3/s); Q 0 t is actual runoff (m3/s).
There are many methods of simulating runoff forecast. The method proposed in this study is to simulate runoff series under the given accuracy (measured by deterministic coefficient) according to the actual runoff. The calculation is performed as detailed below:
Q st = k ( Q ct Q 0 t ) + Q 0 t
DC s = 1 t = 1 n [ Q st Q 0 t ] 2 t = 1 n [ Q 0 t Q 0 a ] 2 = 1 k 2 t = 1 n [ Q ct Q 0 t ] 2 t = 1 n [ Q 0 t Q 0 a ] 2 = 1 k 2 DC 0
k = 1 DC s 1 DC 0
where Q st is the forecasted runoff, m3/s; DC s is the deterministic coefficient of simulation of runoff forecast corresponding to the given accuracy; DC 0 is the deterministic coefficient of actual runoff forecast; k is the proportionality coefficient of runoff forecast deviation.
POA is adopted to simulate reservoir optimal operation process and to calculate Potential Hydropower Output under various simulated forecast quality scenarios along with the actual forecast quality.

3.2.2. Impact of Flood Control

Flood control operation influences power generation mainly through setting constraints such as flood control level, commence date of flood season and commencement date of impounding. This study focuses on the analysis of flood control level, the constraint that has most significant effect on power generation. The different reservoir water level limits were selected during the flood season to simulate the Potential Hydropower Output. The risk analysis due to the increase of flood control level has been reported in prior studies [19,20]. Therefore, this study mainly focuses on sensitivity analysis of different flood control levels rather than the risk analysis.

3.2.3. Impact of Navigation

Navigation can affect power benefits by adjusting the downstream minimum navigation water level (or minimum navigation discharge) and the water level fluctuation. In the Three Gorges and Gezhouba cascade complex, the Gezhouba plant is a counter regulation reservoir, therefore the constraining effect of water level fluctuation is almost negligible. As a result, this study focuses on the constraining effect of the minimum navigation water level at downstream of the Gezhouba plant (i.e., at Miaozui, 1 km downstream of Gezhouba Dam). In Equation (7), DL i , t is used to simulate the navigation water level in order to obtain corresponding potential hydropower output.

4. Results and Discussion

4.1. Integrated Evaluation of Power Generation Benefits for Joint Operation of the Three Gorges and Gezhouba Cascade Complex

The precise simulation-optimization is carried out based on the joint operation from 2004 to 2010 under certain conditions, and the constraints stipulated by design operation rules during different periods (see Table 2). As shown in Table 2, the annual potential increasing percentages between 2004 and 2010 were around or less than 10% of the simulated maximum power output. This indicated that the actual joint operation of the cascade complex has exploited more than 90% of the theoretical maximum power output. The maximum theoretical power output was obtained in the simulation-optimization model under known inflow conditions. Therefore, it can be regarded as the upper limit of power generation that the cascade complex can achieve in reality. This result shows that the current operation efficiency has already reached a considerably high level. Under the existing operation rules, the Three Gorge and Gezhouba cascade complex still has some limited room to increase its power generating efficiency. In addition, as shown in Table 2, simulated power outputs of the cascade complex are greater than the actual power outputs. The surpluses in simulated power outputs of the cascade complex are mainly a contribution of the Three Gorges hydropower plant whereas simulated power outputs of the Gezhouba hydropower plant by itself are less than its actual power outputs. This indicates it is more effective to fully utilize the Three Gorges hydropower plant’s capacity than that of Gezhouba to achieve additional benefits from the cascade complex as an entire system. This suggested that the different scale of hydropower plants may play different roles in achieving the power generation benefits during the joint operation of the cascade complex.
Table 2. Results of integrated evaluation of power generation benefit for joint operation of The Three Gorges and Gezhouba Cascade Complex (TWh).
Year2004200520062007200820092010
Three GorgesActual power output39.1649.0949.6261.3180.3179.5583.94
Simulated max. power output42.4054.9854.7064.5586.6584.6487.73
GezhoubaActual power output17.0116.2514.5315.4617.0516.1516.10
Simulated max. power output15.0314.4214.6614.2016.6115.4815.85
CascadeActual power output56.1765.3464.1676.7797.3695.70100.04
Simulated max. power output57.4369.4069.3678.75103.26100.13103.59
Potential hydropower output1.274.065.211.985.904.433.55
Potential increasing percentage (δ)3.23%8.27%10.49%3.22%7.35%5.57%4.23%

4.2. Analysis of Influencing Factors

4.2.1. Impact of Hydrological Forecast Quality

According to the forecast data provided by the Three Gorges Cascade Control Centre of the China Three Gorges Corporation, the longest forecast time is 7 days at the moment, although the forecast with 4-day lead time is most reliable. Forecast accuracy (DC values) of the original inflow process for the Three Gorges Reservoir from 2004 to 2010 is simulated (see Table 3). As shown in Table 3, the forecast accuracy is correlated with the forecast time. The forecast accuracy for 1-day and 2-day can be above 90%, while the accuracy levels for 3-day and 4-day drop to around 85% and 81%, respectively. This shows there is room for improvement in terms of forecast quality, especially in the forecast accuracy for a longer forecast time. The simulated power generation for different forecast periods and different forecast accuracies in 2009 is calculated as per rolling optimal operation model (see Table 4). As shown in Table 4, the power output increases with the improvement of forecast accuracy and the expansion of forecast time. If the forecast accuracy with 4-day lead time reaches 95%, the power generation can be increased by more than 2%. The relationships between forecast accuracy, forecast time, and power generation are illustrated in Figure 3.
Table 3. Forecast accuracy DC values of original inflow process for the Three Gorges Reservoir from 2004 to 2010.
YearForecast time of 1-dayForecast time of 2-dayForecast time of 3-dayForecast time of 4-day
20040.940.900.840.80
20050.940.910.850.80
20060.940.910.850.82
20070.940.910.850.82
20080.940.920.860.82
20090.920.900.840.80
20100.950.920.860.83
Average0.940.910.850.81
Table 4. The simulated power generation for different forecast time and different forecast accuracy in 2009 (TWh).
Forecast timeDC = 0.80DC = 0.85DC = 0.90DC = 0.95
1-day93.3794.8096.0096.96
2-day93.7695.0996.4997.46
3-day94.3395.7796.9897.95
4-day96.1697.2398.1698.84
Figure 3. Relationship between different forecast accuracy, forecast time, and power output.
Energies 06 01165 g002

4.2.2. Impact of Flood Control Level

The impact of increasing flood control level (from Elev. 145 m to Elev. 165 m) on power output is analyzed. To analyze the impact of inflow, the hydrological years 2009 and 2010 are selected. The other series of data are from the daily average flow at the Yi Chang Gauging Station, which is located 1 km downstream of Gezhouba Dam. Daily average flow of a typical wet year, normal flow year and dry year is set at frequencies of 75%, 50% and 25%, corresponding the years of 1931, 1906 and 1928, respectively. The results are shown in Table 5.
Table 5 indicates that the power output increases significantly by raising the flood control level. Further analysis confirms that, compared to the actual operation, the degree of increasing power output is closely associated with the inflow during the flood season. The increasing percentages of power generation differ according to hydrological conditions. Increasing percentages of power generation related to the rise of flood control level are higher in dry years than those in wet years. This indicated that the rise of flood control level is more effective in dry years that in wet years in terms of achieving higher power outputs.
Table 5. Impact of increasing flood control level on power output of Three Gorges and Gezhouba cascade complex for different hydrological years (TWh).
FCL (m)20092010Typical wet year (1931)Typical normal year (1906)Typical dry year (1928)
SPOδSPOδSPOδSPOδSPOδ
 145*99.2-102.6-101.4-97.7-93.1-
 150101.42.2%104.31.6%104.83.3%101.43.8%95.72.8%
 155104.14.9%105.32.6%106.85.3%103.66.0%98.55.8%
 160105.46.2%106.03.3%107.15.6%105.27.6%101.38.8%
 165106.16.9%106.63.8%107.55.9%105.27.6%103.511.2%
Notes: FCL is flood control level; SPO is simulated power output; δ is potential increasing percentage of power generation. Actual operation in 2009, 2010 was done using FCL = 145 m, and the values in Row 145* are the actual power output.

4.2.3. Impact of Minimum Navigation Water Level

This section shows the analysis of the impact of minimum navigation water level on power generation during the dry seasons of 2008–2009 and 2009–2010. The results are shown in Table 6. The data show that lowering the minimum navigation water level during dry season has a comparatively minor impact on the power generation. In addition, the level of impact varies from year to year. Power generation in the dry season of the hydrological years 2008–2009 can be increased by as little as 0.24% by lowering the navigation water level. Furthermore, the power output will not increase once the water level reached Elev. 38.8 m. The impact of lowering the minimum navigation water level during the dry season of the hydrological years 2009–2010 is relatively larger. However, the maximum increase in power generation under these conditions is still only up to 2.03%, which is not significant. Further analysis indicates that this impact is closely related to inflow conditions. In general, the impact of navigation water level on power output is more significant in dry years that that in wet years. We further analyzed the number of days that inflows were less than the threshold value during dry seasons between 2004 and 2010. It is found that the inflow was at the lowest level recorded during the dry season of the hydrological years 2009–2010. As shown in Figure 3, lowering the downstream water level can significantly increase power output. However, there are very few of days with inflow of less than 5500 m3/s in normal years. Therefore, lowering the navigation water level actually has little impact on power generation. This finding suggests that the existing regulation rules on the downstream navigation water level are reasonable.
Table 6. Impact of lowering minimum navigation water level on power generation during dry seasons (1 December 2008–9 June 2009 and 1 December 2009–9 June 2010) (TWh).
Min. water level at Miaozui (m)Min. discharge flow (m3/s)1 December 2008–9 June 2009 1 December 2009–9 June 2010
SPOδSPOδ
37.503,00053.490.24%42.982.03%
38.003,70053.490.24%42.982.03%
38.504,30053.490.24%42.961.98%
38.804,80053.490.23%42.921.92%
39.005,30053.420.10%42.470.86%
39.20*5,50053.37-42.11-
Note: The values in Row 39.20* are the actual power output.
Figure 3. Number of days with inflow less than threshold values during dry seasons between 2004 and 2010 (m3/s).
Energies 06 01165 g003

5. Conclusions

Power generation is one of critical functions provided by hydropower developments. The cascade complex presents a significant challenge for effective power generation due to its complex nature. This research proposed an improved methodology for the post-evaluation of the effectiveness of power generation in cascade hydropower developments. A new concept, Potential Hydropower Output is proposed to assist the post-evaluation. Based on the first hand data of the joint operation of the Three Georges and Gezhouba cascade complex between 2004 and 2010, we critically analyzed the power generation efficiency of the two hydropower plants separately and for the entire cascade complex. The optimization modeling process considered a number of constraints such as the navigation water level limits, apart from traditional constraints such as downstream reservoir limits, power generation limits, and boundary conditions limit.
The results showed that the efficiency of current joint operation of the Three Georges and Gezhouba cascade complex has already reached a considerably high level, with little room left for further improvement under the existing regulation rules. It is interesting to note the full utilization of the Three Georges power plant’s capacity can increase the overall power output of the cascade complex. This is a useful finding as the role of different scale of hydropower plants play in effective power generation of the cascade developments could be taken into consideration in future endeavors. In addition, the accuracy of hydrological forecasts and flood control levels have significant impacts on power outputs, whereas the impact of downstream minimum navigation water level of the Gezhouba hydropower plant under existing regulation rules is minimal. Further research opportunities exist to refine evaluation index system and optimization model, to establish evaluation standards and to analyze impacts of optimization algorithm on evaluation results.

Acknowledgments

This study was financially supported by the National Key Technology R&D Program of China (2008BAB29B09). The authors would like to appreciate the anonymous reviewers for their constructive comments to improve this paper. Similarly, the authors would like to acknowledge the China Three Gorges Corporation for providing access to all original data that are essential for this research. In particular, the authors would like to thank Zuo Jian from the University of South Australia for improving the English usage.

References

  1. Simonovic, S.P. Reservoir systems analysis: Closing gap between theory and practice. J. Water Resour. Plan. Manag. 1992, 3, 262–280. [Google Scholar] [CrossRef]
  2. Lenzen, M. Current state of development of electricity-generating technologies: A literature review. Energies 2010, 3, 462–591. [Google Scholar] [CrossRef]
  3. Yeh, W. Reservoir management and operations models: A state-of-the-art review. Water Resour. Res. 1985, 21, 1797–1818. [Google Scholar] [CrossRef]
  4. Labadie, J.W. Optimal operation of multi-reservoir systems: State-of-the-art review. J. Water Resour. Plan. Manag. 2004, 130, 93–111. [Google Scholar] [CrossRef]
  5. Stein, S.M.; Martin, B.; Stout, S.R. Evaluating Reservoir Operations in the Muskingum Basin. In Proceedings of the World Environmental and Water Resources Congress, Ahupua’a, HI, USA, 13–16 May 2008; pp. 1–10.
  6. Dai, H.C.; Dong, Q.J.; Cao, G.J. Status and progress of operation techniques integration on cascade project of Three Gorges and Gezhouba [in Chinese]. J. Sichuan Univ. Eng. Sci. Ed. 2009, 4, 1–7. [Google Scholar]
  7. Cao, G.J.; Cai, Z.G. The preliminary study on evaluation methods and its improvement of economical operation of hydropower station [in Chinese]. J. China Three Gorges Constr. 2008, 11, 16–23. [Google Scholar]
  8. Lu, Y.M.; Cao, G.J. Yangtze Three Gorges Project—Technology; [in Chinese]; China Water Conservancy and Hydropower Press: Beijing, China, 2009. [Google Scholar]
  9. Cai, Z.G.; Cao, G.J.; Zheng, Y. A new approach to assess the power-generating management for cascade hydropower plants [in Chinese]. J. Hydroelectr. Eng. 2011, 2, 15–19. [Google Scholar]
  10. Teasley, R.L.; McKinney, D.C. Calculating the benefits of transboundary river basin cooperation: Syr Darya Basin. J. Water Resour. Plan. Manag. 2011, 6, 481–490. [Google Scholar] [CrossRef]
  11. Liu, J.; Zuo, J.; Sun, Z.; Zillante, G.; Chen, X. Sustainability in hydropower development—A case study. Renew. Sustain. Energy Rev. 2013, 19, 230–237. [Google Scholar] [CrossRef]
  12. Zhang, Y.C. Principles Operation of Hydropower Stations; [in Chinese]; Huazhong University of Science and Technology Press: Wuhan, China, 1998. [Google Scholar]
  13. Spendley, W.; Hext, G.R.; Himsworth, F.R. Sequential application of simplex designs in optimization and evolutionary operation. Technometrics 1962, 4, 441–461. [Google Scholar] [CrossRef]
  14. Nelder, J.A.; Mead, R. A simplex method for function minimization. Comput. J. 1965, 7, 308–313. [Google Scholar] [CrossRef]
  15. Howsan, H.R.; Sancho, N.G.F. A new algorithm for the solution of multistate dynamic programming problems. Math. Program. 1975, 8, 104–116. [Google Scholar] [CrossRef]
  16. Turgeon, A. Optimal short-term hydro scheduling from the principle of progressive optimality. J. Water Resour. Res. 1981, 17, 481–486. [Google Scholar] [CrossRef]
  17. Guo, S.L.; Chen, J.H.; Li, Y.; Liu, P.; Li, T.Y. Joint operation of the multi-reservoir system of the Three Gorges and the Qingjiang Cascade Reservoirs. Energies 2011, 4, 1036–1050. [Google Scholar] [CrossRef]
  18. The Ministry of Water Resources Conservancy Information Center (MWRCIC). Standard for Hydrological Information and Hydrological Forecasting (Chinese, SL250-2000); [in Chinese]; China Water Conservancy and Hydropower Press: Beijing, China, 2000; pp. 18–19. [Google Scholar]
  19. Zhao, Y.F.; Liu, Z.W.; Zhang, J.S. Discussion on dynamic limited flood water level control of Three Gorges Reservoir [in Chinese]. Hydropower Autom. Dam Monit. 2007, 1, 1–10. [Google Scholar]
  20. Liu, P.; Guo, S.L.; Wang, C.J.; Zhou, F. Optimization of limited water level in flood season and impounding scheme for reservoir in Three Gorges Project [in Chinese]. J. Hydraulic Eng. 2004, 7, 11–20. [Google Scholar]

