1. Introduction
In the last two decades, a large number of Wave Energy Converter (WEC) technologies have been developed. These are roughly divided into three major categories, namely the point absorber, the over topping device and the oscillating water column [
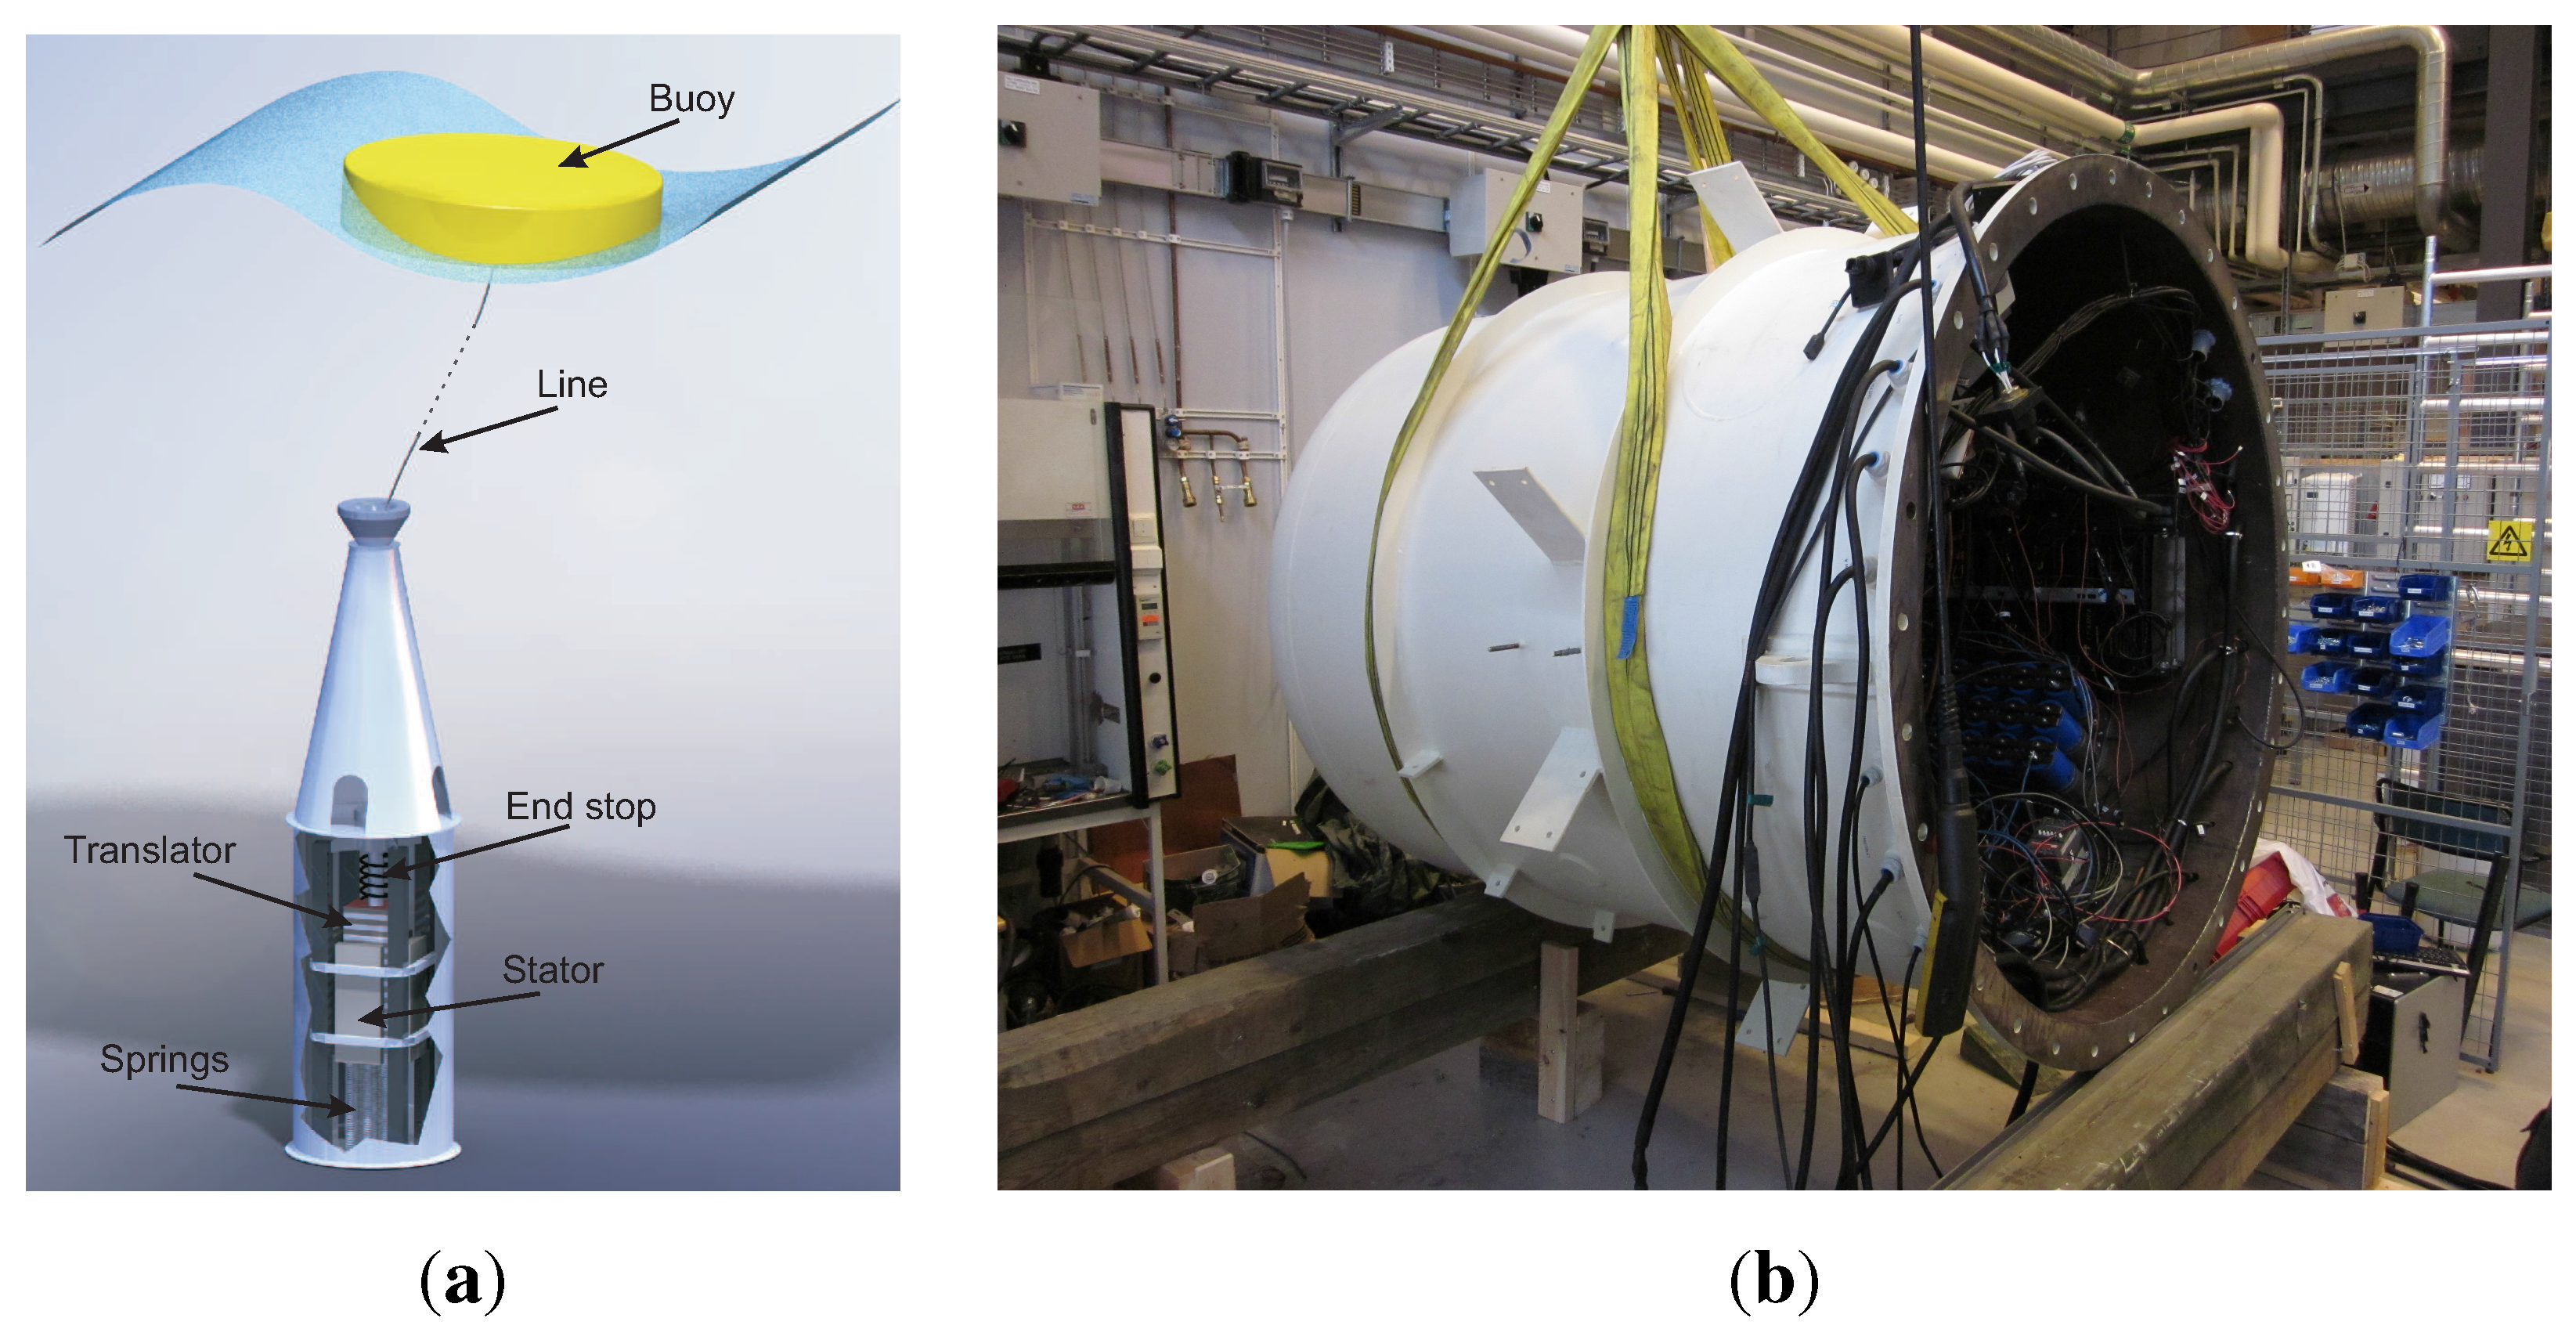
1]. In the Swedish Center for Renewable Electric Energy Conversion, Uppsala University, the point-absorber concept has been adopted, and is illustrated in
Figure 1a. A direct driven permanent magnet linear generator is placed on the seabed, connecting the translator to the floating buoy via a reinforced steel wire. The kinetic energy of the waves is absorbed by the buoy and transformed into electrical energy in the stator of the generator. The main advantage of this type of Power Take Off (PTO) system is its simplicity in the mechanical design, lacking gearbox, latching mechanisms and secondary energy storage.
Figure 1.
(a) WEC schematic; (b) Offshore marine substation.
Figure 1.
(a) WEC schematic; (b) Offshore marine substation.
The Uppsala University concept has been undergoing trials in real sea conditions for the last eight years and the results have been documented and published. A few relevant theoretical and experimental studies of the WEC can be found in [
2,
3,
4]. Examples of other existing projects also working with direct driven linear generators for wave energy conversion are presented in [
5,
6,
7].
To reduce the number of sea cables and improve transmission efficiency to shore for a wave power farm, an intermediate marine substation is required. The substation merges the power from all the WECs, and transfers it to the local electric grid onshore. A substation prototype is under construction as shown in
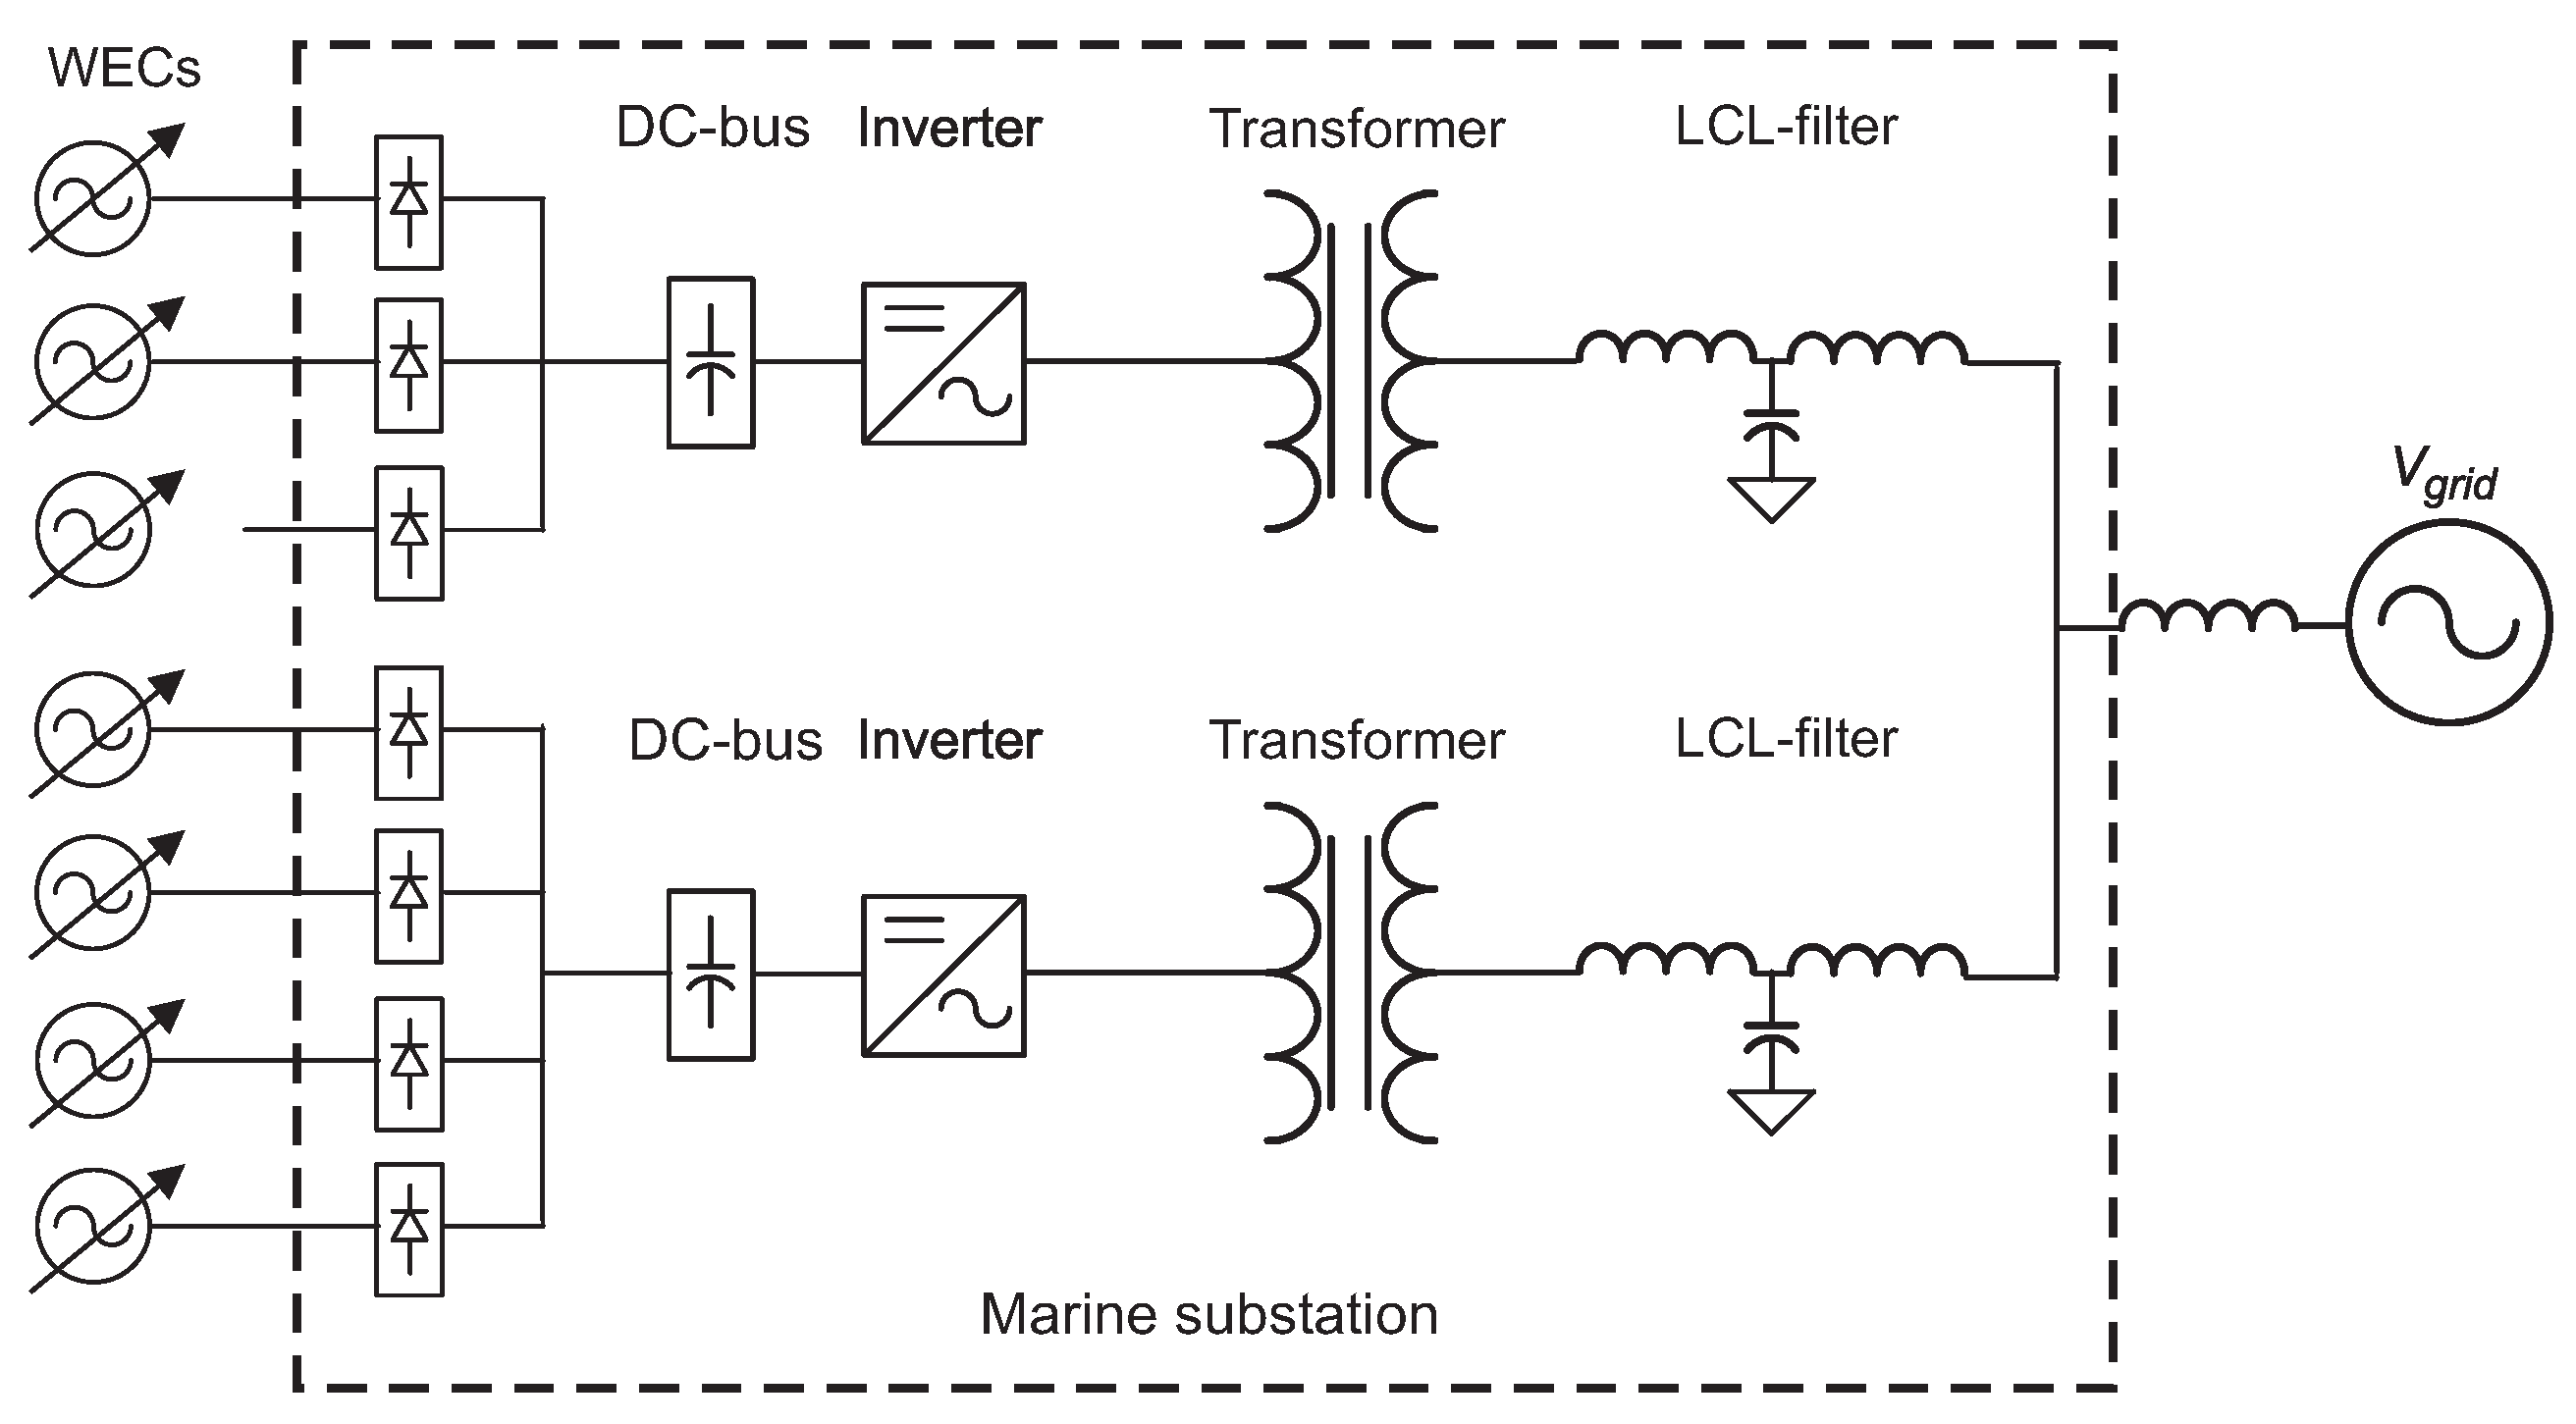
Figure 1b, and will be deployed with seven WECs for farm experiments. The single line diagram of its electrical circuit is shown in
Figure 2.
Figure 2.
Electrical layout of the marine substation.
Figure 2.
Electrical layout of the marine substation.
In this paper, the full simulation model of the WEC system has been developed. Long-term research site data have been used as input to the model and the delivered energy has been investigated. The model is executed for various values of constant DC-voltages at different sea states, and an optimal constant DC-level is obtained as a function of the sea state parameters. Finally, the total yearly energy output has been computed for two different operational strategies, for a full-scale prototype WEC at the research site.
2. Strategies for Maximum Energy Absorption of a Point Absorber
The classification of a WEC as a point absorber is based on its floating body having dimensions much smaller than the wave length of the incident waves, and results in a rather narrow operational bandwidth of the system. The energy absorption can be maximized if the resonant frequency of the WEC coincides with the dominant frequencies of the incident waves [
8]. However, the resonant frequency of the point absorber is generally found to be above the wave frequencies normally encountered. Therefore, to employ resonance techniques for increasing the energy absorption, it becomes necessary to provide the system with a supplementary mass [
9] or provide a negative spring constant using reactive power flow. It is well established that for a point absorber based linear generator system, the optimal power absorption from the waves occur when the buoy velocity and the wave excitation force are in phase. This is achieved by phase-shifting the buoy position by 90 degrees from the wave amplitude, referred to as buoy latching [
10]. Latching technique by using the damping force of the electrical generator with the use of bidirectional converters is discussed in [
11]. The implementation of latching control requires prediction of the wave amplitudes which is reported to be computationally intensive. Other damping strategies such as variable DC-link or reactive power control are discussed in [
12,
13]. These techniques are reported to considerably increase the energy absorption at the expense of increased internal system losses and increased system complexity. The buoy latching techniques for a direct driven linear generator has to handle large mechanical forces and yet survive in the harsh sea environment. It is therefore widely acknowledged that latching for such a PTO is best implemented electrically as an electrical damping force [
8].
The additional investments in bidirectional converters and reactive power elements like capacitors may be economically viable for a WEC unit of medium or high power rating. However, for small-scale WEC units of more modest power rating, the extra circuitry may not be worth the investment costs and increased complexity. For a wave power farm of multiple small-scale units, rectification onto a common DC-link bus may be recommended as a very simple, cheap and reliable strategy, despite its limitations in damping control.
3. Constant DC-link Damping
The basic equation for the dynamics of the WEC under consideration can be written as:
where
is the excitation force due to the incident waves;
is the radiation force;
is the hydrostatic force; m is the total mass of the system;
S is the wetted area of the buoy; z is the wave elevation; and
is the reaction force from the PTO. The parameter that can be controlled from the electrical side is the reaction force
. If the generator output is rectified and the DC-link voltage is maintained at constant level, the generator current envelope can be expressed as:
where
is the induced generator voltage envelope; and
the resistance of the cable windings, ignoring the diode voltage drops. The reaction force
in the PTO can be expressed as:
where k is a variable depending on the generator design and the translator active area. Under normal operation, the buoy and the translator move in tandem, with equal velocity. The generated power output
is then computed as:
The variation in DC link voltage allows for control of
and hence the damping force
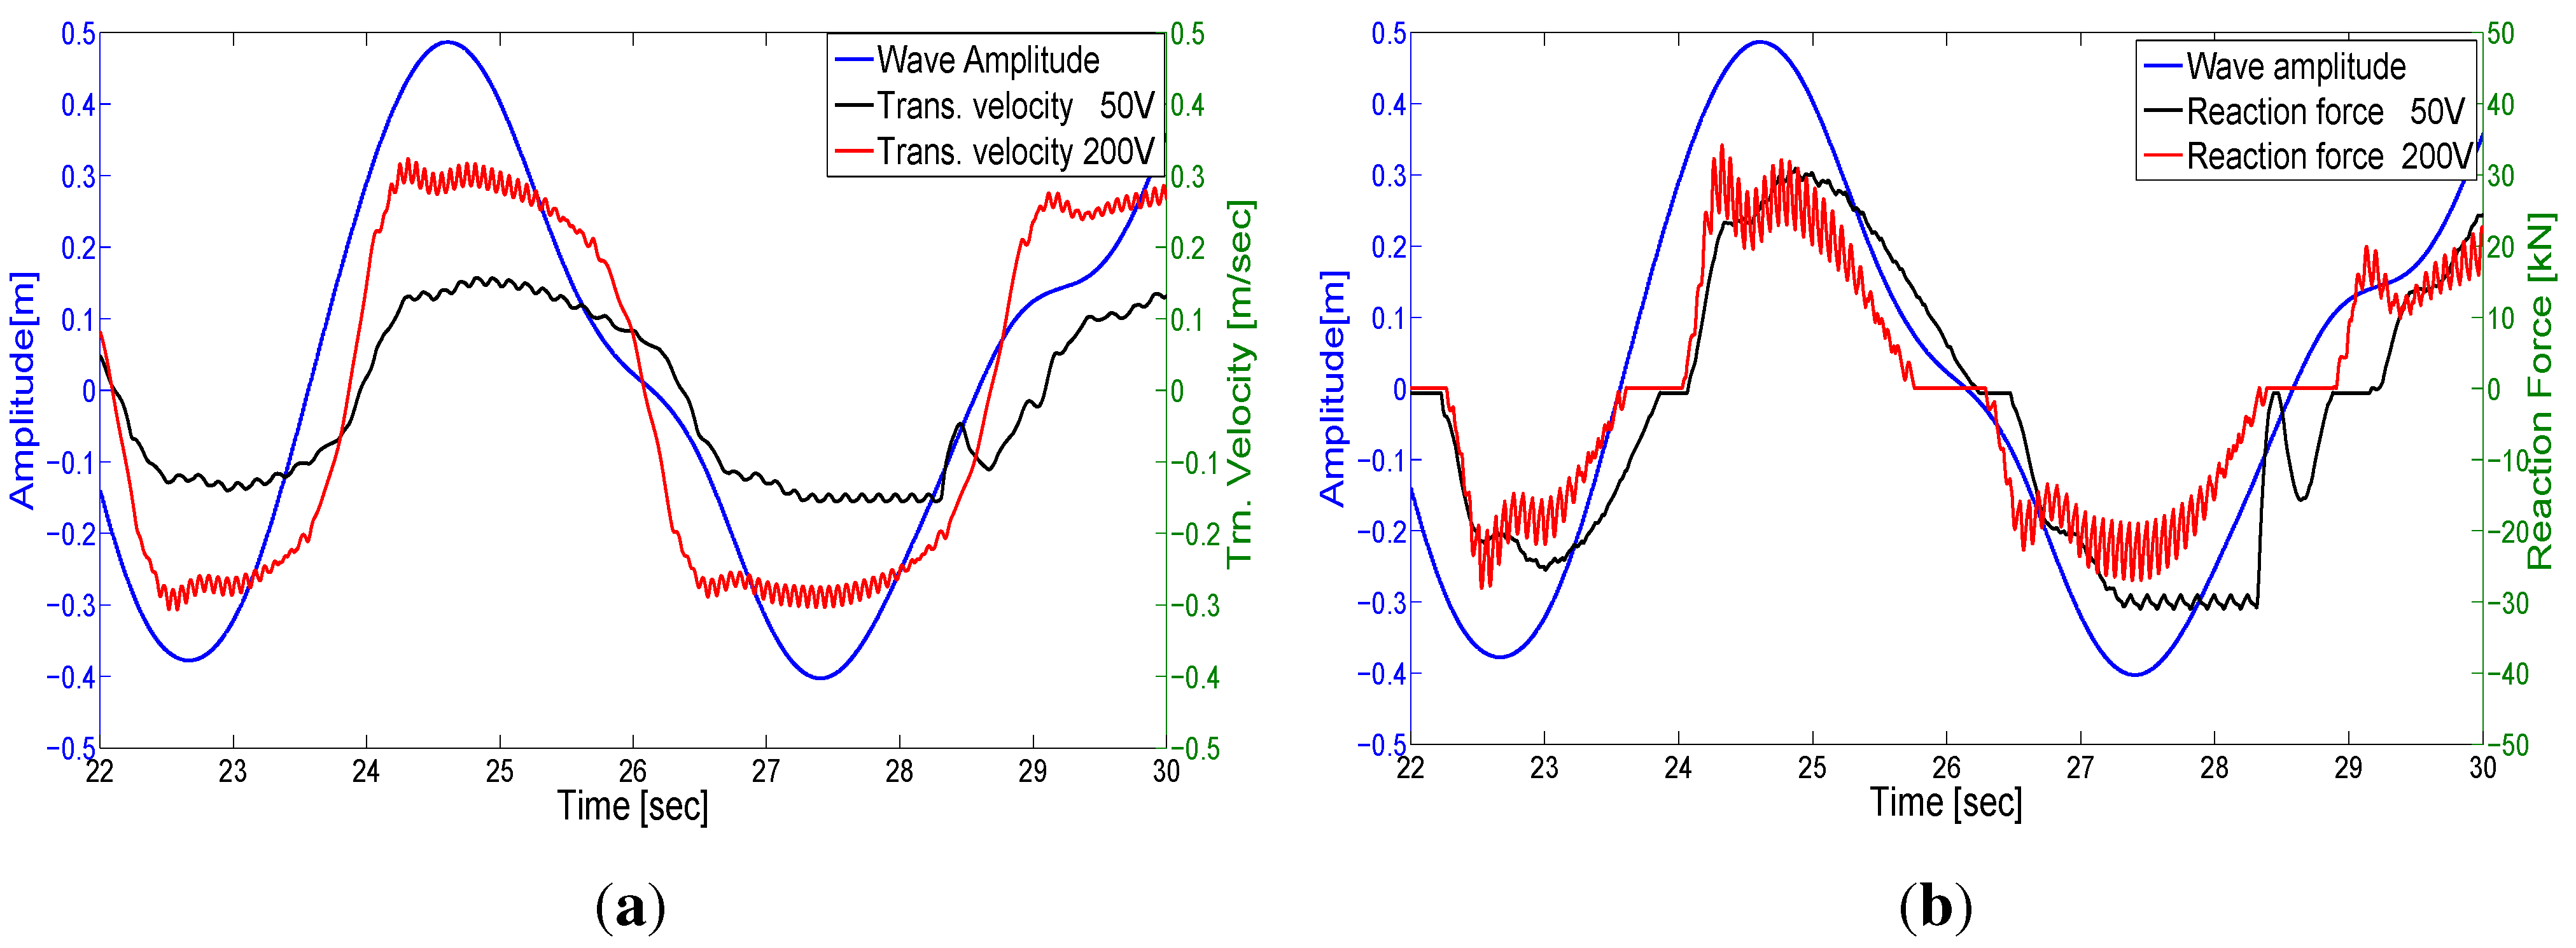
. The optimal energy output of the WEC is obtained by setting the DC-voltage low enough to get a good damping, but high enough to keep the resistive losses down. The DC-voltage control is implemented by controlling the power injected into the grid using a voltage source inverter, or by adding a DC-DC converter to the circuit. The control strategy is illustrated in
Figure 3, where two DC link voltages of 50 V and 200 V are examined for the same input wave. In
Figure 3a, the translator velocities for the two cases are compared, and there is a noticeable decrease for the 50 V-case. However, looking at the respective damping forces for each case in
Figure 3b, there is almost no difference between the cases. According to Equation (
4), more energy is absorbed from the waves at 200 V than 50 V for this specific wave. This forms basis for the control strategy presented in the article.
Figure 3.
Examples of WEC velocity and damping force, using a constant DC-link at 50 V and 200 V. (a) Comparison of translator velocities; (b) Comparison of Reaction forces.
Figure 3.
Examples of WEC velocity and damping force, using a constant DC-link at 50 V and 200 V. (a) Comparison of translator velocities; (b) Comparison of Reaction forces.
4. Research Site Specifics
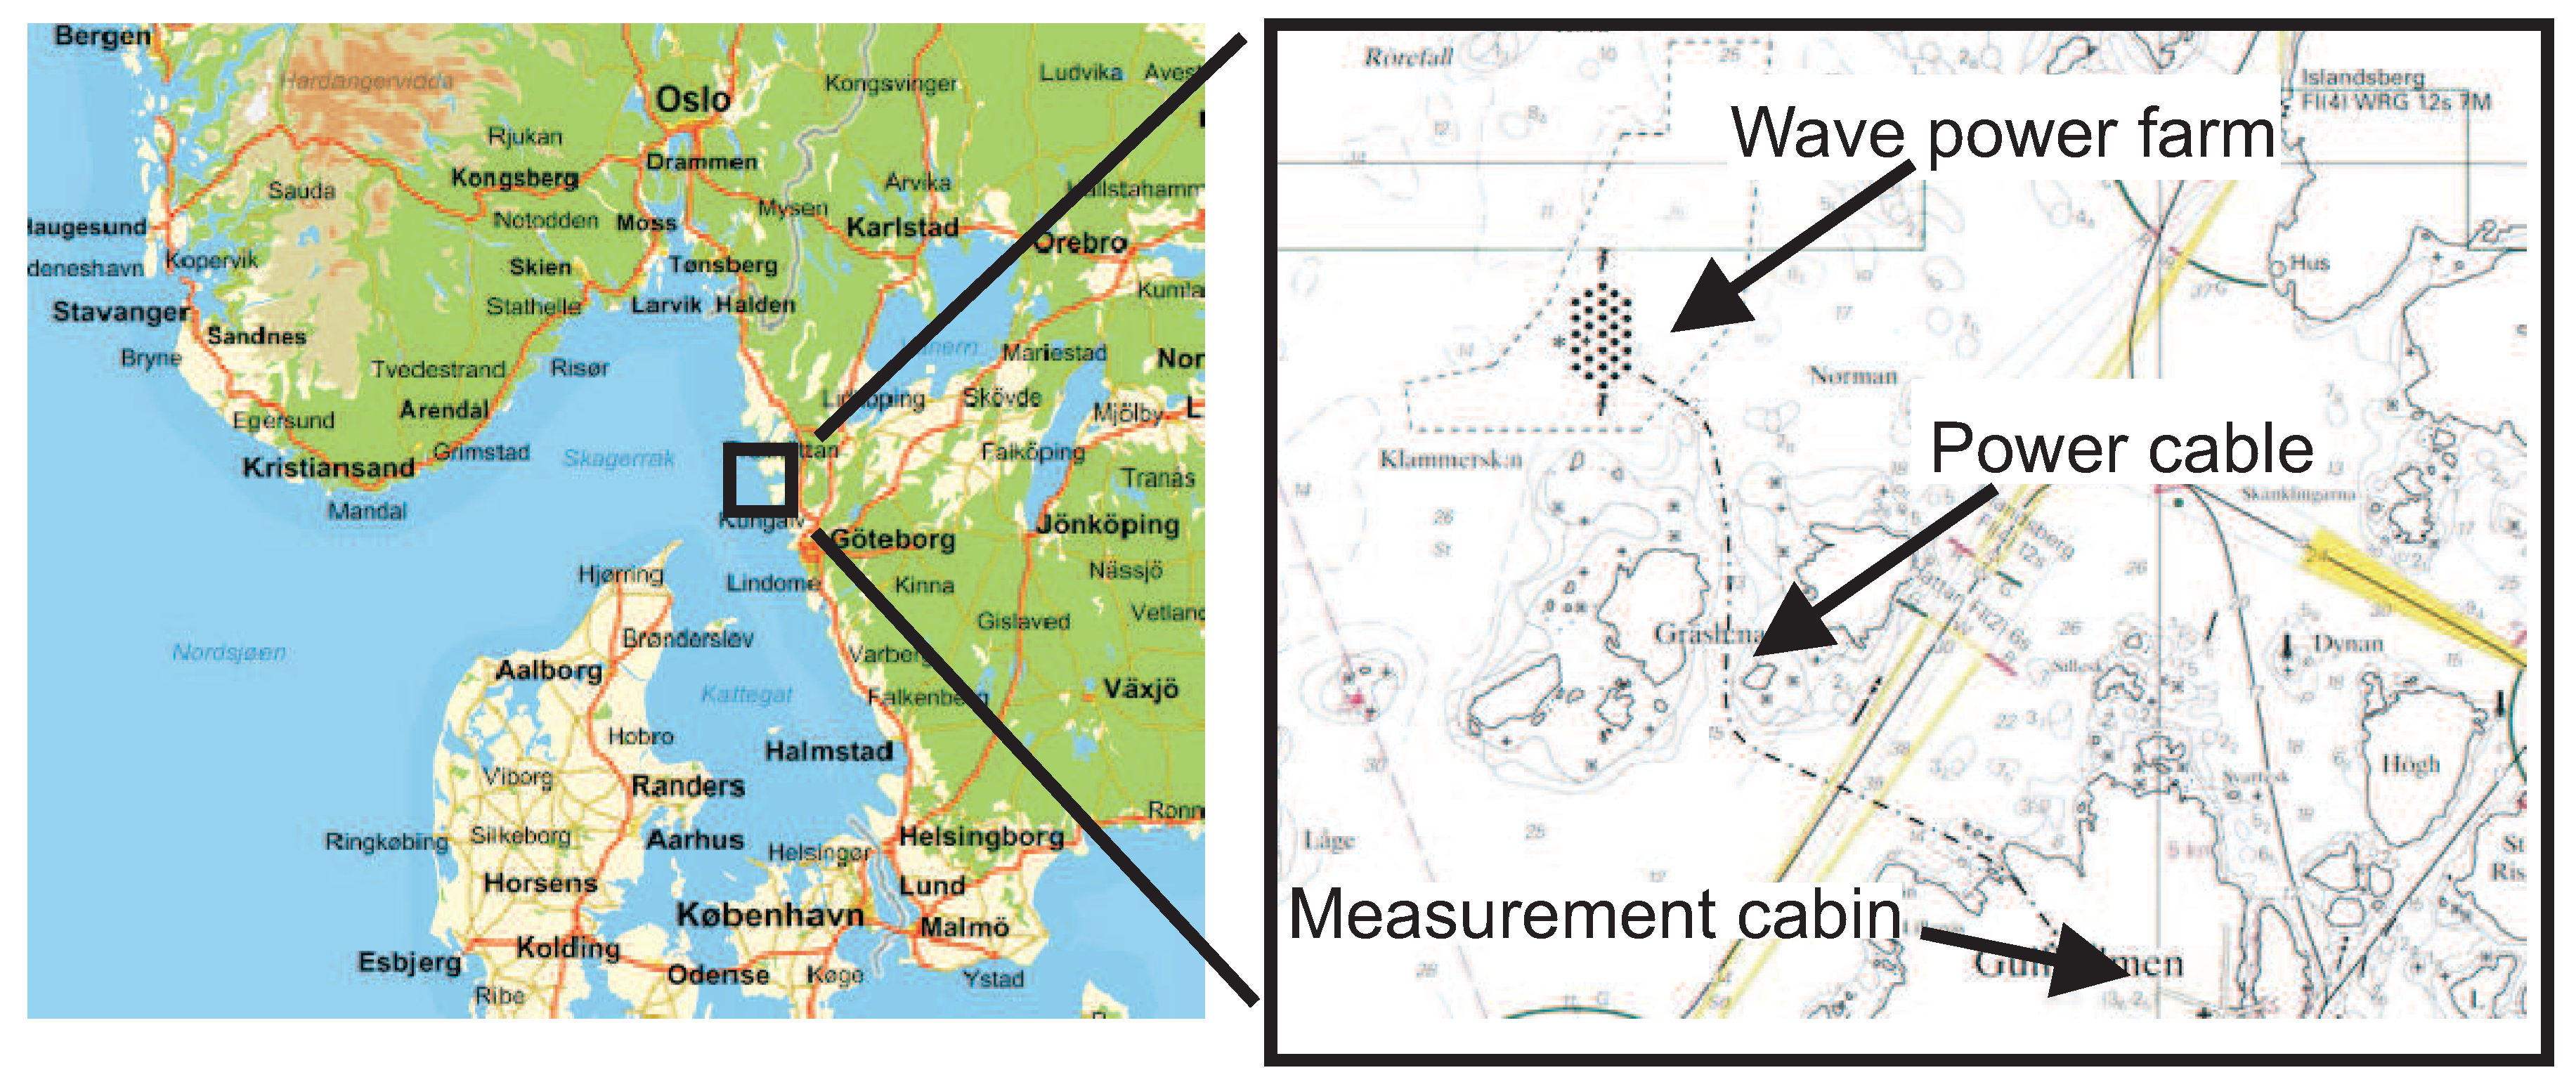
The experimental site is chosen to provide partially sheltered sea conditions to allow for the initial prototypes to survive and allow for easy deployment and observation by diving crew. The research site for planned deployment of seven WECs and a marine substation is shown in
Figure 4. The marine substation is connected via a sea cable to the electric grid onshore at 11 kV.
Figure 4.
Location of the Lysekil test site.
Figure 4.
Location of the Lysekil test site.
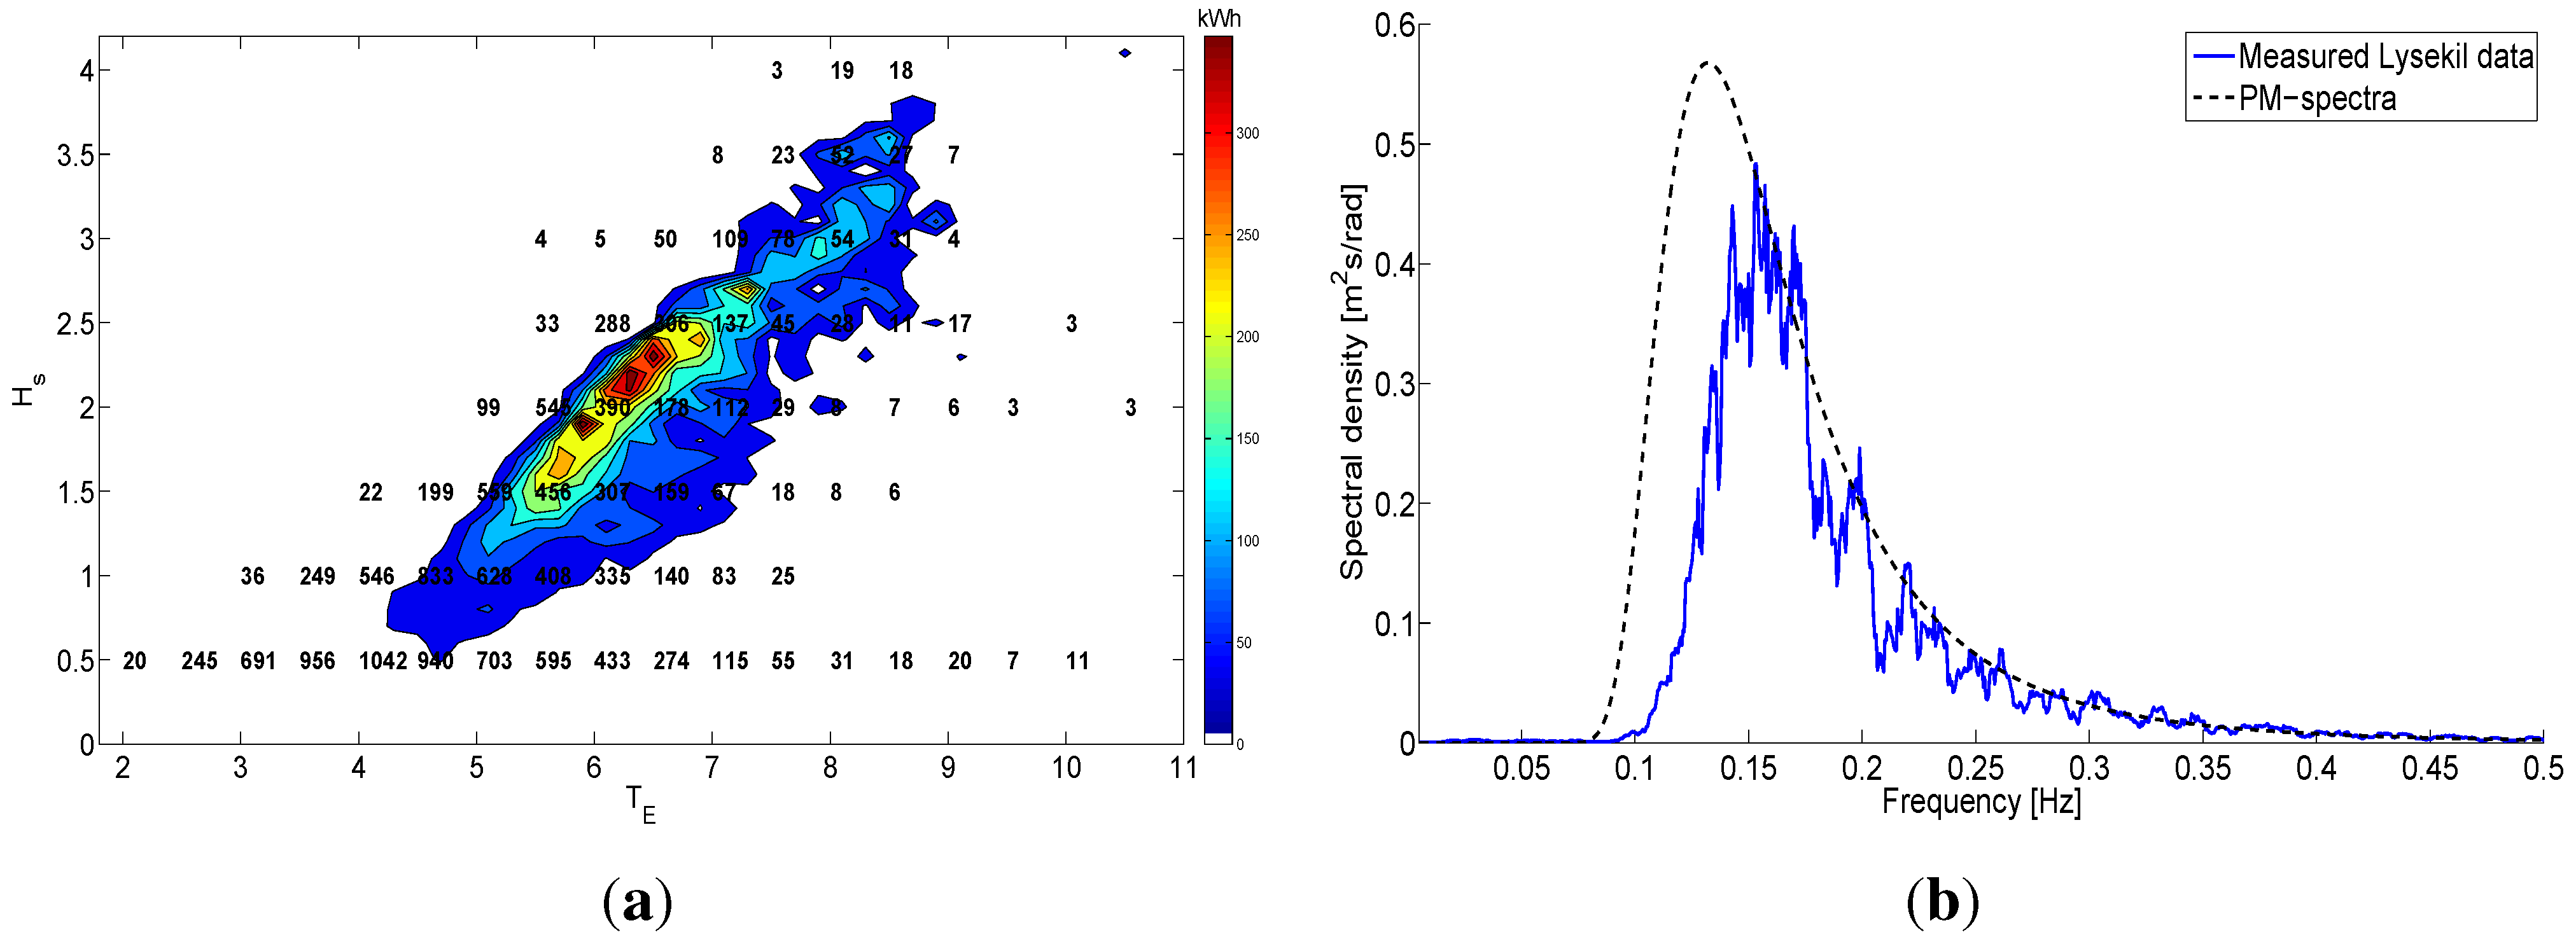
Information on the sea state is gathered by a Wave rider buoy at the site, with a sampling frequency of 2.56 Hz. To get a better dynamic response, this data is up-sampled to 100 Hz for the Simulink model. In
Figure 5a, the data for the full year of 2008 has been analysed and gathered into half-hour sample lengths, and the average values of
and
are computed.
The significant wave height is calculated using:
and the average energy period by:
where the nth moment
of the spectral density
is defined by:
In deep water, the average power of the waves can be derived using potential wave theory as:
where
is the sea water density,
is the gravitational constant.
Figure 5.
Wave data at the site.
Figure 5.
Wave data at the site.
The half-hour duration samples of
Figure 5a are used with Equation 8 to calculate the yearly energy generation at various sea states, depicted with the colour-plot in the same figure. The most energetic waves of the site appear in the surroundings of
= 2 m and
= 6 s. The stroke length of the translator is therefore dimensioned to 2 m. A more thorough summary of the sea states at various places on the Swedish West coast is found in [
14]. In
Figure 5b, the wave spectra is derived and compared with a Pierson-Moskowitz spectra done at the site. From this, it becomes obvious that most energy is available in the range of
= 4–8 s.
5. Simulation Model
A complete time-domain model of the system has been developed for studying the response of the system on real sea waves. The estimation of the average power generated and parameters like the conversion losses are more realistic when using the real sea waves. The simulation has to be performed in time-domain for handling the non-linear system effects, like the electric rectification, the translator hitting the end-stops of the generator and the flexible wire connection between the buoy and the translator. The system model is based on MatLAB Simulink, and has been verified with experimental results in e.g., [
15,
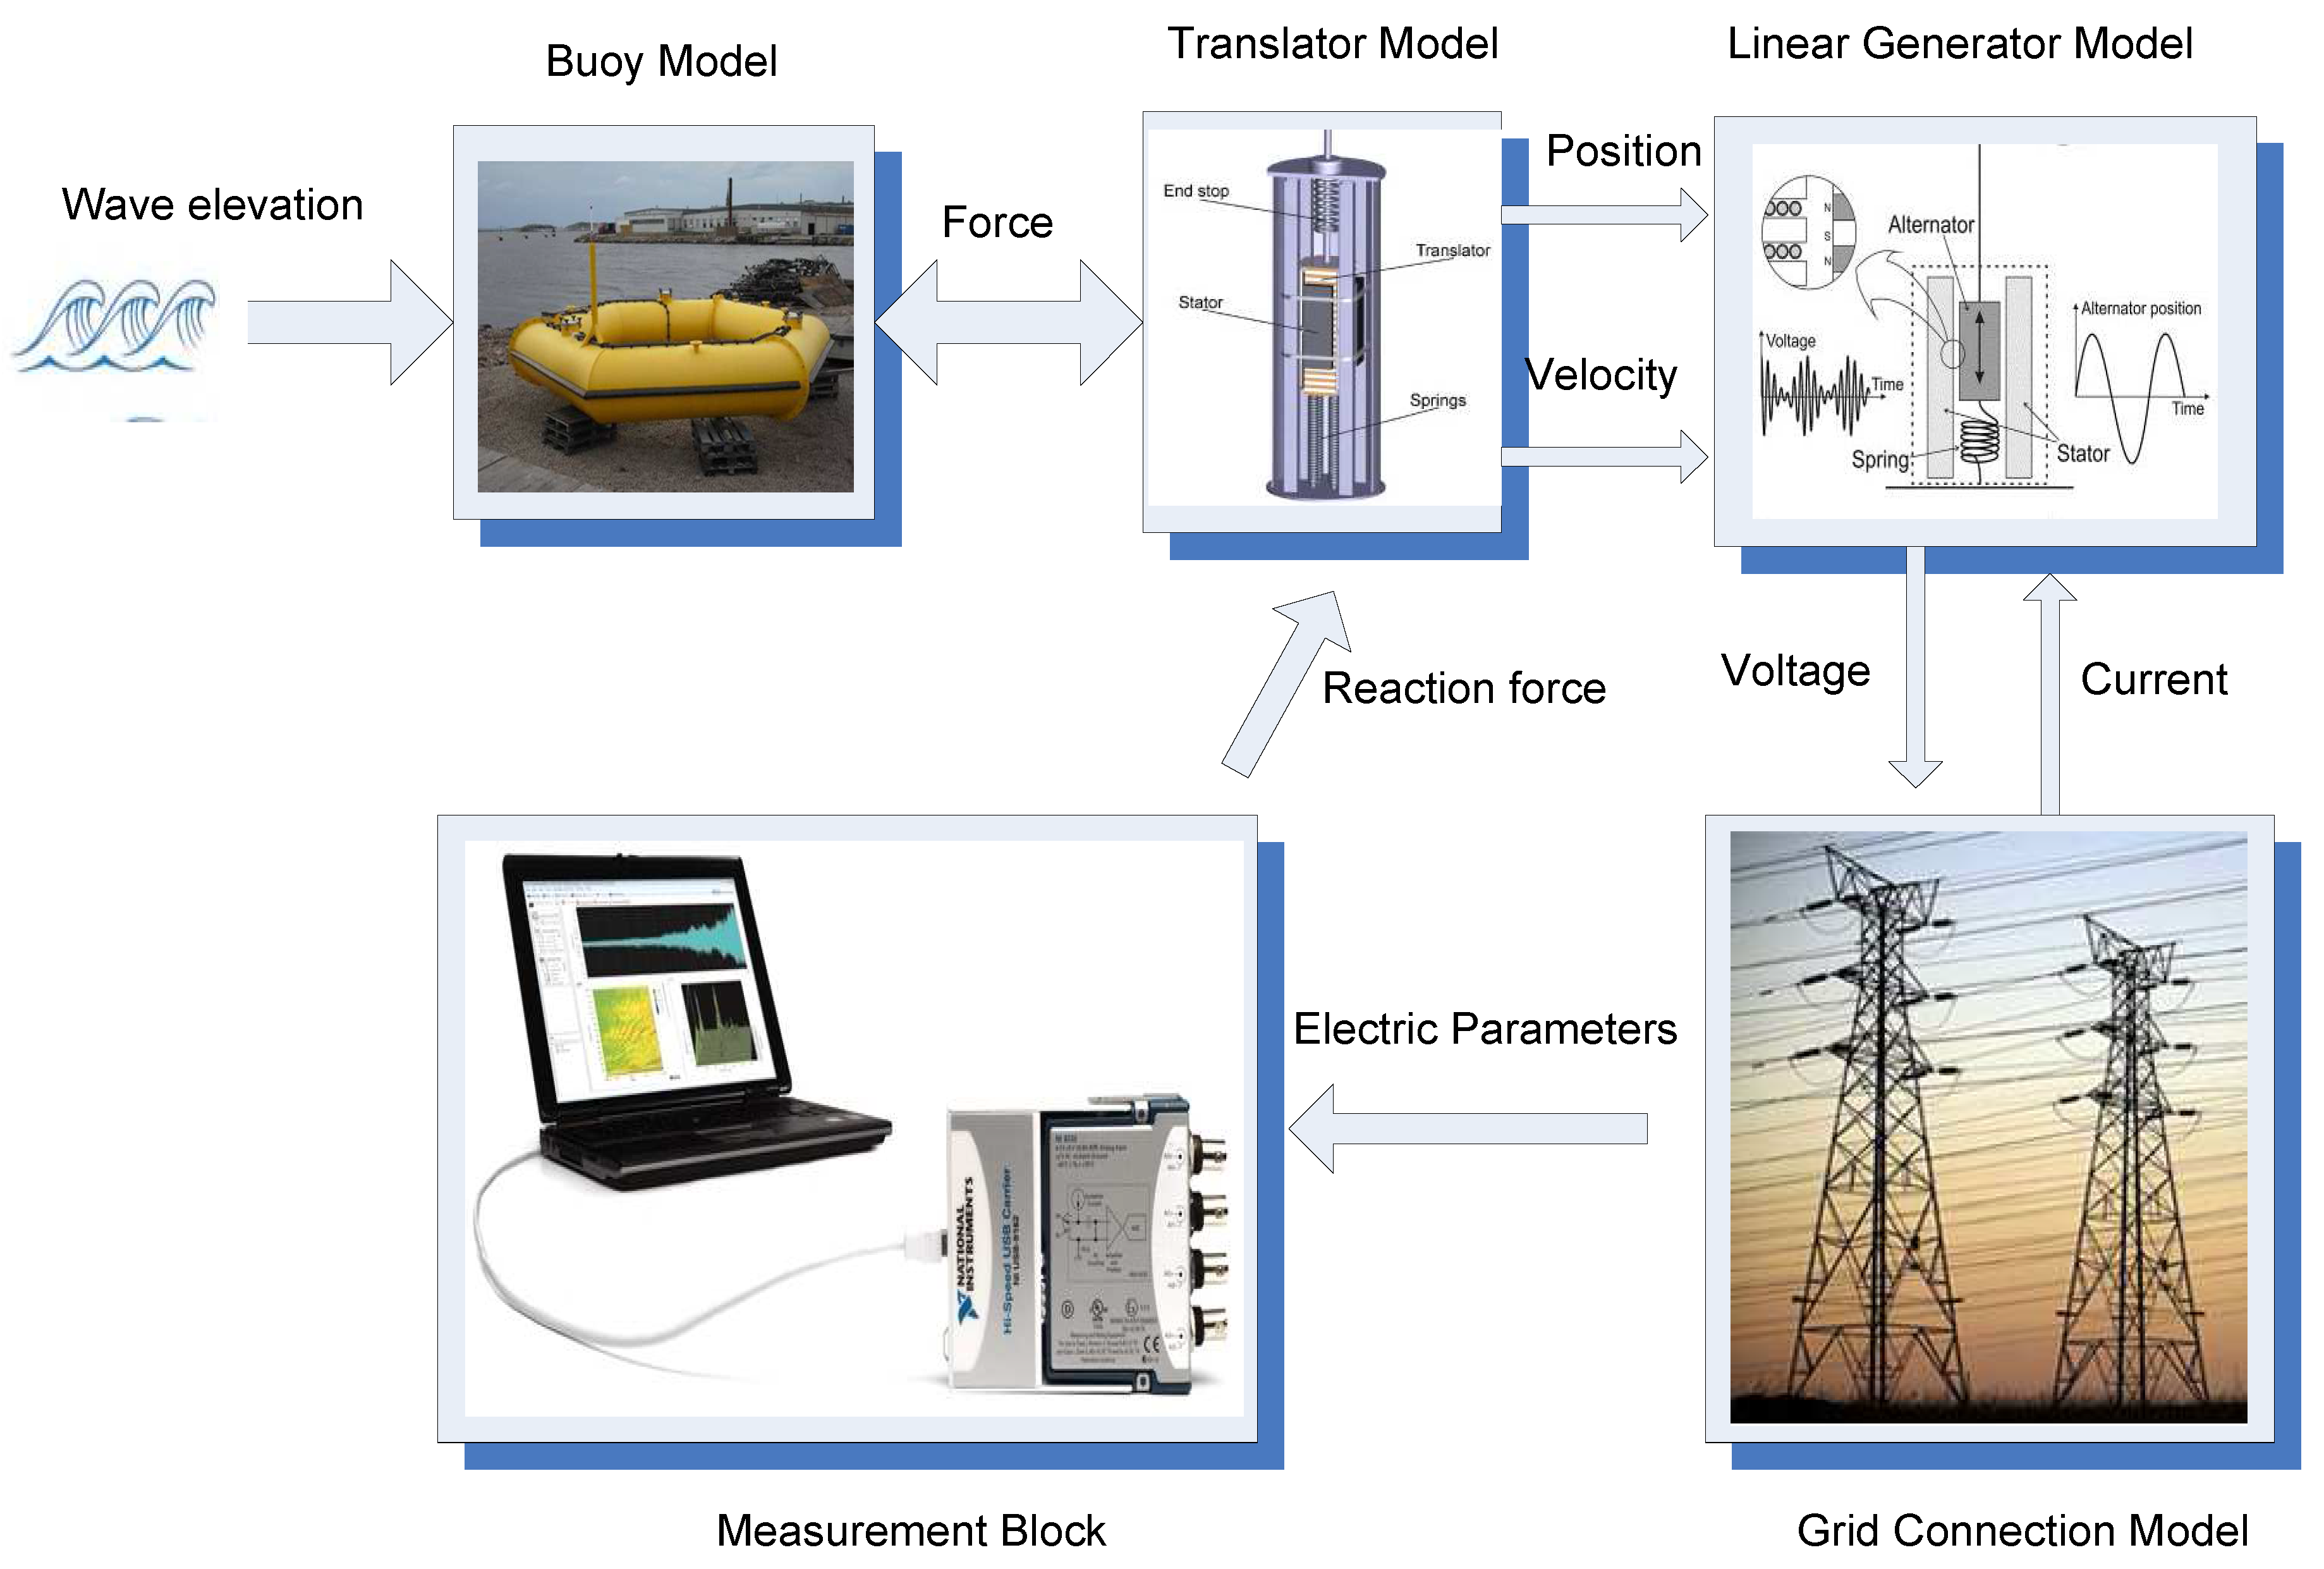
16]. The model constitutes of four major subsystem blocks. This allows for flexibility in changing and modifying parameters. The interconnection between the blocks and the major parameters connecting them are shown in
Figure 6.
The Buoy module design is based on the potential linear wave theory [
17]. The buoy dynamics consider only the heave motion. The results published in [
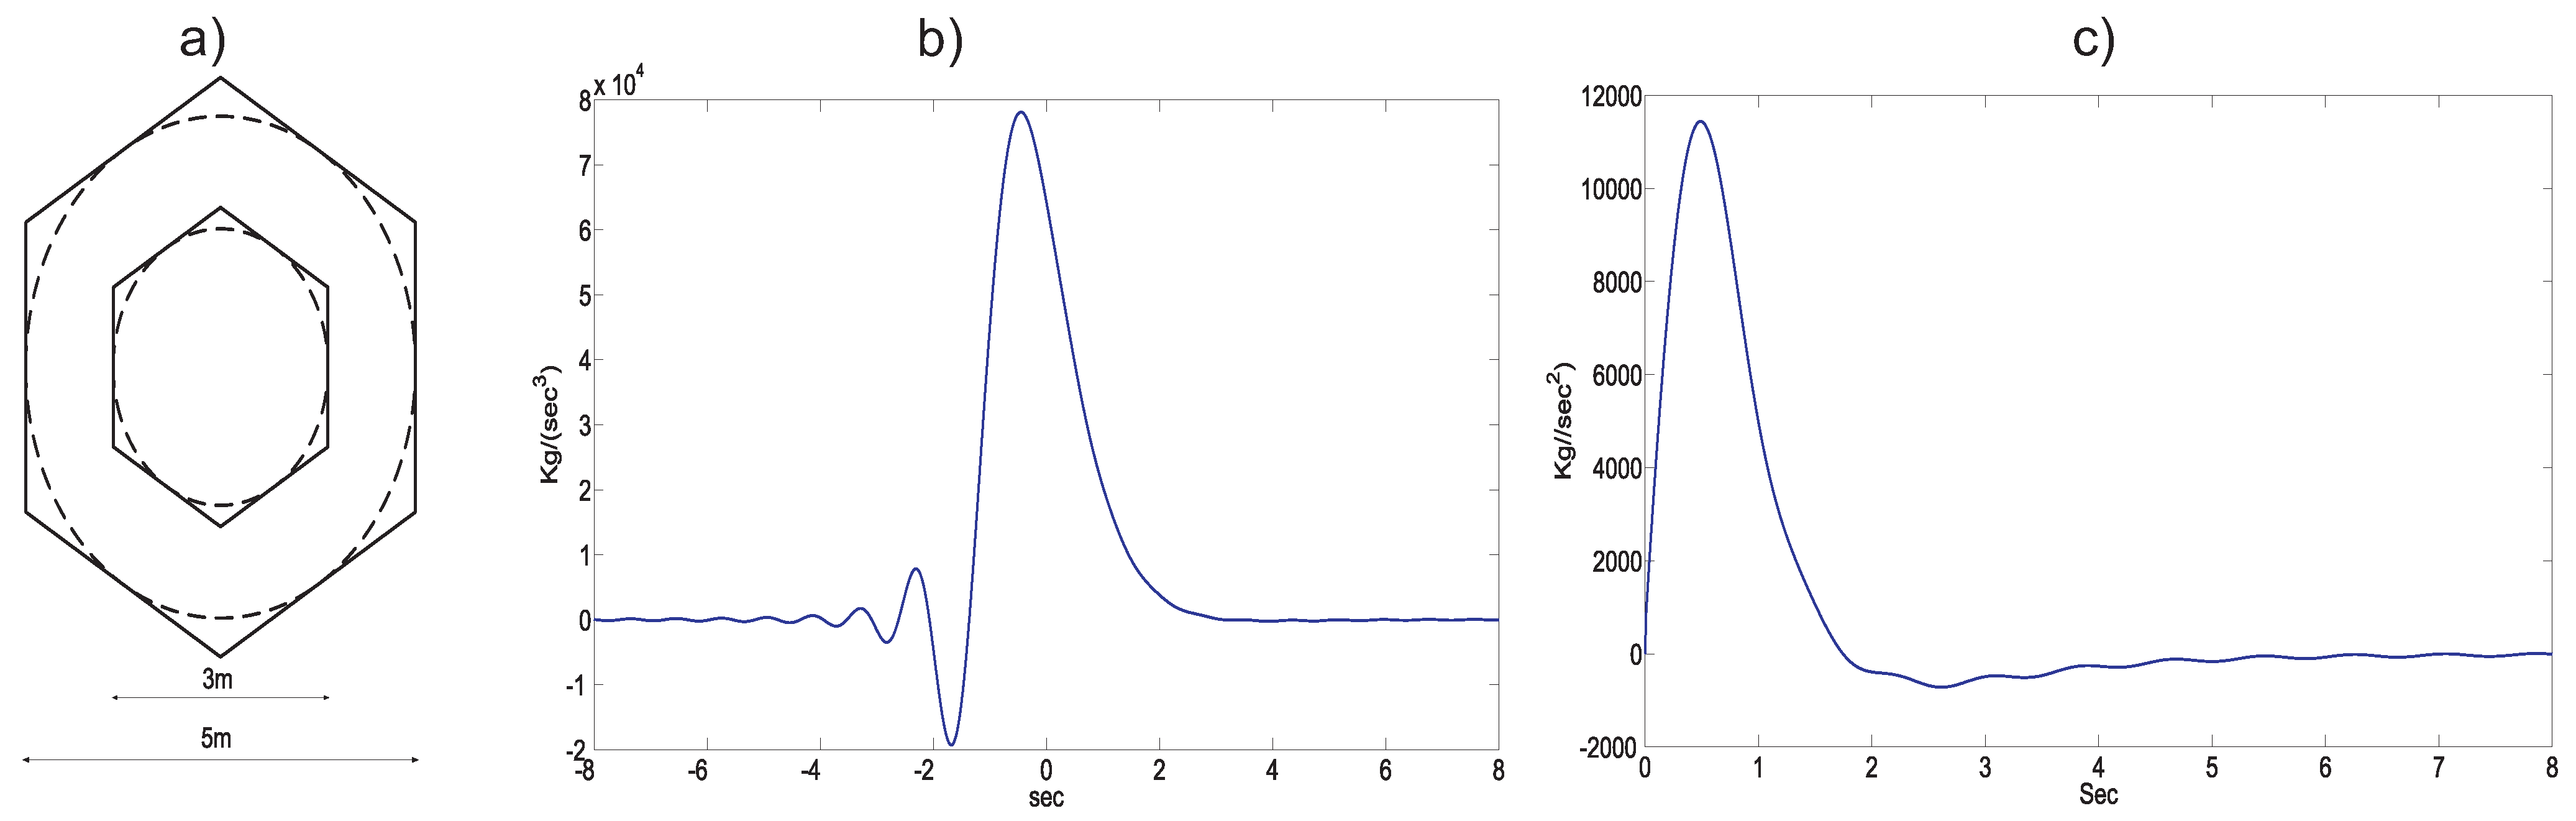
18] show that since the wire length is much longer than the possible side-way motion, the heave motion is the main contributor in the power generation. The excitation response and the radiation response of the buoy are obtained from WAMIT which uses the Boundary Integral Equation Method (BIEM). The buoy used is a hexagonal shaped doughnut buoy which is shown in
Figure 7a the excitation force kernel is shown in
Figure 7(b) and the radiation integral kernel is shown in
Figure 7c, as used by the model. The value of added mass is also obtained from WAMIT analysis. The wave amplitude is taken from a wave rider buoy placed at the experimental site. This wave data is used as input to the model which computes the forces on the buoy. The flexible steel rope connecting the translator and the buoy transmits the buoy force only if the rope is stretched tight. In the instances when there is slack in the rope, the translator and the buoy exhibit independent dynamics.
Figure 6.
Block diagram of the Simulink model.
Figure 6.
Block diagram of the Simulink model.
Figure 7.
Buoy characteristics. (a) Hexagonal torus buoy; (b) Excitation impulse response; (c) Radiation impulse response.
Figure 7.
Buoy characteristics. (a) Hexagonal torus buoy; (b) Excitation impulse response; (c) Radiation impulse response.
The Translator module uses a model with the mass, end stop springs and the damping resistance of the generator. The values of the frictional losses and the windage losses are ignored. The translator velocity is generally low, in the range of 0–1 m/s. The magnetic losses of the generator are approximately calculated from FEM data, but are generally small due to the low magnetic frequencies in the generator [
2].
The Generator model uses winding parameters of resistance and leakage inductance, obtained from FEM analysis. The leakage flux, as well as the leakage inductance, will vary with the armature current, which is taken into account in the model. The temperature variations of the stator are considered small and thus ignored. As the translator moves, the active area inducing voltage into the stator windings will vary, which is included in the model by feedback control of the translator position. The reaction force is computed from the generated power at the air-gap and the translator velocity. This force is fed back into the translator module.
The main design parameters of the WEC are tabulated below.
Table 1.
Design Characteristics of Linear Generator.
Table 1.
Design Characteristics of Linear Generator.
| Rated power | 23.1 kW at 0.7 m/s |
| Rated phase voltage | 450 V at 0.7 m/s |
| Phase winding resistance | 1.0 Ohm |
| Phase winding inductance | 20 mH |
| Pole widtd | 52 mm |
| B-field | 1.73 Tesla |
| Sea cable resistance | 0.2 Ω/km |
| Sea cable capacitance | 50 /km |
| Buoy mass | 2500 kg |
| Translator mass | 2700 kg |
| Translator lengtd | 2 m |
| Stator lengtd | 2 m |
| Free stroke lengtd | ±1 m |
| Max. stroke lengtd | ±1.25 m |
The Electric module includes the impedance of the transmission cable,the diode rectifier and an ideal constant DC voltage source. The cable impedance is modelled as a lumped parameter
π model. The rectifier diodes used for the modelling are SKN240/18 (1800 V, 240 A). Important design parameters are mentioned in
Table 1. A Measurement block measures the voltages and currents at the generator terminal and also at the load on-shore. The generated power and the delivered power are calculated and logged.
6. Simulation Results and Discussion
The simulation model has been executed for the given WEC parameters in
Section 5 at various sea states. Experimental long term wave data series for various values of
and
has been used as input to the model, and the constant value of the DC-bus has been varied over a wide range.
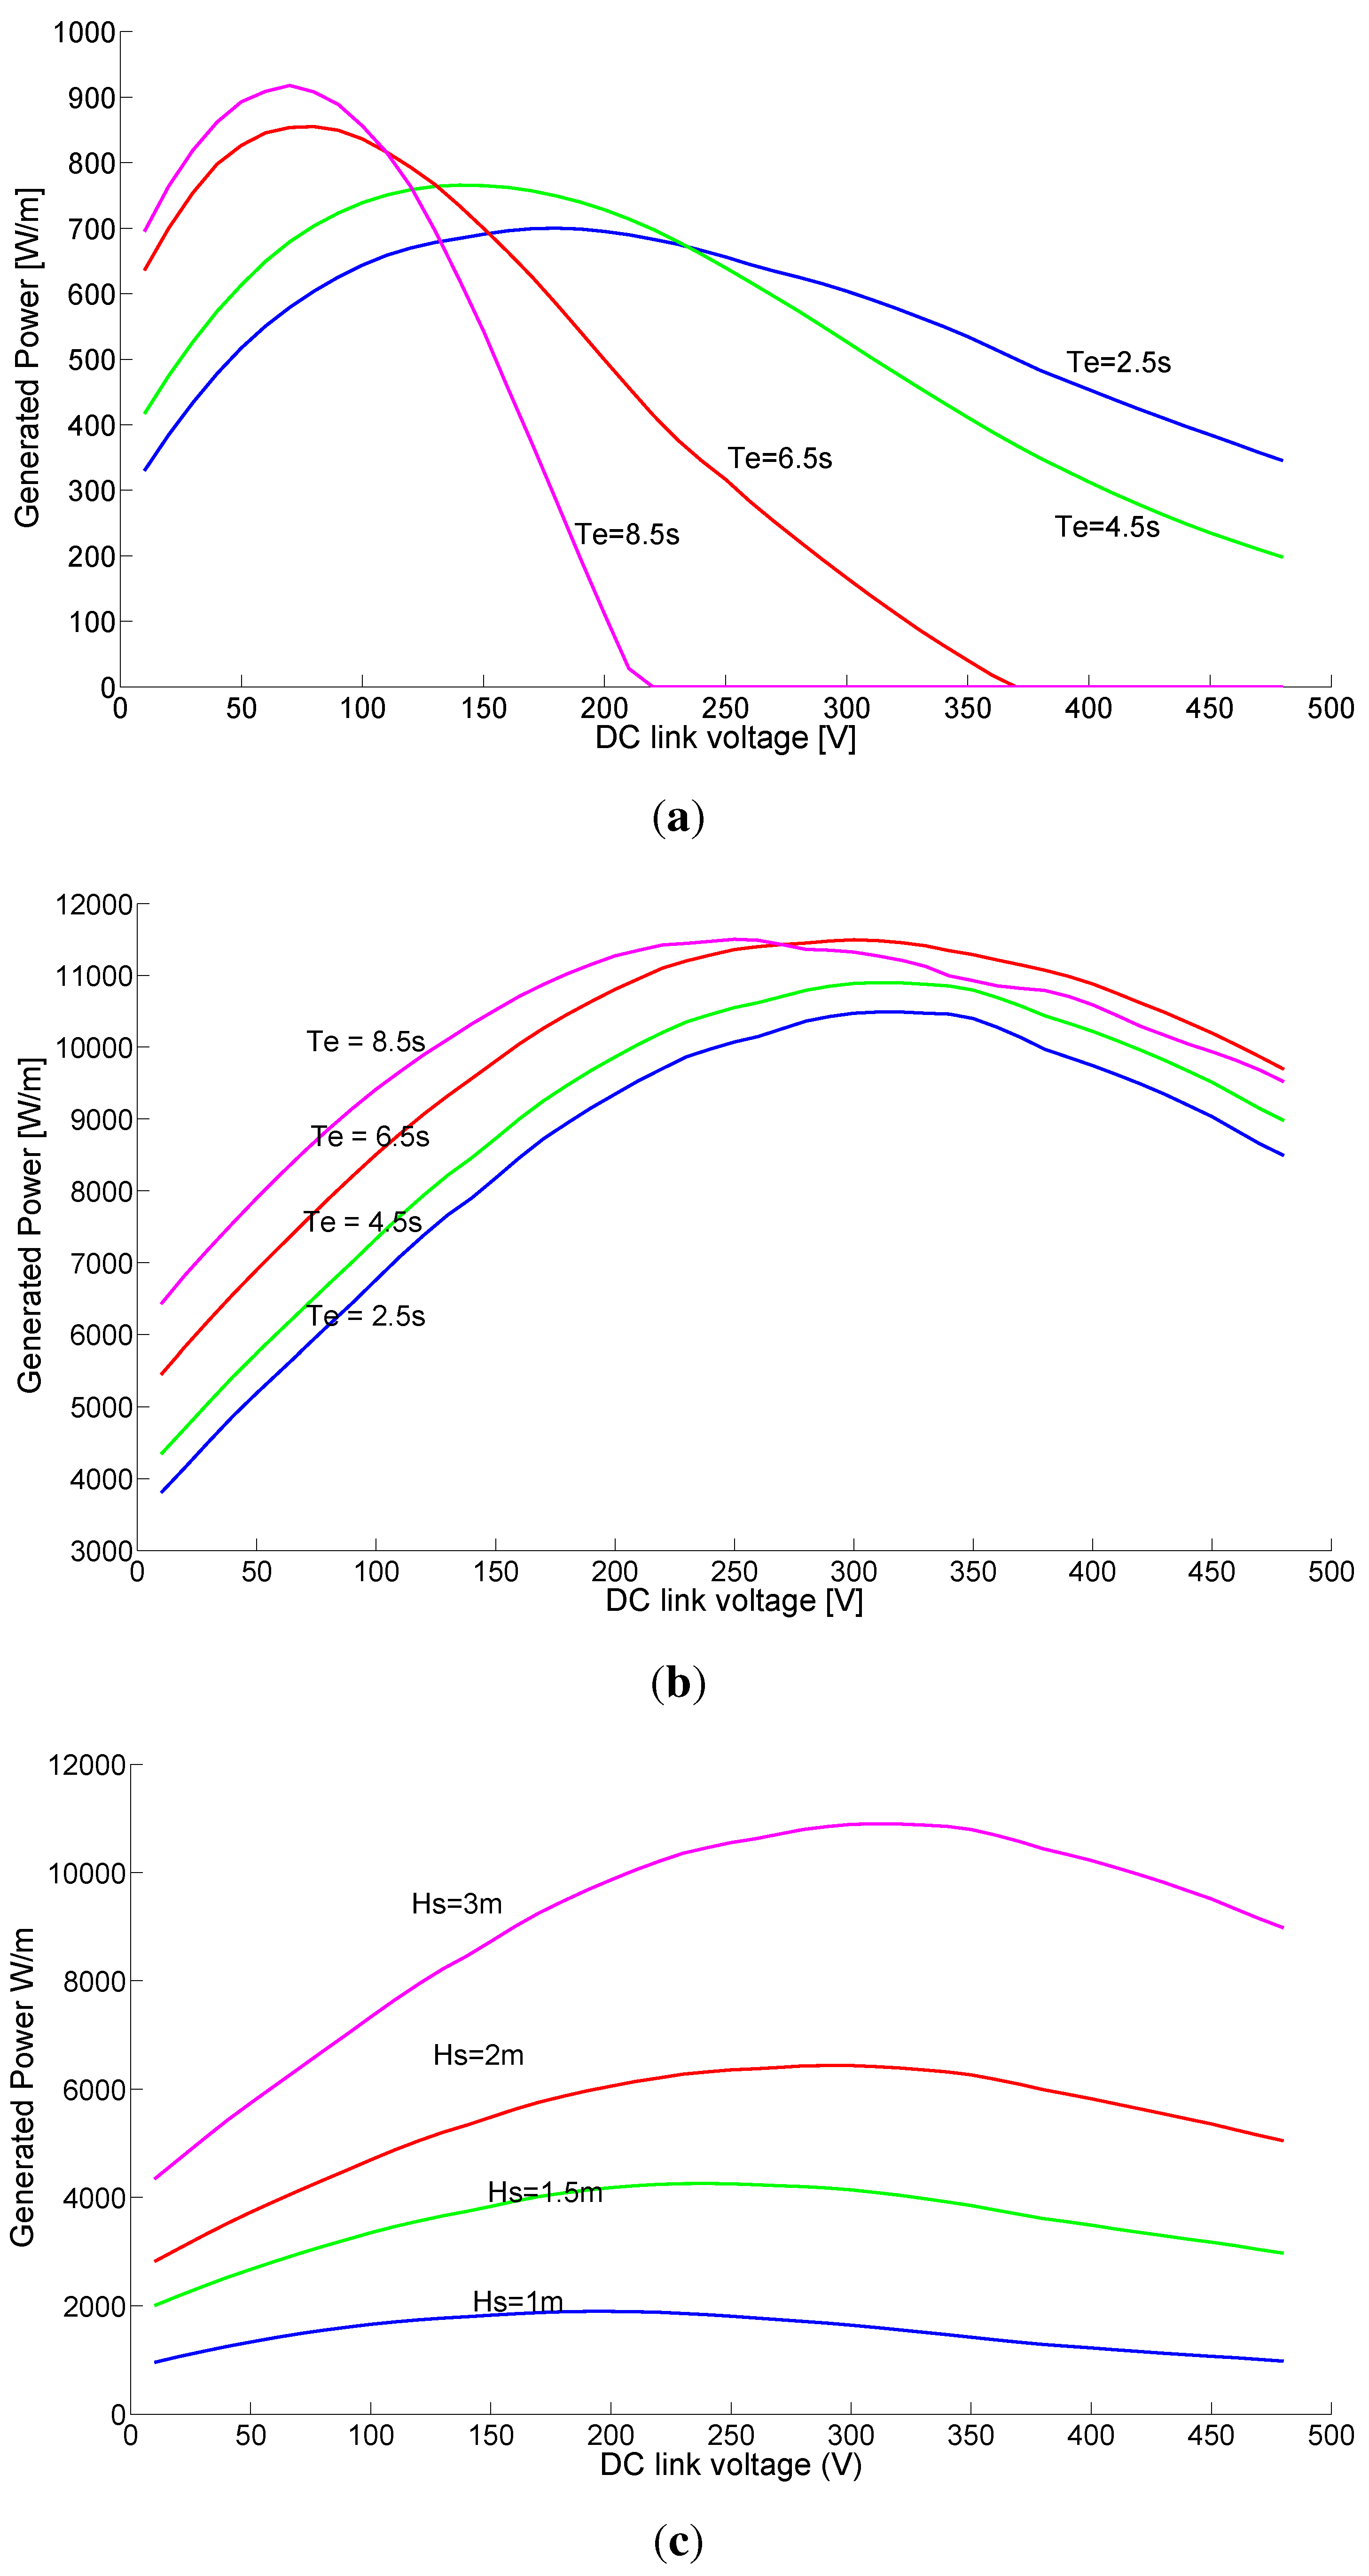
In
Figure 8,
and
have been kept constant one at a time while varying the other, and the generated DC-power was obtained for various values of
.
Figure 8.
Optimal DC-level keeping either or constant. (a) = 0.7 m; (b) = 3.0 m; (c) = 4.5 s; (d) = 6.5 s.
Figure 8.
Optimal DC-level keeping either or constant. (a) = 0.7 m; (b) = 3.0 m; (c) = 4.5 s; (d) = 6.5 s.
In
Figure 8a,
is 0.7 m, which is well within the stroke length of the translator, whereas an
of 3 m in
Figure 8b results in the translator hitting the end-stop of the generator. The variation of
results in a smaller deviation of optimal
for more energetic sea states,
i.e., higher significant wave heights. At
= 3 m, there is a minor increase in power output for higher
since the available wave power increases. However, since the translator will hit the endstop, this increased power cannot be fully absorbed. As
increases, the optimal
decreases slightly. When the translator is allowed to move freely (
< 2 m), the variations in
results in larger changes in the generated output power, as more energy is available in the waves and may now be absorbed by the system. In this case, the optimal DC-level decreases for increased
since the translator velocity decreases as well as the induced voltage. To maintain good damping, the DC-voltage has to be lower.
In
Figure 8c and
Figure 8d,
is kept constant at 4.5 s and 6.5 s respectively while varying
. It is worth observing that the power increases substantially even after the translator hits the end-stop (
> 2m). An increase in
results in a proportional increase in the translator velocity, and thus the induced voltage. This makes the optimal DC-voltage increase, to keep the resistive losses down while maintaining good electrical damping. As was depicted in
Figure 5a, most of the available energy in the sea is available in a diagonal trend,
i.e., with an increase in
and
simultaneously. It was also noted from above how an increase in
results in increased optimal
while an increase in
results in a decrease in optimal
. An obvious conclusion is that the optimal DC-level should not change much within the normal sea states at the Lysekil research site.
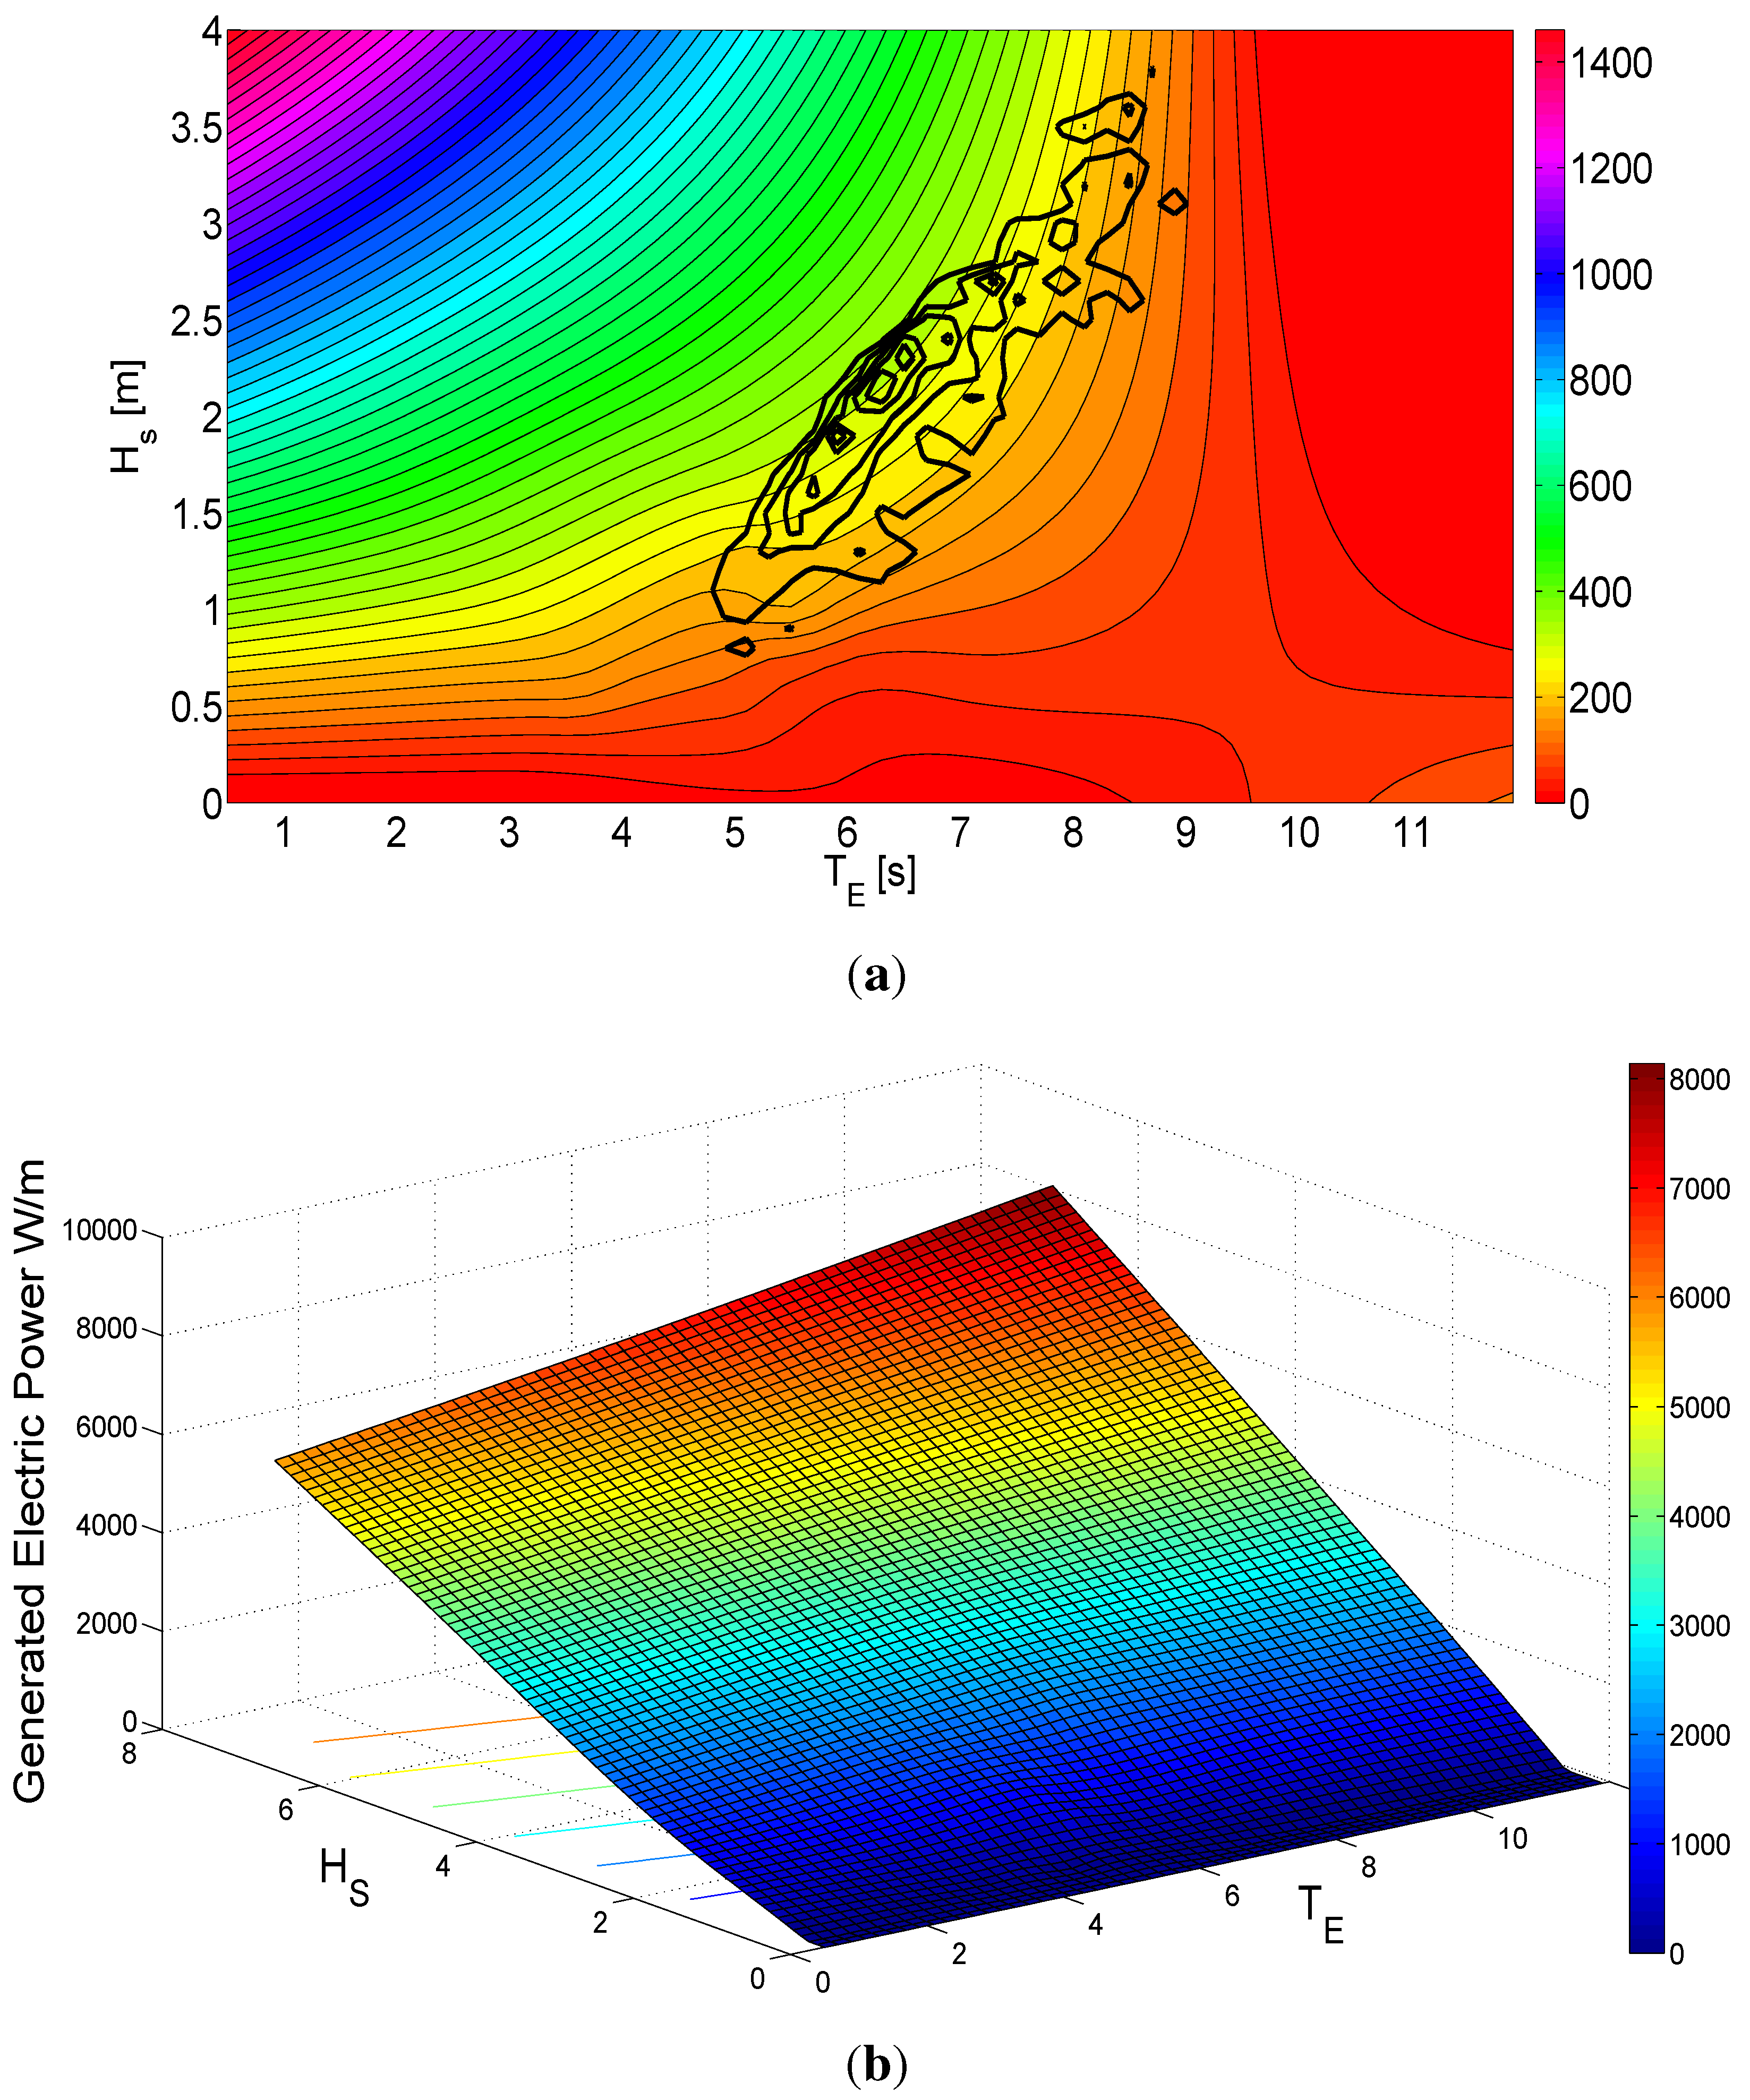
A set of 30 different sea states have been simulated, and their optimal
was obtained for maximum power delivery. In
Figure 9a, an optimal DC-plane has been fitted between the points by using a interpolating surface fit function. Also, the contours of the sea state power plot from
Figure 5a are super-positioned, to match the optimal DC-voltage with the available energy. As concluded above, the value of optimal
does not vary much in the regions of most energetic sea states. It seems that the generally best DC-level is around 250 V for this specific WEC at the given site conditions.
In
Figure 9b, the power output corresponding to the the optimal DC level is displayed, and is steadily increasing with the sea state. It increases faster with
than with
as would be guessed by Equation (
8). However, this only shows the available power at different sea states and does not reflect the occurrence of these occasions.
Figure 9.
Optimal as a function of the sea state parameters. (a) Optimal DC-level and the contours of the available energy; (b) Generated power operating at optimal for the different sea states.
Figure 9.
Optimal as a function of the sea state parameters. (a) Optimal DC-level and the contours of the available energy; (b) Generated power operating at optimal for the different sea states.
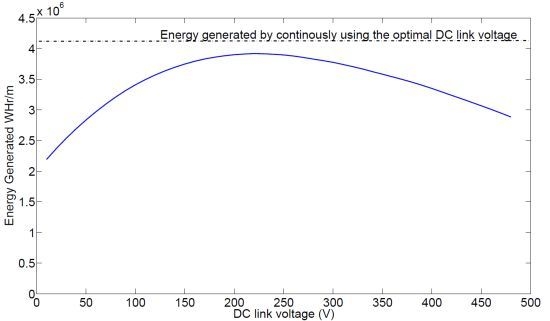
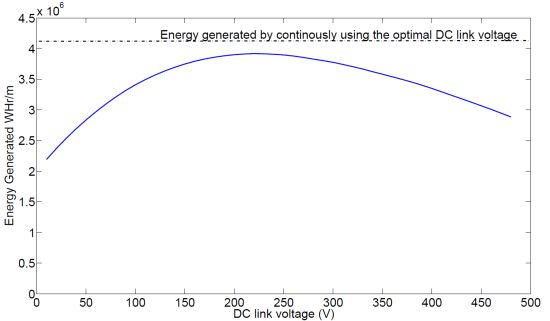
Two strategies of constant DC-level are adopted. In the first, the sea state for every half hour interval is known and the optimal DC-level is selected in accordance with the simulated best value in
Figure 9(a). In the second strategy, the DC-level is kept constant throughout the year. The total energy produced by the WEC is computed by knowing the generated power as a function of
, and the sea state at the site. The results are shown in
Figure 10. The upper line shows the first strategy (independent of the x-axis) and the lower curve shows the energy as a function of selected DC-level. As strategy 1 is optimized, it will always generate the most energy. However, it is interesting to notice that the difference between the two strategies when selecting 250 V is remarkably small, roughly a 10% difference. Part of the explanation for this was shown in
Figure 9a. Also, keeping optimal DC-voltage at the lower sea states has a relatively small effect on the energy output.
Figure 10.
Annual energy variation with different constant DC voltages.
Figure 10.
Annual energy variation with different constant DC voltages.


