Article

Experimental Study of the Feasibility of Air Flooding in an Ultra-Low Permeability Reservoir

1
College of Petroleum Engineering, Northeast Petroleum University, Daqing 163318, China
2
Hainan Fushan Petroleum Exploration and Development Company Limited, Haikou 570100, China
*
Author to whom correspondence should be addressed.
Submission received: 7 August 2016 / Revised: 12 September 2016 / Accepted: 20 September 2016 / Published: 28 September 2016
(This article belongs to the Special Issue Oil and Gas Engineering)

Abstract

:
The development effect of water flooding in an ultra-low permeability reservoir is poor due to its poor physical properties and high shale content, so an experimental study of air flooding which helps to complement energy production was carried out. Based on the Accelerating Rate Calorimeter experimental results, the crude oil of N block in L oilfield can undergo low-temperature oxidation reactions, which are the basic condition for air flooding. Three groups of experimental natural cylinder cores designed for oil displacement, water flooding and air flooding were used respectively, and the relationship between differential pressure, oil recovery, injection capacity with injection volume was investigated. It is observed that the recovery efficiency increased 2.58%, the injection-production pressure difference dropped 60% and the injection capability increased 60% in the experiment of shifting air flooding after water flooding to 75% moisture content, compared with water flooding alone. It has been shown in the results that the recovery efficiency improved sharply more than water flooding, the effect of depressurization and augmented injection was obvious, and the air displacement was thus validated. We suggest that other science and technology workers should perform further tests and verify this result through numerical simulation.

1. Introduction

The proven reserves found low and ultra-low permeability reservoirs in China account for a large proportion of the available oil and in recent years, water injection has been developed for low and extra-low permeability oil reservoirs, but it generally shows poor effects [1,2]. Many studies show that gas (including air, nitrogen, carbon dioxide, etc.) injection is an effective method to improve the development efficiency of low and extra-low permeability reservoirs [3,4,5,6,7], which can establish a valid driving force better than water injection. Less often considered is that most CO2 used for enhanced oil recovery (EOR) is never recovered, but is actually stored in the reservoir permanently; this long-term sequestration helps offset the greenhouse gas (GHG) emissions from burning fossil fuels [8,9,10]. In practice CO2 flooding cannot be carried out because of the air supply, scaling and corrosion of pipelines. N2 flooding gets more oil under the circumstances of a larger volume coefficient the same as the other gas injection volume. N2 has high compressibility and expansibility, but the preparation and transport of N2 are expensive. Air injection is more worthy of application because it is an abundant resource and low-cost [11,12], so air injection is expected to become one of the most preferred techniques in the future.
Air displacement is mainly divided into low-temperature oxidation (LTO) and high-temperature oxidation (HTO) In-Situ combustion (ISC) is mainly used for heavy oil reservoirs, as its theory, including dry combustion and wet combustion, is complex. The preferred mechanism is HTO, whereby the heavy ingredients of crude oil such as coke are used as fuels, and the heating decreases the viscosity of crude oil to enhance the oil recovery. The use of horizontal wells for ISC to shorten the displacement distance, which is called the Toe-To-Heel Air Injection process (THAI) is also established, but the method is not adaptable to the target block due to the high cost of drilling horizontal wells. The target block usable for air flooding has thin oil, well trapped good and with a small inclination angle, and the main mechanism is LTO which can reduce oil viscosity, producing complementary energy to enhance oil recovery. Field testing of air flooding has been performed in the Yanchang oilfield, but the effect was not good because of the cross flow of low permeability fractured reservoirs. N block of L oilfield in the Bohai Bay basin on the other hand is an extra-low permeability sandstone reservoir without cracks. As the mechanism of air flooding is not only complex, but also has a certain operational risk, an experimental study has now been been conducted to study the feasibility of air displacement [13,14].

2. Experimental Design

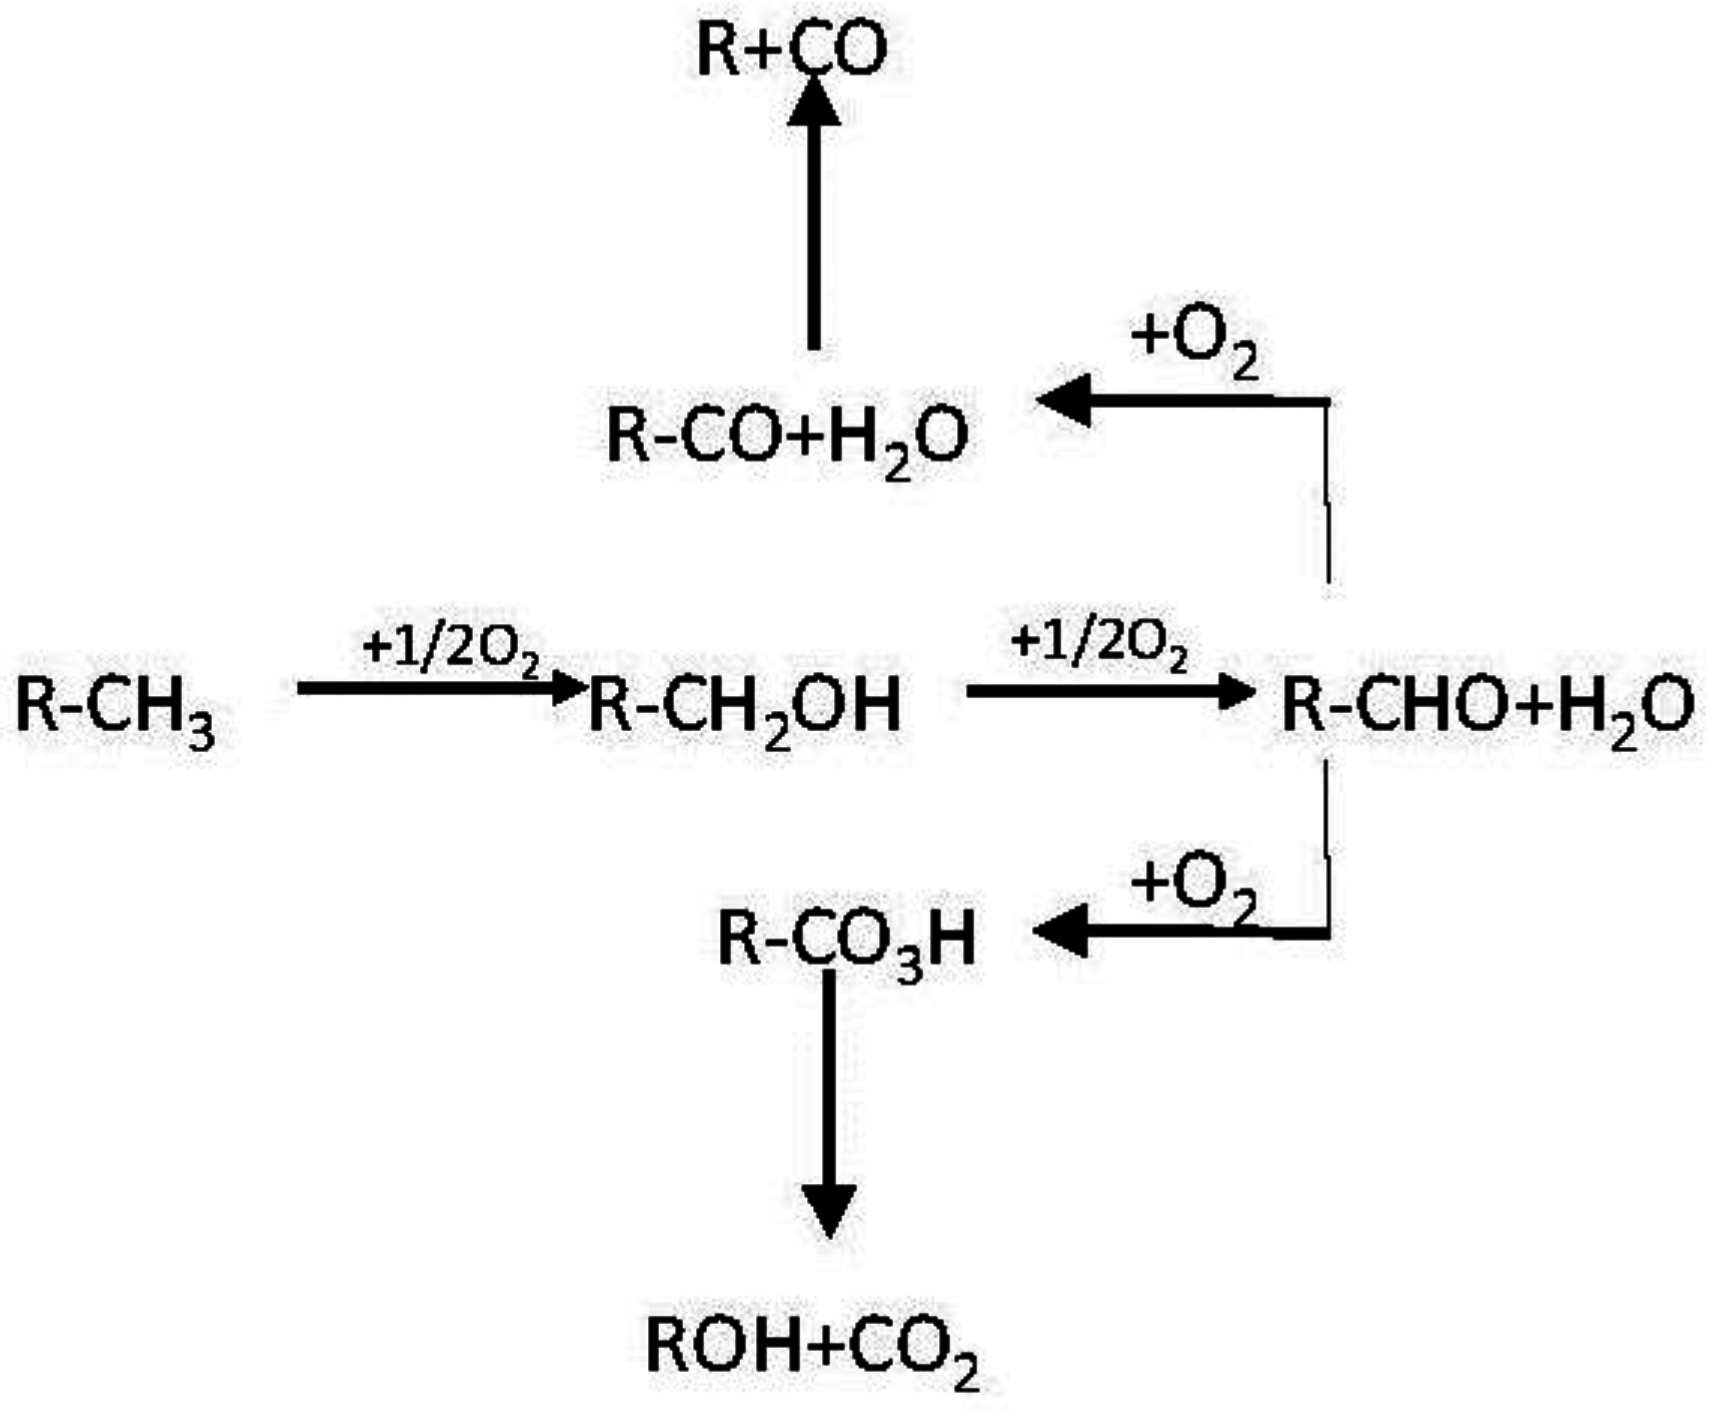
2.1. Low Temperature Oxidation Kinetics Experiment

An Accelerating Rate Calorimeter (ARC) is the instrument used for screening suitable conditions for injecting air into the reservoir. Under adiabatic conditions, by means of heating-waiting-retrieving-tracking, then detecting the rate of increase of the instrument’s internal temperature and evaluating the possibility of spontaneous combustion of crude oil under certain pressure, we can get the crude oil oxidation kinetic parameters (heat of reaction, activation energy, reaction series), determining the reaction type [15,16,17]. The experimental conditions were as follows: M calorimetric ball, 13.781 g; M sample, 3.2 g (oil 1.5 g + particulate cores 1.5 g + water 0.2 g); Cp calorimetric ball, 0.42 J/g, K); initial search temperature 50 °C; stop search temperature 350 °C; search step 10 °C. The chemical reaction equations of low temperature oxidation are shown in Figure 1.

2.2. Oil Displacement Experiment

Contrastive studies of the displacement efficiency between water and gas displacement have undertaken in the N block of L oilfield in the Bohai Bay basin [18,19,20,21,22]. The block has been exposed to water flooding, thus two types of experiments were performed: direct water flooding and gas driving after water flooding, in order to get in line with the actual situation. Typical cores from producing wells were selected, and a series of three oil displacement experiments were designed for comparing the recovery ratio and injection capacity between the two types of displacement.

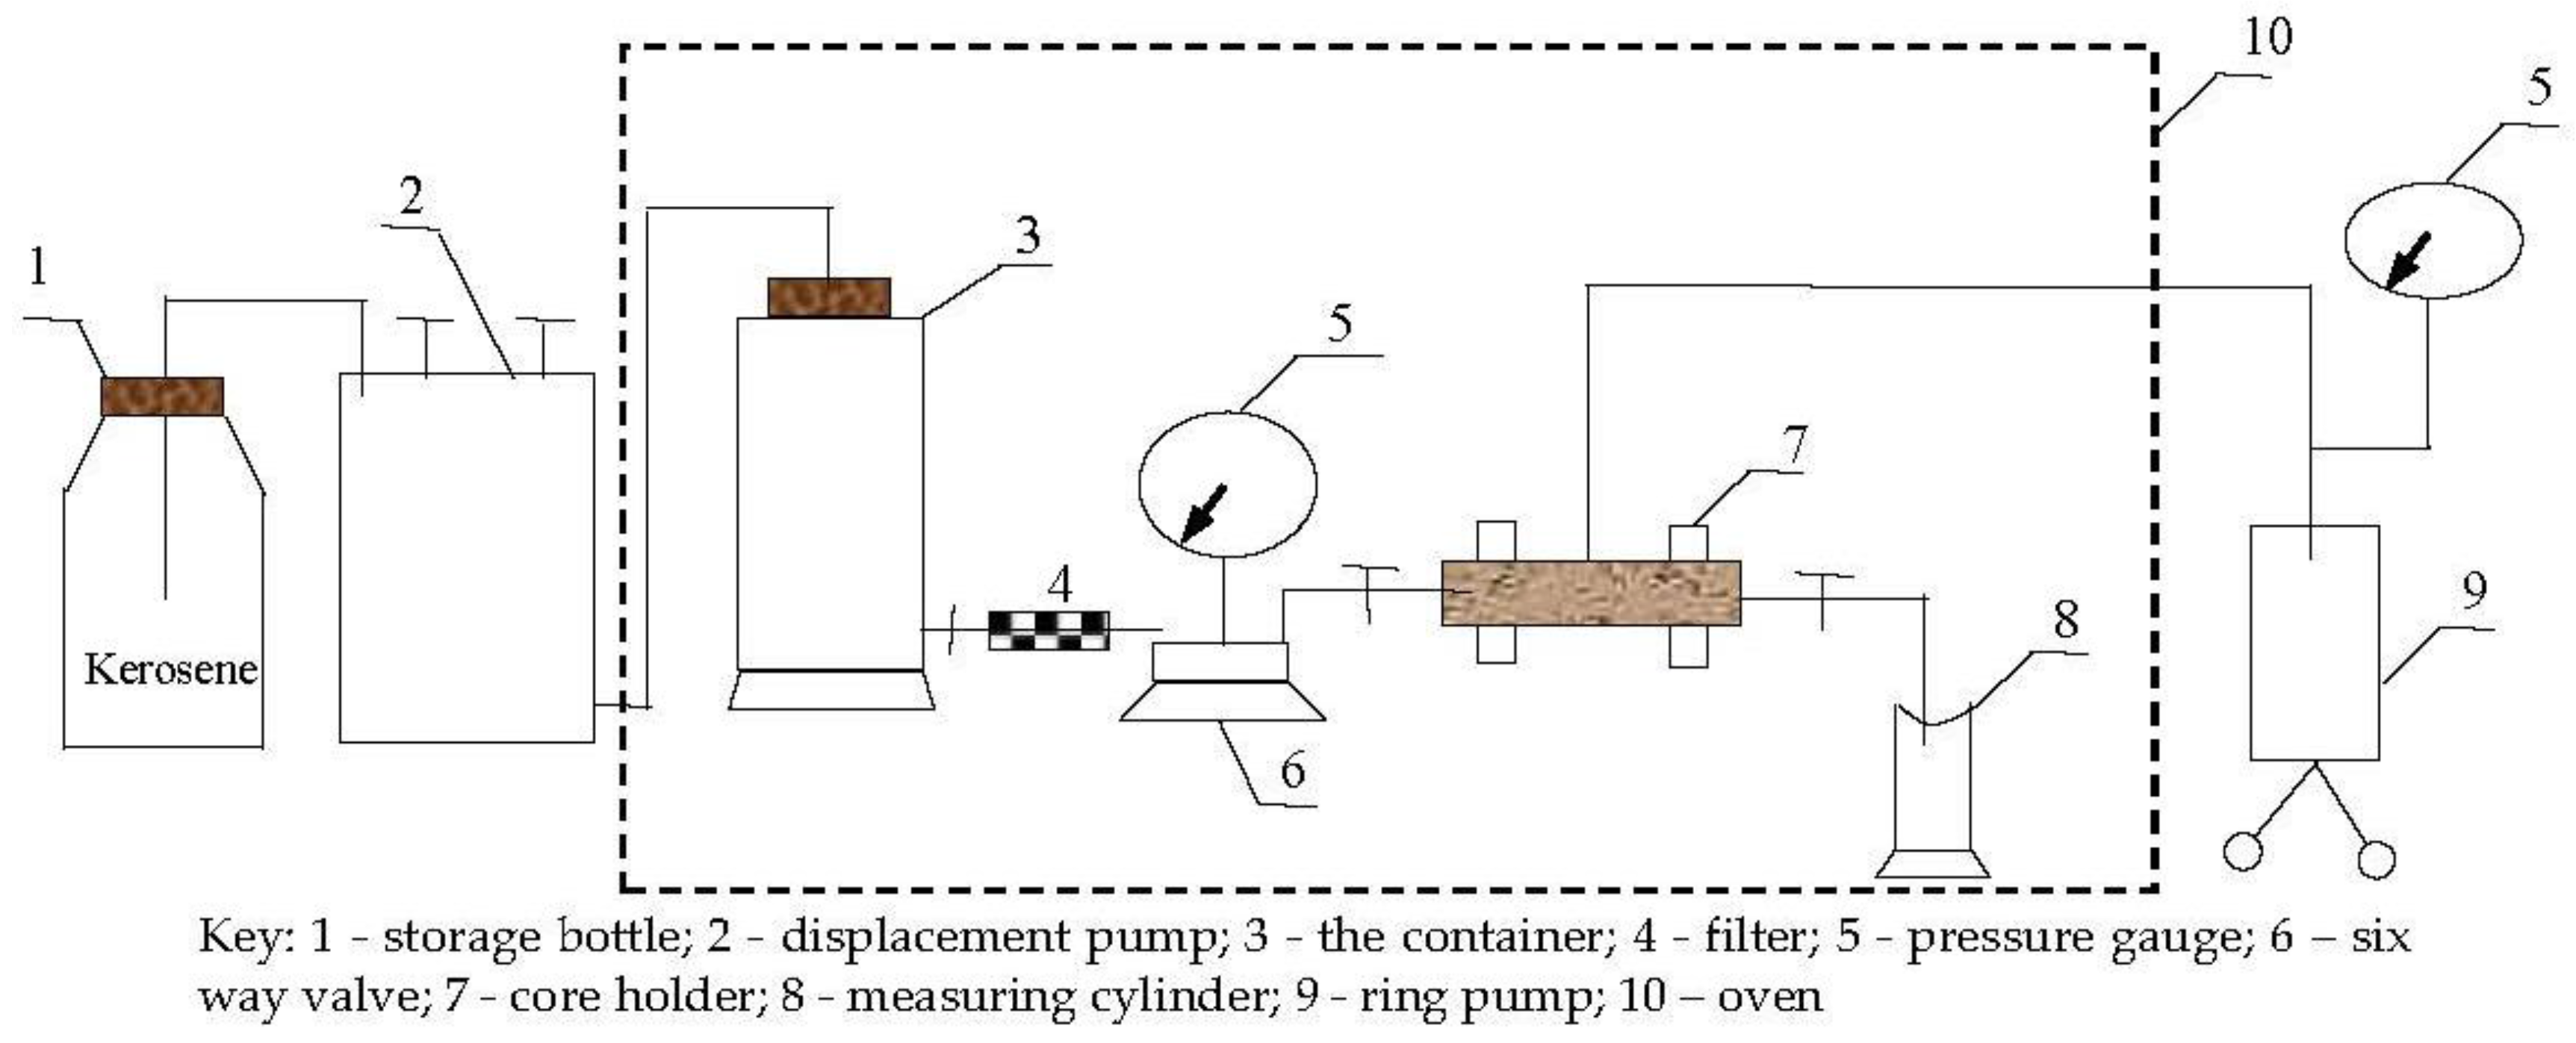
2.2.1. Experimental Setup

The average depth of the target block is 3100 m, spacing is 3100 m, the average permeability is 1 × 10⁻³ μm2, the average oil viscosity is 2.79 mPa·s, the well spacing method is an inverted nine-spot pattern, the combined water cut is 75% at present, and as the moisture content increases, the pressure of the water wells rises quickly, the stage injection-production ratio is 0.6, and the formation energy decreased rapidly. Based on the observation of cores from inspection wells, due to the strong water sensitivity, clay expansion reduces the reservoir permeability, so gas injection is the best choice. The whole experiment was designed according to the similarity principle to simulate the reservoir.
Gas channeling can easily form because of the high permeability of gas compared with the oil and water phases. The gravity stabilization method, water/air alternate injection, air foam flooding and other ways of flooding are used in the oilfield. Considering the limited laboratory conditions, the experimental model was designed to satisfy the following conditions: first, the model is long enough, so an oxidation zone, mixed regions and oil zone can be formed after multi-level contacting; second, enough reactant is used to ensure that complete oxygen consumption happens before reaching the flue gas outlet; third, the sweep efficiency should increase along with the injection volume and amount of solvent injected; fourth, the core holding is roughed to reduce the breakthrough of injected fluid from the tube wall and improve the sweep efficiency [23]. The experimental apparatus is shown in Figure 2.

2.2.2. Experimental Conditions

Experimental reagents, including distilled water, NaCl, CaCl2, MgCl2, kerosene, crude oil, air, water injection, were used etc. The cores should be long enough and not suffer damage during drilling. The basic physical parameters of the cores such as the permeability (K), porosity (Φ), core length (L) and diameter (d) of the samples were tested after grinding, washing and drying and are listed in Table 1. The test results show that the samples have ultra-low permeability.
The experimental displacement oil sample is simulate the crude oil from the production well has an oil formation temperature of 78.0 °C, formation pressure is 29.0 MPa, the saturation pressure is 18.0 MPa, dissolved gas ratio 450.0, and crude oil viscosity is 2.79 mPa·s.
Experimental formation water and injected water are based on water analysis data of samples from oilfield block N, oilfield L. The block formation water contains sodium bicarbonate (NaHCO3), the total salinity has an average of 5112.42 mg/L, which includes high levels of cations like Na+ and K+, while the Mg2+ ion content is relatively low. A relatively high content of anions like HCO3, while SO42− ion content is relatively low. The details are listed in Table 2. The volume fraction of oxygen of the injection air is 21%.

2.2.3. Experimental Procedures

The experiment is divided into eight steps.
(1)
The air permeability of the natural core is determined after oil extraction, washing, drying, packaging the core in plastic, connecting it with the core model, and connecting the back pressure controller to the outlet end of core. The porosity is determined after formation water saturation.
(2)
Formation water is prepared, the cores are saturated with water, and the water permeability calculated.
(3)
Oil is injected into the core which is saturated with water, creating oil flooding water, until there no water comes out of the core outlet, and the irreducible water saturation is calculated.
(4)
Water is injected into the core 15 for water flooding until no oil flows out. The amount of oil flooding by water, the amount of injection water needed for the flooding process, and the residual oil saturation, recovery efficiency and ultimate recovery can be calculated.
(5)
Core 15 should be oil saturated with irreducible water. Repeat step (3), to calculate the irreducible water saturation.
(6)
Inject water into core 15 for water flooding until the water cut of the outlet reaches 75%, which is the average water cut of the block. Adjust the gas pressure to the displacement pressure, inject air into the core for the oil displacement experiments until no oil flows out, calculating the amount of oil and injected air.
(7)
Repeat steps (1)~(4) to calculate the residual oil saturation, recovery efficiency and ultimate recovery with core 31.
(8)
Repeat steps (1)~(3), (6), measuring the oil and gas volume and injected gas volume and calculate the recovery efficiency with core 32.

3. Results and Discussion

3.1. Test Conclusions

The initial exothermal temperature was 200 °C; adiabatic temperature rise >136 °C; maximum heating rate 0.11 °C/min; correction coefficient is 2.24; activation energy 87.577 kJ/mol. Refer to the former factor 1.54 × 10⁸ s−1; reaction series is 0.97. The adiabatic oxidation process temperature–time profile is shown in Figure 3. As shown in the figure, the current block formation of crude oil, particulate cores and water mixture can happen with the air oxidation reaction in low temperature. At the reservoir temperature, the low temperature oxidation reaction is very slow, less than the rate of diffusion of oxygen into the oil.
The speed can be lower when there are no sands, suggesting that the reaction occurs on the surface of the sand, or when the oil and gas interface is fairly small, and the reaction is controlled by the diffusion.

3.2. The Experimental Results and Analysis

There are three groups of oil displacement experiments. The first set of experiments used core 15 for water flooding only, followed by gas flooding after the water flooding experiment; the second set of experiments used core 31 for water flooding; the third set of experiments used core 32 for gas flooding after a water flooding experiment. The current N block water cut is about 75%, so in order to make the experiment more in line with the reality, the water drive was changed to gas drive as the outlet water cut reached up to 75%.

3.2.1. The First Set of Experiments

For the first set of experiments with core 15, the physical parameters of the core are shown in Table 3.
The core was drilled from the 12–16 Well of L oilfield N block. μw is the injected water viscosity, Ka is the permeability, φ is the porosity, T is the experimental temperature, γd the is ratio of formation water, KW is the water phase permeability, γW is the ratio of injected water and formation water, μd is brine viscosity, L is the core length, k is the water-free oil recovery, the S w i is the irreducible water saturation, D is the diameter, s o r is residual oil saturation, K w is the water phase permeability in the residual oil saturation, η is the ultimate oil displacement efficiency of water flooding, V is the pore volume, vw s the water injection rate, Qo is the oil saturation, μ o is the oil viscosity, A is the cross-sectional area, and p w o is the differential pressure at the end of the water displacement.

(a) Permeability to Water

Core 15 is saturated by formation water and Kw was measured. The experimental results are shown in Table 4, where ta is the time interval, v is the injection rate, ta is the cumulative injection time, the Q is the cumulative injection volume, and p is the differential pressure. During the experimental process, the pressure rose slowly, but as the injection time was extended, the pressure rose with a very slight increases, which shows that there are changes in the pore structure of the core, such as jams caused by clay swelling and particle movement, etc.

(b) Water Flooding Recovery

The core was saturated with oil and the core irreducible water saturation was measured. It takes 75 min for the oil to come out of the outlet and after 195 min the core is saturated with oil. In the oil saturation process, the irreducible water saturation is 42.65%. The detailed experimental data is shown in Table 5, Q w is the accumulated water production rate.
The water flooding experiment was carried out after saturating with oil, and the recovery efficiency of water flooding was determined. In the water flooding process, it took 8 min for the water to break through, and the measured water-free oil recovery was 36.23%. It takes 565 min to the end of water flooding with an ultimate recovery of 56.52%, a residual oil saturation of 24.93% and the water phase permeability is 0.0807 × 10⁻³ μm2 under Sor conditions. The experimental results are shown in Table 6 and Figure 4 and Figure 5, where Qo is the cumulative oil production.
The injection pressure of core 15 during water flooding shows a small fluctuation before rising during the water flooding recovery efficiency experiments, rather than the decreasing pressure seen in general water flooding. The phenomenon illustrates that internal pore blockage happened, which is because of the high content of clay expanding after meeting the water. Generally, the pressure would rise if the open water injection method were adopted, especially in the cores of this block.
The differential pressure between production and injection increased rapidly as the injection volume increased, with the growth slowing down gradually after 0.5 PV, and the differential pressure stayed above 3.5 MPa and rose slowly. After 1.5 PV injection, the injection capacity began to flatten, and the injection capacity trended slightly down due to the low permeability of the clay minerals of the core.

(c) Oil Saturation Experiment Again

Because the structure of core 15 changed after water flooding, the saturated oil pressure is significantly higher than the saturated oil pressure the first time. Due to the decrease of flowing pore volume, the amount of saturated oil was significantly less than the first time, which was high in bound water. The oil measured content was 1.77 mL in the core, and the irreducible water saturation is 50.97%. Specific experimental data are shown in Table 7. The experimental purpose is re-saturate the oil with oil, irreducible water, oil content within the core is 1.77 mL, the irreducible water saturation s w i   is 50.97%.

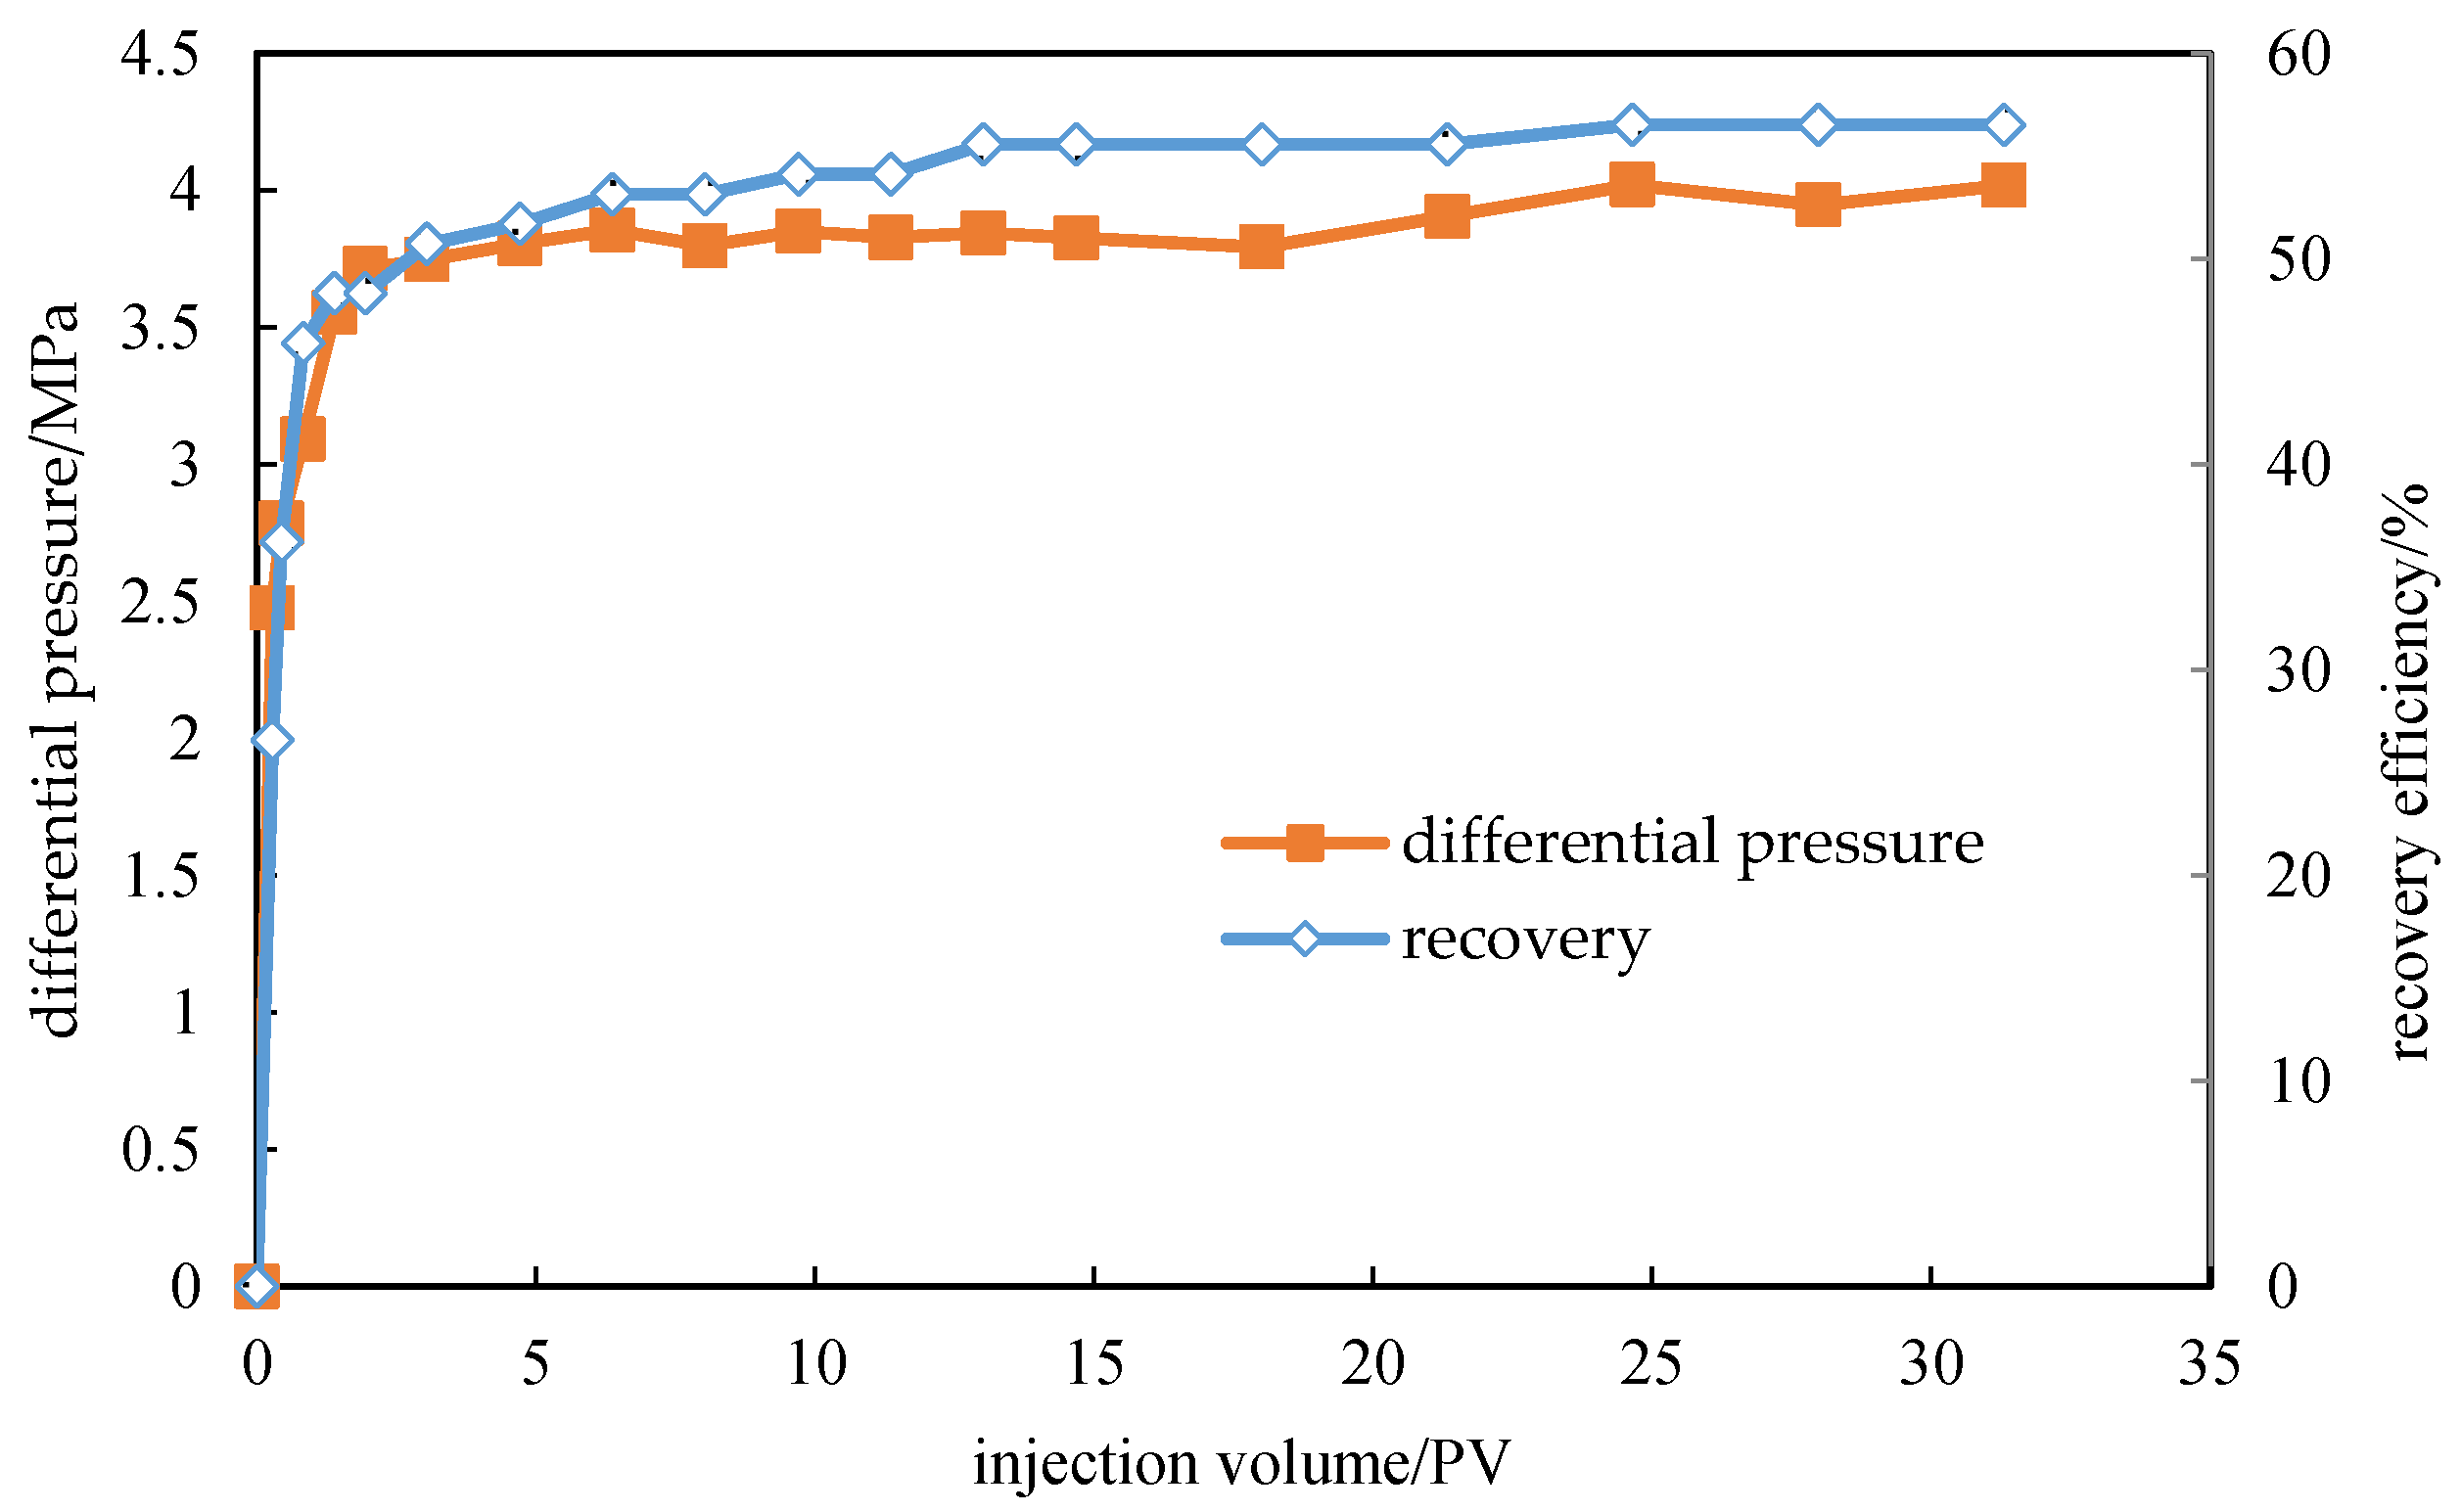
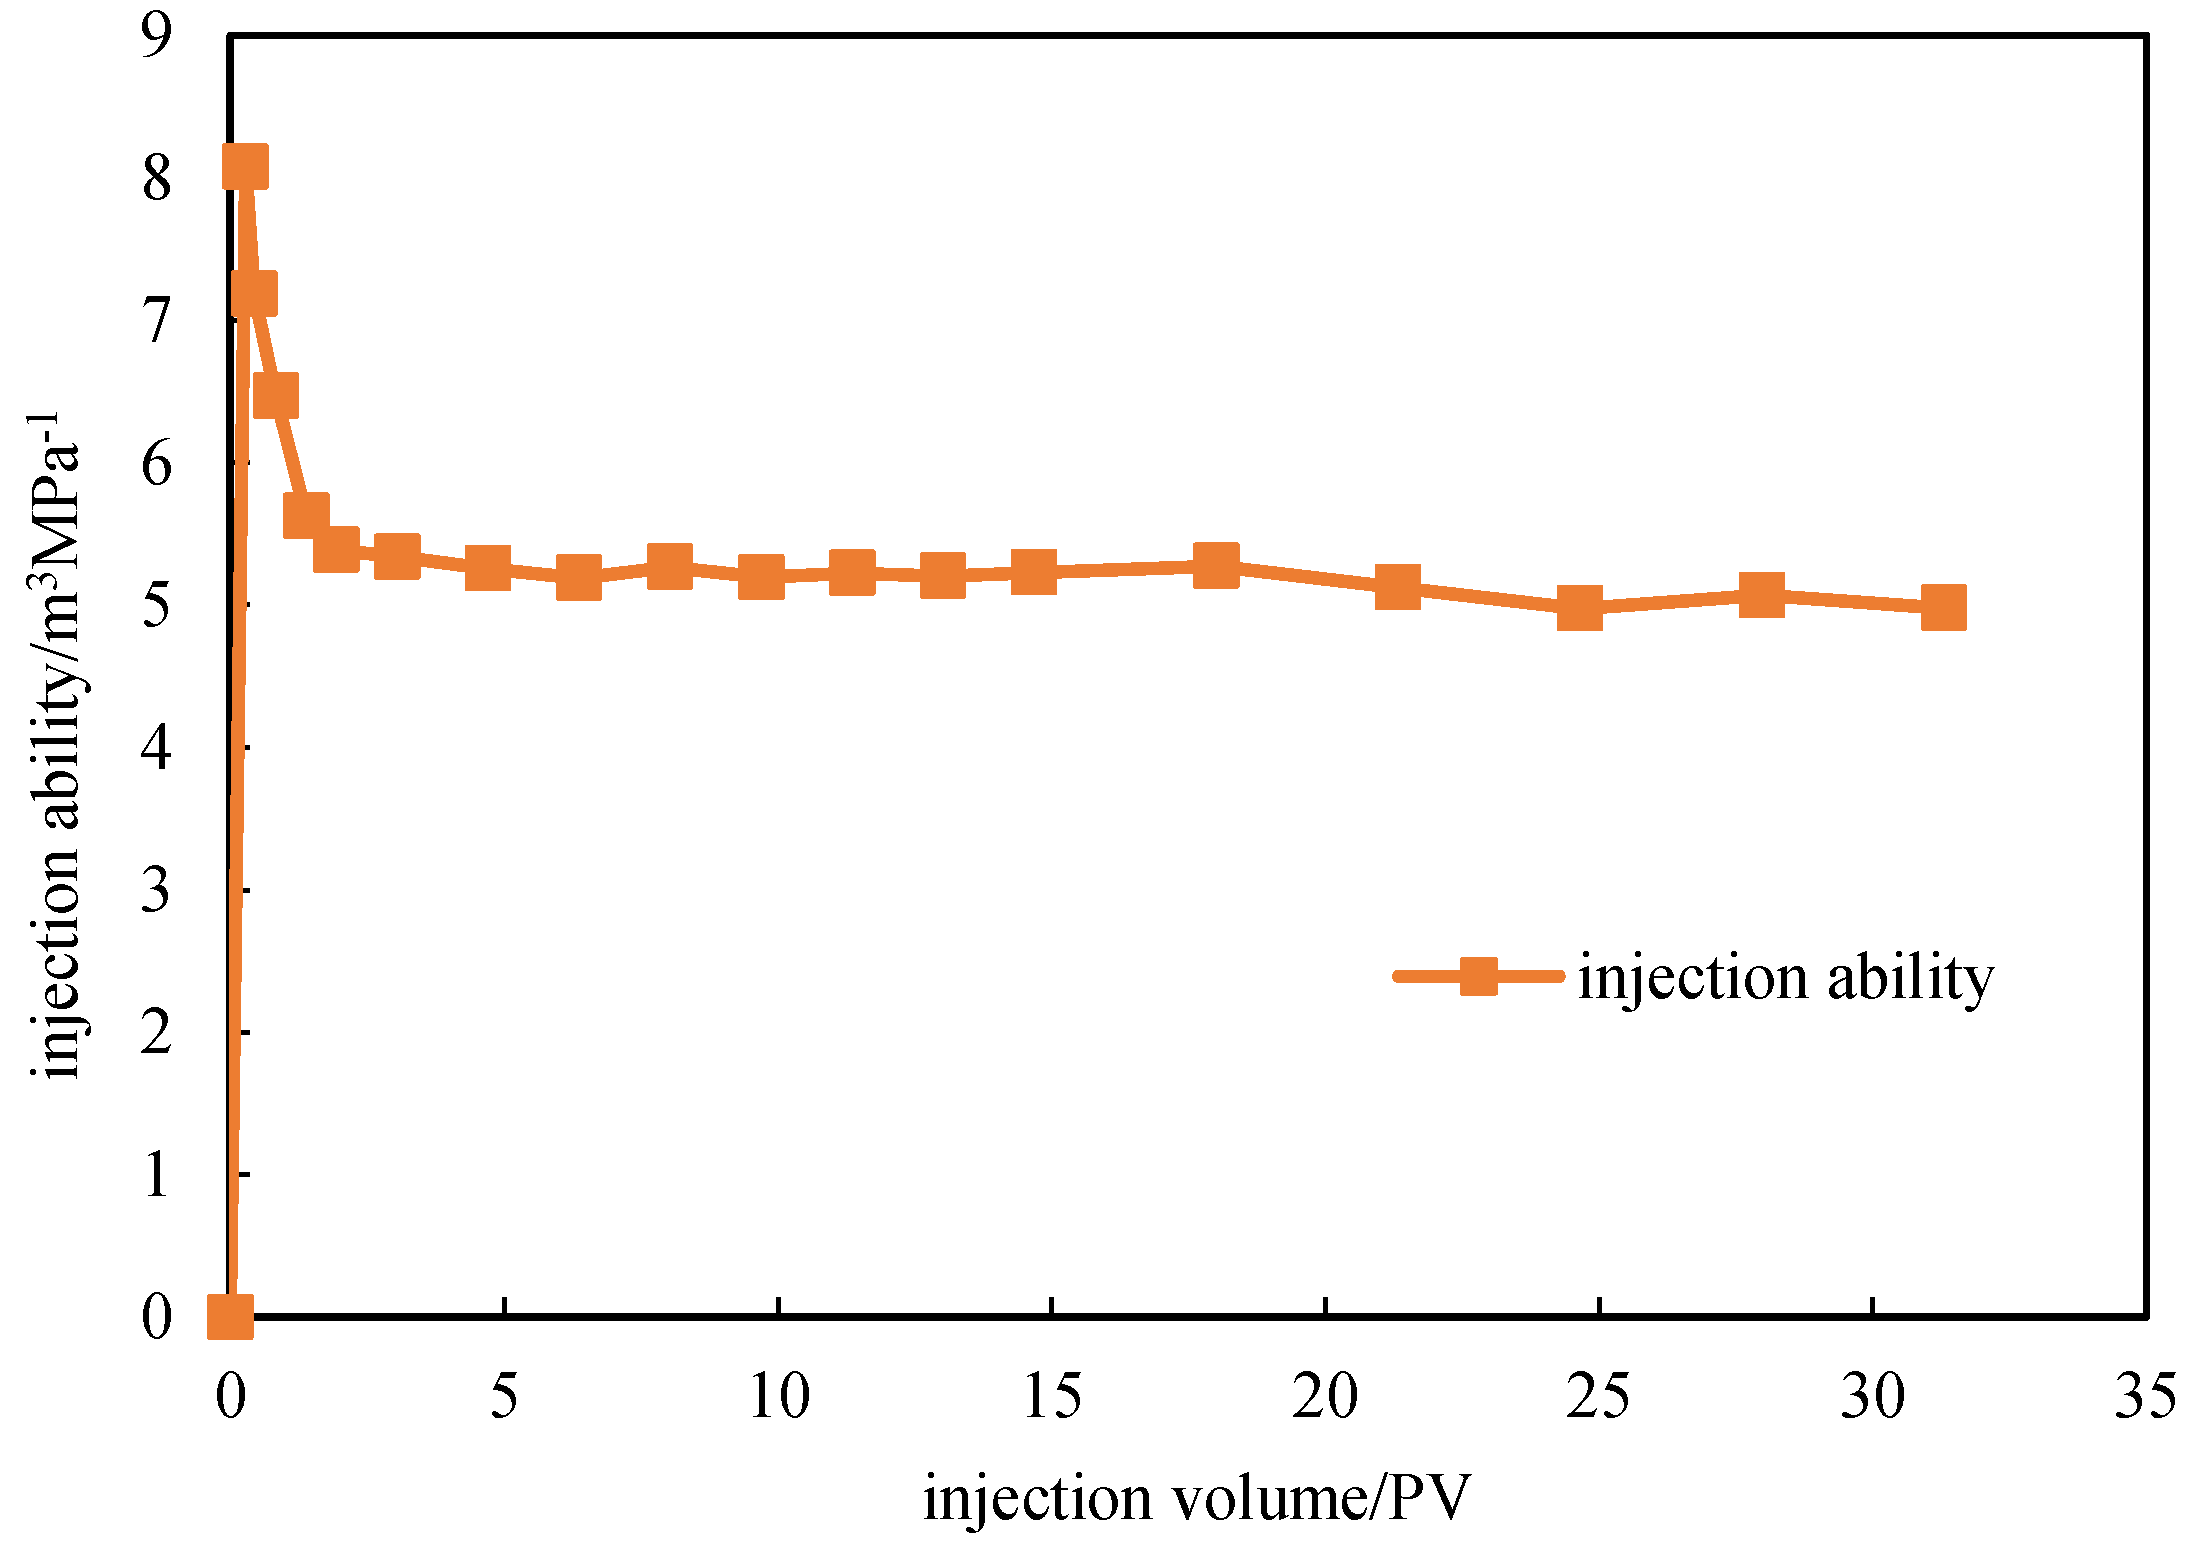
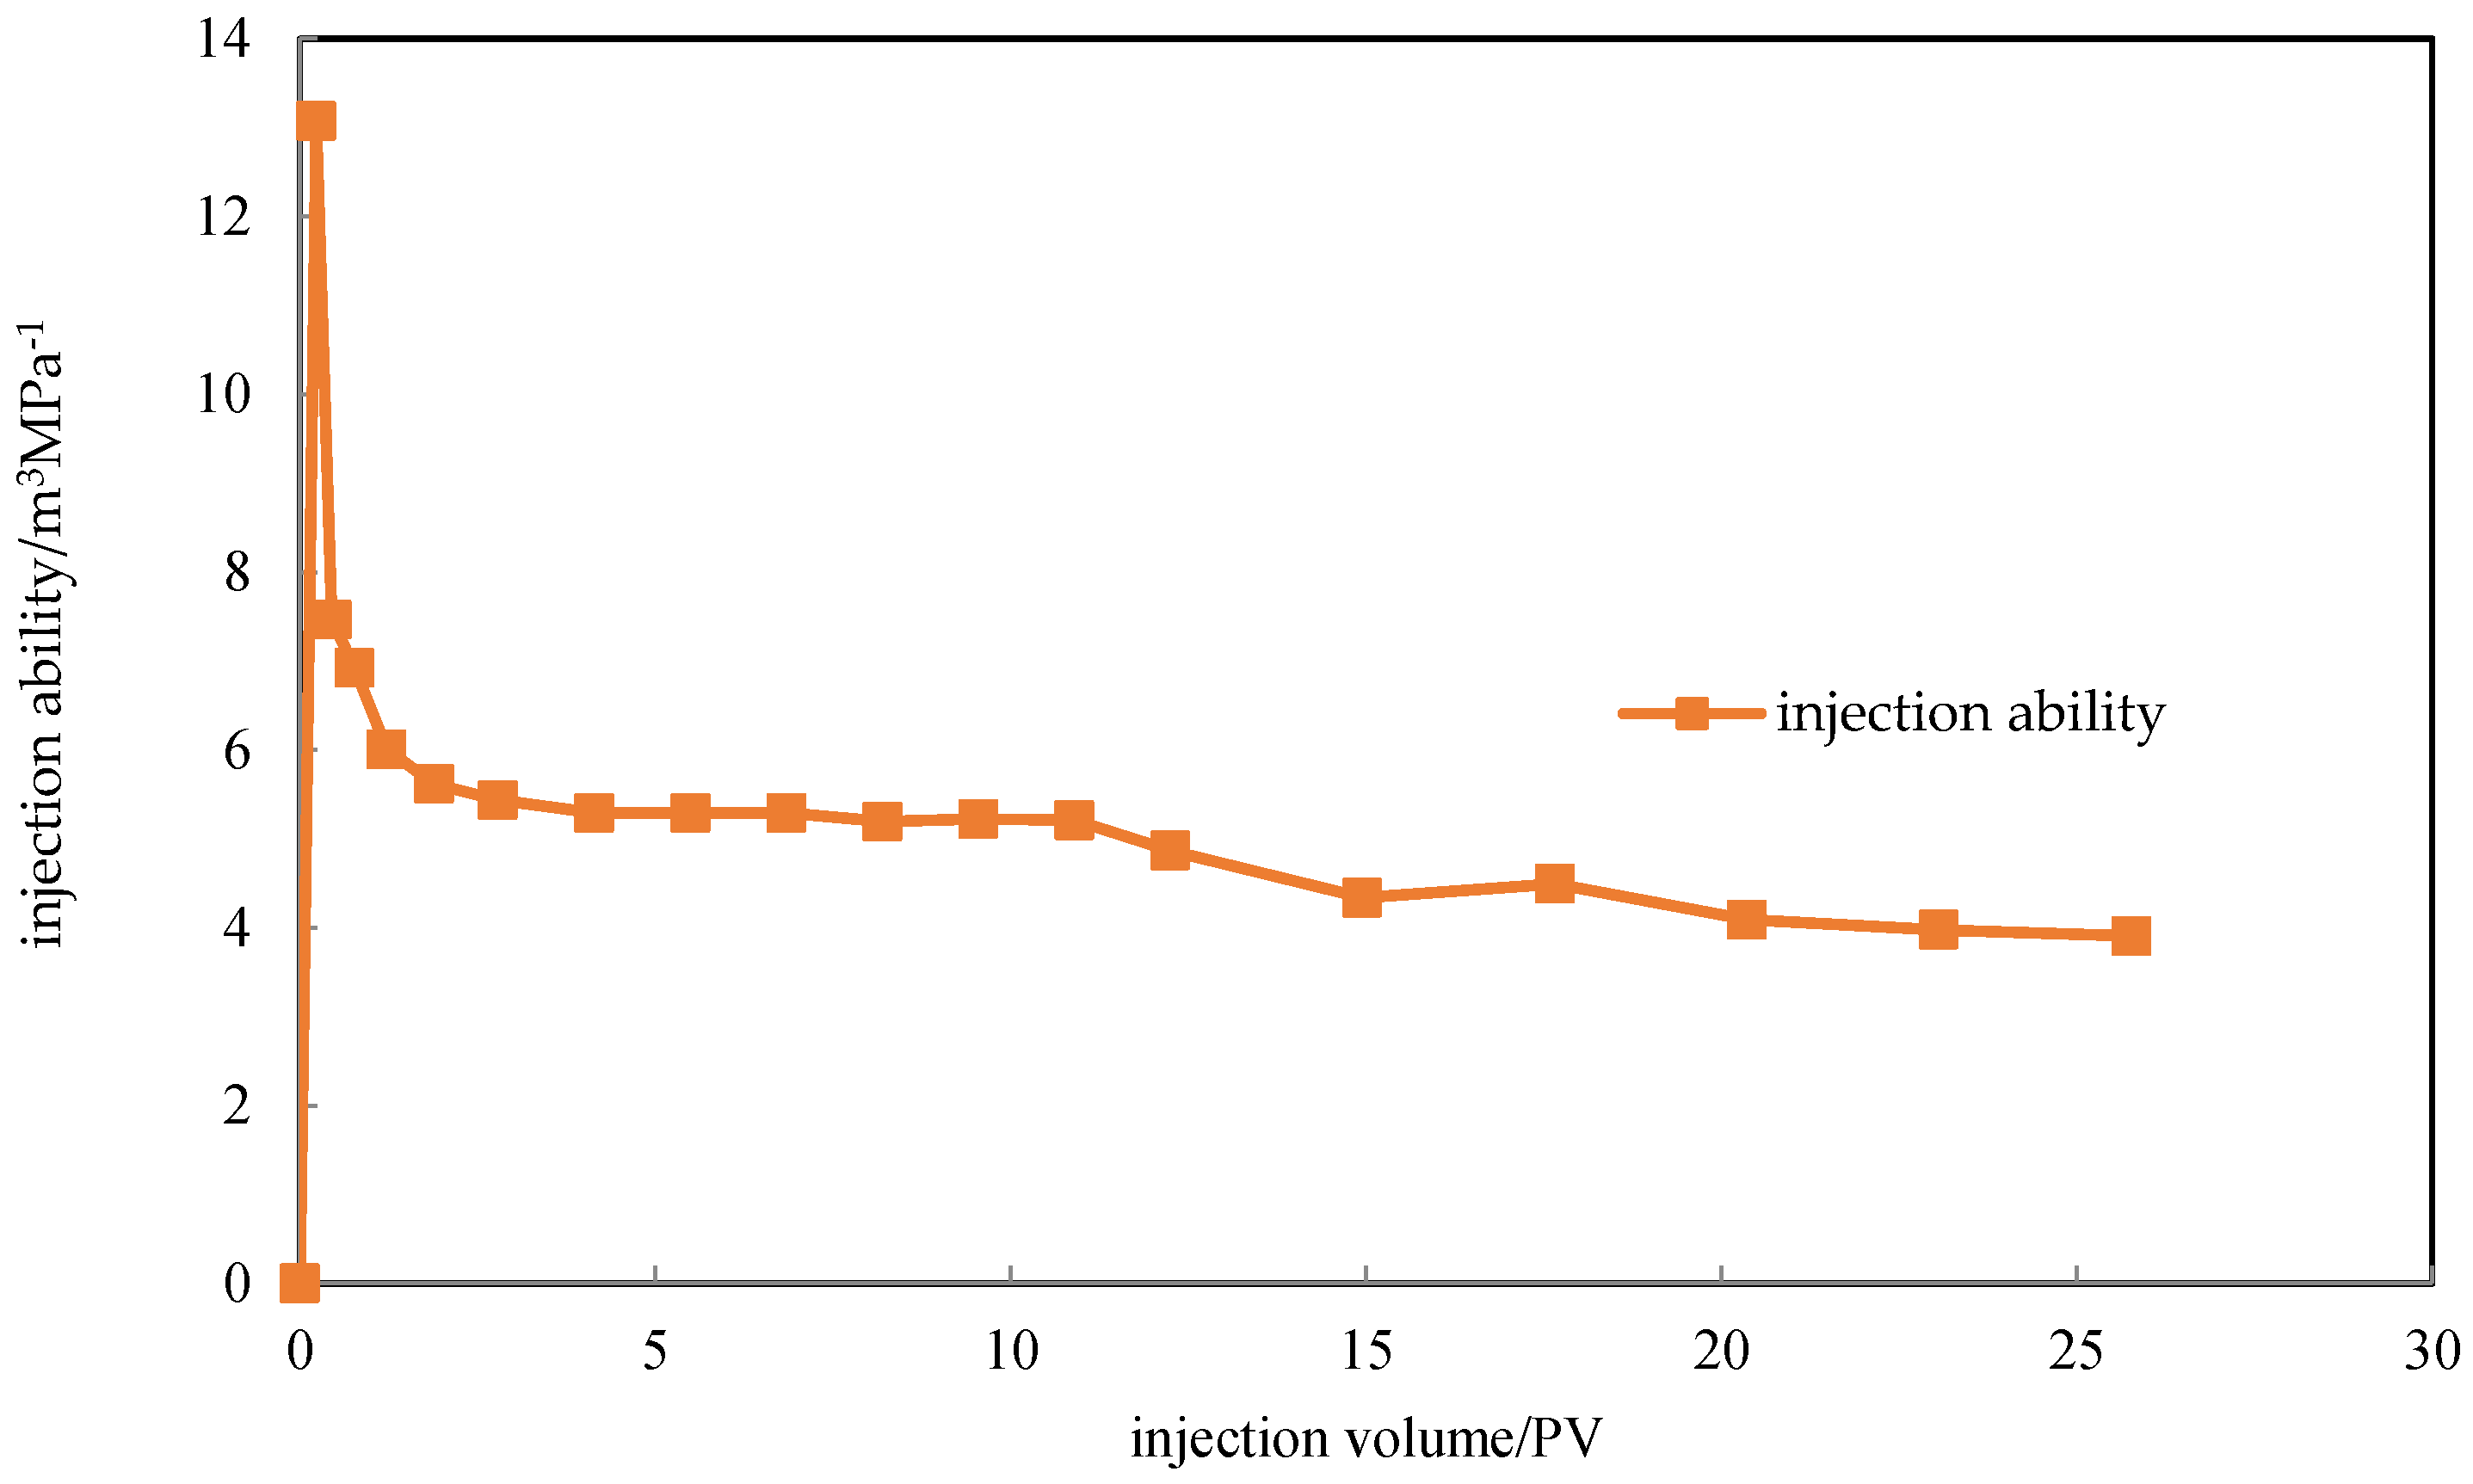
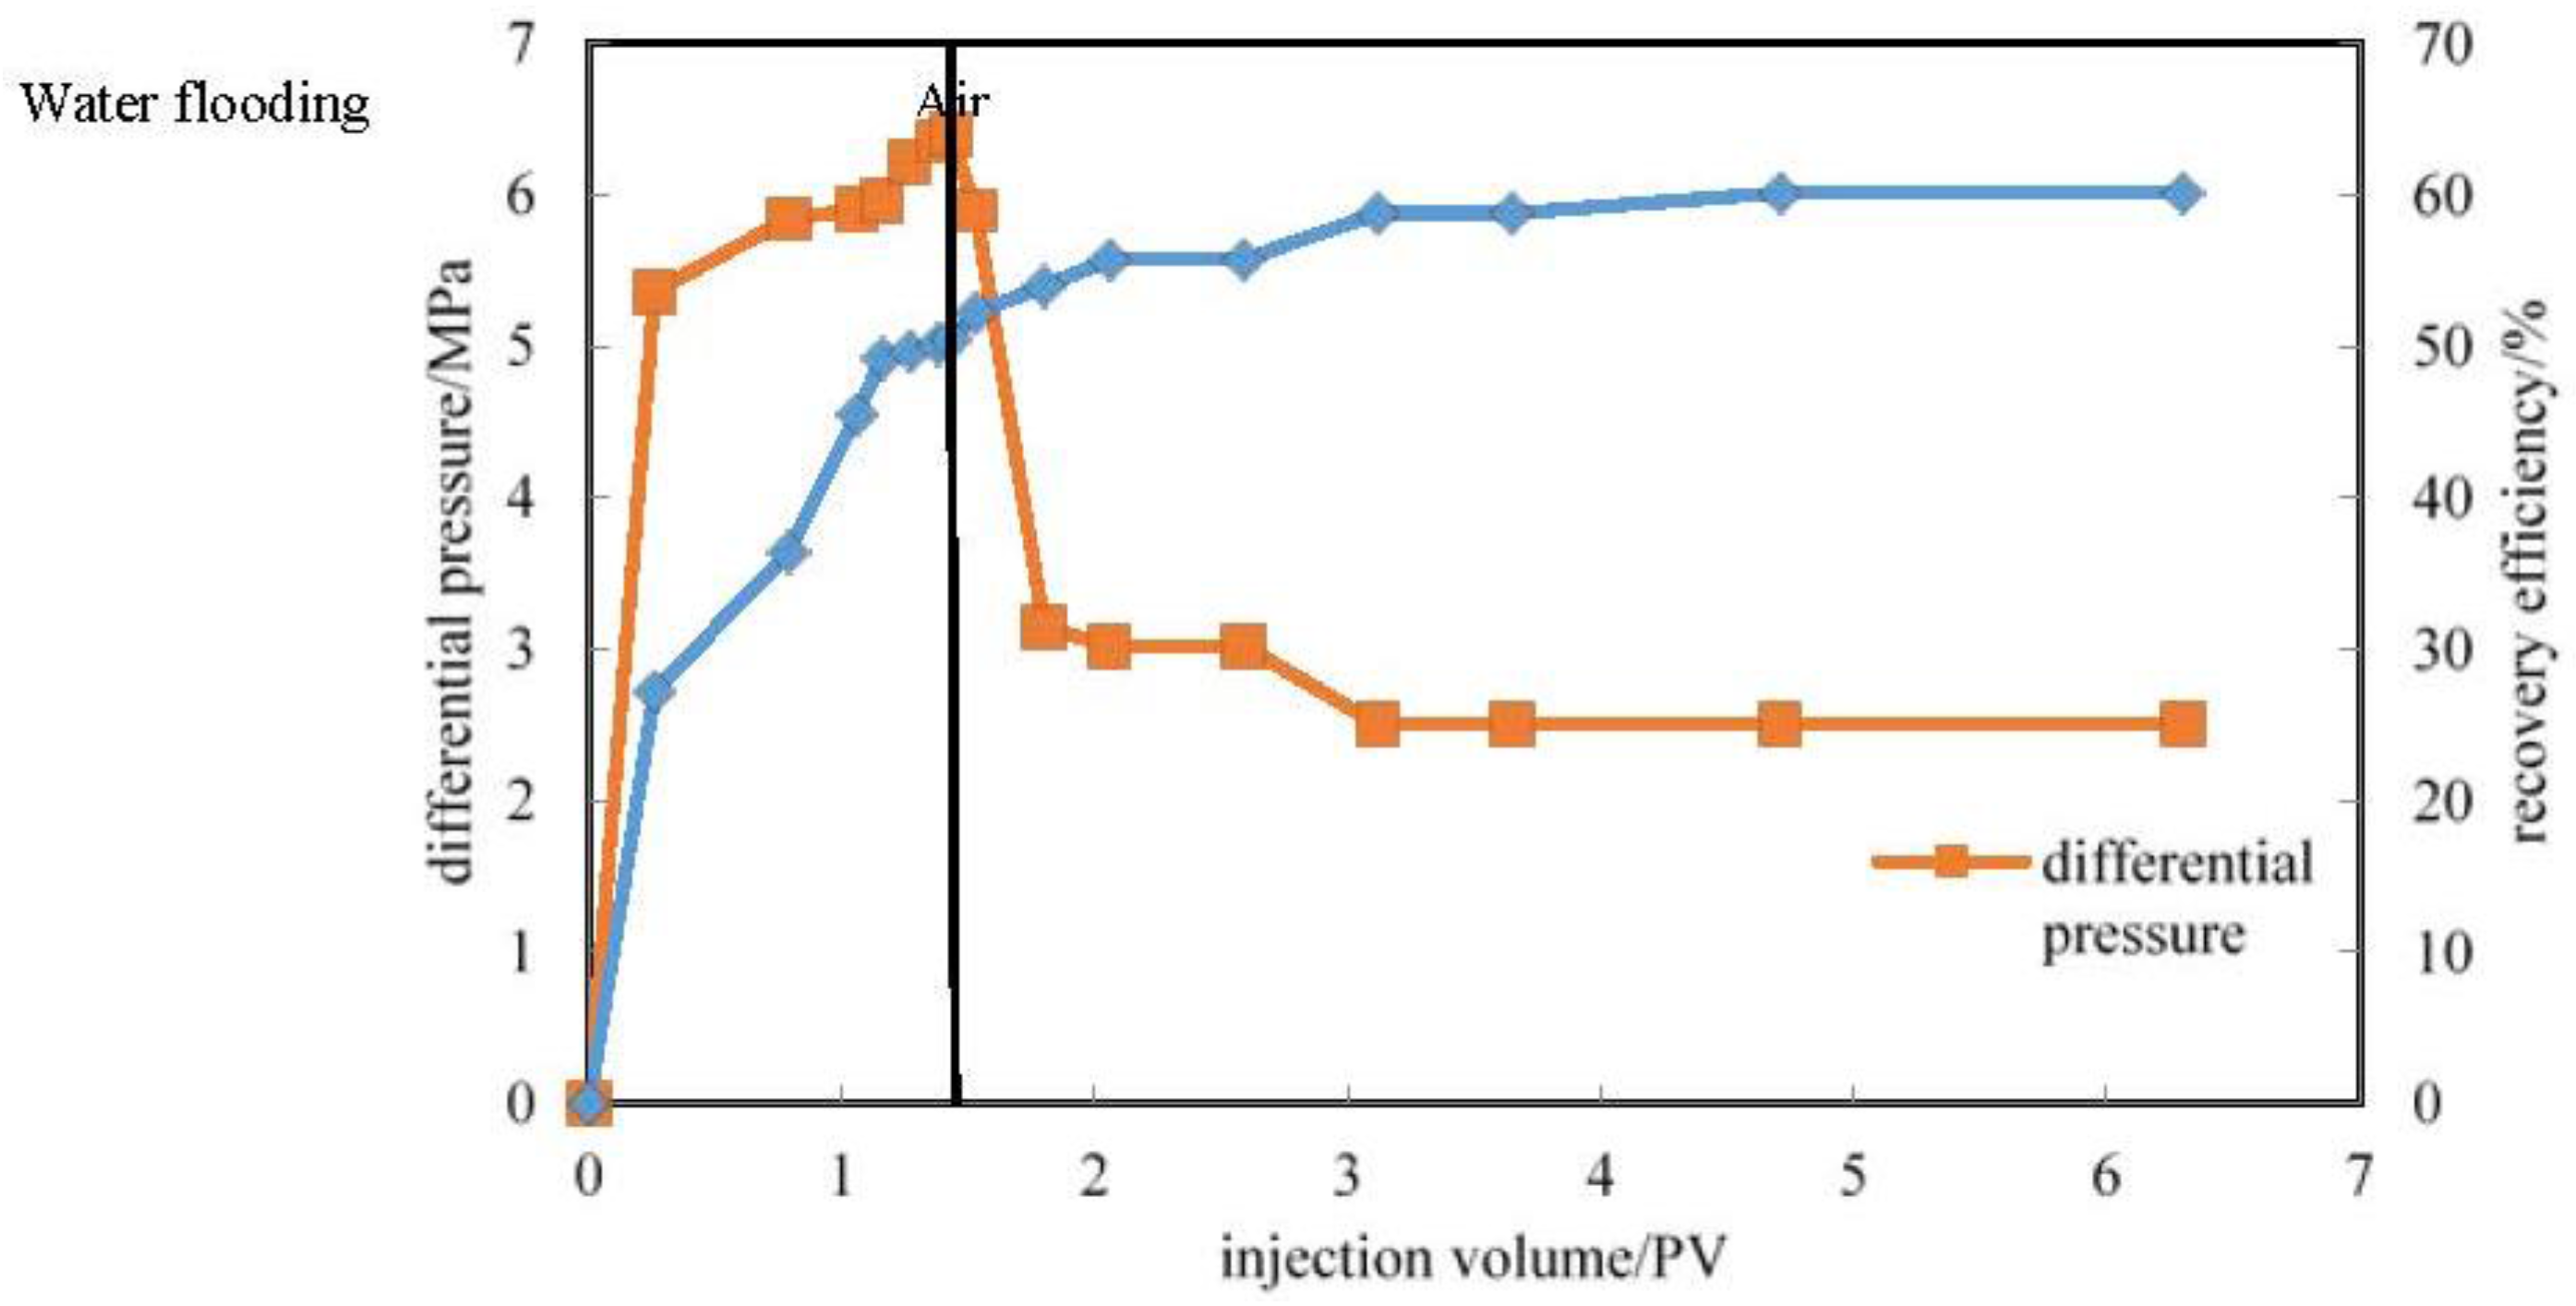
(d) Air Displacement after Water Flooding Experiments

First, the experiment was switched from water flooding to gas displacement when the outlet moisture content was 75%. When the injection time is 20 min, outlet water breakthrough occurred and the measured the water-free oil recovery is 35.03%. At the end of the water drive the recovery efficiency was 48.01%. The outlet water cut reached 75% after the change to air injection. The experiment ended at 185 min, with a total recovery efficiency of 54.80%. Specific experimental data are shown in Table 8, Figure 6 and Figure 7.
The differential pressure between production and injection increased rapidly as the injection volume increased, and after the injection of air, the differential pressure of injection-production drops rapidly, and stays constant at 2.5 MPa. Before the black vertical lines is the water flooding stage, and the gas injection stage is behind. As Figure 6 shows, in the gas flooding after water flooding experiment process, recovery factor increased during the water drive process as the injected water rose significantly. After changing to air injection displacement and using a displacement velocity of 0.2 mL/min, the recovery increase is not obvious, and the ultimate recovery was 54.8%.

(e) Analysis of the Results

The recovery in core 15 is 56.52% during the first water flooding experiment process, which is higher than the second water flooding recovery efficiency of 54.80%. As Table 8 shows, the oxygen content is higher after gas breakthrough with an oxygen content of 19.6%, and the oxygen content of the injected air was 21%, suggesting that gas channeling happened during the air displacement process, which affected the results of the experiment. In order to confirm the air displacement effect, a second and the third group of experiments was carried out, and in the bcase of gas channeling the injection volume, and injection solvent amount increased.

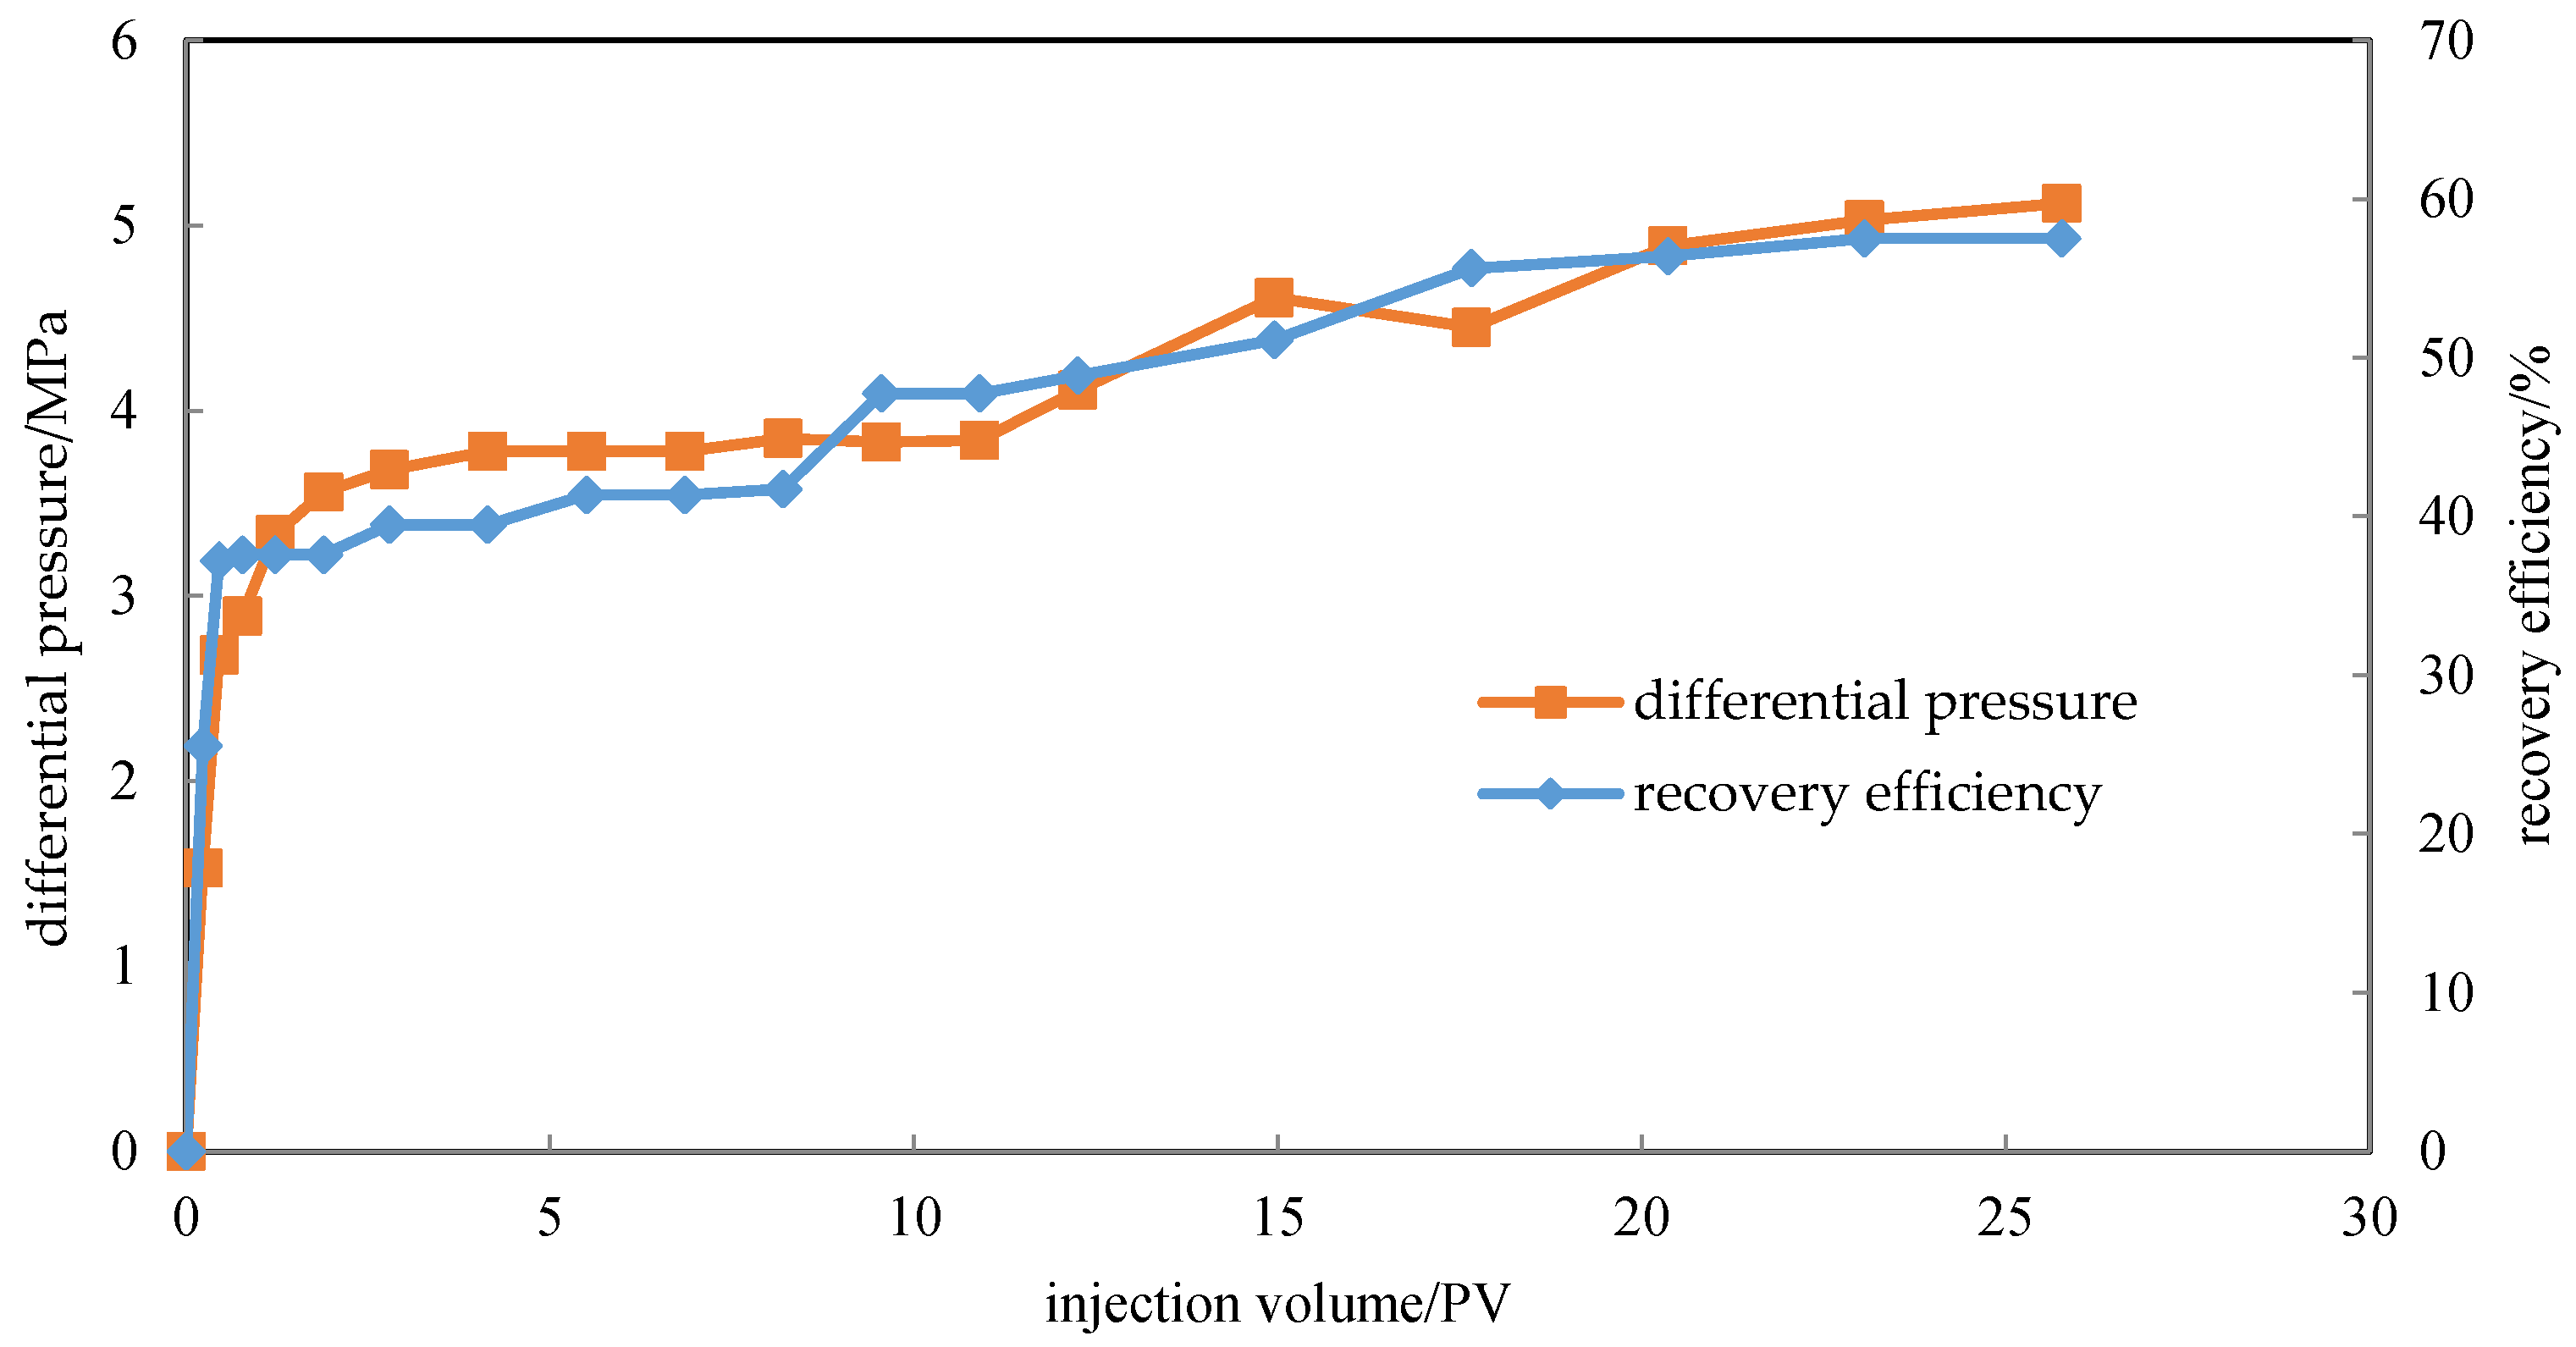
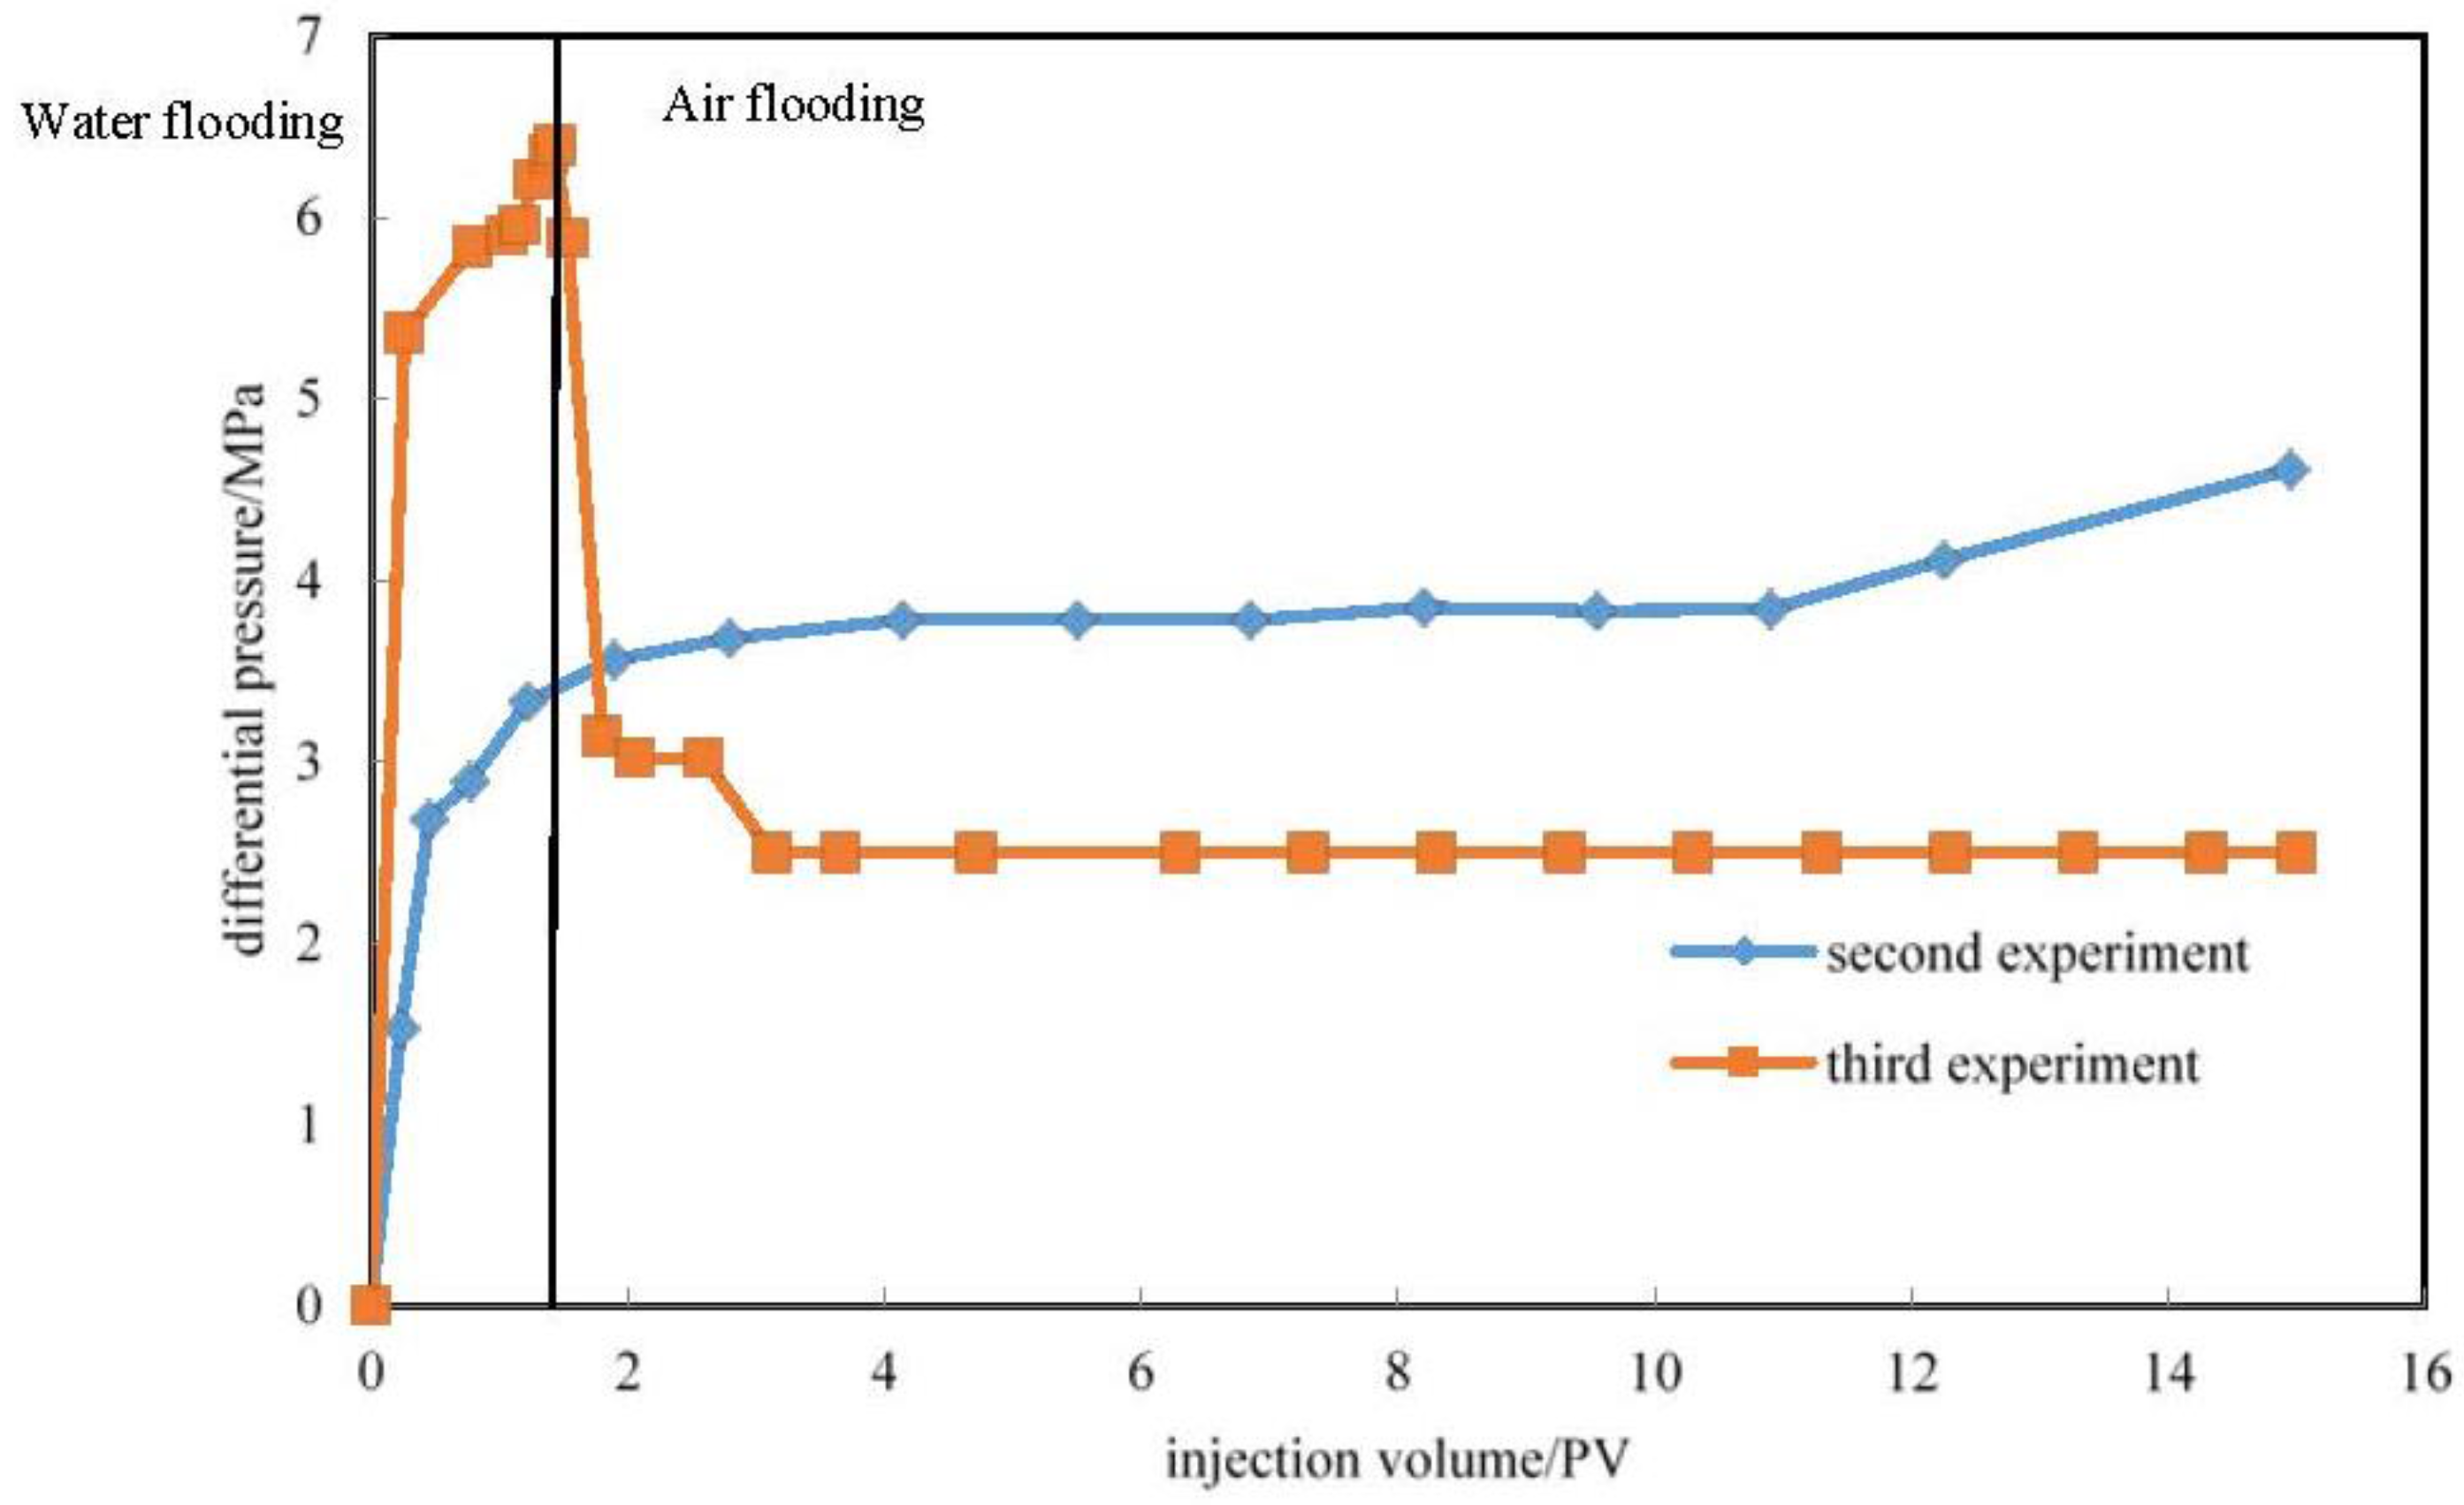
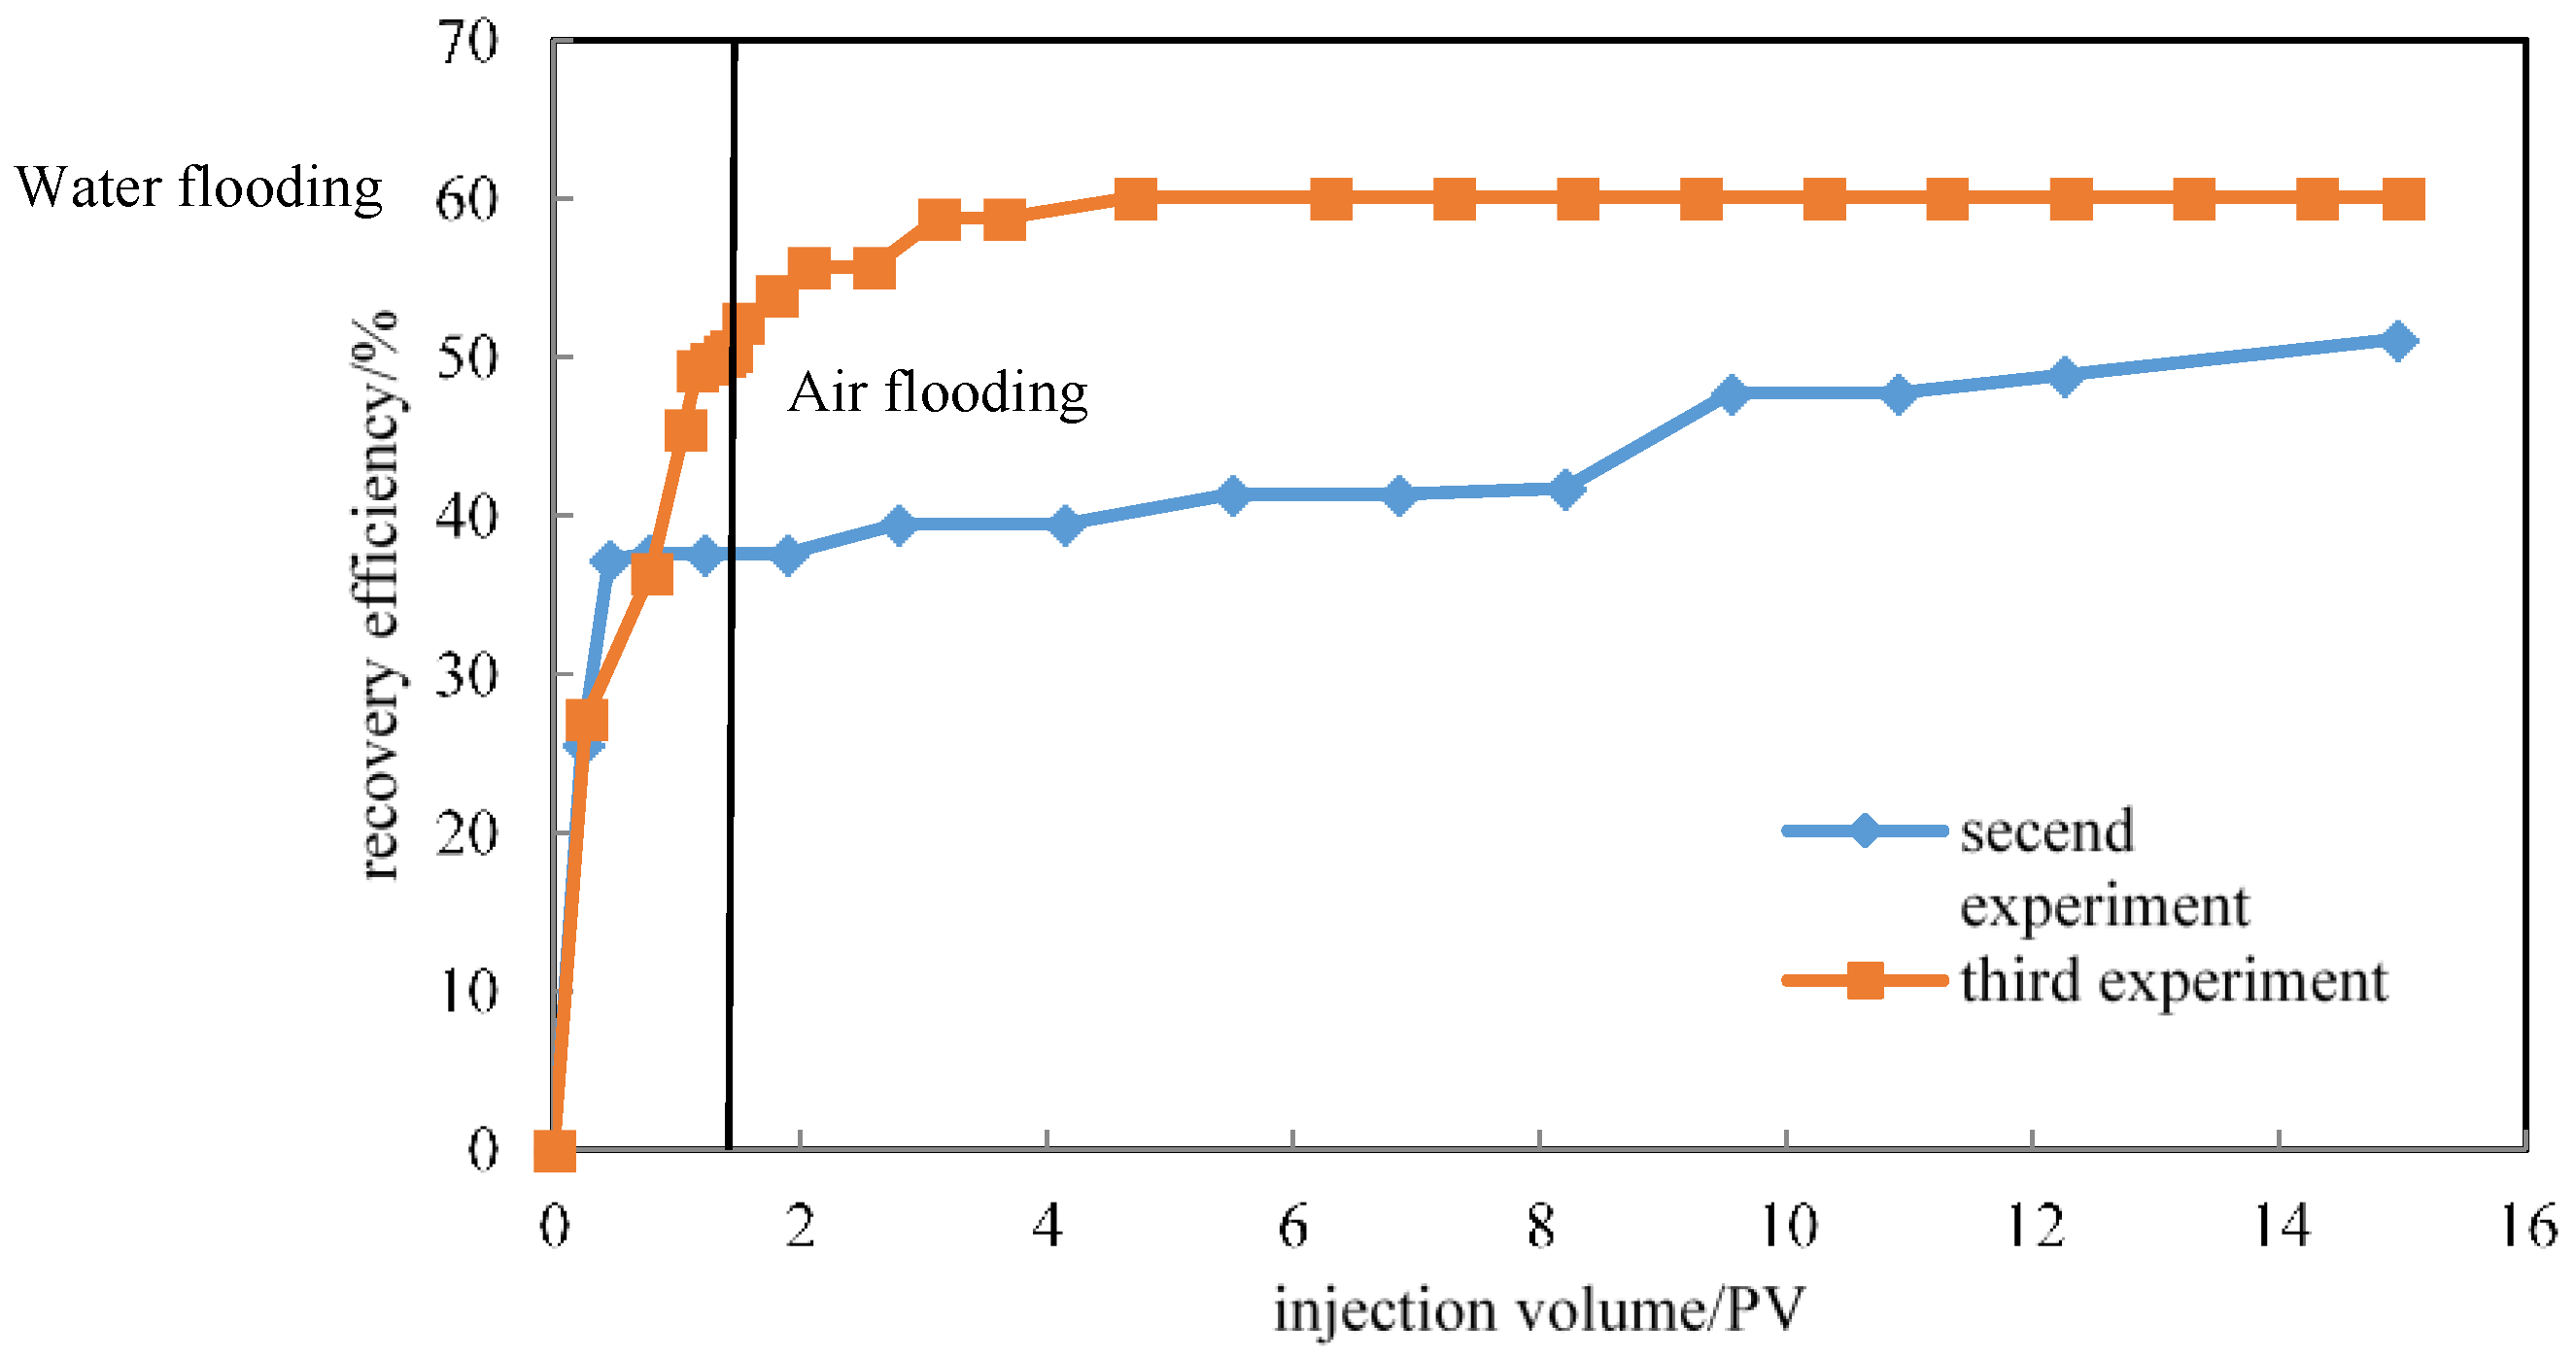
3.2.2. The Second and the Third Groups of Experiments

The second and third groups of experiments were carried out with cores 31 and 32, respectively. The cores are drilled from 12 to 18 Wells at 3228 m depth with similar properties, and adopt water flooding and water flooding to air flooding at the water cut of 75% in the outlet, to make a contrastive analysis of the experimental results. A second group of core 31 basic data used in the experiment are shown in Table 9.
On core 31 with saturated oil operation, we measured the irreducible water saturation of the core. During the process of oil saturation, after a cumulative injection time of 120 min, oil came out from the outlet. After 210 min the saturated oil release is over, and the irreducible water saturation measured 40.09%. Specific experimental data are shown in Table 10.
At the time of 10 min injection, water broke through from the outlet, and the water-free oil recovery was 37.22%. Water flooding ended at 545 min, and the ultimate recovery of 57.52%, and the residual oil saturation was 25.45%. The data are shown in Table 11, Figure 8 and Figure 9.
The recovery efficiency increased with the increase of injection rate, while the differential pressure between production and injection became higher and higher. For water flooding an ultra-low permeability core, the trend is obviously that the injection capability declines after reaching stability. The basic data of core 32 in the third set of experiments are shown in Table 12. The core source was from L oilfield N block Well12-18 (depth 3228 m).

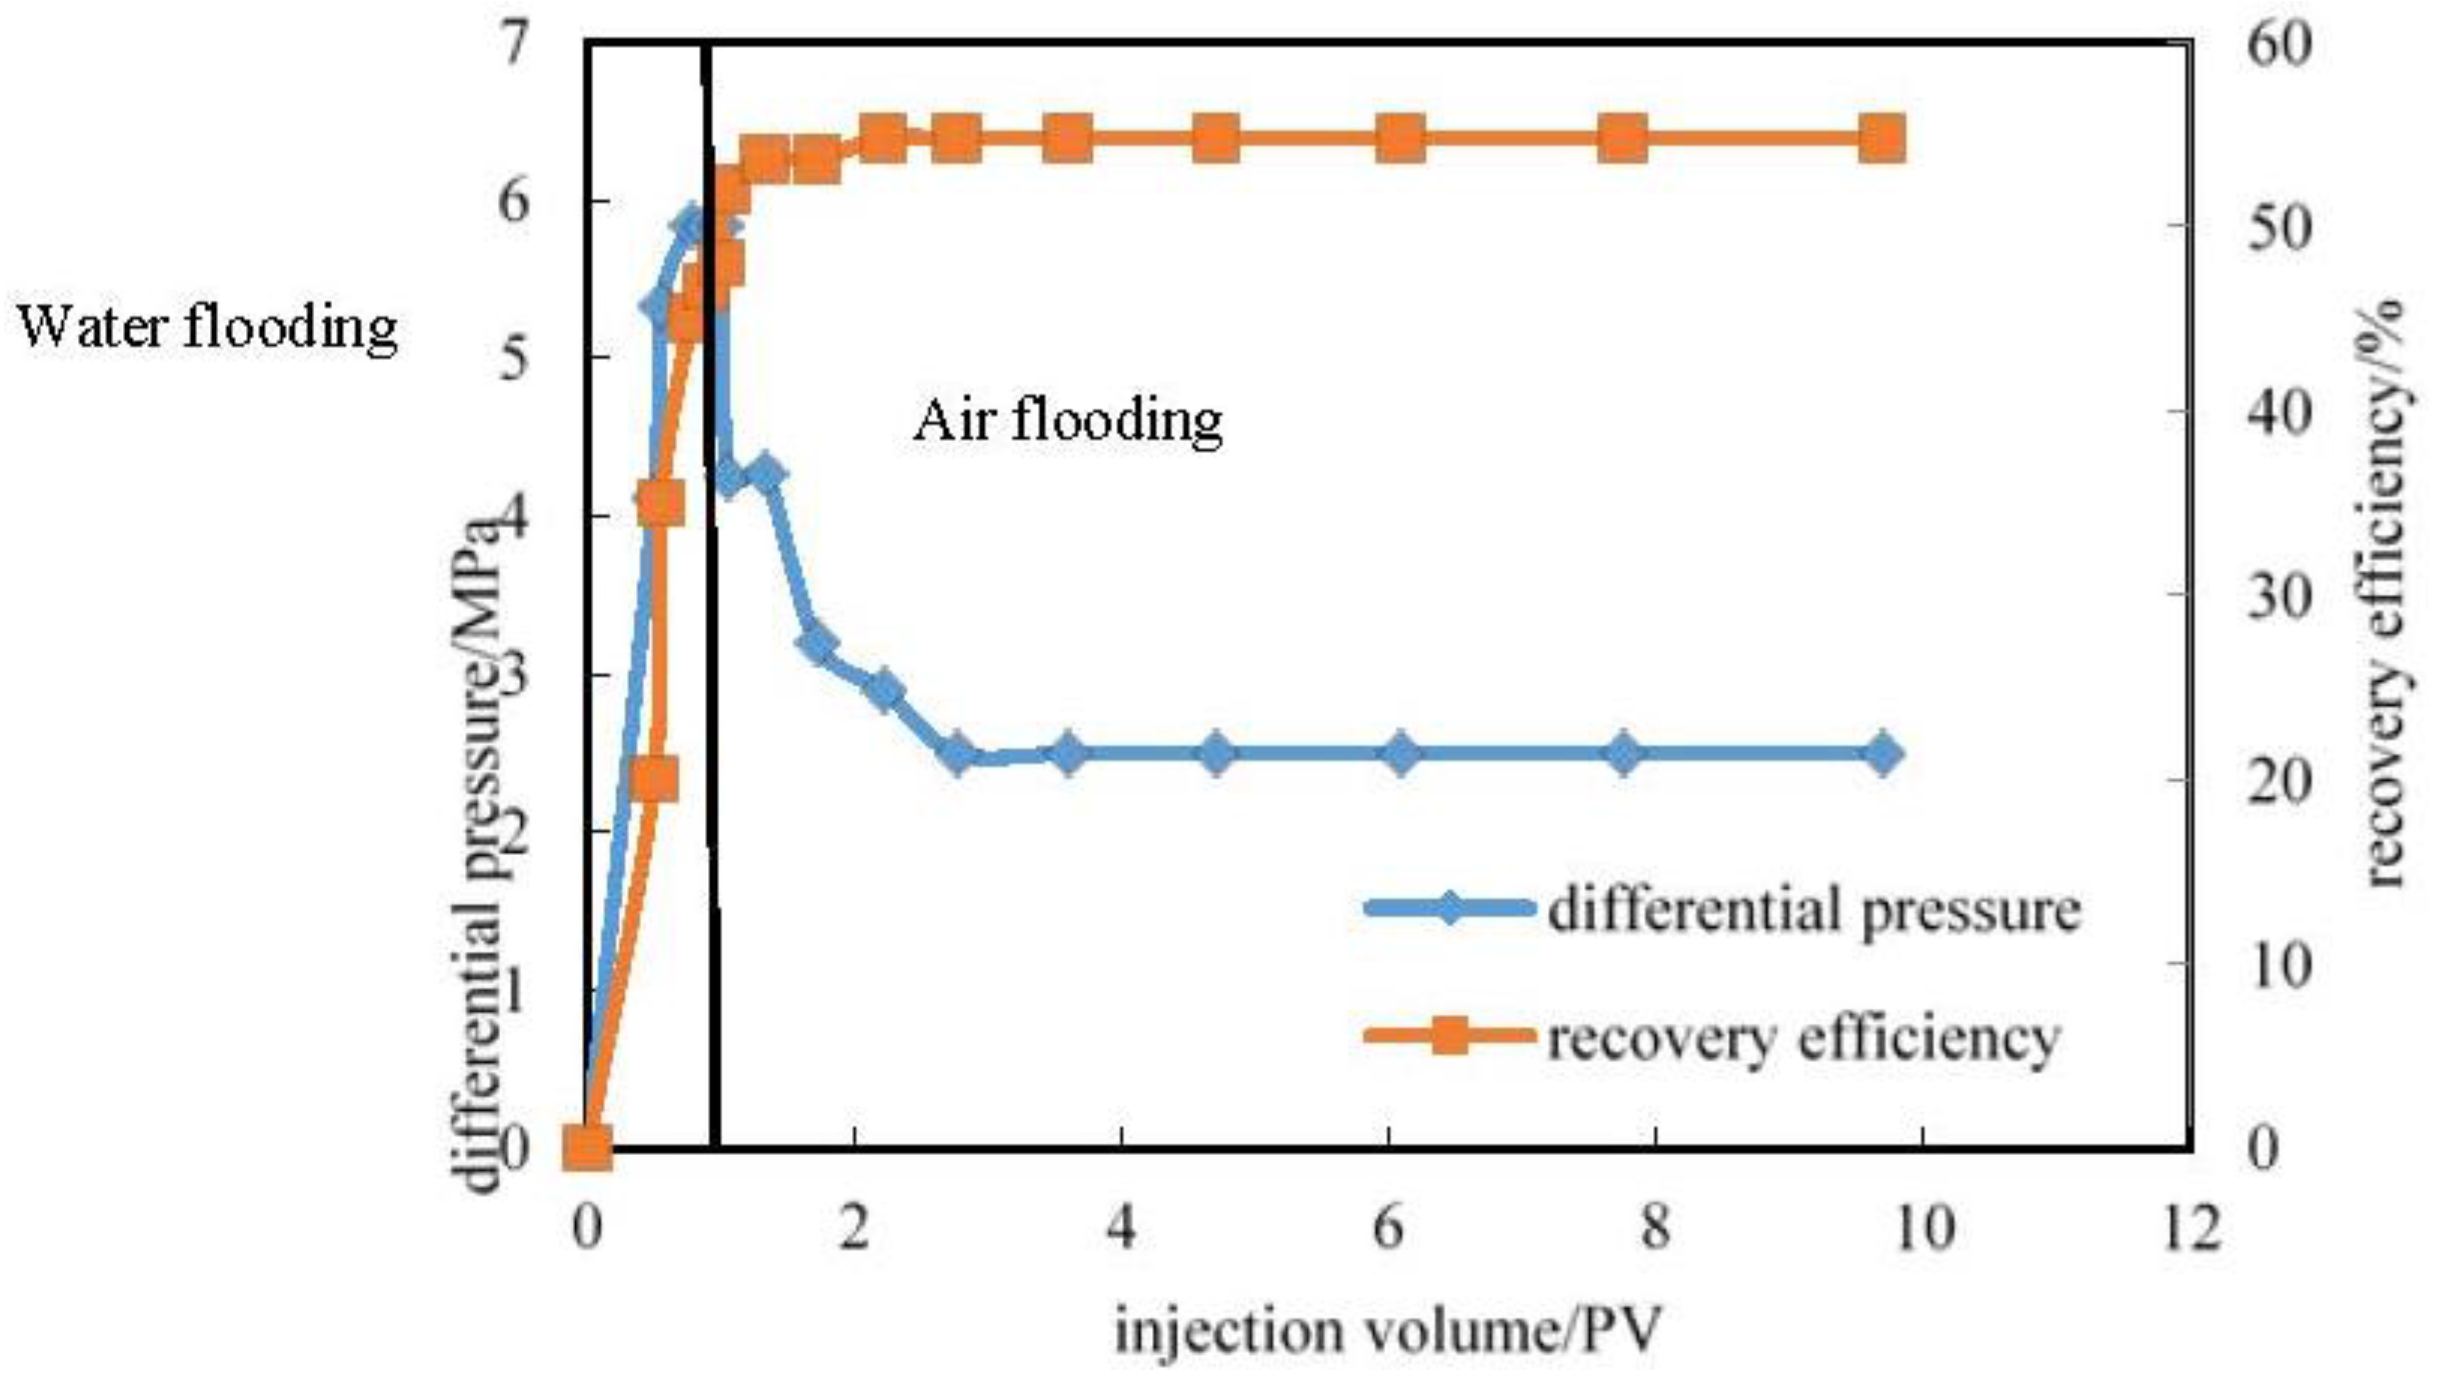
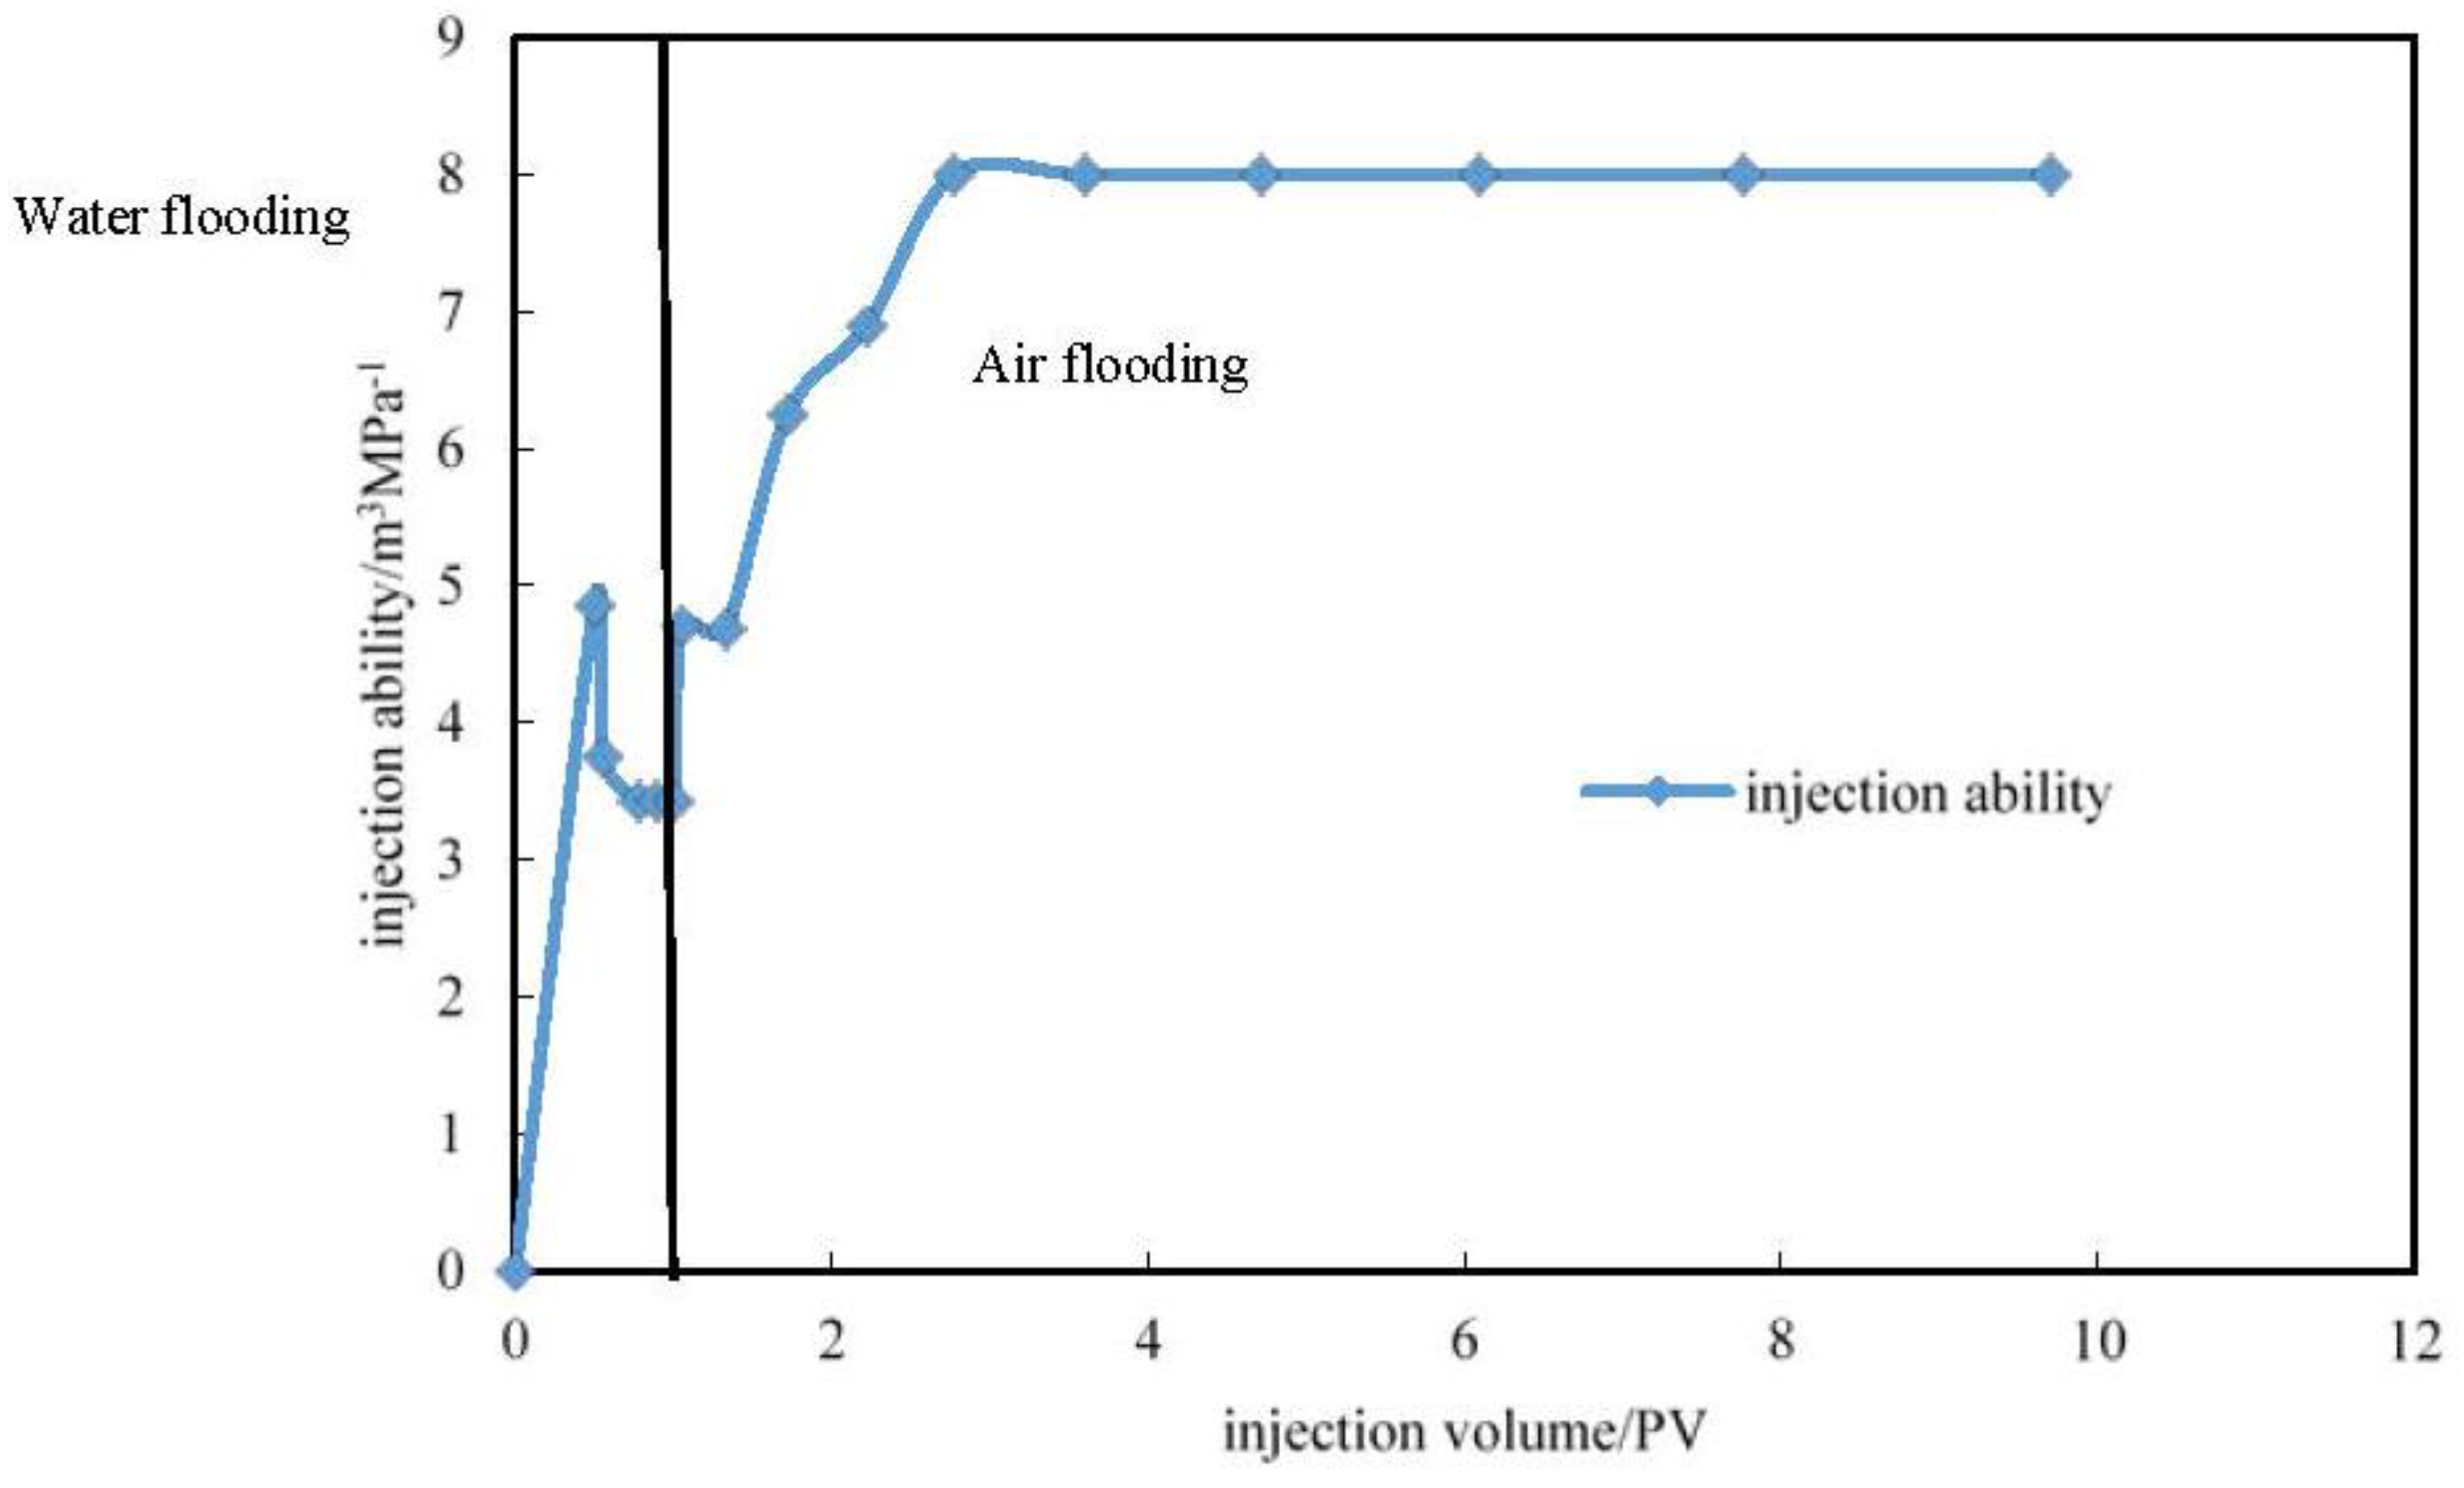
(a) Water Flooding Recovery

Core 32 was saturated with oil, and the irreducible water saturation of the core was measured. During the process of oil saturation, at the injection time of 220 min, oil breakthrough from outlet was observed. The saturation was over at 610 min, and the irreducible water saturation was 39.78%. Specific experimental data are shown in Table 13.

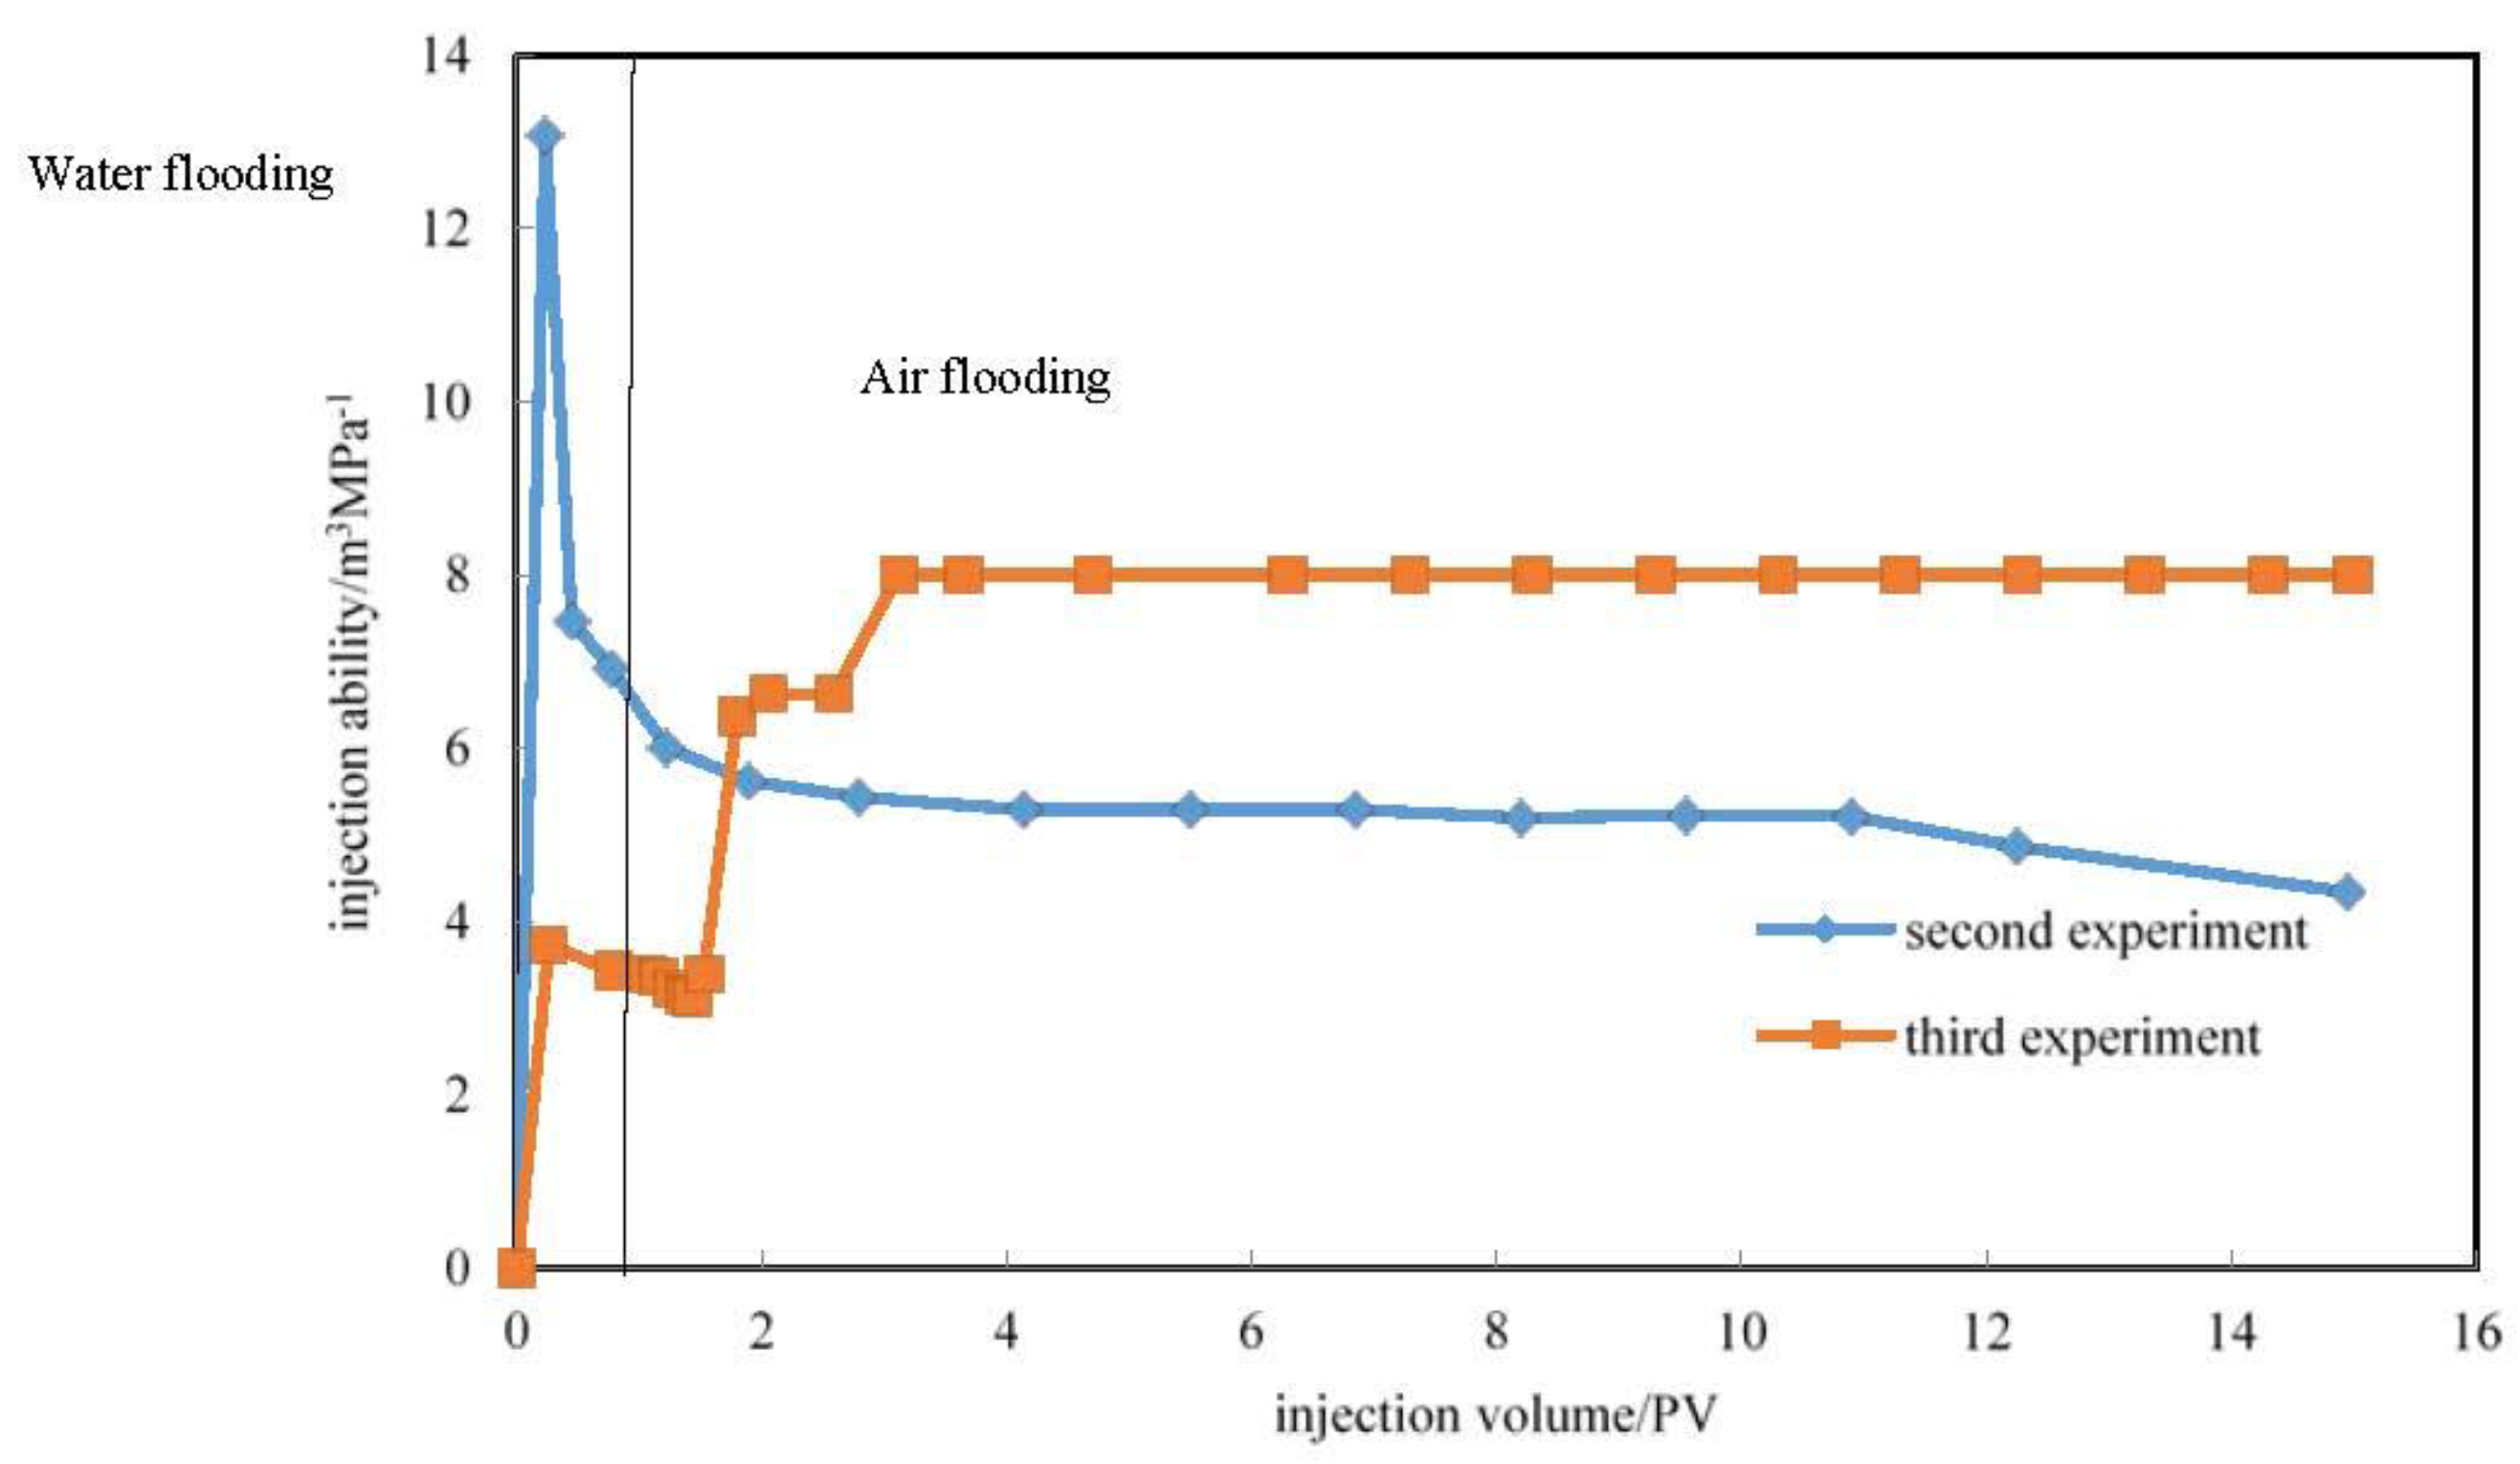
(b) Switch to Air Displacement after Water Flooding Experiment

A gas flooding after water flooding experiment was carried out on core 32. The water flooding experiment was performed first, until the outlet water cut is 75%, and then switched to a gas displacement experiment. When the injection time is 15 min, water breaks through from outlet, and the water-free oil recovery is 36.40%. The water flooding experiment ended at 26 min, and the recovery from the core was 50.10%. Then it was converted to a gas displacement experiment, and gas breakthrough from the outlet was observed at 34 min, so as the instantaneous flow became faster, gas breakthrough occurs sooner, and there is a sharp drop in pressure. The gas flooding experiment ended at 119 min, and the recovery was 60.09%. The results are shown in Table 14, Figure 10 and Figure 11.
Compared to the second set of experiments, the differential pressure of injection-production drops by more than half after the air drive, which matches with the first set of experiments. The area before the black vertical line is the water flooding stage, and the gas injection stage follows. The injection capacity increased more than one time and remained stable after air flooding, which matches the first set of experiments. Several researchers’ results [24] show that for most of the oil product, the oxygen content safety limit is 10%~11%. As shown in Table 14, the oxygen content is 10.8%, which is within the safety scope of the security. At the same time, the well spacing between injection and production well is generally a few hundred meters, so the oxygen of the injected air could make full contacted with the oil within the scope of the long distance, and result in a slow reaction at the reservoir temperature, so the concentration of oxygen is reduced gradually, so we can predict that the production well will not explode, but the surveillance must nevertheless be strengthened [25,26].
Figure 10 shows that recovery efficiency continues to increase during the water flooding, and the recovery is 45.47% when the water injection up to 1.06 PV (injection volume divided by pore volume). Then the water flooding effect get worse, and when 1.38 PV is injected, the recovery reaches 50.10%. We switch from water drive to gas drive when the water displacement becomes difficult. The displacement rate is 0.2 mL/min, injection angle is 20°, and air displacement improved the recovery efficiency to 60.09% by gravitational force, which is higher than ever.

(c) Result Comparison

Figure 12 shows that the injection pressure increases obviously after switching to air flooding, and oil recovery with air flooding is higher than with water flooding when the injection up to 4 to 5.5 PV. The pressure of the air injection is nearly half lower than the pressure of water flooding, and the pressure falls rapidly after breakthrough. From Figure 13 and Figure 14, the oil displacement ability of water flooding in the two experiments is close, and they show similar recovery trends, but the recovery of the third group experiments with air displacement is significantly higher than in the second set of experiments, which shows that air flooding plays a significant role in this experiment. Through comparison and analysis of the second and the third groups of experiments on core 31 and core 32, respectively, after water flooding and water flooding to a moisture content of 75% and switching to air displacement, the recoveries were 57.51% and 60.09%, respectively, a 60% drop compared to the water, gas injection pressure differential, and the injection capacity increased by 60%, after the change to air injection of 2.43 PV, so compared with the same water flooding the degree of recovery increases significantly. The effect of air displacement in the L oilfield N block oil displacement is significant, the air displacement of oil is feasible, but places a high requirement on technology.
The experiments can only consider the viscosity factor, and there is a swept volume in actually water flooding a reservoir, so the actual recovery efficiency is lower than in the experiments. Compared with the CO2 flooding, nitrogen gas flooding is much cheaper, but its security problems are very significant. Corrosion resistance must be considered in the actual production, increasing the monitoring oxygen content.
After the early water flooding stage, the injection of the third set of experiments is more difficult than the second set of experiments, as the differential pressure of injection-production is two times more, and the differential pressure of injection-production is less than only water flooding after switching to air flooding. Before the black vertical line is the water flooding stage, and the gas injection stage follows.
The injection capacity of the second set of experiments becomes poor gradually, which corresponds to only water flooding, while the injection capacity of the third set of experiments increases greatly after the shift to air flooding. Before the black vertical line is the water flooding stage, and the gas injection stage is behind.

4. Conclusions

(1)
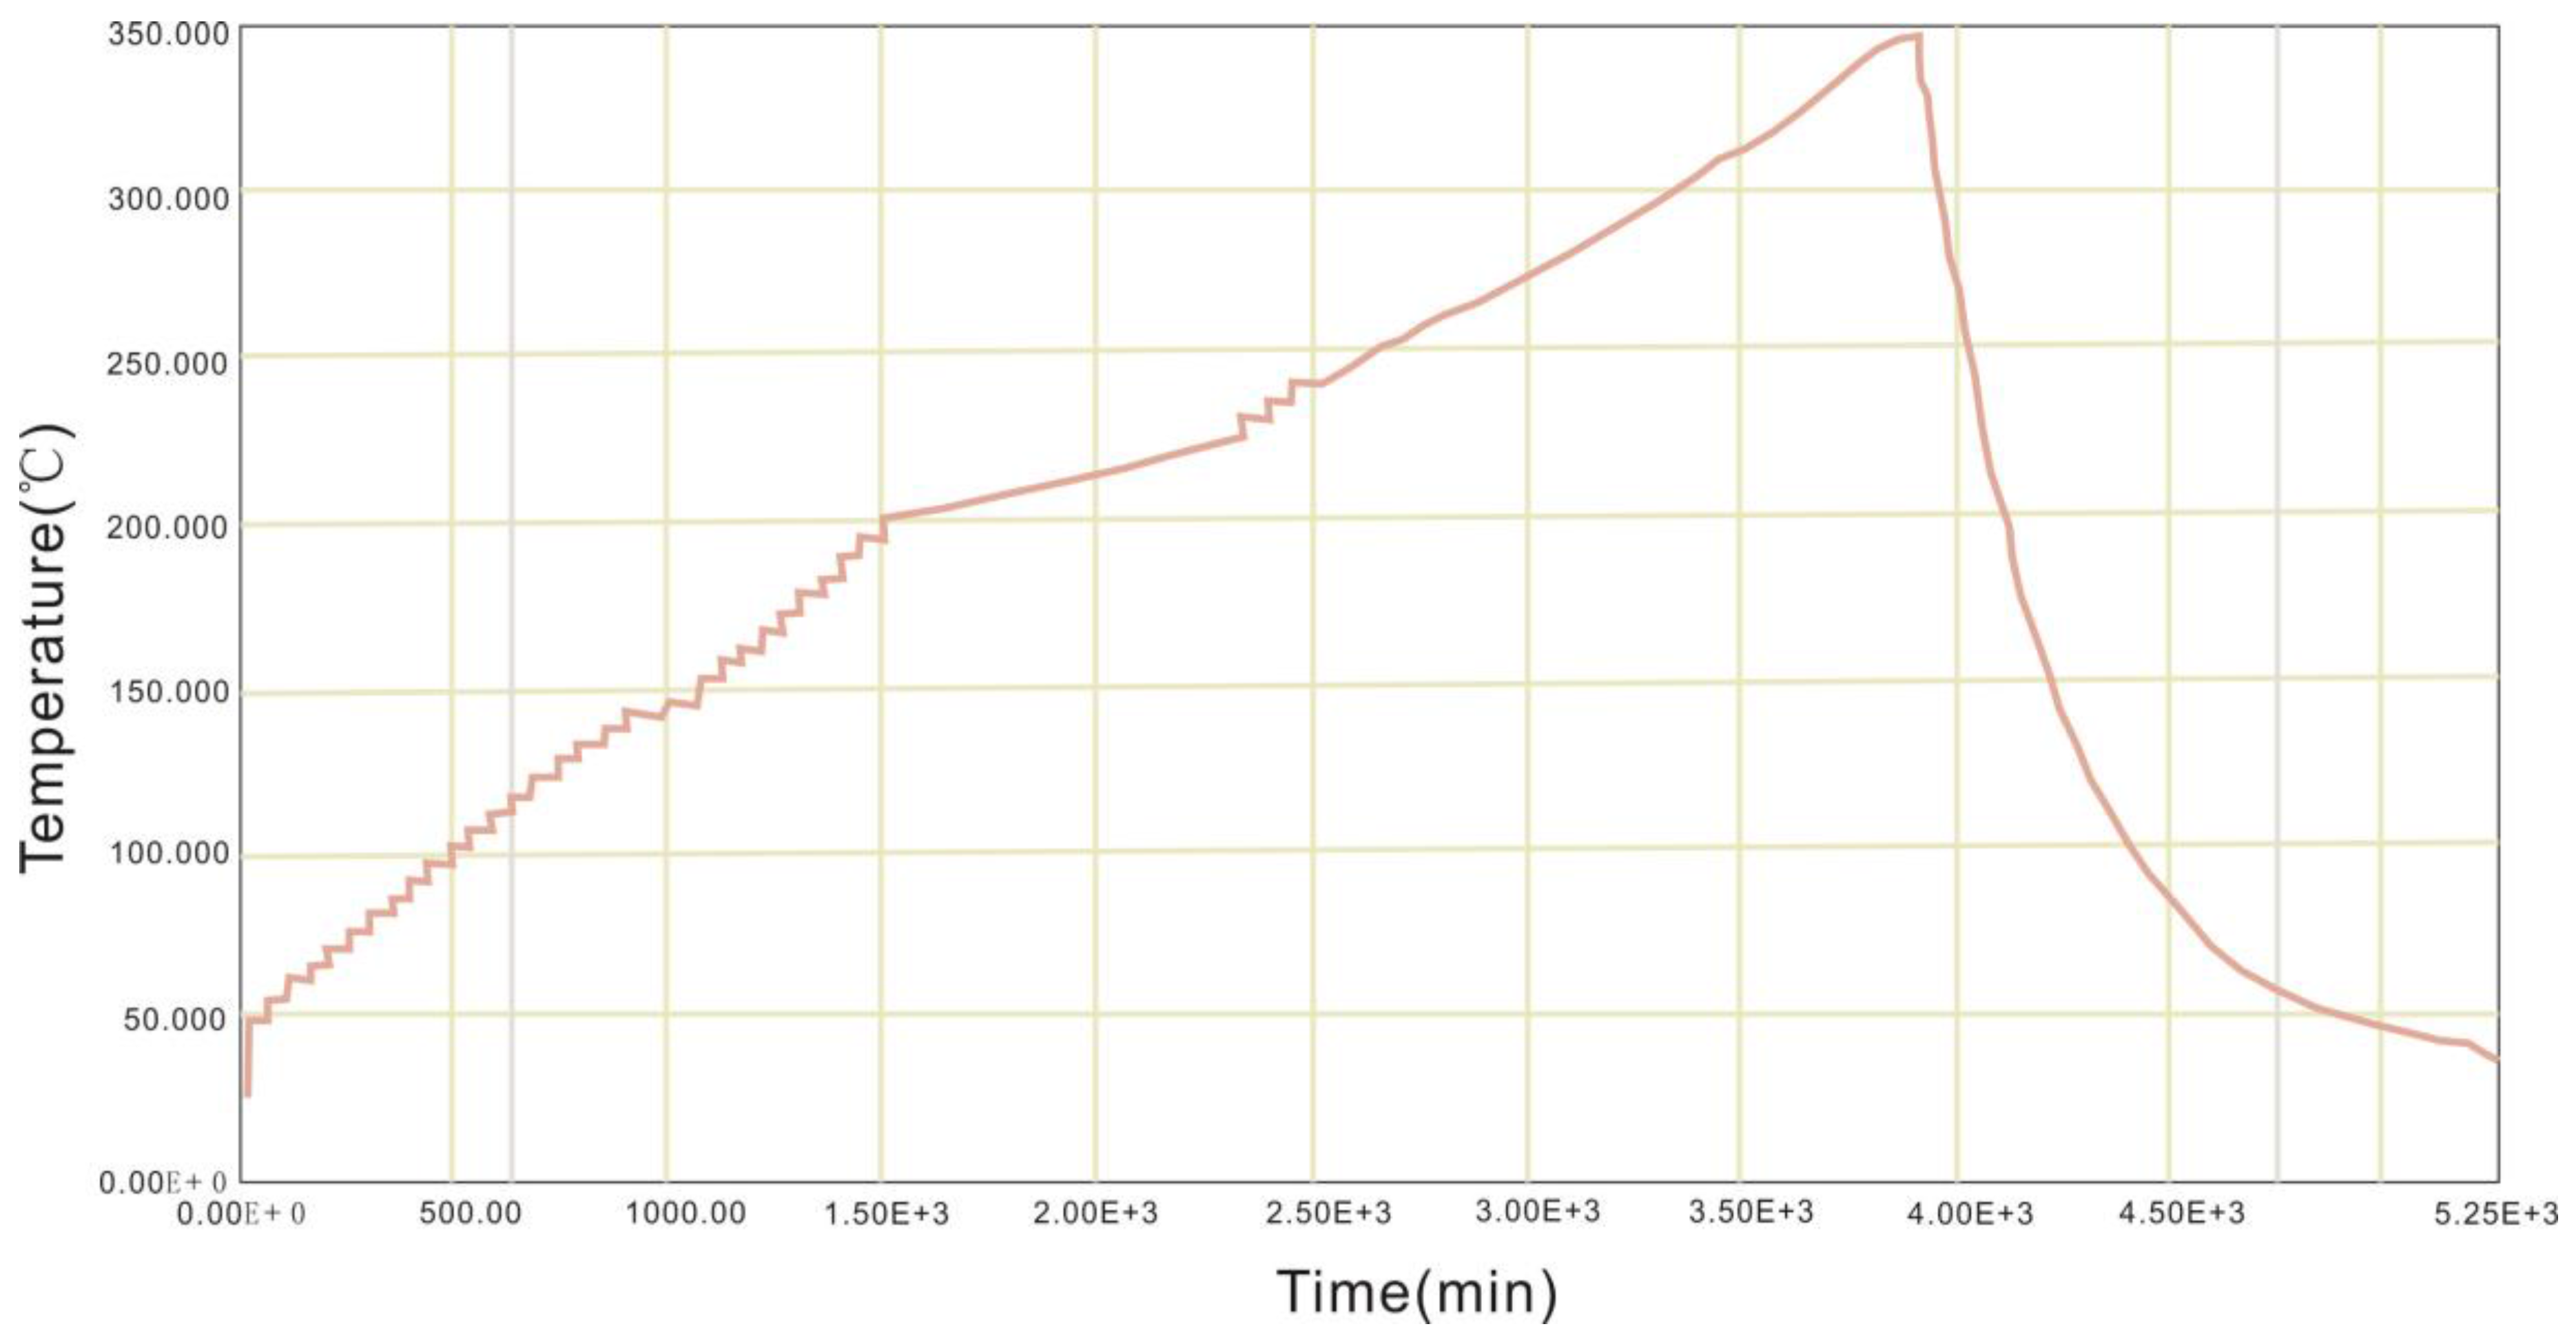
ARC verified by the experiment that in this block formation oil transformation can happen with low temperature air oxidation, the initial exothermic temperature of the experiment is 240 °C, and the maximum heating rate is 0.11 °C/min.
(2)
The core15 experiments may be a result of gas channeling, and increasing the injection volume, and increasing the sweep efficiency may be ways to improve this problem, and one could also try the injection foam in the actual production.
(3)
The recovery efficiency improved 2.58%, the injection-production pressure difference dropped 60% and the injection capability increased 60% in the experiment shifting to air flooding after water flooding to 75% moisture content, compared with only water flooding. In the aspect of EOR and injection capacity improvmenet, the air displacement feasibly solved the problem of injection difficulty in the N fault block of the L oilfield.
(4)
The paper provides experimental proof this can work, suggesting that other science and technology workers could now undertake further tests and verify this through numerical simulation.

Acknowledgments

This work is supported by the Science Foundation of Heilongjiang (QC2016049), the National Natural Science Foundation of China (41572135) and the Major Projects of National Science and Technology of China (2016ZX05046-001 and 2016ZX05010-002-004).

Author Contributions

Guohui Qu and Yuanlin Meng conceived and designed the experiments; Yongxing Tao and Anqi Shen performed the experiments; Yuxin Guo and Anqi Shen analyzed the data; Yikun Liu and Yuanlin Meng contributed reagents; Guohui Qu wrote the paper.

Conflicts of Interest

The authors declare no conflict of interest. Science Foundation of Heilongjiang played a role in the design of the study, National Natural Science Foundation of China played an important role in the collection, analyses and interpretation of data, the Major Projects of National Science and Technology of China played a role in preparation of experiment materials.

References

  1. Greaves, M.; Ren, S.R.; Rathbone, R.R. Air Injection Technique (LTO Process) for IOR from Light Oil Reservoirs: Oxidation. In Proceedings of the SPE/DOE Improved Oil Recovery Symposium, Tulsa, OK, USA, 19–22 April 1998; pp. 479–492.
  2. Wang, C.J.; Zheng, L.M.; Gao, R.M. Extra low permeability reservoir in Erdos shallow air flooding after water flooding experiment research. J. Pet. Geol. Eng. 2013, 27, 135–141. [Google Scholar]
  3. Greaves, M.; Ren, S.R.; Rathbone, R.R. Improve Residual Light Oil Recovery by Air Injection (LTO Process). J. Can. Pet. Technol. 2000, 39, 57–61. [Google Scholar] [CrossRef]
  4. Jiang, Y.W.; Zhang, Y.T.; Liu, S.Q. Oil displacement mechanism of air injection of low permeability reservoir development. J. Pet. Explor. Dev. 2010, 37, 471–476. [Google Scholar]
  5. Faure, P.; Landais, P. Evidence for clay minerals catalytic effects during low temperature air oxidation of n-alkanes. J. Fue1 2000, 79, 1751–1756. [Google Scholar] [CrossRef]
  6. Zhang, X.; Liu, J.Y.; Sun, L.T.; Li, S.L.; Liu, W.H. Research on the mechanisms of enhancing recovery of light-oil reservoir by air-injected low-temperature oxidation technique. Nat. Gas Ind. 2004, 24, 78–80. [Google Scholar]
  7. Sandra, R.; Nielsen, R.F. Tibetan Mining Dynamics; Petroleum Industry Press: Beijing, China, 1987; pp. 64–137. [Google Scholar]
  8. Dai, Z.; Middleton, R.; Viswanathan, H.; Fessenden-Rahn, J.; Bauman, J.; Pawar, R.; Lee, S.; McPherson, B. An integrated framework for optimizing CO2 sequestration and enhanced oil recovery. Environ. Sci. Technol. Lett. 2014, 1, 49–54. [Google Scholar] [CrossRef]
  9. Ampomah, W.; Balch, R.S.; Grigg, R.B.; McPherson, B.; McPherson, B.; Will, R.A.; Lee, S.; Dai, Z.; Pan, F. Co-optimization of CO2-EOR and storage processes in mature oil reservoirs. Greenhouse Gas Sci. Technol. 2016, 6, 1–15. [Google Scholar] [CrossRef]
  10. Dai, Z.; Viswanathan, H.; Middleton, R.; Pan, F.; Ampomah, W.; Yang, C.; Jia, W.; Xiao, T.; Lee, S.; McPherson, B.; et al. CO2 Accounting and Risk Analysis for CO2 Sequestration at Enhanced Oil Recovery Sites. Environ. Sci. Technol. 2016, 50, 7546–7554. [Google Scholar] [CrossRef] [PubMed]
  11. Giacchetta, G.; Leporini, M.; Marchetti, B. Economic and environmental analysis of a Steam Assisted Gravity Drainage (SAGD) facility for oil recovery from Canadian oil sands. Appl. Energy 2014, 142, 1–9. [Google Scholar] [CrossRef]
  12. Crivellini, A.; Giacchetta, G.; Marchetti, B.; Marchetti, C.; Paciarotti, C.; Terenzi, A. Development and validation of a model for the simulation of the air drying phenomena in pipelines. Int. J. Math. Model. Numer. Optim. 2013, 4, 351–373. [Google Scholar] [CrossRef]
  13. Chen, Y.R.; Guo, P.; Zhang, J.D.; Xiong, J. Low permeability oil reservoir air injection low-temperature oxidation mechanism of crude oil. J. Chongqing Inst. Technol. 2013, 15, 101–103. [Google Scholar]
  14. Permain, P.; Gevelin, J.L. Air Injection into a Light Oil Reservoir: The Horse Creek Project. In Proceedings of Middle East Oil Show and Conference, Manama, Bahrain, 15–18 March 1997.
  15. Fu, Z.J. Bohai South, 36 Pieces of Air Displacement Indoor Experimental Research; China University of Petroleum: Beijing, China, 2008. [Google Scholar]
  16. Fraim, M.L.; Moffitt, P.D.; Yannimaras, D.V. Laborary Testing and Simulation Results for High Pressure Air Injection in a Waterflooded North Sea Oil Reservoir. Available online: http://cat.inist.fr/?aModele=afficheN&cpsidt=6244813 (accessed on 5 September 2016).
  17. Moore, R.G.; Ursenbach, M.G. Air injection for oil recovery. J. JCPT 2002, 9, 16–19. [Google Scholar]
  18. Gutierrez, D.; Miller, R.J.; Taylor, A.R.; Pete, T.; Vinodh, K. Buffalo Field High-Pressure Air Injection Projects 1977 to 2007: Technical Performance and Operational Challenges. SPE Reservoir Eval. Eng. 2009, 12, 542–550. [Google Scholar] [CrossRef]
  19. Gutierrez, D.; Miller, R.J.; Taylor, A.R.; Thies, P.; Kumar, V. The Challenge of Predicting The Field Performance of Air Injection Projects -based on Laboratory and Numerical Modeling. J. CPT 2009, 48, 53–56. [Google Scholar]
  20. Fasishi, M.B. Low temperature oxidation of visions crude oils. SPE Reservoir Eng. 1990, 5, 609–616. [Google Scholar] [CrossRef]
  21. Pan, Y.; Dong, W.J.; Feng, L. Physical model visualization model of multi-layer sandstone reservoir water flooding experiment study. J. Southwest Pet. Univ. 2012, 34, 79–86. [Google Scholar]
  22. He, W.X.; Yang, Y.Q.; Ma, C.Y. Law of low permeability reservoir water flooding experiment research. J. Lithologic Reservoir 2010, 22, 109–111. [Google Scholar]
  23. Lv, W.F.; Leng, Z.P.; Zhang, Z.B. Application of CT scanning technology study of water flooding low permeability core mechanism. Geol. Oil Recover. Oil Gas 2013, 20, 87–90. [Google Scholar]
  24. Wan, C.L.; Wang, L. The upper limit value of combustible gas oxygen content security study. Chin. J. Safety Sci. 1999, 9, 48–52. [Google Scholar]
  25. Wang, R.F.; Sun, W. Low permeable sandstone microscopic model of water flooding experiment factors affecting oil displacement efficiency. Geol. Oil Exp. 2010, 32, 93–97. [Google Scholar]
  26. Gao, H.; Sun, W.; Lu, Y.; Tian, Y.H.; Ren, G.F. Experimental study on micro-flow channel characteristic of ultralow permeability sandstone reservoir: Taking Yanchang formation, Ordos Basin as example. Pet. Geol. Recover. Effic. 2011, 18, 58–62. [Google Scholar]
Figure 1. Chemical reaction equations of low temperature oxidation.
Energies 09 00783 g001
Figure 2. Diagram of the experimental setup.
Energies 09 00783 g002
Figure 3. Adiabatic oxidation process temperature-time curve.
Energies 09 00783 g003
Figure 4. Pressure difference, recovery ratio relationship of injection multiples.
Energies 09 00783 g004
Figure 5. Injection ability and injection multiples relationship diagrams.
Energies 09 00783 g005
Figure 6. Pressure differential, recovery ratio relationship of multiple injections.
Energies 09 00783 g006
Figure 7. Injection ability and multiple injection relationship diagrams.
Energies 09 00783 g007
Figure 8. Pressure differential, recovery relationship of multiple injections.
Energies 09 00783 g008
Figure 9. Injection ability and multiple injection relationship diagrams.
Energies 09 00783 g009
Figure 10. Pressure difference, recovery ratio relationship of multiple injections.
Energies 09 00783 g010
Figure 11. Injection ability and multiple injection relationship diagrams.
Energies 09 00783 g011
Figure 12. The second and the third group experiments of pressure difference and multiple injection contrast analysis.
Energies 09 00783 g012
Figure 13. The second and the third group experiments of recovery ratio and multiple injection contrast analysis.
Energies 09 00783 g013
Figure 14. The second and the third group experiments of injection ability and injection multiples contrast analysis.
Energies 09 00783 g014
Table 1. Core sample parameters.
Core SampleK/×10−3 μm2Φ/%L/cmd/cm
150.739912.636.542.36
310.327910.007.092.36
320.229710.006.082.36
Table 2. Formation water composition (mg/L).
IonSalinity
Na+ + K+1493.85
Ca2+10.02
Mg2+6.08
Cl274.80
SO42−81.65
HCO33051.00
CO32−195.00
Total Salinity5112.42
Table 3. Core physical property parameters and experimental conditions.
Parameter
μw/mPa·sKa/×10−3 μm2φ/%T/°Cγd/g/cm3μo/μw *Kw/×10−3 μm2
0.650.7412.63780.9934.230.56
Parameter
γW/g/cm3μd/mPa·sL/cmk/%Swi/%D/cmSor
0.990.676.5436.342.772.360.0807
Parameter
η/%V/cm3vw/mL·min−1Qo/mLμo/mPa·sA/cm2pw0/MPa
56.523.610.202.072.754.3721364.018
* dimensionless.
Table 4. Saturated water experimental results.
ta/minv/mL·min−1Q/mLp/MPaInjection Multiples/PVK/×10−3 μm2
00.5000
600.512.001.3883.320.602
300.518.001.3944.990.599
300.524.001.4536.650.575
200.528.001.4647.760.570
200.532.001.4758.860.566
200.536.001.4869.970.562
Table 5. Saturated oil experimental results.
ta/minv/mL·min−1Q/mLQw/mLp/MPaInjection Volume/PVK/×10−3 μm2Remarks
00.100000
750.115.001.621.6314.160.420Oil breakthrough
300.221.001.871.7195.820.399
300.427.001.973.3487.480.410
300.833.002.074.9699.140.552
301.239.002.078.48410.800.646
Table 6. Water flooding experimental results.
ta/minv/mL·min−1Q/mLQo/mLp/MPaInjection Multiples/PVRecovery/%Remarks
00.20 000
50.21.000.552.4760.2826.57
30.21.600.752.7840.4436.23Water breakthrough (water-free recovery 36.23%)
70.23.000.953.0920.8345.89
100.25.001.003.5551.3948.31
100.27.001.003.7141.9448.31
200.211.001.053.7473.0550.72
300.217.001.073.8064.7151.69
300.223.001.103.8556.3753.14
300.229.001.103.7988.0353.14
300.235.001.123.8509.7054.11
300.241.001.123.82811.3654.11
300.247.001.153.84413.0255.56
300.253.001.153.82614.6855.56
600.265.001.153.79318.0155.56
600.277.001.153.90521.3355.56
600.289.001.174.02024.6556.52
600.2101.001.173.94727.9856.52
600.2113.001.174.01831.3056.52
Table 7. Saturated oil again experimental results.
ta/minv/mL·min−1Q/mLQw/mLp/MPaInjection Multiples/PVK/×10−3 μm2Remarks
00.100000
2150.143.000.472.62011.910.262Oil breakthrough
300.249.000.573.65913.570.375
300.455.000.675.48715.240.500
300.861.000.777.28816.900.753
300.467.000.777.00018.560.392
300.2073.000.776.50020.220.211
300.1079.000.773.58721.880.191
300.1085.000.773.40523.550.201
300.1091.000.773.60925.210.190
600.10103.000.773.68828.530.186
1200.05127.000.773.96835.180.086
1200.05151.000.774.23341.830.081
1200.05175.000.774.56448.480.075
1200.05199.000.774.60755.120.074
1200.05223.000.874.13461.770.083
Table 8. Switch to air injection experimental results.
ta/minV/mL·min−1Q/mLQo/mLp/MPaInjection Multiples/PVRecovery/%Qa/m3·MPa−1Oxygen Content/%Remarks
00.2000000-
100.21.00.254.120.5020.030.21-
100.22.00.625.330.5535.030.38-Water breakthrough
40.22.80.795.840.7845.030.48-
20.23.20.835.830.8946.760.55-
20.23.60.855.841.0048.010.62-
10.23.80.924.251.0551.980.89-
50.24.80.954.271.3353.671.12-
70.26.20.953.201.7253.671.9419.6Gas breakthrough
90.280.972.902.2254.802.7617.6
100.2100.972.502.7754.804.0016.7
150.2130.972.503.6054.805.2012.1
200.2170.972.504.7154.806.8010.2
250.2220.972.506.0954.808.8010.2
300.2280.972.507.7654.8011.209.9
350.2350.972.509.7054.8014.007.5
Table 9. The Core 31 physical property parameters and experimental conditions.
ParametersKa /×10−3 μm2T/°Cμo/μw *φ/%γd/g·cm–3Kw/×10−3 μm2L/cm
Value3.1825784.2314.310.9932.957.09
Parametersμd/mPa·sk/%D/cmV/cm3Swi/%Sorvw/mL·min−1
Value0.6737.22.364.4440.090.2550.20
ParametersA/cm2μo/mPa·sQ0/mLpWO/MPaμw/mPa·sγW/g·cm–3η/%
Value4.3722.752.663.8530.650.9957.51
* dimensionless.
Table 10. Saturated oil experiment results.
ta/minv/mL·min−1Q/mLQw/mLp/MPaInjection Multiples/PVK/×10−3 μm2Remarks
00.1000000
700.20141.030.893.151.67
500.50241.651.535.412.43Oil found
301.20302.062.926.763.06
301.80362.354.588.112.92
303.15422.667.369.463.18
Table 11. Second group of water flooding experiment results.
ta /minv/mL·min−1Q/mLQo/mLp/MPaInjection Multiples/PVRecovery/%Qa/m3·MPa−1Remarks
00.20000000
50.21.000.681.530.2325.560.65
50.22.000.992.680.4537.220.75Water breakthrough
70.23.401.002.890.7737.591.18
100.25.401.003.331.2237.591.62
150.28.401.003.561.8937.592.36
200.212.401.053.682.7939.473.37
300.218.401.053.784.1439.474.87
30.224.401.103.785.5041.356.46
300.230.401.103.786.8541.358.04
300.236.401.113.858.2041.739.45
300.242.401.273.839.5547.7411.08
300.248.401.273.8410.9047.7412.59
300.254.401.304.1112.2548.8713.24
600.266.401.364.6114.9551.1314.40
600.278.401.484.4517.6655.6417.62
600.290.401.504.8920.3656.3918.49
600.2102.41.535.0323.0657.5220.36
600.2114.41.535.1225.7757.5222.34
Table 12. The core 32 physical property parameters and experimental conditions.
Parameters
Ka/×10−3 μm2φ/%T/γd/g/cm3μo/μwKw/×10−3 μm2L/cm
3.229714.21780.9934.232.836.08
Parameters
μd/mPa·sD/cmSwi/%k/%SorV/cm3vw/mL·min−1
0.672.3639.7836.40.2413.780.20
Parameters
A/cm2μo/mPa·sQ0/mLpWO/MPaμw/mPa·sγW/g/cm3η/%
4.3722.752.282.2110.650.9960.09
Table 13. Third oil saturation experiment results of experiments.
ta/minv/mL·min−1Q/mLQw/mLp/MPaInjection Multiples/PVK/×10−3 μm2Remarks
00.100000
500.2101.030.992.651.29
700.2241.111.26.351.06
500.3341.371.478.991.30
500.4441.541.5611.641.64Oil breakthrough
300.4501.662.7813.230.92
300.5561.872.8614.811.11
300.5621.952.8716.401.11
601742.012.9219.582.18
601.6862.017.3622.751.39
601.8982.287.2525.931.58
1203.21222.288.6432.282.36
Table 14. Third group experiment: first water flooding followed by air injection experiments.
ta/minV/mL·min−1Q/mLQo/mLP/MPaInjection Multiples/PVRecovery/%Qa/m3·MPa−1Oxygen Content/%Remarks
00.2000000-
50.21.000.625.360.2627.190.19-
100.23.000.835.840.7936.400.51-Water breakthrough
50.24.001.045.901.0645.470.68-
20.24.401.125.961.1649.200.74-
20.24.801.136.211.2749.650.77-
20.25.201.146.351.3850.100.82-
10.25.401.156.401.4350.440.84-
20.25.801.195.891.5352.190.98-
50.26.801.233.141.8053.952.1710.8Gas breakthrough
50.27.801.273.022.0655.702.588.7
100.29.801.273.022.5955.703.257.1
100.211.801.342.503.1258.774.727.0
100.213.801.342.503.6558.775.525.6
200.217.801.372.504.7160.097.124.6
300.223.801.372.506.3060.099.524.1

