
In Situ Production of Copper Oxide Nanoparticles in a Binary Molten Salt for Concentrated Solar Power Plant Applications

 ,
,
Abstract
:1. Introduction
2. Methodology
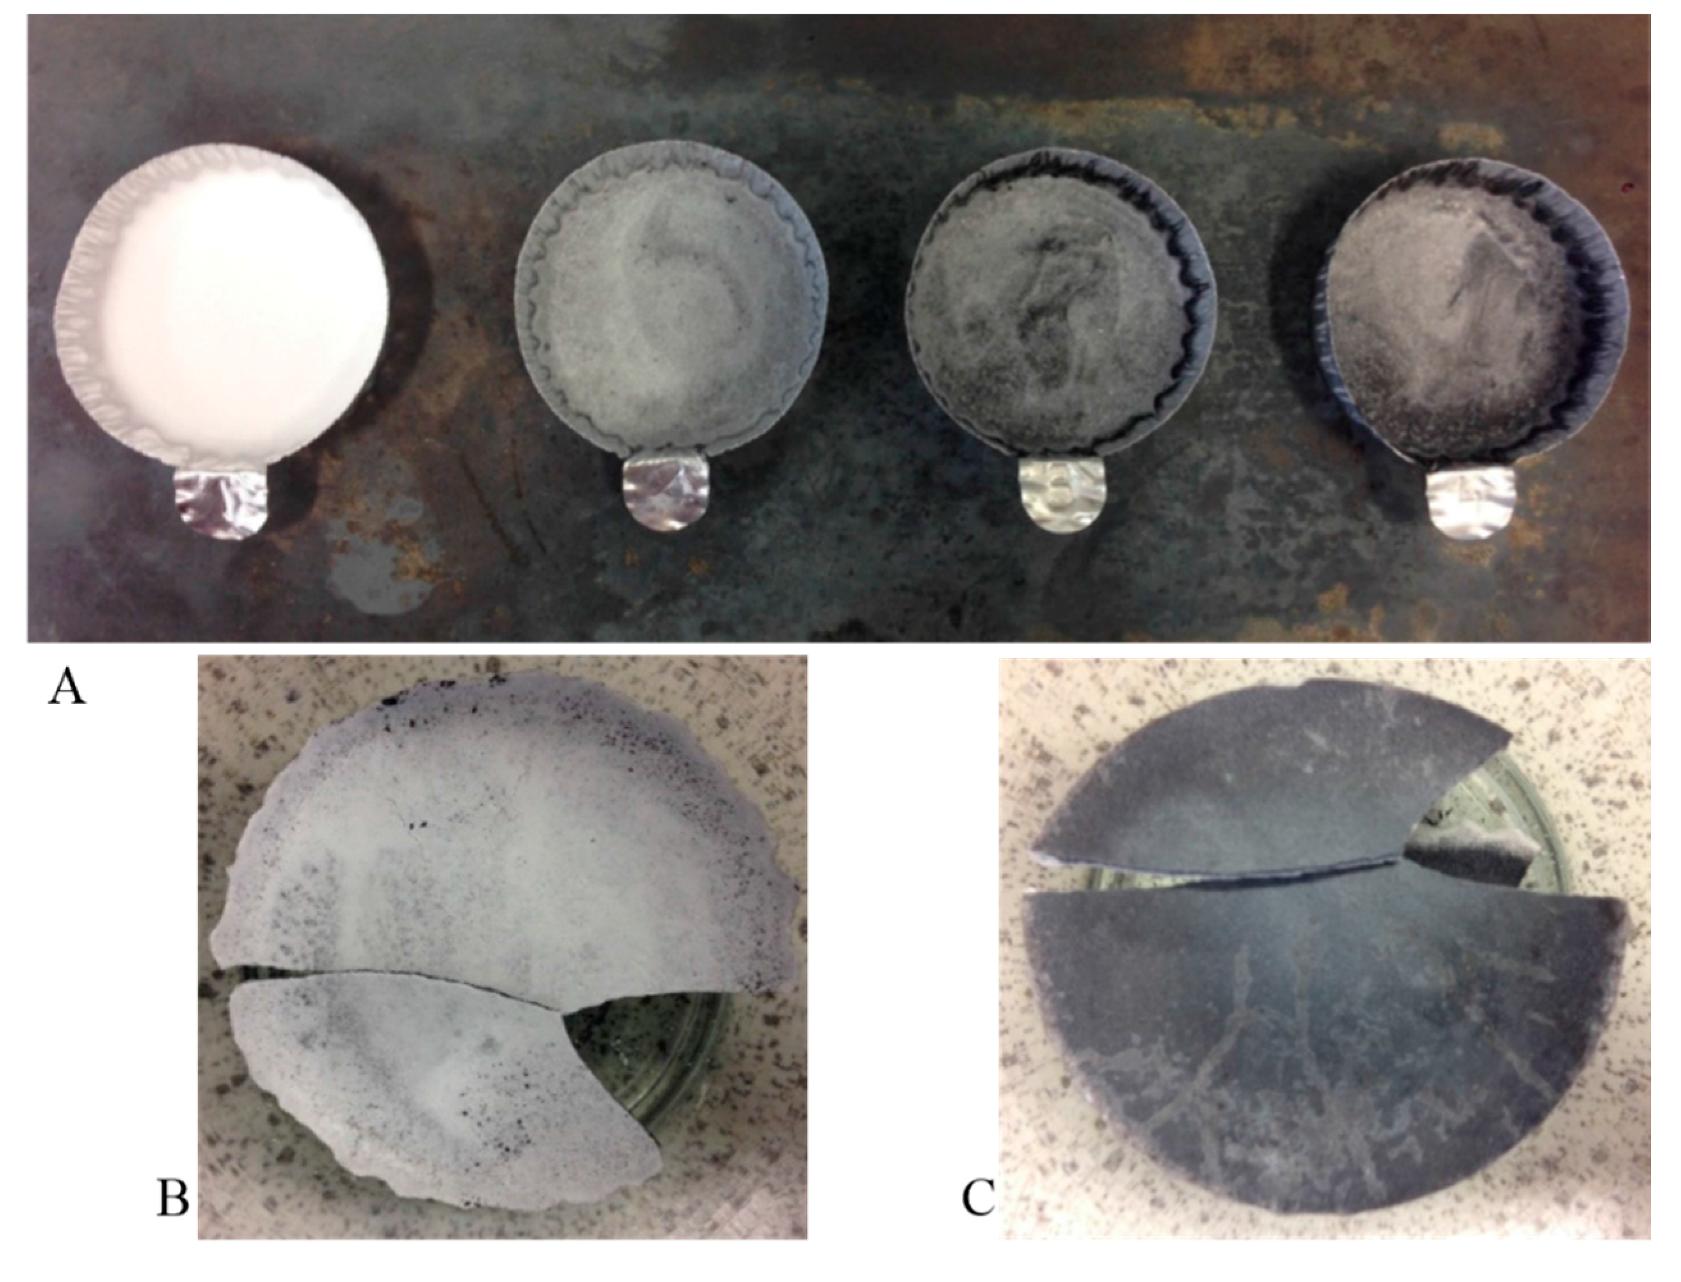
2.1. Sample Preparation
2.1.1. DSC
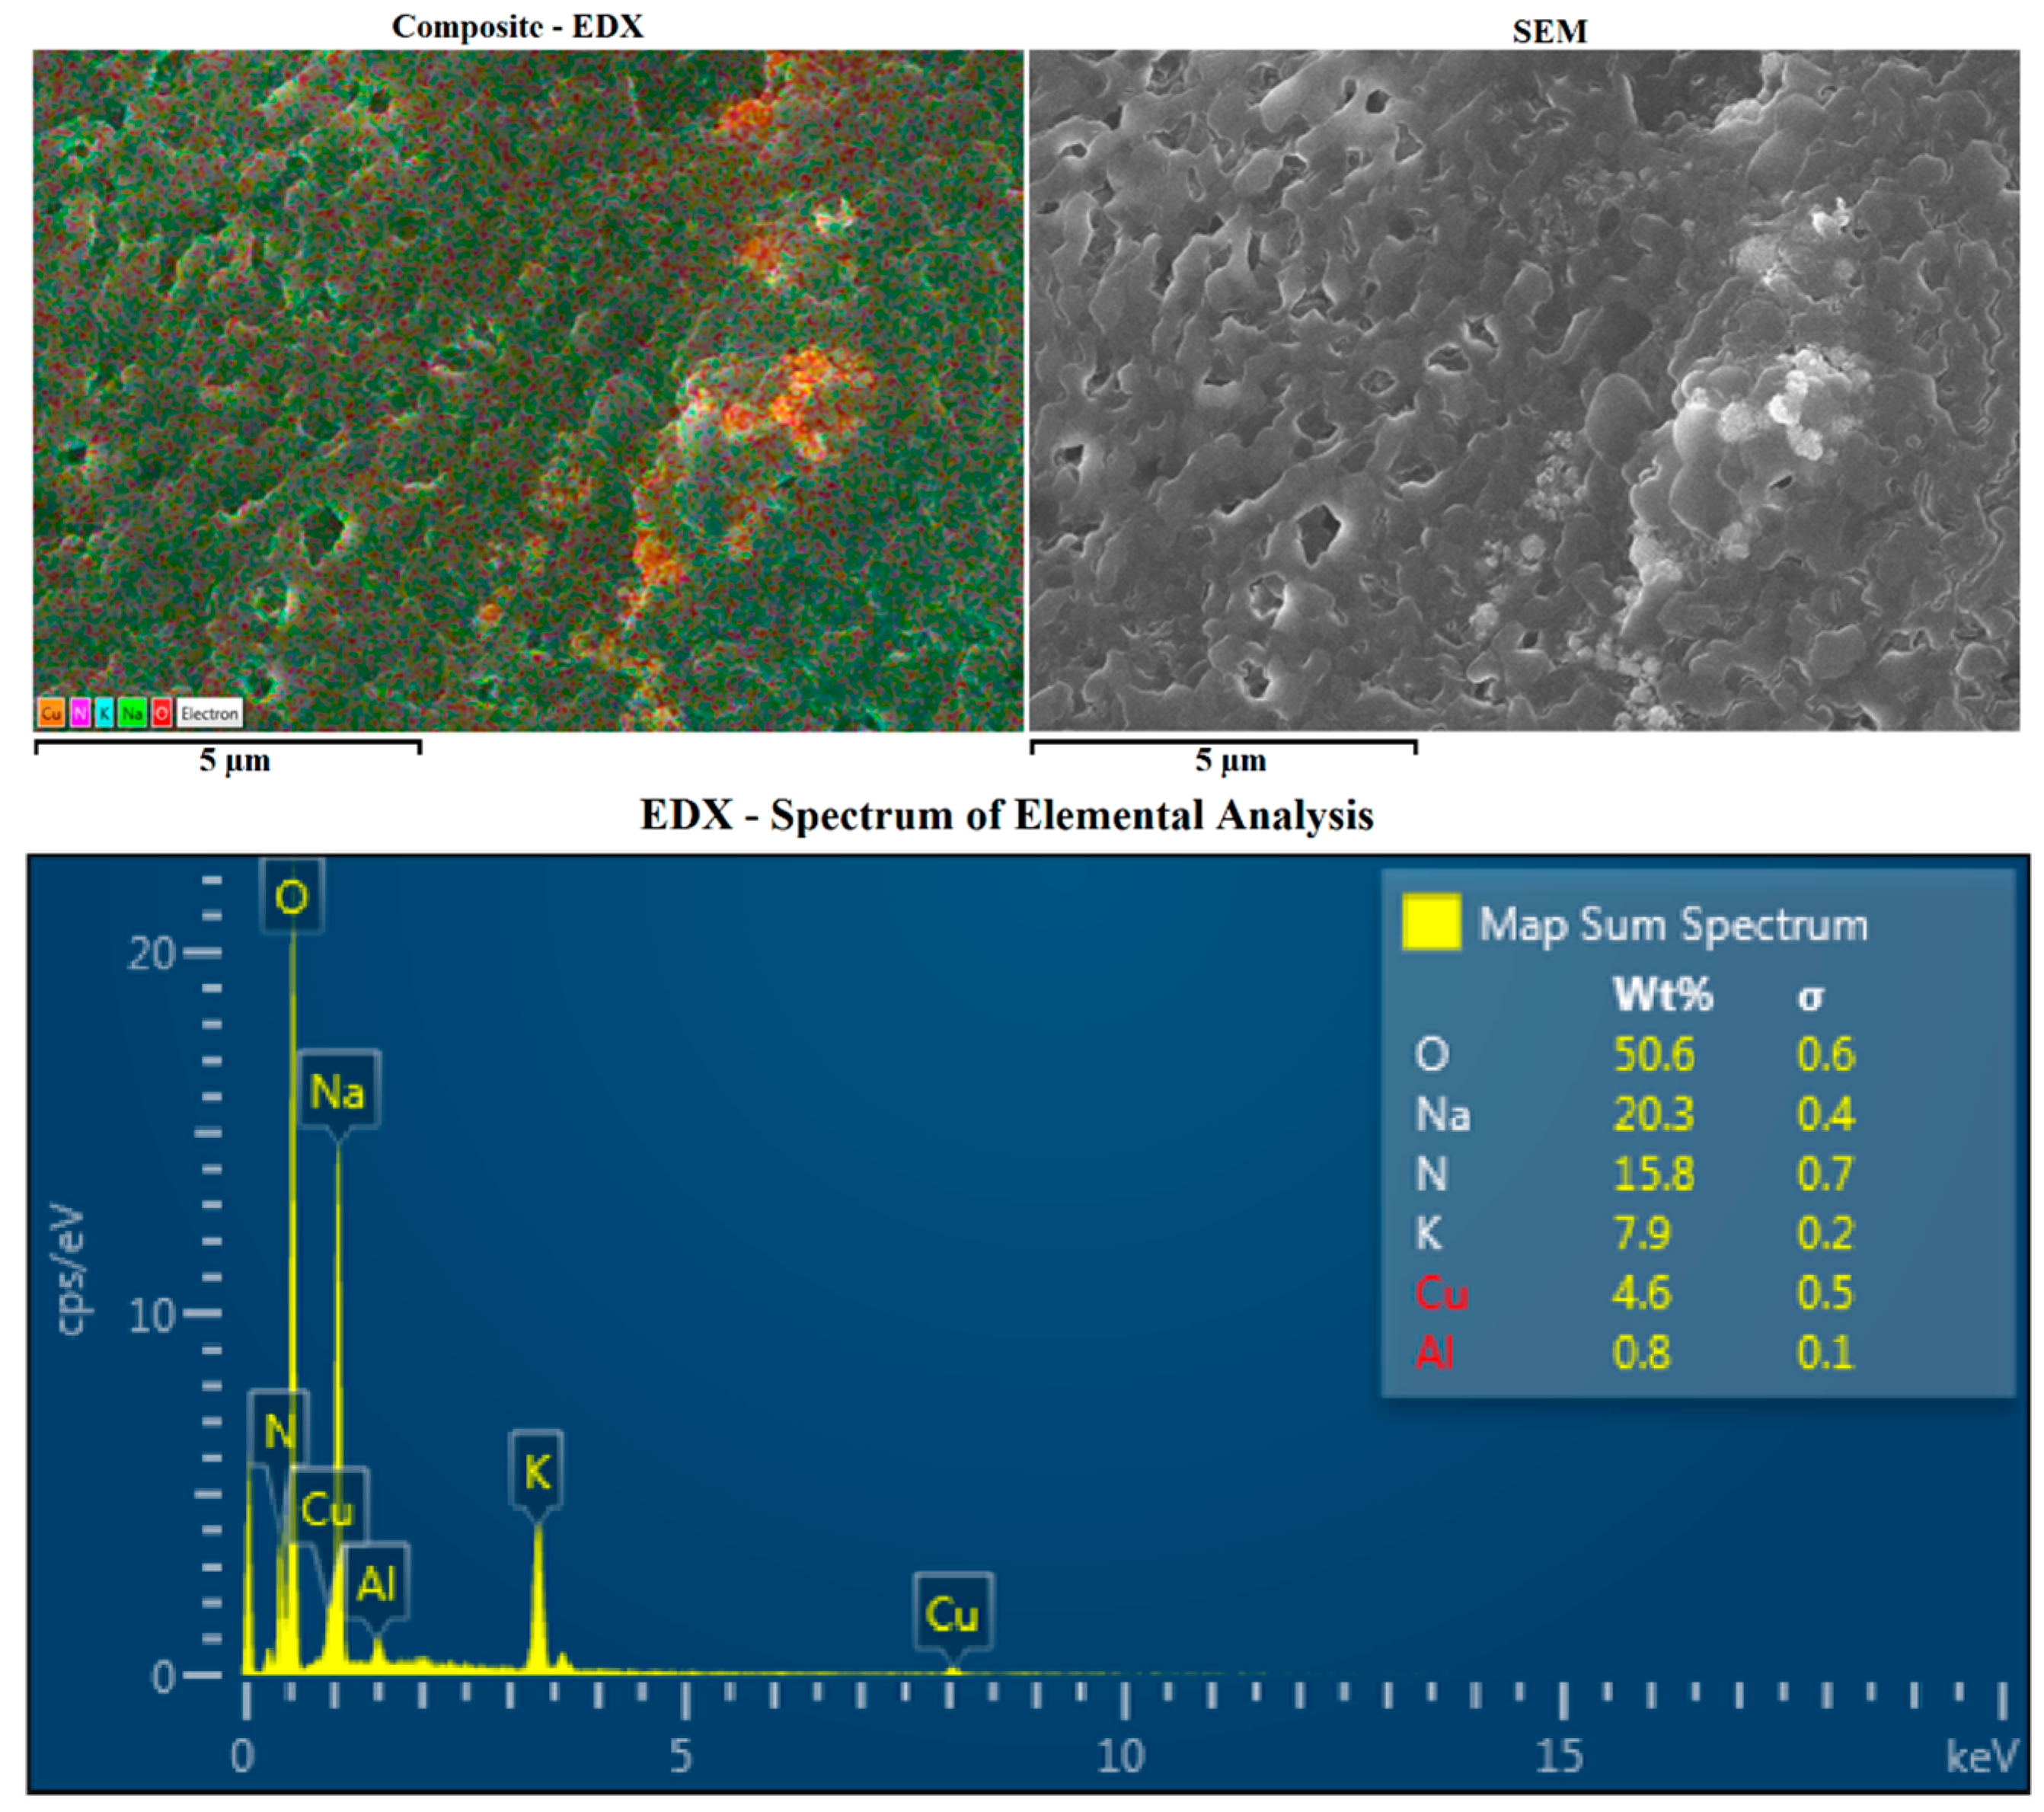
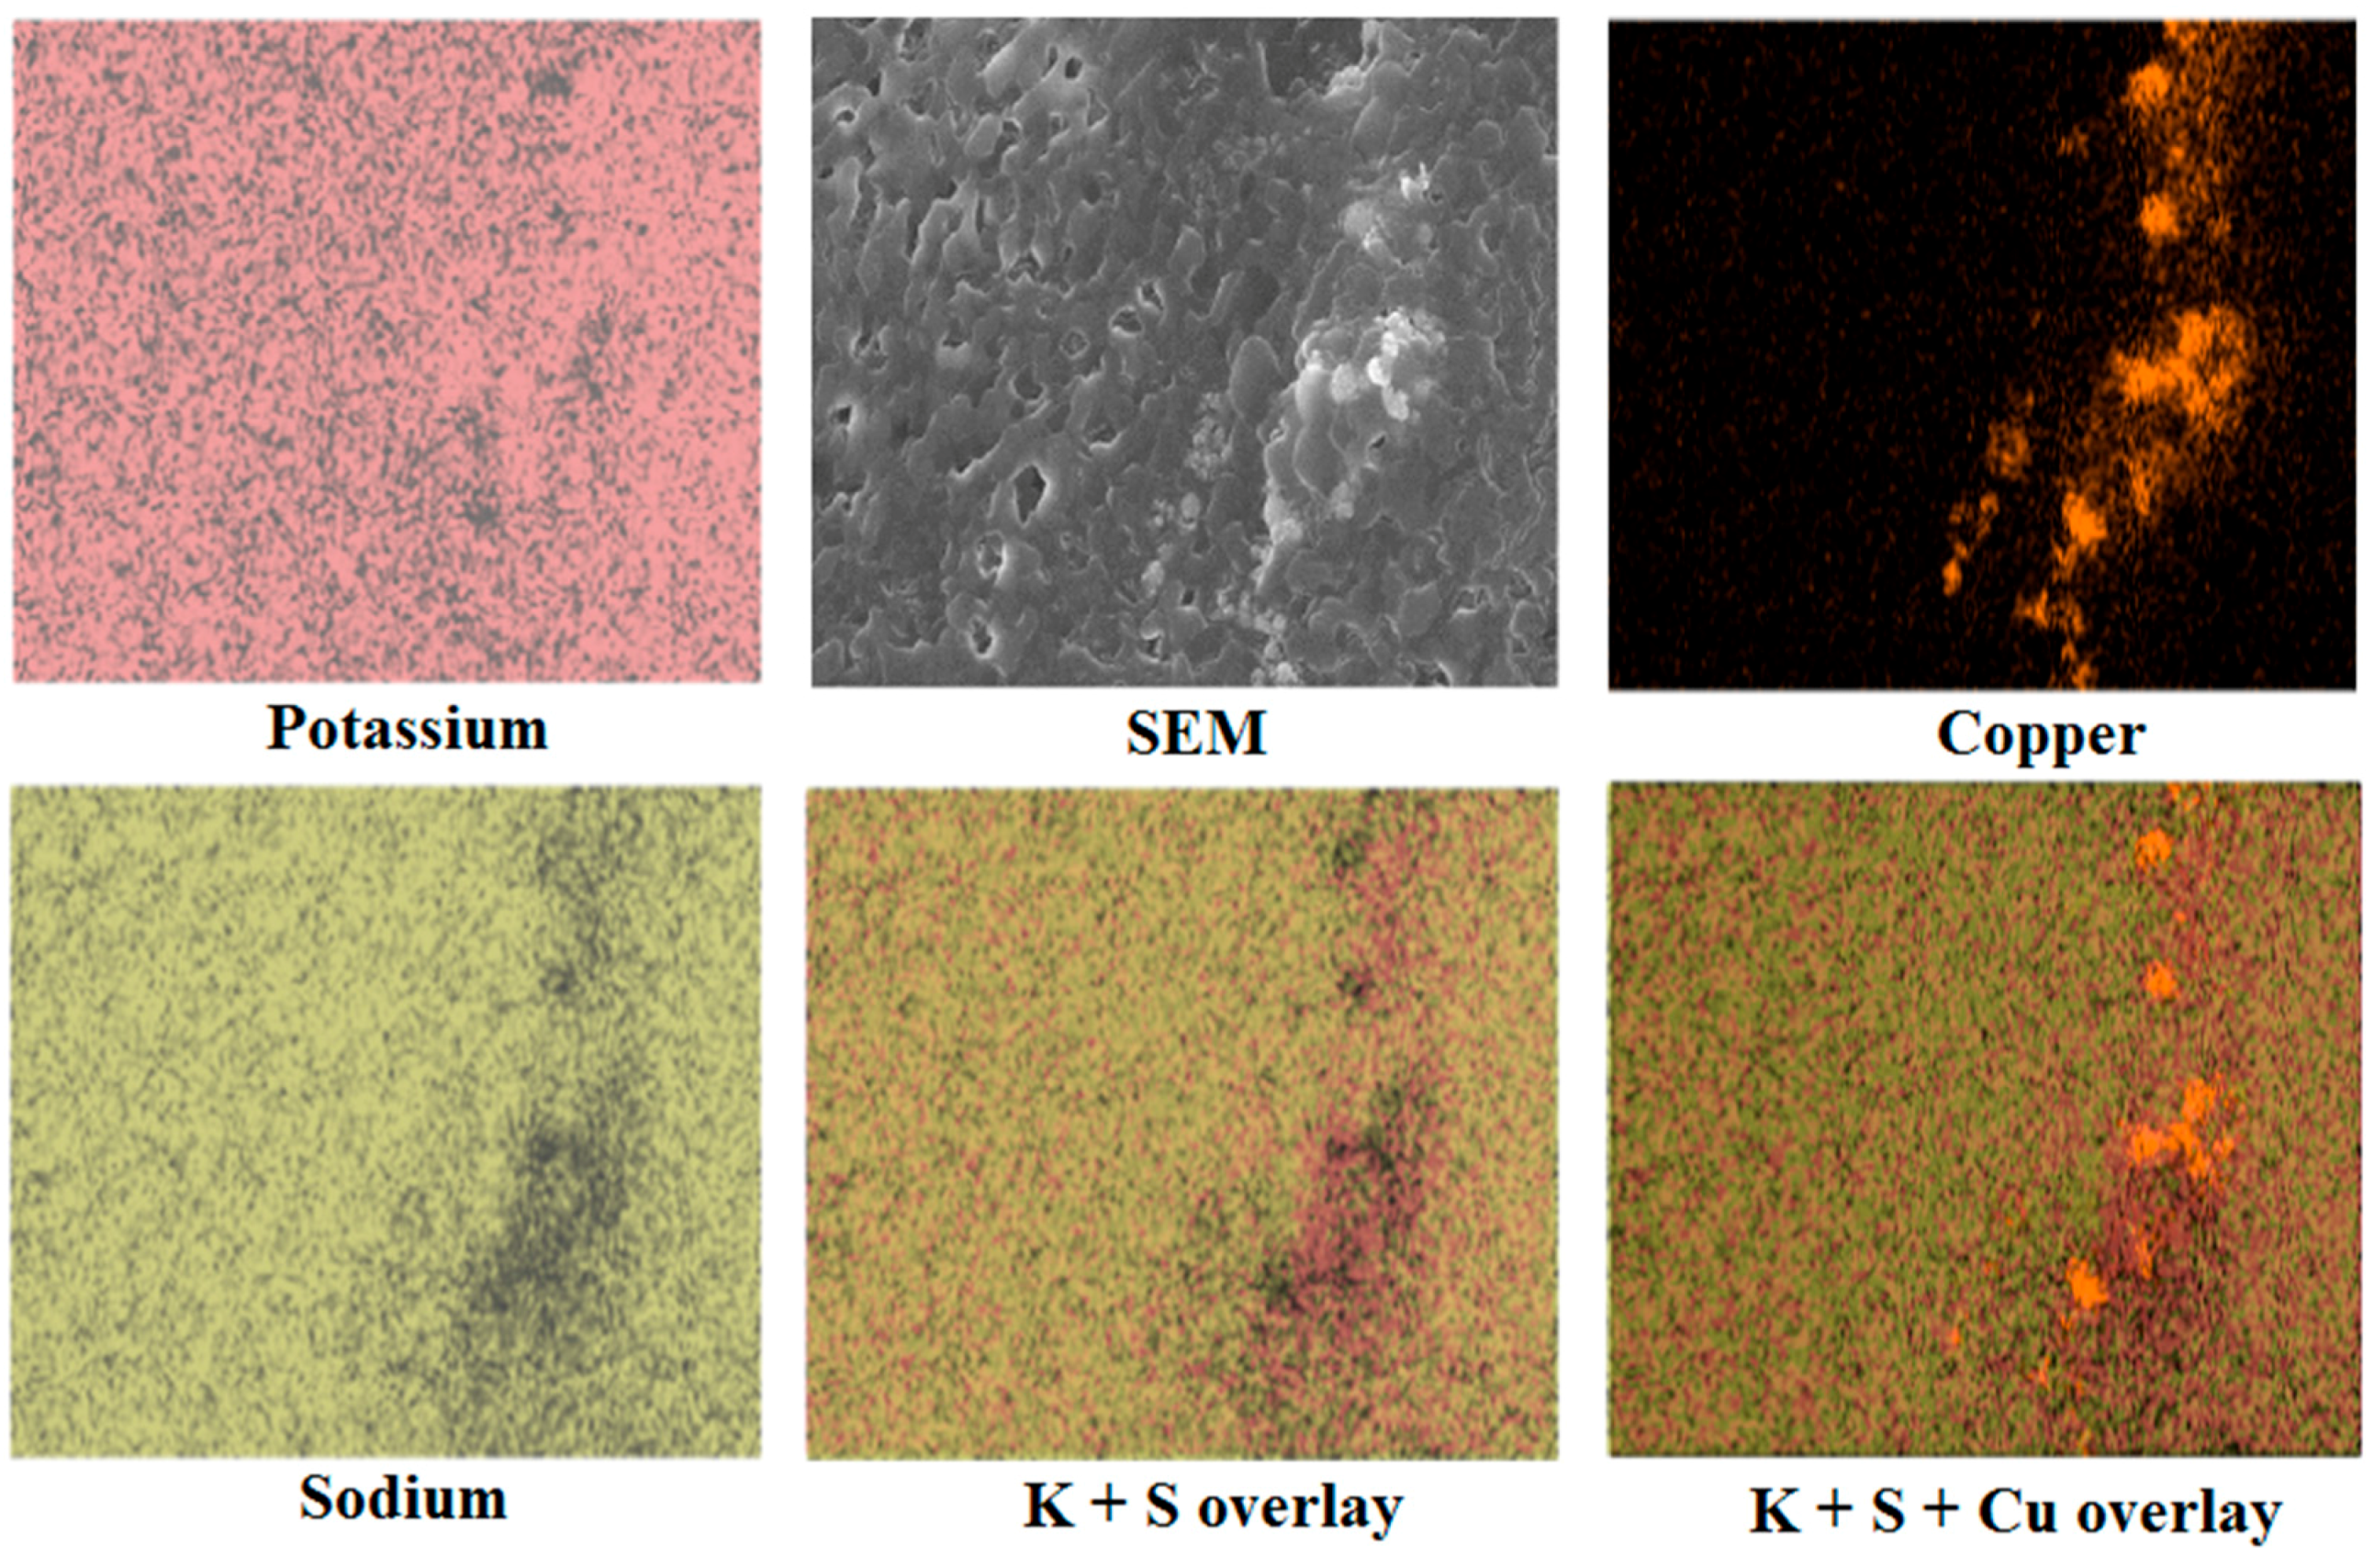
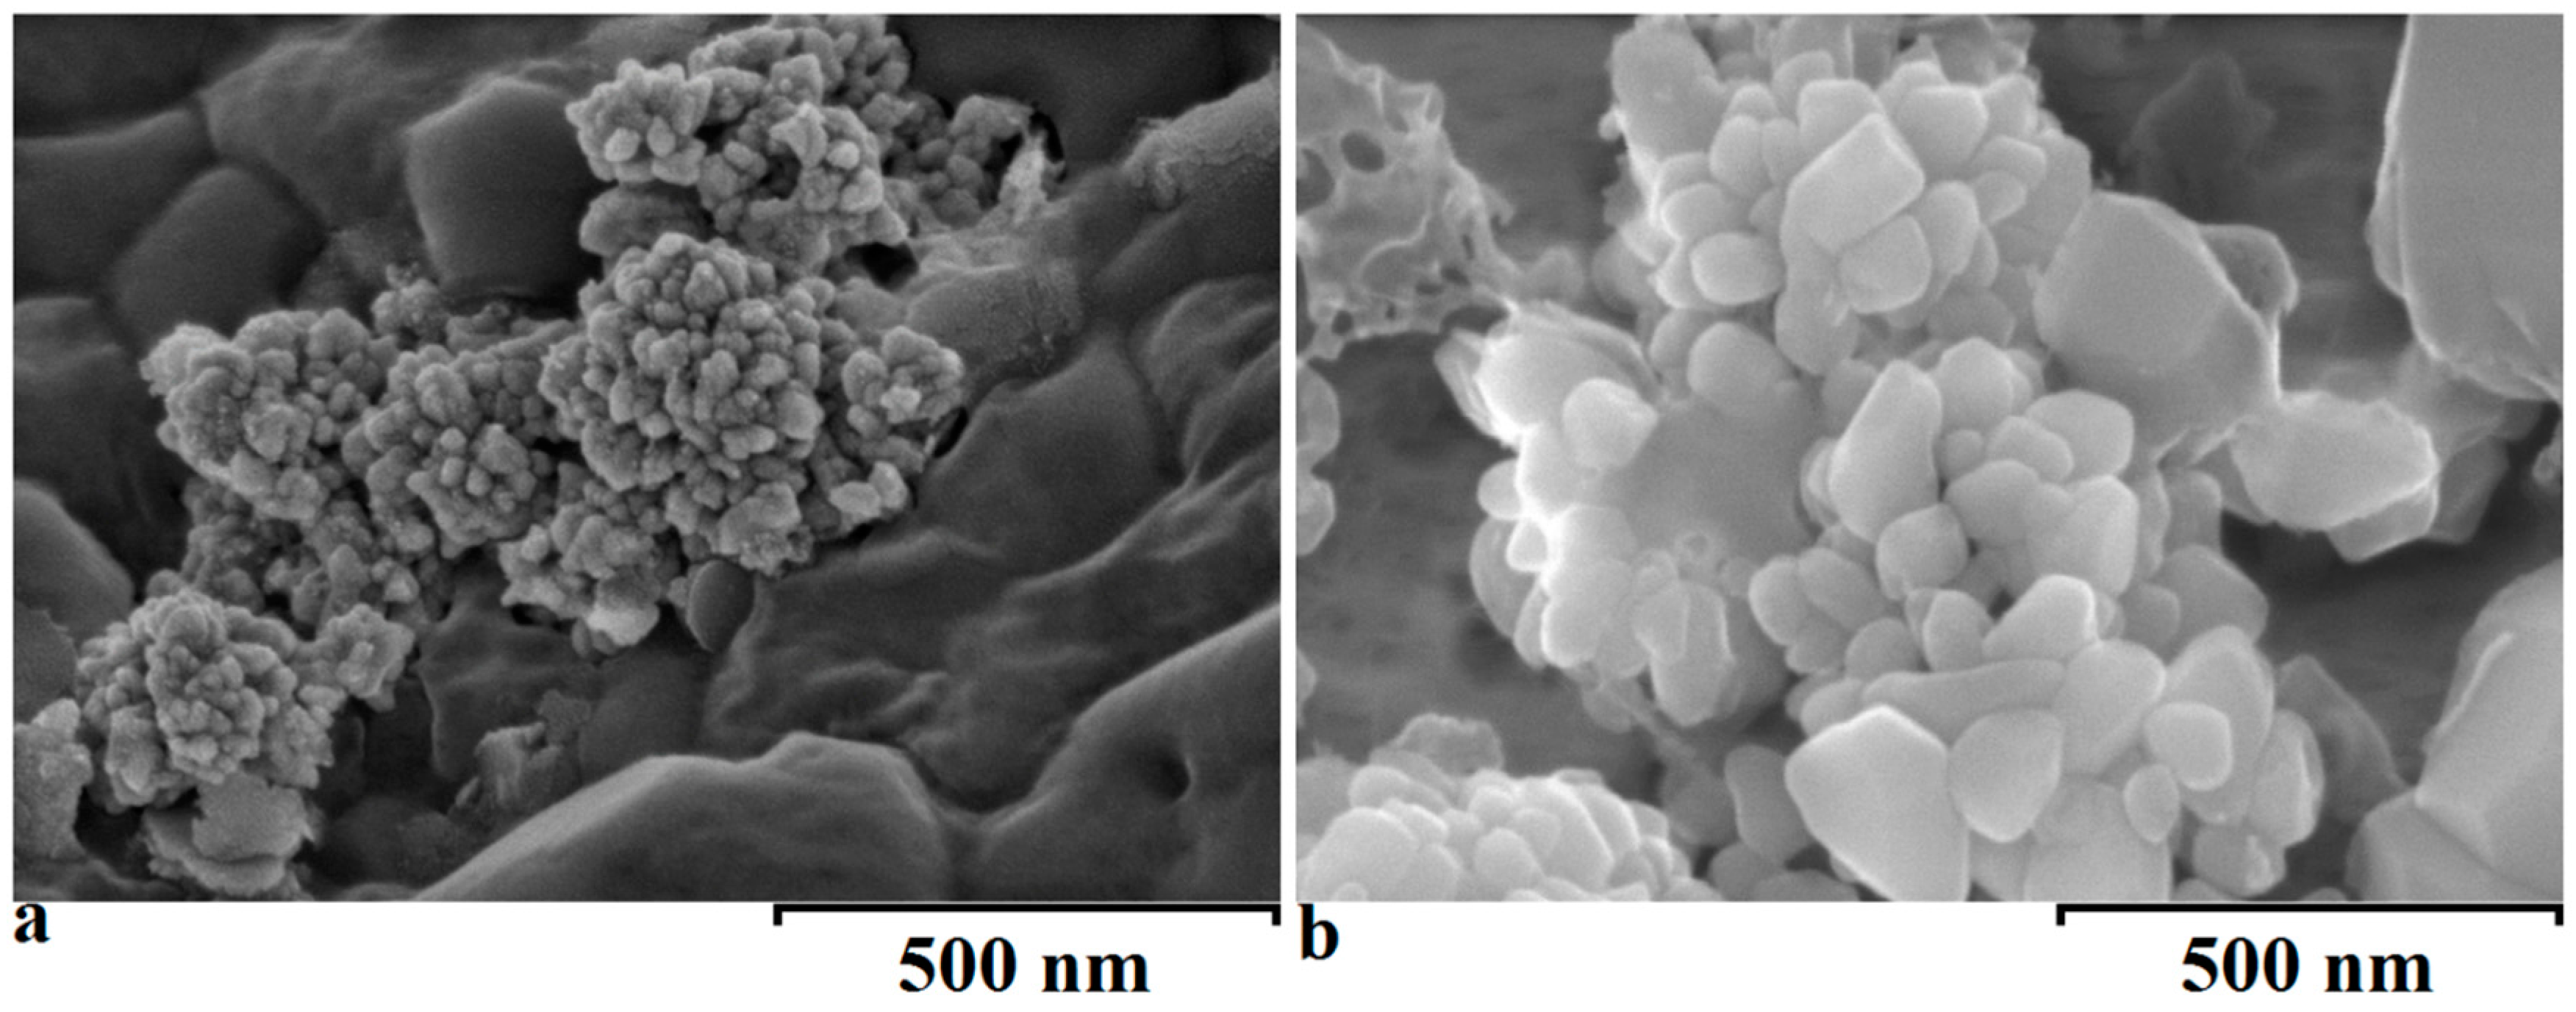
2.1.2. SEM and EDX
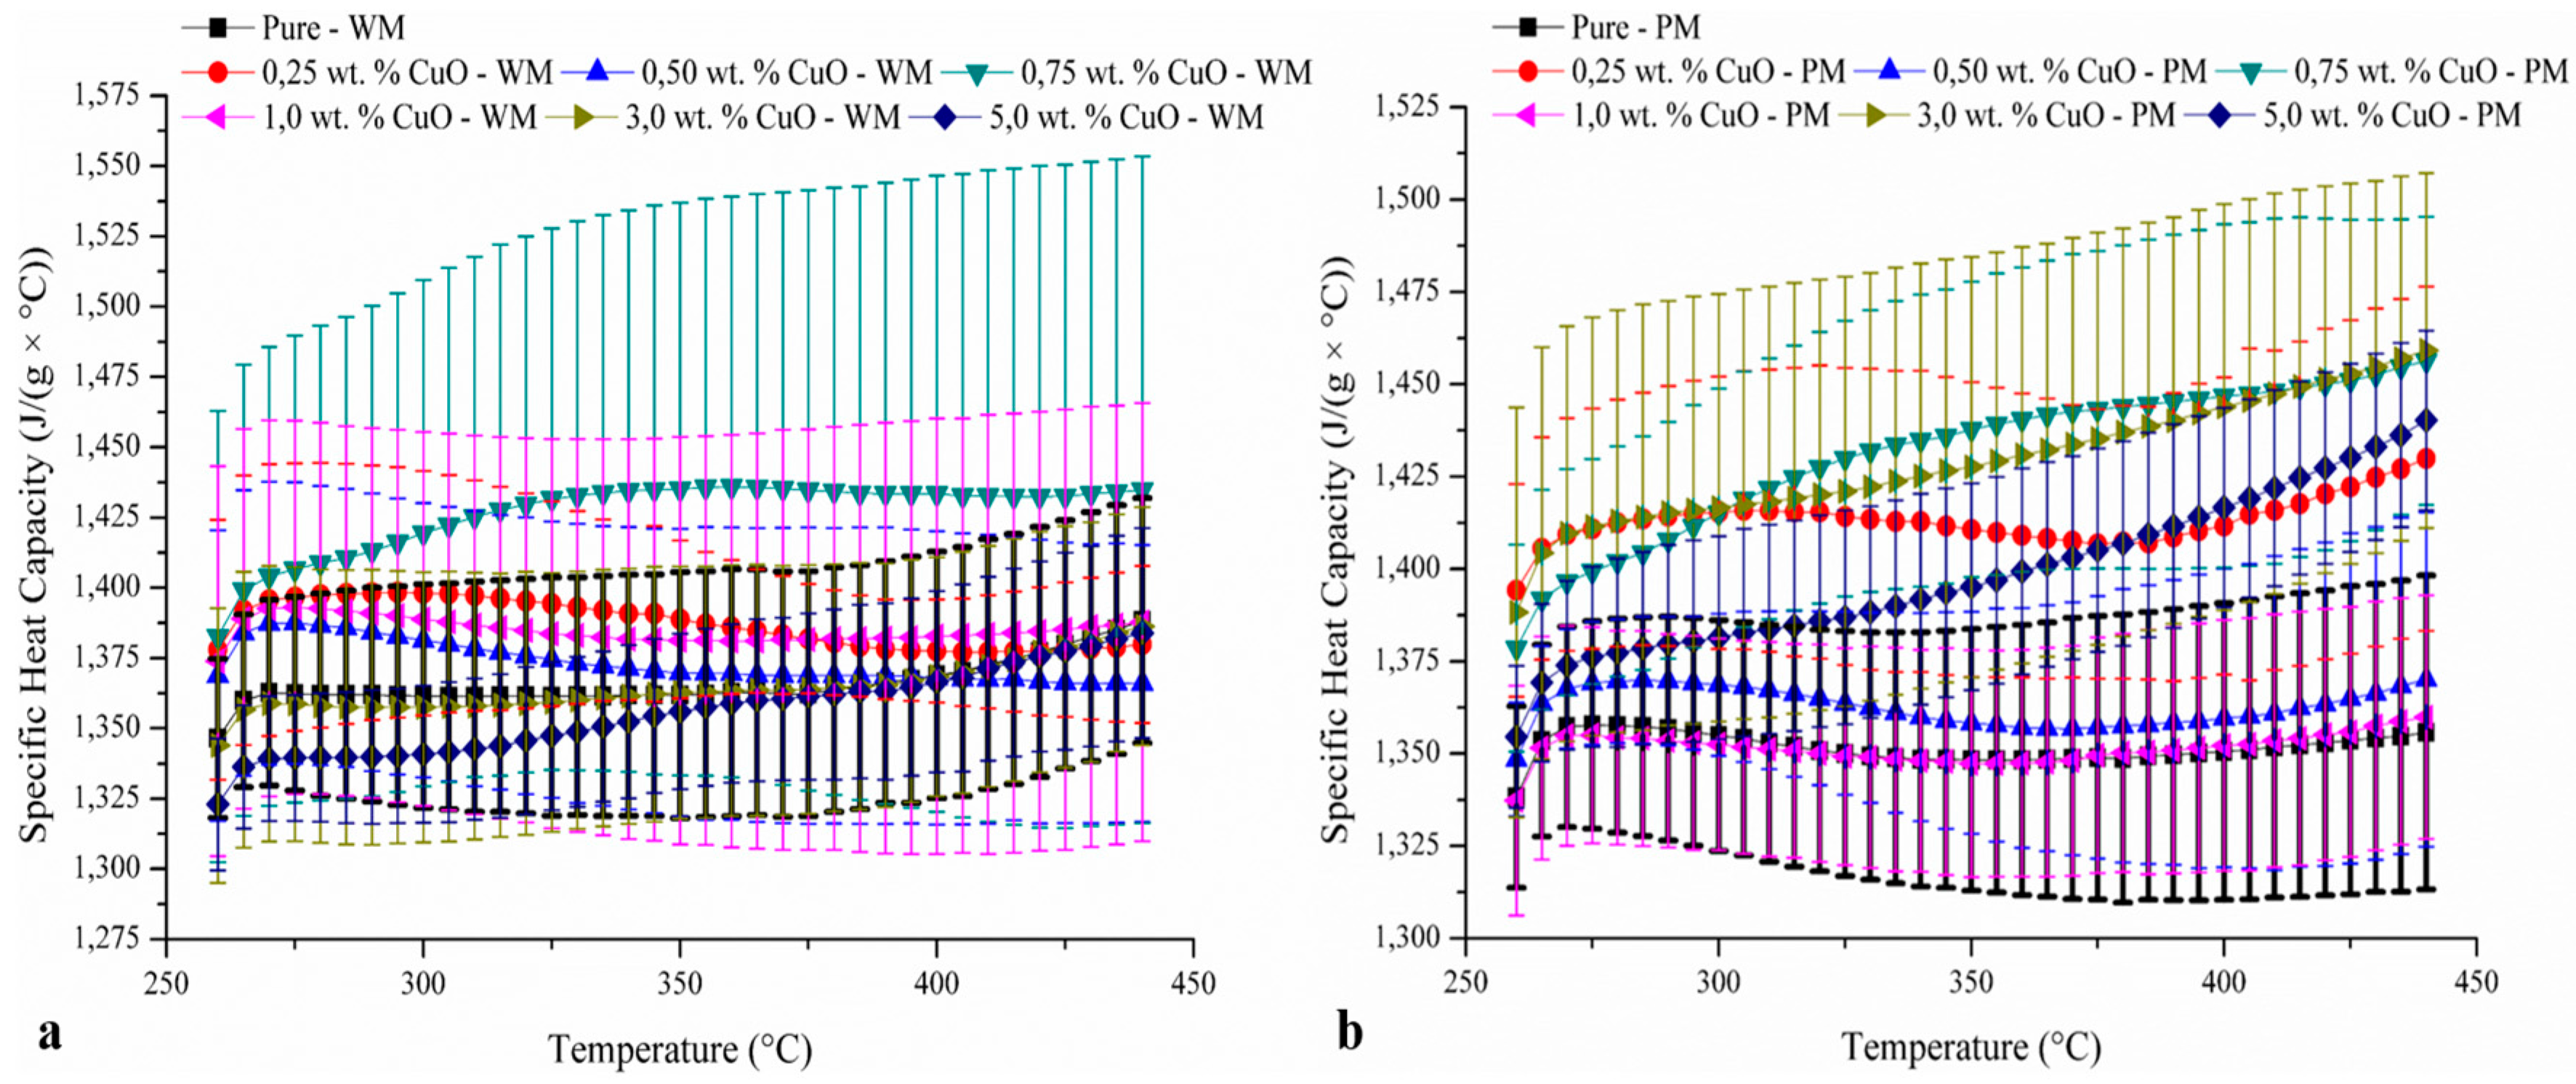
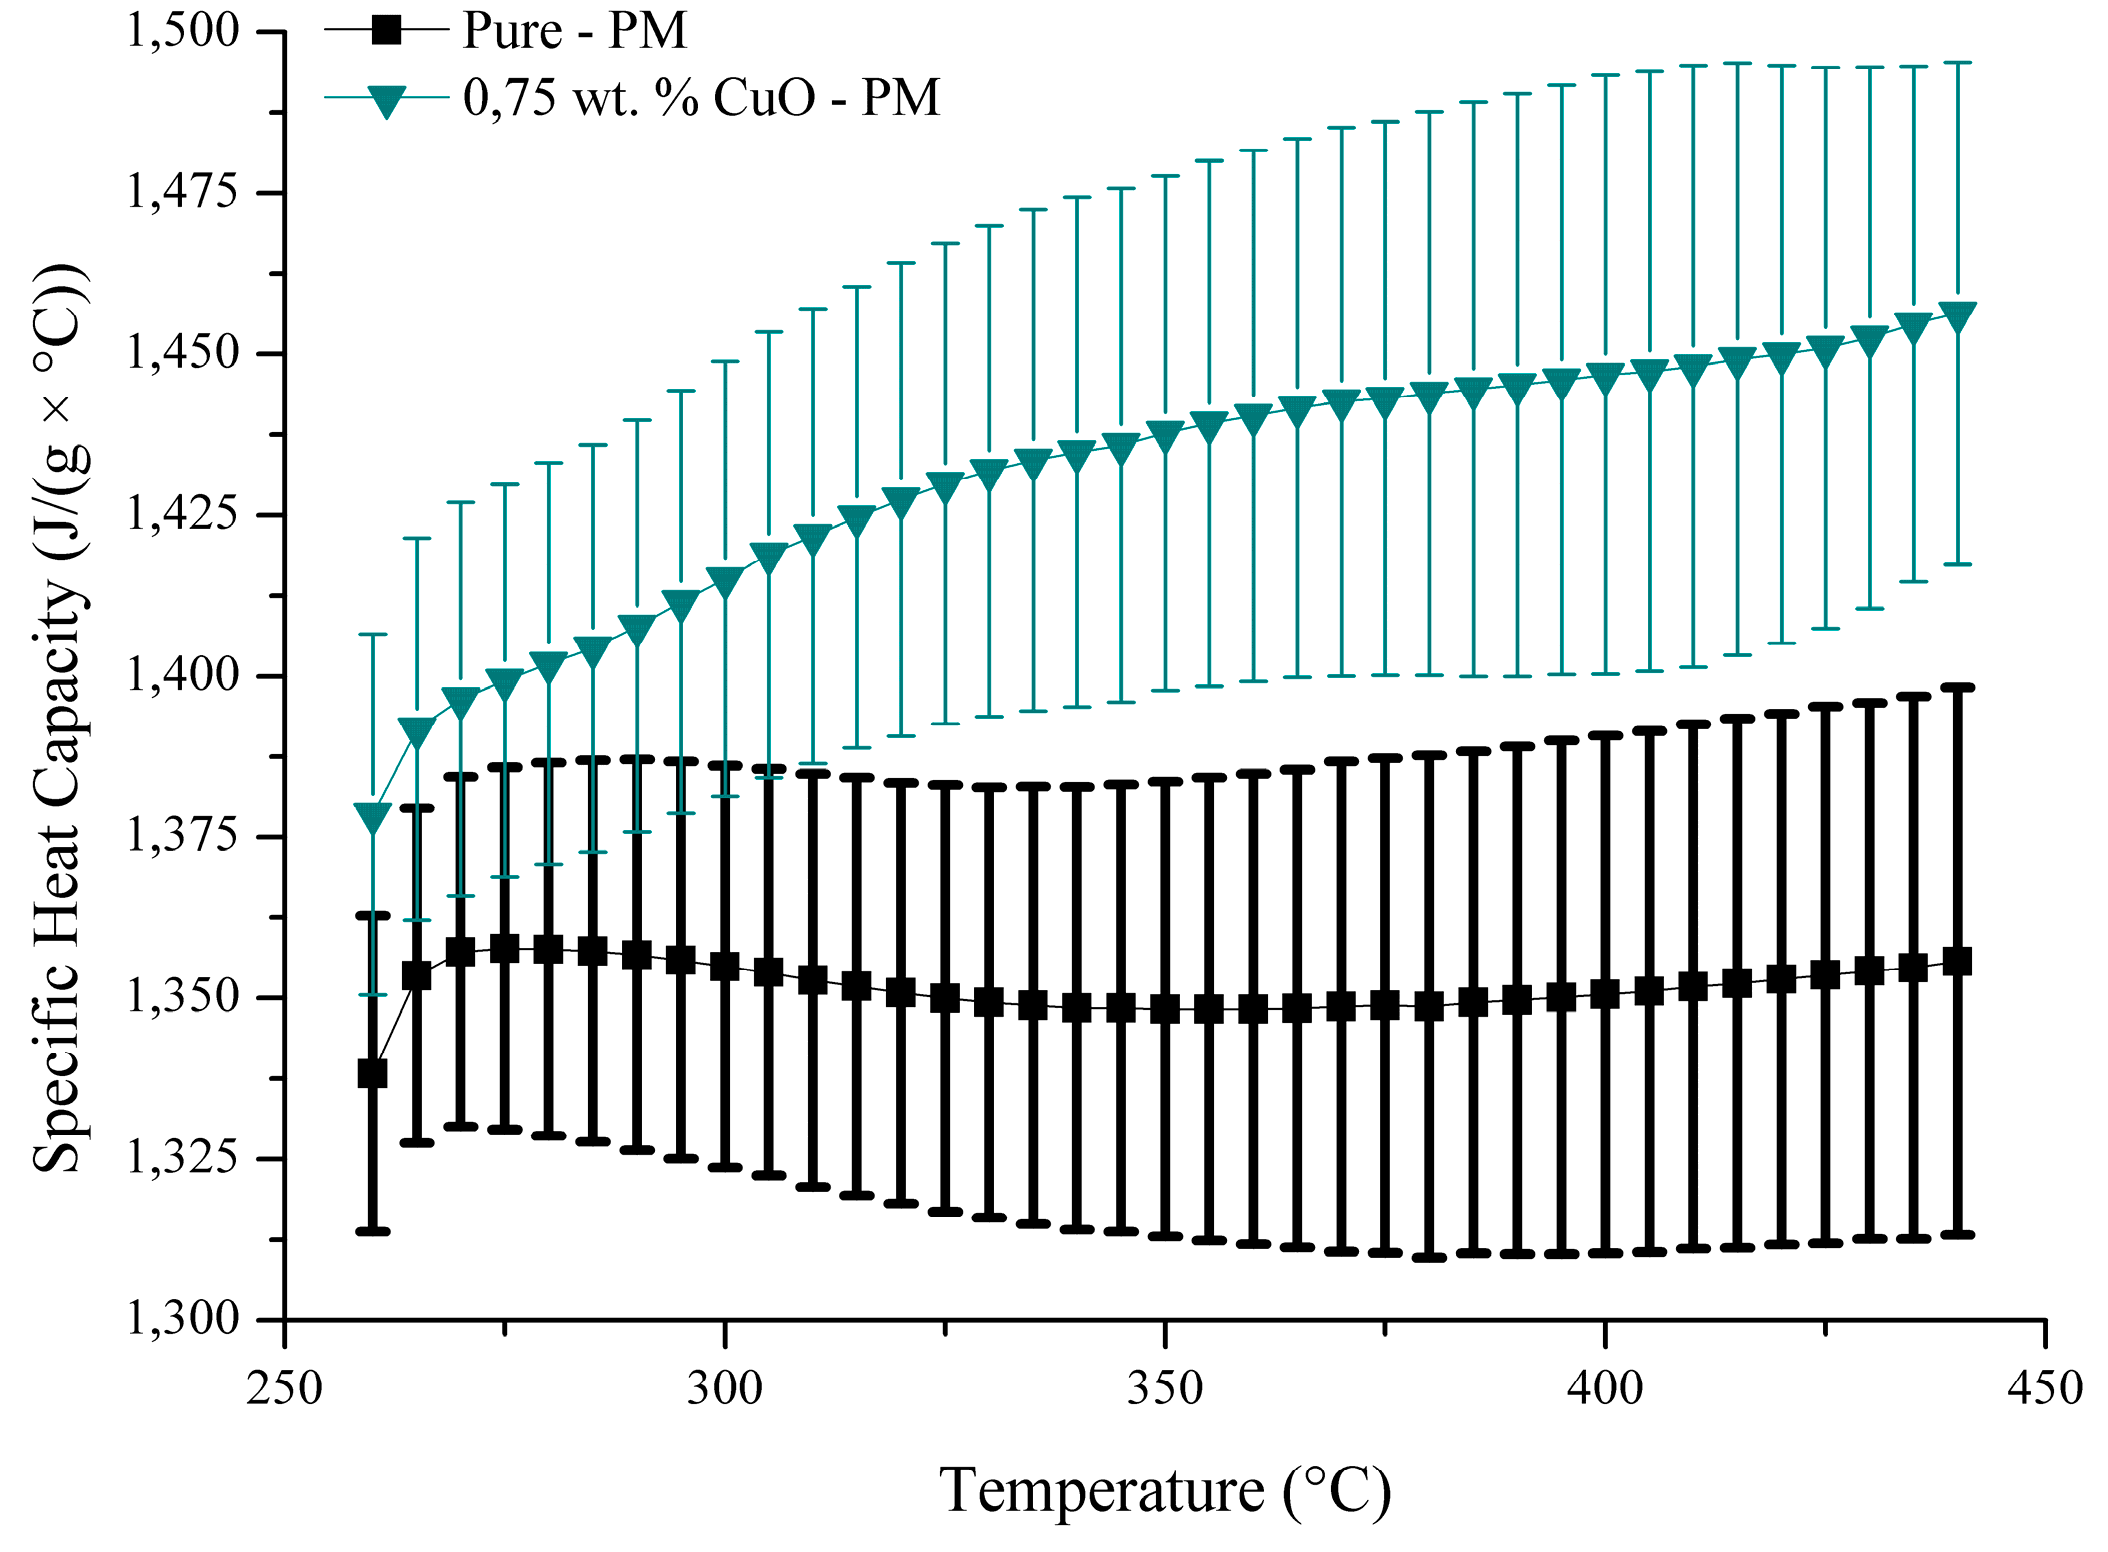
3. Results and Discussion
4. Conclusions
Acknowledgments
Author Contributions
Conflicts of Interest
References
- Medrano, M.; Gil, A.; Martorell, I.; Potau, X.; Cabeza, L.F. State of the art on high-temperature thermal energy storage for power generation. Part 2—Case studies. Renew. Sustain. Energy Rev. 2010, 14, 56–72. [Google Scholar] [CrossRef]
- Shin, D.; Banerjee, D. Effects of silica nanoparticles on enhancing the specific heat capacity of carbonate salt eutectic (work in progress). Int. J. Struct. Chang. SOLIDS 2010, 2, 25–31. [Google Scholar]
- Shin, D.; Banerjee, D. Enhanced Specific Heat of Silica Nanofluid. J. Heat Transf. 2010, 133, 024501. [Google Scholar] [CrossRef]
- Shin, D.; Banerjee, D. Enhancement of specific heat capacity of high-temperature silica-nanofluids synthesized in alkali chloride salt eutectics for solar thermal-energy storage applications. Int. J. Heat Mass Transf. 2011, 54, 1064–1070. [Google Scholar] [CrossRef]
- Lu, M.-C.; Huang, C.-H. Specific heat capacity of molten salt-based alumina nanofluid. Nanoscale Res. Lett. 2013, 8, 292. [Google Scholar] [CrossRef] [PubMed]
- Tiznobaik, H.; Shin, D. Enhanced specific heat capacity of high-temperature molten salt-based nanofluids. Int. J. Heat Mass Transf. 2013, 57, 542–548. [Google Scholar] [CrossRef]
- Ho, M.X.; Pan, C. Optimal concentration of alumina nanoparticles in molten Hitec salt to maximize its specific heat capacity. Int. J. Heat Mass Transf. 2014, 70, 174–184. [Google Scholar] [CrossRef]
- Jo, B.; Banerjee, D. Enhanced specific heat capacity of molten salt-based nanomaterials: Effects of nanoparticle dispersion and solvent material. Acta Mater. 2014, 75, 80–91. [Google Scholar] [CrossRef]
- Wang, L.; Tan, Z.C.; Meng, S.G.; Liang, D.B.; Li, G.G. Enhancement of molar heat capacity of nanostructured Al2O3. J. Nanoparticle Res. 2001, 3, 483–487. [Google Scholar] [CrossRef]
- Wang, B.-X.; Zhou, L.-P.; Peng, X.-F. Surface and Size Effects on the Specific Heat Capacity of Nanoparticles. Int. J. Thermophys. 2006, 27, 139–151. [Google Scholar] [CrossRef]
- Tan, Z.-C.; Wang, L.; Shi, Q. Study of heat capacity enhancement in some nanostructured materials. Pure Appl. Chem. 2009, 81, 1871–1880. [Google Scholar] [CrossRef]
- Xue, L.; Keblinski, P.; Phillpot, S.R.; Choi, S.U.-S.; Eastman, J.A. Effect of liquid layering at the liquid–solid interface on thermal transport. Int. J. Heat Mass Transf. 2004, 47, 4277–4284. [Google Scholar] [CrossRef]
- Liu, S.; Wu, D.; Liu, J.; Nian, Y.; Qiu, P. Development of a novel molten-salt filled with nanoparticles for concentration solar plants. In Proceedings of the 2nd IET Renewable Power Generation Conference, Beijing, China, 9–11 September 2013; pp. 1–4. [Google Scholar] [CrossRef]
- Dudda, B.; Shin, D. Effect of nanoparticle dispersion on specific heat capacity of a binary nitrate salt eutectic for concentrated solar power applications. Int. J. Therm. Sci. 2013, 69, 37–42. [Google Scholar] [CrossRef]
- Chieruzzi, M.; Cerritelli, G.F.; Miliozzi, A.; Kenny, J.M. Effect of nanoparticles on heat capacity of nanofluids based on molten salts as PCM for thermal energy storage. Nanoscale Res. Lett. 2013, 8, 448. [Google Scholar] [CrossRef] [PubMed]
- Jo, B.; Banerjee, D. Enhanced Specific Heat Capacity of Molten Salt-Based Carbon Nanotubes Nanomaterials. J. Heat Transf. 2015, 137, 091013. [Google Scholar] [CrossRef]
- Shin, D.; Banerjee, D. Enhanced Specific Heat Capacity of Nanomaterials Synthesized by Dispersing Silica Nanoparticles in Eutectic Mixtures. J. Heat Transf. 2013, 135, 032801. [Google Scholar] [CrossRef]
- Seo, J.; Shin, D. Enhancement of specific heat of ternary nitrate (LiNO3-NaNO3-KNO3) salt by doping with SiO2 nanoparticles for solar thermal energy storage. IET Micro Nano Lett. 2014, 9, 817–820. [Google Scholar] [CrossRef]
- Schuller, M.; Shao, Q.; Lalk, T. Experimental investigation of the specific heat of a nitrate–alumina nanofluid for solar thermal energy storage systems. Int. J. Therm. Sci. 2015, 91, 142–145. [Google Scholar] [CrossRef]
- Andreu-Cabedo, P.; Mondragon, R.; Hernandez, L.; Martinez-Cuenca, R.; Cabedo, L.; Julia, J.E. Increment of specific heat capacity of solar salt with SiO2 nanoparticles. Nanoscale Res. Lett. 2014, 9, 582. [Google Scholar] [CrossRef] [PubMed]
- Lasfargues, M.; Bell, A.; Ding, Y. In situ production of titanium dioxide nanoparticles in molten salt phase for thermal energy storage and heat-transfer fluid applications. J. Nanopart. Res. 2016, 18, 150. [Google Scholar] [CrossRef] [PubMed]
- Lasfargues, M.; Geng, Q.; Cao, H.; Ding, Y. Mechanical Dispersion of Nanoparticles and Its Effect on the Specific Heat Capacity of Impure Binary Nitrate Salt Mixtures. Nanomaterials 2015, 5, 1136–1146. [Google Scholar] [CrossRef] [PubMed]
- Shin, D.; Banerjee, D. Specific heat of nanofluids synthesized by dispersing alumina nanoparticles in alkali salt eutectic. Int. J. Heat Mass Transf. 2014, 74, 210–214. [Google Scholar] [CrossRef]
- Harris, A.D.; Kalbus, L.H. Decomposition of copper(II) sulfate pentahydrate: A sequential gravimetric analysis. J. Chem. Educ. 1979, 56, 417. [Google Scholar] [CrossRef]


| Author | Nanoparticle | Size | Concentration | Base Fluid(s) | Measured Temperature in DSC (°C) | cp Enhancement(%) | Ref. | |
|---|---|---|---|---|---|---|---|---|
| Diameter | Length | |||||||
| Shin and Banerjee—November 2010 (IJSCS) | SiO2 | 1–20 nm | - | 1.5 wt. % | Li2CO3 + K2CO3 (62:38 molar ratio) | 350–550 | Solid Phase: 20–42%, Liquid Phase: 73–101% | [2] |
| Shin and Banerjee—November 2010 (Journal of Heat Transfer) | SiO2 | 20–30 nm | - | 1.0 wt. % | BaCl2 + NaCl+CaCl2+LiCl | 495–555 | Liquid Phase: 14.5% | [3] |
| Shin and Banerjee—February 2011 (IJHMT) | SiO2 | 10 nm | - | 1.0 wt. % | Li2CO3 + K2CO3 (62:38 molar ratio) | 525–555 | Liquid Phase: 19–24% | [4] |
| Tiznobaik and Shin—November 2012 (IJHMT) | SiO2 | 5, 10, 30 and 60 nm | - | 1.0 wt. % | Li2CO3 + K2CO3 (62:38 molar ratio) | 150–550 | Solid Phase: 23–28%, Liquid Phase: 22–26% | [6] |
| Shin and Banerjee—February 2013 (Journal of Heat Transfer) | SiO2 | 2-20 nm | - | 1.5% wt. % | Li2CO3 + K2CO3 (62:38 molar ratio) | 150–560 | Solid Phase: 38–54%, Liquid Phase: 118–124% | [17] |
| Dudda and Shin—February 2013 (IJTS) | SiO2 | 5, 10, 30 and 60 nm | - | 1.0 wt. % | NaNO3 + KNO3 (60:40 weight % ratio) | 150–450 | Solid Phase: 3–10%, Liquid Phase: 8–24% | [14] |
| Ho and Pan—October 2013 (IJHMT) | Al2O3 | <50 nm | - | 0.016 wt. %, 0.0625 wt. %, 0.125 wt. %, 0.25 wt. %, 0.5 wt. %, 1 wt. % and 2 wt. % | NaNO3 + KNO3 + NaNO2 (7:53:40 weight % ratio) | 200–350 | Liquid Phase: −5.7–+19.9% | [7] |
| Lu and Huang—2013 (Nanoscale Research Letters) | Al2O3 | 13 and 90 nm | - | 0.9 vol. %, 2.7 vol. % and 4.6 vol. % | NaNO3 + KNO3 (60:40 weight % ratio) | 290–340 | Liquid Phase: negative values | [5] |
| Chieruzzi, et al. 2013 (Nanoscale Research Letters) | Al2O3, SiO2, SiO2-Al2O3, and TiO2 | 13 nm, 7 nm, 2–200 nm and 2 nm | - | 0.5 wt. %, 1.0 wt. % and 1.5 wt. % | NaNO3 + KNO3 (60:40 weight % ratio) | 155–295 | Solid Phase: −17–+58%, Liquid Phase: −20–+23% | [15] |
| Liu, et al. 2013 (2nd IET Renewable Power Generation) | MWCNTs, Au | Au (5 nm and 10 nm) | - | MWCNTs (0.5 wt. %, 1 wt. % and 1.5 wt. %) | NaNO3 + KNO3 (60:40 weight % ratio) | 370–420 | Liquid Phase: up to +100% for MWCNTs and +220% for Au | [13] |
| Shin and Banerjee—February 2014 (IJHMT) | Al2O3 | 10 nm | - | 1.0 wt. % | Li2CO3 + K2CO3 (62:38 molar ratio) | 355–555 | Liquid Phase: ~32% | [23] |
| Jo and Banerjee—May 2014 (ActaMaterialia) | Graphite | - | 50 nm | 0.1 wt. % | Li2CO3 + K2CO3 (74.6:25.4–62:38–34:64 molar ratios) | Solid Phase: 250 and 400, Liquid Phase: 525 and 555 | Solid Phase: 28–40%, Liquid Phase: 17–57% | [8] |
| Seo and Shin-September 2014 (Micro and Nano Letters) | SiO2 | 60 nm | - | 1.0 wt. % | LiNO3 + NaNO3 + KNO3 (38:15:47 molar ratio) | 150–400 | Solid and Liquid Phase: 13% | [18] |
| Andreu—Cabedo, et al. 2014 (Nanoscale Research Letters) | SiO2 | 12 nm | - | 0.5 wt. %, 1.0 wt. %, 1.5 wt. %, 2.0 wt. % | NaNO3 + KNO3 (60:40 weight % ratio) | 250–450 | Liquid Phase: 3–25% | [2] |
| Jo and Banerjee—September 2015 (Journal of Heat Transfer) | MWCNTs | 10–30 nm | 1.5 µm | 0.1 wt. %, 0.5 wt. %, 1 wt. % and 5 wt. % | Li2CO3 + K2CO3 (62:38 molar ratio) | Solid Phase: 250 and 400, Liquid Phase: 525–555 | Solid Phase: 12%, Liquid Phase: 15% | [16] |
| Schuller, et al. 2015 (IJTS) | Al2O3 | 40 nm | - | 0.125%, 0.25%, 0.5%, 0.75, 1%, 1.5% and 2% (nominal mass fraction) | NaNO3 + KNO3 (60:40 weight % ratio) | 250–450 | Liquid Phase: up to 31% | [19] |
| Lasfargues, et al.—June 2015 (MDPI-nanomaterials) | CuO, TiO2 | CuO—29 nm and TiO2—34 nm | - | 0.1 wt. %, 0.5 wt. %, 1 wt. % and 1.5 wt. % | NaNO3 + KNO3 (60:40 weight % ratio) | 250–450 | Liquid Phase: up to 10% | [22] |
| Lasfargues, et al.—May 2016 (Springer-J Nanopart Res) | TiO2 | TiO2—16 nm | - | 1 wt. %, 2 wt. % and 3 wt. % | NaNO3 + KNO3 (60:40 weight % ratio) | 250–450 | Liquid Phase: max 7.5% | [21] |
| NaNO3 (g) | KNO3 (g) | CuSO4.5H2O (wt. %) | CuSO4.5H2O (g) | Total Weight (g) | Theoretical CuO (wt. %) after Production of Nanoparticles |
|---|---|---|---|---|---|
| 2.9925 | 1.995 | 0.25 | 0.0125 | 5 | 0.08 |
| 2.985 | 1.99 | 0.5 | 0.025 | 5 | 0.16 |
| 2.9775 | 1.985 | 0.75 | 0.0375 | 5 | 0.24 |
| 2.97 | 1.98 | 1 | 0.05 | 5 | 0.32 |
| 2.91 | 1.94 | 3 | 0.15 | 5 | 0.98 |
| 2.85 | 1.9 | 5 | 0.25 | 5 | 1.65 |
| Powder Mixing (PM) | Melting Point | SD | Enthalpy of Fusion | SD | Wet Mixing (WM) | Melting Point | SD | Enthalpy of Fusion | SD |
|---|---|---|---|---|---|---|---|---|---|
| °C | J/g | °C | J/g | ||||||
| 60% NaNO3 40% KNO3 | 221.49 | 0.20 | 107.25 | 2.27 | 60% NaNO3 40% KNO3 | 220.90 | 0.22 | 106.93 | 1.24 |
| 0.08 wt. % CuO | 218.29 | 0.13 | 107.84 | 0.84 | 0.08 wt. % CuO | 218.24 | 0.05 | 108.63 | 1.58 |
| 0.16 wt. % CuO | 218.01 | 0.19 | 105.23 | 1.56 | 0.16 wt. % CuO | 217.57 | 0.40 | 106.52 | 2.84 |
| 0.24 wt. % CuO | 217.91 | 0.05 | 106.53 | 1.41 | 0.24 wt. % CuO | 217.31 | 0.13 | 107.32 | 3.14 |
| 0.32 wt. % CuO | 217.91 | 0.11 | 108.02 | 1.82 | 0.32 wt. % CuO | 217.79 | 0.11 | 106.67 | 3.22 |
| 0.98 wt. % CuO | 217.64 | 0.22 | 107.19 | 2.54 | 0.98 wt. % CuO | 217.70 | 0.09 | 106.03 | 2.27 |
| 1.65 wt. % CuO | 217.69 | 0.18 | 104.80 | 1.00 | 1.65 wt. % CuO | 217.67 | 0.13 | 103.97 | 1.12 |
© 2017 by the authors. Licensee MDPI, Basel, Switzerland. This article is an open access article distributed under the terms and conditions of the Creative Commons Attribution (CC BY) license (http://creativecommons.org/licenses/by/4.0/).
Share and Cite
Lasfargues, M.; Stead, G.; Amjad, M.; Ding, Y.; Wen, D. In Situ Production of Copper Oxide Nanoparticles in a Binary Molten Salt for Concentrated Solar Power Plant Applications. Materials 2017, 10, 537. https://0-doi-org.brum.beds.ac.uk/10.3390/ma10050537
Lasfargues M, Stead G, Amjad M, Ding Y, Wen D. In Situ Production of Copper Oxide Nanoparticles in a Binary Molten Salt for Concentrated Solar Power Plant Applications. Materials. 2017; 10(5):537. https://0-doi-org.brum.beds.ac.uk/10.3390/ma10050537
Chicago/Turabian StyleLasfargues, Mathieu, Graham Stead, Muhammad Amjad, Yulong Ding, and Dongsheng Wen. 2017. "In Situ Production of Copper Oxide Nanoparticles in a Binary Molten Salt for Concentrated Solar Power Plant Applications" Materials 10, no. 5: 537. https://0-doi-org.brum.beds.ac.uk/10.3390/ma10050537