Manganese Phosphatizing Coatings: The Effects of Preparation Conditions on Surface Properties


Abstract
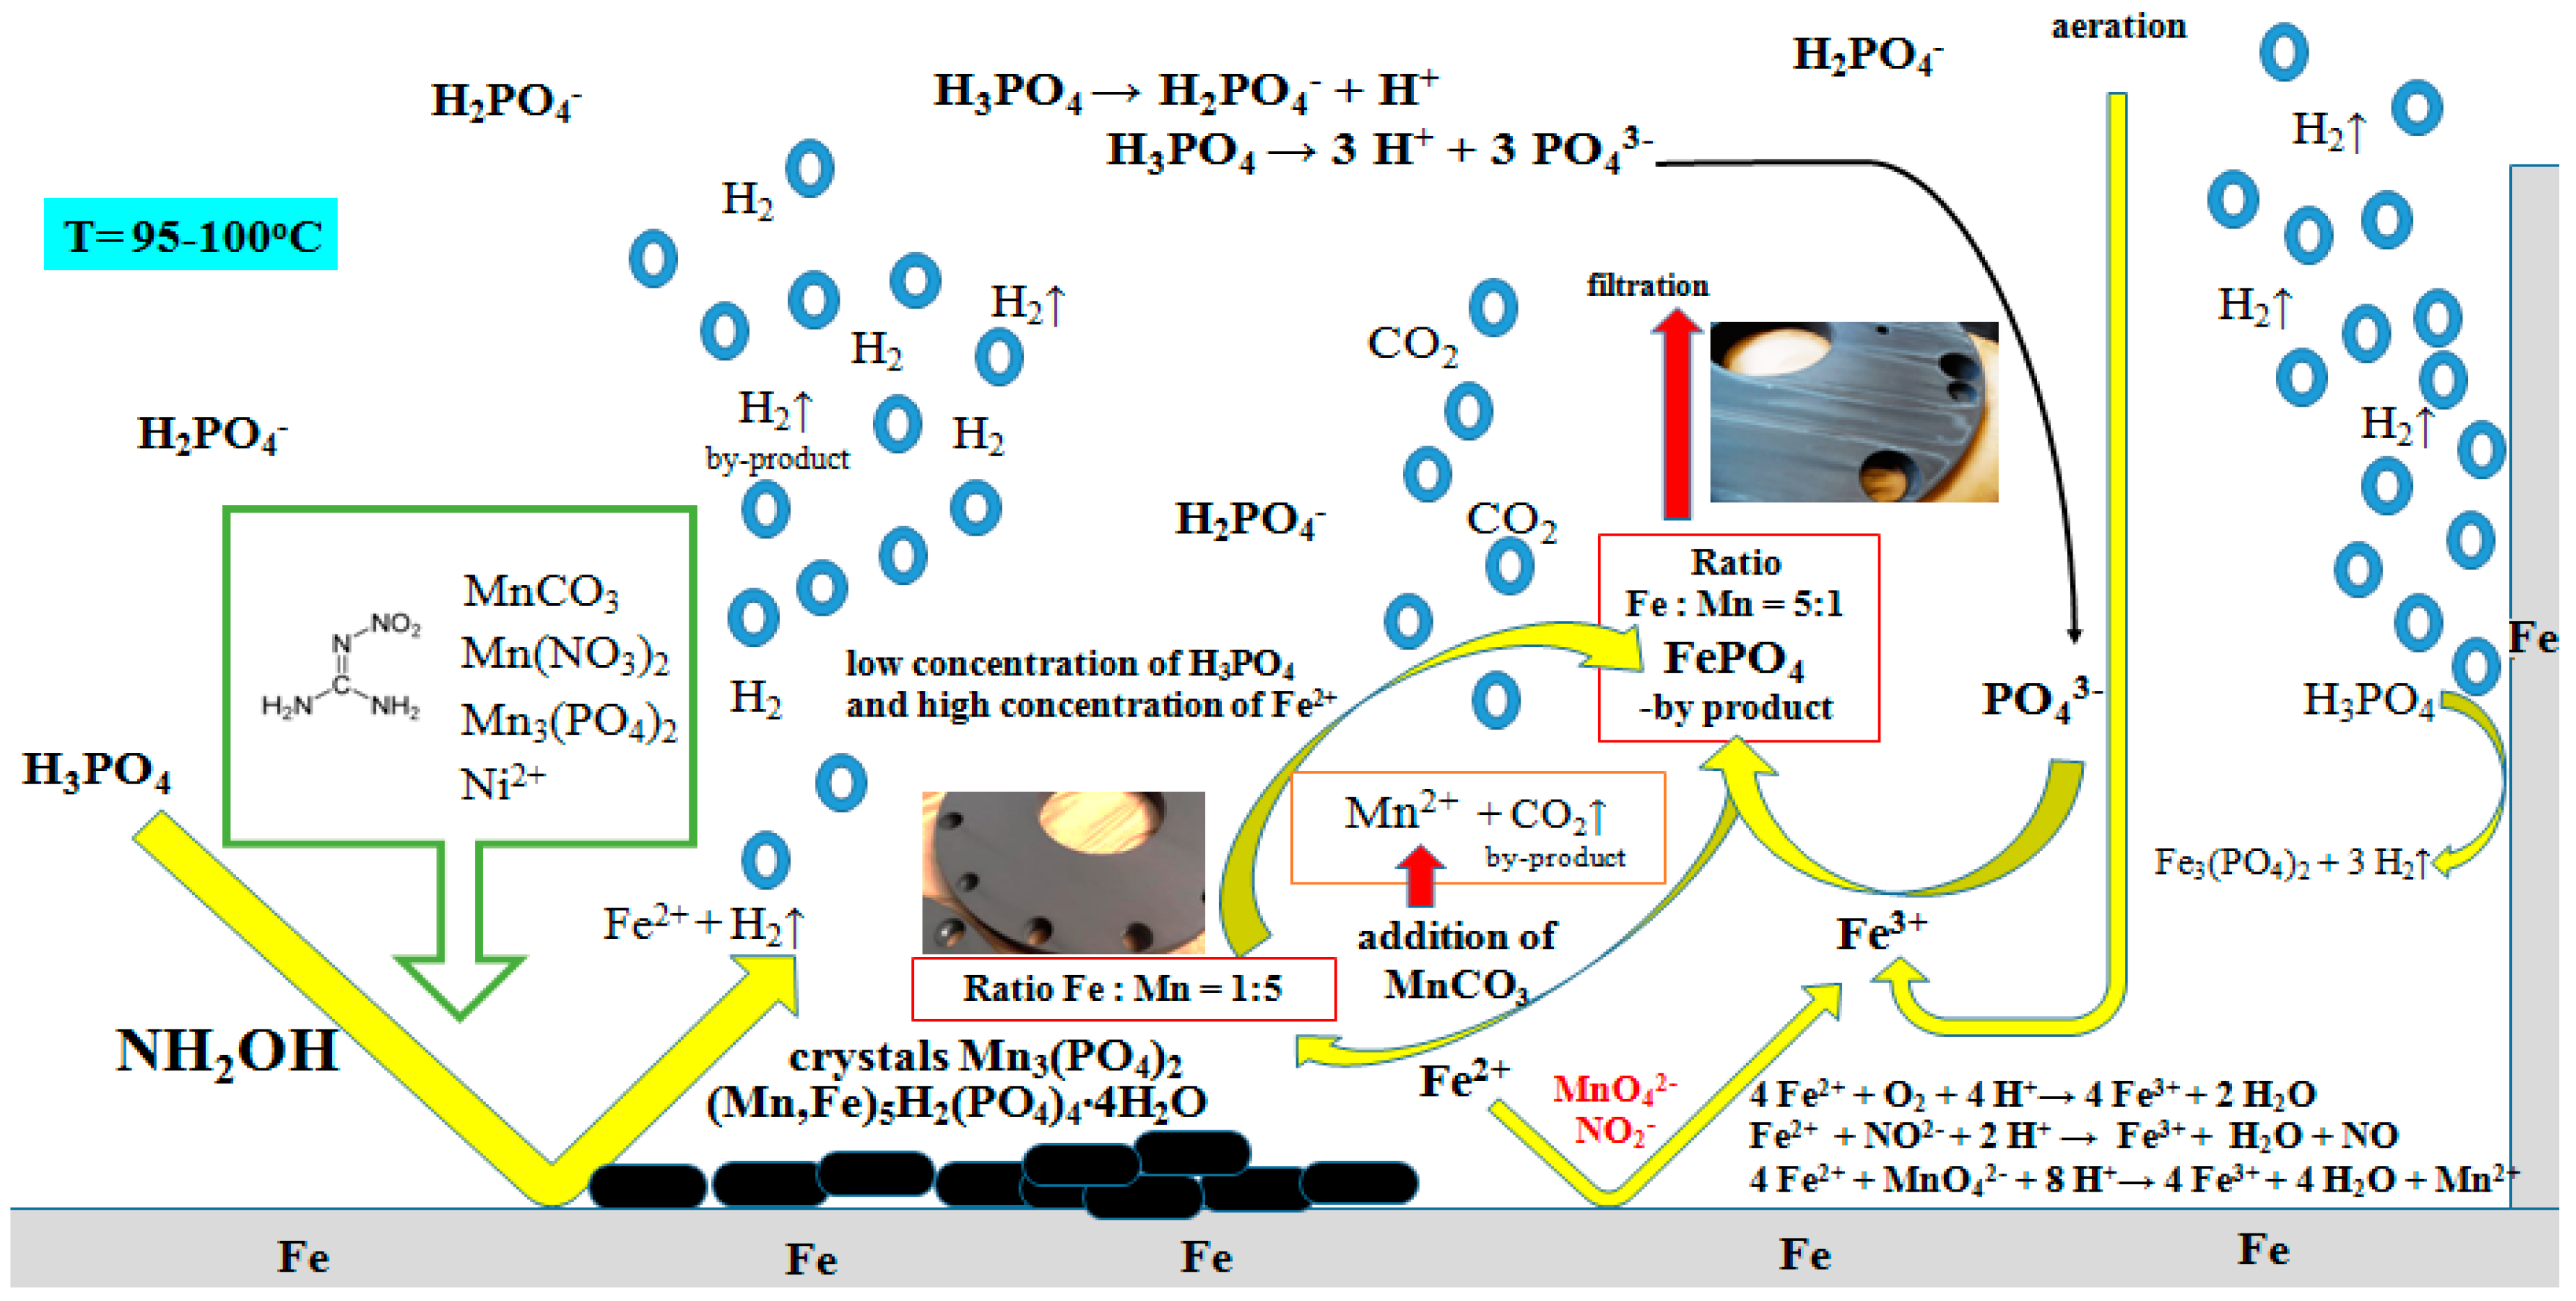
:1. Introduction
2. Experimental
2.1. Samples
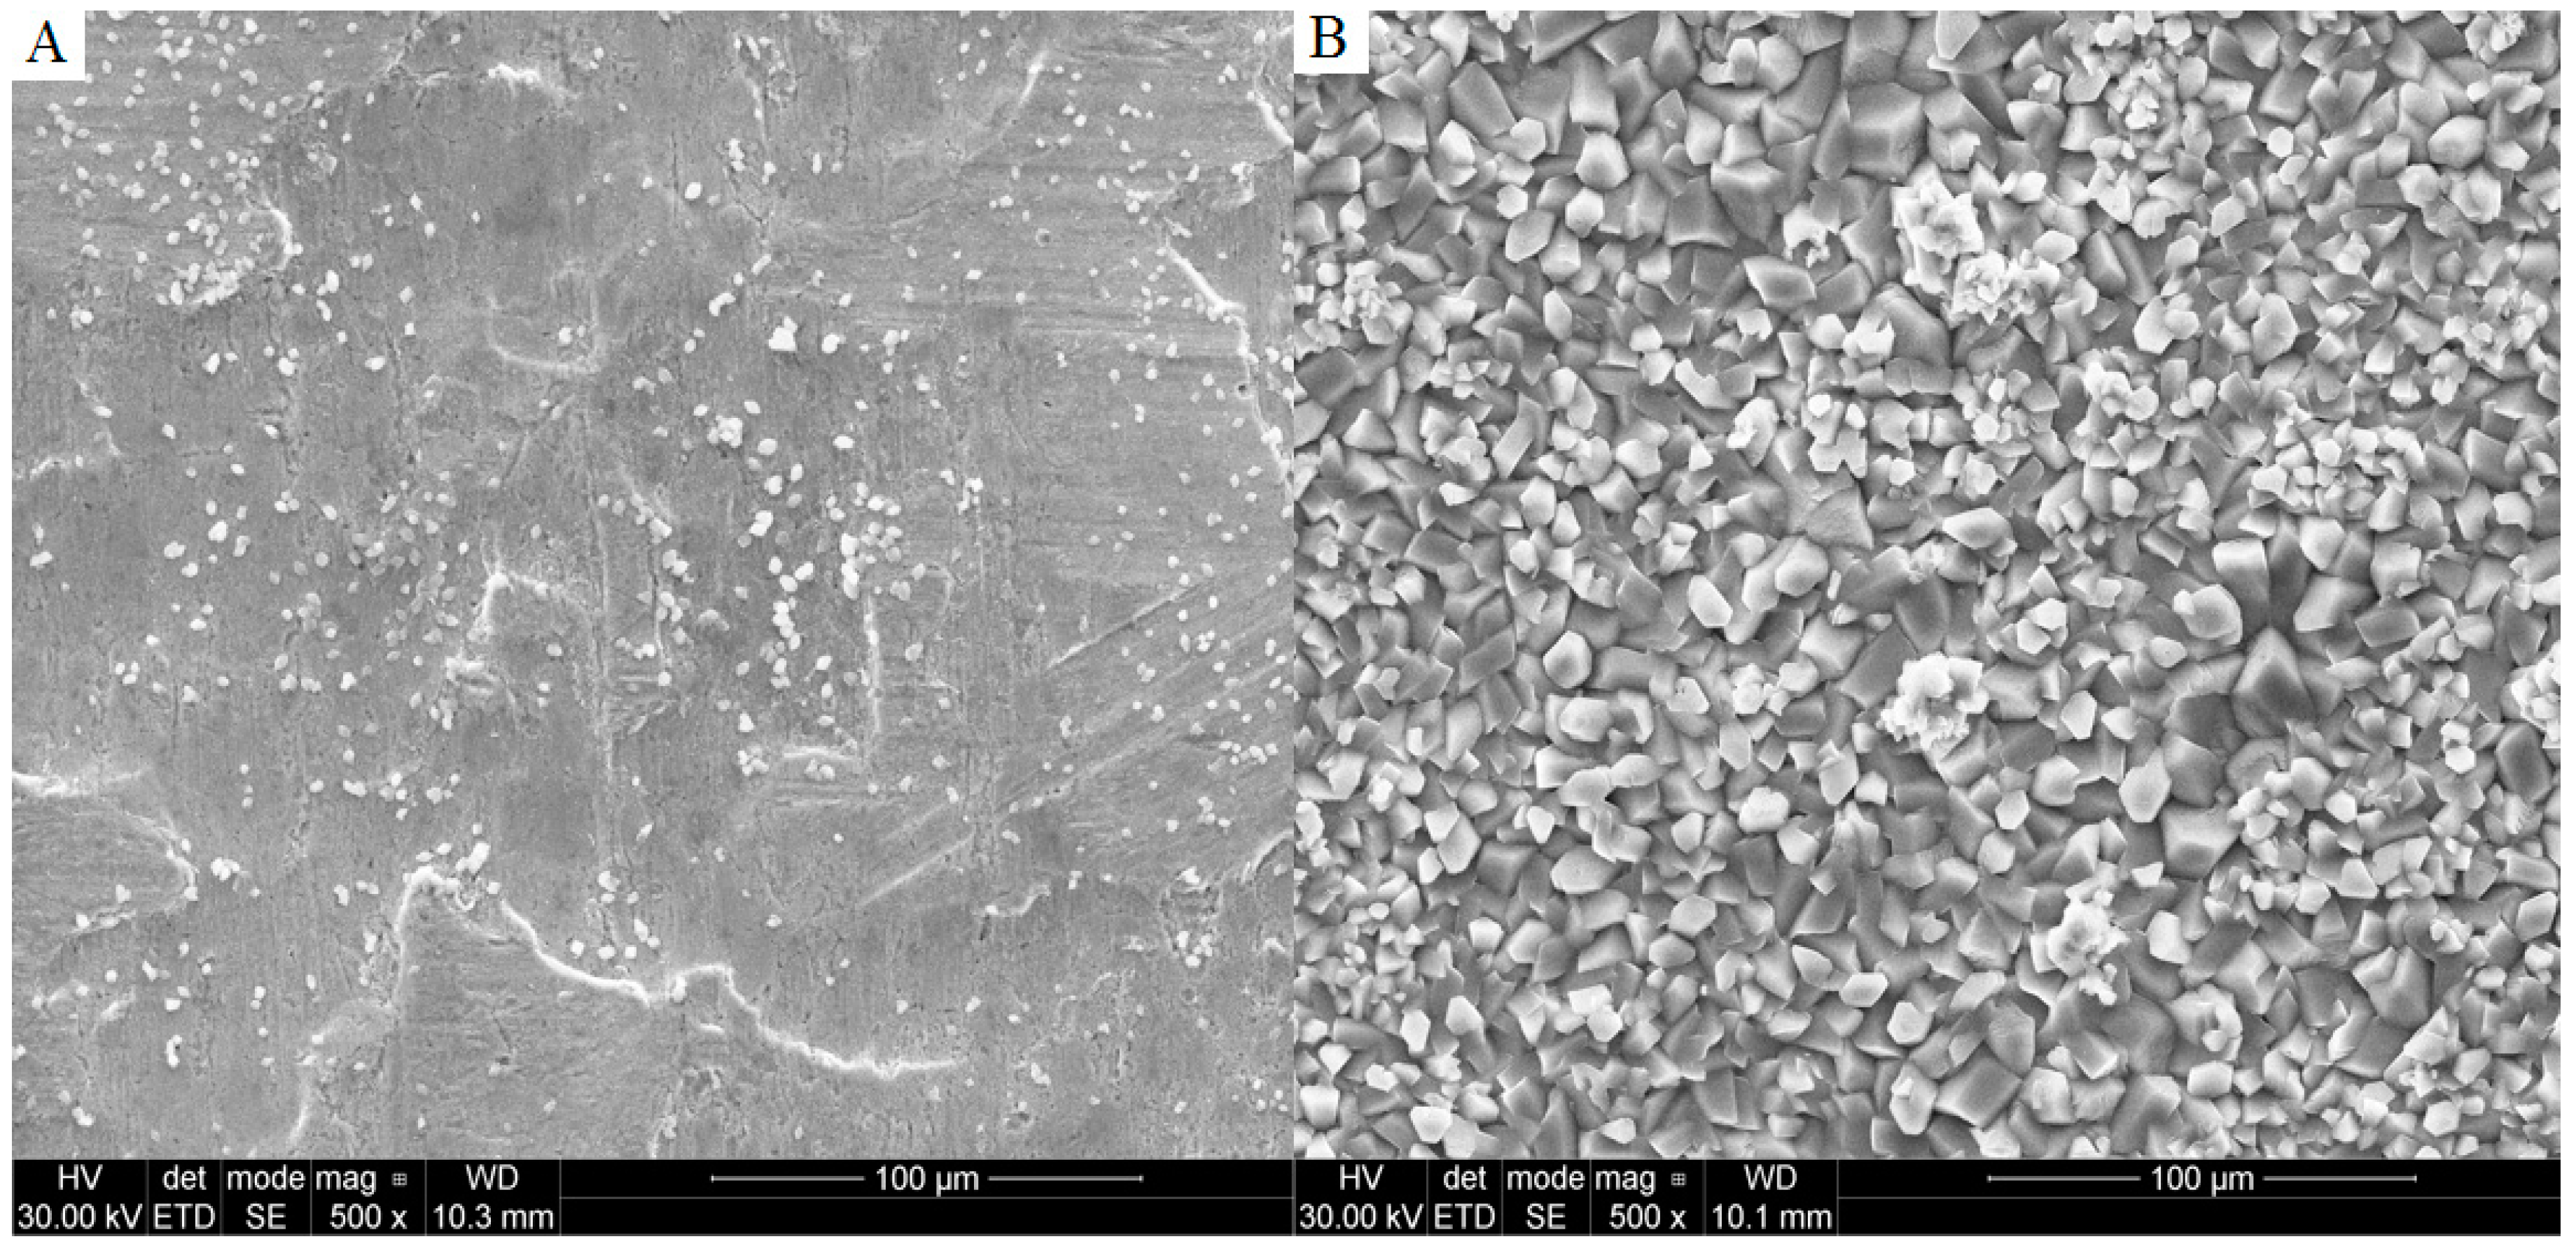
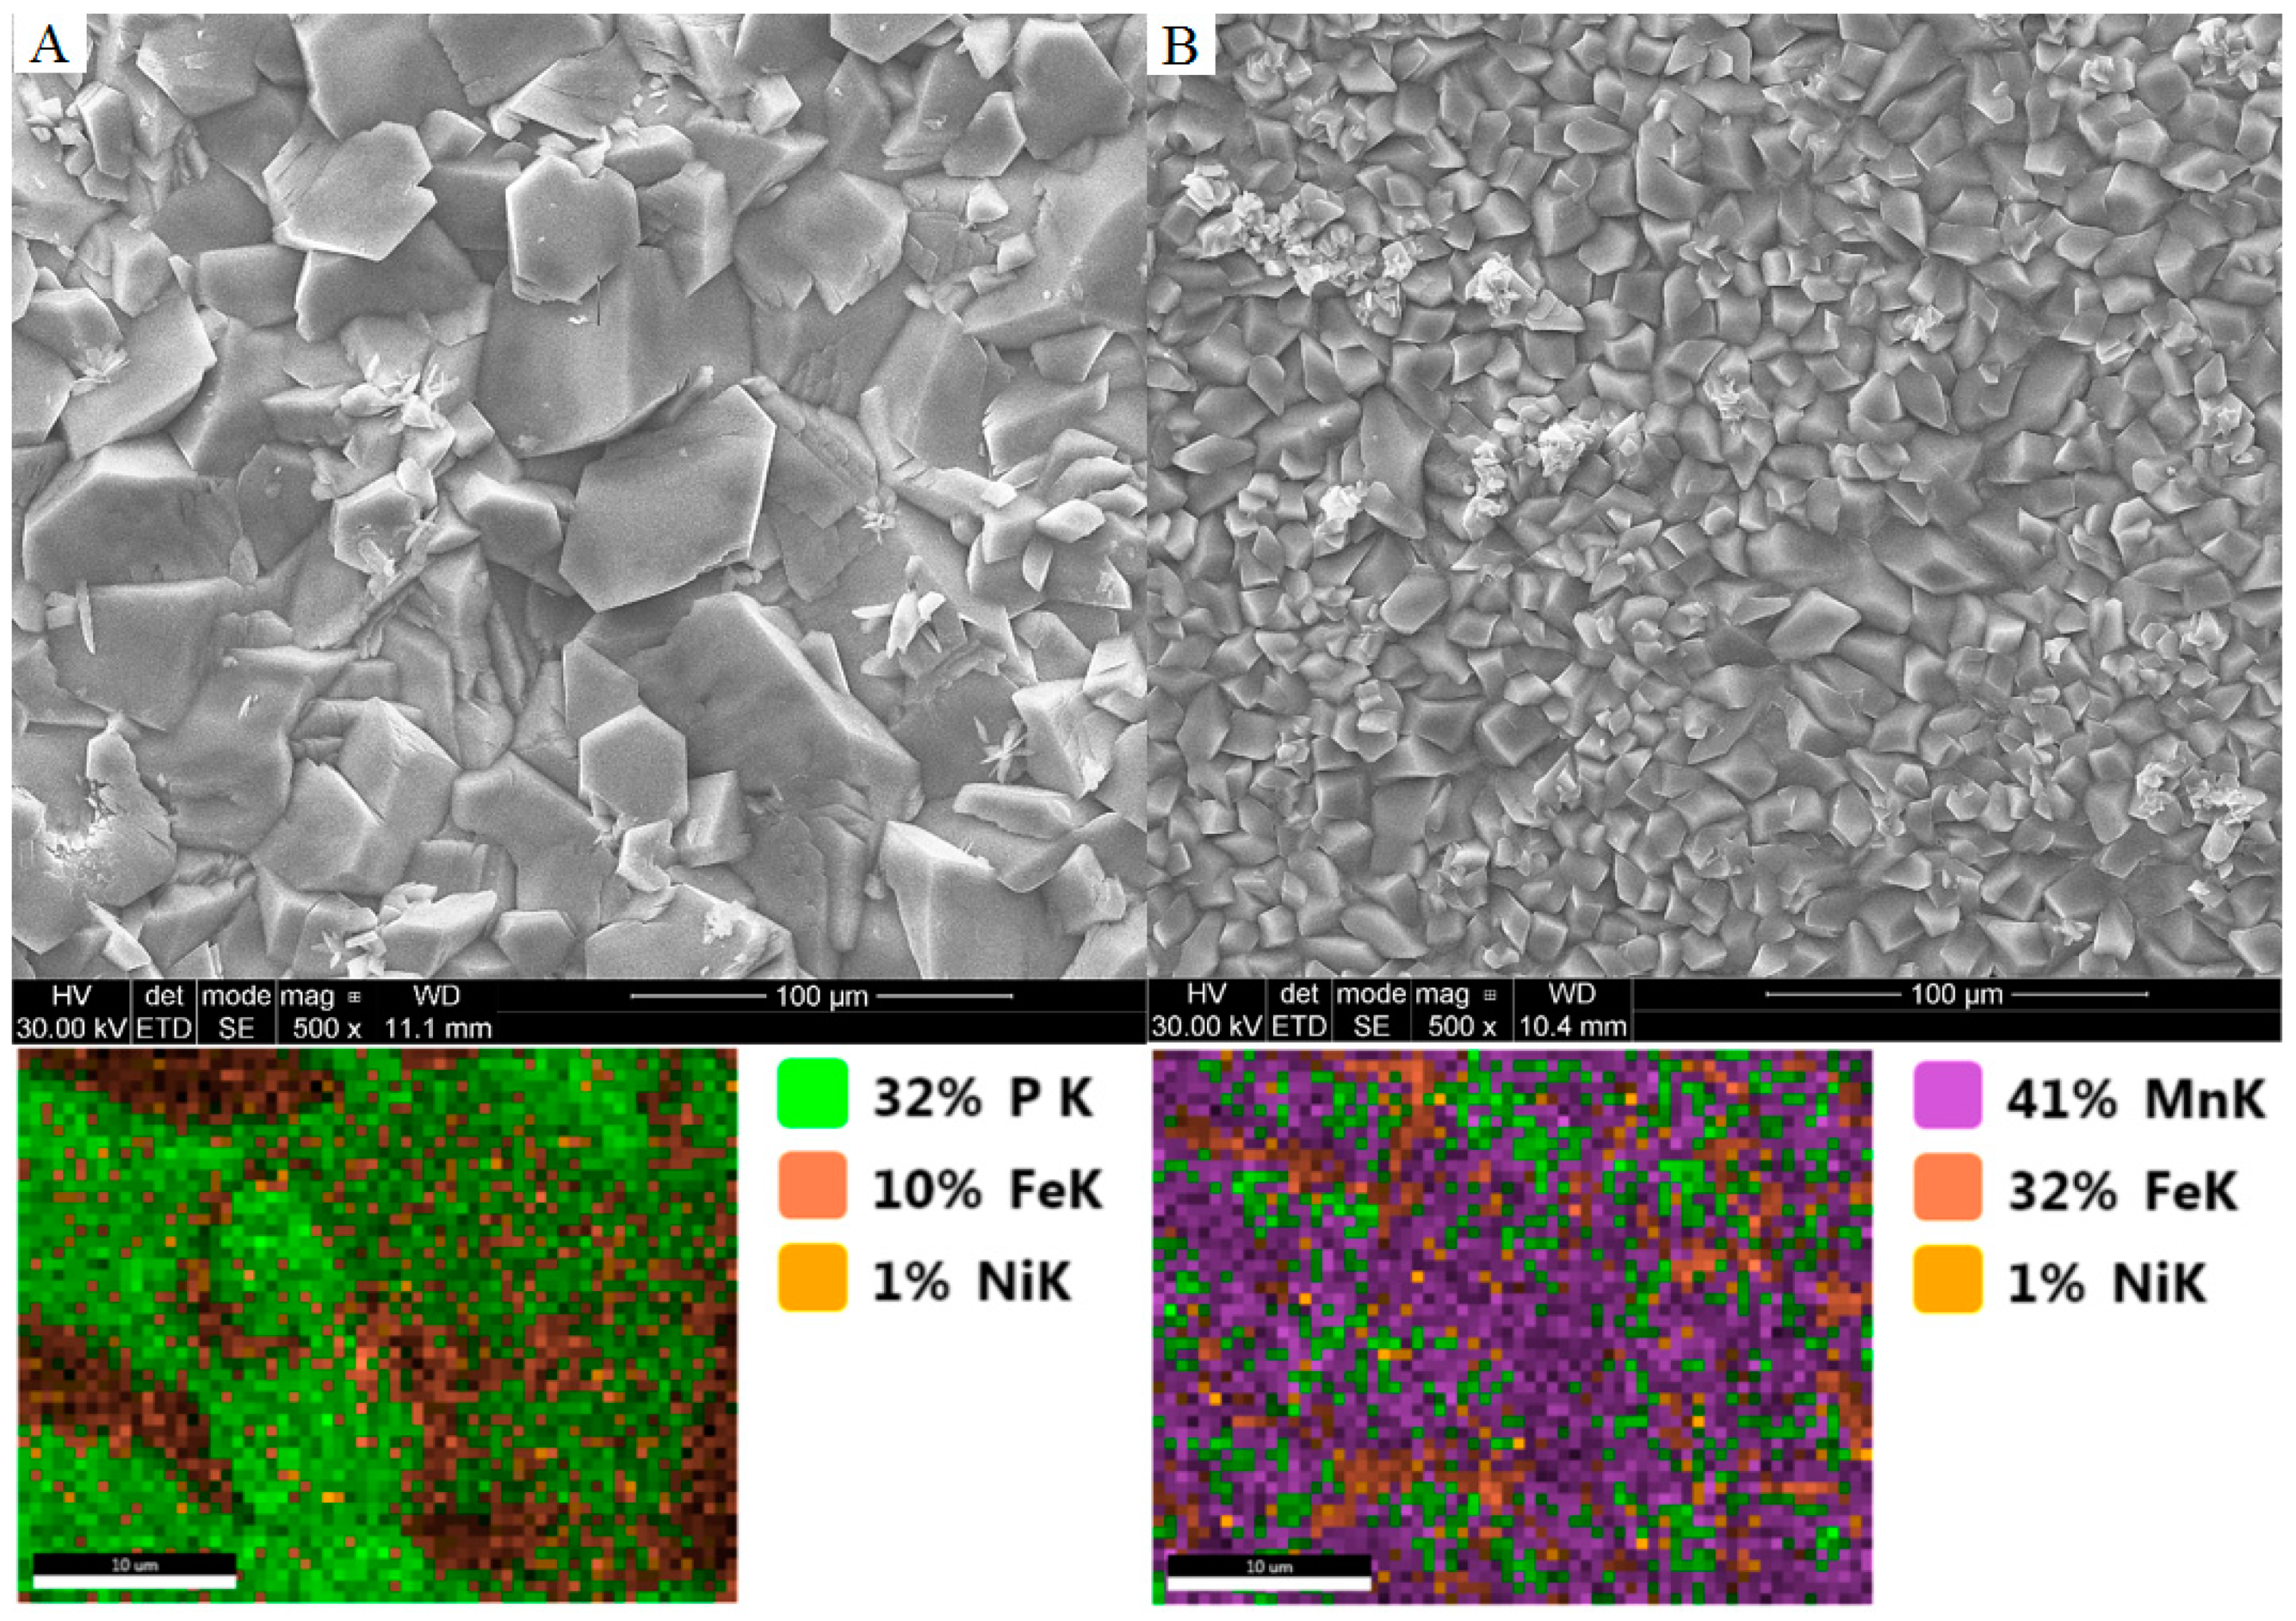
2.2. The Microstructure of Manganese Coating
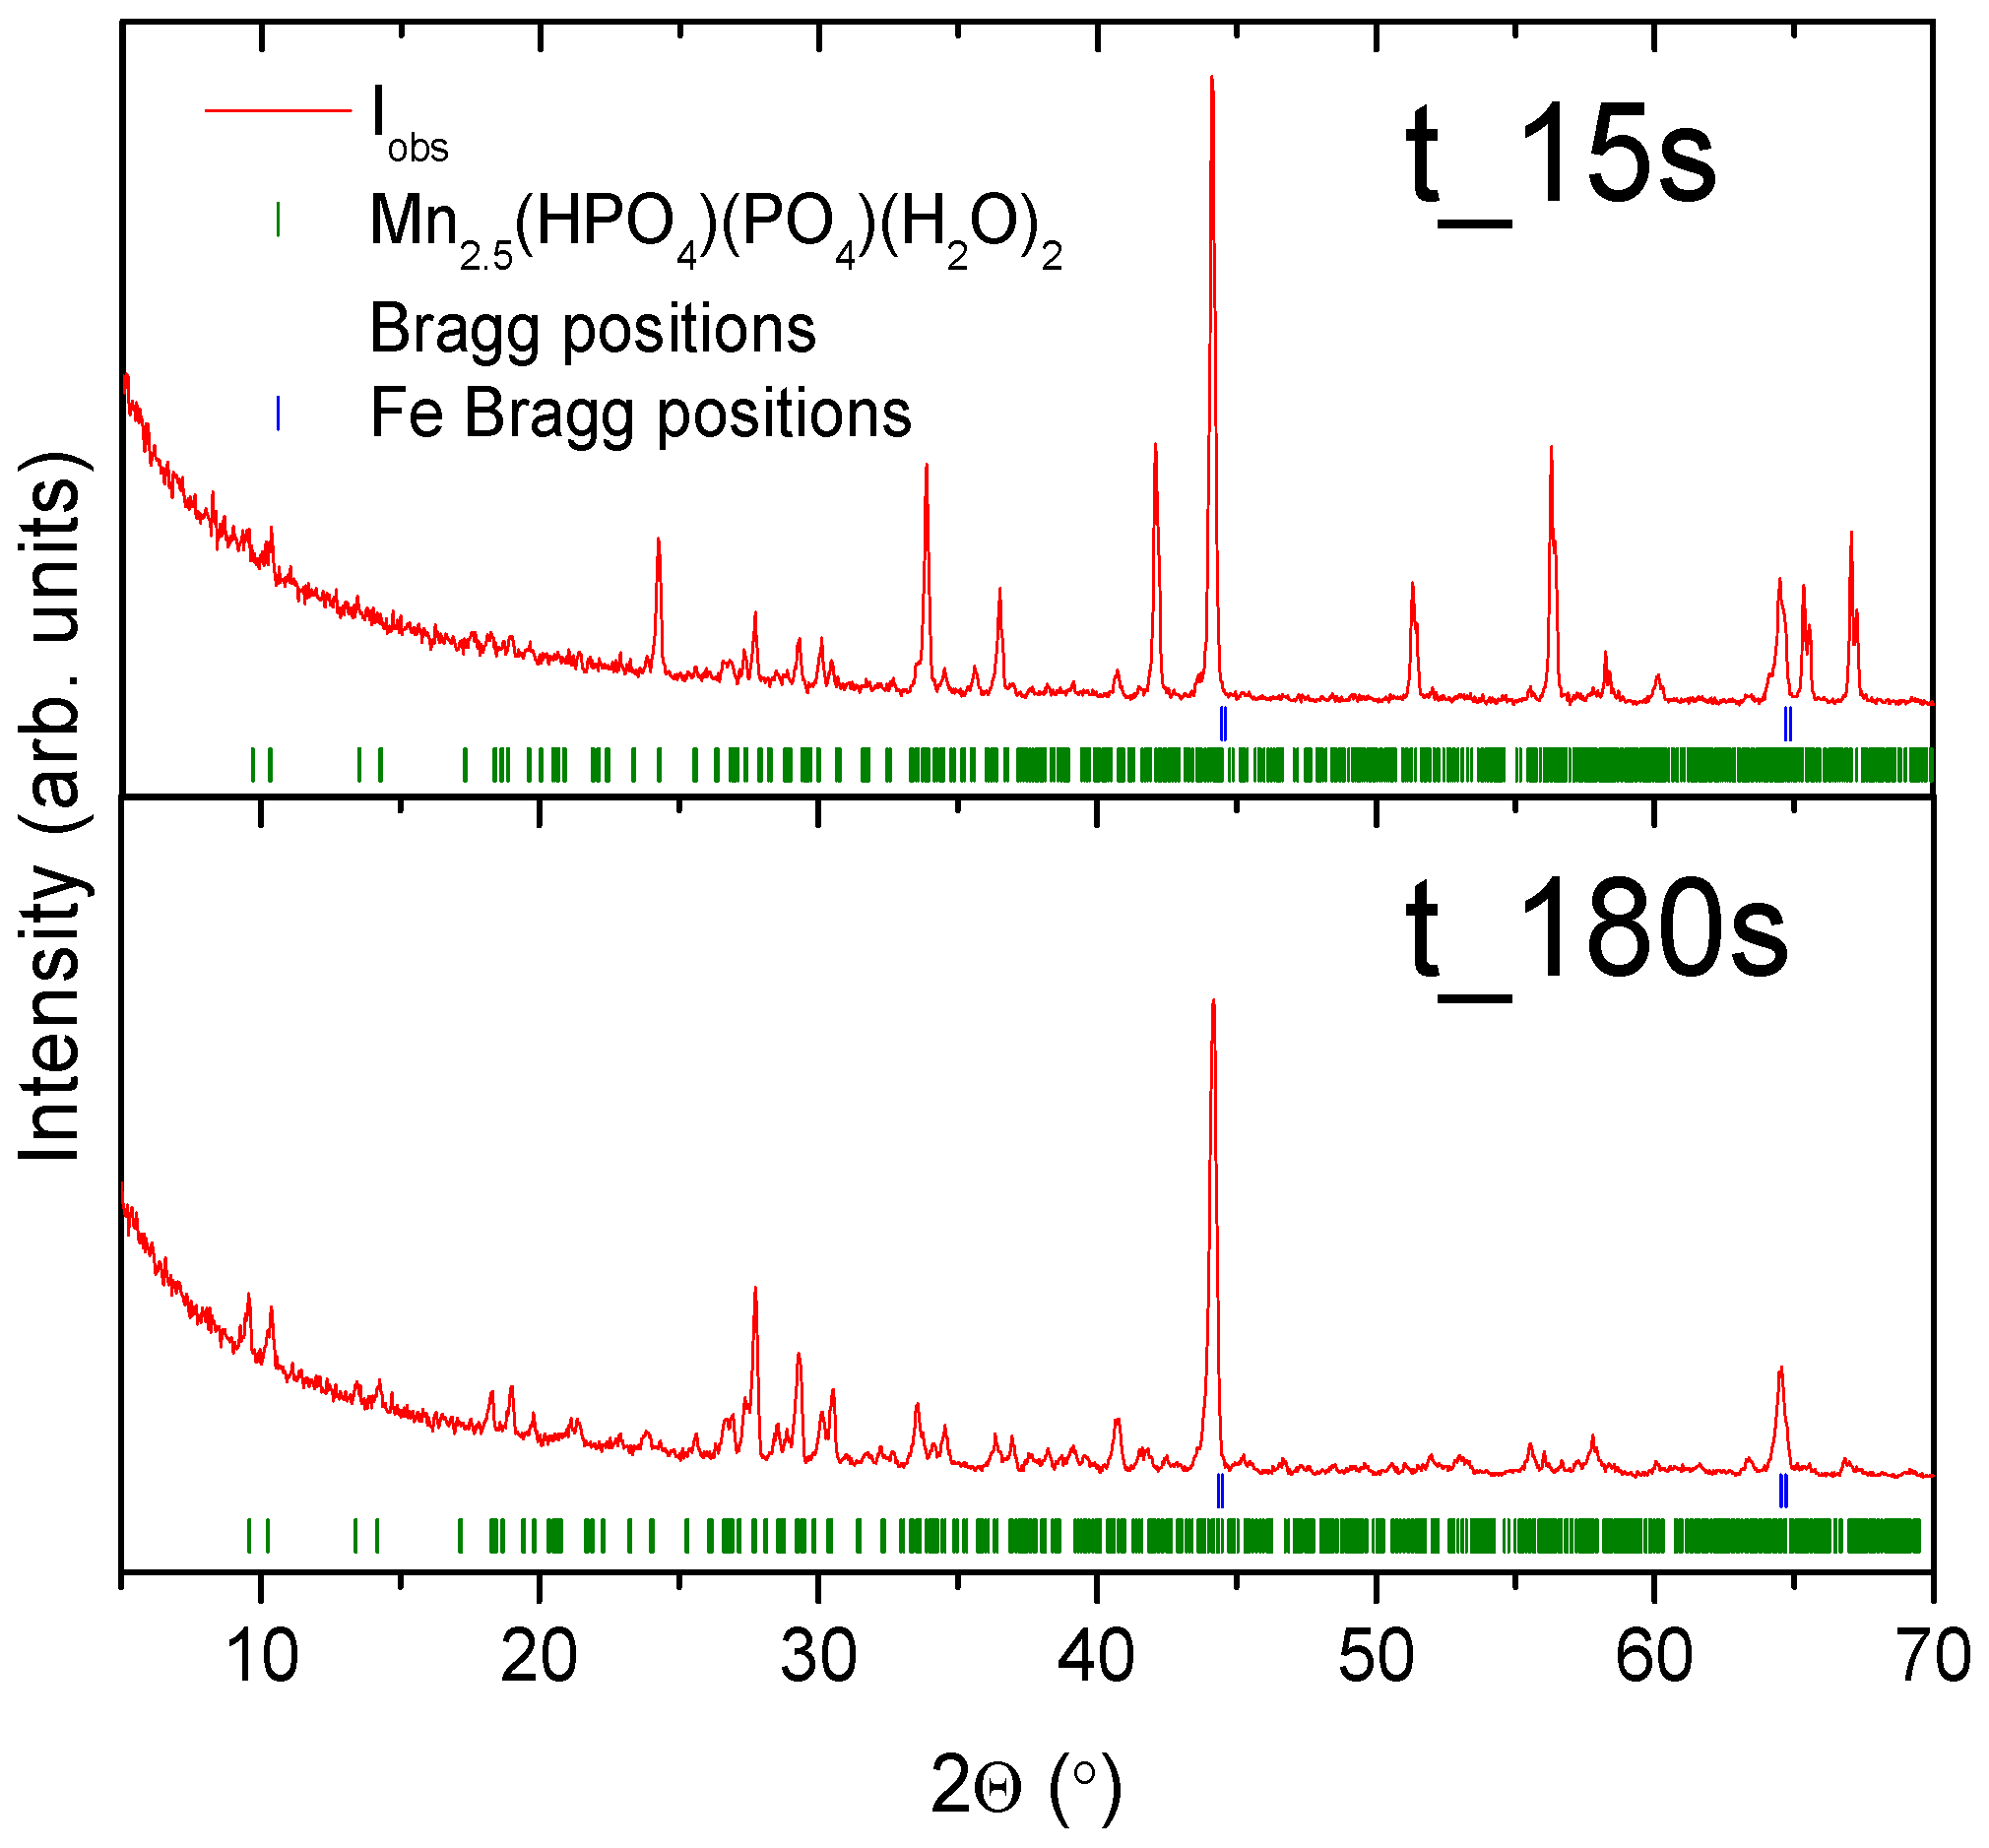
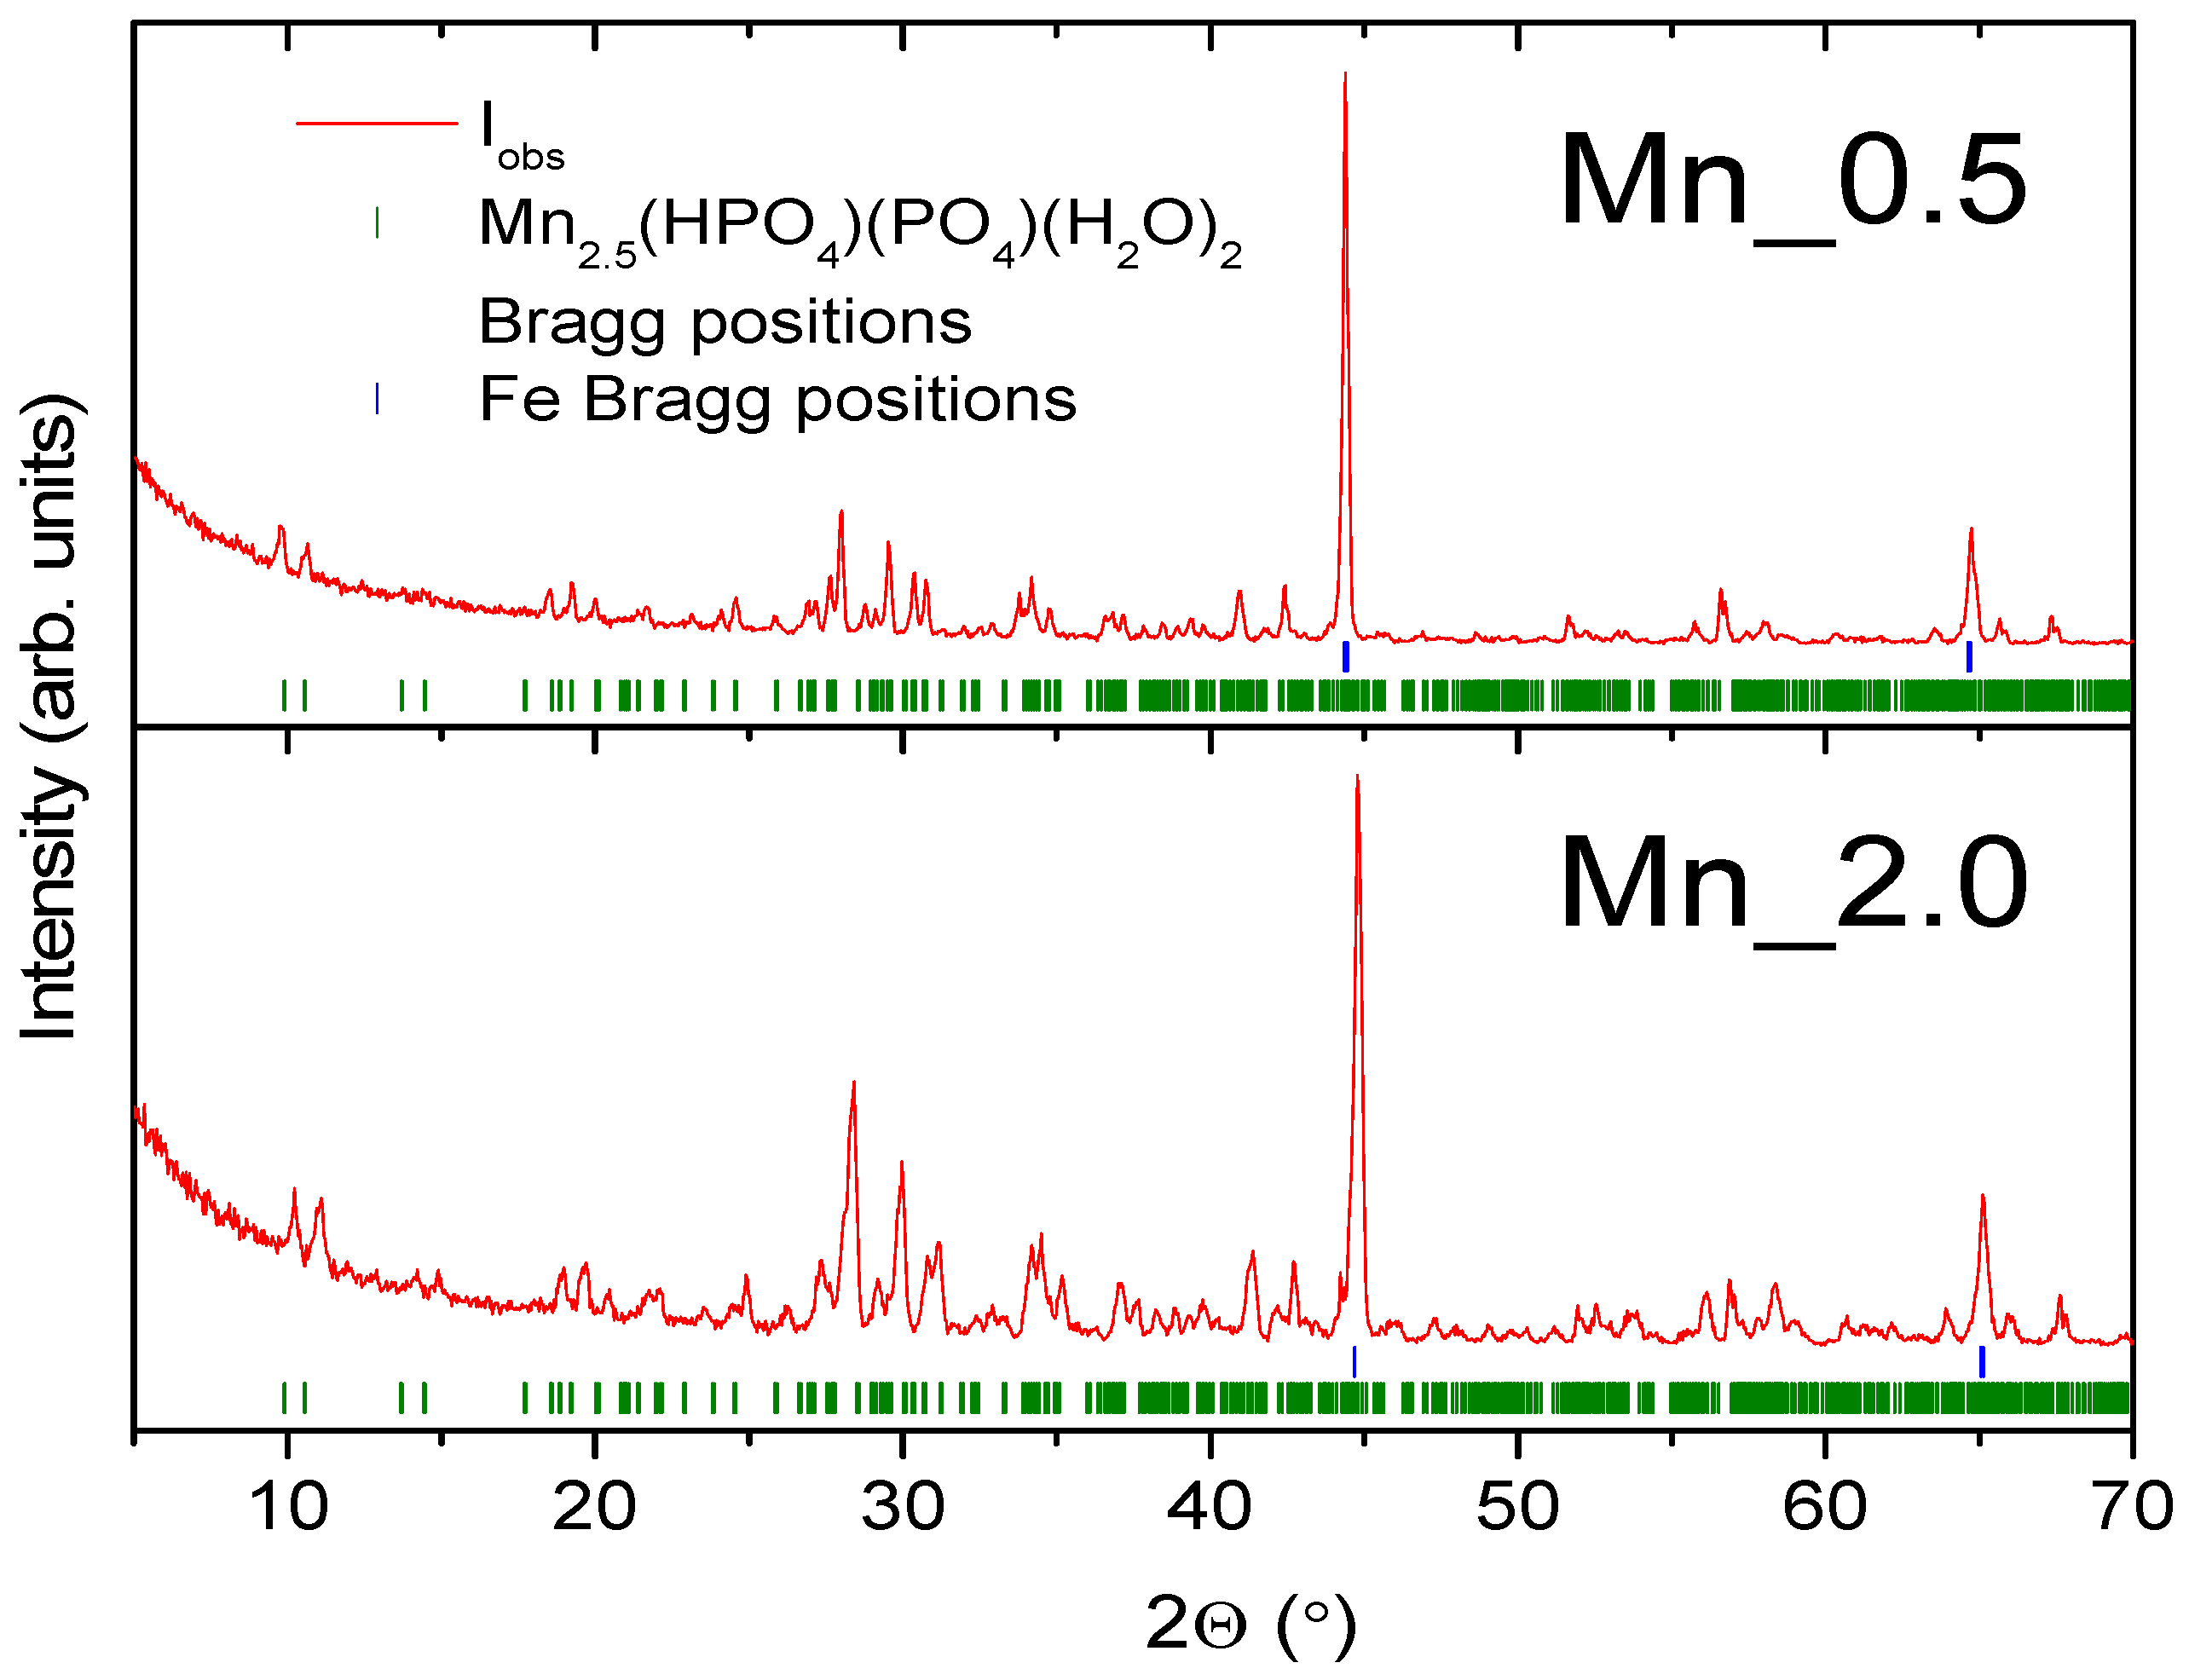
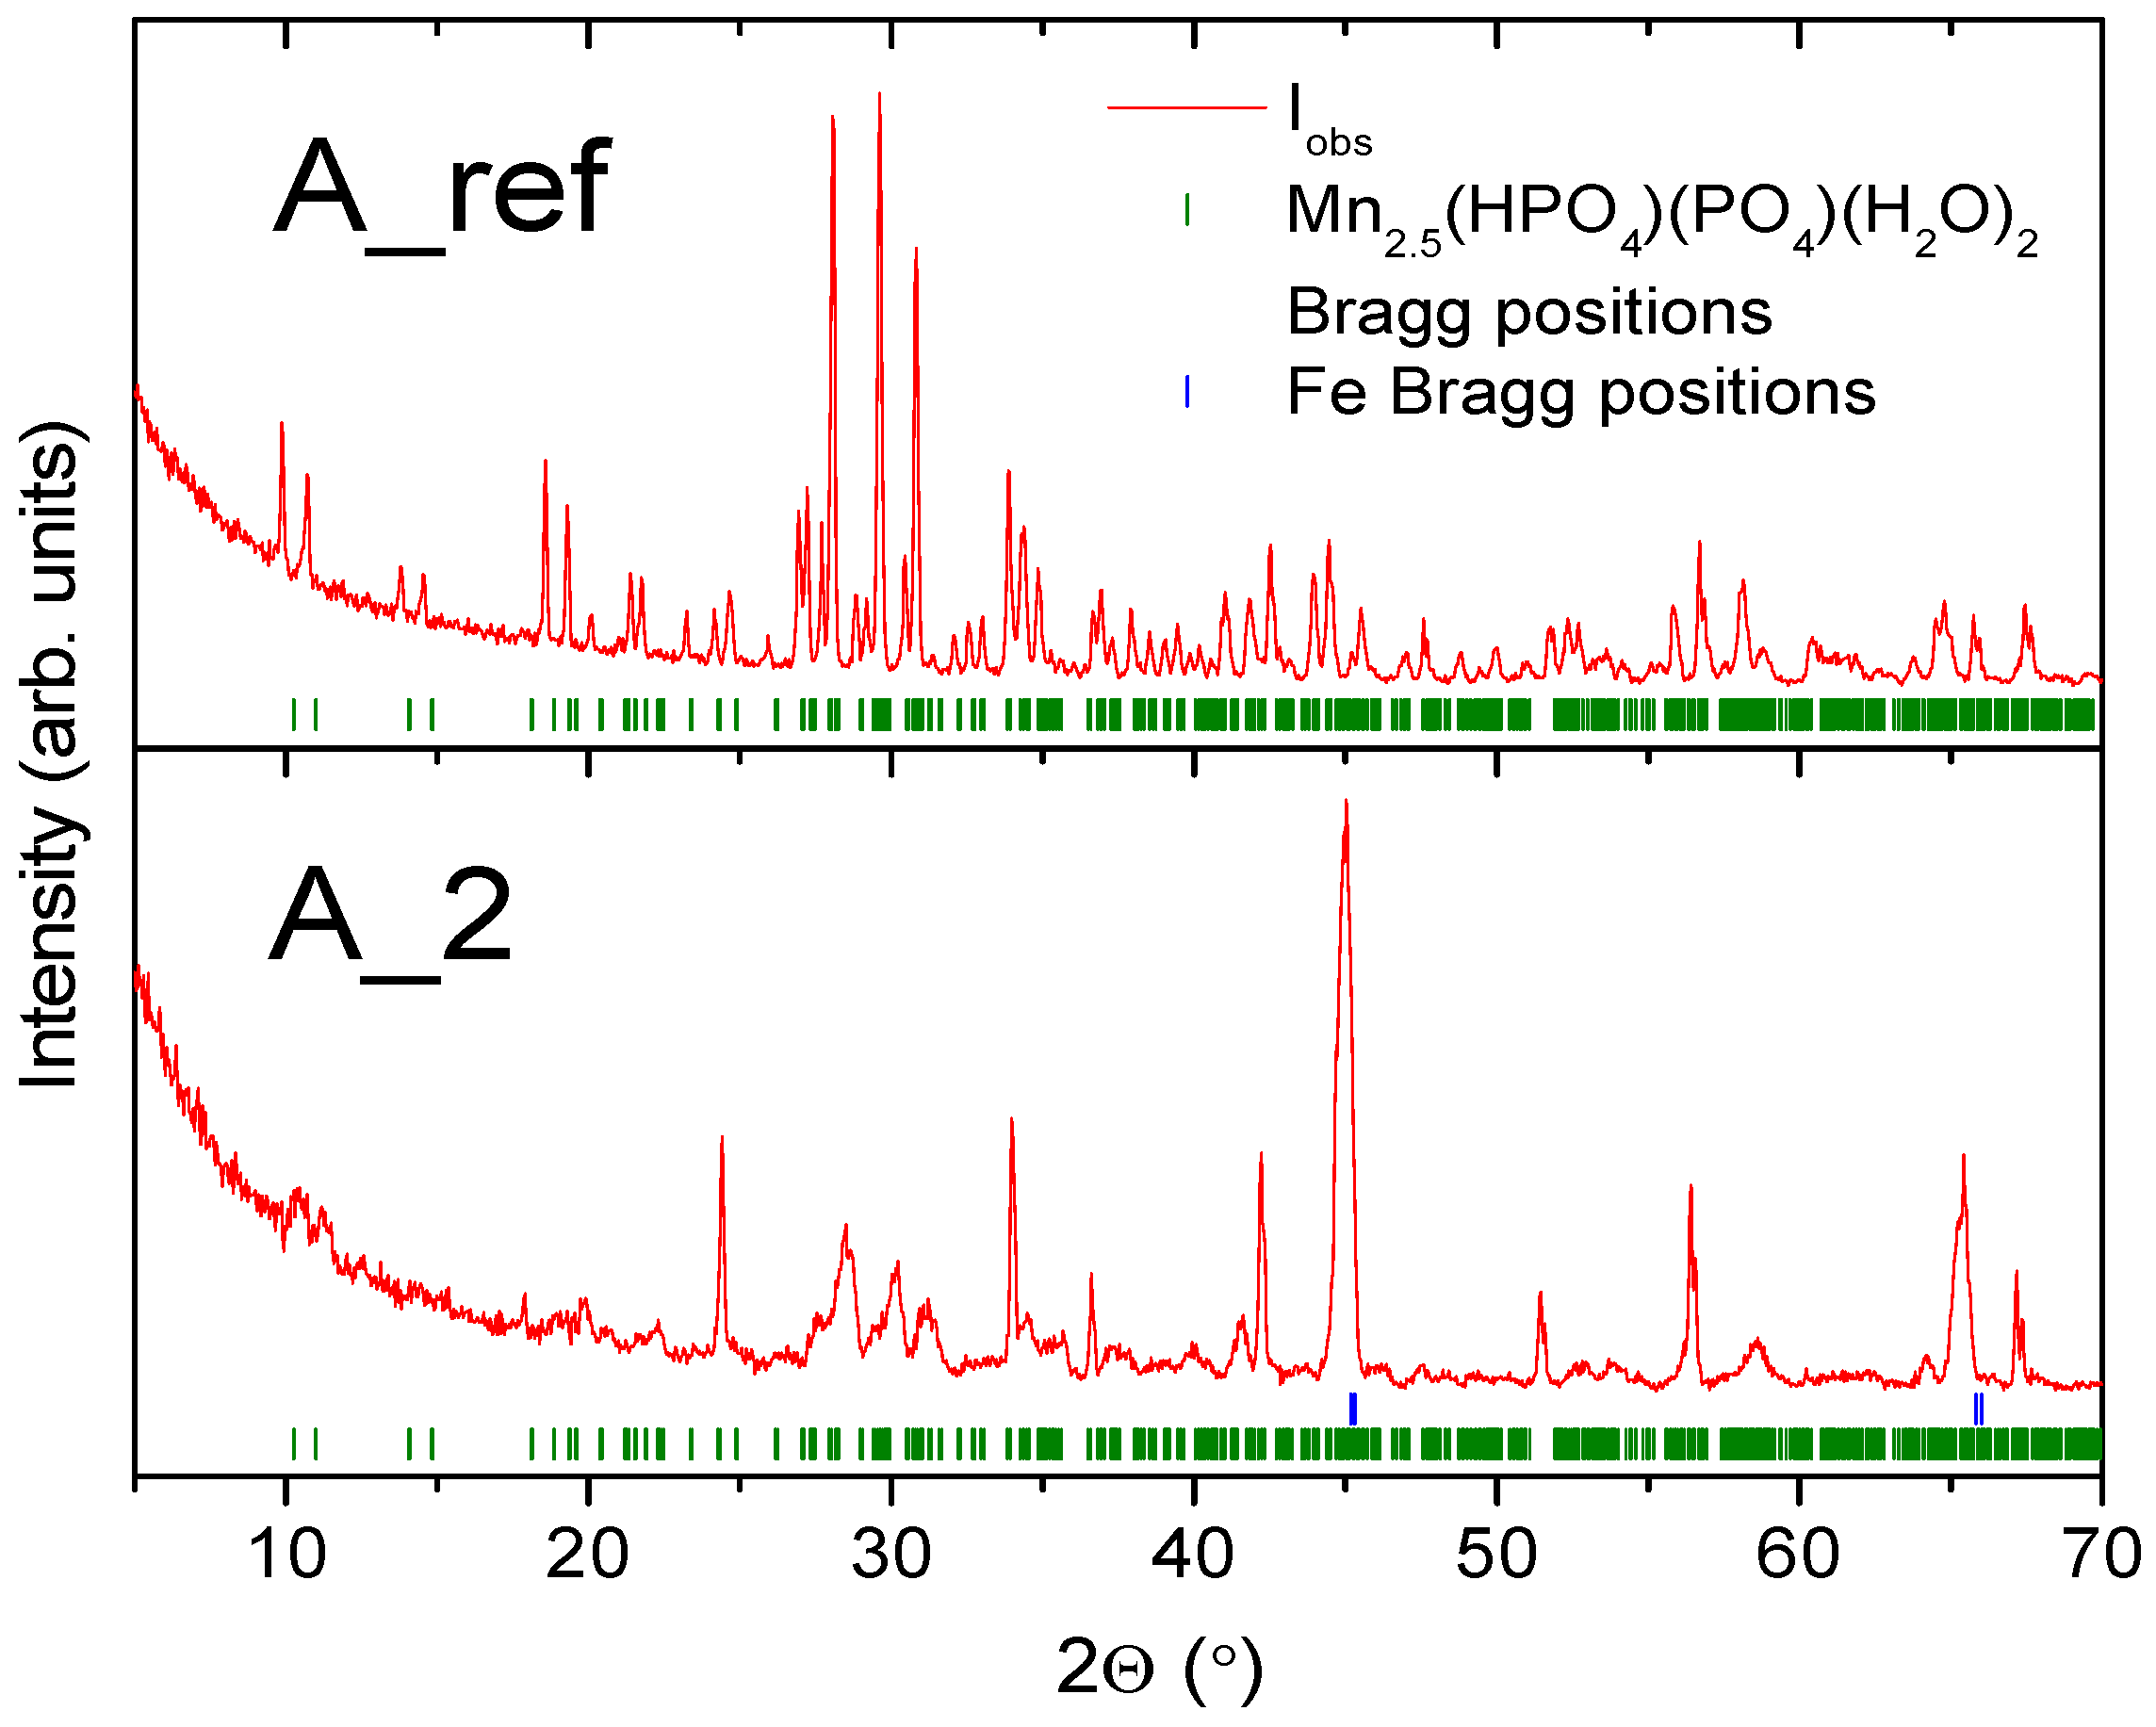
2.3. X-ray Diffraction Analysis
2.4. Electrochemical Measurements
3. Results and Discussion
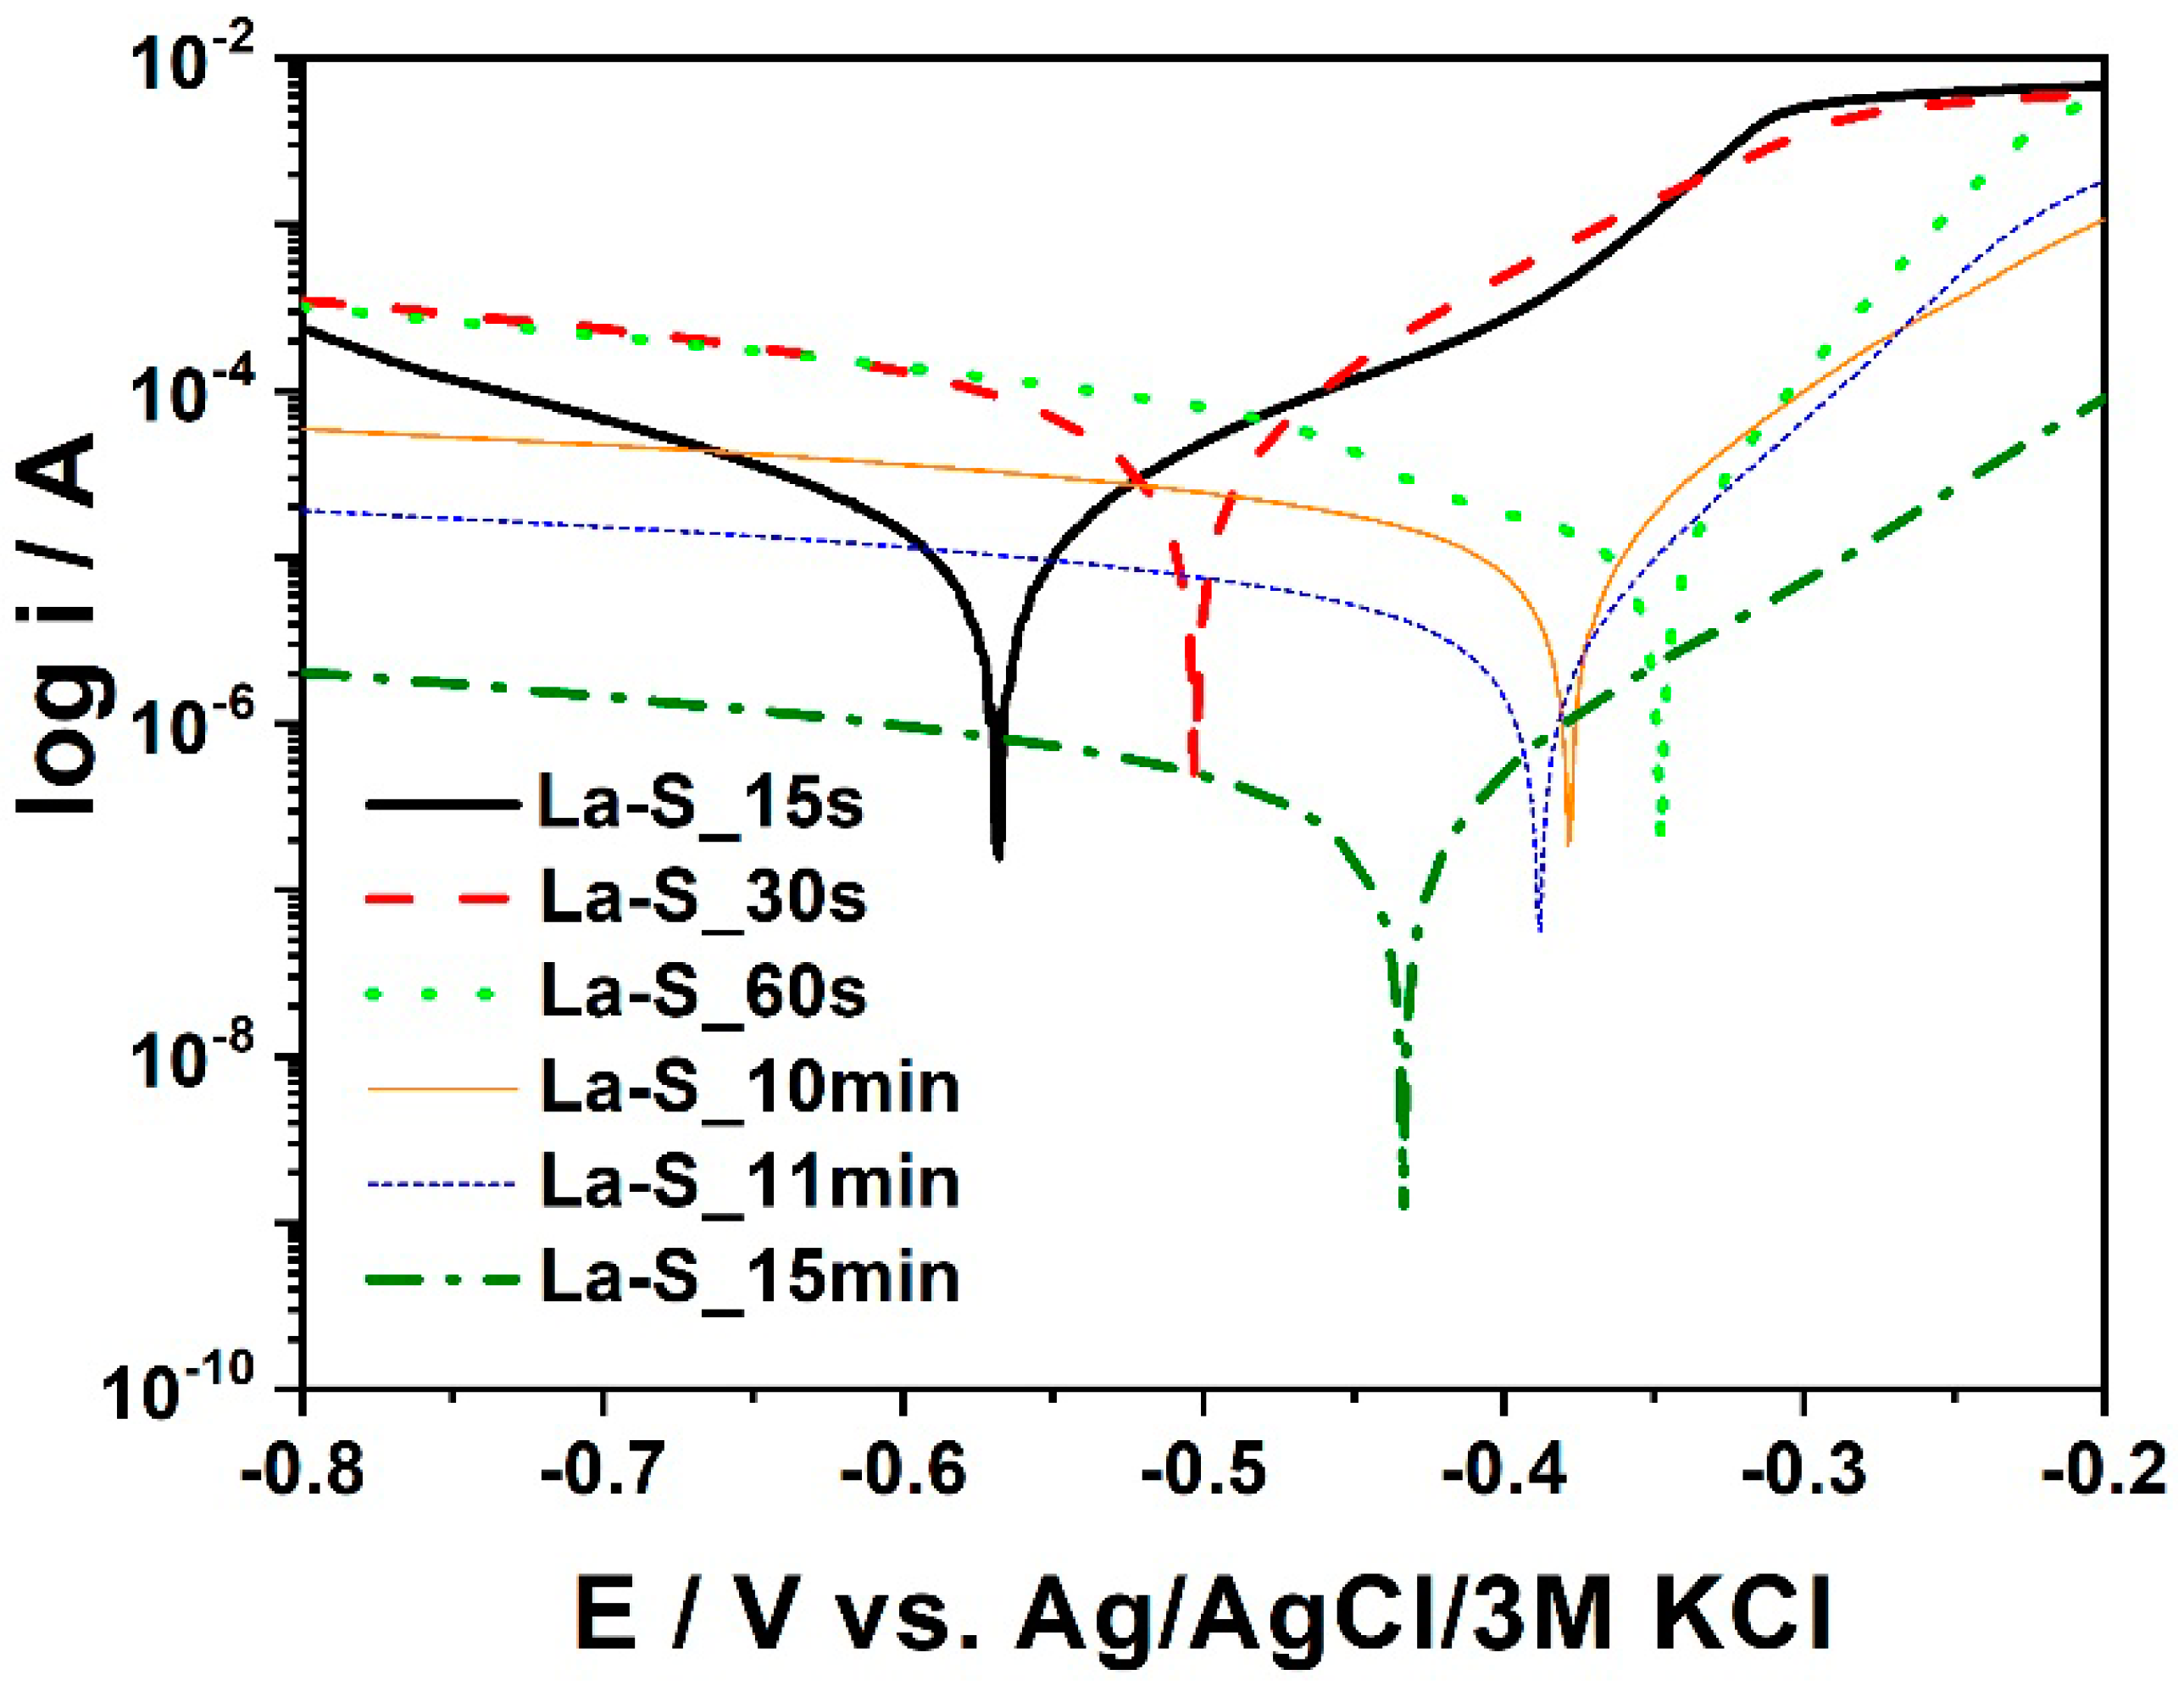
3.1. The Impact of Time of Phosphating Process
3.2. The Impact of Nickel on Coating Quality
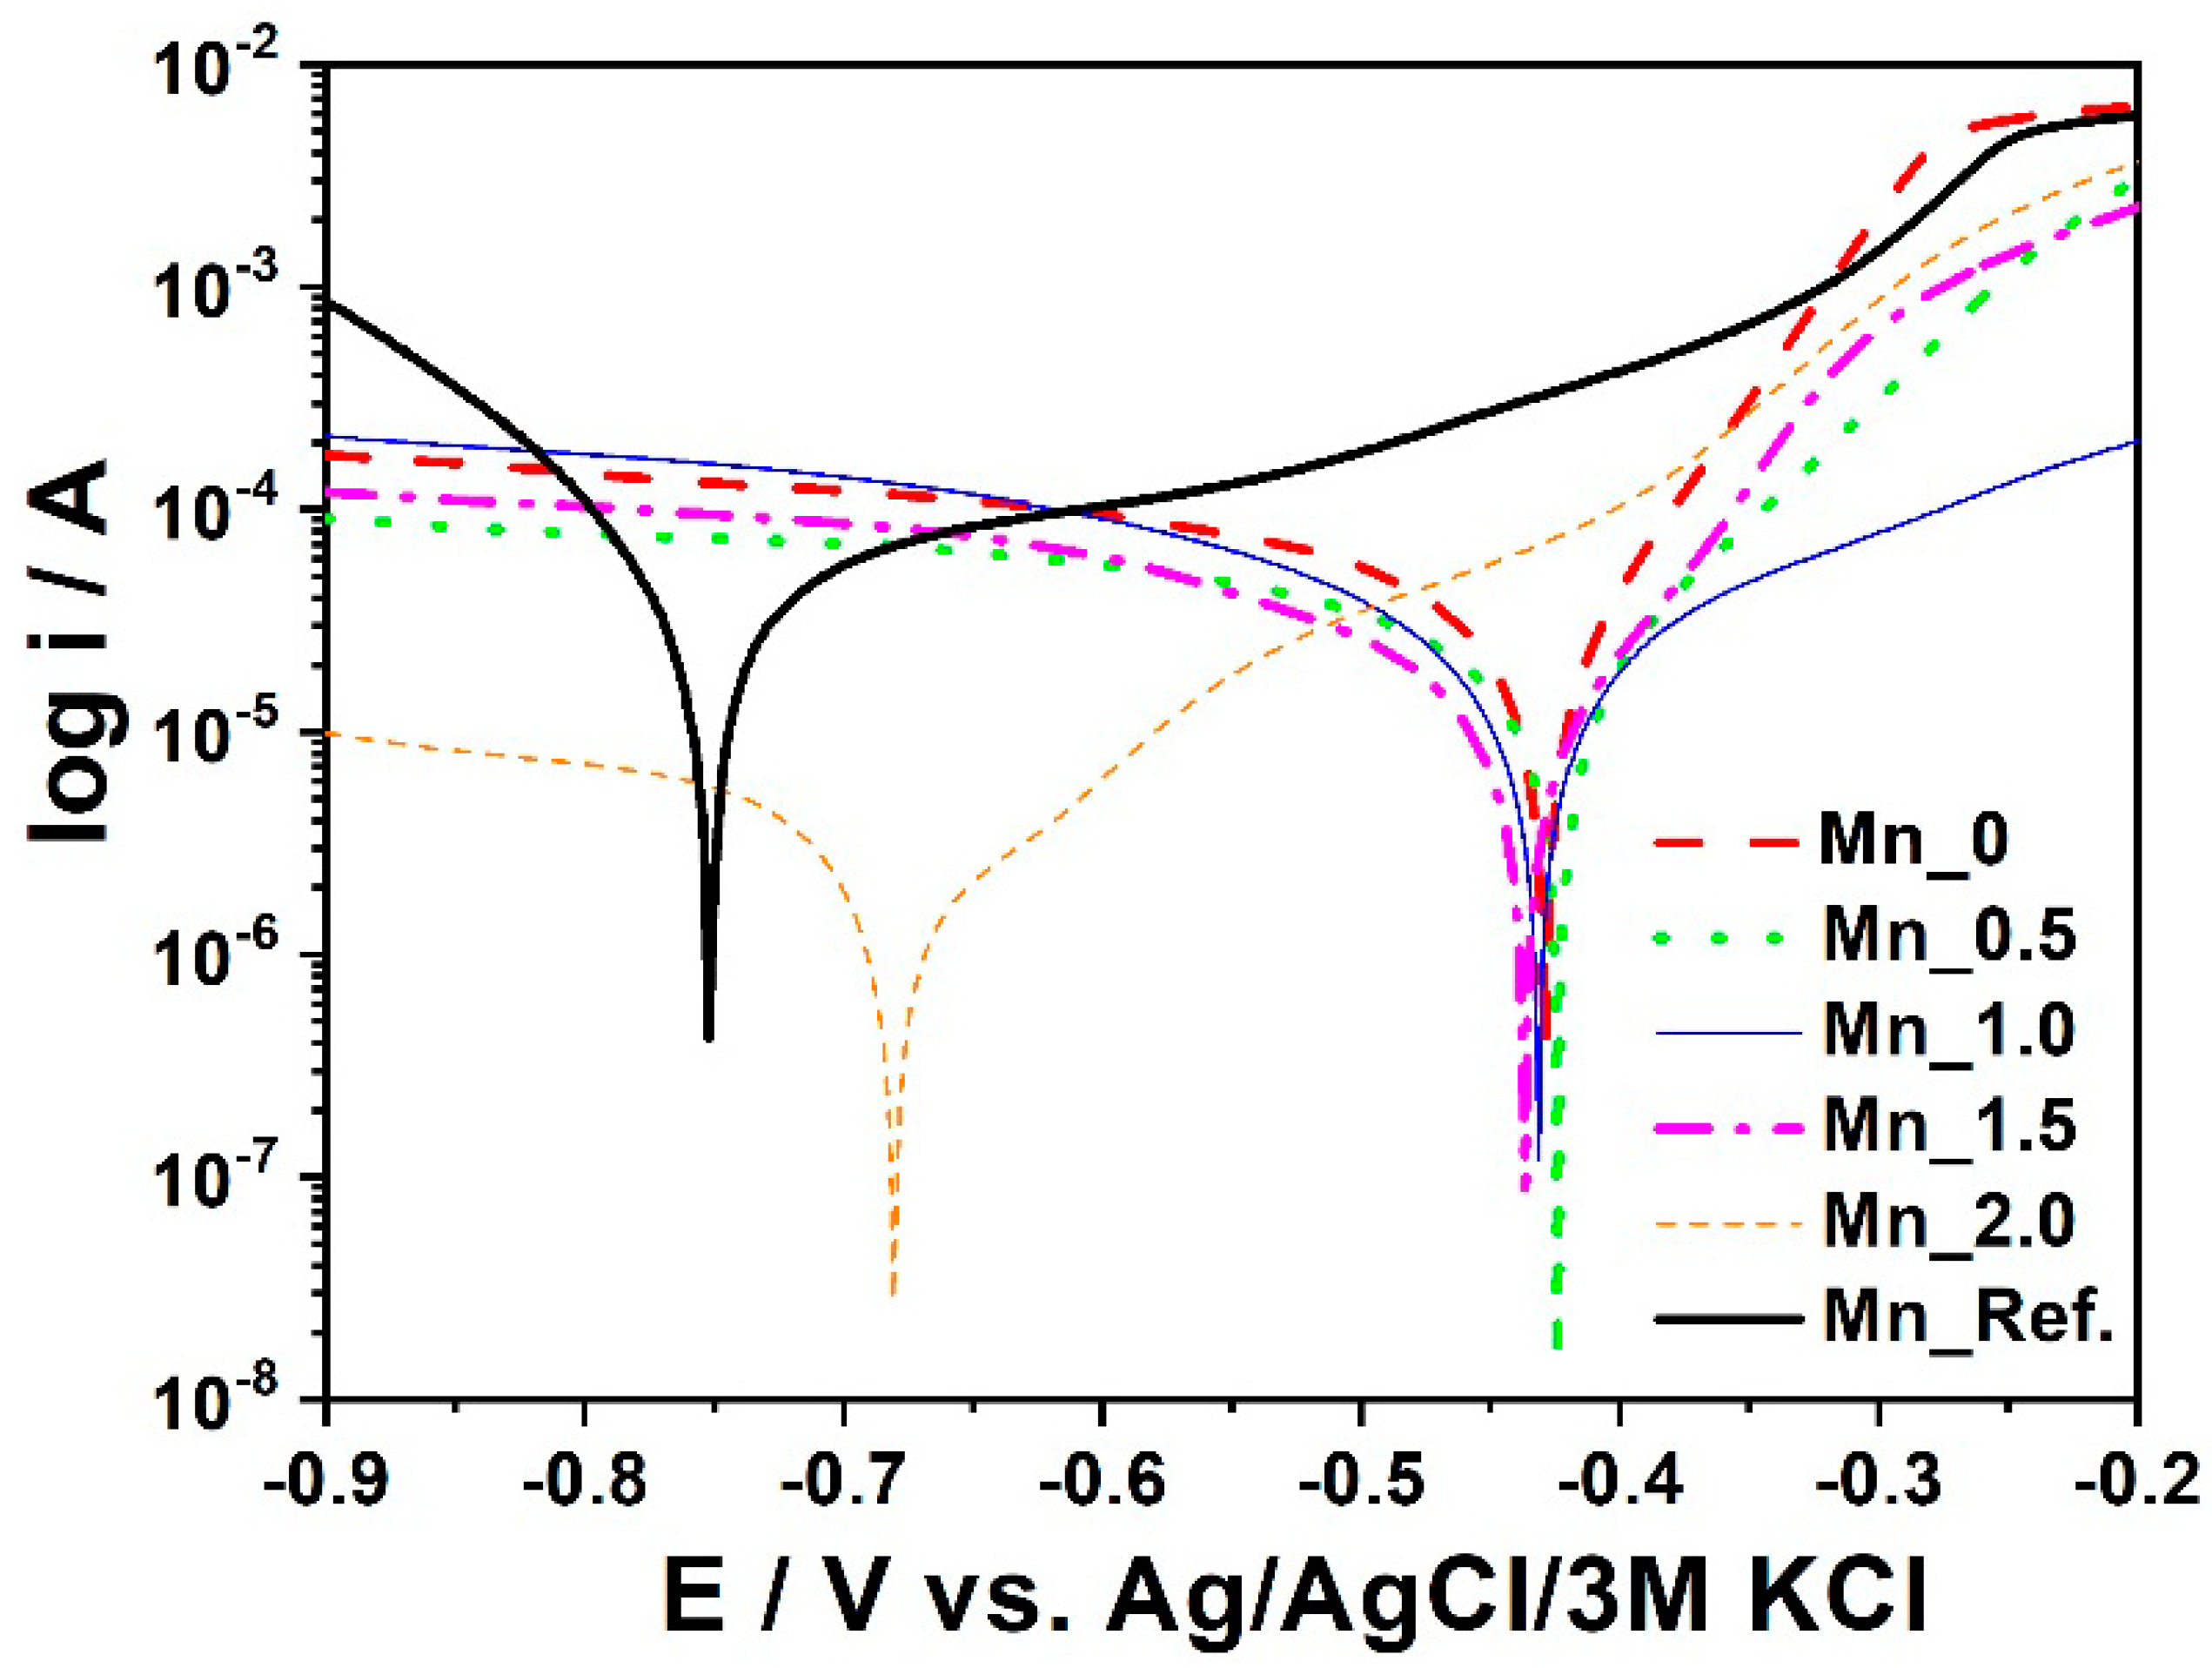
3.3. The Impact of Manganese on Coating Quality
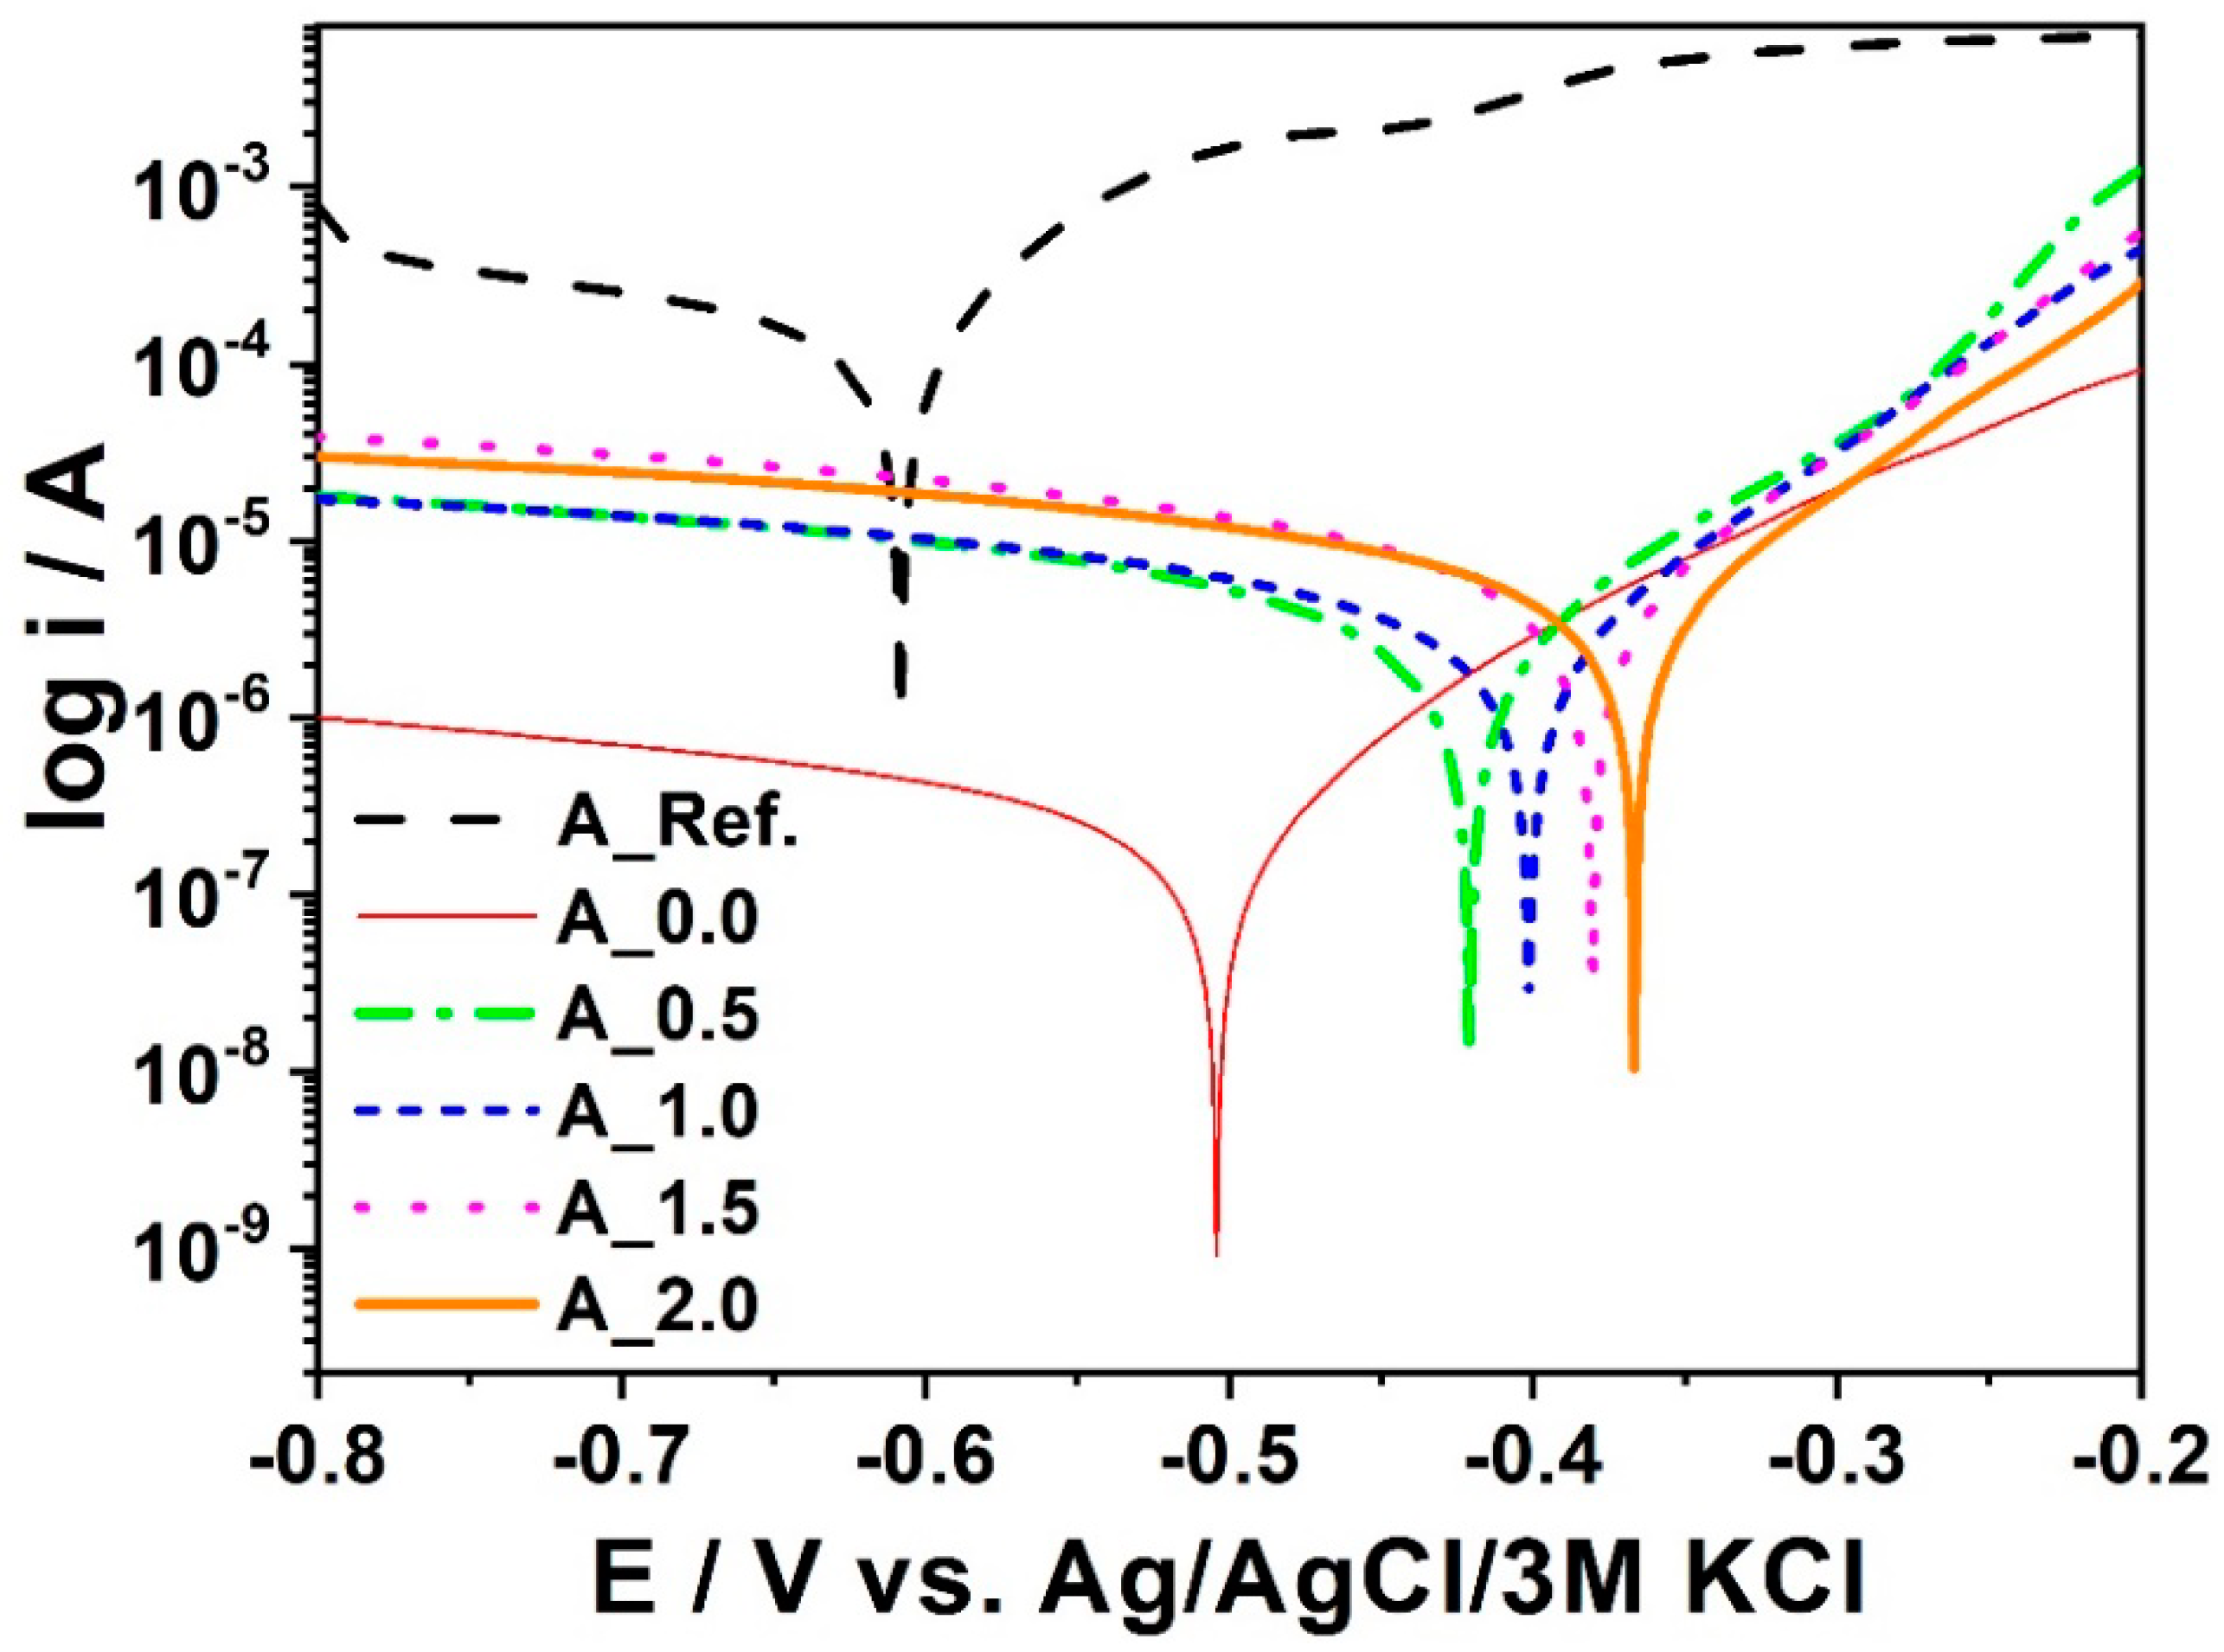
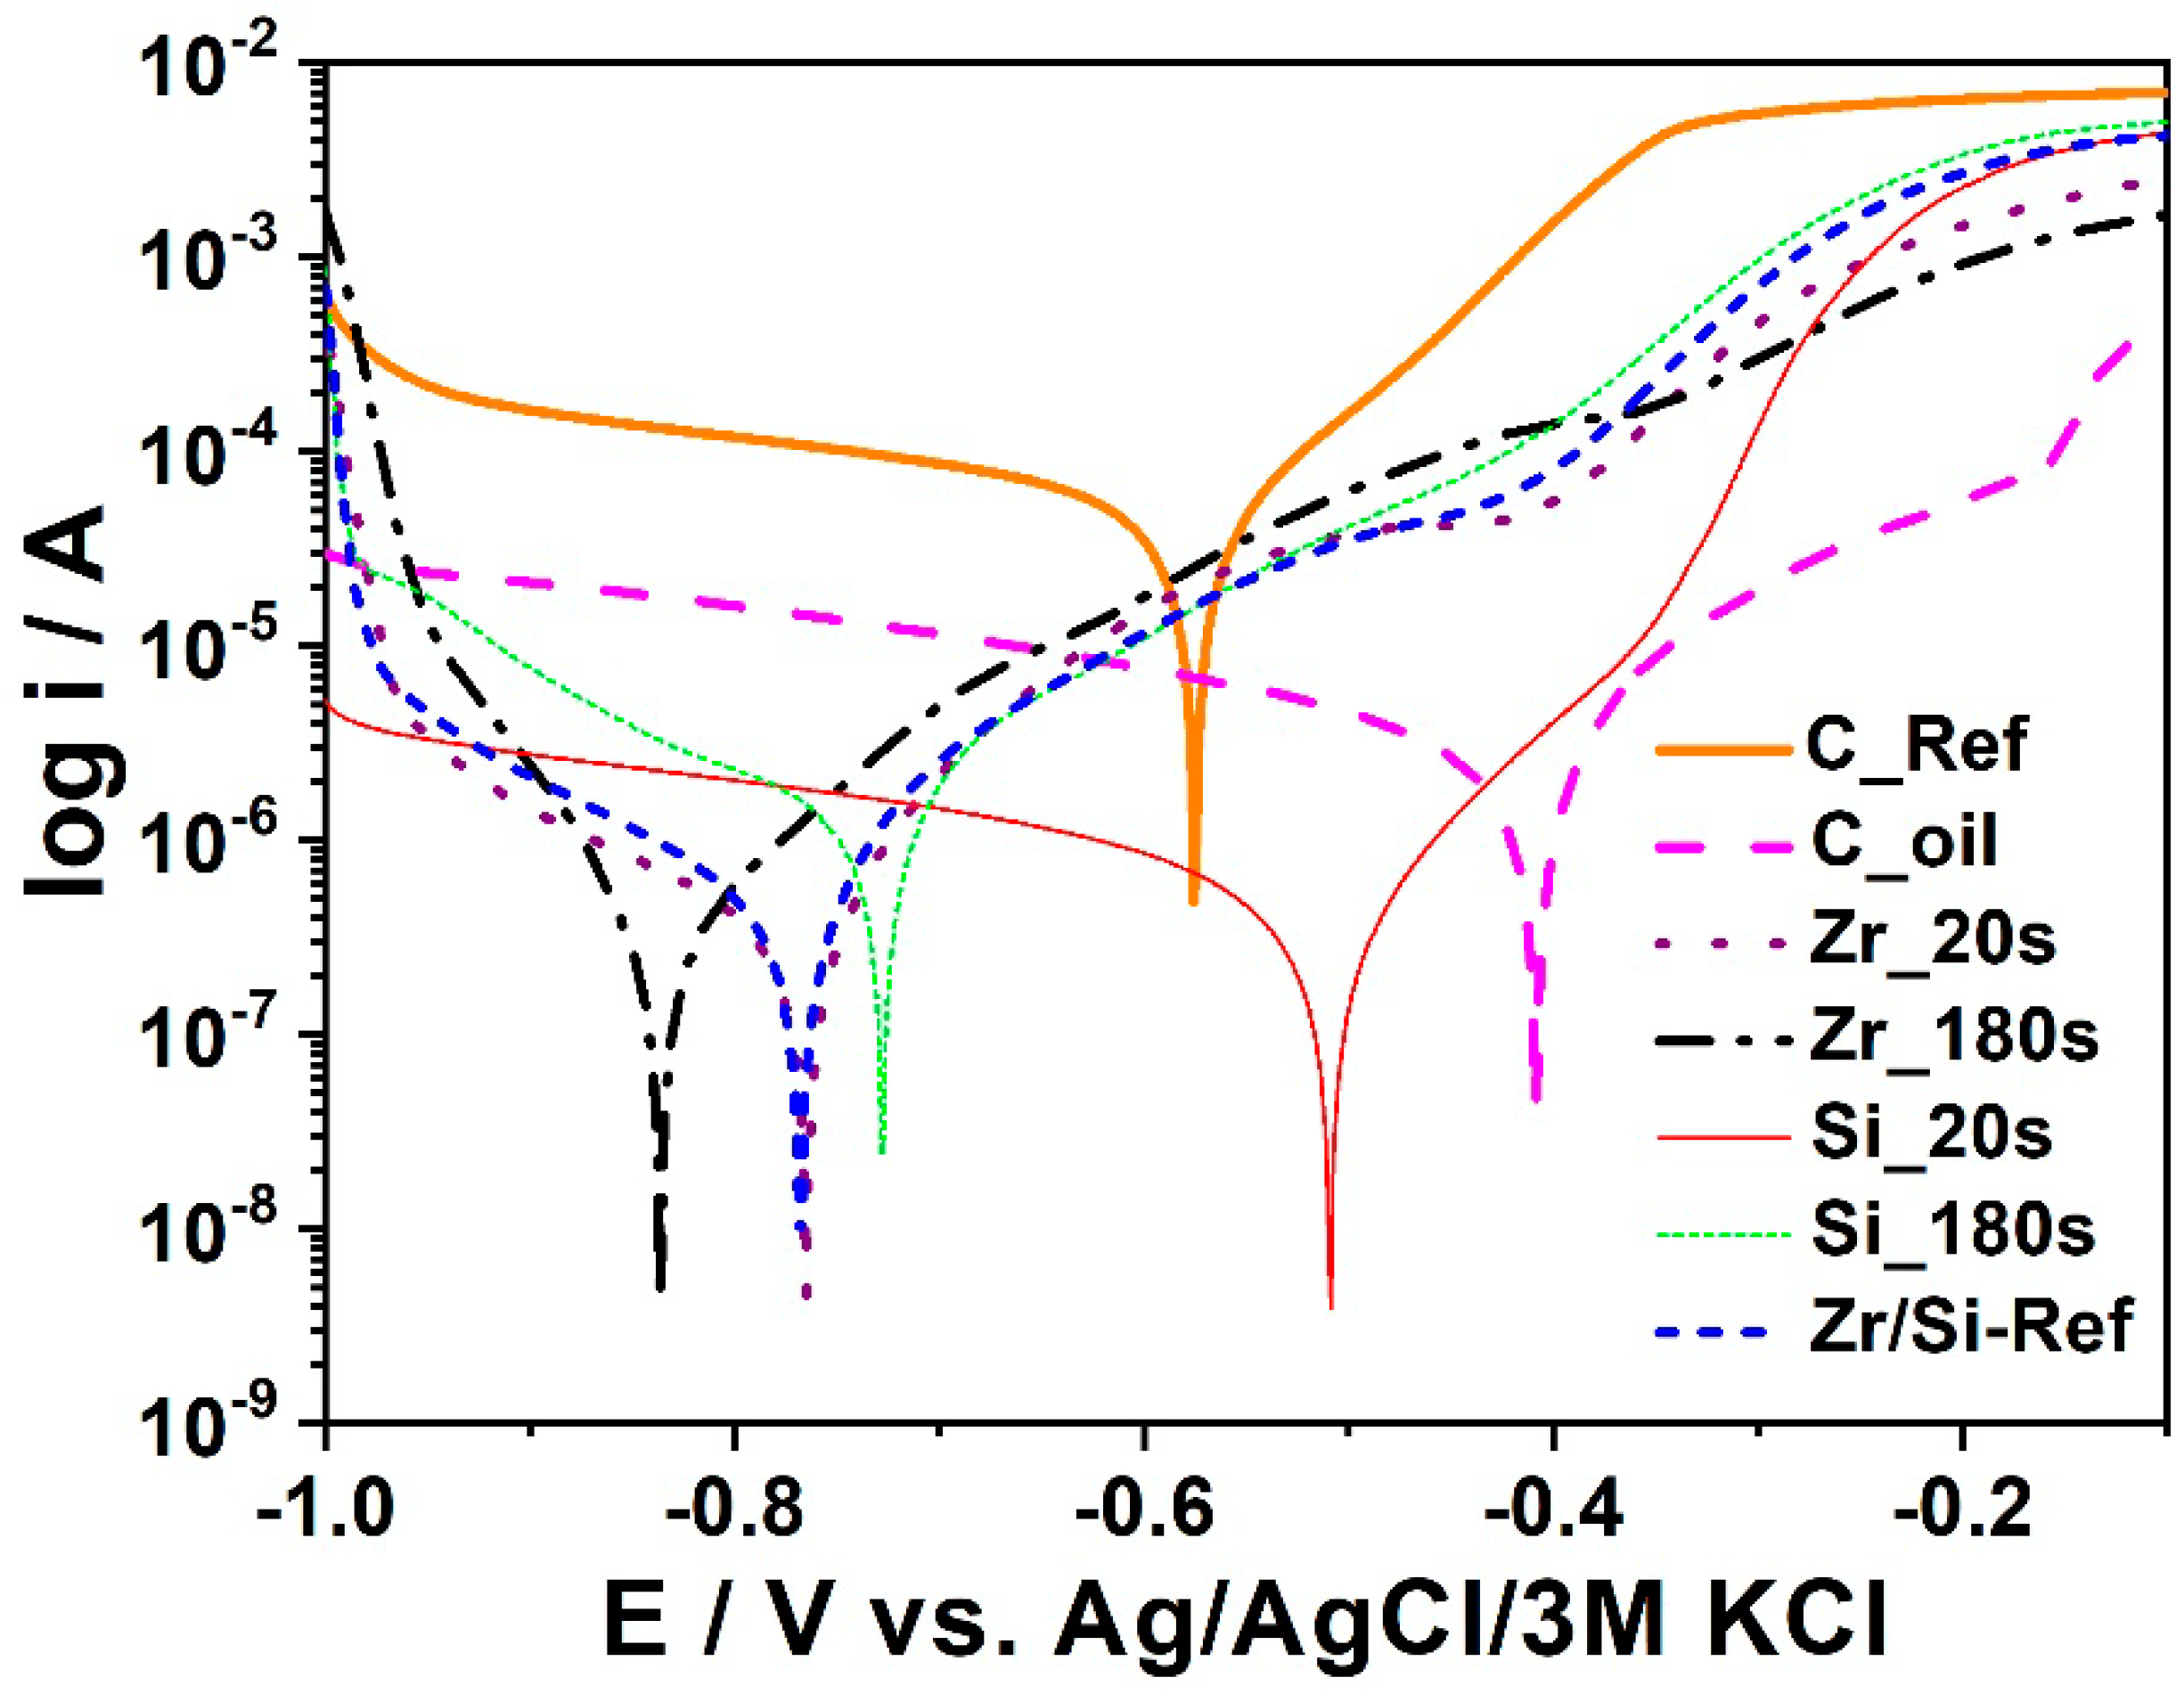
3.4. The Impact of Activation and Passivation on Coating Quality
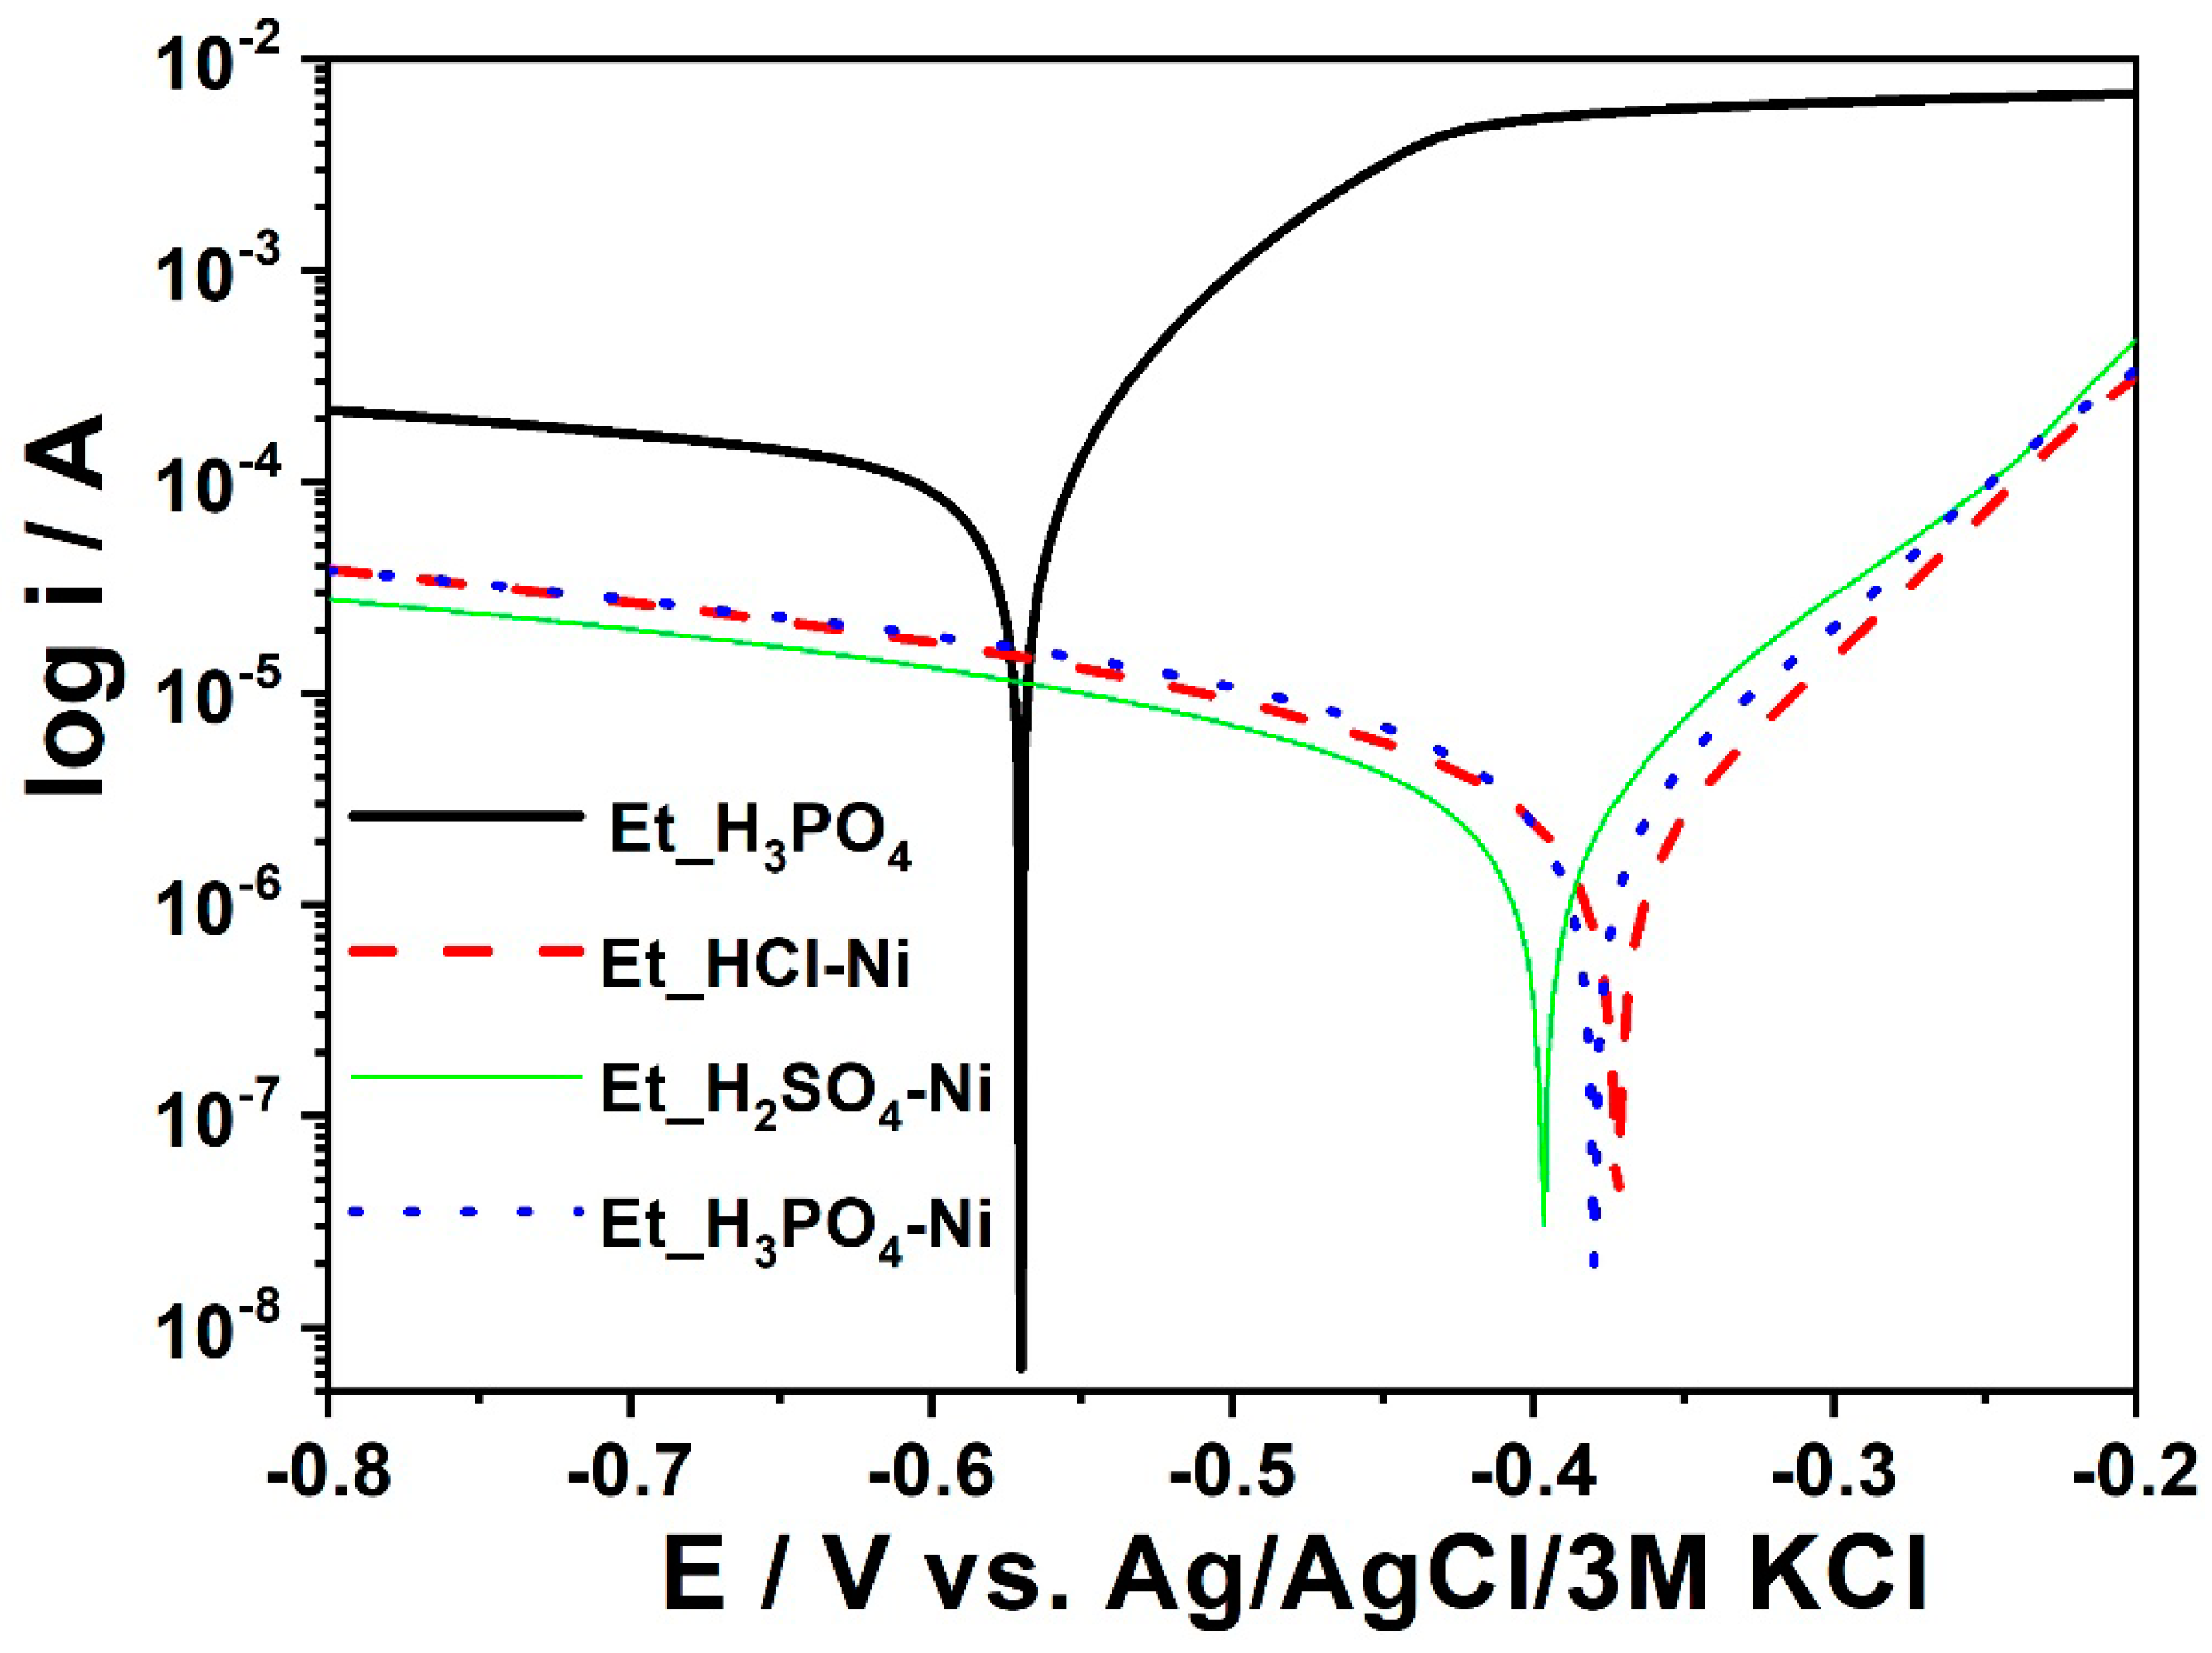
3.5. The Impact of Etching on Coating Quality
4. Conclusions
- (1)
- The addition of manganese in the form of manganese carbonate dramatically improves the phosphate coating. Similarly, the addition of nickel dramatically affects the quality of the phosphate coating achieved.
- (2)
- The activation of the surface of a metal sample just before the phosphating process begins significantly affects the corrosion resistance. Along with an increase in the concentration of manganese hydrogen phosphate and sodium pyrophosphate, smaller crystals are formed, which improves the tightness of the coating.
- (3)
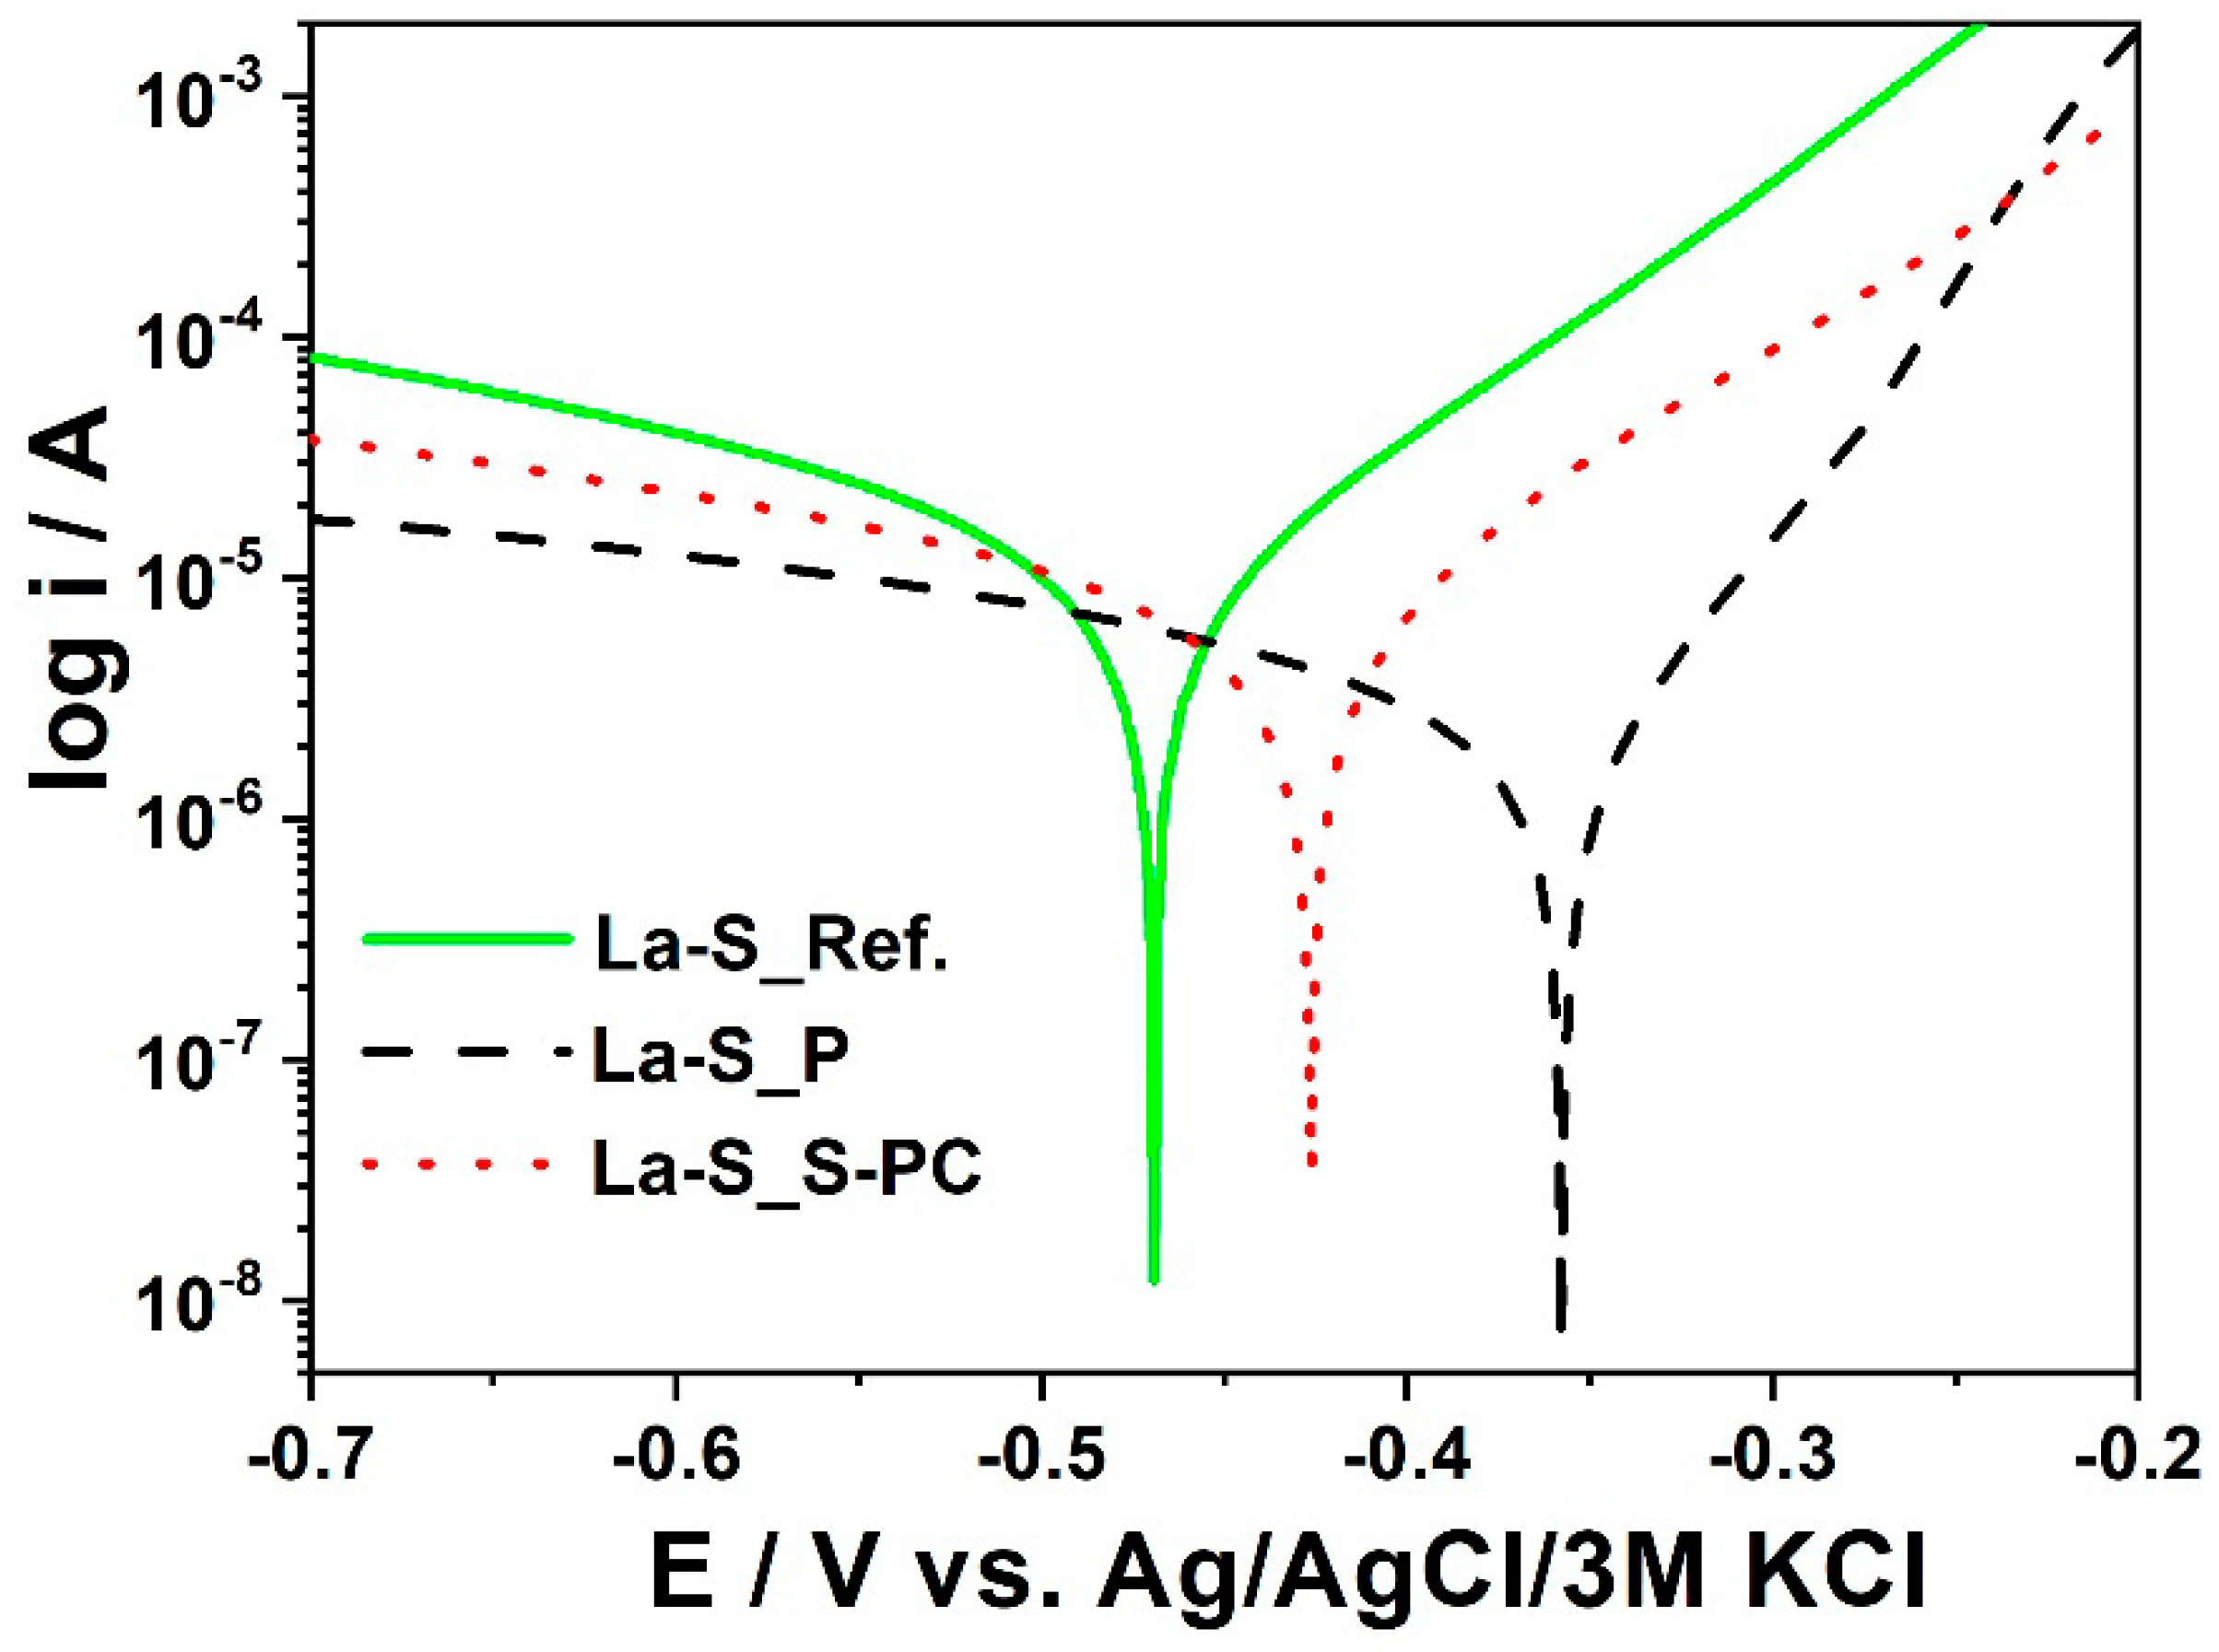
- It has been shown that the passivation process with the use of hexafluorozirconium acid or zirconyl chloride and hexafluorosilocon acid does not increase the concentration of zirconia and silicon in the manganese phosphate coating. The usage of zirconia chloride leads to good corrosion resistance.
- (4)
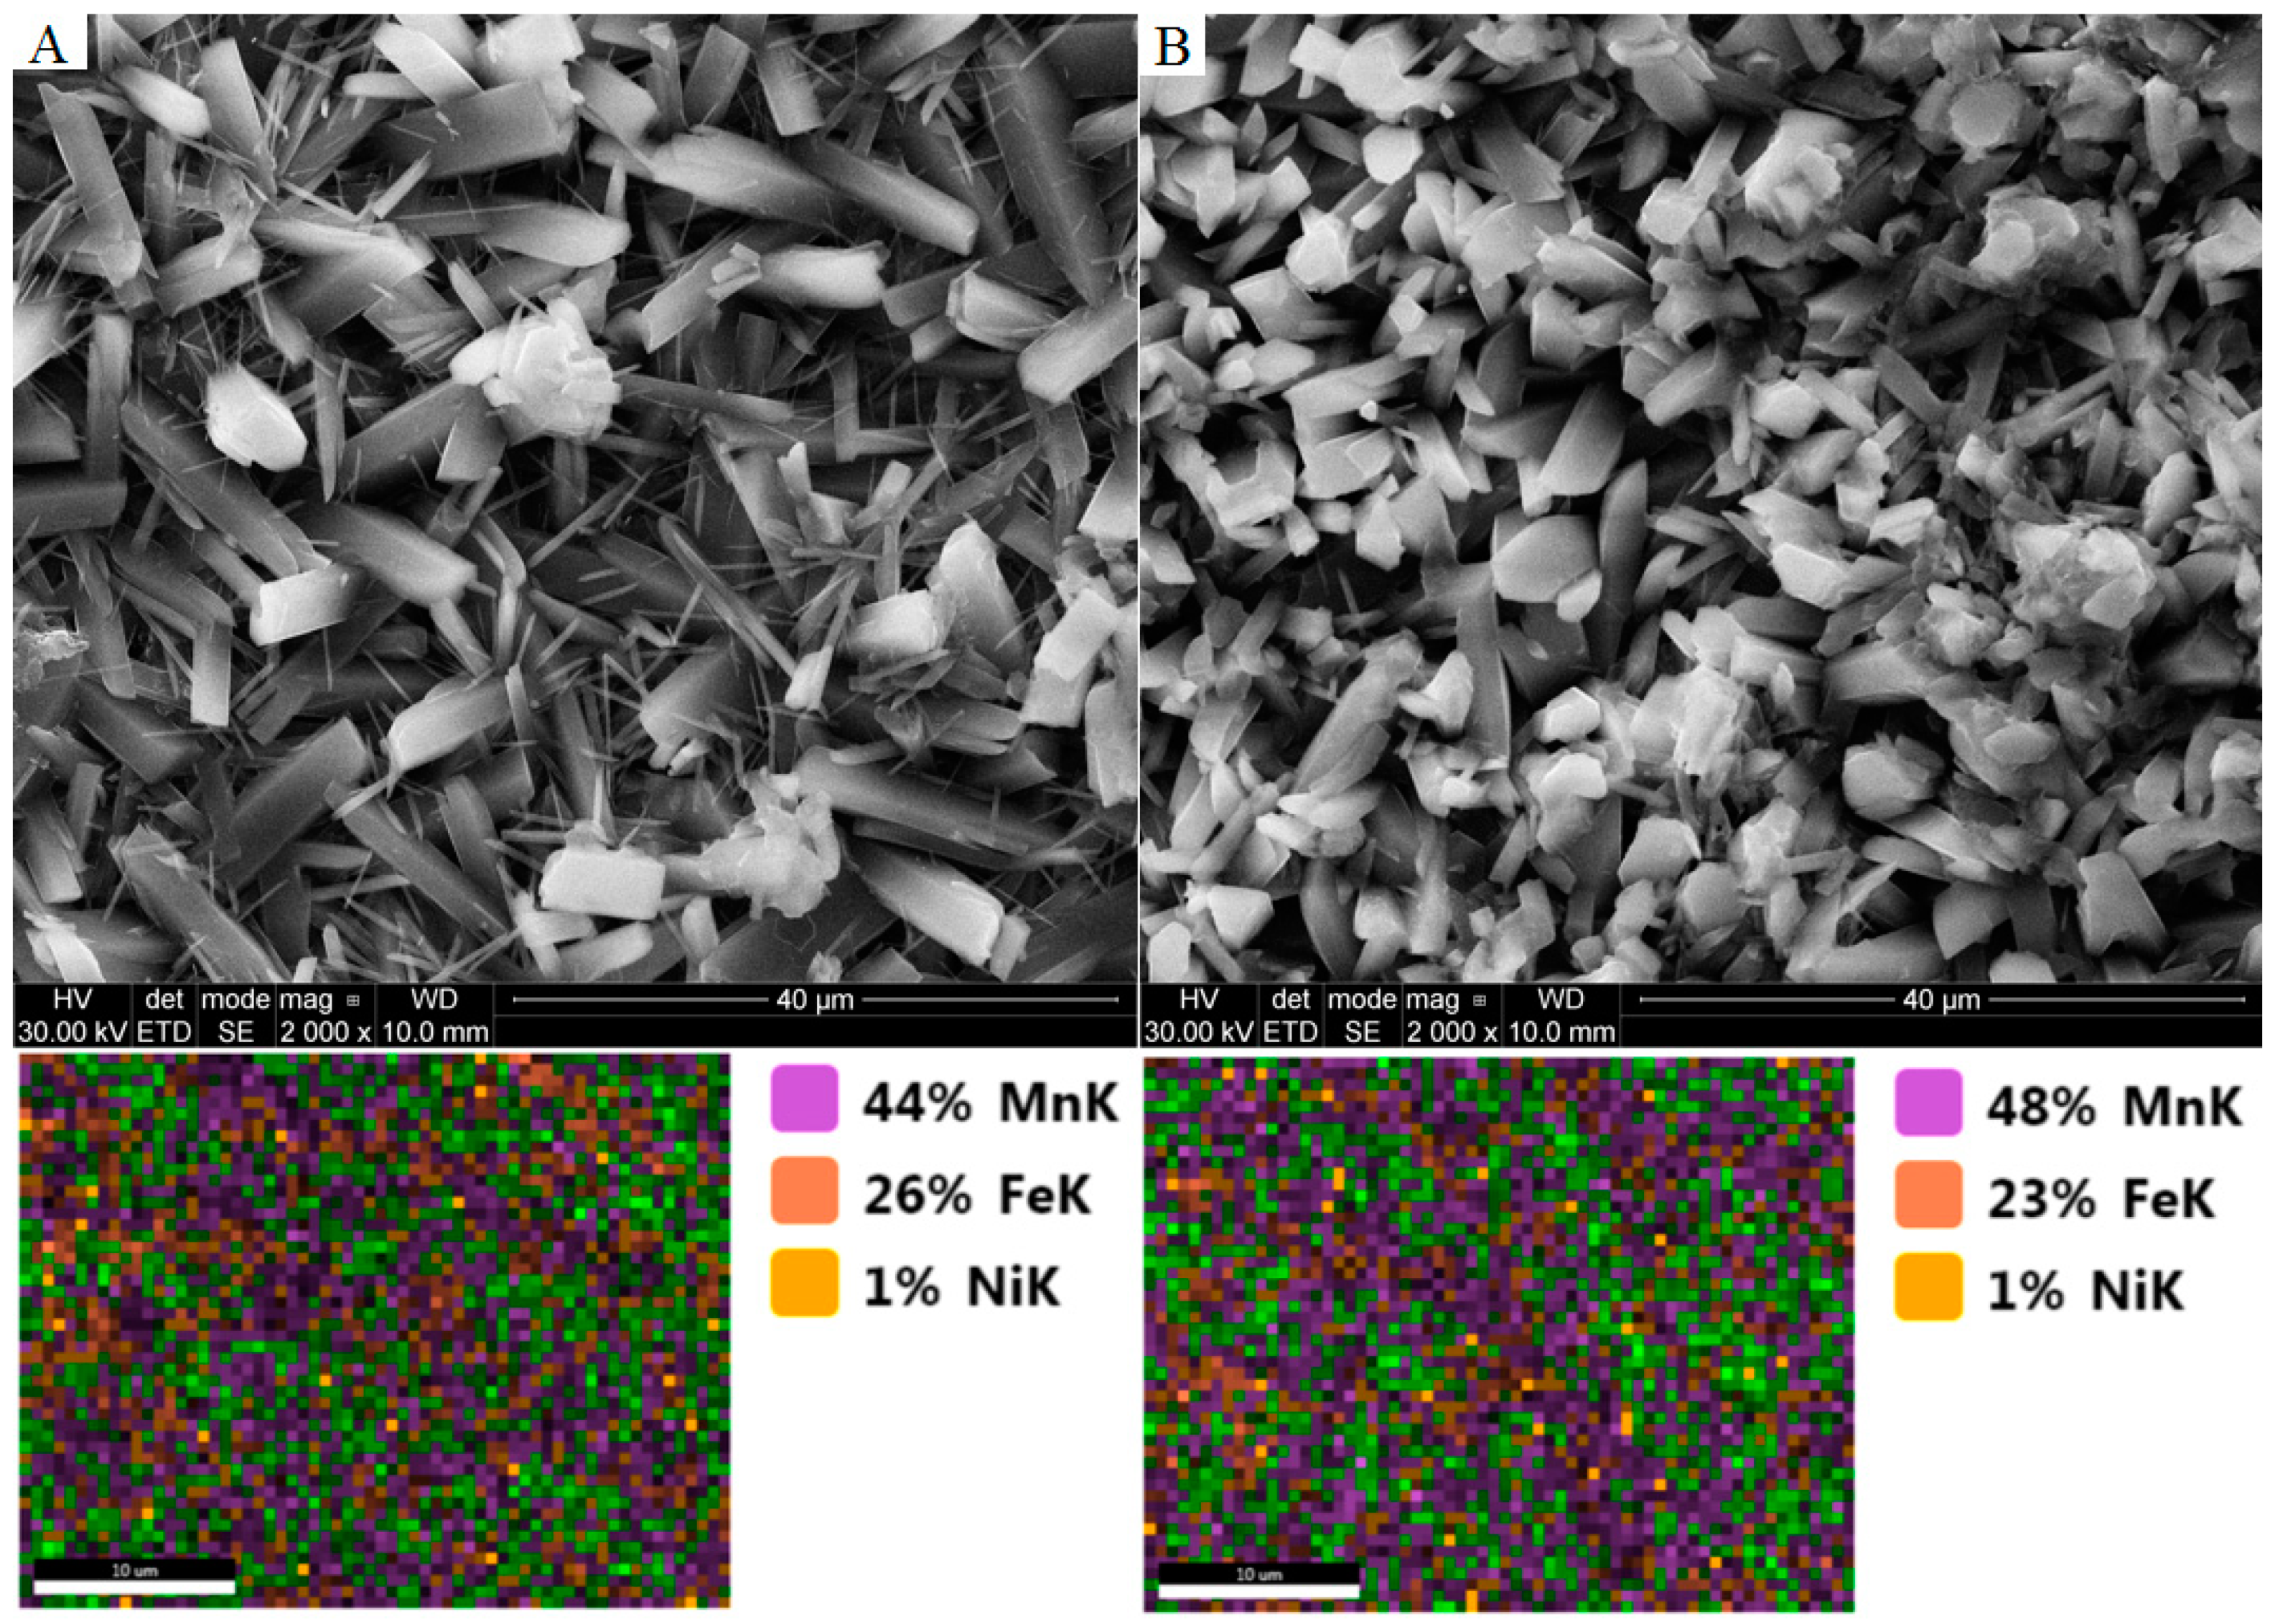
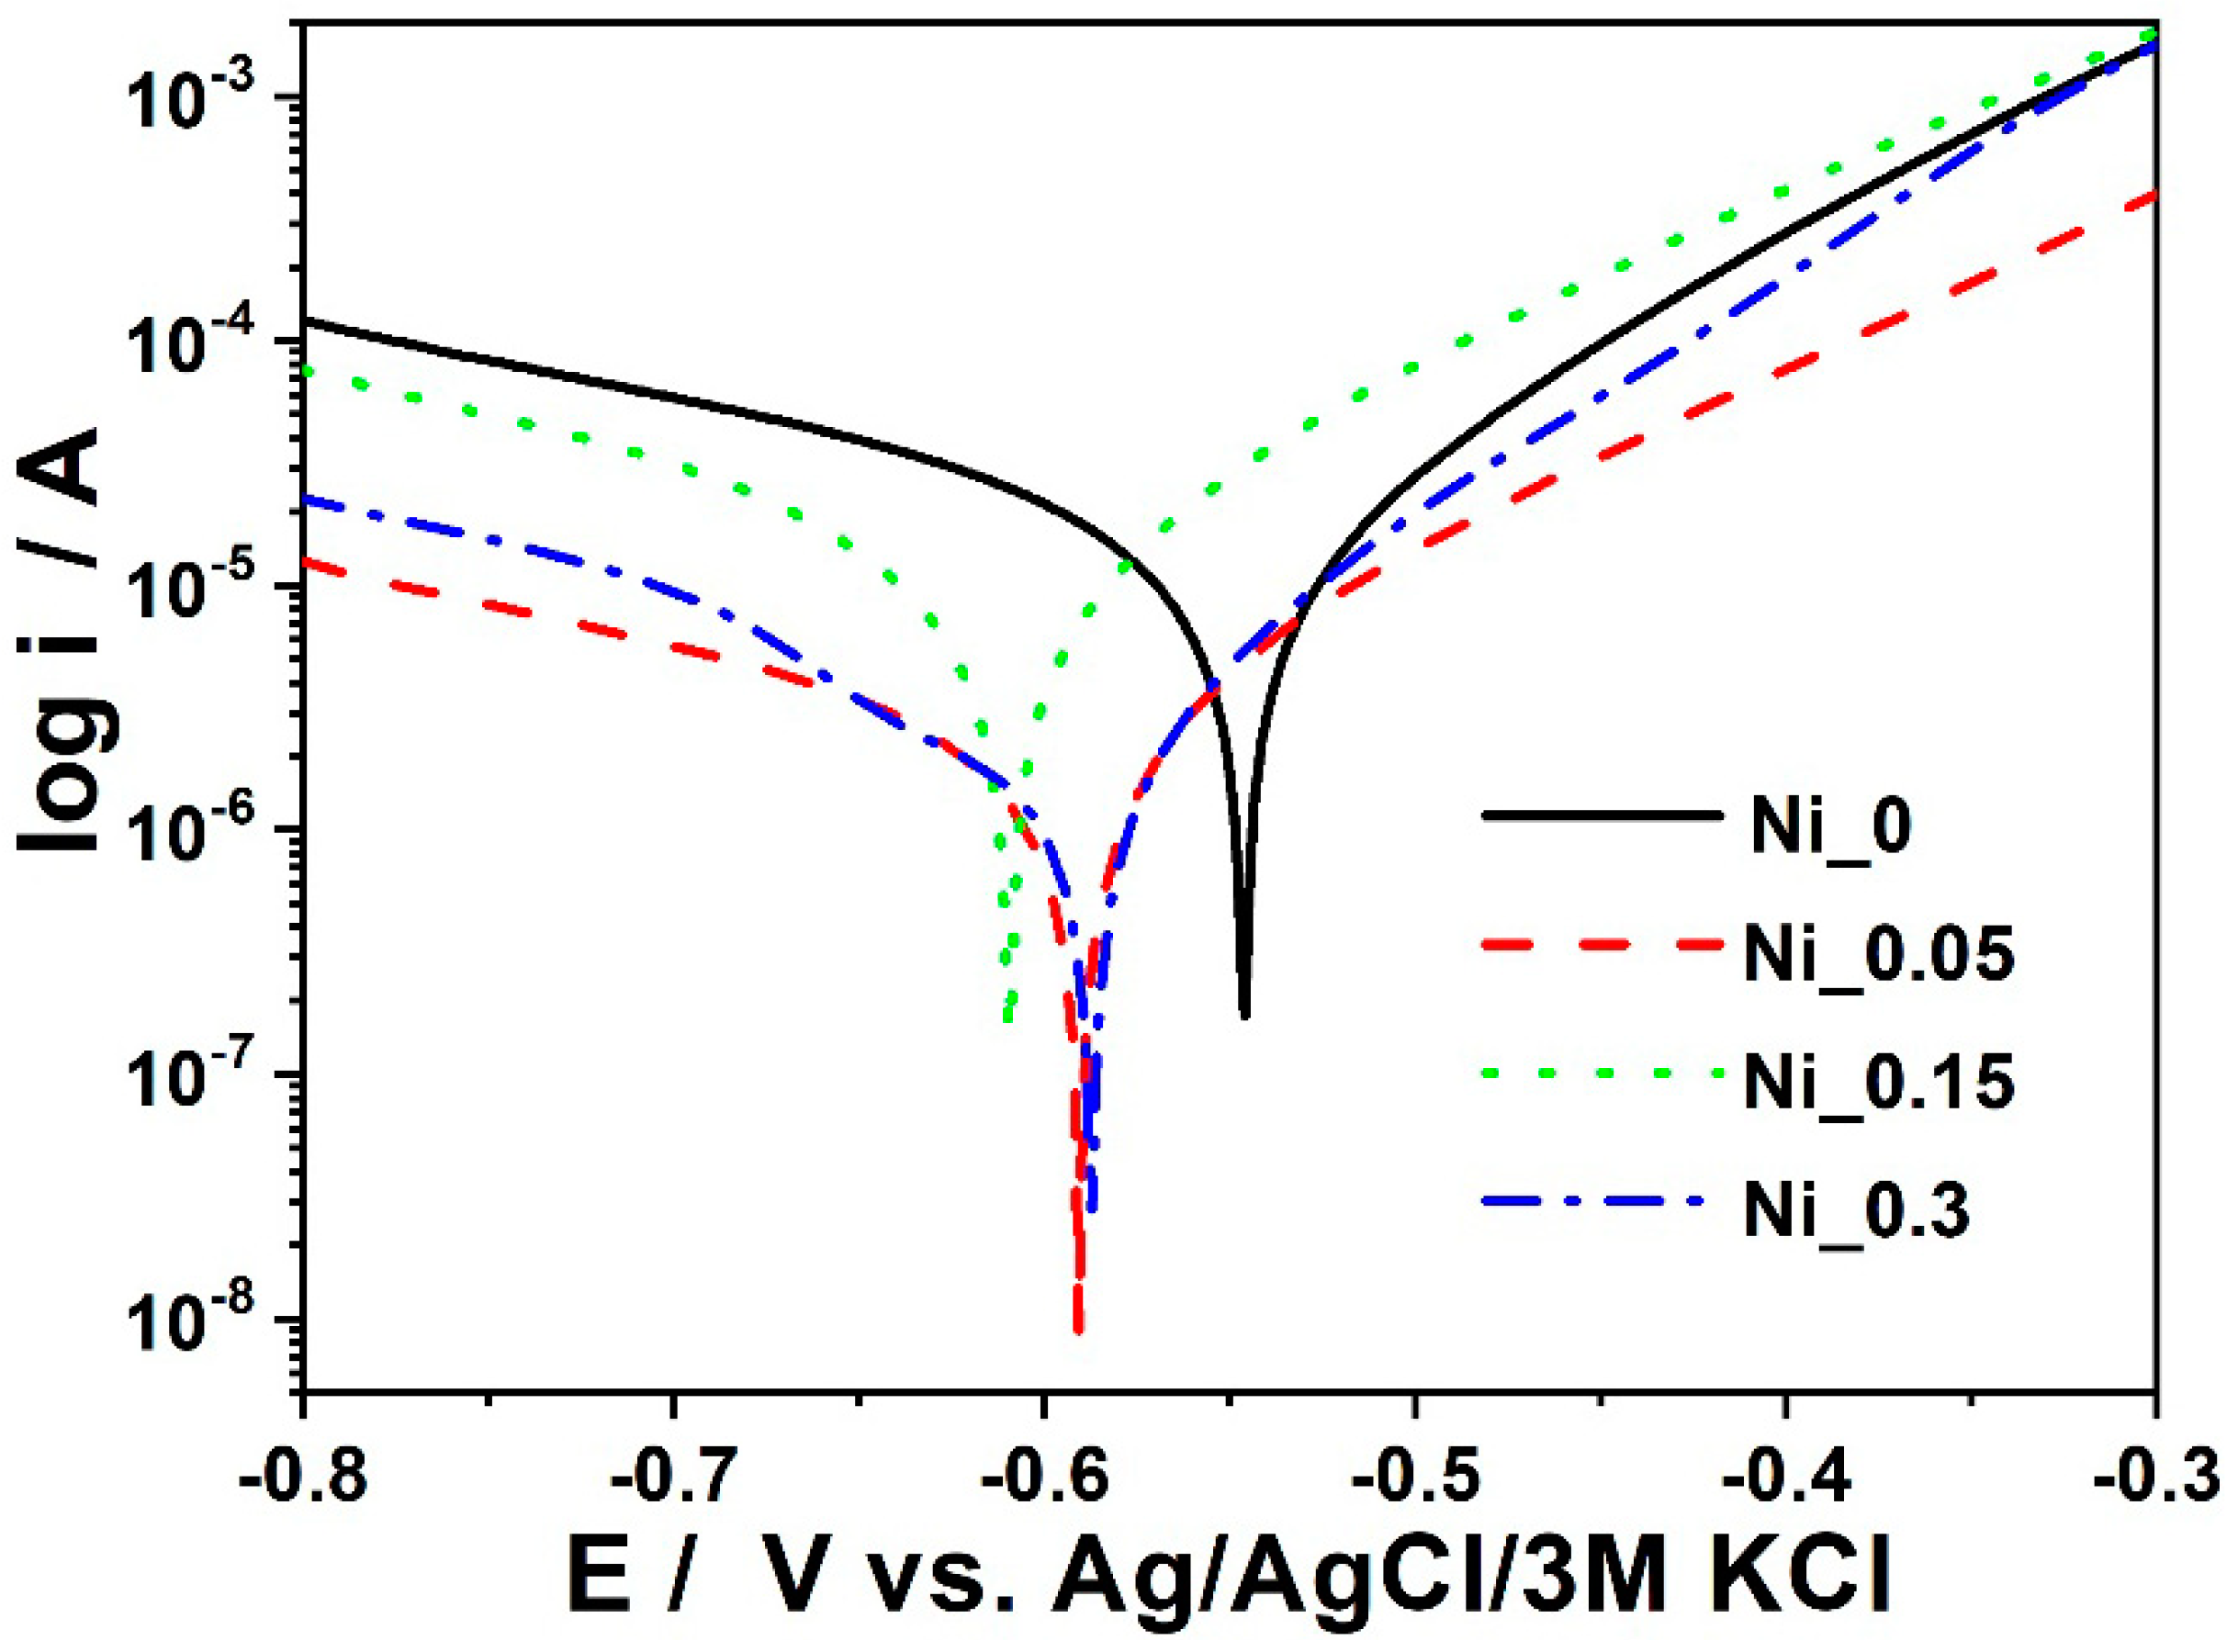
- The addition of manganese and nickel to the phosphating bath reduces the rate of corrosion of the sample. Also, increasing the concentration of the activating bath dramatically reduces the corrosion rate of the sample. It has been discovered that a higher concentration of nickel in the phosphating bath increases the anticorrosion properties of the coating. During the analysis, the optimal dose of the nickel (II) nitrate (V) was determined to be 0.6 g/1 dm3. The process without the use of nickel results in a coating which has crystals of different shapes.
- (5)
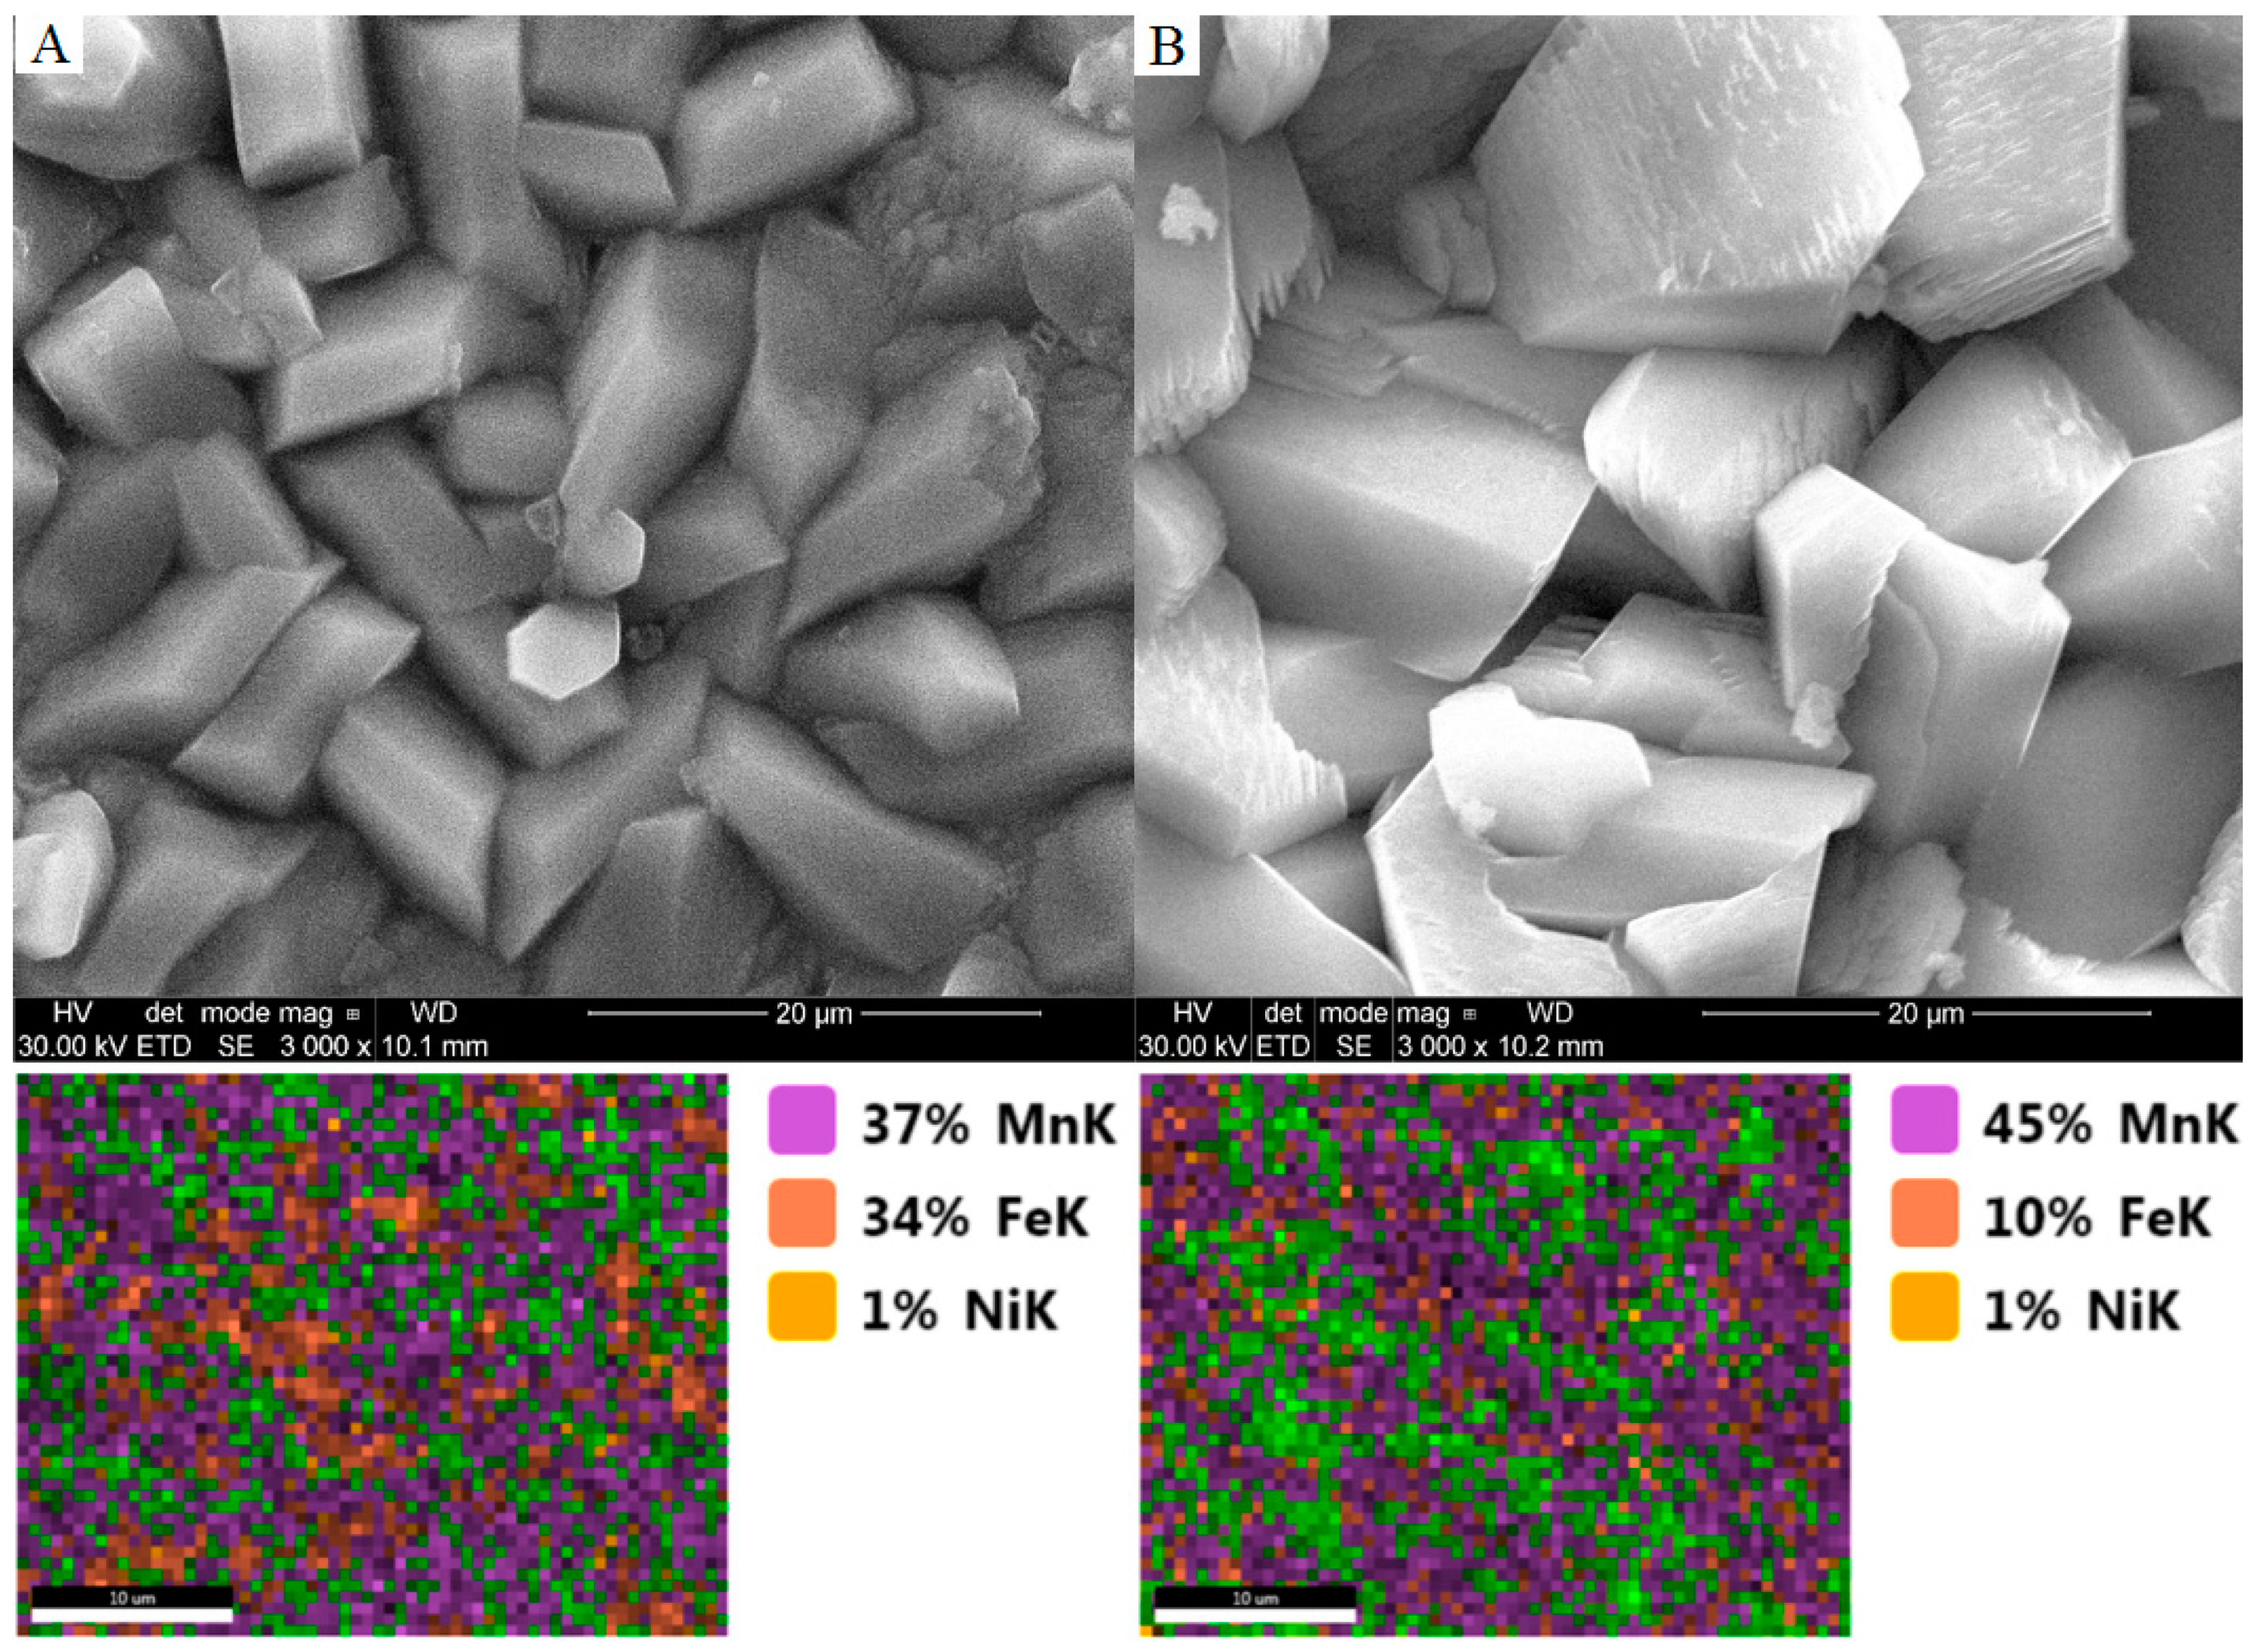
- With the increasing concentration of manganese, and without changing the acidity and the free acidity, the corrosion resistance of the phosphate coating increases. During the polarization measurements it can be seen that with an increasing formation time of a phosphate coating, the anticorrosive properties increase.
- (6)
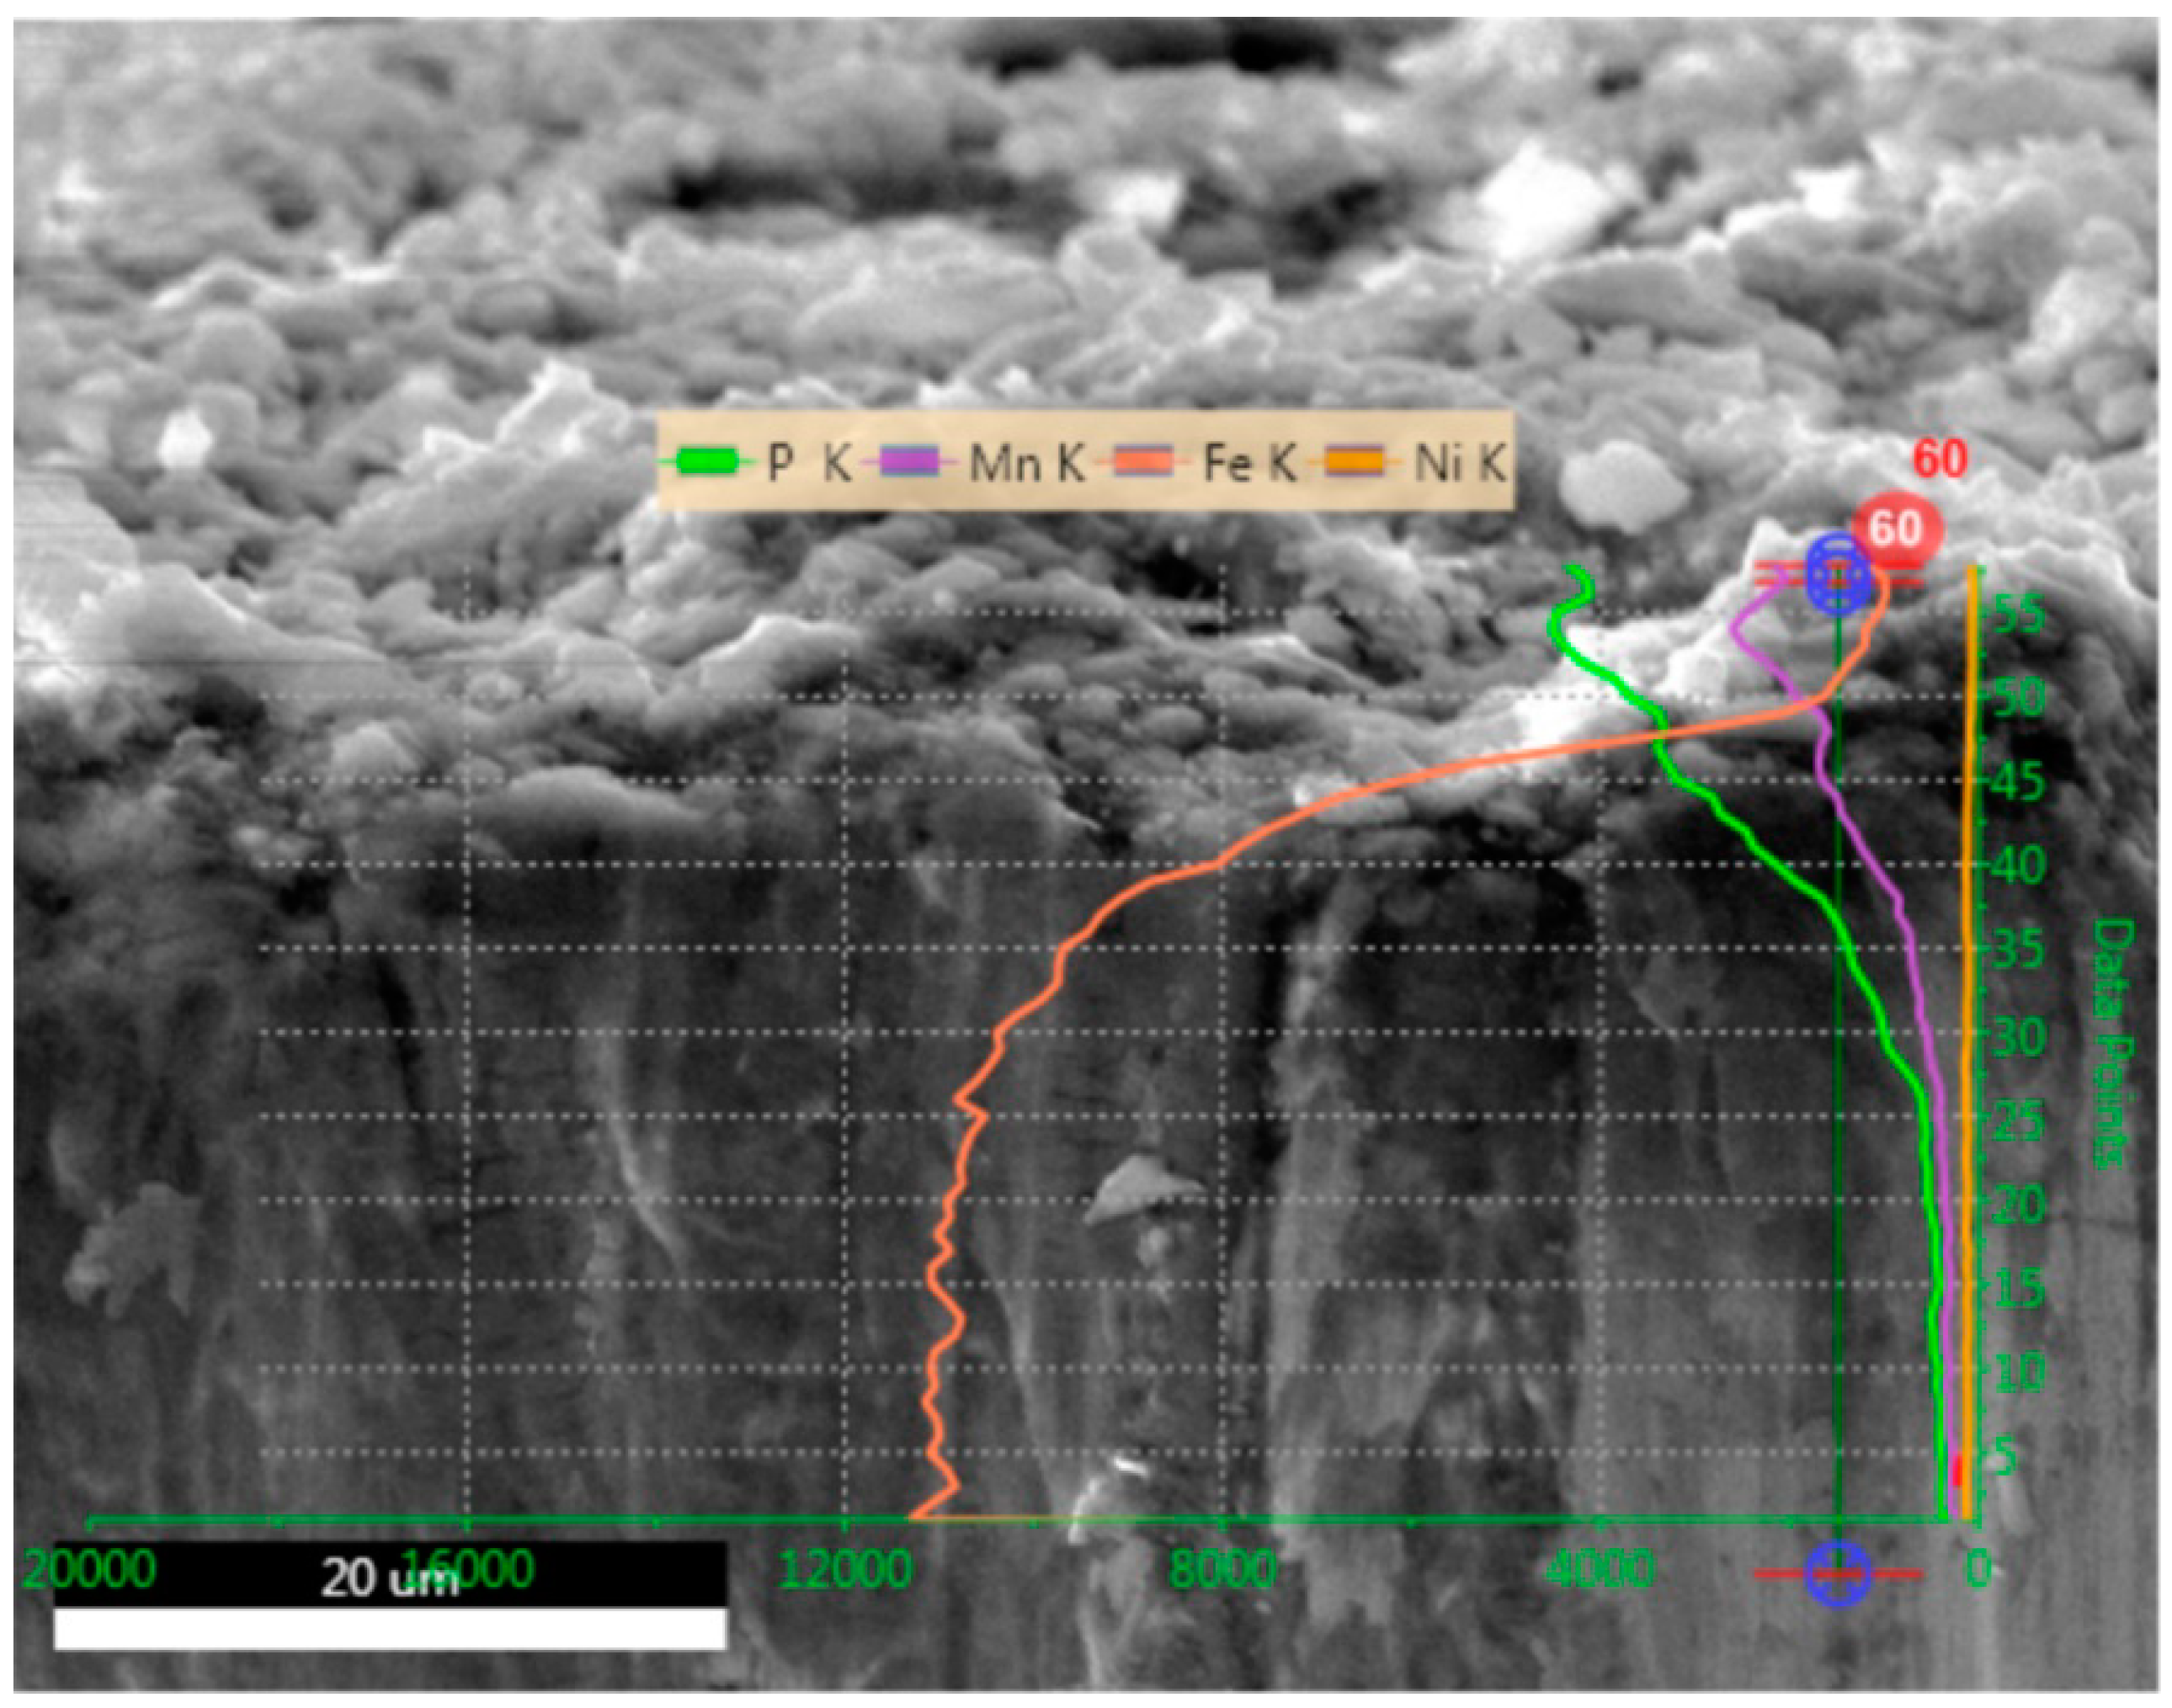
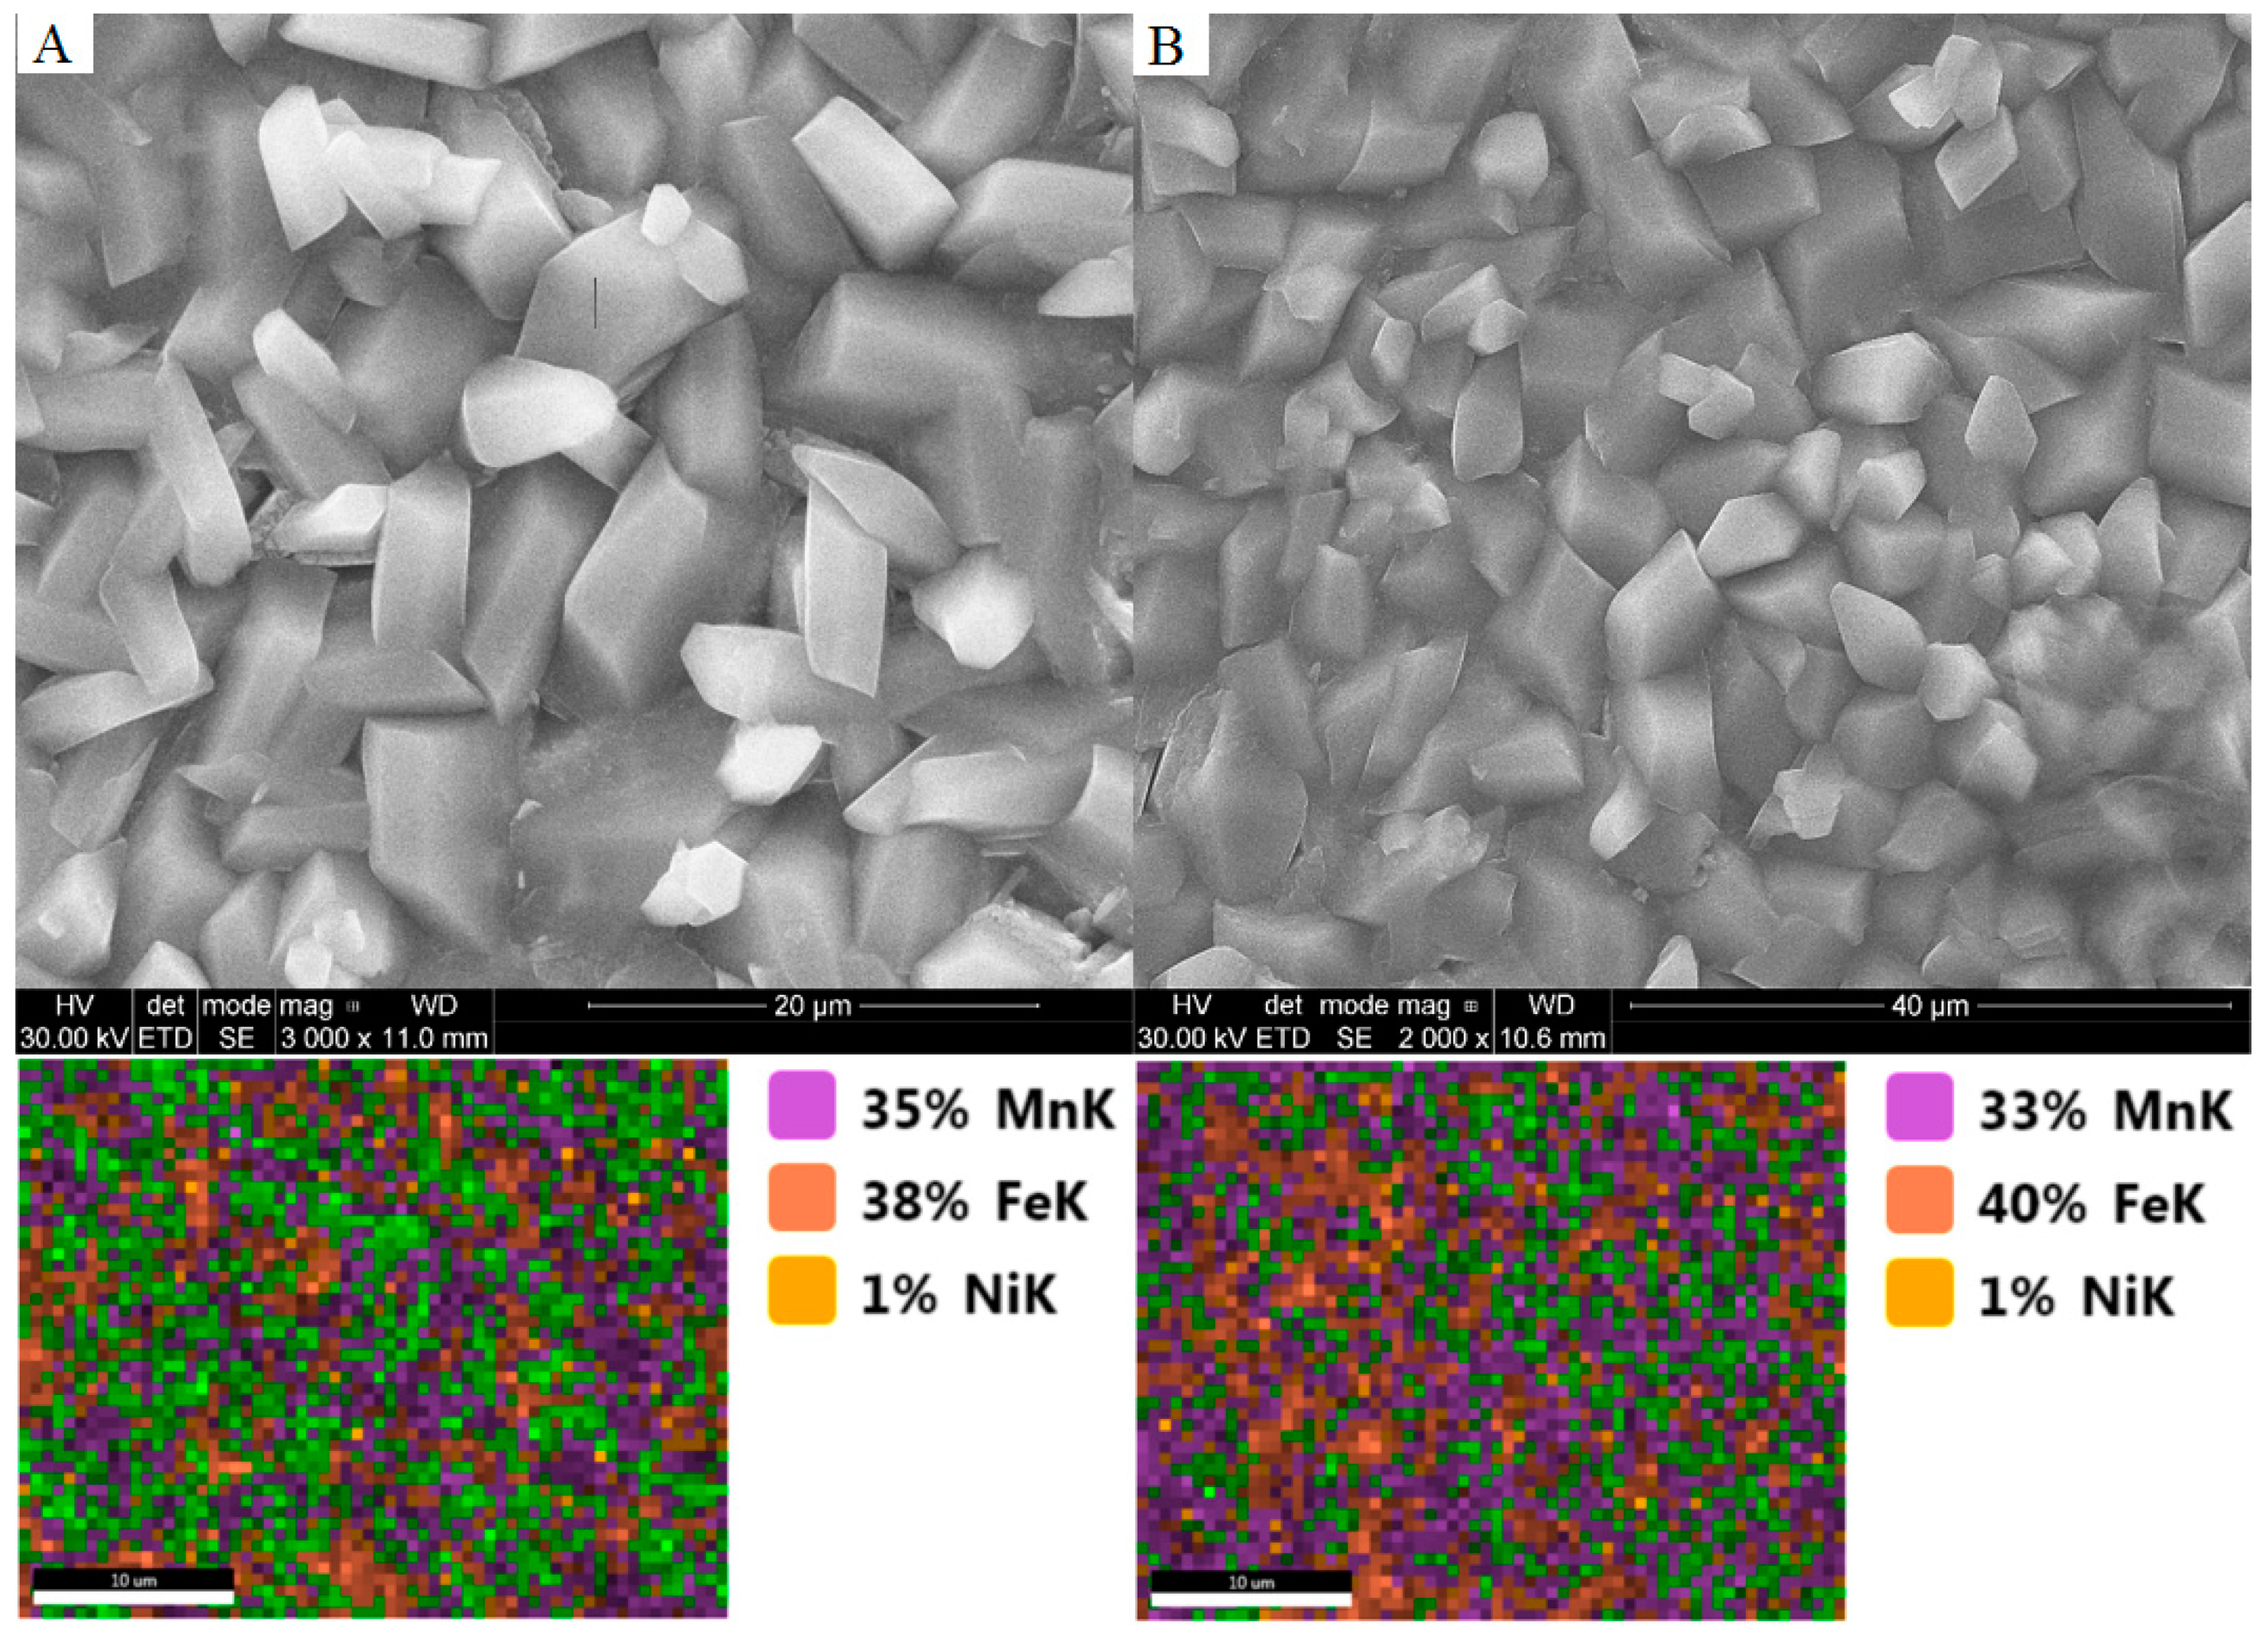
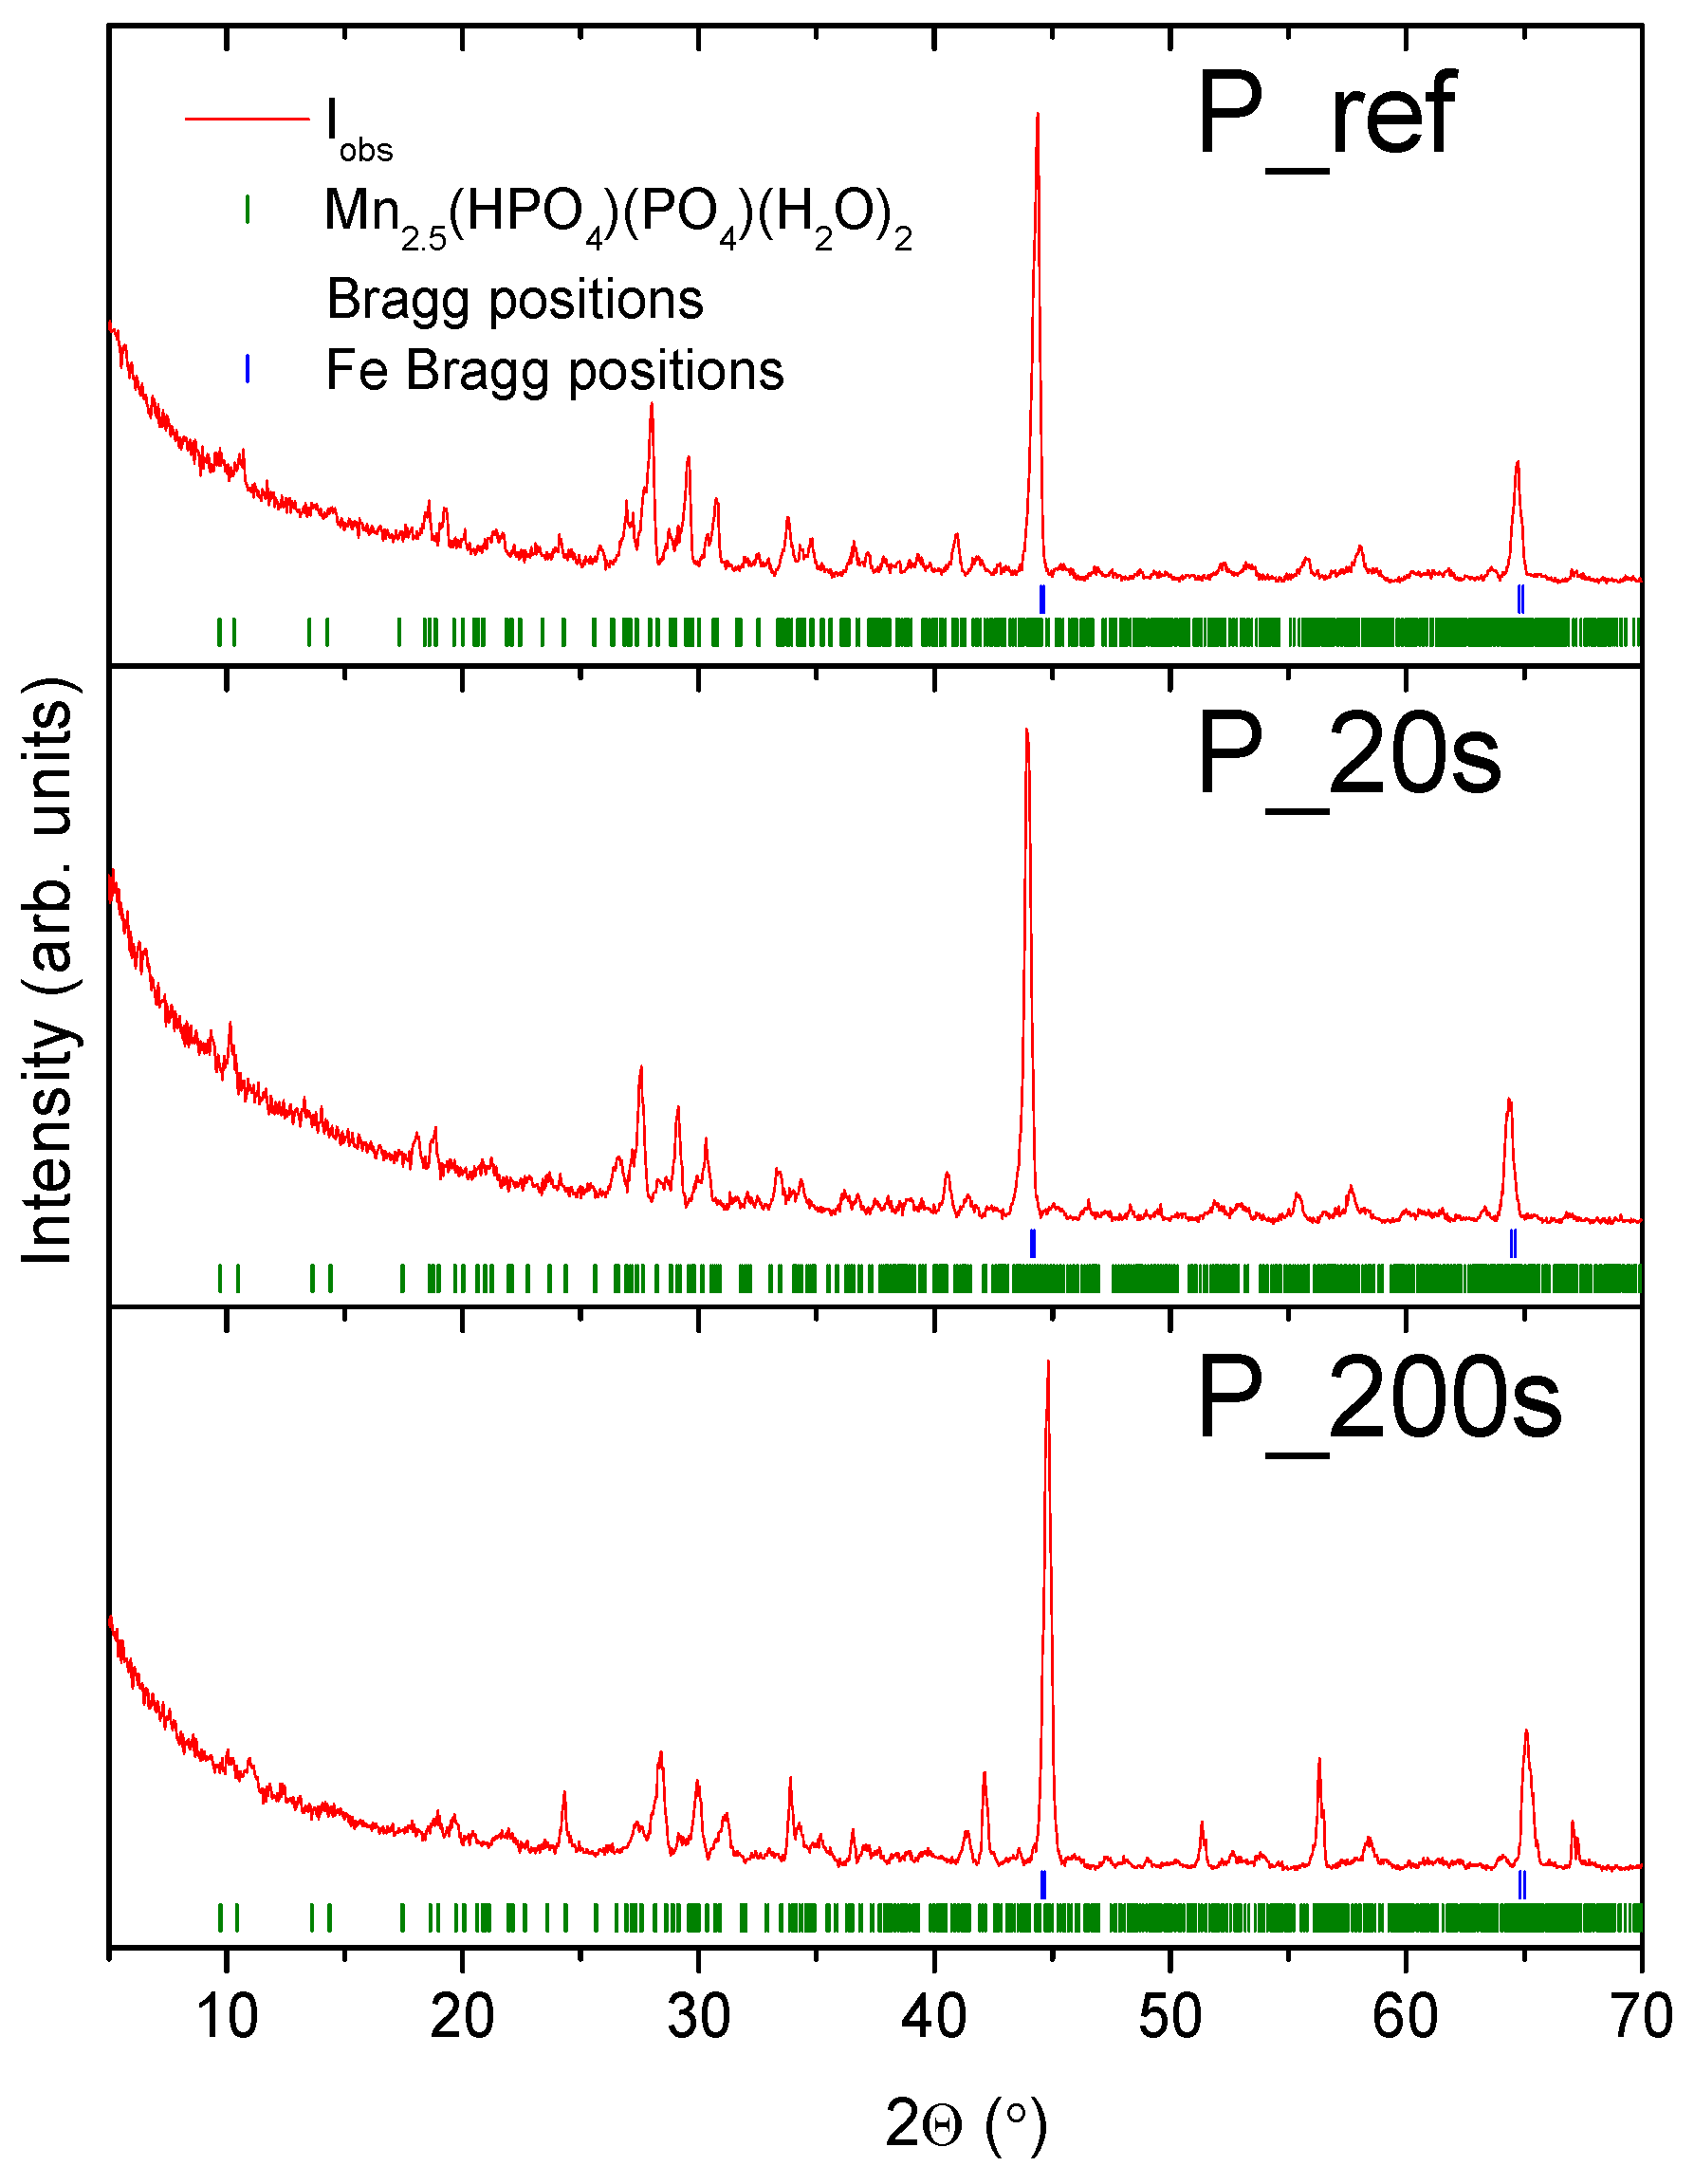
- XRD analysis indicated the presence of two phases in the phosphate coating; Fe metal phase and phosphate coating phase, Mn2.5(HPO4)(PO4)(H2O)2. The cross-section analysis showed that the manganese coating had no clear border between the surface and the metal. A relative atomic concentration on the surface is 50:37:13 (P:Mn:Fe) and 30 μm from the surface is 2:1:97 (P:Mn:Fe).
- (7)
- On the basis of electrochemical tests, it has been proven that with an increased immersion time of the sample in the phosphatizing bath, the corrosion resistance increases. The best effect was obtained for a sample with a time of 900 s in a phosphate bath.
- (8)
- The use of phosphoric acid in the process of sample etching results in a higher corrosion resistance of the coating. Furthermore, the addition of hydrogen peroxide to the etching bath affects the phosphating coating conditions.
Author Contributions
Funding
Conflicts of Interest
References
- Galvan-Reyes, C.; Fuentes-Aceituno, J.C.; Salinas-Rodríguez, A. The role of alkalizing agent on the manganese phosphating of a high strength steel part 1: The individual effect of NaOH and NH4OH. Surf. Coat. Technol. 2016, 291, 179–188. [Google Scholar] [CrossRef]
- Hosseini, M.R.; Sarabi, A.A.; Mohammadloo, E.E.; Sarayloo, M. The performance improvement of Zr conversion coating through Mn incorporation: With and without organic coating. Surf. Coat. Technol. 2016, 258, 437–446. [Google Scholar] [CrossRef]
- Mohammadloo, E.E.; Sarabi, A.A.; Sabbagh, A.A.; Sameie, H.; Salimi, R. Nano-ceramic hexafluorozirconic acid based conversion thin film: Surface characterization and electrochemical study. Surf. Coat. Technol. 2016, 206, 4132–4139. [Google Scholar] [CrossRef]
- Lostak, T.; Maljusch, A.; Klink, B.; Krebs, S.; Kimpel, M.; Flock, J.; Schulz, S.; Schuhmann, W. Zr-based conversiaon layer Zn-Al-Mg alloy coated steel sheets: Insights into the formation mechanism. Electrochem. Acta 2014, 137, 65–74. [Google Scholar] [CrossRef]
- Niu, L.; Lin, L.; Li, Y.; Shi, Z.; Xu, L. Improvenment of anticorrosion and adhesion to magnesium alloy by phosphate coating formed at room temperature. Sci. Dir. 2010, 20, 1356–1360. [Google Scholar]
- Miles, D.L.; Charles, H.R. Phosphate Coating Process and Composition. U.S. Patent Application No. 214,537, 18 May 1982. [Google Scholar]
- Per-Erik, T. The mechanism of chemical activation with titanium phosphate colloids in the formation of zinc phosphate conversion coatings. Colloids Surf. 1990, 49, 373–383. [Google Scholar]
- Fouladi, M.; Amadeh, A. Comparative study between novel magnesium phosphate and traditional zinc phosphate coatings. Mater. Lett. 2013, 98, 1–4. [Google Scholar] [CrossRef]
- Banaczek, E.P.; Rodrigues, P.R.P.; Costa, I. Investigation on the effect of benzotriazole on the phosphating of carbon steel. Surf. Coat. Technol. 2006, 201, 3701–3708. [Google Scholar] [CrossRef]
- Rongchang, Z.; Zidong, L.; Linghong, K.; Yuanding, H.; Hongzhi, C. Characterization of calcium-modified zinc phosphate conversion coatings and their influences on corrosion resistance of AZ31 alloy. Surf. Coat. Technol. 2011, 205, 3347–3355. [Google Scholar] [Green Version]
- Niu, L.Y.; Jiang, Z.H.; Li, G.Y.; Gu, C.D.; Lian, J.S. A study and application of zinc phosphate coating on AZ91D magnesium alloy. Surf. Coat. Technol. 2006, 9, 3021–3026. [Google Scholar] [CrossRef]
- Li, G.Y.; Lian, J.S.; Niu, L.Y.; Jiang, Z.H.; Jiang, Q. Growth of zinc phosphate coatings on AZ91D magnesium alloy. Surf. Coat. Technol. 2006, 201, 1814–1820. [Google Scholar] [CrossRef]
- Nguyen, P.; Kyuhwan, L.; Doyon, C.; Man, K.; Sangyeoul, L.; Sungmo, M. Zinc phosphate conversion coatings on magnesium alloys: A review. Met. Mater. Int. 2013, 19, 273–281. [Google Scholar]
- Nguyen, P.; Sungmo, M. Comparative corrosion study of zinc phosphate and magnesium phosphate conversion coatings on AZ31 Mg alloy. Mater. Lett. 2014, 122, 341–344. [Google Scholar]
- Fath, L.; Azadbeh, M. Effect of surface mechanical activation on morphology of zinc phosphate coating. World Appl. Sci. J. 2013, 26, 122–125. [Google Scholar]
- Gurunathan, E.; Senthilkumar, A. Optimization of Zinc Phosphating Process Using Statistical Tool. IOSR J. Mech. Civil Eng. e-ISSN: 2278-1684. 19–28. Available online: http://iosrjournals.org/iosr-jmce/papers/ICRTEM/ME/Volume-4/IOSRME04.pdf?id=7622 (accessed on 28 February 2018).
- Jegannathan, S.; Narayanan, T.S.N.S.; Ravichandran, K.; Rajeswari, S. Performance of zinc phosphate coatings obtained by cathodic electrochemical treatment in accelerated corrosion tests. Electrochim. Acta 2005, 51, 247–256. [Google Scholar] [CrossRef]
- Prado da Silva, M.H.; Moura, F.N.; Navarro da Rocha, D.; Gobbo, L.A.; Costa, A.M. Zinc-modified hydroxyapatite coatings obtained from parascholzite alkali conversion. Surf. Coat. Technol. 2014, 249, 109–117. [Google Scholar] [CrossRef]
- Gruss, B. Iron phosphating. Met. Finish. 2010, 108, 33–37. [Google Scholar] [CrossRef]
- Breur, H.J.A.; de Wit, J.H.W. Electrochemical impendance study on the formation of biological iron phosphate layer. Electrochim. Acta 2002, 47, 2289–2295. [Google Scholar] [CrossRef]
- Popić, J.P.; Jegdić, B.V. The effect on deposition temperature on the surface coverage and morphology of iron-phosphate coatings on low carbon steel. Appl. Surf. Sci. 2011, 257, 10855–10862. [Google Scholar] [CrossRef]
- Guangyu, L.; Liyuan, N.; Jinshe, L.; Zhonghao, J. A black phosphate coating for C1008 steel. Surf. Coat. Technol. 2004, 176, 215–221. [Google Scholar]
- Weng, D.; Jokiel, P.; Uebleis, A.; Boehni, H. Corrosion and protection characteristics of zinc and manganese phosphate coatings. Surf. Coat. Technol. 1996, 88, 147–156. [Google Scholar] [CrossRef]
- Wang, C.; Liau, H.; Tsai, W.T. Effects of temperature and applied potential on the microstructure and electrochemical behavior of manganese phosphate coating. Surf. Coat. Technol. 2006, 201, 2994–3001. [Google Scholar] [CrossRef]
- Westberg, H.J.; Nilsson, P.H.; Rosén, B.G.; Stenbom, B. Manganese Phosphating of Gears and Surface Roughness Consequence; Chalmers University of Technology, Department of Production Engineering, Volvo Technological Development: Gothenburg, Sweden, 2013. [Google Scholar]
- Hivart, P.; Hauw, B.; Brincout, J.P.; Oudin, J. Seizure behaviour of manganese phosphate coatings according to the process conditions. Tribol. Int. 1997, 30, 561–570. [Google Scholar] [CrossRef]
- Iaiyavel, S.I.; Venkatesan, A. Experimental Investigation of Wear Characteristics on Manganese Phosphate Coated AISI D2 Steel. Int. J. Precis. Eng. Manuf. 2012, 13, 581–586. [Google Scholar] [CrossRef]
- Menchetti, S.; Sabelli, C. The crystal structure of Hureaulite Mn5(HOPO3)2(PO4)2(H2O)4. Acta Cryst. B 1973, 29, 2541–2548. [Google Scholar] [CrossRef]
- Duszczyk, J.; Zaleska-Medynska, A. Manganowe powłoki fosforanowe, VIII Seminarium Koła Naukowego “Żyjesz w Środowisku” PWSZ Kalisz. Available online: http://www.pwsz.kalisz.pl/index.php/seminarium-z-licealistami (accessed on 28 February 2018).
- Alvarado-Macías, G.; Fuentes-Aceituno, J.C.; Rodríguez, A.S.; Rodríguez-Varela, F.J. Understanding the Nature of the Manganese Hot Dip Phosphatizing Process of Steel. J. Mex. Chem. Soc. 2013, 57, 328–336. [Google Scholar] [CrossRef]
- Nittel, K.-L.; Seifert, D.; Stickler, R. Method for Applying Manganese Phosphate Layers. U.S. Patent Application No. 12/971,806, 14 April 2011. [Google Scholar]
- Boulos, M.S.; Montrose, D.C.; Petschel, M. Moderate Temperature Manganese Phosphate Conversion Coating Composition and Process. U.S. Patent Application No. 747,136, 17 March 1998. [Google Scholar]
- Woods, K.J. Accelerator for Phosphating Solutions. U.S. Patent Application No. 711,232, 25 April 1978. [Google Scholar]
- Dolan, S.E. Composition and Process for Treating Metals. U.S. Patent Application No. 300,674, 12 September 1995. [Google Scholar]
- Minevski, Z.; Maxey, J.; Eylem, C. Isomolybdate Conversion Coatings. U.S. Patent Application No. 09/500,372, 13 August 2002. [Google Scholar]
- Wolf, A.R.; Gottwald, K.H.; Hamacher, M.; Brouwer, J.W. Nickel-Free Phosphating Process. U.S. Patent Application No. 08/313,179, 6 March 2001. [Google Scholar]
- Rausch, W.; Oei, H.Y.; Edler, H.J.; Liebl, H. Process for coating ferrous surfaces. U.S. Patent 3,516,875, 7 June 1970. [Google Scholar]
- Deemer, M.; Cooper, C. Process for Providing a Thin Corrosion Inhibiting Coatiung on Metalic Surface. WO2004059034 A1, 15 July 2015. [Google Scholar]
- Narayanan, T.S.N. Surface Pretreatment by phosphate conversion coatings—A review. Rev. Adv. Mater. Sci. 2005, 9, 130–177. [Google Scholar]
- Popov, B.N. Corrosion Engineering: Principles and Solved Problems; Elsevier: Amsterdam, The Netherlands, 2015. [Google Scholar]
- Yingsamphancharoen, T.; Srisuwan, N.; Rodchanarowan, A. The electrochemical investigation of the corrosion rates of welde pipe ASTM A106 Grade B. Metals 2016, 6, 207. [Google Scholar] [CrossRef]
- Finšgar, M.; Jackson, J. Application of corrosion inhibitors for steels in acidic media for the oil and gas industry: A review. Corros. Sci. 2014, 86, 17–41. [Google Scholar] [CrossRef]
- Winiarski, J.; Szczygieł, B. Odporność na korozję powłok bezchromowych otrzymanych z kąpieli na bazie H2ZrF6 modyfikowanej dodatkiem 3-aminopropylotrietoksysilanu. Ochr. przed Koroz. 2012, 11, 541–543. [Google Scholar]
- Winiarski, J.; Szczygieł, B. Właściwości ochronne powłok otrzymanych z roztworów na bazie silanów oraz związków tytanu(IV). Ochr. przed Koroz. 2011, 7, 446–448. [Google Scholar]
- Winiarski, J.; Szczygieł, B. Właściwości ochronne bezchromowych powłok konwersyjnych osadzanych z kąpieli na bazie związków Ti(IV), Mn(II) oraz kwasu fosforowego(V) modyfikowanej dodatkiem organicznym. Ochr. przed Koroz. 2012, 55, 224–228. [Google Scholar]
- Azhaarudeen, S.; Faruck, A.A.M.; Nevosad, A. Tribological behaviour and wera mechanism of manganese photosphate coatings under dry reciprocating sliding contact conditions. Tribol. Int. 2018, 122, 189–199. [Google Scholar] [CrossRef]
- Luo, L.; Huang, Y.; Xuan, F.Z. Deflection behaviour of corrosion crack growth in the affected zone of CrNiMoV steel welded joint. Corros. Sci. 2017, 121, 11–21. [Google Scholar] [CrossRef]
- Ernens, D.; de Rooij, M.B.; Pasaribu, H.R.; van Riet, E.J.; van Haaften, W.M.; Schipper, D.J. Mechanicsa characterization and single sperity scratch behaviour of dry zinc and managanese phospphate cotings. Tribol. Int. 2018, 118, 474–483. [Google Scholar] [CrossRef]


| Element | C | Si | Mn | P | S | Cr | Mo | Ni | Nb | Al | Cu |
| Weight content (%) | 0.034 | 0.009 | 0.220 | 0.009 | 0.007 | 0.040 | 0.007 | 0.012 | 0.011 | 0.026 | 0.041 |
| Element | Co | B | Ti | W | Ca | Sn | Pb | Sb | Te | As | Fe |
| Weight content (%) | 0.002 | <0.0001 | 0.010 | 0.008 | 0.001 | 0.001 | 0.006 | 0.008 | 0.001 | 0.001 | 99.545 |
| Stage No | Process Type | Composition of Solution | Process Conditions |
|---|---|---|---|
| 1 | Degreasing | 10% (or 7 mol) solution of NaOH | Mixing, 80–85 °C, 5 min |
| 2 | Rinsing | Distilled water | room temp., 3 min |
| 3 | Etching | Solution of HCl 15%, 1–10 mL of 3% H2O2 | room temp., 3 min |
| 4 | Rinsing | Distilled water | room temp., 3 min |
| 5 | Activating | MnHPO4: 2 g | mixing, 40–45 °C, 4 min |
| Na4P2O7: 2 g | |||
| H2O: 500 g | |||
| 6 | Phosphating | H3PO4 (85%): 7.0 g | 95 °C, 15 min |
| Mn3(PO4)2: 15.0 g | |||
| Mn(NO3)2: 6.0 g | |||
| MnCO3: 0.5 g | |||
| Ni(NO3)2: 0.3 g | |||
| H2O: 531.5 g | |||
| (optional) 1-methyl-nitroguanidine: 0.5 g | |||
| 7 | Rinsing | Distilled water | room temp., 3 min |
| 8 | Passivation | ZrOCl2/H2SiF6: 0.3 g | Mixing, 25–30 °C, 2 min |
| Mn(NO3)2: 1.1 g | |||
| NaNO3: 0.14 g | |||
| HNO3: 0.14 g | |||
| CH3OH: 0.14 g | |||
| Na2CO3: 5.4 g | |||
| H2O: 100 g | |||
| 9 | Conservation with oil | Solution of mineral oil solution of mineral, emulsifying with water oil (ZWEZ 4999) produced by ZWEZ. | Mixing, 75 °C, 2 min |
| Sample | Time of Immersion in Phosphate Bath (s) | Corrosion Potential (Ecor/V) | Current Density (jcor/µAcm−2) | Corrosion Rate (CR/mpy) |
|---|---|---|---|---|
| La-S_15s | 15 | −0.568 | 1.200 | 0.554 |
| La-S_30s | 30 | −0.500 | 3.7225 | 1.719 |
| La-S_60s | 60 | −0.347 | 2.2250 | 1.038 |
| La-S_120s | 120 | −0.372 | 0.9975 | 0.460 |
| La-S_180s | 180 | −0.354 | 0.705 | 0.325 |
| La-S_240s | 240 | −0.396 | 1.2080 | 0.557 |
| La-S_300s | 300 | −0.363 | 0.730 | 0.337 |
| La-S_360s | 360 | −0.358 | 0.830 | 0.383 |
| La-S_420s | 420 | −0.376 | 1.075 | 0.496 |
| La-S_480s | 480 | −0.400 | 1.300 | 0.6 |
| La-S_540s | 540 | −0.440 | 2.050 | 0.946 |
| La-S_600s | 600 | −0.379 | 1.205 | 0.556 |
| La-S_660s | 660 | −0.387 | 0.3925 | 0.181 |
| La-S_900s | 900 | −0.431 | 0.025 | 0.012 |
| Sample | Nickel Content (g) |
|---|---|
| Ni_0 | 0.0 |
| Ni_0.01 | 0.002 |
| Ni_0.05 | 0.010 |
| Ni_0.12 | 0.025 |
| Ni_0.15 | 0.030 |
| Sample | Nickel Content (g) | Corrosion Potential (Ecor/V) | Current Density (jcor/µAcm−2) | Corrosion Rate (CR/mpy) |
|---|---|---|---|---|
| Ni_0 | 0.00 | −0.546 | 0.9325 | 0.430 |
| Ni_0.05 | 0.01 | −0.590 | 0.2450 | 0.113 |
| Ni_0.15 | 0.03 | −0.609 | 0.9090 | 0.419 |
| Ni_0.3 | 0.06 | −0.587 | 0.1450 | 0.067 |
| Element | SEM Image A | SEM Image B | ||
|---|---|---|---|---|
| Weight (%) | Atomic (%) | Weight (%) | Atomic (%) | |
| P K | 30.68 | 44.08 | 32.69 | 46.37 |
| Mn K | 52.8 | 42.77 | 52.37 | 41.88 |
| Fe K | 16.24 | 12.94 | 14.57 | 11.46 |
| Ni K | 0.28 | 0.21 | 0.38 | 0.29 |
| Element | SEM Image A | SEM Image B | ||
|---|---|---|---|---|
| Weight (%) | Atomic (%) | Weight (%) | Atomic (%) | |
| P K | 20.94 | 32.2 | 17.88 | 14.58 |
| Mn K | 28.05 | 24.32 | 34.67 | 15.94 |
| Fe K | 50.48 | 43.05 | 4.65 | 2.1 |
| Ni K | 0.53 | 0.43 | 0.16 | 0.07 |
| Sample | Additional Manganese Content (g) | Corrosion Potential (Ecor/V) | Current Density (jcor/µAcm−2) | Corrosion Rate (CR/mpy) |
|---|---|---|---|---|
| Mn_0 | 0.0 | −0.427 | 3.5000 | 1.615 |
| Mn_0.5 | 0.24 | −0.424 | 1.8750 | 0.865 |
| Mn_1.0 | 0.48 | −0.430 | 1.8890 | 0.871 |
| Mn_1.5 | 0.72 | −0.680 | 1.2880 | 0.594 |
| Mn_2.0 | 0.96 | −0.680 | 0.2470 | 0.114 |
| Mn_Ref. | Reference sample | −0.750 | 5.2450 | 2.420 |
| Element | SEM Image A | SEM Image B | SEM Image C | SEM Image D | ||||
|---|---|---|---|---|---|---|---|---|
| Weight (%) | Atomic (%) | Weight (%) | Atomic (%) | Weight (%) | Atomic (%) | Weight (%) | Atomic (%) | |
| Na K | 1.45 | 2.75 | - | - | - | - | - | - |
| P K | 31.26 | 43.97 | 24.81 | 37.1 | 24.12 | 36.26 | 24.45 | 36.7 |
| Mn K | 61.63 | 48.87 | 40.82 | 34.41 | 34.52 | 29.27 | 32.54 | 27.53 |
| Fe K | 5.59 | 4.36 | 33.79 | 28.02 | 40.73 | 33.97 | 42.48 | 35.36 |
| Ni K | 0.05 | 0.05 | 0.58 | 0.46 | 0.63 | 0.5 | 0.53 | 0.42 |
| Activation Process | Passivation Process | ||||||||
|---|---|---|---|---|---|---|---|---|---|
| Sample | Activation Dose MnHPO4/Na4P2O7 (g) | Corrosion Potential (Ecor/V) | Current Density (jcor/µAcm−2) | Corrosion Rate | Sample | Conditions of Passivation (g) | Corrosion Potential (Ecor/A) | Current Density (jcor/µAcm−2) | Corrosion Rate (CR/mpy) |
| A_Ref | Reference sample | −0.608 | 11.50 | 5.306 | La-S_Ref | ZrOCl2/H2SiF6: 0.3 g Mn(NO3)2: 1.1 g NaNO3: 0.14 g HNO3: 0.14 g CH3OH: 0.14 g Na2CO3: 5.4 g H2O: 100 g 25–30 °C, 2 min | −0.470 | 0.6575 | 0.303 |
| A_0.0 | 0.0 | −0.504 | 0.0195 | 0.009 | |||||
| A_0.5 | 0.5 | −0.420 | 0.2825 | 0.130 | La-S_P | −0.357 | 0.1688 | 0.078 | |
| A_1.0 | 1.00 | −0.401 | 0.2318 | 0.107 | |||||
| A_1.5 | 1.5 | −0.379 | 0.301 | 0.139 | La-S_PC | −0.426 | 0.49 | 0.266 | |
| A_2.0 | 2.0 | −0.366 | 0.293 | 0.135 | |||||
| Sample | Passivation Conditions | Process Time (s) | Corrosion Potential (Ecor/V) | Current Density (jcor/µAcm−2) | Corrosion Rate (CR/mpy) |
|---|---|---|---|---|---|
| Zr_20s. | ZrOCl2/H2SiF6: 0.3 g Mn(NO3)2: 1.1 g NaNO3: 0.14 g HNO3: 0.14 g CH3OH: 0.14 g Na2CO3: 5.4 g H2O: 100 g 25–30 °C, 2 min | 20 | −0.768 | 0.04468 | 0.021 |
| Si_20s. | 20 | −0.507 | 0.04283 | 0.020 | |
| Zr_180s. | 180 | −0.836 | 0.0930 | 0.011 | |
| Si_180s. | 180 | −0.728 | 0.1174 | 0.054 | |
| Zr/Si_Ref | Without | - | −0.769 | 0.04985 | 0.023 |
| C_Ref | Without | - | −0.574 | 4.3080 | 1.987 |
| C_Oil | With oilness process | 120 | −0.408 | 0.3290 | 0.152 |
| Sample | Etching Conditions (%) | Nickel Content in the Phosphating Bath (g) | Corrosion Potential (Ecor/V) | Current Density (jcor/µAcm−2) | Corrosion Rate (CR/mpy) |
|---|---|---|---|---|---|
| Et_H3PO4 | 15 | 0.0 | −0.569 | 7.7830 | 3.591 |
| Et_HCl-Ni | 15 | 0.3 | −0.372 | 0.2843 | 0.131 |
| Et_H2SO4-Ni | 15 | 0.3 | −0.394 | 0.2578 | 0.119 |
| Et_H3PO4-Ni | 15 | 0.3 | −0.377 | 0.2978 | 0.137 |
© 2018 by the authors. Licensee MDPI, Basel, Switzerland. This article is an open access article distributed under the terms and conditions of the Creative Commons Attribution (CC BY) license (http://creativecommons.org/licenses/by/4.0/).
Share and Cite
Duszczyk, J.; Siuzdak, K.; Klimczuk, T.; Strychalska-Nowak, J.; Zaleska-Medynska, A. Manganese Phosphatizing Coatings: The Effects of Preparation Conditions on Surface Properties. Materials 2018, 11, 2585. https://0-doi-org.brum.beds.ac.uk/10.3390/ma11122585
Duszczyk J, Siuzdak K, Klimczuk T, Strychalska-Nowak J, Zaleska-Medynska A. Manganese Phosphatizing Coatings: The Effects of Preparation Conditions on Surface Properties. Materials. 2018; 11(12):2585. https://0-doi-org.brum.beds.ac.uk/10.3390/ma11122585
Chicago/Turabian StyleDuszczyk, Jakub, Katarzyna Siuzdak, Tomasz Klimczuk, Judyta Strychalska-Nowak, and Adriana Zaleska-Medynska. 2018. "Manganese Phosphatizing Coatings: The Effects of Preparation Conditions on Surface Properties" Materials 11, no. 12: 2585. https://0-doi-org.brum.beds.ac.uk/10.3390/ma11122585