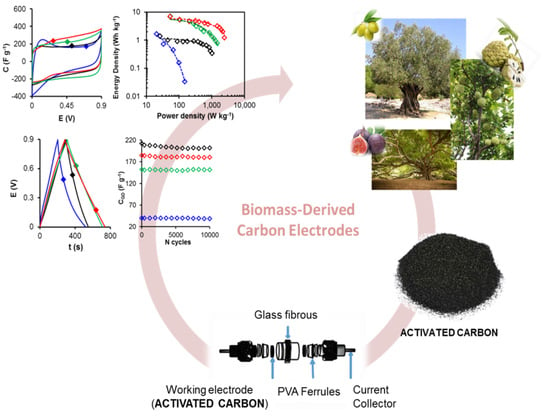
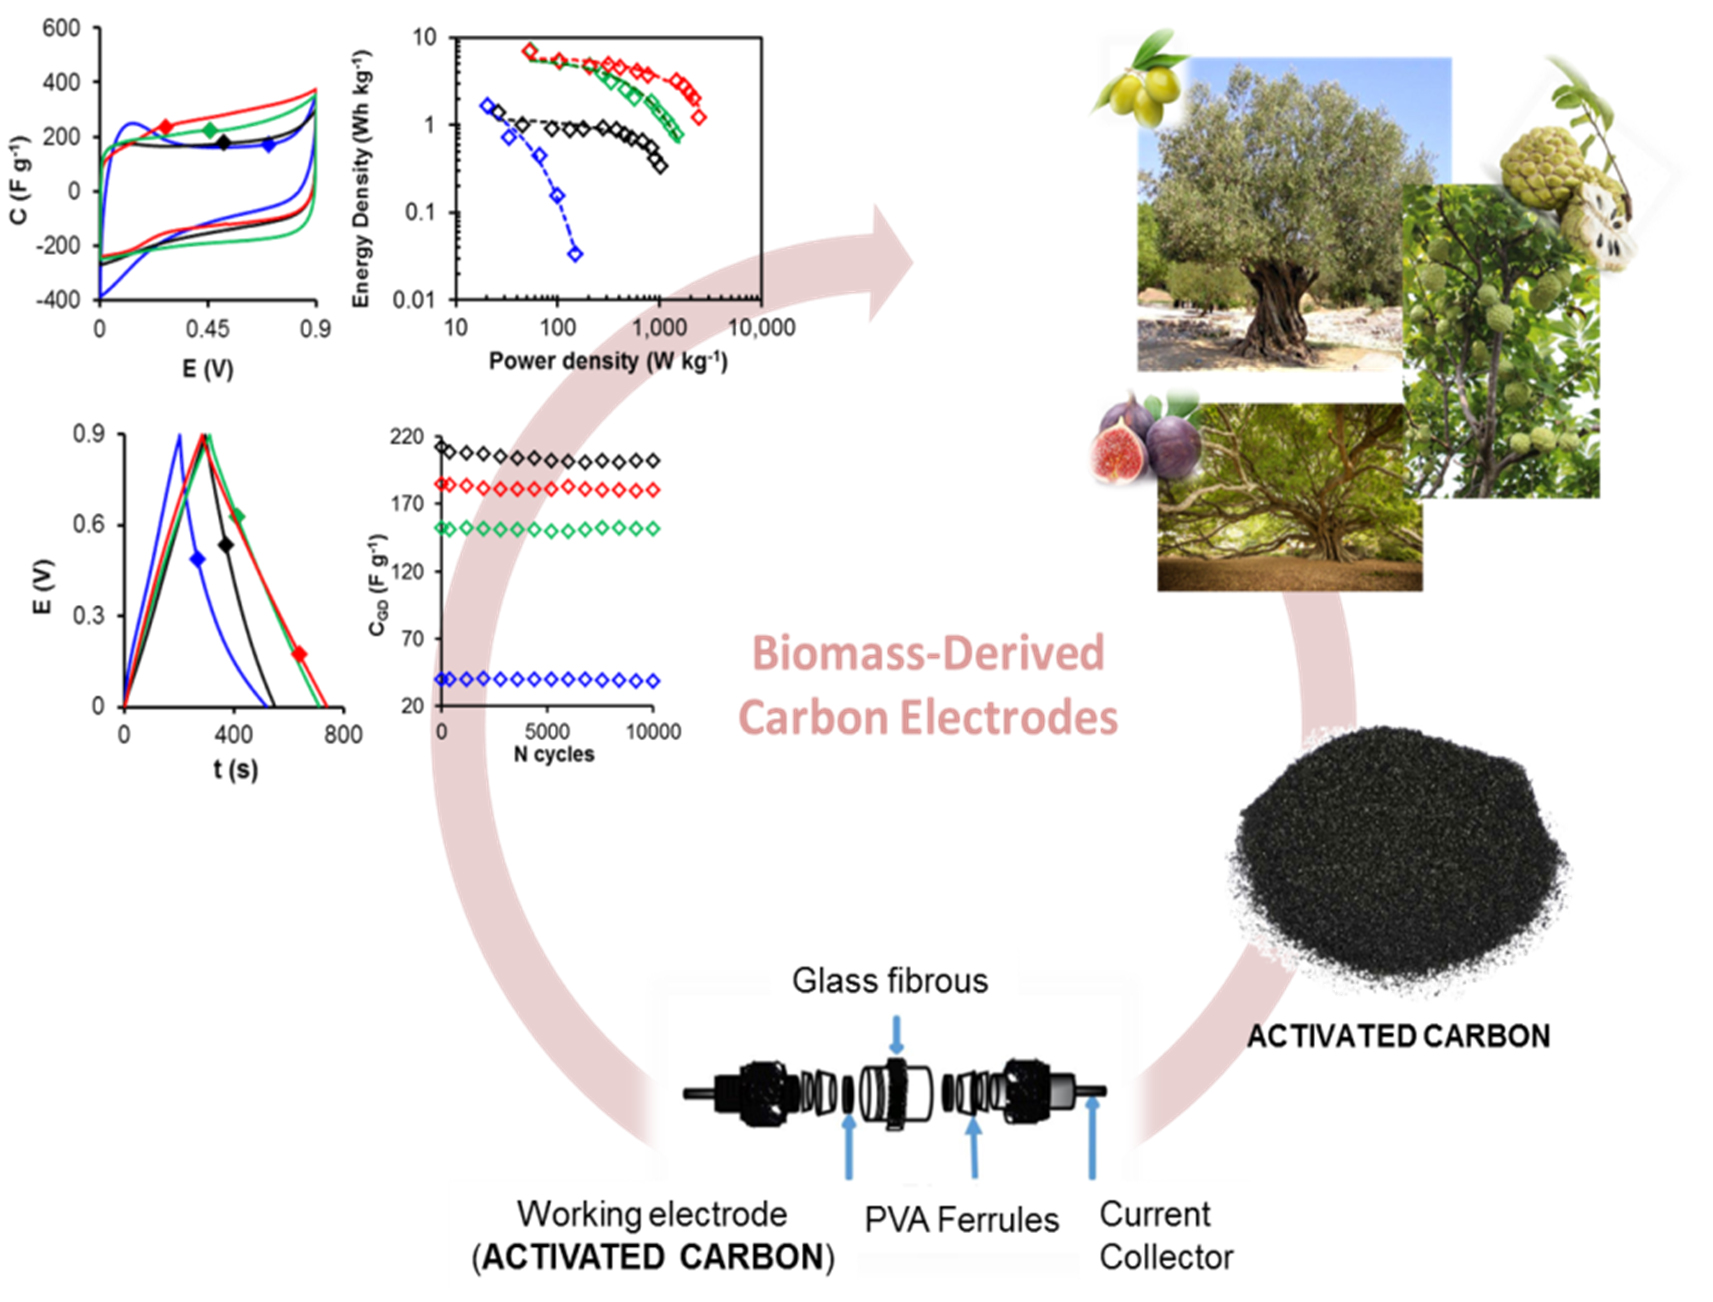
Influence of Surface Chemistry on the Electrochemical Performance of Biomass-Derived Carbon Electrodes for its Use as Supercapacitors

 ,
, 
 ,
,  and
and
Abstract
:
1. Introduction
2. Materials and Methods
2.1. Synthesis of Modified Activated Carbons Samples
2.2. Characterization
2.3. Electrochemical Measurements
3. Results and Discussion
3.1. Structural and Textural Characterization
3.2. Electrochemical Characterization
4. Conclusions
Supplementary Materials
Author Contributions
Acknowledgments
Conflicts of Interest
References
- Luo, X.; Wang, J.; Dooner, M.; Clarke, J. Overview of current development in electrical energy storage technologies and the application potential in power system operation. Appl. Energy 2015, 137, 511–536. [Google Scholar] [CrossRef] [Green Version]
- Faraji, S.; Ani, F.N. The development supercapacitor from activated carbon by electroless plating—A review. Renew. Sustain. Energy Rev. 2015, 42, 823–834. [Google Scholar] [CrossRef]
- Weinstein, L.; Dash, R. Supercapacitor carbons: Have exotic carbons failed? Mater. Today 2013, 16, 356–357. [Google Scholar] [CrossRef]
- Lin, Z.; Goikolea, E.; Balducci, A.; Naoi, K.; Taberna, P.L.; Salanne, M.; Yushin, G.; Simon, P. Materials for supercapacitors: When Li-ion battery power is not enough. Mater. Today 2018, 21, 419–436. [Google Scholar] [CrossRef] [Green Version]
- Kostoglou, N.; Koczwara, C.; Prehal, C.; Terziyska, V.; Babic, B.; Matovic, B.; Constantinides, G.; Tampaxis, C.; Charalambopoulou, G.; Steriotis, T.; et al. Nanoporous activated carbon cloth as a versatile material for hydrogen adsorption, selective gas separation and electrochemical energy storage. Nano Energy 2017, 40, 49–64. [Google Scholar] [CrossRef]
- Lee, J.; Jäckel, N.; Kim, D.; Widmaier, M.; Sathyamoorthi, S.; Srimuk, P.; Kim, C.; Fleischmann, S.; Zeiger, M.; Presser, V. Porous carbon as a quasi-reference electrode in aqueous electrolytes. Electrochim. Acta 2016, 222, 1800–1805. [Google Scholar] [CrossRef]
- Yakout, S.M.; El-Deen, G.S. Characterization of activated carbon prepared by phosphoric acid activation of olive stones. Arab. J. Chem. 2016, 9, S1155–S1162. [Google Scholar] [CrossRef] [Green Version]
- Ubago-Pérez, R.; Carrasco-Marín, F.; Fairén-Jiménez, D.; Moreno-Castilla, C. Granular and monolithic activated carbons from KOH-activation of olive stones. Microporous Mesoporous Mater. 2006, 92, 64–70. [Google Scholar] [CrossRef]
- Moreno-Castilla, C.; Carrasco-Marín, F.; López-Ramón, M.V.; Alvarez-Merino, M.A. Chemical and physical activation of olive-mill waste water to produce activated carbons. Carbon 2001, 39, 1415–1420. [Google Scholar] [CrossRef]
- Moreno-Castilla, C.; García-Rosero, H.; Carrasco-Marín, F. Symmetric supercapacitor electrodes from KOH activation of pristine, carbonized, and hydrothermally treated Melia azedarach stones. Materials 2017, 10, 745. [Google Scholar] [CrossRef]
- Elmouwahidi, A.; Zapata-Benabithe, Z.; Carrasco-Marín, F.; Moreno-Castilla, C. Activated carbons from KOH-activation of argan (Argania spinosa) seed shells as supercapacitor electrodes. Bioresour. Technol. 2012, 111, 185–190. [Google Scholar] [CrossRef]
- Yin, L.; Chen, Y.; Li, D.; Zhao, X.; Hou, B.; Cao, B. 3-Dimensional hierarchical porous activated carbon derived from coconut fibers with high-rate performance for symmetric supercapacitors. Mater. Des. 2016, 111, 44–50. [Google Scholar] [CrossRef]
- Arena, N.; Lee, J.; Clift, R. Life Cycle Assessment of activated carbon production from coconut shells. J. Clean. Prod. 2016, 125, 68–77. [Google Scholar] [CrossRef] [Green Version]
- Contreras, M.S.; Páez, C.A.; Zubizarreta, L.; Léonard, A.; Blacher, S.; Olivera-Fuentes, C.G.; Arenillas, A.; Pirard, J.P.; Job, N. A comparison of physical activation of carbon xerogels with carbon dioxide with chemical activation using hydroxides. Carbon 2010, 48, 3157–3168. [Google Scholar] [CrossRef]
- Demiral, H.; Demiral, I.; Karabacakoĝlu, B.; Tümsek, F. Production of activated carbon from olive bagasse by physical activation. Chem. Eng. Res. Des. 2011, 89, 206–213. [Google Scholar] [CrossRef]
- Hou, S.; Wang, M.; Xu, X.; Li, Y.; Li, Y.; Lu, T.; Pan, L. Nitrogen-doped carbon spheres: A new high-energy-density and long-life pseudo-capacitive electrode material for electrochemical flow capacitor. J. Colloid Interface Sci. 2017, 491, 161–166. [Google Scholar] [CrossRef]
- He, D.; Niu, J.; Dou, M.; Ji, J.; Huang, Y.; Wang, F. Nitrogen and oxygen co-doped carbon networks with a mesopore-dominant hierarchical porosity for high energy and power density supercapacitors. Electrochim. Acta 2017, 238, 310–318. [Google Scholar] [CrossRef]
- Hsiao-Hsuan, S.; Chi-Chang, H. Capacitance Enhancement of Activated Carbon Modified in the Propylene Carbonate Electrolyte. J. Electrochem. Soc. 2014, 161, A1828–A1835. [Google Scholar] [CrossRef]
- Kakhki, R.M.Z.; Heydari, S. A simple conductometric method for trace level determination of brilliant green in water based on β-cyclodextrin and silver nitrate and determination of their thermodynamic parameters. Arab. J. Chem. 2013, 7, 1086–1090. [Google Scholar] [CrossRef]
- Zhang, Y.; Li, X.; Huang, J.; Xing, W.; Yan, Z. Functionalization of Petroleum Coke-Derived Carbon for Synergistically Enhanced Capacitive Performance. Nanoscale Res. Lett. 2016, 11, 163. [Google Scholar] [CrossRef]
- Leng, C.; Sun, K.; Li, J.; Jiang, J. The reconstruction of char surface by oxidized quantum-size carbon dots under the ultrasonic energy to prepare modified activated carbon materials as electrodes for supercapacitors. J. Alloys Compd. 2017, 714, 443–452. [Google Scholar] [CrossRef]
- Li, J.; Liu, W.; Xiao, D.; Wang, X. Oxygen-rich hierarchical porous carbon made from pomelo peel fiber as electrode material for supercapacitor. Appl. Surf. Sci. 2017, 416, 918–924. [Google Scholar] [CrossRef]
- Pels, J.R.; Kapteijn, F.; Moulijn, J.A.; Zhu, Q.; Thomas, K.M. Evolution of nitrogen functionalities in carbonaceous materials during pyrolysis. Carbon 1995, 33, 1641–1653. [Google Scholar] [CrossRef]
- Moreno-Castilla, C.; Ferro-García, M.A.; Joly, J.P.; Bautista-Toledo, I.; Carrasco-Marín, F.; Rivera-Utrilla, J. Activated Carbon Surface Modifications by Nitrcc Acid, Hydrogen Peroxide, and Ammonium Peroxydisulfate Treatmenss. Langmuir 1995, 11, 4386–4392. [Google Scholar] [CrossRef]
- Conway, B.E. AC Impedance Behavior of Electrochemical Capacitors and Other Electrochemical Systems. In Book Electrochemical Supercapacitors: Scientific Fundamentals and Technological Applications, 1st ed.; Springer: Boston, MA, USA, 2013; Volume 1, pp. 479–524. [Google Scholar] [CrossRef]
- Elmouwahidi, A.; Bailón-García, E.; Pérez-Cadenas, A.F.; Maldonado-Hódar, F.J.; Carrasco-Marín, F. Activated carbons from KOH and H3PO4-activation of olive residues and its application as supercapacitor electrodes. Electrochimi. Acta 2017, 229, 219–228. [Google Scholar] [CrossRef]
- Figueiredo, J.; Pereira, M.F.; Freitas, M.M.; Órfão, J.J. Modification of the surface chemistry of activated carbons. Carbon 1999, 37, 1379–1389. [Google Scholar] [CrossRef]
- Moreno-Castilla, C.; López-Ramón, M.V.; Carrasco-Marín, F. Changes in surface chemistry of activated carbons by wet oxidation. Carbon 2000, 38, 1995–2001. [Google Scholar] [CrossRef]
- Gorgulho, H.F.; Gonçalves, F.; Pereira, M.F.R.; Figueiredo, J.L. Synthesis and characterization of nitrogen-doped carbon xerogels. Carbon 2009, 47, 2032–2039. [Google Scholar] [CrossRef]
- Stańczyk, K.; Dziembaj, R.; Piwowarska, Z.; Witkowski, S. Transformation of nitrogen structures in carbonization of model compounds determined by XPS. Carbon 1995, 33, 1383–1392. [Google Scholar] [CrossRef]
- Raymundo-Piñero, E.; Cazorla-Amorós, D.; Linares-Solano, A.; Find, J.; Wild, U.; Schlögl, R. Structural characterization of N-containing activated carbon fibers prepared from a low softening point petroleum pitch and a melamine resin. Carbon 2002, 40, 597–608. [Google Scholar] [CrossRef]
- Jurewicz, K.; Babeł, K.; Pietrzak, R.; Delpeux, S.; Wachowska, H. Capacitance properties of multi-walled carbon nanotubes modified by activation and ammoxidation. Carbon 2006, 44, 2368–2375. [Google Scholar] [CrossRef]
- Ando, R.A.; Do Nascimento, G.M.; Landers, R.; Santos, P.S. Spectroscopic investigation of conjugated polymers derived from nitroanilines. Spectrochim. Acta Part A 2008, 69, 319–326. [Google Scholar] [CrossRef]
- Xie, W.; Weng, L.T.; Chan, C.K.; Yeung, K.L.; Chan, C.M. Reactions of SO2 and NH3 with epoxy groups on the surface of graphite oxide powder. Phys. Chem. Chem. Phys. 2018, 20, 6431–6439. [Google Scholar] [CrossRef]
- Guo, Y.; Qi, J.; Jiang, Y.; Yang, S.; Wang, Z.; Xu, H. Performance of electrical double layer capacitors with porous carbons derived from rice husk. Mater. Chem. Phys. 2003, 80, 704–709. [Google Scholar] [CrossRef]
- Frackowiak, E. Carbon materials for supercapacitor application. Phys. Chem. Chem. Phys. 2007, 9, 1774–1785. [Google Scholar] [CrossRef]
- Rufford, T.E.; Hulicova-Jurcakova, D.; Zhu, Z.; Lu, G.Q. Nanoporous carbon electrode from waste coffee beans for high performance supercapacitors. Electrochem. Commun. 2008, 10, 1594–1597. [Google Scholar] [CrossRef]
- Hulicova, D.; Yamashita, J.; Soneda, Y.; Hatori, H.; Kodama, M. Supercapacitors prepared from melamine-based carbon. Chem. Mater. 2005, 17, 1241–1247. [Google Scholar] [CrossRef]
- Zhang, L.; Hu, X.; Wang, Z.; Sun, F.; Dorrell, D.G. A review of supercapacitor modeling, estimation, and applications: A control/management perspective. Renew. Sustain. Energy Rev. 2018, 81, 1868–1878. [Google Scholar] [CrossRef]
- Liu, X.; Wang, Y.; Zhan, L.; Qiao, W.; Liang, X.; Ling, L. Effect of oxygen-containing functional groups on the impedance behavior of activated carbon-based electric double-layer capacitors. J. Solid State Electrochem. 2011, 15, 413–419. [Google Scholar] [CrossRef]
- Zárate-Guzmán, A.I.; Manríquez-Rocha, J.; Antaño-López, R.; Rodríguez-Valadez, F.J.; Godínez, L.A. Study of the Electrical Properties of a Packed Carbon Bed for Its Potential Application as a 3D-Cathode in Electrochemical Processes. J. Electrochem. Soc. 2018, 165, E460–E465. [Google Scholar] [CrossRef]


| Sample | N2 | CO2 | |||||
|---|---|---|---|---|---|---|---|
| SBET m2/g | W0(N2) cm3/g | L0(N2) nm | Vtotal cm3/g | Vmes cm3/g | W0(CO2) cm3/g | L0(CO2) nm | |
| CK | 1504 | 0.59 | 1.20 | --- | --- | 0.35 | 0.70 |
| CKM | 1525 | 0.60 | 1.16 | 0.75 | 0.15 | 0.37 | 0.70 |
| CKC | 1706 | 0.68 | 1.27 | 0.85 | 0.17 | 0.06 | 0.95 |
| CKN | 46 | 0.01 | 4.84 | 0.10 | 0.09 | 0.13 | 0.46 |
| CKS | 1042 | 0.41 | 1.16 | 0.54 | 0.13 | 0.32 | 0.61 |
| FK | 1024 | 0.41 | 1.30 | --- | --- | 0.31 | 0.70 |
| FKM | 1575 | 0.63 | 1.26 | 0.80 | 0.17 | 0.35 | 0.67 |
| FKC | 1669 | 0.67 | 1.28 | 0.84 | 0.17 | 0.06 | 0.99 |
| FKN | 287 | 0.11 | 1.40 | 0.20 | 0.09 | 0.07 | 0.93 |
| FKS | 1114 | 0.44 | 1.36 | 0.59 | 0.15 | 0.32 | 0.62 |
| OK | 1273 | 0.49 | 1.30 | --- | --- | 0.34 | 0.70 |
| OKM | 1400 | 0.56 | 1.34 | 0.77 | 0.21 | 0.23 | 0.63 |
| OKC | 1314 | 0.53 | 1.32 | 0.69 | 0.16 | 0.30 | 0.71 |
| OKN | 153 | 0.06 | 2.81 | 0.15 | 0.09 | 0.14 | 0.47 |
| OKS | 1075 | 0.42 | 1.30 | 0.58 | 0.16 | 0.25 | 0.61 |
| Sample | Oxps (wt.%) | Nxps (wt.%) | OTPD (wt.%) | CO (mmol g−1) | CO2 (mmol g−1) | CO/CO2 |
|---|---|---|---|---|---|---|
| CKM | 1.7 | 1.6 | 1.0 | 0.11 | 0.26 | 0.42 |
| CKC | 3.7 | 0.8 | 2.1 | 0.45 | 0.43 | 1.05 |
| CKN | 21.4 | 1.1 | 25.5 | 1.16 | 7.41 | 0.16 |
| CKS | 15.5 | 0.9 | 14.0 | 0.87 | 3.96 | 0.22 |
| FKM | 1.9 | 2.1 | 1.0 | 0.19 | 0.23 | 0.83 |
| FKC | 4.3 | 0.7 | 2.1 | 0.48 | 0.42 | 1.14 |
| FKN | 20.6 | 0.9 | 25.3 | 1.22 | 7.32 | 0.17 |
| FKS | 16.0 | 0.5 | 15.1 | 0.94 | 4.26 | 0.22 |
| OKM | 6.1 | 1.0 | 3.7 | 0.26 | 1.03 | 0.25 |
| OKC | 5.7 | 0.9 | 7.0 | 0.41 | 1.98 | 0.21 |
| OKN | 22.0 | 1.4 | 27.0 | 1.78 | 7.85 | 0.23 |
| OKS | 15.0 | 0.2 | 14.4 | 0.89 | 4.02 | 0.22 |
| Sample | C1s (eV) | FWHM (eV) | Peak (%) | O1s (eV) | Peak (%) | N1S (eV) | Peak (%) | S2p3/2 (eV) | Peak (%) |
|---|---|---|---|---|---|---|---|---|---|
| CKM | 284.5 | 1.34 | 65 | 531.6 | 33 | 398.3 | 33 | ||
| 285.7 | 17 | 532.9 | 67 | 399.4 | 28 | ||||
| 286.9 | 7 | 400.5 | 24 | ||||||
| 288.4 | 5 | 401.6 | 15 | ||||||
| 290.2 | 4 | ||||||||
| 291.7 | 2 | ||||||||
| CKC | 284.5 | 1.48 | 65 | 531.3 | 49 | 398.4 | 20 | ||
| 285.8 | 18 | 533.4 | 51 | 399.4 | 31 | ||||
| 287.2 | 7 | 400.5 | 31 | ||||||
| 288.5 | 5 | 401.6 | 18 | ||||||
| 290.3 | 4 | ||||||||
| 291.6 | 1 | ||||||||
| CKN | 284.5 | 1.45 | 60 | 531.4 | 39 | 399.3 | 16 | ||
| 285.8 | 19 | 533.0 | 61 | 400.5 | 11 | ||||
| 286.9 | 6 | 401.5 | 34 | ||||||
| 288.6 | 12 | 405.5 | 40 | ||||||
| 290.1 | 3 | ||||||||
| 291.5 | 1 | ||||||||
| CKS | 284.6 | 1.40 | 61 | 531.5 | 36 | 168.2 | 62 | ||
| 285.8 | 19 | 533.0 | 64 | 169.5 | 38 | ||||
| 287.0 | 6 | ||||||||
| 288.5 | 11 | ||||||||
| 290.3 | 3 | ||||||||
| 291.7 | 1 | ||||||||
| FKM | 284.6 | 1.35 | 62 | 531.4 | 36 | 398.4 | 28 | ||
| 285.6 | 19 | 533.0 | 64 | 399.4 | 31 | ||||
| 286.8 | 8 | 400.5 | 28 | ||||||
| 288.3 | 5 | 401.9 | 13 | ||||||
| 290.2 | 4 | ||||||||
| 291.6 | 1 | ||||||||
| FKC | 284.6 | 1.35 | 65 | 531.1 | 36 | 398.4 | 28 | ||
| 285.8 | 18 | 533.3 | 64 | 399.4 | 31 | ||||
| 287.1 | 7 | 400.5 | 28 | ||||||
| 288.5 | 5 | 401.9 | 13 | ||||||
| 290.3 | 4 | ||||||||
| 291.5 | 1 | ||||||||
| FKN | 284.6 | 1.43 | 58 | 531.5 | 36 | 399.6 | 12 | ||
| 285.8 | 21 | 533.1 | 64 | 400.5 | 13 | ||||
| 286.9 | 5 | 401.6 | 35 | ||||||
| 288.6 | 12 | 405.7 | 40 | ||||||
| 290.1 | 2 | ||||||||
| 291.5 | 1 | ||||||||
| FKS | 284.5 | 1.43 | 62 | 531.6 | 40 | 168.2 | 67 | ||
| 285.9 | 16 | 533.0 | 60 | 169.4 | 33 | ||||
| 287.0 | 7 | ||||||||
| 288.5 | 11 | ||||||||
| 290.3 | 4 | ||||||||
| 291.9 | 1 | ||||||||
| OKM | 284.6 | 1.37 | 66 | 531.4 | 53 | 398.3 | 27 | ||
| 285.7 | 17 | 533.0 | 47 | 399.4 | 31 | ||||
| 286.9 | 7 | 400.5 | 27 | ||||||
| 288.5 | 4 | 401.6 | 16 | ||||||
| 290.1 | 4 | ||||||||
| 291.5 | 2 | ||||||||
| OKC | 284.5 | 1.38 | 66 | 531.2 | 48 | 398.3 | 20 | ||
| 285.8 | 17 | 533.0 | 52 | 399.5 | 40 | ||||
| 287.1 | 6 | 400.5 | 32 | ||||||
| 288.6 | 5 | 401.9 | 8 | ||||||
| 290.2 | 4 | ||||||||
| 291.6 | 1 | ||||||||
| OKN | 284.6 | 1.45 | 58 | 531.5 | 39 | 399.5 | 16 | ||
| 285.7 | 21 | 533.1 | 61 | 400.5 | 14 | ||||
| 287.0 | 6 | 401.6 | 26 | ||||||
| 288.6 | 12 | 405.6 | 45 | ||||||
| 290.1 | 2 | ||||||||
| 291.3 | 1 | ||||||||
| OKS | 284.5 | 1.42 | 62 | 531.5 | 48 | 168.2 | 71 | ||
| 285.9 | 18 | 533.1 | 52 | 169.2 | 29 | ||||
| 287.0 | 7 | ||||||||
| 288.5 | 9 | ||||||||
| 290.2 | 4 | ||||||||
| 291.6 | 1 |
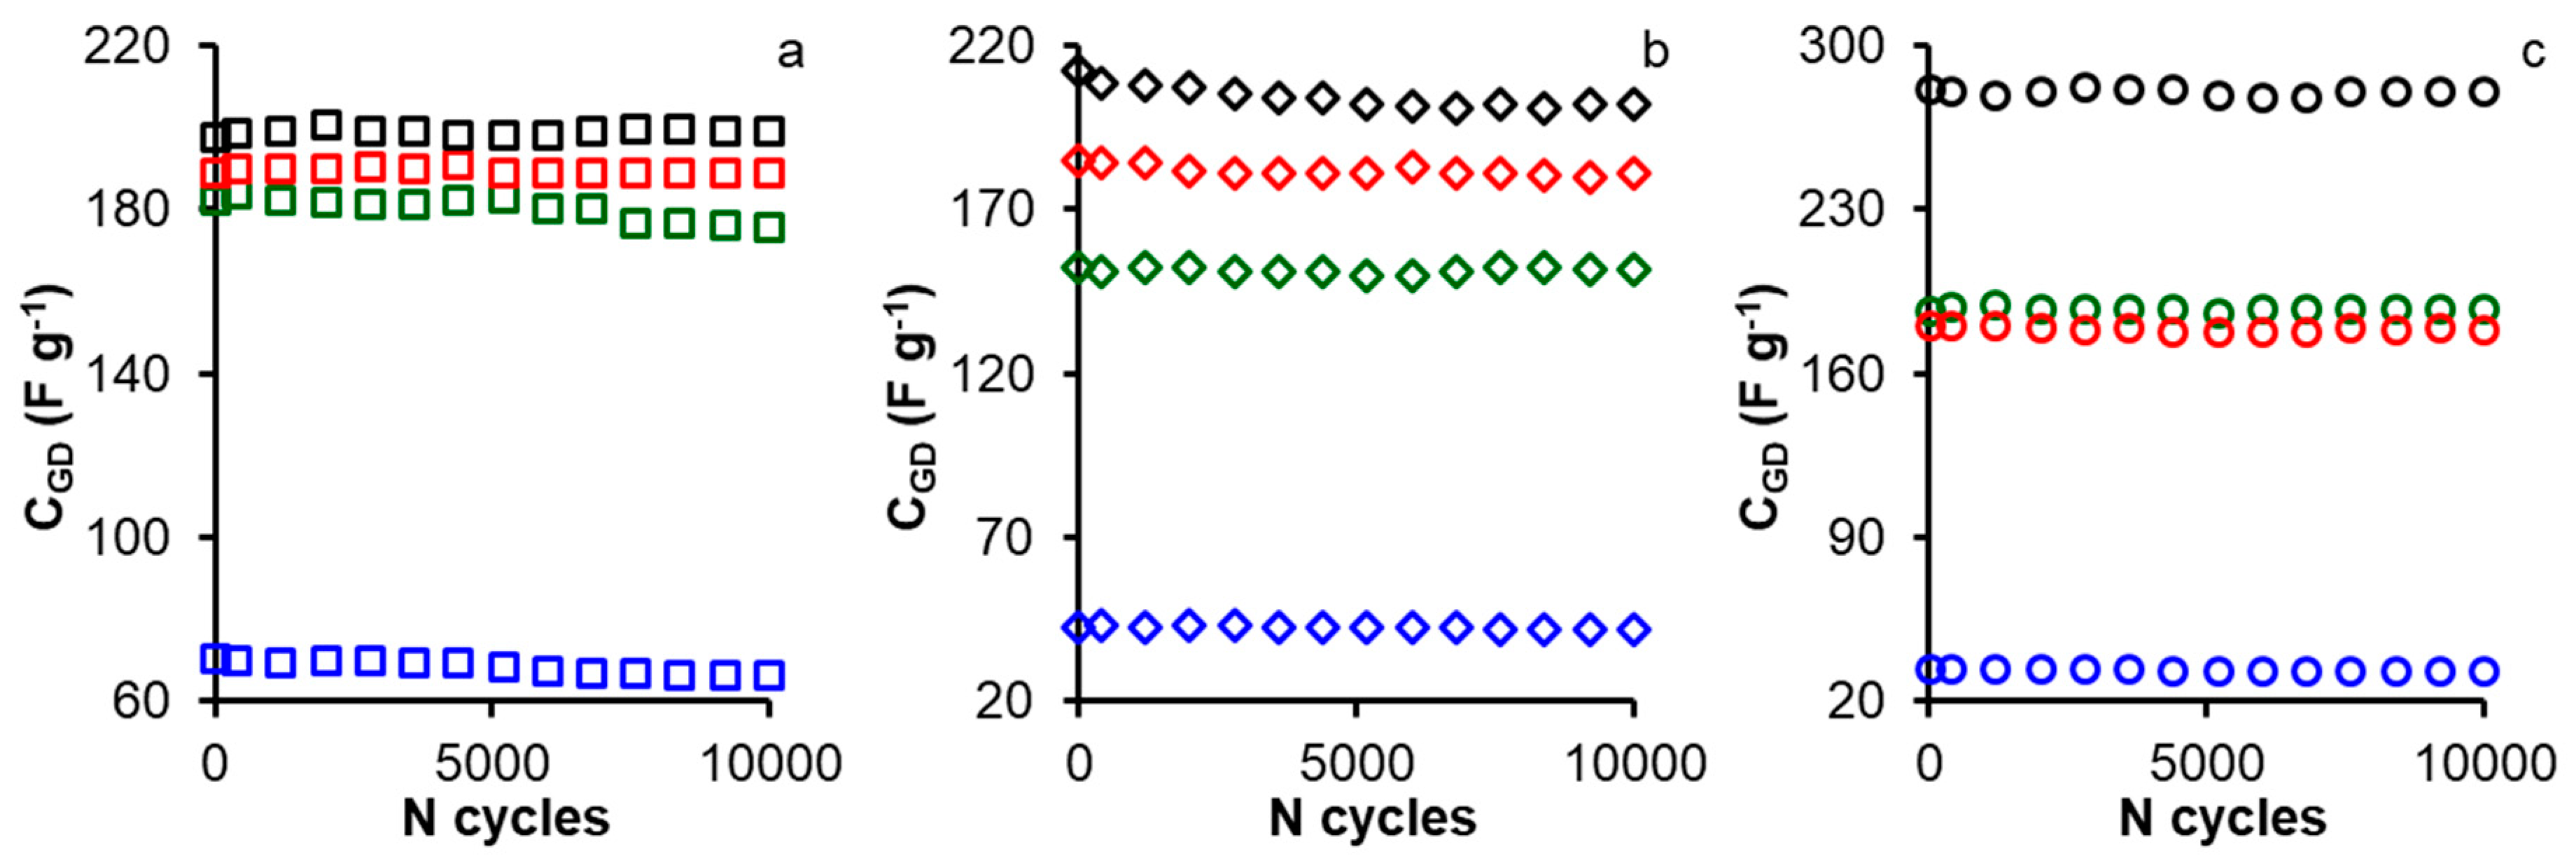
| Sample | Cv 0.5 mV s−1 | Ccp 125 mA g−1 | Ccp 2 A g−1 | Ccp 10 mA g−1 | Retention (%) |
|---|---|---|---|---|---|
| CKM | 205 | 236 | 181 | 139 | 59 |
| CKC | 153 | 199 | 139 | 115 | 58 |
| CKN | 153 | 176 | 16 | - | 8* |
| CKS | 180 | 290 | 231 | 174 | 60 |
| FKM | 200 | 283 | 186 | 144 | 51 |
| FKC | 210 | 280 | 190 | 119 | 43 |
| FKN | 169 | 259 | 35 | - | 14* |
| FKS | 171 | 237 | 189 | 85 | 36 |
| OKM | 167 | 225 | 176 | 135 | 60 |
| OKC | 180 | 216 | 206 | 183 | 85 |
| OKN | 143 | 145 | 11 | - | 48* |
| OKS | 218 | 312 | 268 | 208 | 67 |
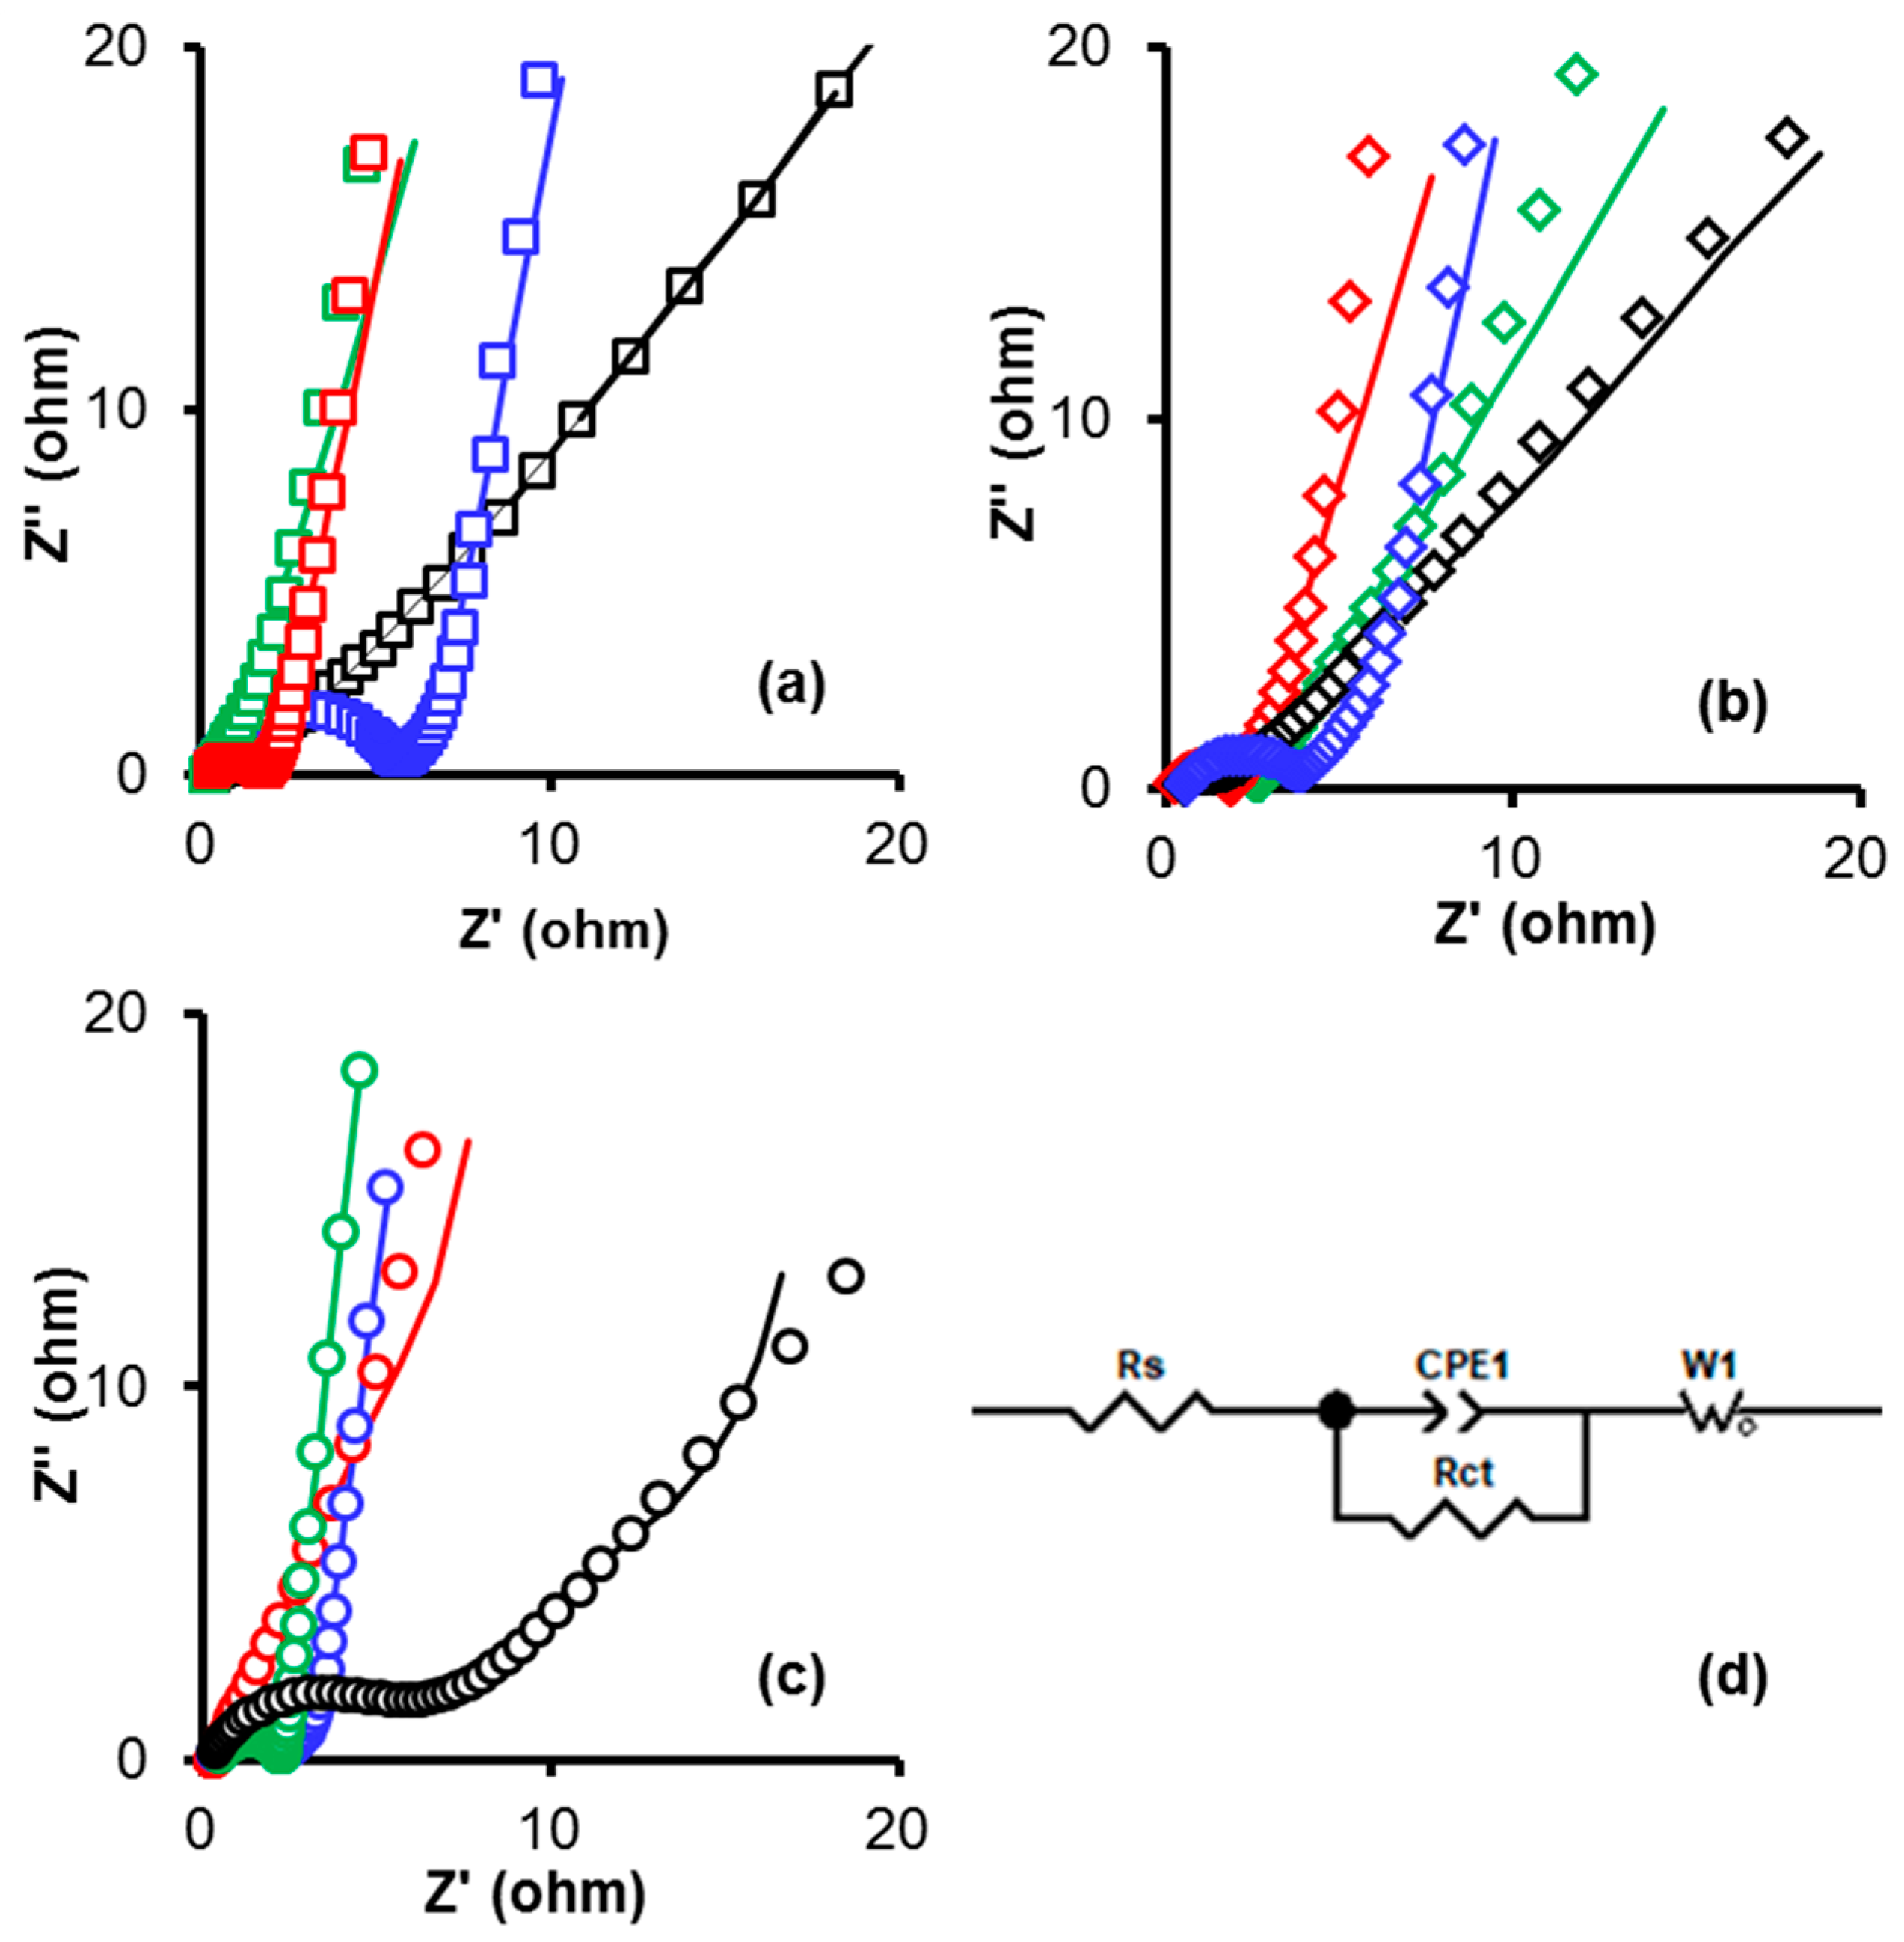
| Sample | Rs (Ω) | Rct (Ω) | Xi2 | (s) | C’max (F g−1) |
|---|---|---|---|---|---|
| CKM | 0.20 | 1.45 | 2.1 × 10⁻³ | 0.62 | 170 |
| CKC | 0.21 | 1.32 | 3.1 × 10⁻³ | 0.62 | 134 |
| CKN | 0.30 | 4.45 | 5.0 × 10⁻³ | 159.17 | 196 |
| CKS | 0.24 | 5.18 | 9.0 × 10⁻⁴ | 1.98 | 118 |
| FKM | 0.25 | 1.48 | 3.7 × 10⁻³ | 1.11 | 171 |
| FKC | 0.51 | 2.18 | 1.7 × 10⁻³ | 3.55 | 177 |
| FKN | 0.42 | 1.40 | 1.5 × 10⁻³ | 49.41 | 173 |
| FKS | 0.55 | 2.94 | 1.7 × 10⁻³ | 1.48 | 166 |
| OKM | 0.29 | 0.05 | 1.4 × 10⁻³ | 1.48 | 141 |
| OKC | 0.48 | 1.74 | 4.0 × 10⁻⁴ | 0.46 | 157 |
| OKN | 0.38 | 5.04 | 3.9 × 10⁻³ | 159.17 | 134 |
| OKS | 0.22 | 2.00 | 9.0 × 10⁻⁴ | 0.62 | 141 |
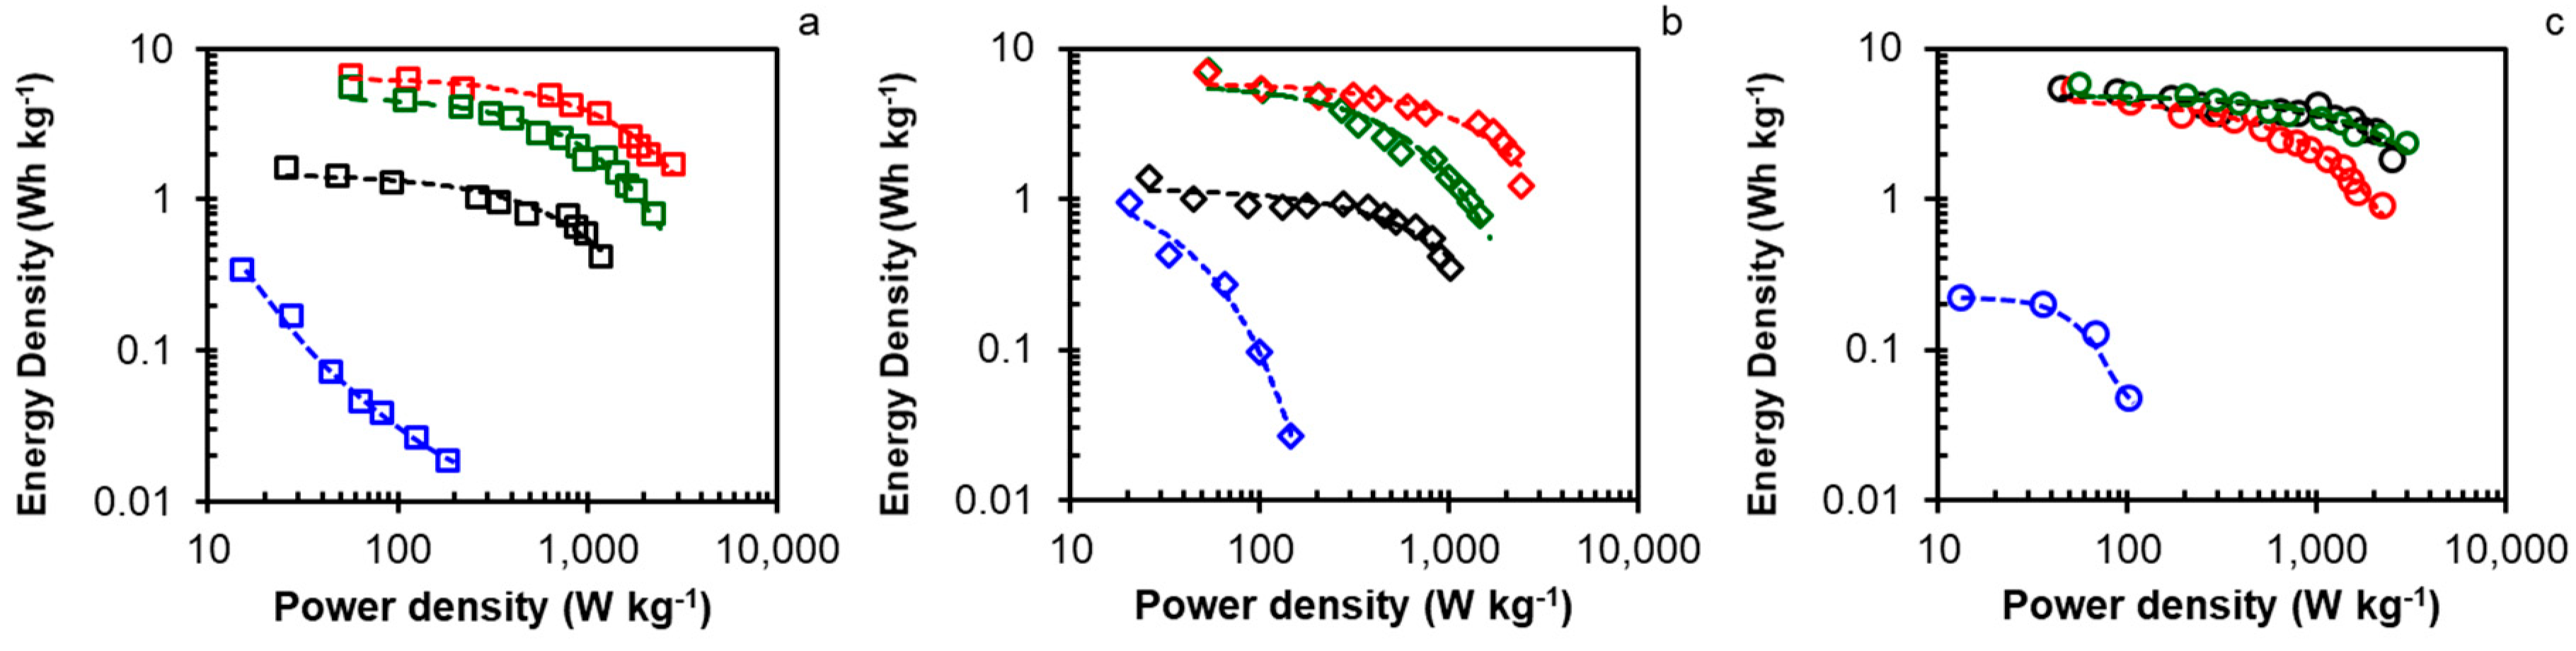
| Sample | Pmax W kg−1 | Emin Wh kg−1 | Emax Wh kg−1 | Pmin W kg−1 |
|---|---|---|---|---|
| CKM | 2825 | 1.72 | 6.61 | 57 |
| CKC | 2245 | 0.81 | 5.57 | 57 |
| CKN | 184 | 0.02 | 0.35 | 15 |
| CKS | 1180 | 0.42 | 1.64 | 26 |
| FKM | 2396 | 1.23 | 6.90 | 53 |
| FKC | 1461 | 0.79 | 7.10 | 54 |
| FKN | 147 | 0.03 | 0.95 | 21 |
| FKS | 997 | 0.12 | 1.40 | 26 |
| OKM | 2214 | 0.92 | 5.44 | 53 |
| OKC | 3039 | 2.35 | 5.88 | 56 |
| OKN | 111 | 0.01 | 0.22 | 13 |
| OKS | 2506 | 1.82 | 5.41 | 45 |
© 2019 by the authors. Licensee MDPI, Basel, Switzerland. This article is an open access article distributed under the terms and conditions of the Creative Commons Attribution (CC BY) license (http://creativecommons.org/licenses/by/4.0/).
Share and Cite
Elmouwahidi, A.; Bailón-García, E.; Romero-Cano, L.A.; Zárate-Guzmán, A.I.; Pérez-Cadenas, A.F.; Carrasco-Marín, F. Influence of Surface Chemistry on the Electrochemical Performance of Biomass-Derived Carbon Electrodes for its Use as Supercapacitors. Materials 2019, 12, 2458. https://0-doi-org.brum.beds.ac.uk/10.3390/ma12152458
Elmouwahidi A, Bailón-García E, Romero-Cano LA, Zárate-Guzmán AI, Pérez-Cadenas AF, Carrasco-Marín F. Influence of Surface Chemistry on the Electrochemical Performance of Biomass-Derived Carbon Electrodes for its Use as Supercapacitors. Materials. 2019; 12(15):2458. https://0-doi-org.brum.beds.ac.uk/10.3390/ma12152458
Chicago/Turabian StyleElmouwahidi, Abdelhakim, Esther Bailón-García, Luis A. Romero-Cano, Ana I. Zárate-Guzmán, Agustín F. Pérez-Cadenas, and Francisco Carrasco-Marín. 2019. "Influence of Surface Chemistry on the Electrochemical Performance of Biomass-Derived Carbon Electrodes for its Use as Supercapacitors" Materials 12, no. 15: 2458. https://0-doi-org.brum.beds.ac.uk/10.3390/ma12152458