Pulp Temperature Rise Induced by Light-Emitting Diode Light-Curing Units Using an Ex Vivo Model

 ,
,  and
and
Abstract
:1. Introduction
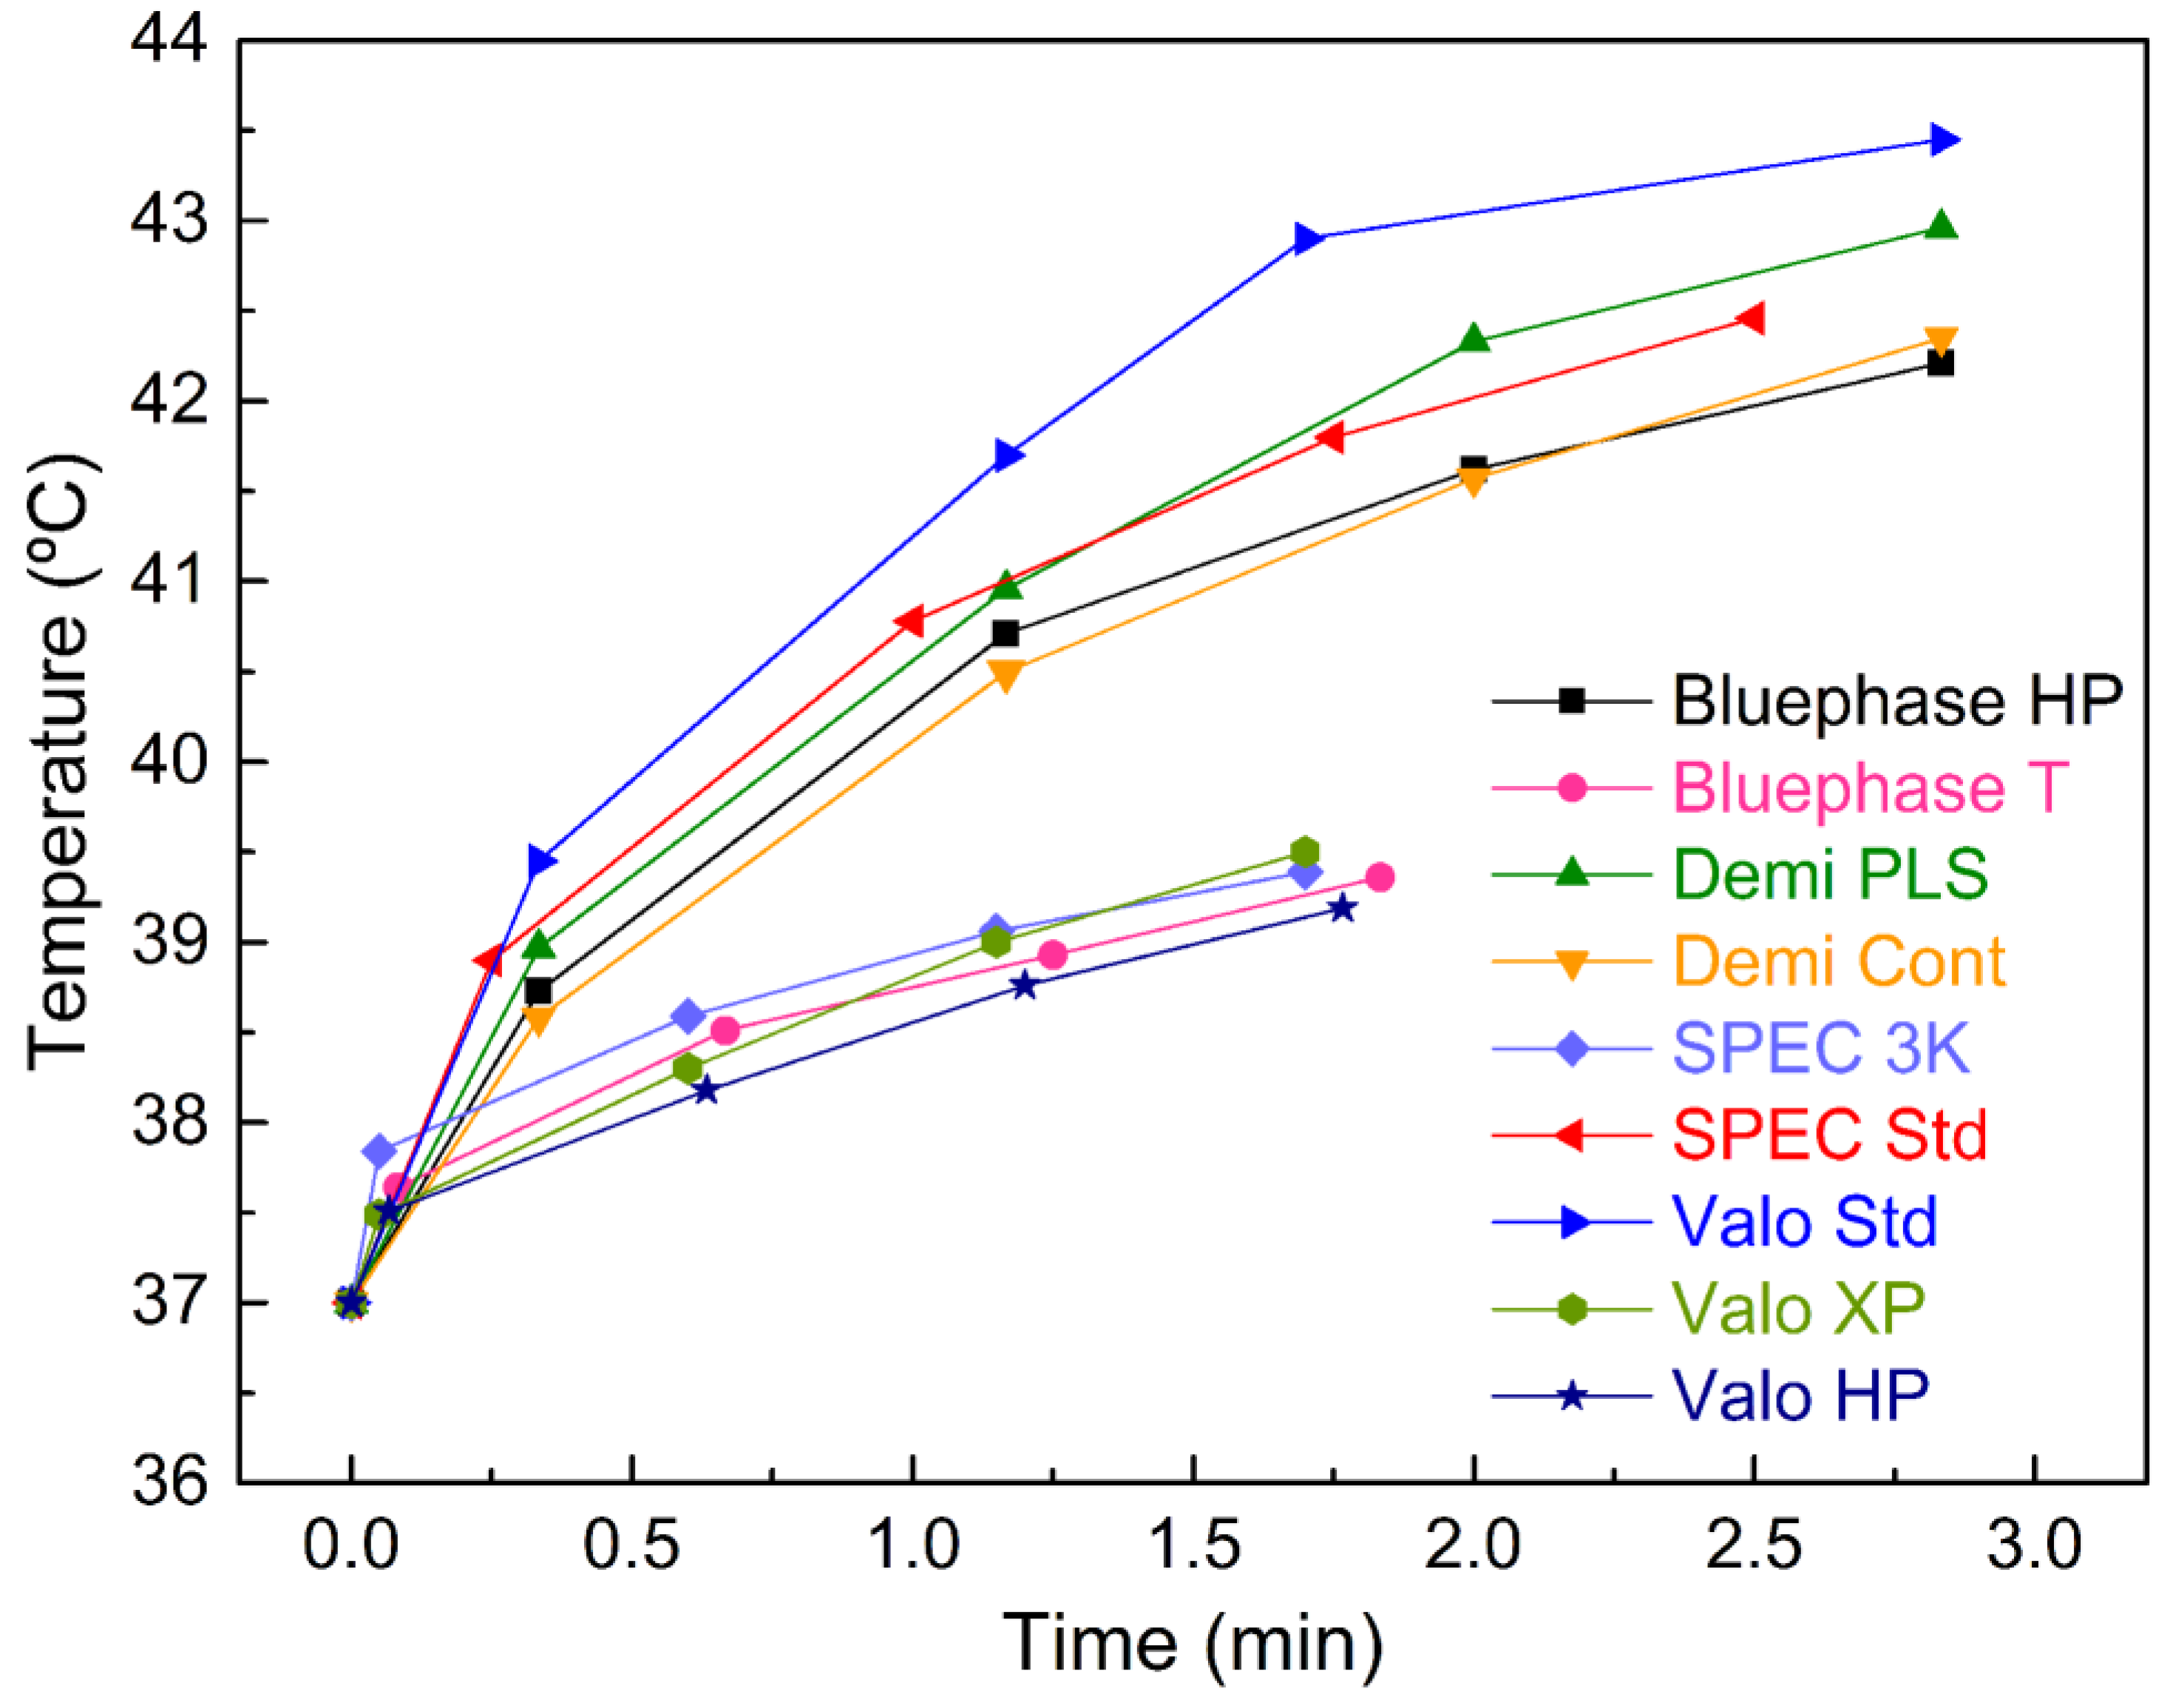
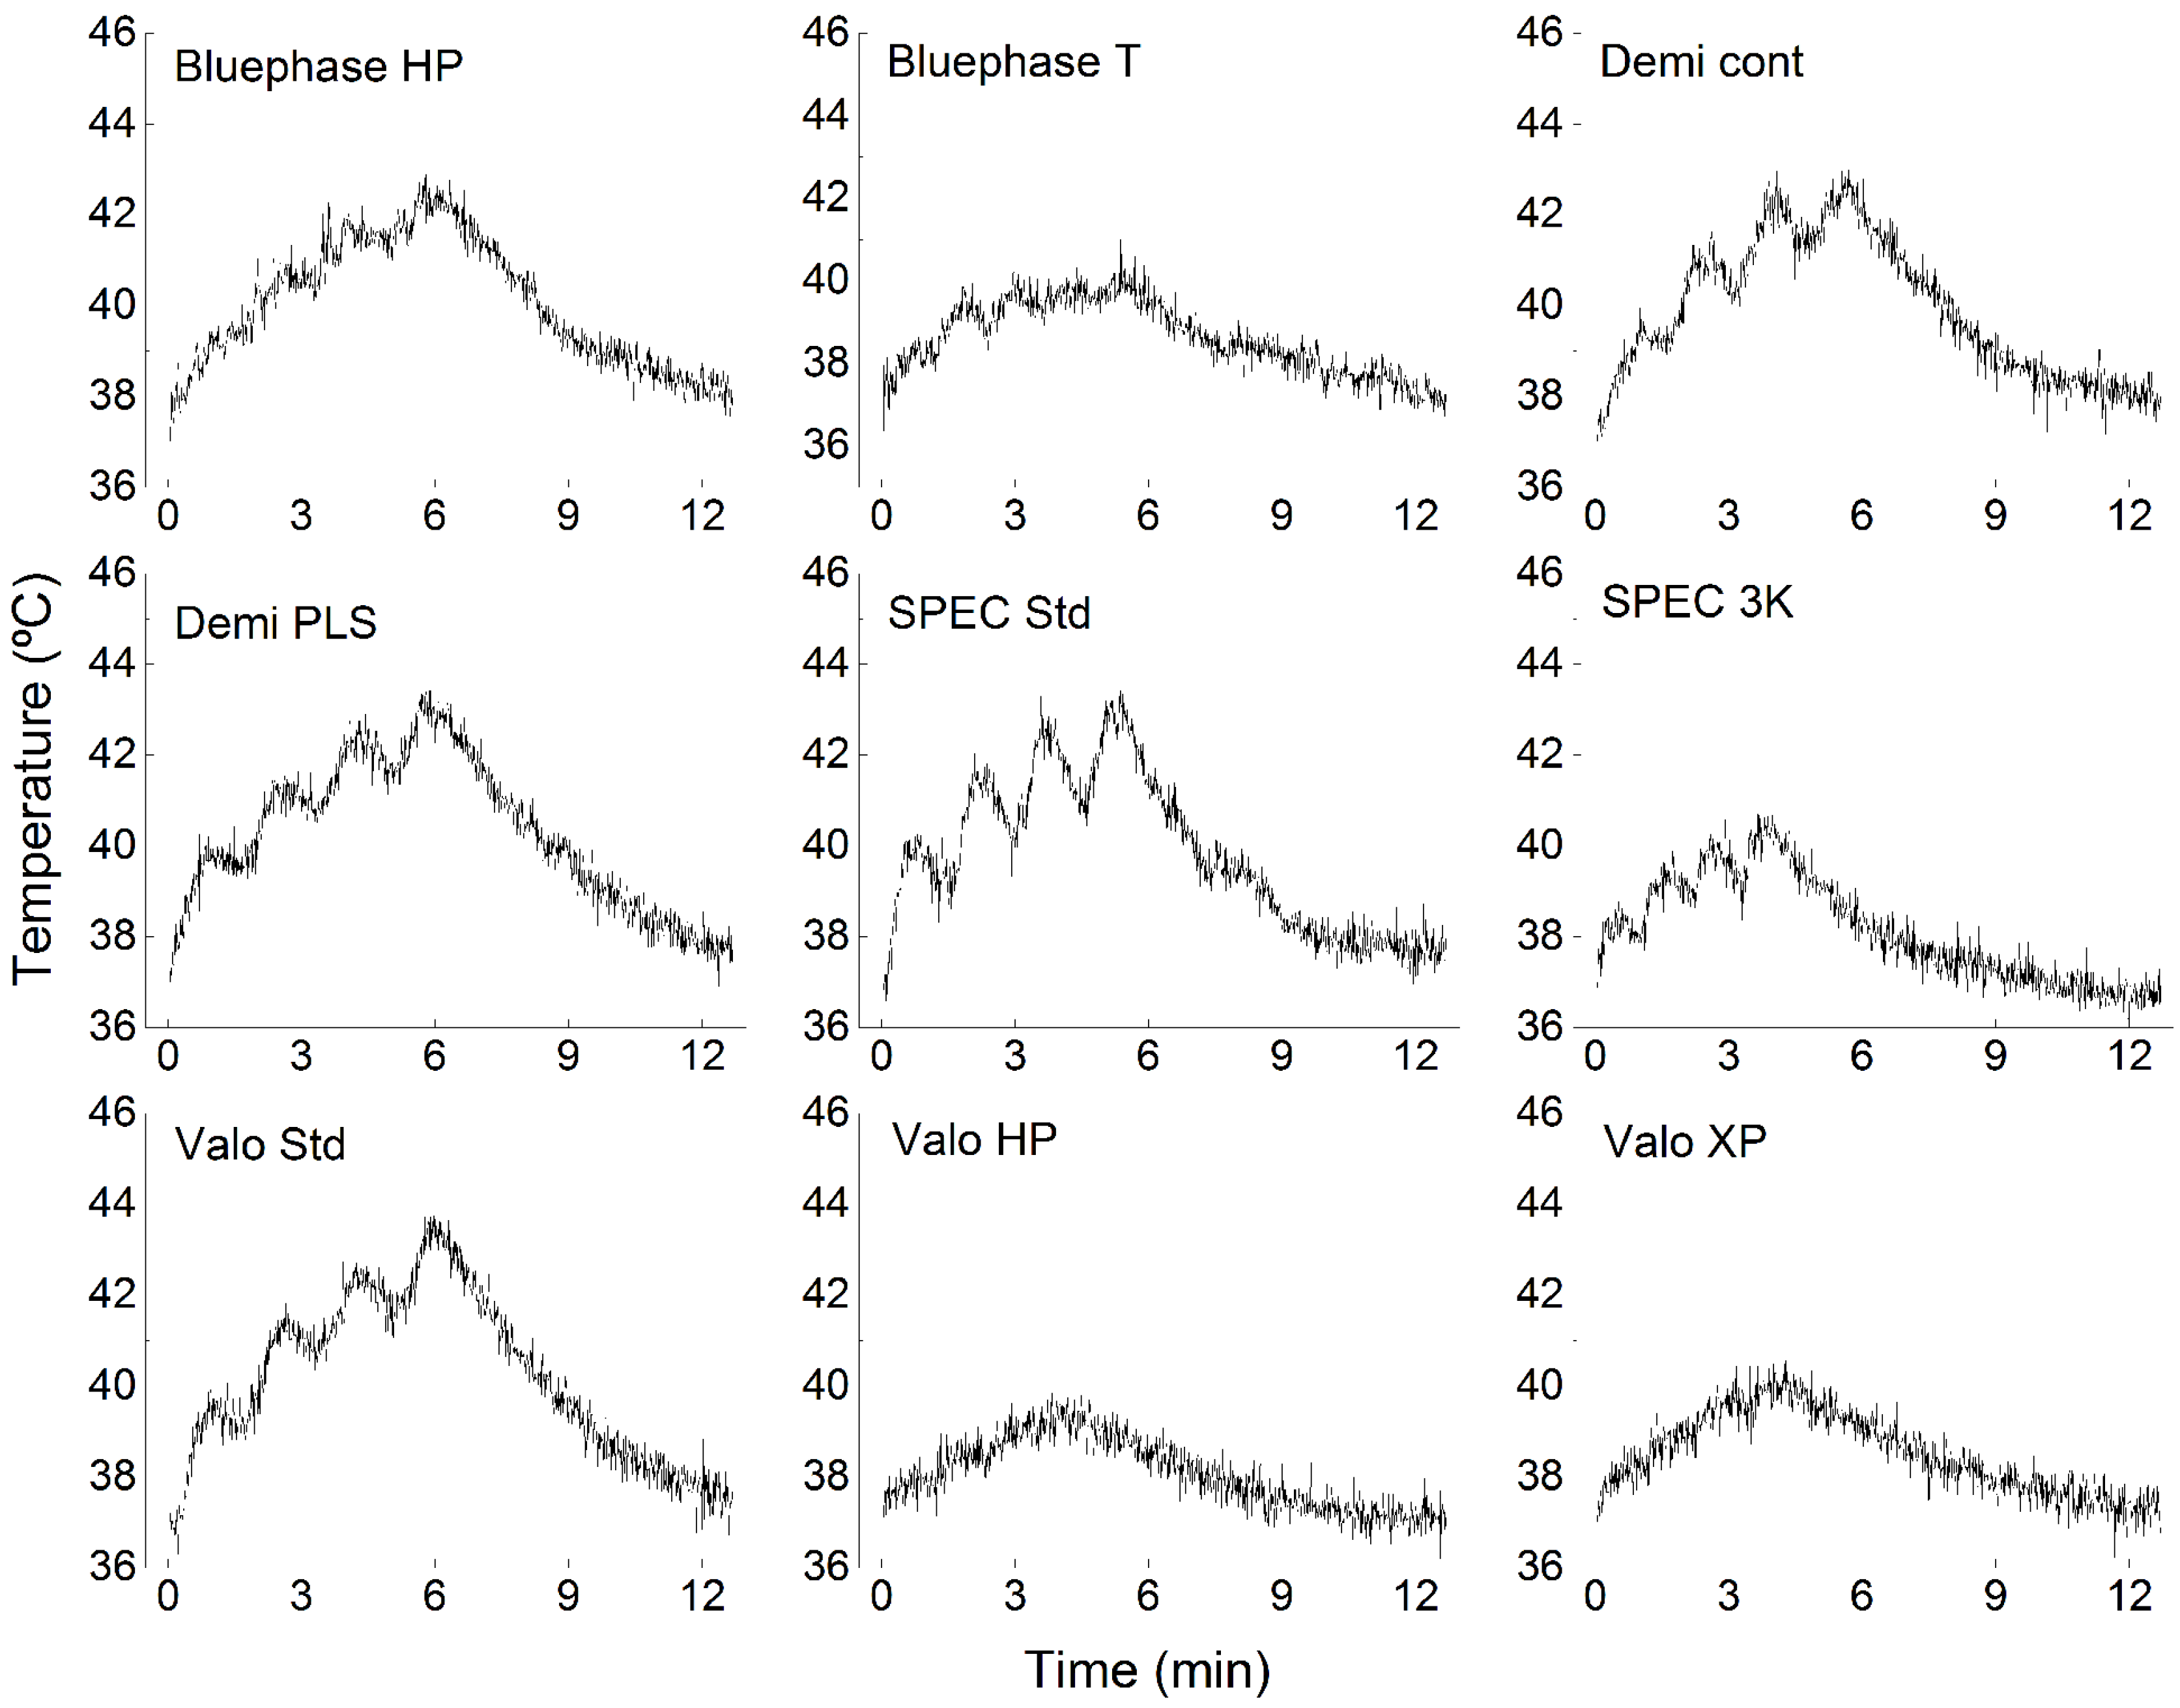
2. Results
3. Discussion
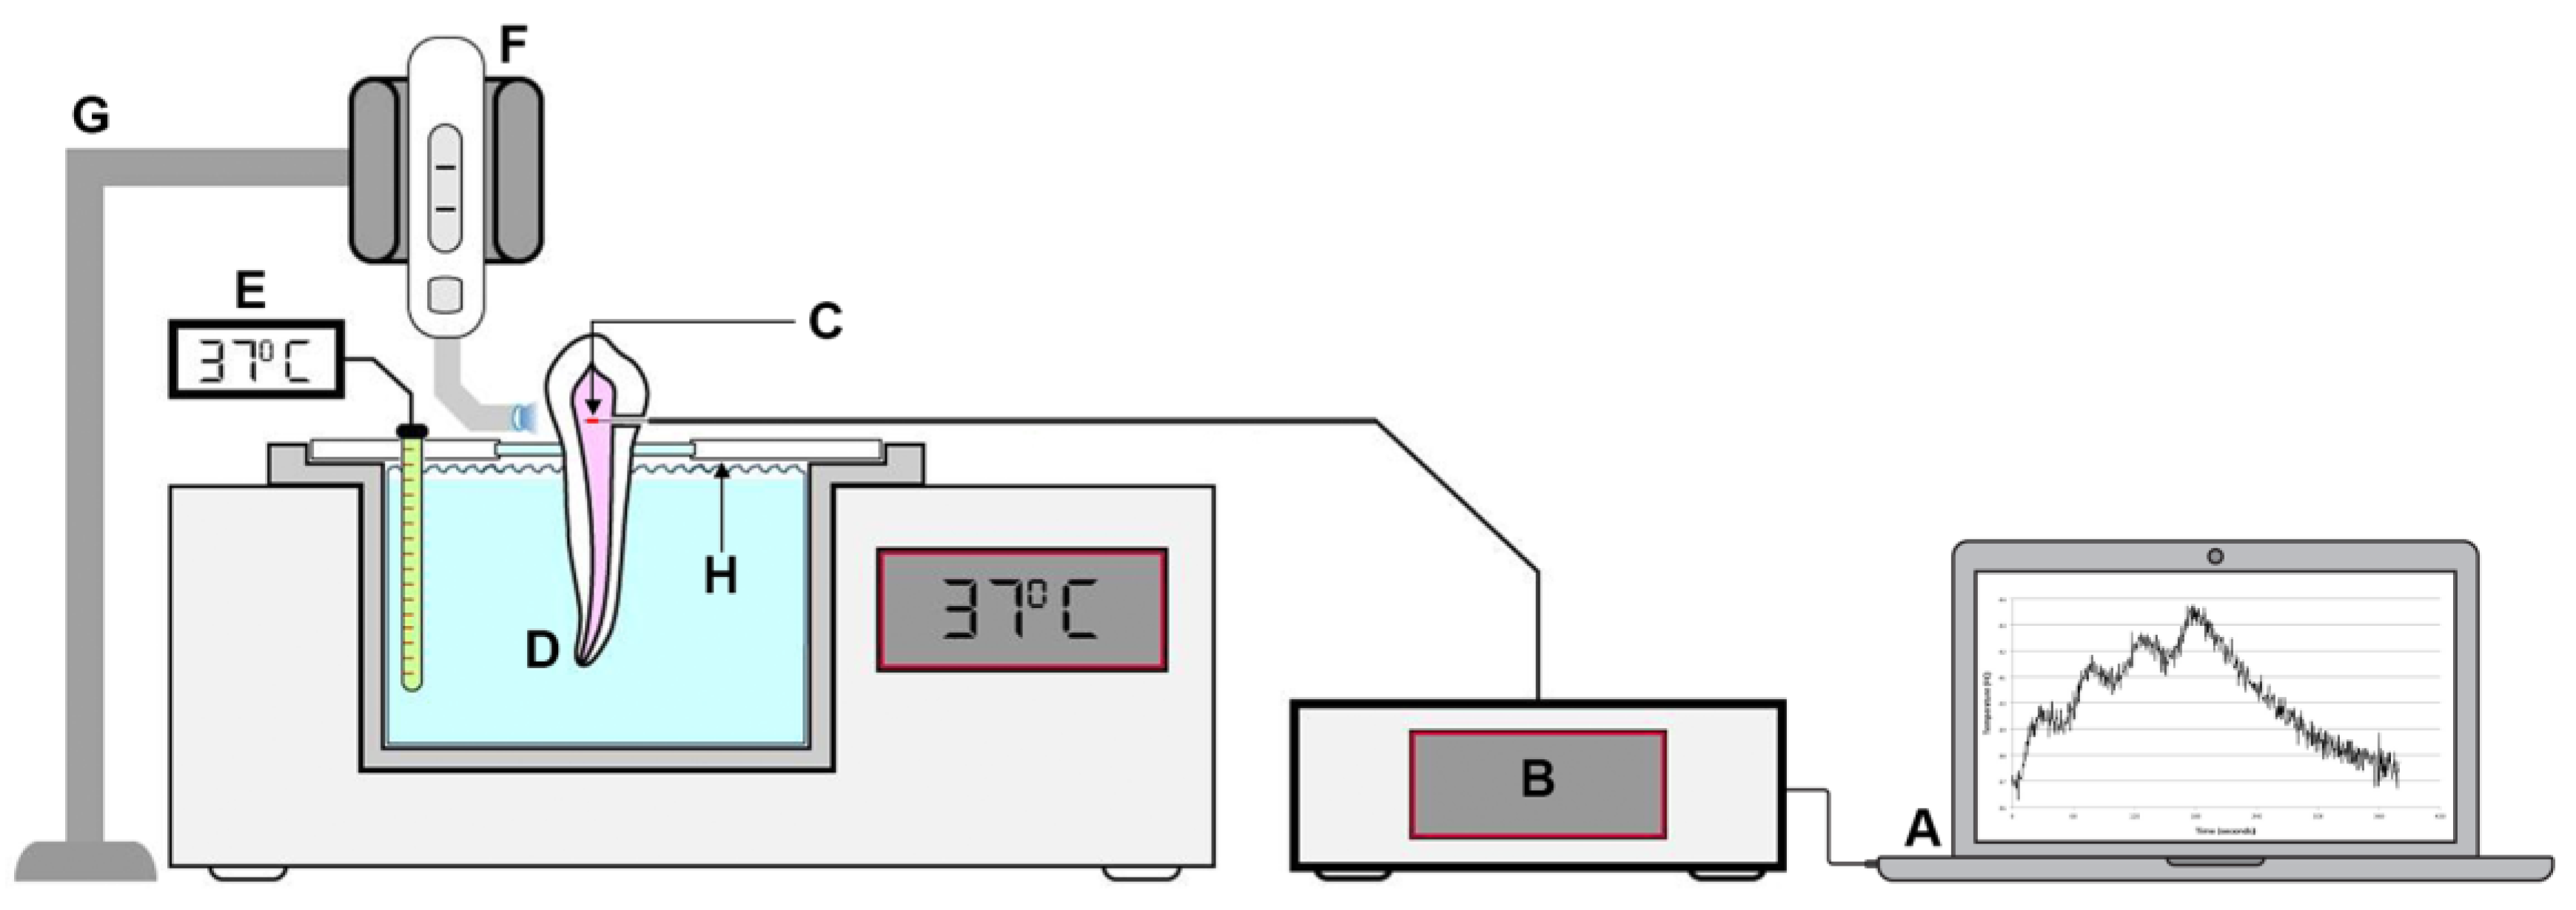
4. Materials and Methods
4.1. Fiber Bragg Grating (FBG) Sensors
4.2. Specimen Preparation and Temperature Measurement
4.3. Statistical Analysis
5. Conclusions
Author Contributions
Funding
Acknowledgments
Conflicts of Interest
References
- Mjor, I.A. Pulp-dentin biology in restorative dentistry. Part 7: The exposed pulp. Quintessence Int. 2002, 33, 113–135. [Google Scholar]
- Baldissara, P.; Catapano, S.; Scotti, R. Clinical and histological evaluation of thermal injury thresholds in human teeth: A preliminary study. J. Oral Rehab. 1997, 24, 791–801. [Google Scholar] [CrossRef]
- Nyborg, H.; Brannstrom, M. Pulp reaction to heat. J. Prost. Dent. 1968, 19, 605–612. [Google Scholar] [CrossRef]
- Kodonas, K.; Gogos, C.; Tziafas, D. Effect of simulated pulpal microcirculation on intrapulpal temperature changes following application of heat on tooth surfaces. Int. Endod. J. 2009, 42, 247–252. [Google Scholar] [CrossRef] [PubMed]
- Choi, S.H.; Roulet, J.F.; Heintze, S.D.; Park, S.H. Influence of cavity preparation, light-curing units, and composite filling on intrapulpal temperature increase in an in vitro tooth model. Oper. Dent. 2014, 39, E195–E205. [Google Scholar] [CrossRef]
- Ramoglu, S.I.; Karamehmetoglu, H.; Sari, T.; Usumez, S. Temperature rise caused in the pulp chamber under simulated intrapulpal microcirculation with different light-curing modes. Angle Orthodont. 2015, 85, 381–385. [Google Scholar] [CrossRef] [Green Version]
- Runnacles, P.; Arrais, C.A.; Pochapski, M.T.; Dos Santos, F.A.; Coelho, U.; Gomes, J.C.; De Goes, M.F.; Gomes, O.M.; Rueggeberg, F.A. In vivo temperature rise in anesthetized human pulp during exposure to a polywave LED light curing unit. Dent. Mater. 2015, 31, 505–513. [Google Scholar] [CrossRef]
- Mouhat, M.; Mercer, J.; Stangvaltaite, L.; Ortengren, U. Light-curing units used in dentistry: Factors associated with heat development-potential risk for patients. Clin. Oral Invest. 2017, 21, 1687–1696. [Google Scholar] [CrossRef] [PubMed]
- Zach, L.; Cohen, G. Pulp response to externally applied heat. Oral Surg. Oral Med. Oral Pathol. 1965, 19, 515–530. [Google Scholar] [CrossRef]
- Rueggeberg, F.A.; Giannini, M.; Arrais, C.A.G.; Price, R.B.T. Light curing in dentistry and clinical implications: A literature review. Braz. Oral Res. 2017, 31, e61. [Google Scholar] [CrossRef]
- Kim, R.J.; Lee, I.B.; Yoo, J.Y.; Park, S.J.; Kim, S.Y.; Yi, Y.A.; Hwang, J.Y.; Seo, D.G. Real-Time Analysis of Temperature Changes in Composite Increments and Pulp Chamber during Photopolymerization. BioMed Res. Int. 2015, 923808. [Google Scholar] [CrossRef]
- Kim, R.J.; Son, S.A.; Hwang, J.Y.; Lee, I.B.; Seo, D.G. Comparison of photopolymerization temperature increases in internal and external positions of composite and tooth cavities in real time: Incremental fillings of microhybrid composite vs. bulk filling of bulk fill composite. J. Dent. 2015, 43, 1093–1098. [Google Scholar] [CrossRef] [PubMed]
- Yasa, E.; Atalayin, C.; Karacolak, G.; Sari, T.; Turkun, L.S. Intrapulpal temperature changes during curing of different bulk-fill restorative materials. Dent. Mater. J. 2017, 36, 566–572. [Google Scholar] [CrossRef] [PubMed] [Green Version]
- Al-Qudah, A.A.; Mitchell, C.A.; Biagioni, P.A.; Hussey, D.L. Effect of composite shade, increment thickness and curing light on temperature rise during photocuring. J. Dent. 2007, 35, 238–245. [Google Scholar] [CrossRef] [PubMed]
- Jakubinek, M.B.; O’Neill, C.; Felix, C.; Price, R.B.; White, M.A. Temperature excursions at the pulp-dentin junction during the curing of light-activated dental restorations. Dent. Mater. 2008, 24, 1468–1476. [Google Scholar] [CrossRef]
- Kim, M.J.; Kim, R.J.; Ferracane, J.; Lee, I.B. Thermographic analysis of the effect of composite type, layering method, and curing light on the temperature rise of photo-cured composites in tooth cavities. Dent. Mater. 2017, 33, e373–e383. [Google Scholar] [CrossRef] [PubMed]
- Shortall, A.C.; Palin, W.M.; Jacquot, B.; Pelissier, B. Advances in light-curing units: Four generations of LED lights and clinical implications for optimizing their use: Part 2. From present to future. Dent. Update 2012, 39, 13–22. [Google Scholar] [CrossRef] [PubMed]
- Park, S.H.; Roulet, J.F.; Heintze, S.D. Parameters influencing increase in pulp chamber temperature with light-curing devices: Curing lights and pulpal flow rates. Oper. Dent. 2010, 35, 353–361. [Google Scholar] [CrossRef]
- Melo, L.B.; Rodrigues, J.M.M.; Farinha, A.S.F.; Marques, C.A.; Bilro, L.; Alberto, N.; Tomé, J.P.C.; Nogueira, R. Concentration sensor based on a tilted fiber Bragg grating for anions monitoring. Opt. Fiber Technol. 2014, 20, 422–427. [Google Scholar] [CrossRef]
- Domingues, M.F.; Tavares, C.; Leitao, C.; Frizera-Neto, A.; Alberto, N.; Marques, C.; Radwan, A.; Rodriguez, J.; Postolache, O.; Rocon, E.; et al. Insole optical fiber Bragg grating sensors network for dynamic vertical force monitoring. J. Biomed. Opt. 2017, 22, 91507. [Google Scholar] [CrossRef] [Green Version]
- Pereira, D.; Santos, T.; Nogueira, R.N.; Costa, L.C.; Alberto, N. High temperatures (>1000 °C) monitoring during the sintering process in microwave oven using RFBGs. Opt. Quant. Electron. 2016, 48, 1–9. [Google Scholar] [CrossRef]
- Harlow, J.E.; Sullivan, B.; Shortall, A.C.; Labrie, D.; Price, R.B. Characterizing the output settings of dental curing lights. J. Dent. 2016, 44, 20–26. [Google Scholar] [CrossRef] [PubMed]
- Shimokawa, C.A.; Harlow, J.E.; Turbino, M.L.; Price, R.B. Ability of four dental radiometers to measure the light output from nine curing lights. J. Dent. 2016, 54, 48–55. [Google Scholar] [CrossRef]
- Taubock, T.T.; Feilzer, A.J.; Buchalla, W.; Kleverlaan, C.J.; Krejci, I.; Attin, T. Effect of modulated photo-activation on polymerization shrinkage behavior of dental restorative resin composites. Eur. J. Oral Sci. 2014, 122, 293–302. [Google Scholar] [CrossRef] [PubMed]
- Bortolotto, T.; Prando, F.; Dietschi, D.; Krejci, I. Light polymerization during cavity filling: Influence of total energy density on shrinkage and marginal adaptation. Odontology 2014, 102, 184–188. [Google Scholar] [CrossRef] [PubMed]
- Daronch, M.; Rueggeberg, F.A.; Hall, G.; De Goes, M.F. Effect of composite temperature on in vitro intrapulpal temperature rise. Dent. Mater. 2007, 23, 1283–1288. [Google Scholar] [CrossRef]
- Leprince, J.; Devaux, J.; Mullier, T.; Vreven, J.; Leloup, G. Pulpal-temperature rise and polymerization efficiency of LED curing lights. Oper. Dent. 2010, 35, 220–230. [Google Scholar] [CrossRef] [PubMed]
- Ulusoy, C.; Irmak, O.; Bagis, Y.H.; Ulusoy, O.I. Temperature rise and shear bond strength of bondable buccal tubes bonded by various light sources. Eur. J. Orthod. 2008, 30, 413–417. [Google Scholar] [CrossRef] [Green Version]
- Anusavice, K.J.; Shen, C.; Rawls, H.R. Physical and Chemical Properties of Solids. In Phillip’s Science of Dental Materials, 12th ed.; Anusavice, K.J., Shen, C., Rawls, H.R., Eds.; Elsevier Saunders: St. Louis, MO, USA, 2013; pp. 30–47. [Google Scholar]
- Vinall, C.V.; Garcia-Silva, T.C.; Lou, J.S.B.; Wells, M.H.; Tantbirojn, D.; Versluis, A. Intrapulpal Temperature Rise During Light Activation of Restorative Composites in a Primary Molar. Pediatr. Dent. 2017, 39, 125–130. [Google Scholar] [PubMed]
- Kwon, S.J.; Park, Y.J.; Jun, S.H.; Ahn, J.S.; Lee, I.B.; Cho, B.H.; Son, H.H.; Seo, D.G. Thermal irritation of teeth during dental treatment procedures. Restor. Dent. Endod. 2013, 38, 105–112. [Google Scholar] [CrossRef]
- Durey, K.; Santini, A.; Miletic, V. Pulp chamber temperature rise during curing of resin-based composites with different light-curing units. Prim. Dent. Care 2008, 15, 33–38. [Google Scholar] [CrossRef] [PubMed]
- Carvalho, L.; Alberto, N.J.; Gomes, P.S.; Nogueira, R.N.; Pinto, J.L.; Fernandes, M.H. In the trail of a new bio-sensor for measuring strain in bone: Osteoblastic biocompatibility. Biosens. Bioelectron. 2011, 26, 4046–4052. [Google Scholar] [CrossRef] [PubMed]


| Energy Level | LED LCU/Curing Mode | Pulp Temperature Variations (°C) | p | |||
|---|---|---|---|---|---|---|
| T1 | T2 | T3 | T4 | |||
| HIGH | Bluephase HP | 1.73 ± 1.44 | 3.71 ± 1.64 | 4.62 ± 1.85 | 5.21 ± 1.73 | <0.01 |
| Demi PLS | 1.97 ± 1.53 | 3.96 ± 1.89 | 5.33 ± 2.00 | 5.96 ± 2.32 | <0.01 | |
| Demi Cont | 1.58 ± 1.46 | 3.50 ± 1.76 | 4.87 ± 1.84 | 5.35 ± 2.29 | <0.01 | |
| SPEC Std | 1.90 ± 1.46 | 3.78 ± 1.56 | 4.80 ± 1.96 | 5.46 ± 1.96 | <0.01 | |
| Valo Std | 2.45 ± 1.83 | 4.70 ± 2.35 | 5.89 ± 2.51 | 6.45 ± 2.61 | <0.01 | |
| p | 0.79 | 0.65 | 0.49 | 0.77 | ||
| Energy Level | LED LCU /Curing Mode | Pulp Temperature Variations (°C) | p | |||
|---|---|---|---|---|---|---|
| T1 | T2 | T3 | T4 | |||
| LOW | Bluephase T | 0.66 ± 0.56 | 1.51 ± 0.90 | 1.93± 0.98 | 2.36 ± 1.08 | <0.01 |
| SPEC 3K | 0.84 ± 0.59 | 1.59 ±0.78 | 2.06 ±0.84 | 2.39 ± 0.75 | <0.01 | |
| Valo HP | 0.51 ±0.70 | 1.18 ± 0.81 | 1.76 ± 0.79 | 2.19 ± 0.89 | <0.01 | |
| Valo XP | 0.49 ± 0.97 | 1.30 ± 0.84 | 2.00 ± 0.78 | 2.50 ± 0.95 | <0.01 | |
| p | 0.49 | 0.62 | 0.70 | 0.85 | ||
| Curing Unit & External Tip Diameter | Wavelength (nm) | Curing Mode | Power Density (mW/cm2) [Manufacturer’s Value] | Curing Protocol | Energy Density (mJ/cm2) |
|---|---|---|---|---|---|
| Bluephase 20i 8 mm Ivoclar Vivadent, Schaan, Liechtenstein Batch number #506475 | 385–515 | High Power (Bluephase HP) | 1080 [1200] | 20 s × 4 (30 s interval) | 86,400 |
| Turbo (Bluephase T) | 1790 [2000] | 5 s × 4 (30 s interval) | 35,800 | ||
| Demi Ultra 8 mm Kerr, Orange, CA, U.S.A. Batch number #784000644 | 450–470 | Continuous (Demi Cont) | 1300 [1215] | 20 s × 4 (30 s interval) | 104,000 |
| Periodic Level Shifting (PLS) (Demi PLS) | 1350 [1100/1330 oscillation per second] | 20 s × 4 (30 s interval) | 108,000 | ||
| SPEC 3 8 mm Coltène Whaledent, Cuyahoga Falls, OH, U.S.A. Batch number #130620166 | 455–465 | Standard (SPEC Std) | 1360 [1600] | 15 s × 4 (30 s interval) | 81,600 |
| 3K (SPEC 3K) | 2420 [3000] | 3 s × 4 (30 s interval) | 29,040 | ||
| Valo 10 mm Ultradent, South Jordan, UT, U.S.A Batch number # V04639 | 395–480 | Standard (Valo Std) | 1130 [1000] | 20 s × 4 (30 s interval) | 90,400 |
| High Power (Valo HP) | 1610 [1400] | 4 s × 4 (30 s interval) | 25,760 | ||
| Xtra Power (Valo XP) | 2710 [3200] | 3 s × 4 (30 s interval) | 32,520 |
© 2019 by the authors. Licensee MDPI, Basel, Switzerland. This article is an open access article distributed under the terms and conditions of the Creative Commons Attribution (CC BY) license (http://creativecommons.org/licenses/by/4.0/).
Share and Cite
Vinagre, A.; Ramos, J.C.; Rebelo, C.; Basto, J.F.; Messias, A.; Alberto, N.; Nogueira, R. Pulp Temperature Rise Induced by Light-Emitting Diode Light-Curing Units Using an Ex Vivo Model. Materials 2019, 12, 411. https://0-doi-org.brum.beds.ac.uk/10.3390/ma12030411
Vinagre A, Ramos JC, Rebelo C, Basto JF, Messias A, Alberto N, Nogueira R. Pulp Temperature Rise Induced by Light-Emitting Diode Light-Curing Units Using an Ex Vivo Model. Materials. 2019; 12(3):411. https://0-doi-org.brum.beds.ac.uk/10.3390/ma12030411
Chicago/Turabian StyleVinagre, Alexandra, João C. Ramos, Clara Rebelo, José Francisco Basto, Ana Messias, Nélia Alberto, and Rogério Nogueira. 2019. "Pulp Temperature Rise Induced by Light-Emitting Diode Light-Curing Units Using an Ex Vivo Model" Materials 12, no. 3: 411. https://0-doi-org.brum.beds.ac.uk/10.3390/ma12030411