Synthesis and Investigation of Cryogenic Mechanical Properties of Chopped-Glass-Fiber-Reinforced Polyisocyanurate Foam

Abstract
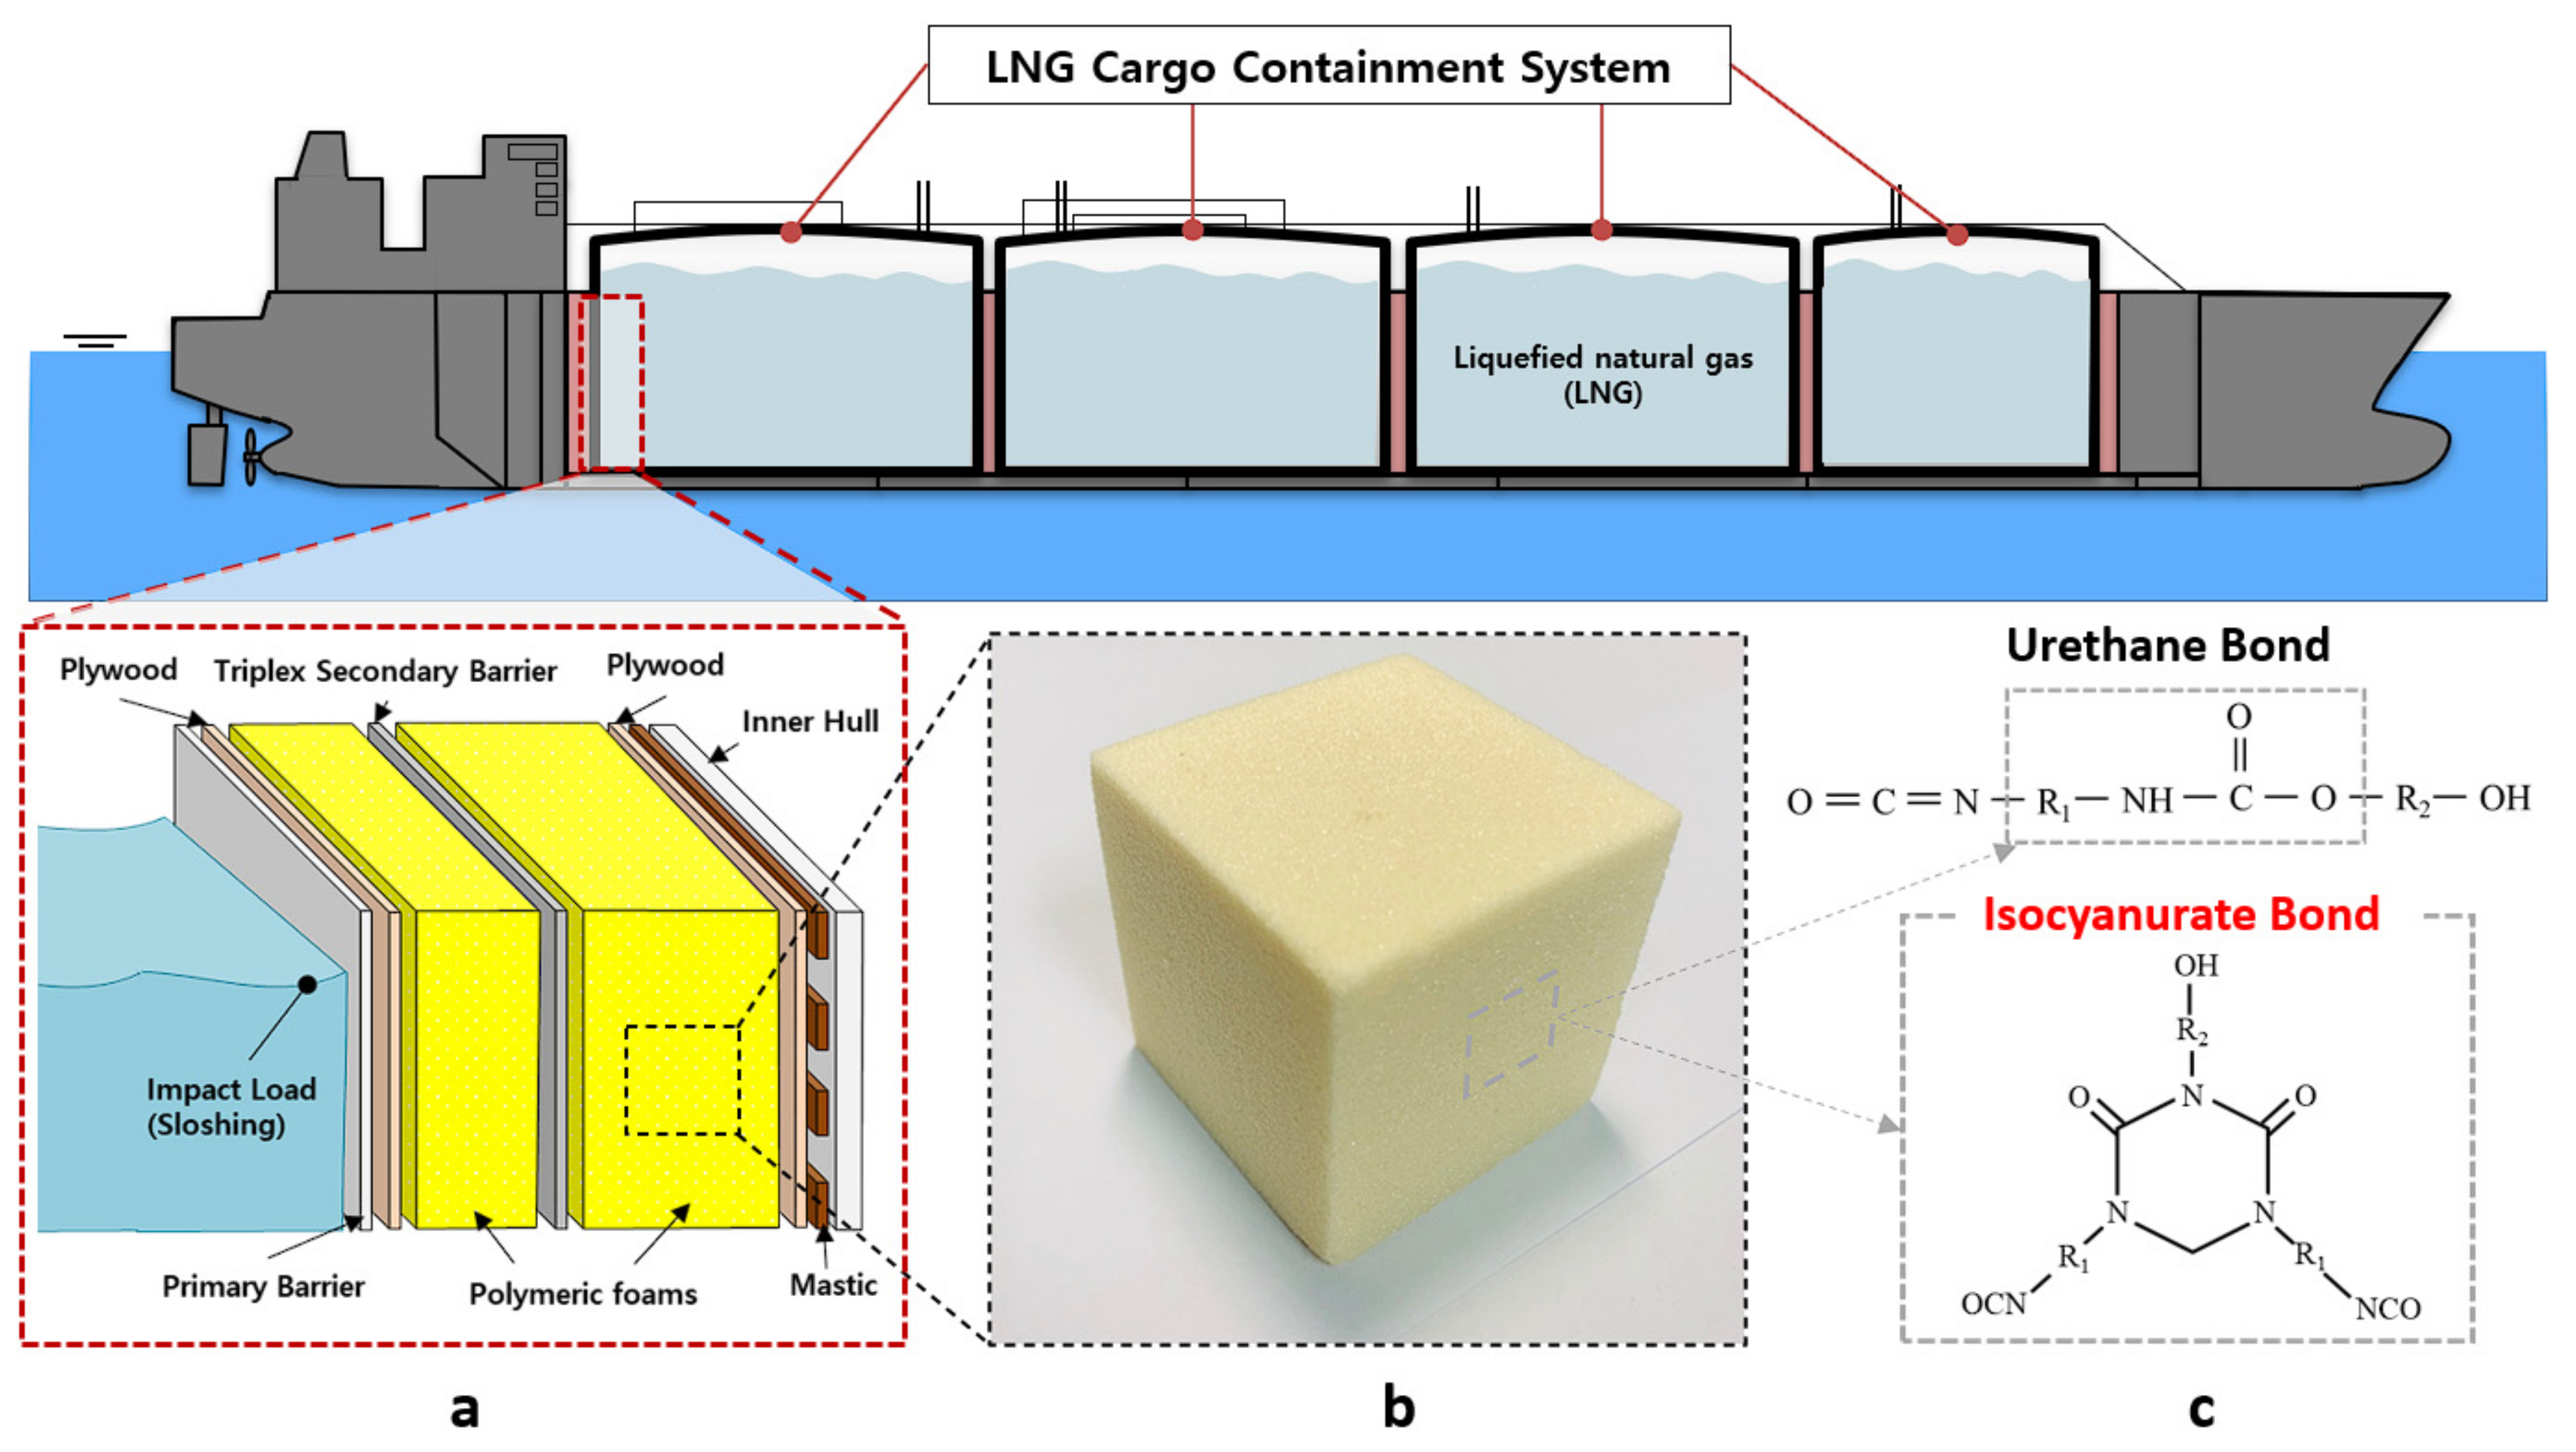
:1. Introduction
2. Experimental
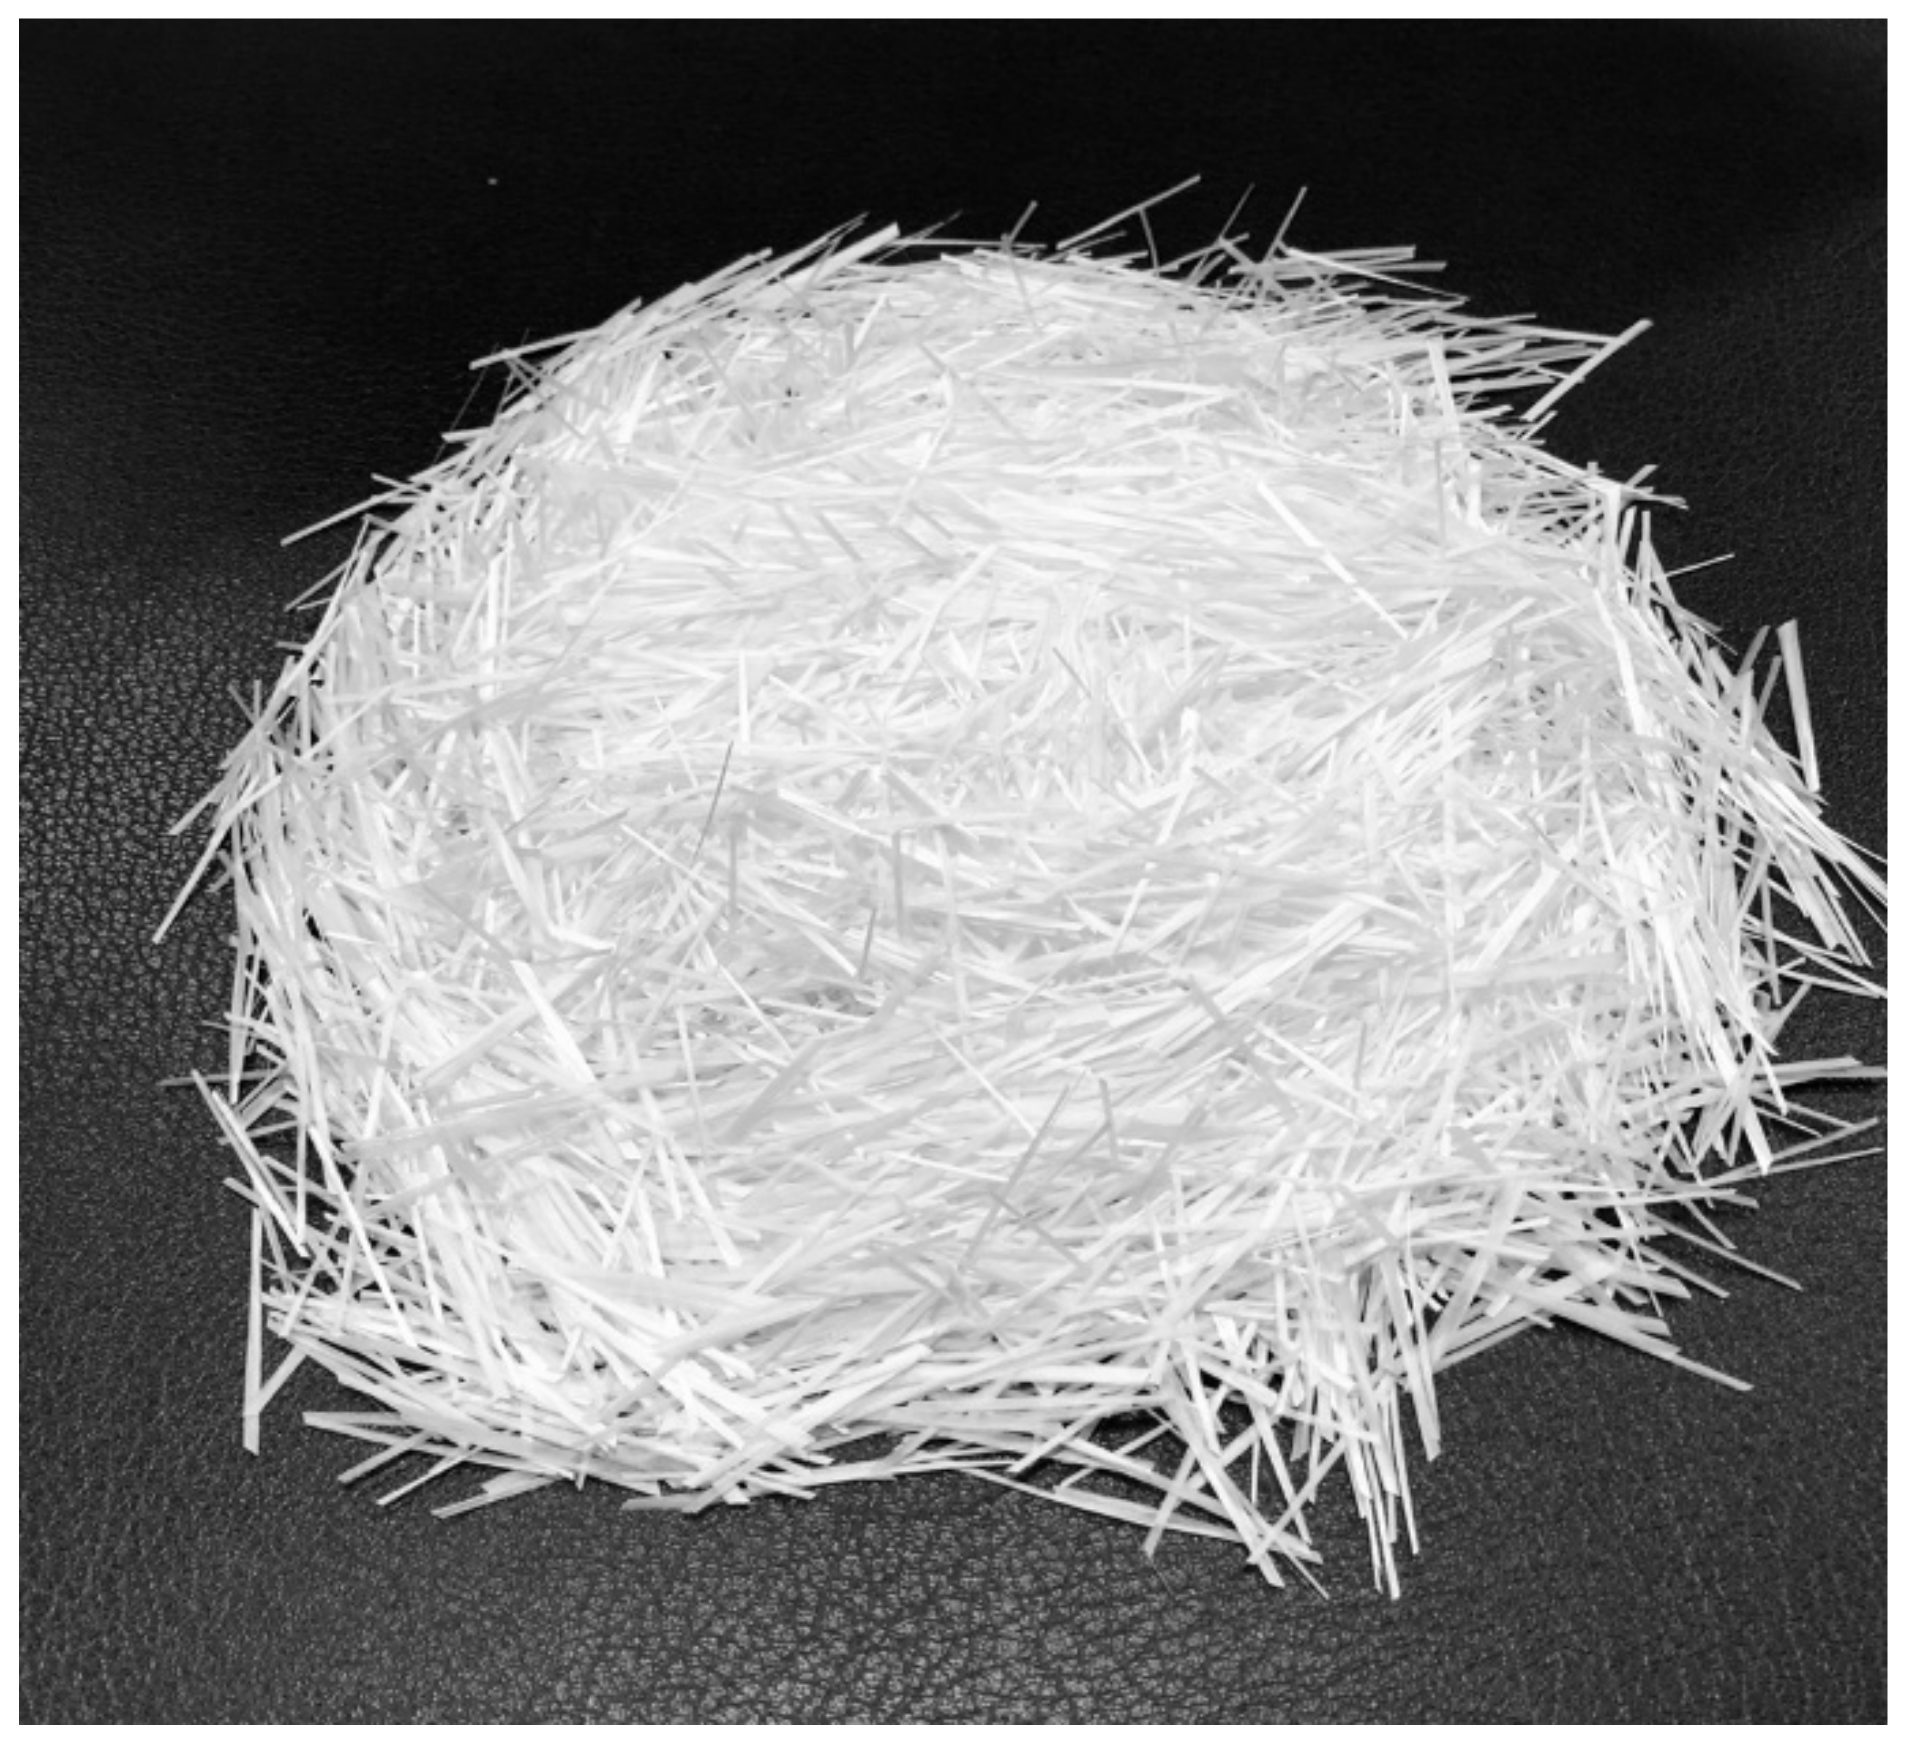
2.1. Materials
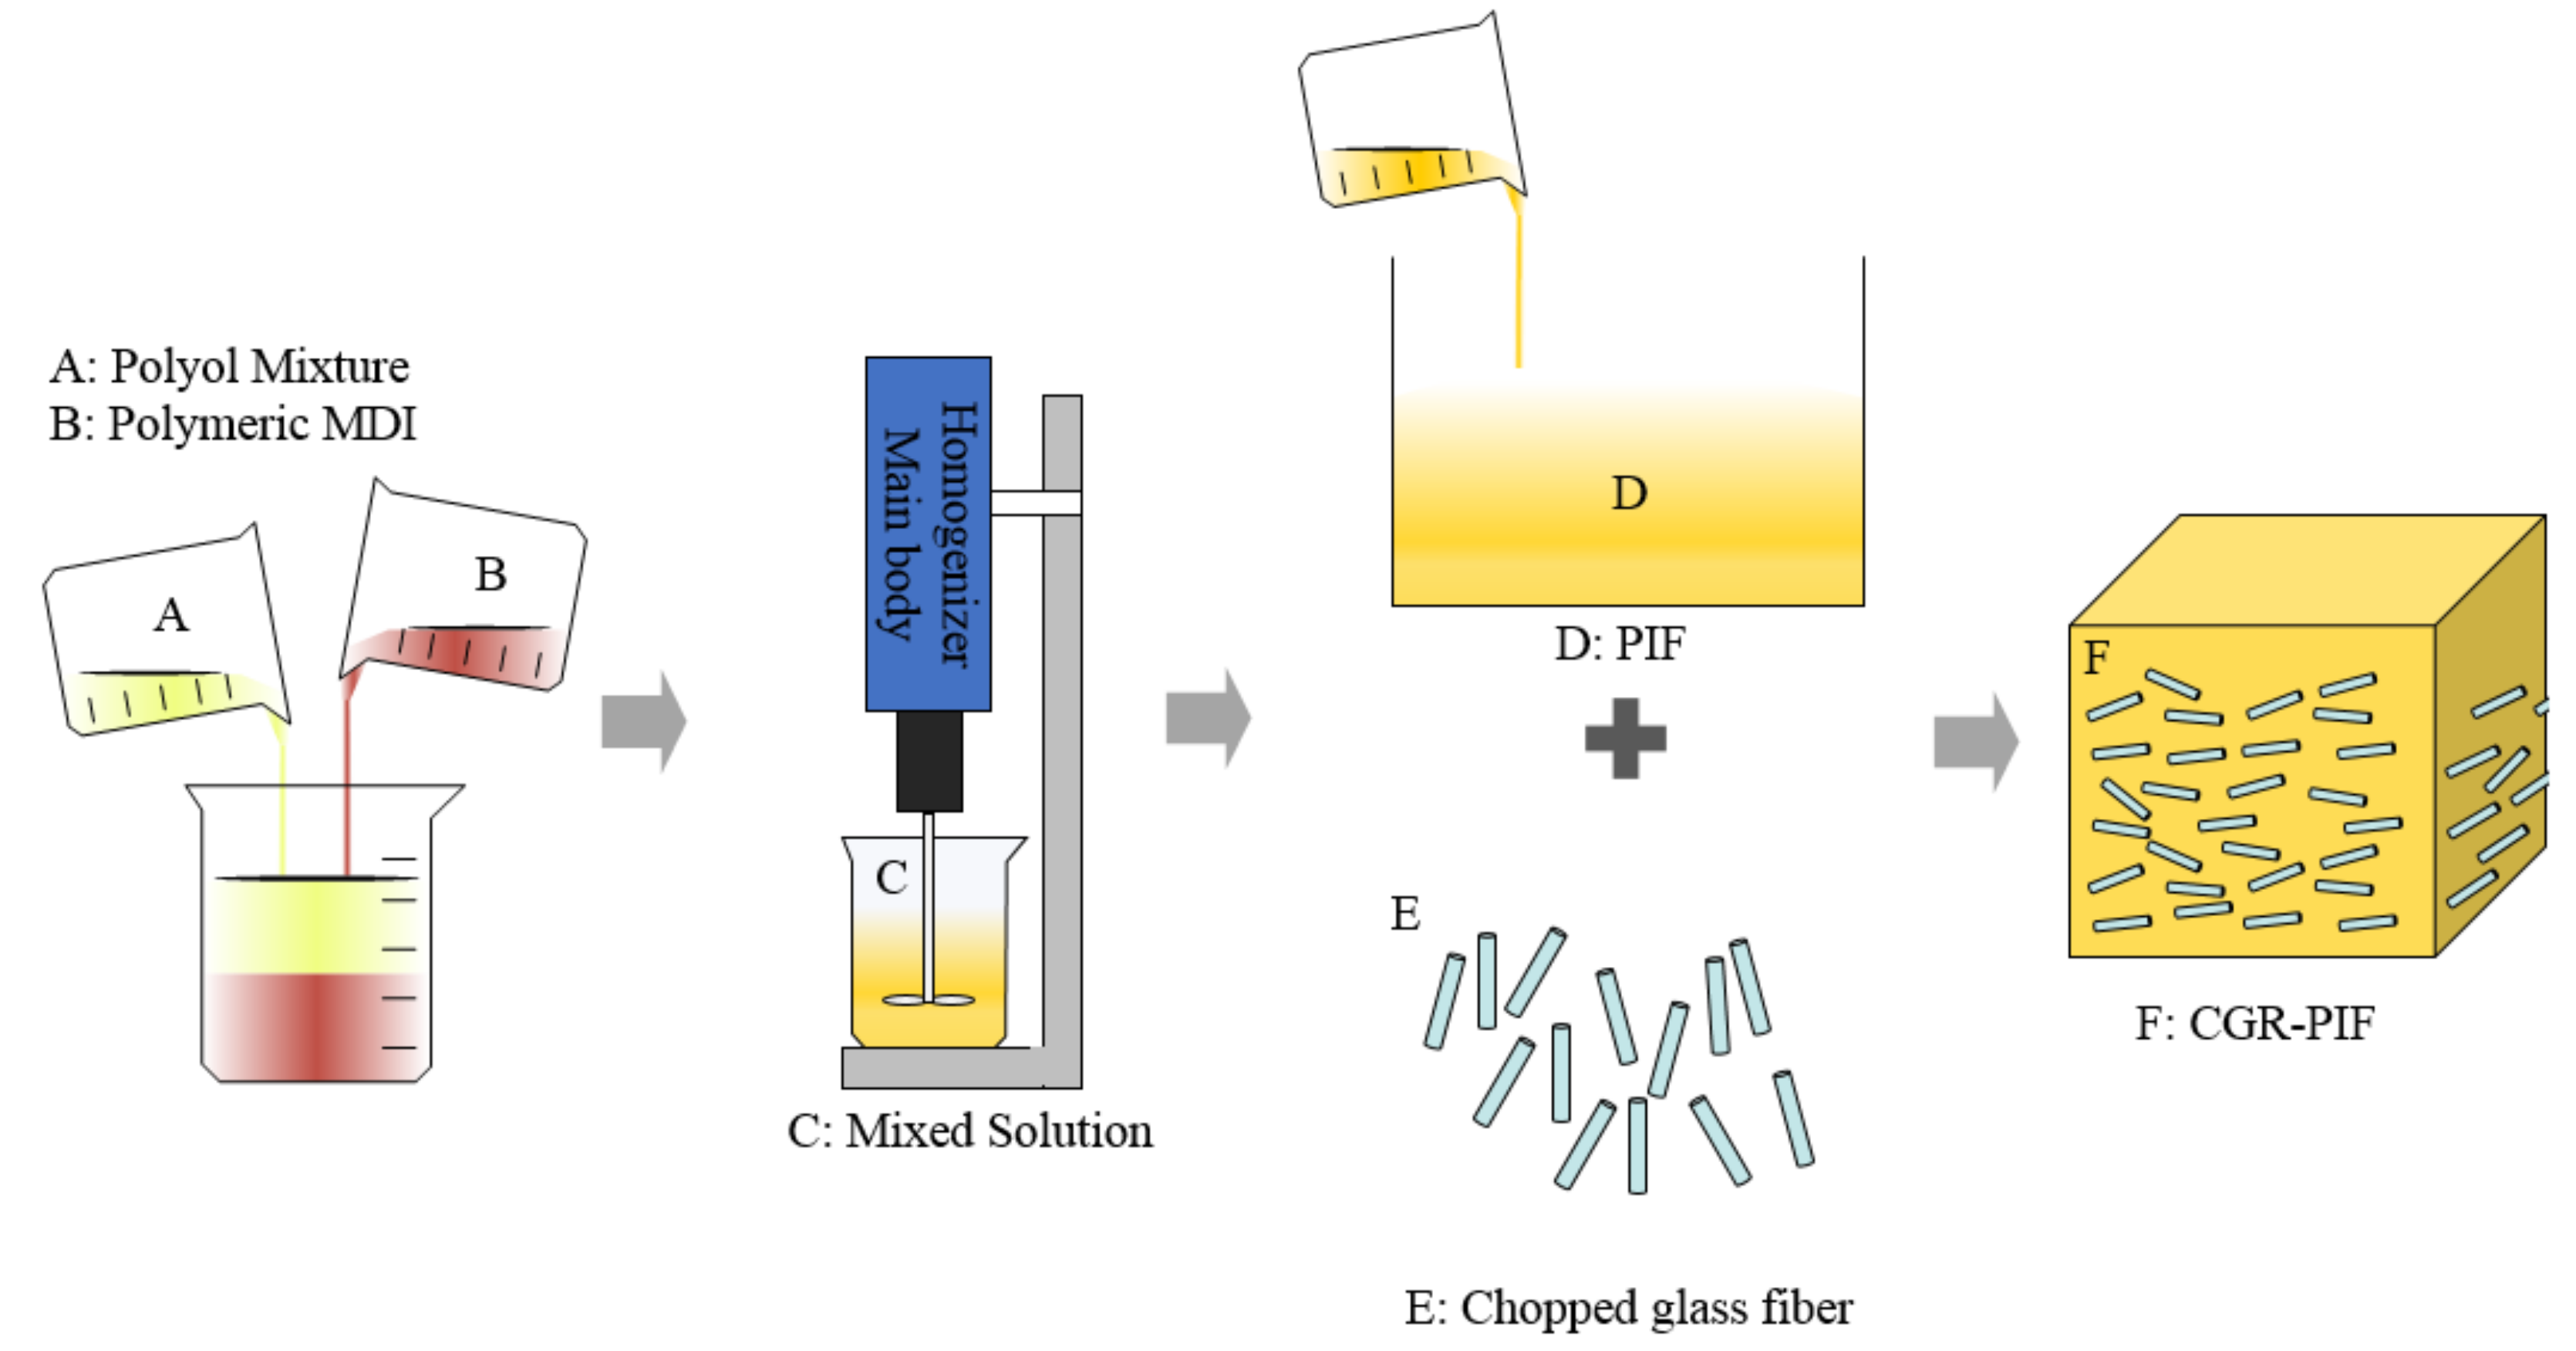
2.2. Synthesis of the CGR-PIF
2.3. Processing
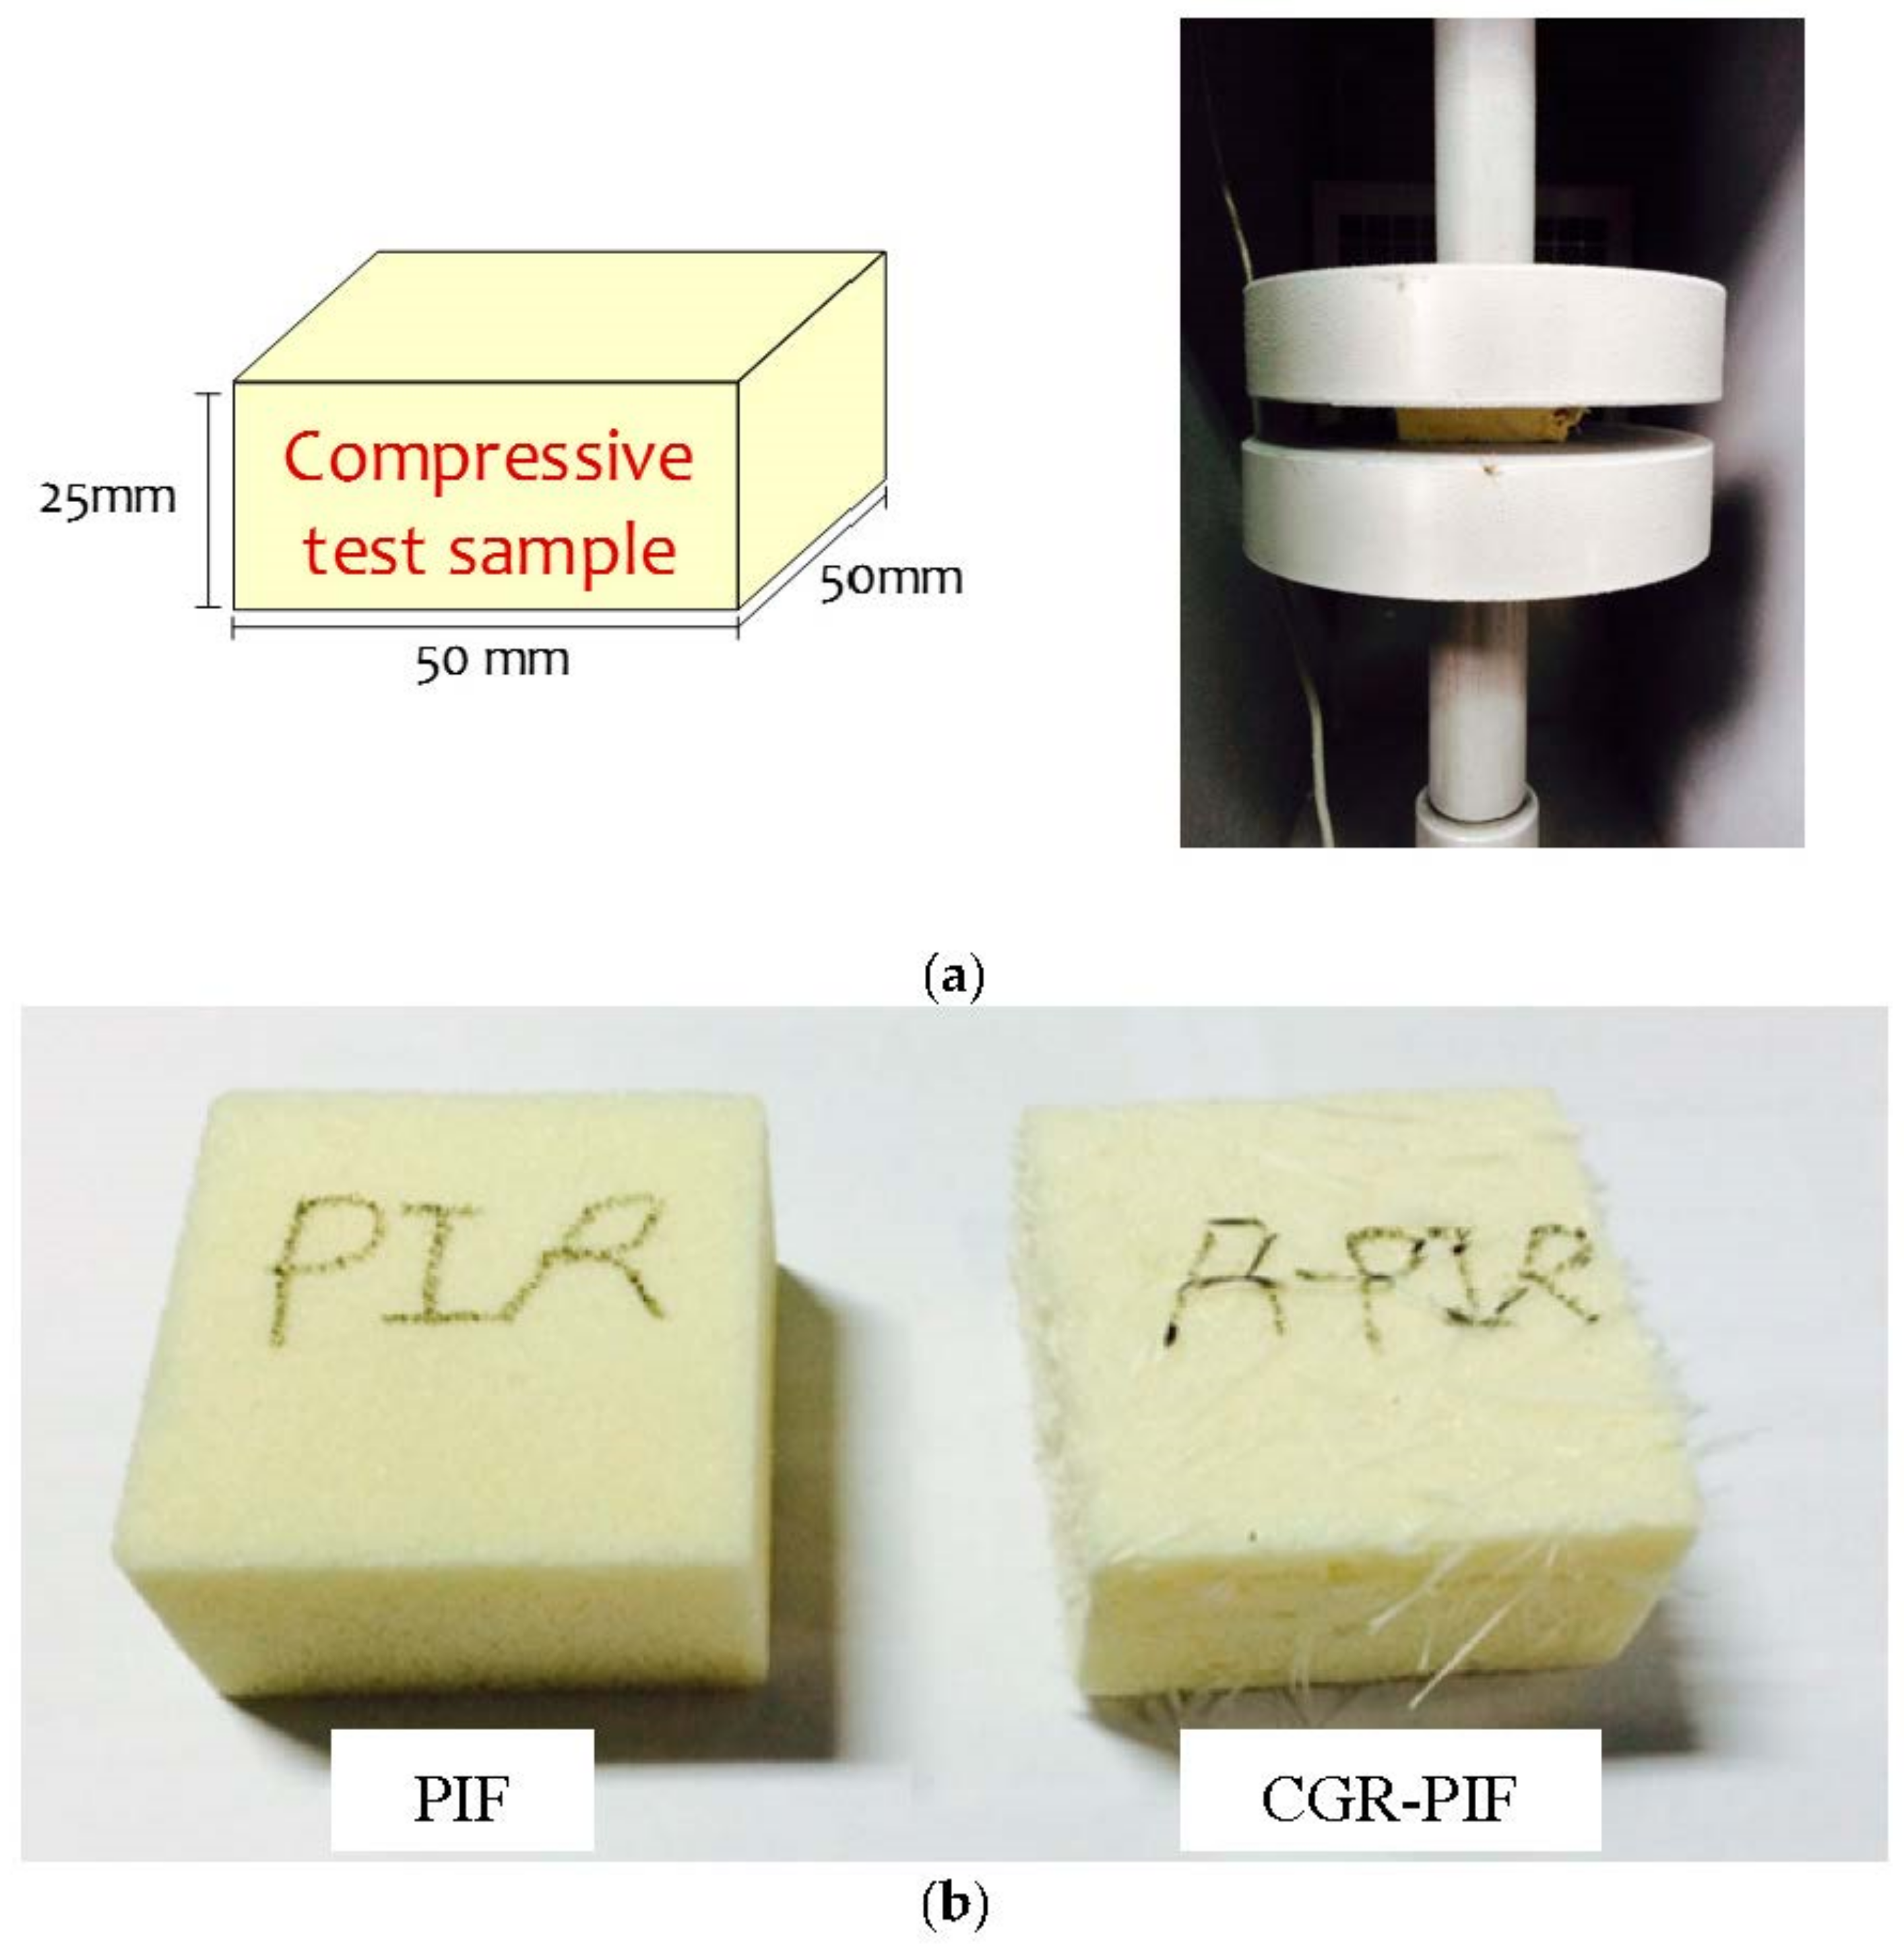
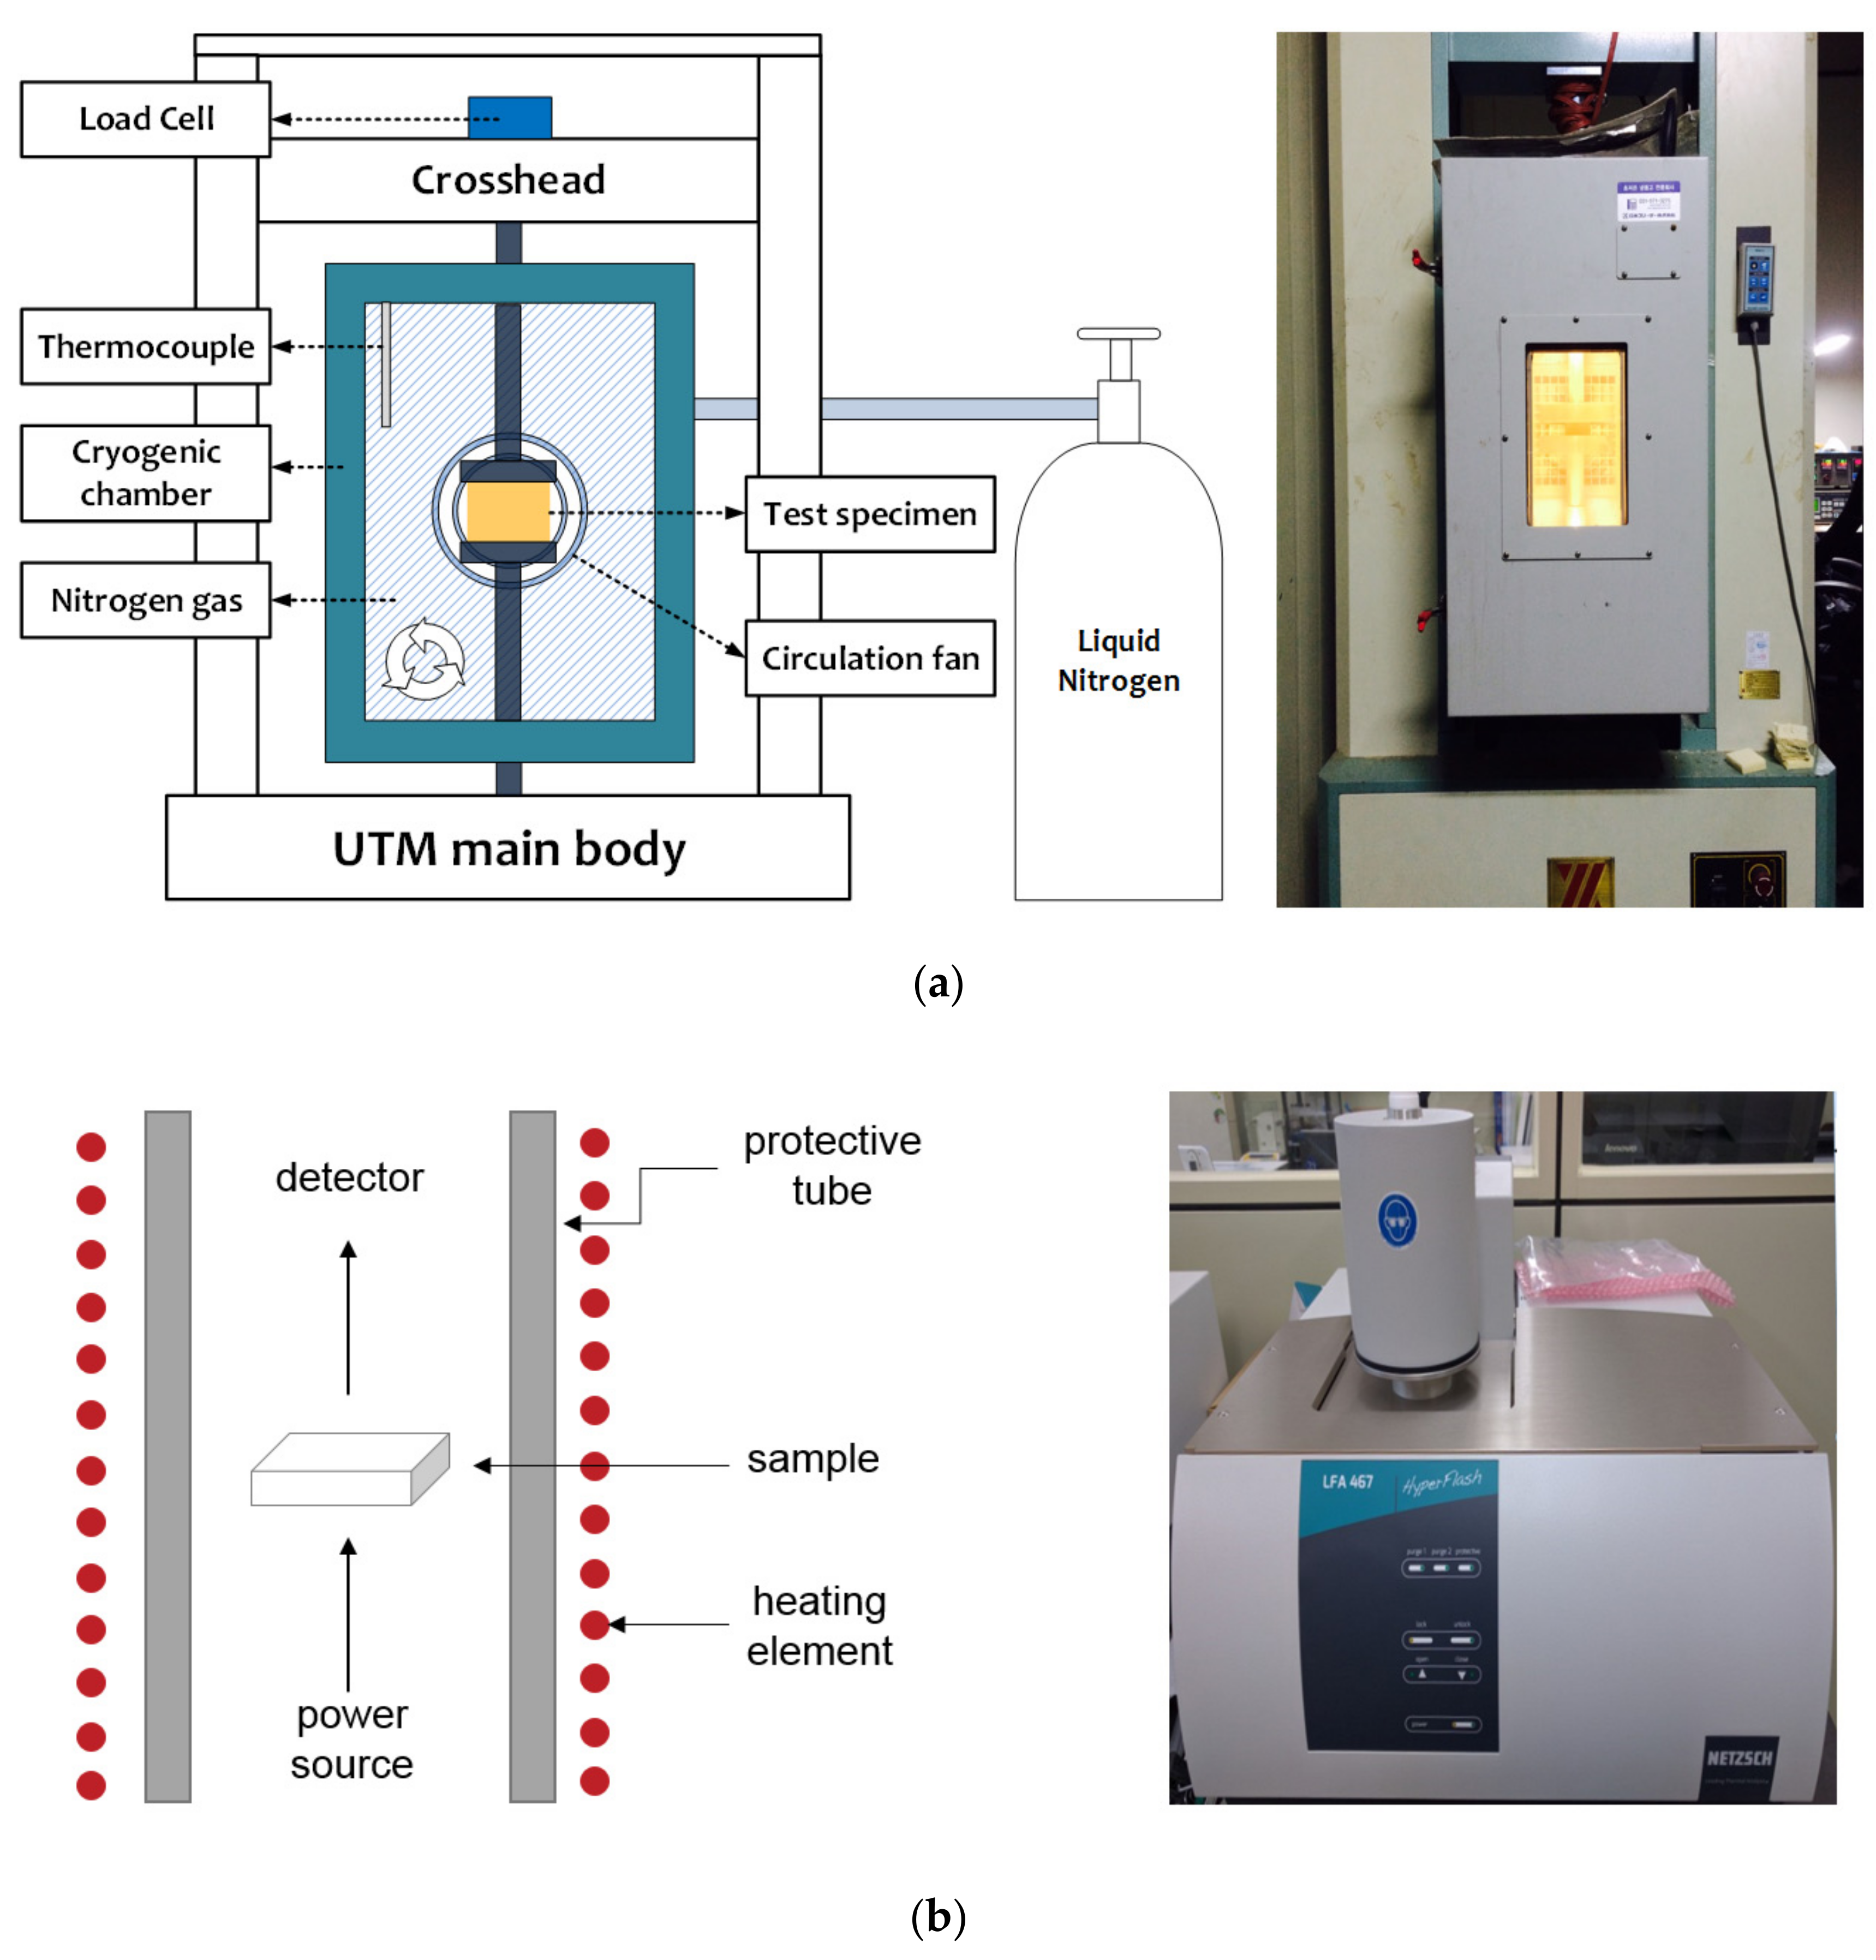
2.4. Test Apparatus and Scenario
3. Results and Discussion
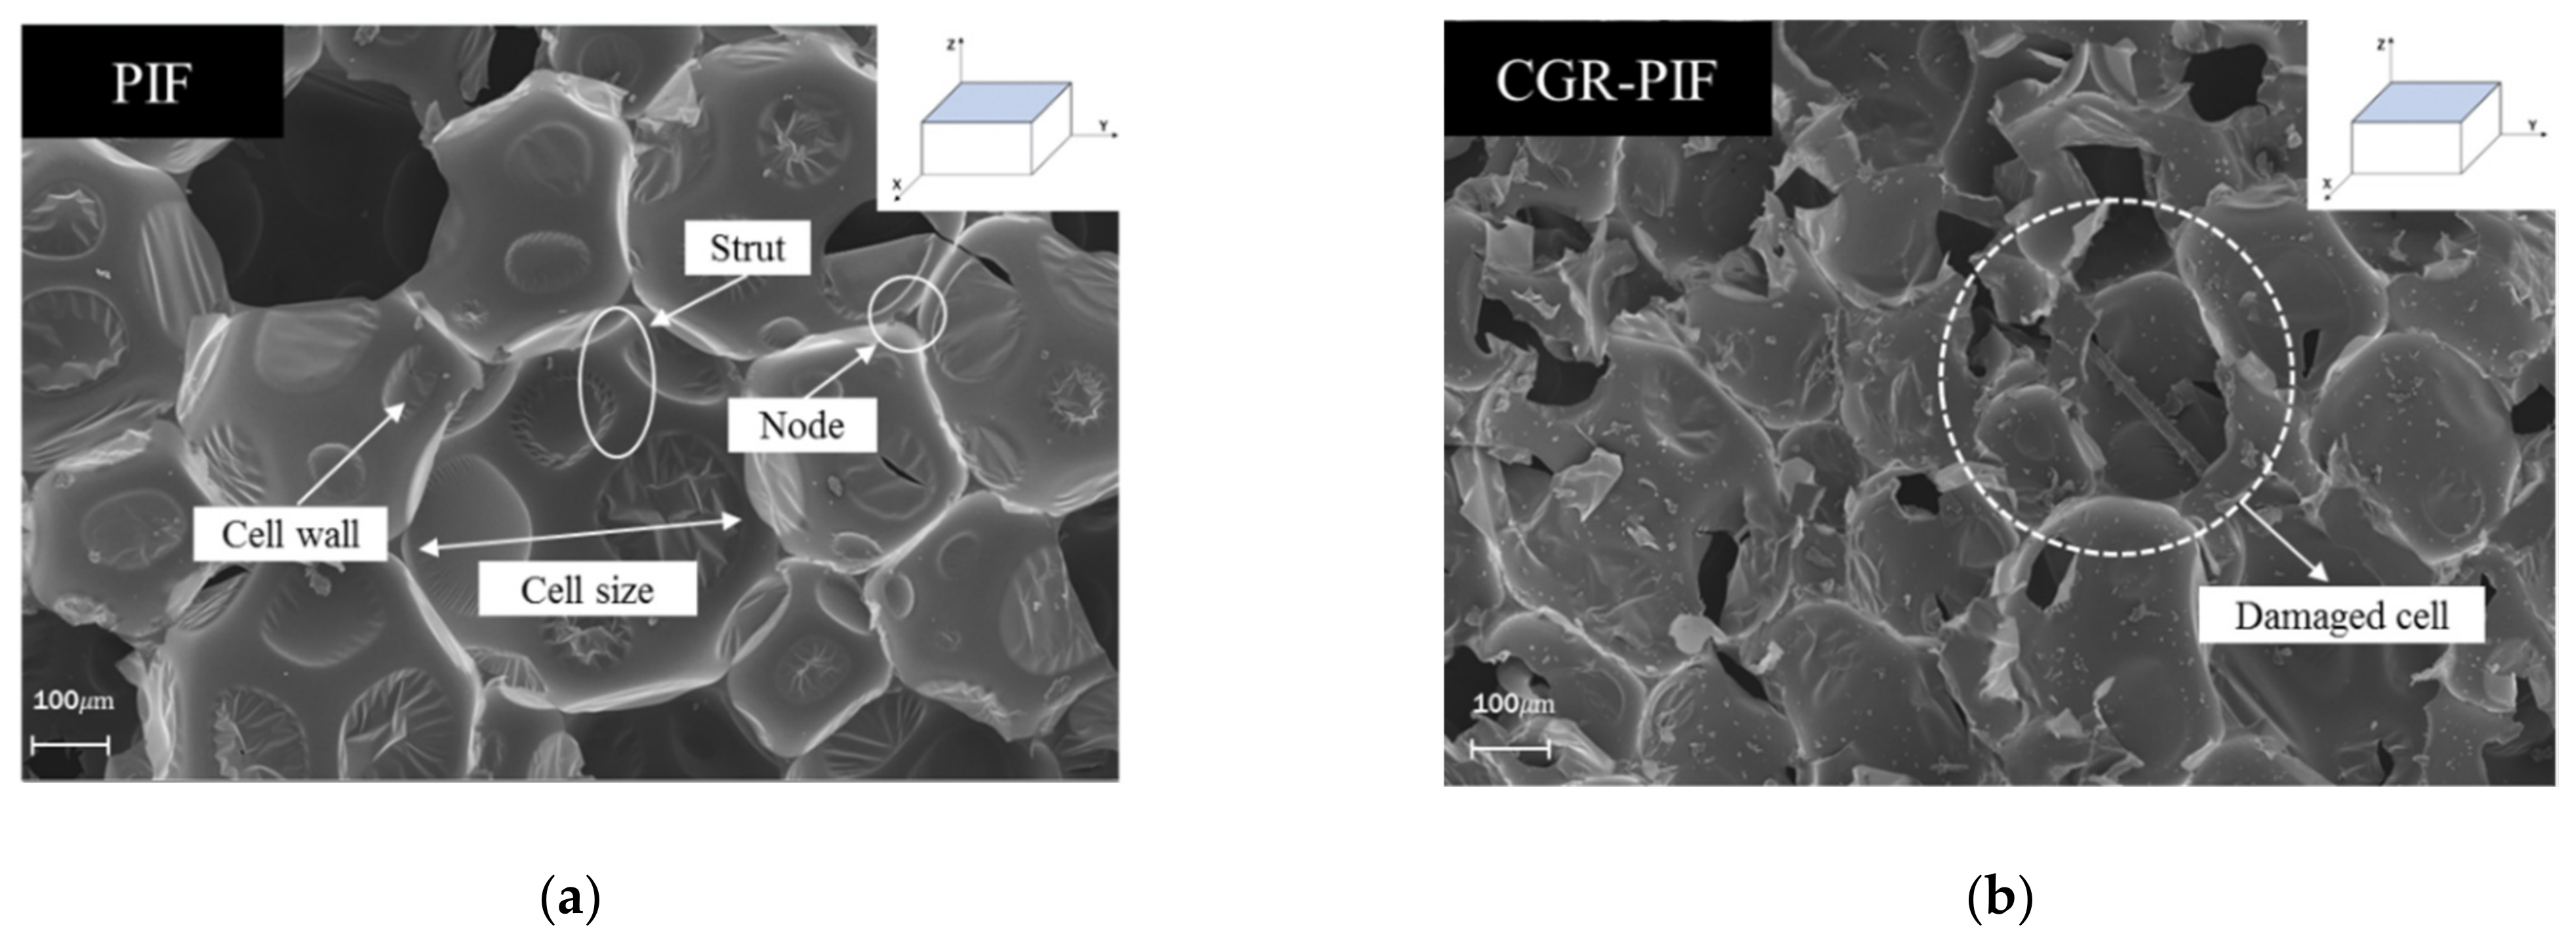
3.1. Morphological Characterization
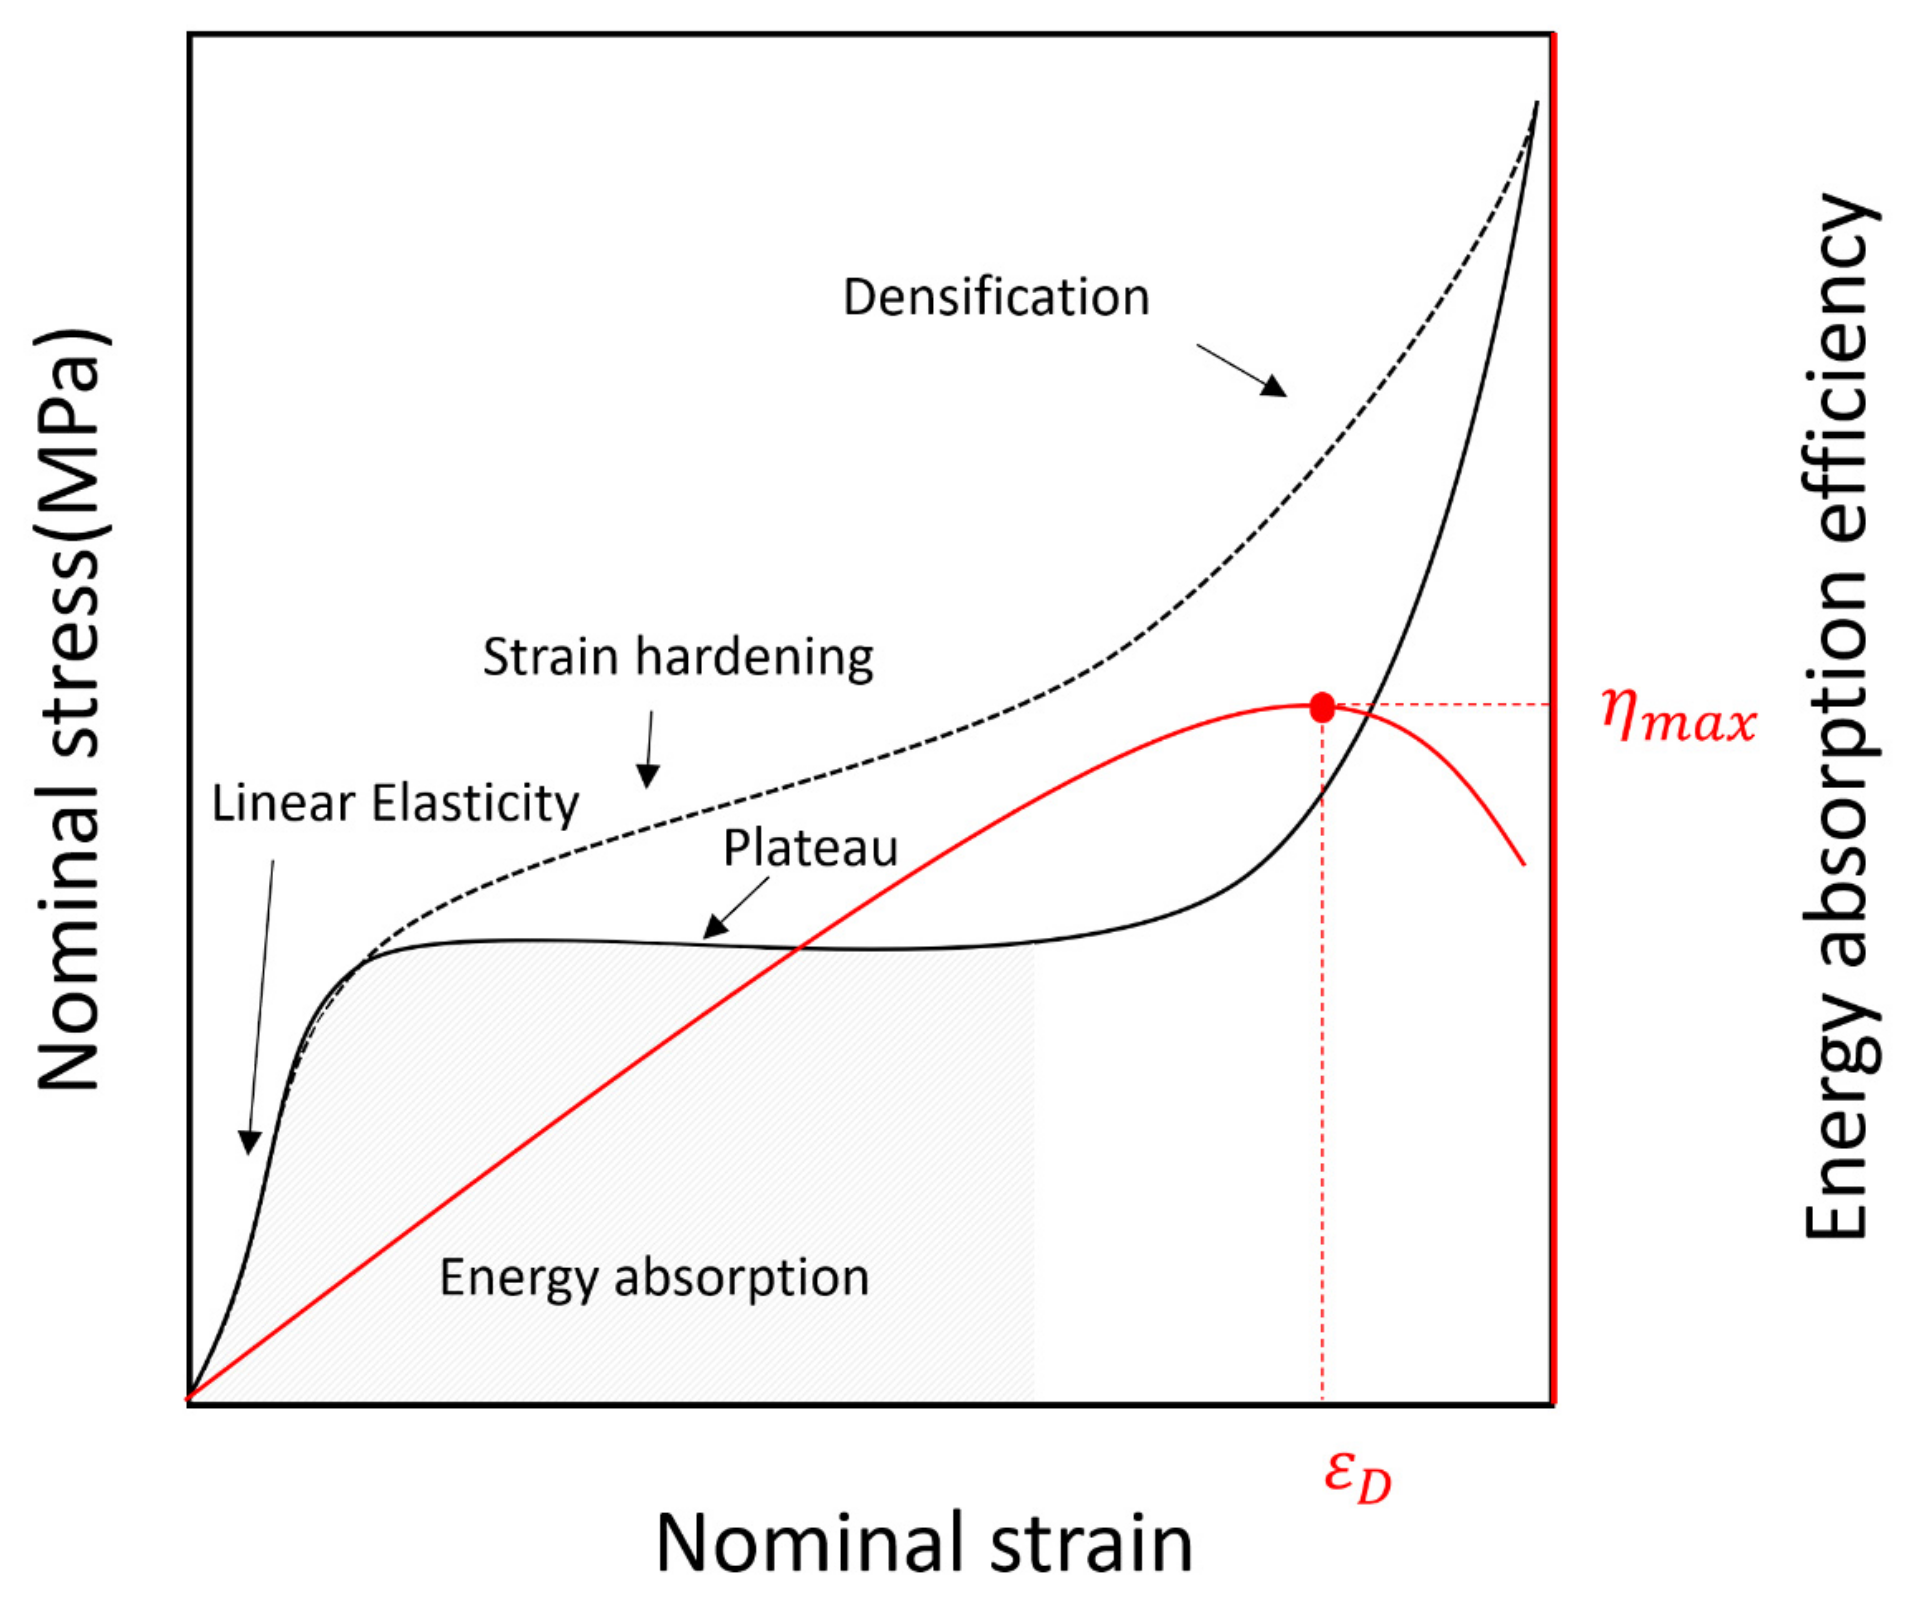
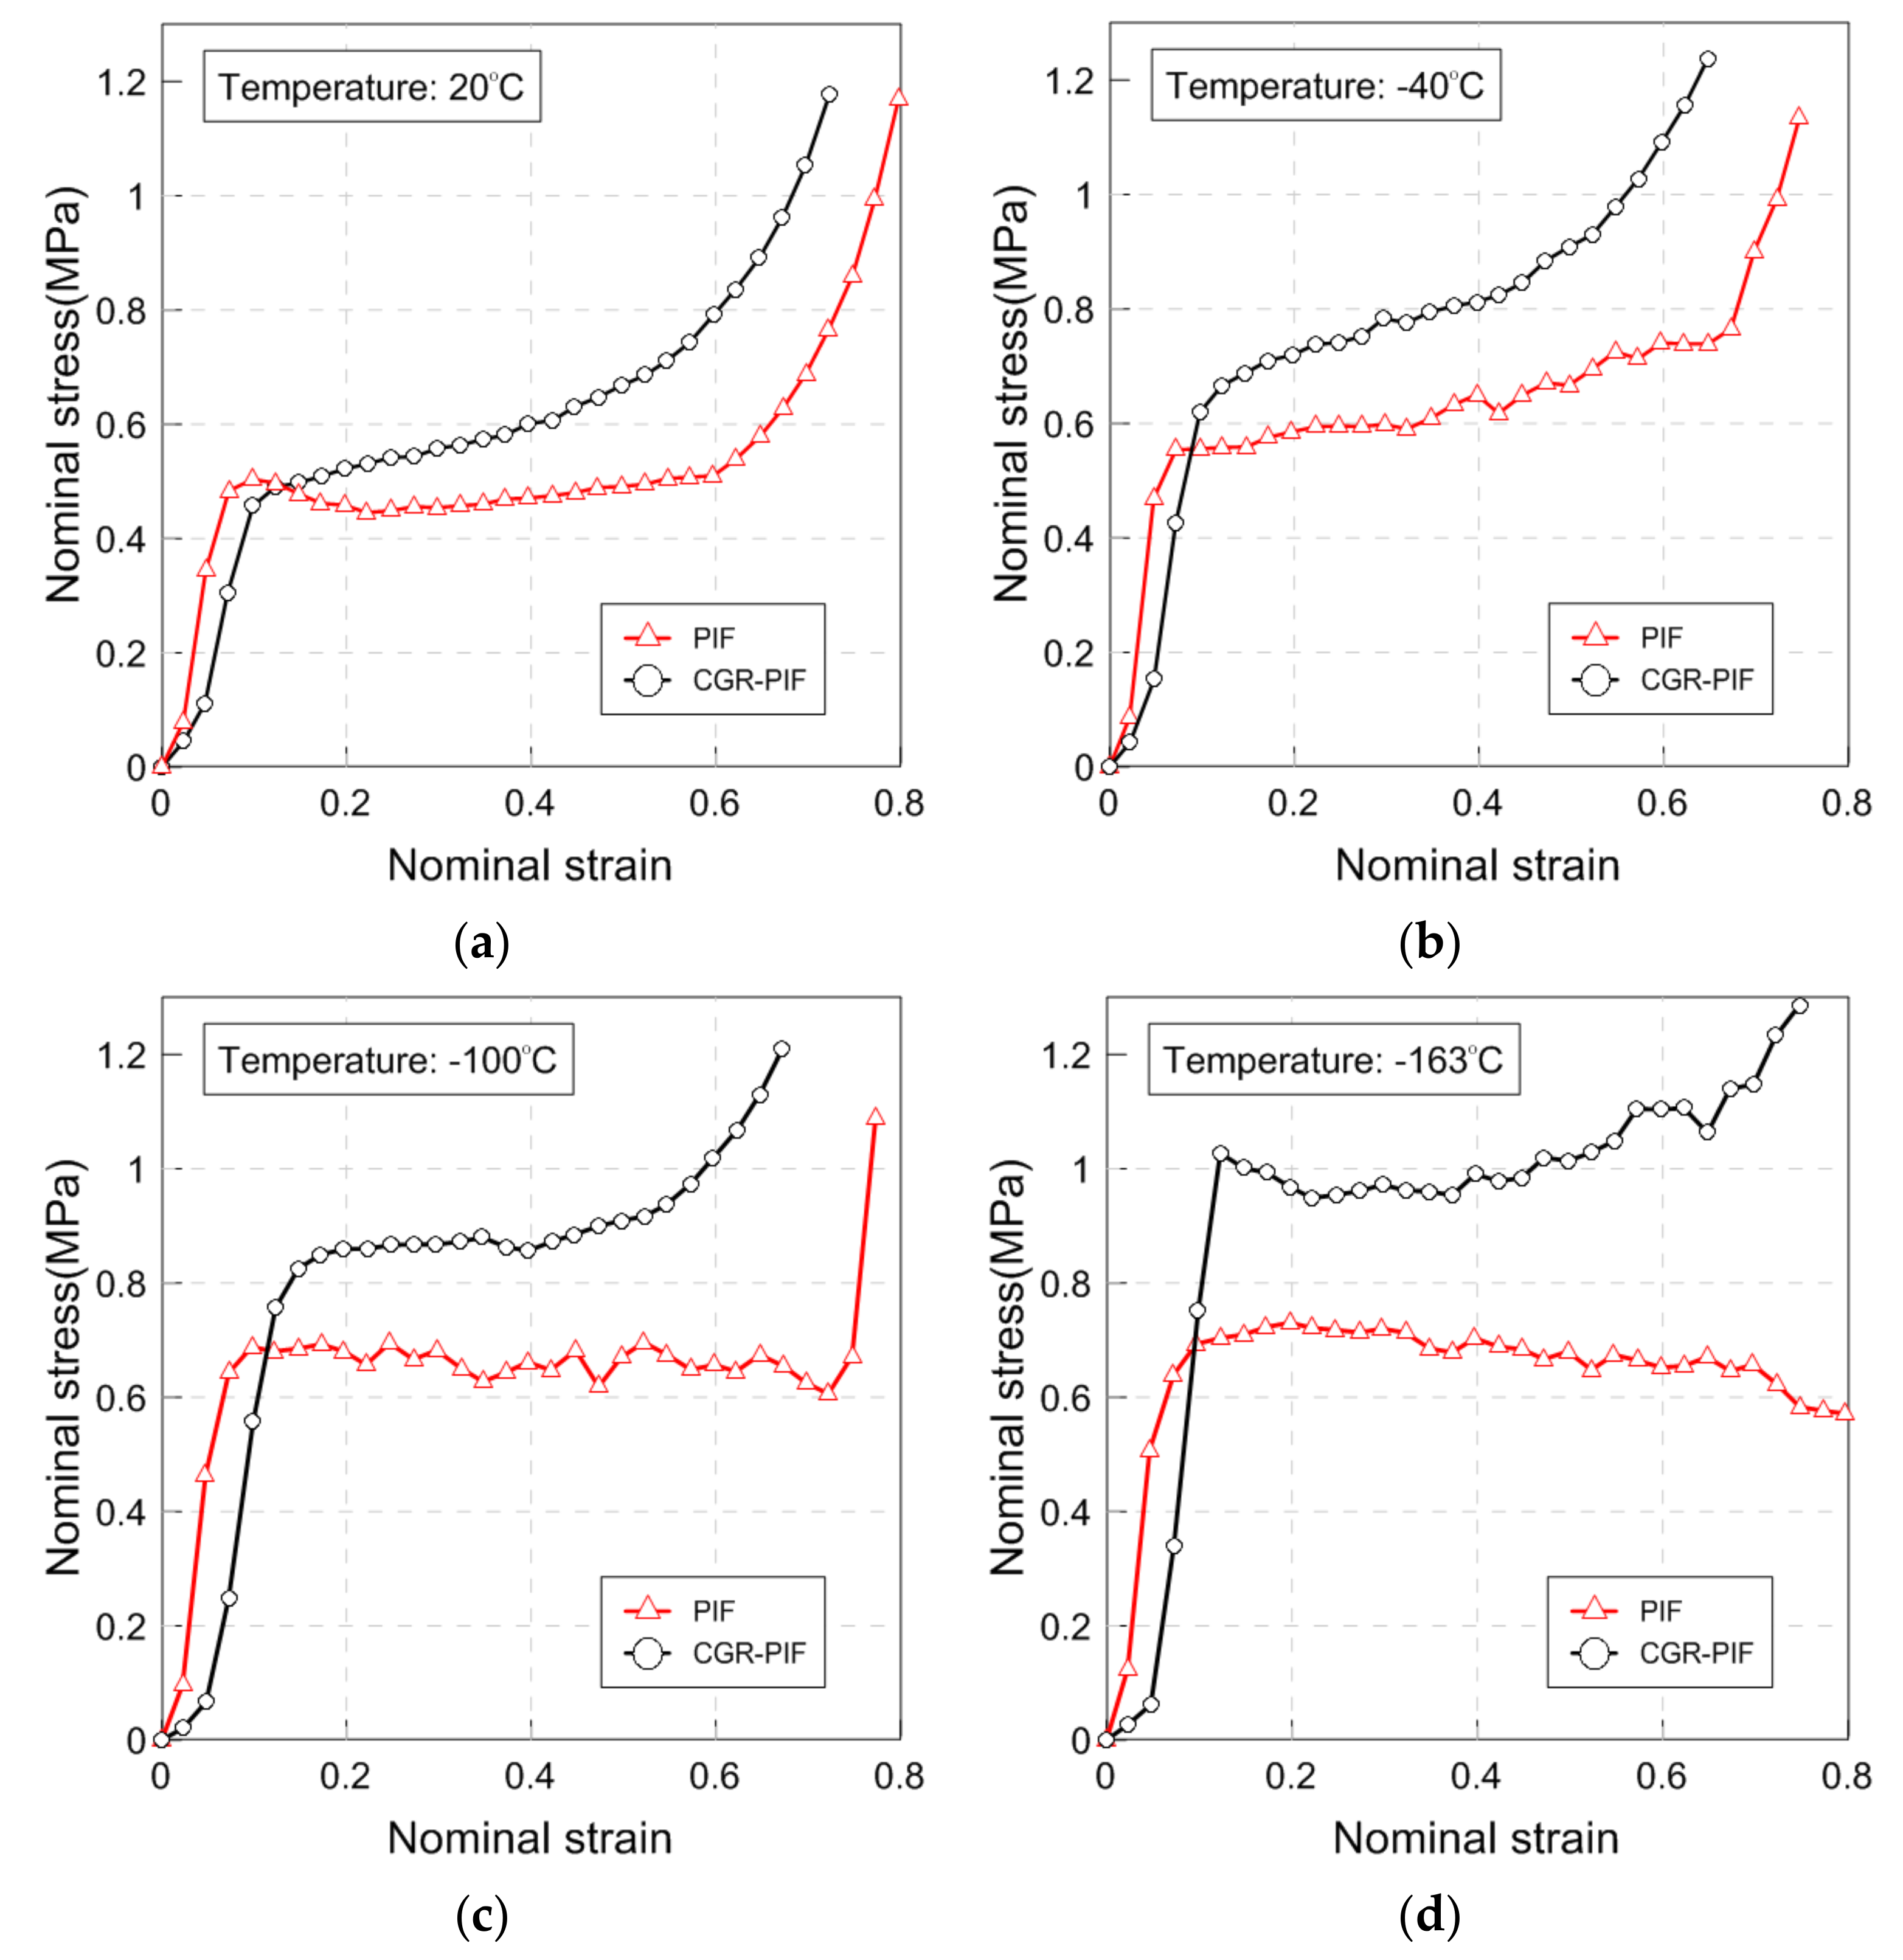
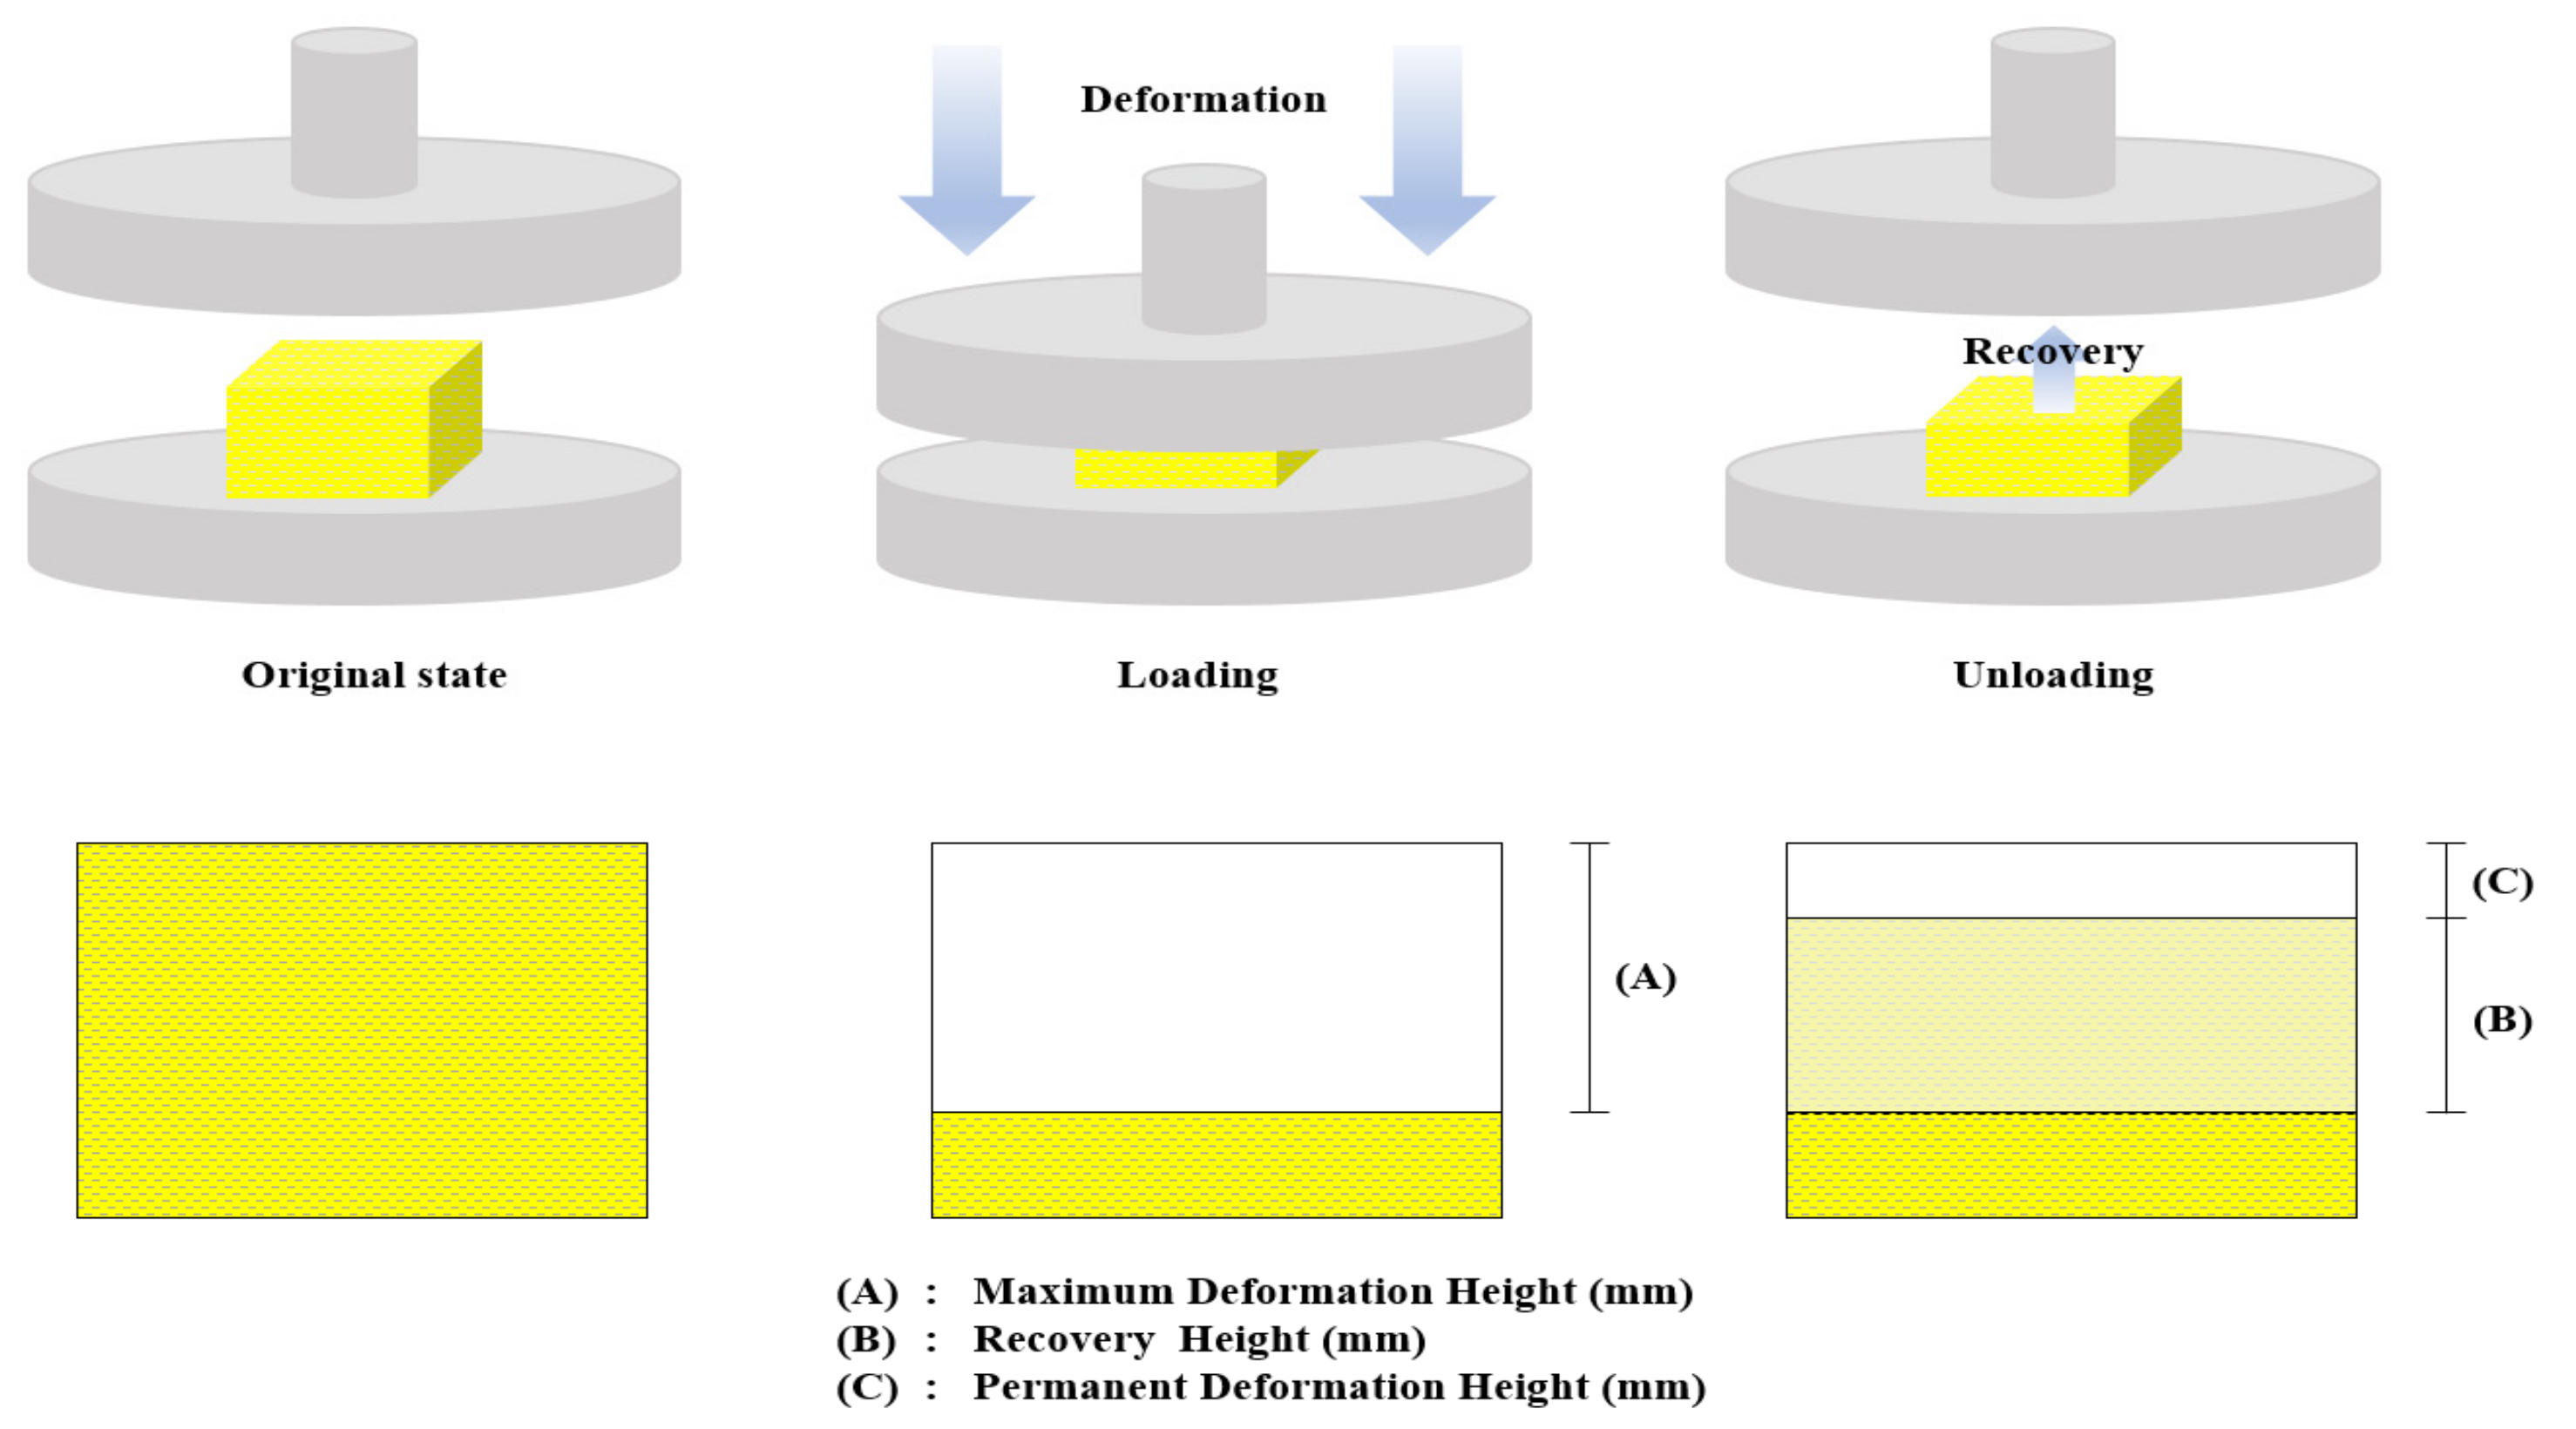
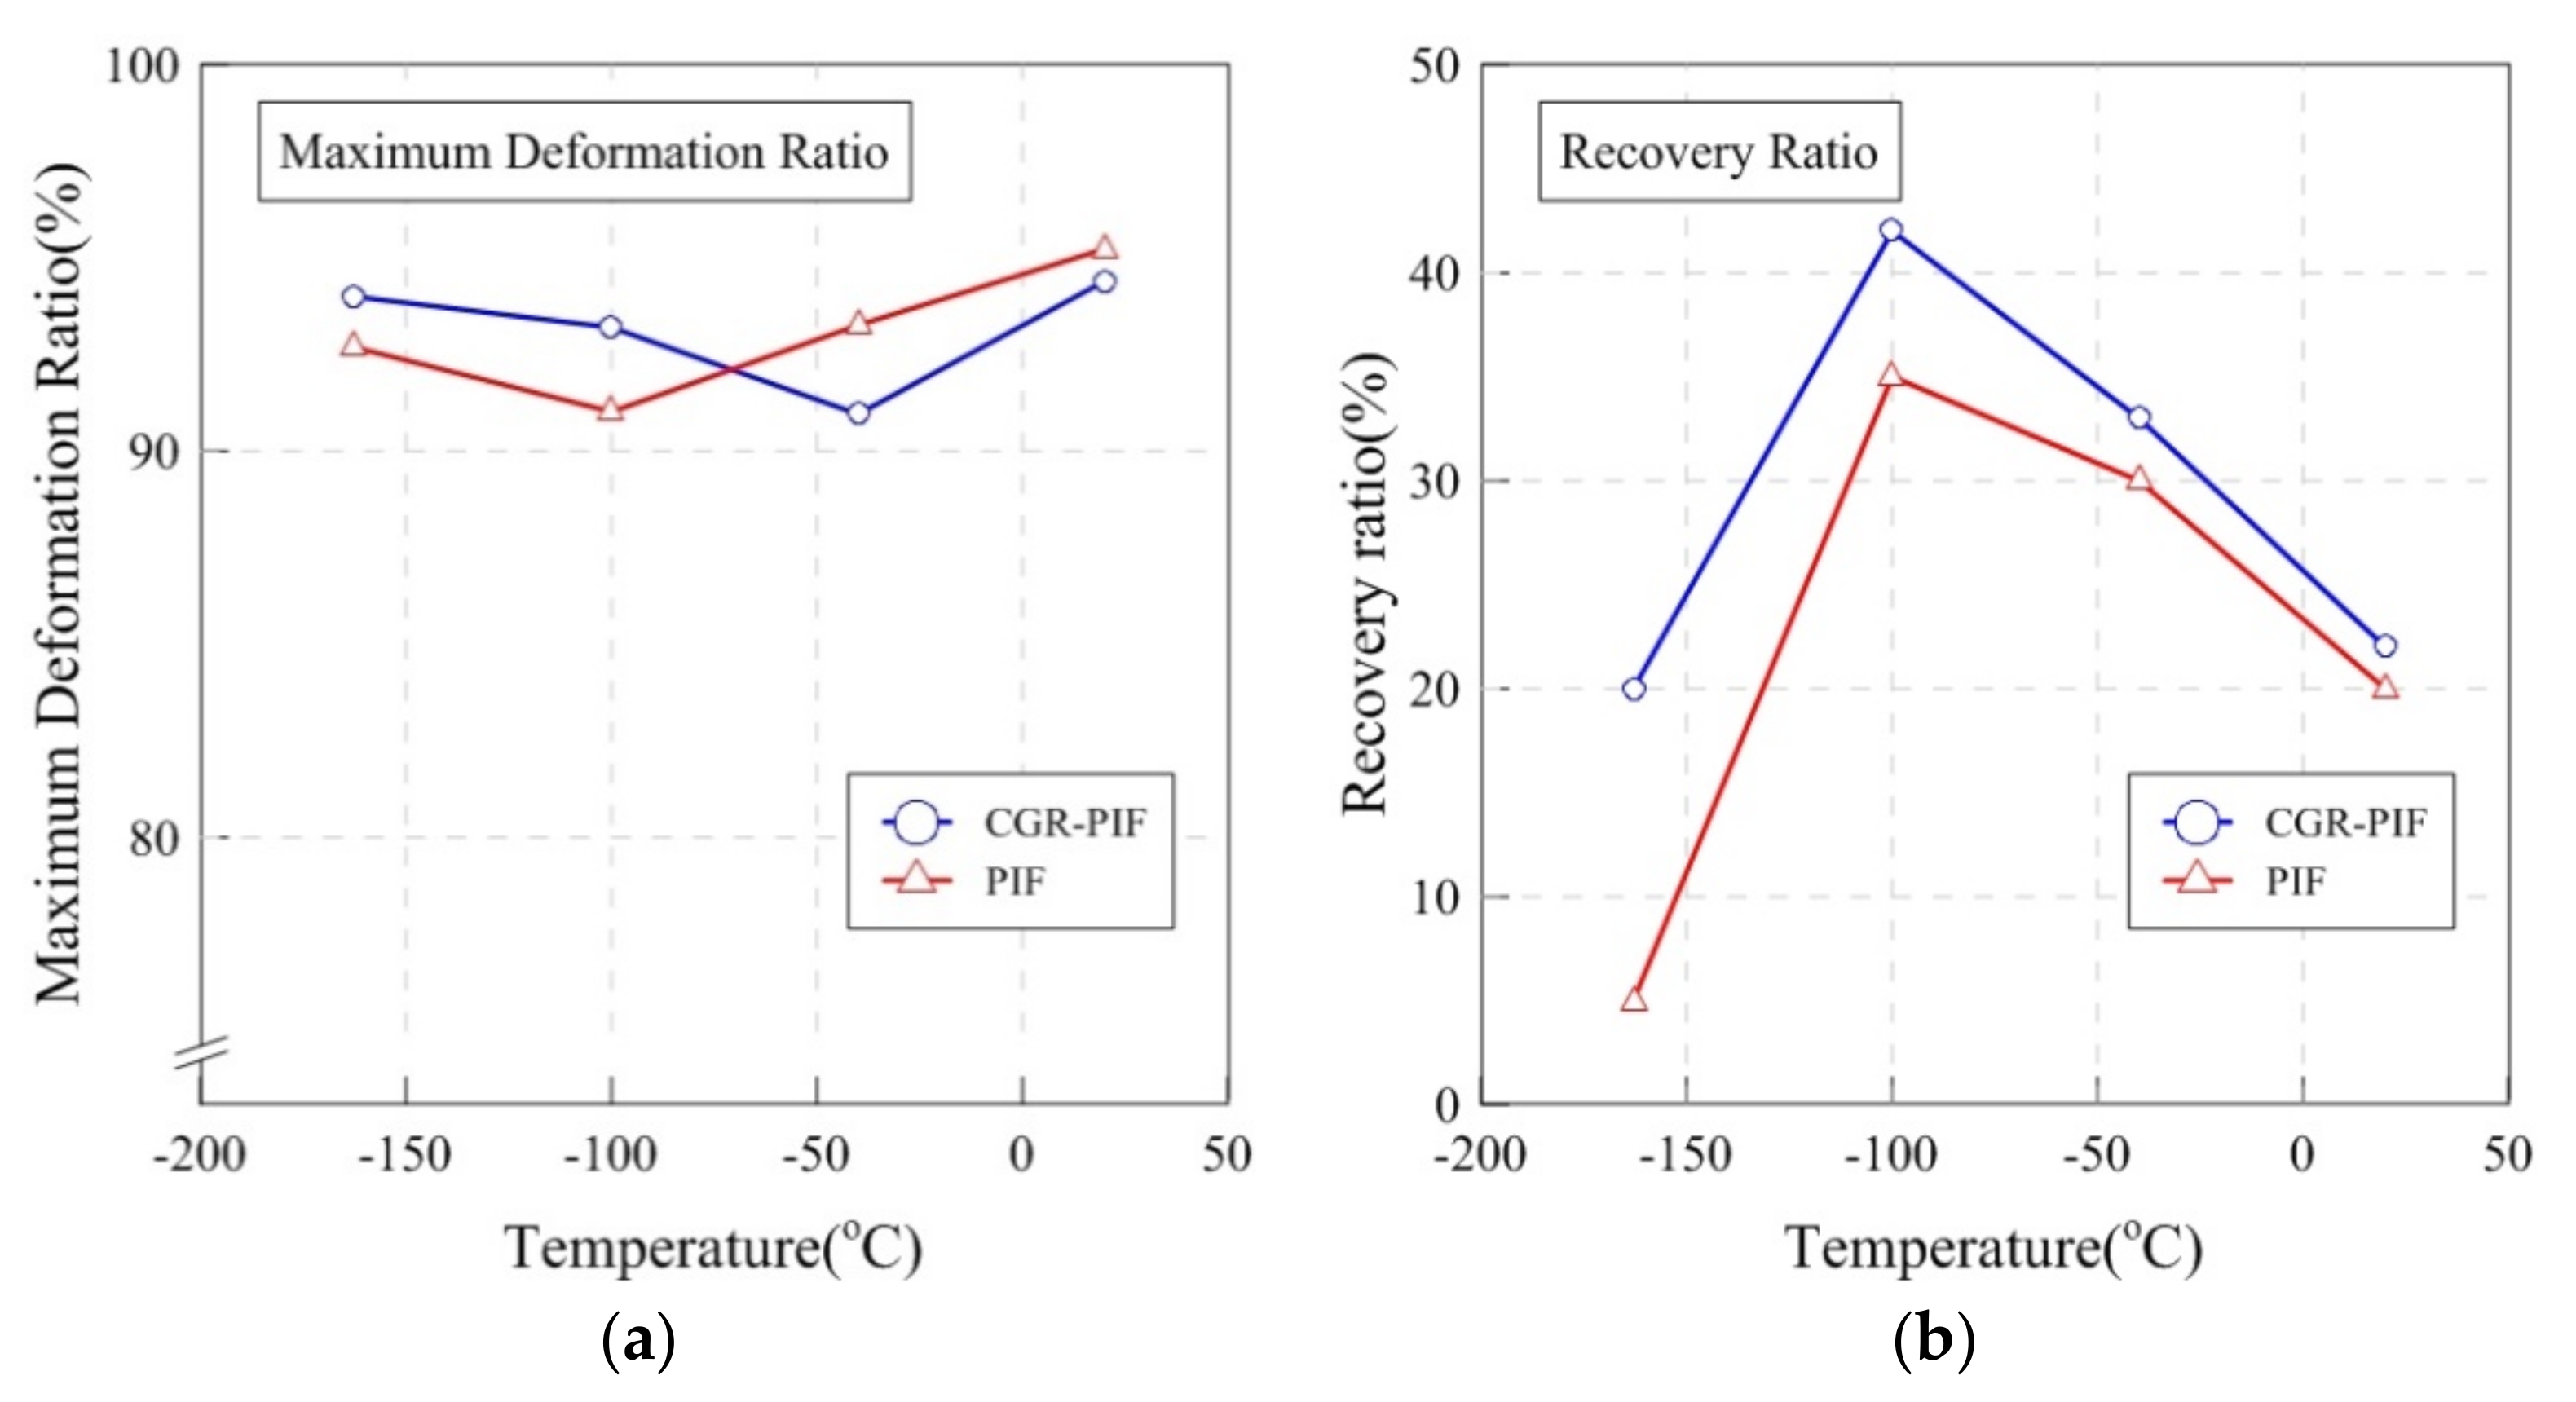
3.2. Deformation Behaviors
3.3. Mechanical Properties
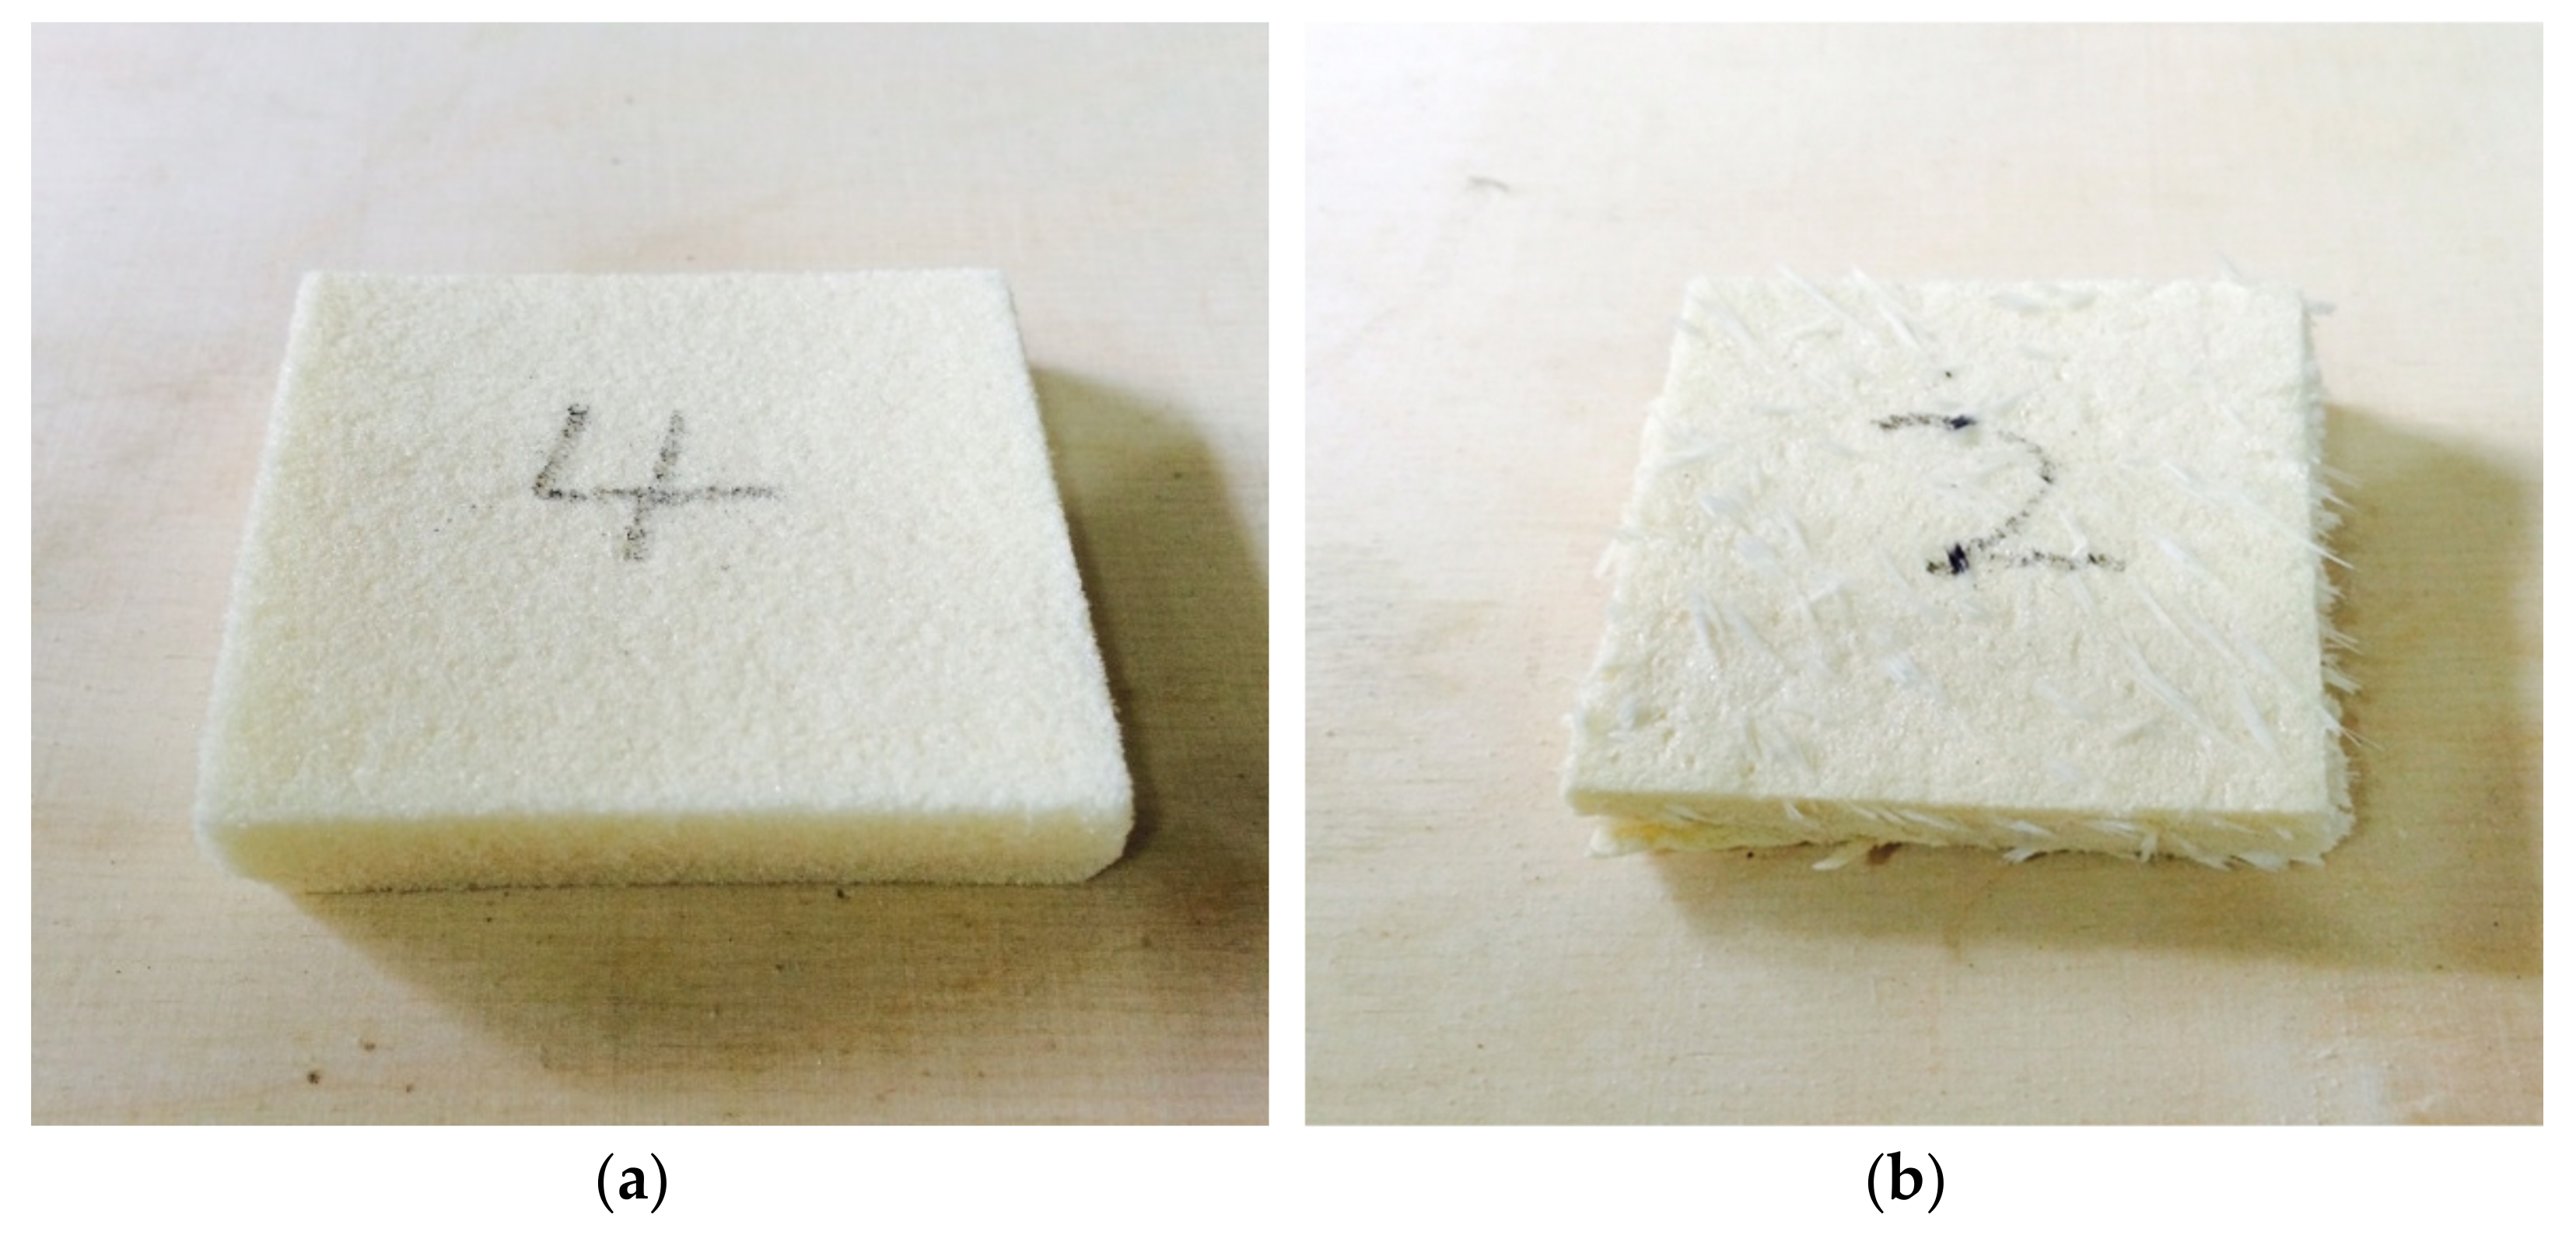
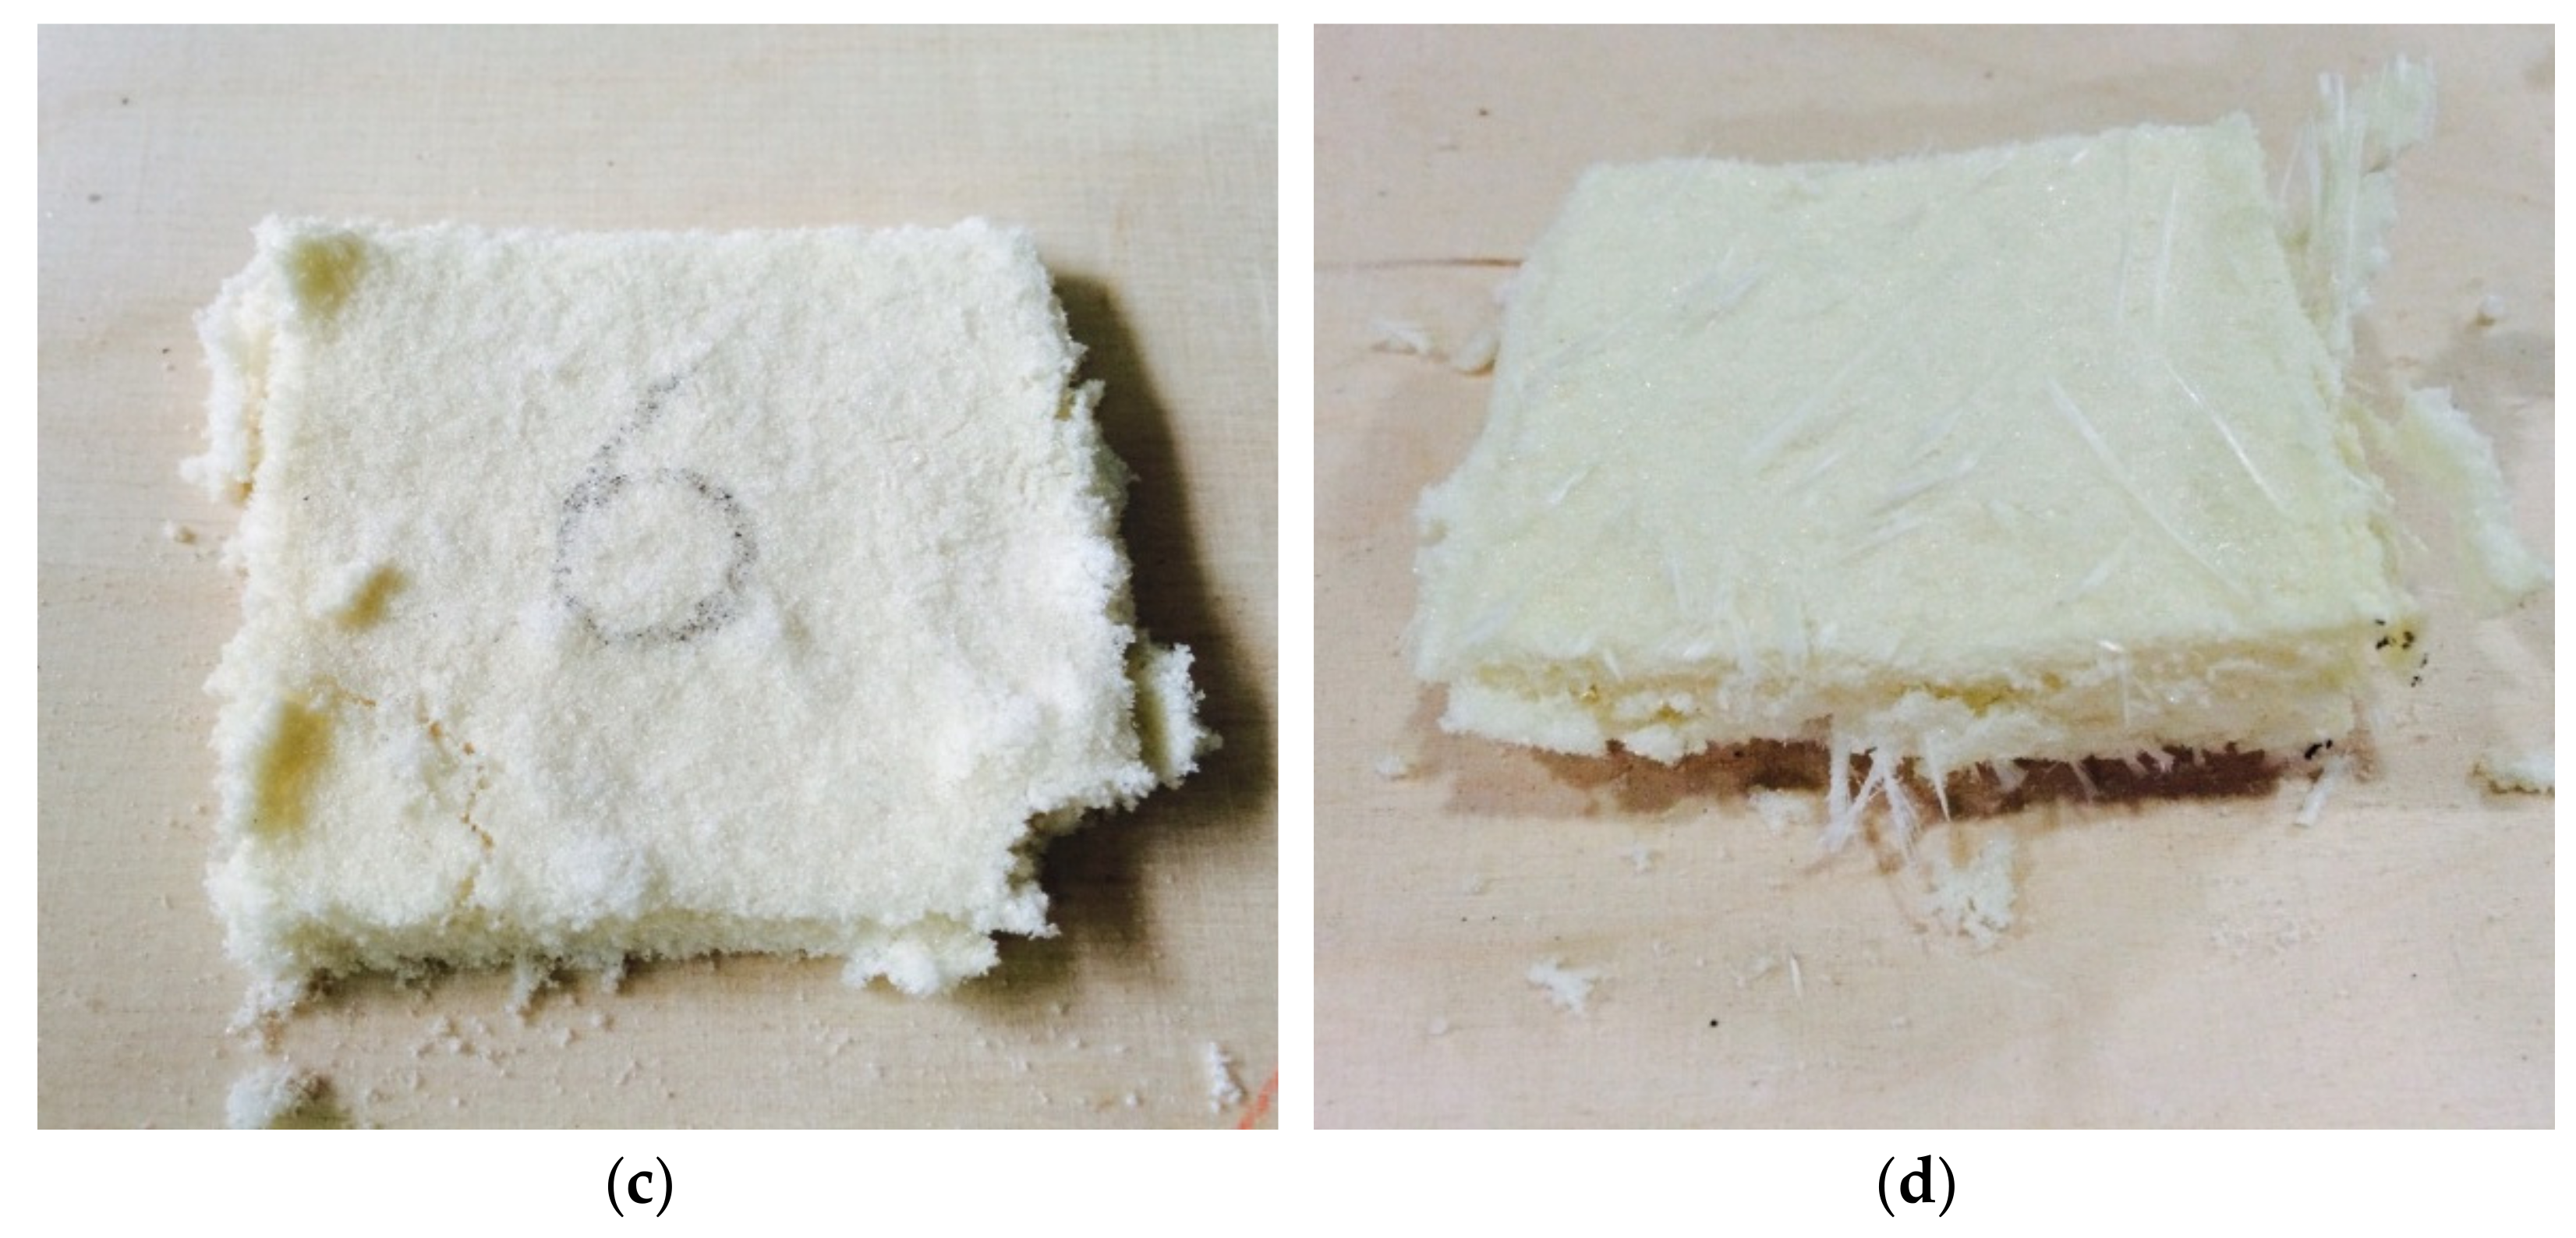
3.4. Failure Characteristics
3.5. Thermal Conductivity
4. Concluding Remarks
- In terms of a comparison of the shapes of the cells of the synthesized CGR-PIF and PIF, the cells of the PIF were found to be relatively uniform in shape, and the cells of the closed form were completely present. However, in the case of CGR-PIF, it is observed that the cell growth around the glass fiber was hindered by the glass fiber, and consequently, the cell size around the chopped glass fiber was relatively small.
- In terms of mechanical behavior of PIF and CGR-PIF, the difference in compressive strength increases as the temperature decreases. Considering that the density is the important parameter when the volume of LNG cargo containment system (CCS) is fixed, the mechanical performance of CGR-PIF at −163 °C is the most superior in terms of compressive strength, Young’s modulus, and specific energy. In fact, when a large load is applied to the PIF used in an LNG fuel CCS, it is better to use CGR-PIF without increasing the thickness of the PIF in terms of mechanical performance.
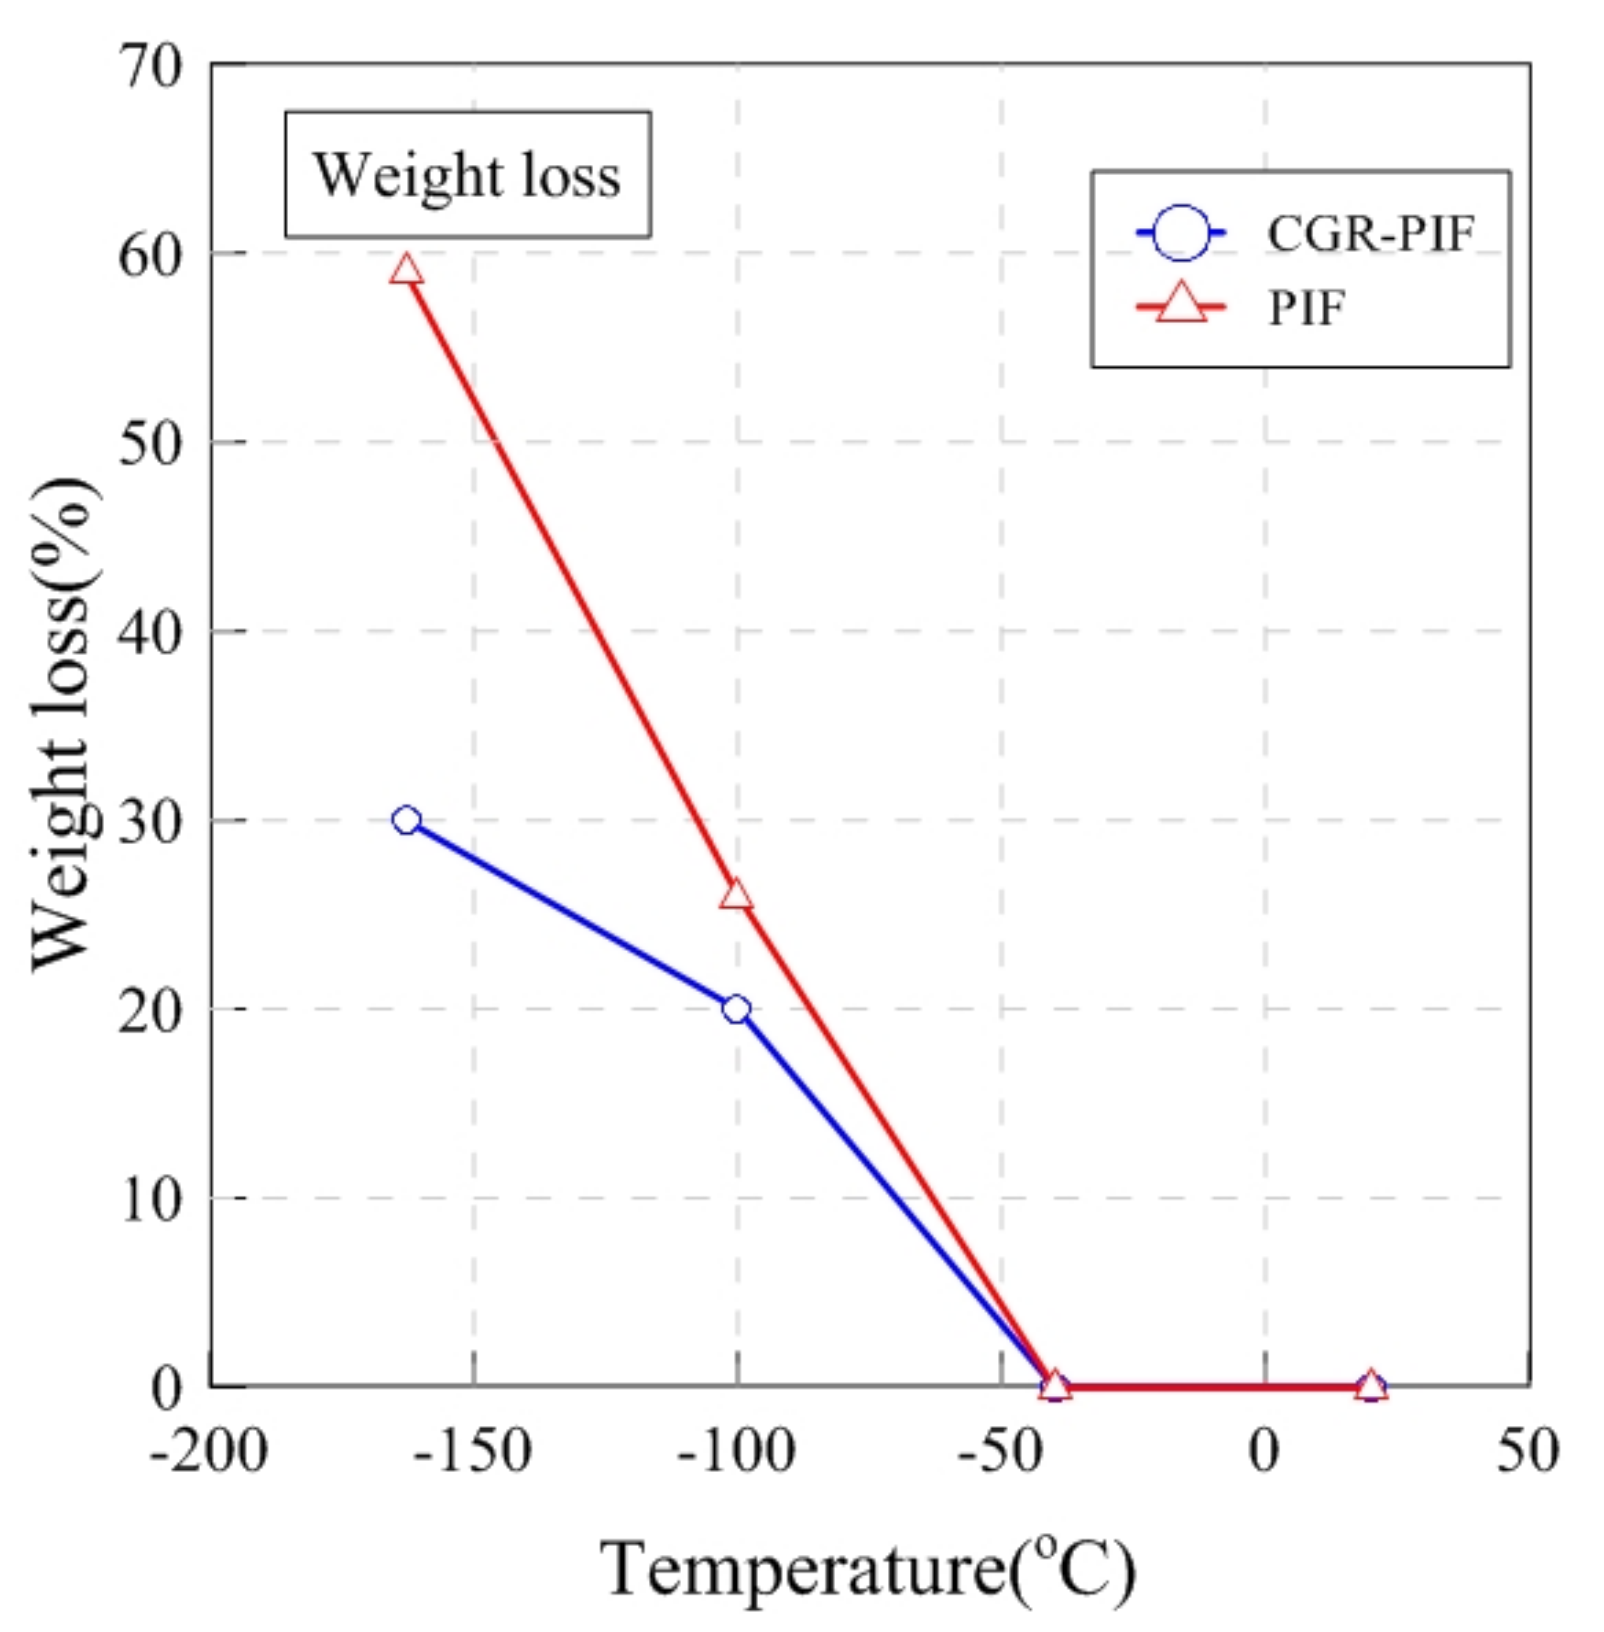
- In terms of failure characteristics, generally, the recovery ratio of CGR-PIF was higher than that of PIF. Especially at −163 °C, which is the temperature at which LNG is stored, it was confirmed that CGR-PIF recovered 20% whereas PIF recovered only slightly. Furthermore, in the evaluation of the degree of brittle fracture, the weight loss of PIF is found to be two times higher than that of CGR-PIF. Chopped glass fibers can compensate for the disadvantage of PIF becoming friable at −163 °C.
- In terms of thermal conductivity, it was confirmed that the insulation performance of PIF was lowered owing to the addition of chopped glass fibers.
Author Contributions
Funding
Institutional Review Board Statement
Informed Consent Statement
Data Availability Statement
Conflicts of Interest
References
- Ruehl, C.; Giljum, J. BP Energy Outlook 2030; Third Quarter; IAEE Energy Forum: Washington, DC, USA, 2011; pp. 7–10. [Google Scholar]
- Kumar, S.; Kwon, H.T.; Choi, K.H.; Hyun Cho, J.; Lim, W.; Moon, I. Current status and future projections of LNG demand and supplies: A global prospective. Energy Policy 2011, 39, 4097–4104. [Google Scholar] [CrossRef]
- Kanbur, B.B.; Xiang, L.; Dubey, S.; Choo, F.H.; Duan, F. Cold utilization systems of LNG: A review. Renew. Sustain. Energy Rev. 2017, 79, 1171–1188. [Google Scholar] [CrossRef]
- Querol, E.; Gonzalez-Regueral, B.; García-Torrent, J.; García-Martínez, M.J. Boil off gas (BOG) management in Spanish liquid natural gas (LNG) terminals. Appl. Energy 2010, 87, 3384–3392. [Google Scholar] [CrossRef]
- Malenica, S.; Diebold, L.; Kwon, S.H.; Cho, D.S. Sloshing assessment of the LNG floating units with membrane type containment system where we are? Mar. Struct. 2017, 56, 99–116. [Google Scholar] [CrossRef]
- Thirumal, M.; Khastgir, D.; Singha, N.K.; Manjunath, B.S.; Naik, Y.P. Effect of foam density on the properties of water blown rigid polyurethane foam. J. Appl. Polym. Sci. 2008, 108, 1810–1817. [Google Scholar] [CrossRef]
- Chun, M.S.; Kim, M.H.; Kim, W.S.; Kim, S.H.; Lee, J.M. Experimental investigation on the impact behavior of membrane-type LNG carrier insulation system. J. Loss Prev. Process Ind. 2009, 22, 901–907. [Google Scholar] [CrossRef]
- Park, S.B.; Lee, C.S.; Choi, S.W.; Kim, J.H.; Bang, C.S.; Lee, J.M. Polymeric foams for cryogenic temperature application: Temperature range for non-recovery and brittle-fracture of microstructure. Compos. Struct. 2016, 136, 258–269. [Google Scholar] [CrossRef]
- Berardi, U. The impact of temperature dependency of the building insulation thermal conductivity in the Canadian climate. Energy Procedia 2017, 132, 237–242. [Google Scholar] [CrossRef]
- Kim, J.M.; Kim, J.H.; Ahn, J.H.; Kim, J.D.; Park, S.; Park, K.H.; Lee, J.M. Synthesis of nanoparticle-enhanced polyurethane foams and evaluation of mechanical characteristics. Compos. Part B Eng. 2018, 136, 28–38. [Google Scholar] [CrossRef]
- Ulrich, H. Recent Advances in Isocyanurate Technology. J. Cell. Plast. 1981. [Google Scholar] [CrossRef]
- Panowicz, R.; Miedzińska, D. Numerical and experimental research on polyisocyanurate foam. Comput. Mater. Sci. 2012, 64, 126–129. [Google Scholar] [CrossRef]
- Goods, S.H.; Neuschwanger, C.L.; Henderson, C.C.; Skala, D.M. Mechanical properties of CRETE, a polyurethane foam. J. Appl. Polym. Sci. 1998, 68, 1045–1055. [Google Scholar] [CrossRef]
- Zhao, C.; Yan, Y.; Hu, Z.; Li, L.; Fan, X. Preparation and characterization of granular silica aerogel/polyisocyanurate rigid foam composites. Constr. Build. Mater. 2015, 93, 309–316. [Google Scholar] [CrossRef]
- Tran, V.H.; Kim, J.D.; Kim, J.H.; Kim, S.K.; Lee, J.M. Influence of Cellulose Nanocrystal on the Cryogenic Mechanical Behavior and Thermal Conductivity of Polyurethane Composite. J. Polym. Environ. 2020. [Google Scholar] [CrossRef]
- Han, D.S.; Park, I.B.; Kim, M.H.; Noh, B.J.; Kim, W.S.; Lee, J.M. The effects of glass fiber reinforcement on the mechanical behavior of polyurethane foam. J. Mech. Sci. Technol. 2010, 24, 263–266. [Google Scholar] [CrossRef]
- Siegmann, A.; Kenig, S.; Alperstein, D.; Narkis, M. Mechanical behavior of reinforced polyurethane foams. Polym. Compos. 1983, 4, 113–119. [Google Scholar] [CrossRef]
- Şerban, D.A.; Weissenborn, O.; Geller, S.; Marşavina, L.; Gude, M. Evaluation of the mechanical and morphological properties of long fibre reinforced polyurethane rigid foams. Polym. Test. 2016, 49, 121–127. [Google Scholar] [CrossRef]
- Gluck, D.G.; Hagan, J.R.; Hipchen, D.E. Glass Fiber Reinforced Isocyanurate-Urethane Foams. J. Cell. Plast. 1980, 16, 159–170. [Google Scholar] [CrossRef]
- Zhao, Y.H.; Wu, Z.K.; Bai, S.L. Thermal resistance measurement of 3D graphene foam/polymer composite by laser flash analysis. Int. J. Heat Mass Transf. 2016, 101, 470–475. [Google Scholar] [CrossRef]
- Dawson, J.R.; Shortall, J.B. The microstructure of rigid polyurethane foams. J. Mater. Sci. 1982. [Google Scholar] [CrossRef]
- Gibson, L.J.; Ashby, M.F. Cellular Solids: Structure and Properties, 2nd ed.; Cambridge University Press: Cambridge, UK, 2014; ISBN 9781139878326. [Google Scholar]
- Kim, S.H.; Park, H.C.; Jeong, H.M.; Kim, B.K. Glass fiber reinforced rigid polyurethane foams. J. Mater. Sci. 2010, 45, 2675–2680. [Google Scholar] [CrossRef]
- Jung, H.C.; Ryu, S.C.; Kim, W.N.; Lee, Y.B.; Choe, K.H.; Kim, S.B. Properties of rigid polyurethane foams blown by HCFC 141B and distilled water. J. Appl. Polym. Sci. 2001, 81, 486–493. [Google Scholar] [CrossRef]
- Chuang, Y.C.; Li, T.T.; Huang, C.H.; Huang, C.L.; Lou, C.W.; Chen, Y.S.; Lin, J.H. Protective rigid fiber-reinforced polyurethane foam composite boards: Sound absorption, drop-weight impact and mechanical properties. Fibers Polym. 2016, 17, 2116–2123. [Google Scholar] [CrossRef]
- Barczewski, M.; Kurańska, M.; Sałasińska, K.; Michałowski, S.; Prociak, A.; Uram, K.; Lewandowski, K. Rigid polyurethane foams modified with thermoset polyester-glass fiber composite waste. Polym. Test. 2020, 81, 106190. [Google Scholar] [CrossRef]
- Mane, J.V.; Chandra, S.; Sharma, S.; Ali, H.; Chavan, V.M.; Manjunath, B.S.; Patel, R.J. Mechanical Property Evaluation of Polyurethane Foam under Quasi-static and Dynamic Strain Rates- An Experimental Study. Procedia Eng. 2017, 173, 726–731. [Google Scholar] [CrossRef]
- Saha, M.C.; Mahfuz, H.; Chakravarty, U.K.; Uddin, M.; Kabir, M.E.; Jeelani, S. Effect of density, microstructure, and strain rate on compression behavior of polymeric foams. Mater. Sci. Eng. A 2005, 406, 328–336. [Google Scholar] [CrossRef]
- Tu, Z.H.; Shim, V.P.W.; Lim, C.T. Plastic deformation modes in rigid polyurethane foam under static loading. Int. J. Solids Struct. 2001, 38, 9267–9279. [Google Scholar] [CrossRef]
- Subhash, G.; Liu, Q.; Gao, X.L. Quasistatic and high strain rate uniaxial compressive response of polymeric structural foams. Int. J. Impact Eng. 2006, 32, 1113–1126. [Google Scholar] [CrossRef]
- Avalle, M.; Belingardi, G.; Montanini, R. Characterization of polymeric structural foams under compressive impact loading by means of energy-absorption diagram. Int. J. Impact Eng. 2001, 25, 455–472. [Google Scholar] [CrossRef]
- Li, P.; Guo, Y.B.; Zhou, M.W.; Shim, V.P.W. Response of anisotropic polyurethane foam to compression at different loading angles and strain rates. Int. J. Impact Eng. 2019, 127, 154–168. [Google Scholar] [CrossRef]
- Park, S.B.; Choi, S.W.; Kim, J.H.; Bang, C.S.; Lee, J.M. Effect of the blowing agent on the low-temperature mechanical properties of CO2- and HFC-245fa-blown glass-fiber-reinforced polyurethane foams. Compos. Part B Eng. 2016, 93, 317–327. [Google Scholar] [CrossRef]
- Lee, J.H.; Kim, S.K.; Park, S.; Park, K.H.; Lee, J.M. Unified constitutive model with consideration for effects of porosity and its application to polyurethane foam. Compos. Part B Eng. 2018, 138, 87–100. [Google Scholar] [CrossRef]
- Goods, S.H.; Neuschwanger, C.L.; Whinnery, L.L.; Nix, W.D. Mechanical properties of a particle-strengthened polyurethane foam. J. Appl. Polym. Sci. 1999, 74, 2724–2736. [Google Scholar] [CrossRef]
- Yu, Y.H.; Choi, I.; Nam, S.; Lee, D.G. Cryogenic characteristics of chopped glass fiber reinforced polyurethane foam. Compos. Struct. 2014, 107, 476–481. [Google Scholar] [CrossRef]
- Shen, H.; Nutt, S. Mechanical characterization of short fiber reinforced phenolic foam. Compos. Part A Appl. Sci. Manuf. 2003, 34, 899–906. [Google Scholar] [CrossRef]
- Mehdikhani, M.; Gorbatikh, L.; Verpoest, I.; Lomov, S.V. Voids in fiber-reinforced polymer composites: A review on their formation, characteristics, and effects on mechanical performance. J. Compos. Mater. 2019, 53, 1579–1669. [Google Scholar] [CrossRef]
- Dutta, P.K. Low-Temperature Compressive Strength of Glass-Fiber-Reinforced Polymer Composites. J. Offshore Mech. Arct. Eng. 1994, 116, 167–172. [Google Scholar] [CrossRef]
- Choi, S.W.; Roh, J.U.; Kim, M.S.; Lee, W.I. Analysis of two main LNG CCS (cargo containment system) insulation boxes for leakage safety using experimentally defined thermal properties. Appl. Ocean Res. 2012, 37, 72–89. [Google Scholar] [CrossRef]
- Hejna, A.; Kosmela, P.; Kirpluks, M.; Cabulis, U.; Klein, M.; Haponiuk, J.; Piszczyk, Ł. Structure, Mechanical, Thermal and Fire Behavior Assessments of Environmentally Friendly Crude Glycerol-Based Rigid Polyisocyanurate Foams. J. Polym. Environ. 2018, 26, 1854–1868. [Google Scholar] [CrossRef] [Green Version]
- Mosiewicki, M.A.; Dell’Arciprete, G.A.; Aranguren, M.I.; Marcovich, N.E. Polyurethane foams obtained from castor oil-based polyol and filled with wood flour. J. Compos. Mater. 2009, 43, 3057–3072. [Google Scholar] [CrossRef]


| Property | Unit |
|---|---|
| Hydroxyl number | 238 mg KOH/g |
| Density | 1.23 g/cm3 |
| Viscosity | 3300 mPas |
| Water content | 0.1 wt.% |
| Characteristics | Unit |
|---|---|
| Thermal Expansion Coefficient | 9 × 10⁻⁶ /K |
| Density | 2.8 × 10⁻³ kg/m3 |
| Tensile Strength | 1.5 GN/m2 |
| Young’s modulus | 74 GN/m2 |
| Strain to failure | 2% |
| Diameter | 10 m |
| Materials | PIF | CGR-PIF |
|---|---|---|
| Polyol mixture | 1000 g | 1000 g |
| Polymeric M50 | 1800 g | 1800 g |
| Glass fiber | - | 500 g |
| Mixing RPM | 6000 rpm | 6000 rpm |
| Mixing time | 15 s | 15 s |
| Mixing temperature | 23 °C | 23 °C |
| Gel time(s) | 150 s | 150 s |
| Density | 59 kg/m3 | 75 kg/m3 |
| Material | Glass Fiber (wt.%) | Temperature (°C) | Specimen(EA) |
|---|---|---|---|
| PIF | 0 | −20 | 5 |
| −40 | 5 | ||
| −100 | 5 | ||
| −163 | 5 | ||
| CGR-PIF | 15 | −20 | 5 |
| −40 | 5 | ||
| −100 | 5 | ||
| −163 | 5 |
| Material | Directions | Ave. Cell Size (μm) | Max. Cell Size (μm) | Standard Deviation (μm) |
|---|---|---|---|---|
| PIF | Perpendicular to foaming direction | 366 | 510 | 81 |
| Parallel to foaming direction | 335 | 600 | 131 | |
| CGR-PIF | Perpendicular to foaming direction | 283 | 420 | 79 |
| Parallel to foaming direction | 241 | 350 | 57 |
| Material | Temperature (°C) | Young’s Modulus (MPa) | Yield Stress (MPa) | Specific Energy (mJ/mm3) |
|---|---|---|---|---|
| PIF | 20 | 5.126 | 0.503 | 0.273 |
| −40 | 7.727 | 0.554 | 0.358 | |
| −100 | 8.852 | 0.643 | 0.382 | |
| −163 | 5.735 | 0.703 | 0.396 | |
| CGR-PIF | 20 | 4.632 | 0.457 | 0.322 |
| −40 | 5.466 | 0.666 | 0.443 | |
| −100 | 6.658 | 0.850 | 0.463 | |
| −163 | 8.368 | 1.027 | 0.528 |
| Material | Density (g/cm3) | Diffusivity (mm2/s) | Specific Heat (J/g/K) | Thermal Conductivity (W/m·K) |
|---|---|---|---|---|
| PIF | 0.0586 | 0.4246 | 1.077 | 0.0268 |
| CGR-PIF | 0.0757 | 0.3572 | 1.3004 | 0.0352 |
Publisher’s Note: MDPI stays neutral with regard to jurisdictional claims in published maps and institutional affiliations. |
© 2021 by the authors. Licensee MDPI, Basel, Switzerland. This article is an open access article distributed under the terms and conditions of the Creative Commons Attribution (CC BY) license (http://creativecommons.org/licenses/by/4.0/).
Share and Cite
Kim, J.-D.; Kim, J.-H.; Lee, D.-H.; Yeom, D.-J.; Lee, J.-M. Synthesis and Investigation of Cryogenic Mechanical Properties of Chopped-Glass-Fiber-Reinforced Polyisocyanurate Foam. Materials 2021, 14, 446. https://0-doi-org.brum.beds.ac.uk/10.3390/ma14020446
Kim J-D, Kim J-H, Lee D-H, Yeom D-J, Lee J-M. Synthesis and Investigation of Cryogenic Mechanical Properties of Chopped-Glass-Fiber-Reinforced Polyisocyanurate Foam. Materials. 2021; 14(2):446. https://0-doi-org.brum.beds.ac.uk/10.3390/ma14020446
Chicago/Turabian StyleKim, Jeong-Dae, Jeong-Hyeon Kim, Dong-Ha Lee, Dong-Ju Yeom, and Jae-Myung Lee. 2021. "Synthesis and Investigation of Cryogenic Mechanical Properties of Chopped-Glass-Fiber-Reinforced Polyisocyanurate Foam" Materials 14, no. 2: 446. https://0-doi-org.brum.beds.ac.uk/10.3390/ma14020446