An Analytical Model for Estimating the Bending Curvatures of Metal Sheets in Laser Peen Forming


1
School of Mechanical Engineering, Jiangsu University, Xuefu Road, Zhenjiang 212013, China
2
Institute of Micro-Nano Optoelectronics and Terahertz Technology, Jiangsu University, Xuefu Road, Zhenjiang 212013, China
3
Laser Processing Research Centre, School of Mechanical, Aerospace and Civil Engineering, The University of Manchester, Manchester M13 9PL, UK
*
Author to whom correspondence should be addressed.
Materials 2021, 14(2), 462; https://0-doi-org.brum.beds.ac.uk/10.3390/ma14020462
Submission received: 27 November 2020
/
Revised: 5 January 2021
/
Accepted: 14 January 2021
/
Published: 19 January 2021
(This article belongs to the Special Issue Metal Forming and Forging)
Abstract
:Laser peen forming (LPF) is suitable for shaping sheet metals without the requirement for die/mold and without causing high temperatures. An analytical model for estimating the bending curvatures of LPF is convenient and necessary for better understanding of the physical processes involved. In this paper, we describe a new analytical model based on internal force balance and the energy transformation in LPF. Experiments on 2024 aluminum alloy sheets of 1–3 mm thickness were performed to validate the analytical model. The results showed that for 1 mm and 3 mm thick–thin plates, the curvature obtained by the analytical model changes from −14 × 10−4 mm−1 and −1 × 10⁻⁴ mm−1 to 55 × 10−4 mm−1 and −21 × 10−4 mm−1, respectively, with the increase of laser energy, which is consistent with the experimental trend. So, when either the stress gradient mechanism (SGM) or the shock bending mechanism (SBM) overwhelmingly dominated the forming process, the analytical model could give relatively accurate predicted curvatures compared with the experimental data. Under those conditions where SGM and SBM were comparable, the accuracy of the model was low, because of the complex stress distributions within the material, and the complex energy coupling process under these conditions.
1. Introduction
Laser peen forming (LPF) has attracted a great amount of attention from both industry and academia in recent years due to its technological advantages. Comparing with traditional die-/mold-based forming and laser hot forming, it has the advantages of being die-/mold-free and noncontact, and has the further advantages of capability of forming thick and large sheets and production of complex geometry without generating heat-affected zones. Typical applications of LPF include forming of aircraft skins, wings, nose wings of bullet trains, and rocket fuel tanks.
The first report of laser peen forming was in 2002 by Hackle et al. [1], who proposed that the technology was especially suitable for forming sheets with a thickness greater than 3/4 inches that were difficult to form with traditional methods. Zhou et al. [2] investigated key process parameters on the convex bending of 6061-T6 aluminum alloy. They observed that the obtained plate arc height varied with number of laser shocks and the plate thickness. Wang et al. [3] conducted LPF experiments on 100 μm copper foils and found that the foil curvatures could evolve from concave to convex by changing the laser intensity from 3.57 GW/cm2 to 4.95 GW/cm2. The top and bottom surface residual stresses under these two conditions were also different. The factors that would affect the component geometry include: inertia after the laser peening forming, bending moment, and induced compressive stress. Hu et al. [4] observed both concave and convex curvature formation in laser peen forming of aluminum sheets of 0.5 mm to 2.25 mm in thickness. They observed that convex deformation was mainly due to stress gradient mechanism (SGM), while shock bending mechanism (SBM) was responsible for concave deformation. A three-dimensional numerical model was developed by them to simulate laser induced stress for understanding the mechanisms involved [5]. Zhou et al. [6] conducted numerical simulation based on finite element modeling (FEM) using ABAQUS and investigated the characteristics of residual stresses before and after laser peen forming. Yu et al. [7] developed an analytical model for the convex bending of laser shock forming with a uniform rectangular laser beam spot based on the biharmonic equations.
So far, many scholars have studied the law of laser shot peening and explored their application [8,9,10,11], but seldom do they conduct theoretical research on numerical analysis of the bending curvature of the sheet after laser shot peening. Although experiments and numerical simulations are helpful for understanding the behavior of the laser peen forming process and key factors affecting the geometry, an analytical model would provide more insight into the fundamental physical processes taking place in the process. At the same time, for engineering applications, there is an urgent need to construct a curvature analytical formula to more conveniently predict the bending results of the plate before the experiment or even the actual production application.
In this paper, we present a new analytical model for the prediction of both convex and concave deformation of metallic sheets through laser peen forming. Experiments were conducted to validate the model, and a detailed discussion of the process physical phenomena and mechanisms is given.
2. Mechanisms of Laser Peen Forming
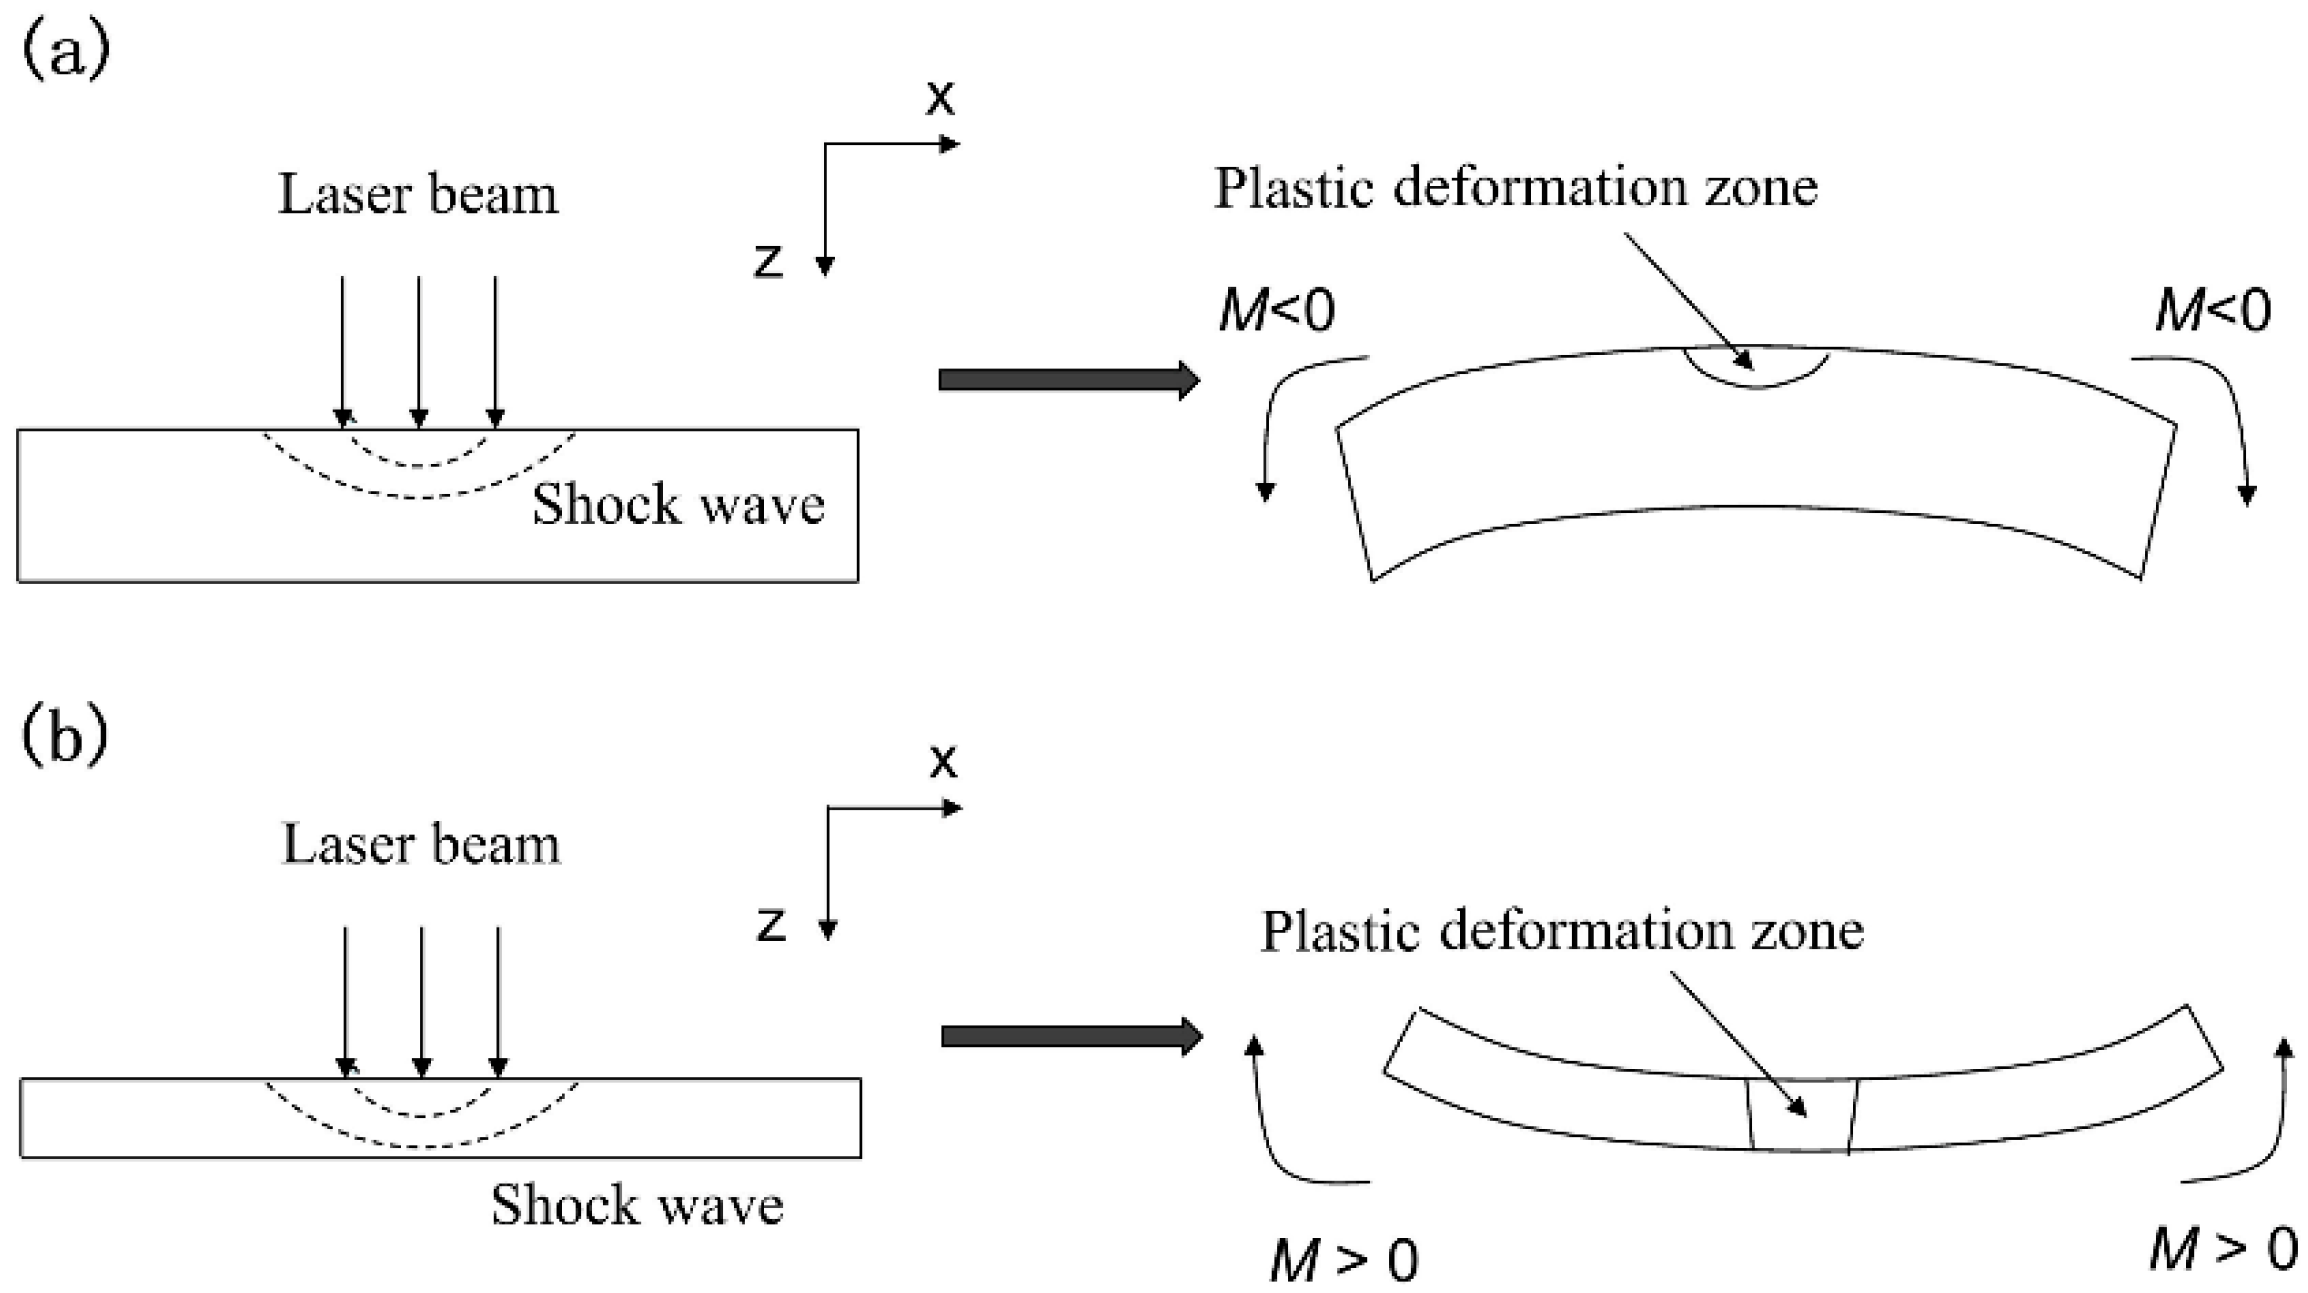
There exist two possible material deformations in laser peen forming [4], as illustrated in Figure 1. When the target sheet is thick or the laser intensity is moderate, the laser-induced shock wave can only induce plastic deformation and compressive residual stress in a thin layer of the target surface and elastic deformation is developed beneath the plastic deformation zone, which will cause a negative moment M, as shown in Figure 1a. Under this condition, the sheet will be bent in a convex mode. This bending mechanism is called the stress gradient mechanism (SGM). When the target sheet is thin or laser intensity is sufficiently high, a laser-induced shock wave can transmit through the overall sheet thickness, causing a positive moment M. The sheet will be bent in a concave mode, shown in Figure 1b. This mechanism is called the shock bending mechanism (SBM).
3. Theoretical Formulation
3.1. Convex Bending
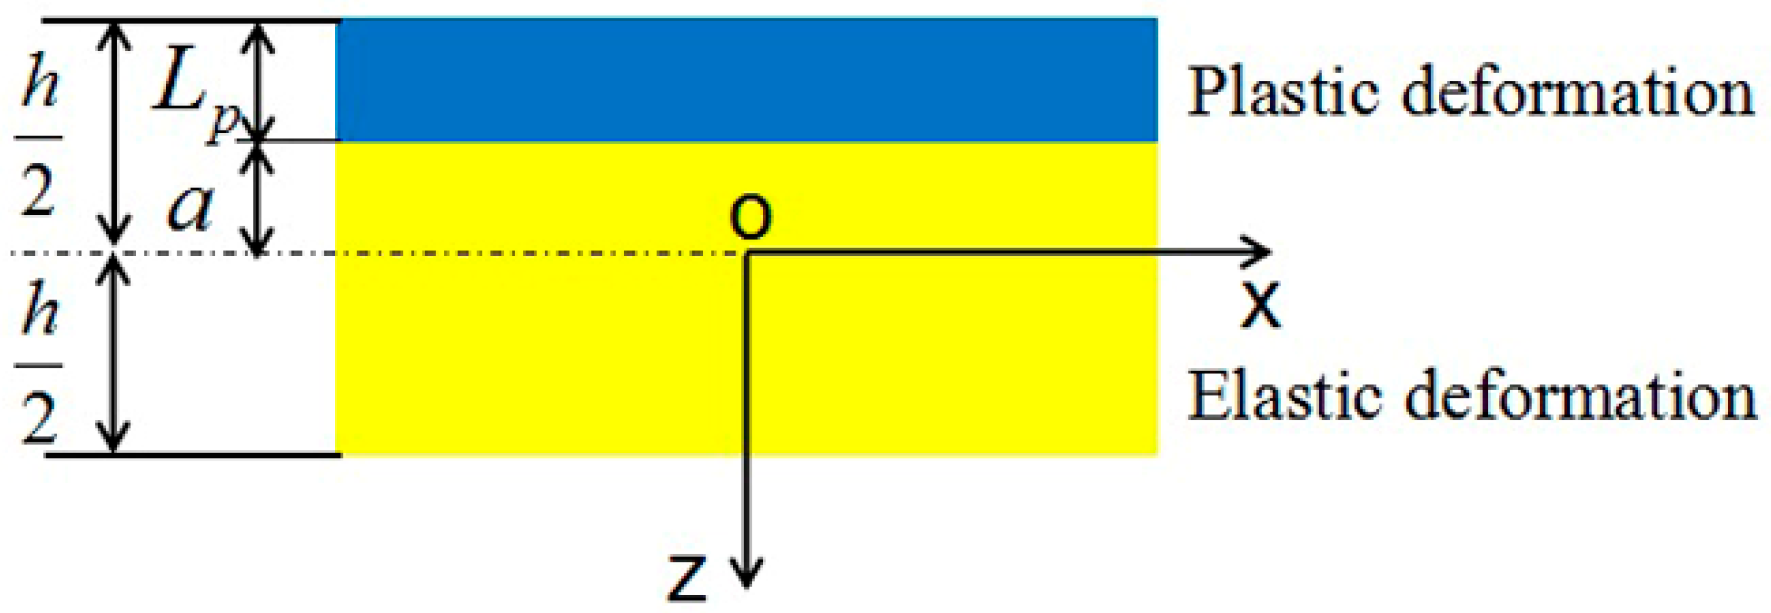
In this case, laser-induced compressive stress and plastic deformation are confined within a thin layer beneath the top surface. The material below the surface plastic deformation zone is subjected to an elastic deformation. Thus, we divide the sheet into two layers along the thickness direction: a surface plastic deformation zone and a lower elastic deformation zone. As shown in Figure 2, under the laser-induced shock impact, the surface material is compressed to undergo a compressive strain along the z axis. If the volume compression of the solid target is not considered, the strain parallel to the surface will extend in the transverse direction. In the lower layer zone, due to the deformation compatibility, the material will undergo elastic strain and stress. In formulating the process relationships, the following assumptions are made: (1) disregarding the laser-induced compressive stress gradient within the upper layer. This is to assume that the compressive stress along the depth is uniform, and (2) the planes perpendicular to the middle layer of the sheet stay perpendicular to it during bending.
Since there is no additional external mechanical force involved after laser peen forming, the in-plane force and the corresponding bending moment resulted from the stress should be self-equilibrium. Therefore, we have,
where σ is the stress developed, and z is the distance in the z direction. According to assumption (2), the normal strain ε in the x axis direction at any coordinate points (x, z) can be expressed as the sum of the plane strain, ε0, and the bending strain, zk01:
where k01 is the curvature of the middle layer.
Combining Equations (1) and (2) gives:
where σym is the static yield strength of sheet material, k is the average stress coefficient, E is the elastic modulus of the metal material, and h is the thickness of the metal sheet. The zone between [−h/2, −a] is subject to plastic deformation, and the zone between [−a, h/2] is elastic, as shown in Figure 2. The depth of the plastic zone, Lp, is
Combining Equations (4)–(6), we have the convex curvature:
From Equation (7), with the appropriate values of k and Lp, k01 can be derived.
3.1.1. Plastic Zone Length, Lp
The length of plastic zone, Lp, is related to the laser peen forming parameters through the following relationships [12,13].
where
Ce is elastic wave velocity, Cp is plastic wave velocity, τ1 is the pressure pulse duration, Pmax is the maximum pressure of laser-induced shock wave, and HEL is Hugoniot elastic limit. ν is Poisson’s ratio and σdym is dynamic yield strength of the metal material, which is two to four times larger than static yield strength, σym, under strong shock loading [14]. For the confined configuration during laser shock processing, τ1 is 2–3 times longer than laser pulse duration [15]. Pmax can be estimated by [16].
and
where Z1 and Z2 are the shock impedance of the confined medium and target material, respectively, and the unit is g/cm2·s. α is the interaction efficiency, and ELaser is the energy of laser pulse. αELaser contributes to the pressure increase. R is the laser spot radius and τ is the laser pulse duration, and the unit of I is GW/cm2.
3.1.2. Average Stress Coefficient k
If disregarding the disturbed condition, such as the influence of the reflected wave from the sample boundaries, the target surface will be subjected to the highest compressive residual stress because laser-induced shock wave attenuates rapidly in the thickness direction. In our analytical model, we simplify the stress distributions within the upper plastic zone to assume that they are uniform. We approximately take σtop/2 as the average stress along the depth within the plastic zone. σtop is the surface residual stress. Thus, the coefficient k is given by
To validate the model, 2024 aluminum alloy was chosen as the target material, and water was used to act as the confining layer. Therefore, Z1 = 0.148 × 10⁶ g/cm2·s, Z2 = 1.506 × 10⁶ g/cm2·s, σym = 290 MPa, E = 72 GPa and ν = 0.34. In our experiments, the laser energy ranged from 2 J to 6 J. The laser pulse length, τ was about 20 ns, R = 1.5 mm, and α = 0.2. Under these conditions, the target sheets of the thicknesses 2 mm and 3 mm had convex bending curvatures. We measured the surface residual stresses of these samples. The maximum amplitude of compressive residual stress for the 2 mm thickness sheet at 2 J laser pulse energy was about 60 MPa. For laser energy 5 J, the surface compressive residual stress was about 70 MPa. According to Equation (15), the average stress coefficients were 0.1 and 0.12, respectively. For a sheet of 3 mm thickness, the maximum amplitude of compressive stress induced at 4 J laser energy was about 80 MPa, and at 6 J, it was about 100 MPa. According to Equation (15), the stress coefficients were about 0.137 and 0.172. In Zhou’s work [6], the maximum amplitude of the compressive stress for a 2 mm 2024 aluminum alloy sheet after bending at laser energy of 5.6 J was about 50 MPa, and it was about 80 MPa for a 3 mm plate. Hence, the average stress coefficients were 0.086 and 0.137, respectively. Combining the results of our experiments and Zhou’s results, the average stress coefficient ranged between 0.08~0.018 at laser energies ranging from 2 J to 6 J. So, in this work, we take the average stress coefficient k = 0.1. It should be noted that, although 2024 aluminum alloy is chosen as the target material in our work, if one chooses other materials as the target, the average stress coefficient k can also be taken in the same way.
3.2. Concave Bending
The bending mechanism of the concave deformation is significantly different from that of convex deformation. When the sheet thickness is small or laser pulse energy is large enough, laser-induced shock wave does not attenuate so seriously along the depth direction. In this case, SBM dominates the bending mechanism, and the analytical model based on SGM does not work. We therefore developed an analytical model for concave bending based on the energy transformation. Based on plate plastic deformation under a normal projectile impact [17], the following assumptions are made: (1) the kinetic energy of the sheet is entirely transformed into its strain energy, (2) there is no plane distortion between the planes during laser shock forming, i.e., the volume of sheet is constant during laser peen forming, (3) the material is linear work hardening, and (4) disregarding the coupling effects among laser impacts, that is to say, the first laser impact determines the sheet curvature, and the following laser impacts only bend other zones to this curvature.
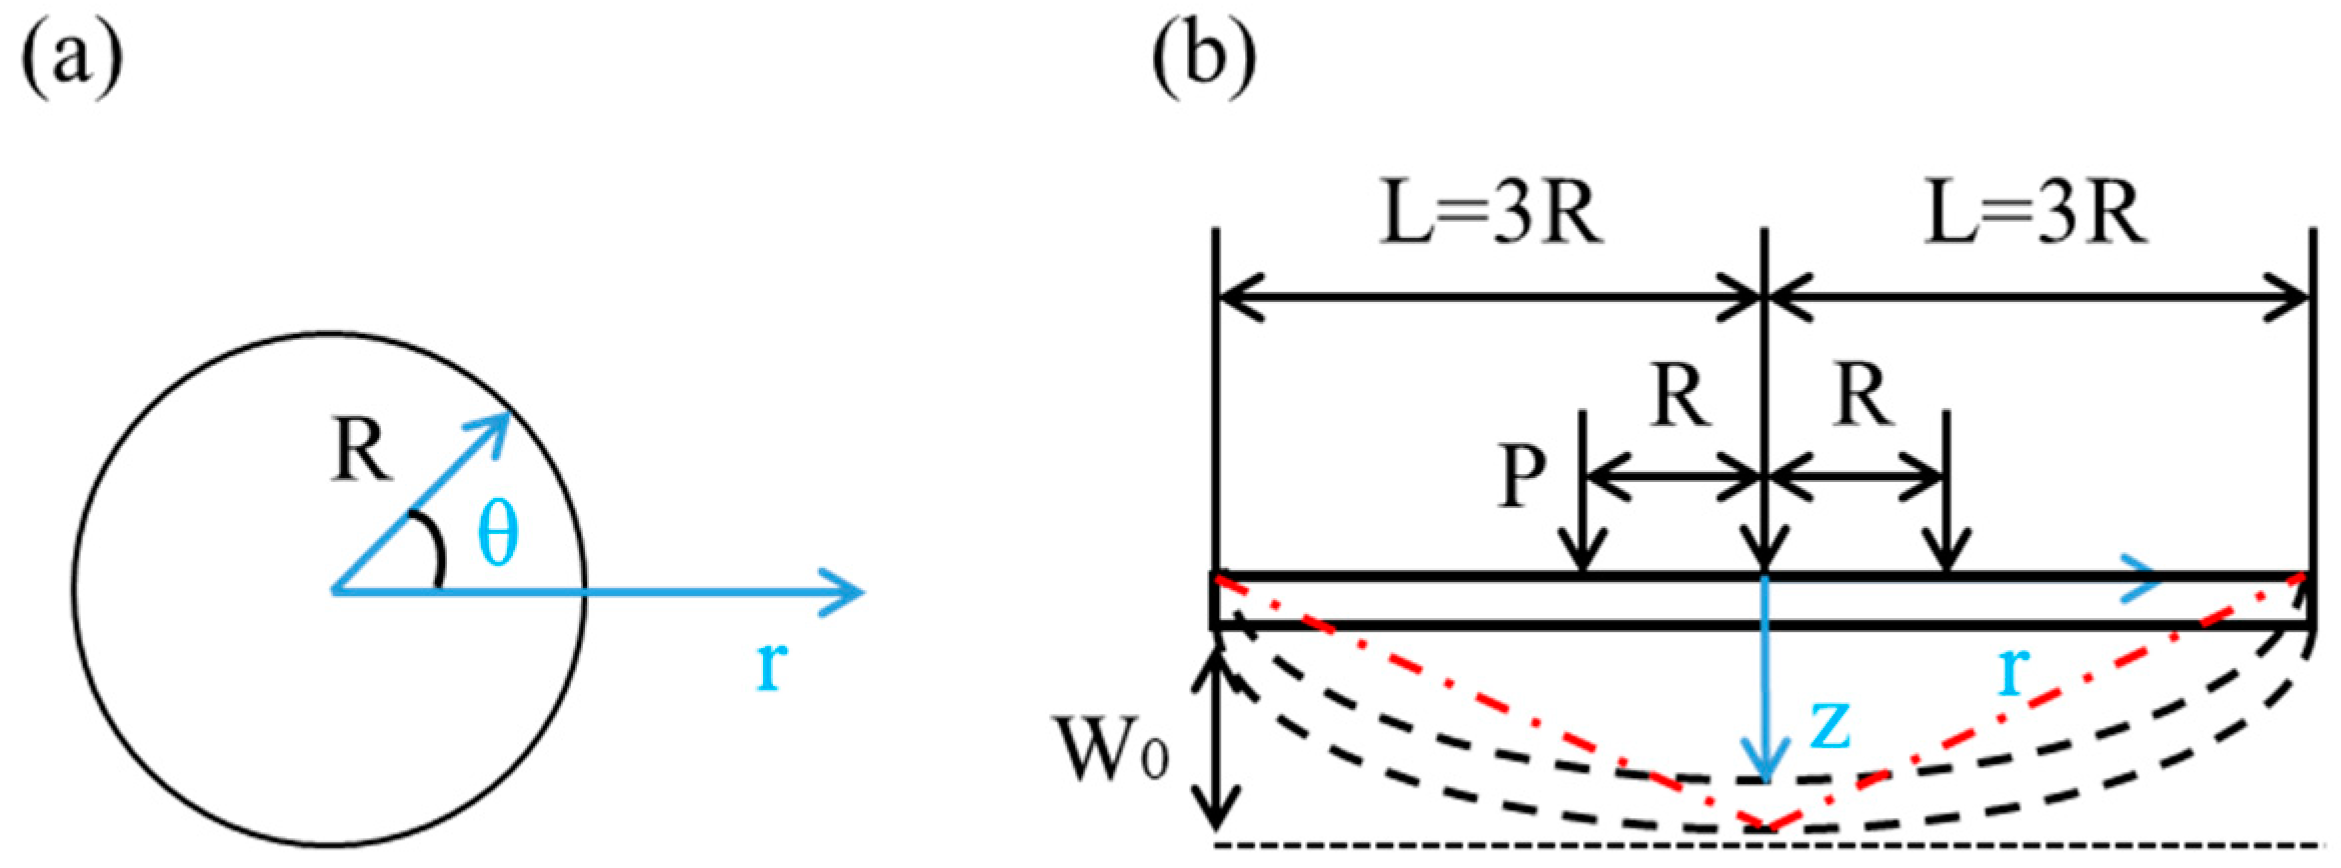
In this case, we apply a cylindrical coordinate system. As shown in Figure 3, the laser shocked surface acts as a polar plane. The laser spot center is the origin and the thickness direction is the z axis.
The plastic strain energy of the plate is Ep, and the elastic strain energy is Ee. The shock wave induced kinetic energy of plate is Ek. Then, as we assumed that the kinetic energy of plate is transformed into the strain energy of plate entirely,
- (1)
- Formulations of Ep and Ee
Their differential expressions are:
where σ and ε are the stress and strain, respectively. Subscripts r and θ refer to the radial and circumferential directions. Ω1 represents the volume of the plastic zone and Ω2 represents that of the elastic zone. The deflection of the plate under the impact of laser is w(r), so the radial strain and the circumferential strain can be expressed as:
Yield condition can be expressed as:
According to assumption (2), we have the normal stress σz = 0, normal strain εz = 0 and shear strains (τrθ, τθz and τzr) are all 0; then, the yield condition becomes
According to assumption (3), the stress in elastic stage can be expressed as:
where σ is the elastic stress, E is the material elastic modulus, and ε is the elastic strain. The stress in plastic stage can be expressed as:
where σd is plastic stress, σym is the static yield strength of the metal material, EP is tangent modulus, and εr1 is plastic strain.
Combining Equations (22) and (24), we have:
According to the relationship between the stress and strain during the elastic stage, we have σθ1 = νσr1, where ν is Poisson’s ratio of the metal material. Then, simplifying Equation (25) gives:
Combining Equations (17) and (26) gives
If the plastic deformation zone does not transmit through the overall target thickness, a small layer of elastic deformation for concave bending will still exist. Then, we define the stress of elastic deformation zone as σr2 = kσym, where k is average stress coefficient within this layer along the depth direction. Therefore, the elastic strain energy can be expressed as
The differentials of Ω1 and Ω2 can be expressed as
where h is the thickness of target, and Lp is the depth of plastic zone. dεr1 integrates from 0 to εr1, and dεr2 integrates from 0 to σym/E. Hence, we have
where L represents the transverse size of the deformation area of plate after laser peen forming, as shown in Figure 3.
- (2)
- Formulation of Ek
Here, the shock wave is simplified as a triangular wave, as shown in Figure 4. Pulse duration of laser-induced shock wave is τ1. According to the measurement of laser-induced shock wave duration by Fabbro [16], we assume that the pressure reaches the maximum value Pmax at τ1/3. P1 represents the pressure within the rising stage and P2 the pressure within the declining stage.
P2 can be expressed as
Then according to the definition of the impulse, the impulse caused by the shock wave on the plate can be obtained.
where R is the radius of the laser spot.
According to the experimental observation, we use line approximation to describe the deflection contour of plate after bending (shown with red dot-dashed line in Figure 3), expressed approximately as follows,
in which w0 is the maximum deflection at the laser spot center, as shown in Figure 3. Then the expression of the point moving velocity v(r) along the z axis on the plate during laser peen forming can be obtained as accordingly:
Combining the definition of the momentum and Equation (37), we have
So, v0 can be expressed as
Then, we have the kinetic energy expression of plate as:
- (3)
- Formulation of the concave curvature k02
From Equations (16), (31), and (32), we have the following relation
According to Equation (36), we have
Considering Equations (40)–(43),we have
Through Equation (44), w0 can be solved. According to the geometric relation of an arc, one can obtain the curvature of the bending plate obtained through laser shock forming:
where R’ is the radius of curvature, and k02 is the curvature of the bending plate.
3.2.1. The Values of w0 and L
According to Equation (47), the key parameters to obtain a curvature are w0 and L. w0 can be obtained from Equation (44). If Lp estimated by Equation (8) is larger than the thickness h of sheet, Lp should be taken as h. After the material and laser parameter are chosen, Pmax can be estimated from Equations (12)–(14). The depth of plastic zone Lp, and the impulse I, are related to the maximum pressure of plasma Pmax. According to the experiment, L = 3R is taken in this work, as shown in Figure 3.
It should be noted that, only satisfying the condition for obtaining the real solution of Equation (44), w0 can be derived. So, according to Equation (44),
That is, SBM can induce concave curvatures only if the depth of laser-shock-induced plastic deformation reaches above the threshold value (Lth), or else SBM should be disregarded.
3.2.2. Determination of Average Stress Coefficient, k
In this case, taking the same laser energy ranges from 2 J to 6 J, if other process parameters are the same as those for convex bending 2024 aluminum alloys with a thickness h1 = 1 mm, the sheet will bend concavely. We measured the stresses along the depth direction of the 1 mm sheet when the laser pulse energy was 2 J. The stress magnitude of the bottom surface was about 40 MPa. Therefore, we took the stress coefficient k = 0.07 when the depth of plastic deformation Lp estimated by Equation (8) exceeded the thickness of the sheet. Then, the third item of Equation (44) is zero and k is not needed.
3.3. The Total Curvature Due to the Combined Effects of SGM and SBM
As is given above, the bending curvature due to just SGM is k01, and that due to just SBM is k02. Actually, SGM and SBM coexist in laser peen forming and their combined effects determine the obtained deformation of targets, that is to say, k0 = k01 + k02. Under certain conditions, e.g., Lp < Lth, SGM dominates the deformation process. k0 = k01. On some other conditions, e.g., Lp > h, SBM dominates during LPF. k0 = k02. Then, based on this principle, we can calculate the curvatures of bent sheet due to LPF. Table 1 gives the results for bending 3 mm, 2 mm, and 1 mm sheets induced by laser of 2 J, 4 J, 5 J, and 6 J.
3.4. Experimental Validation
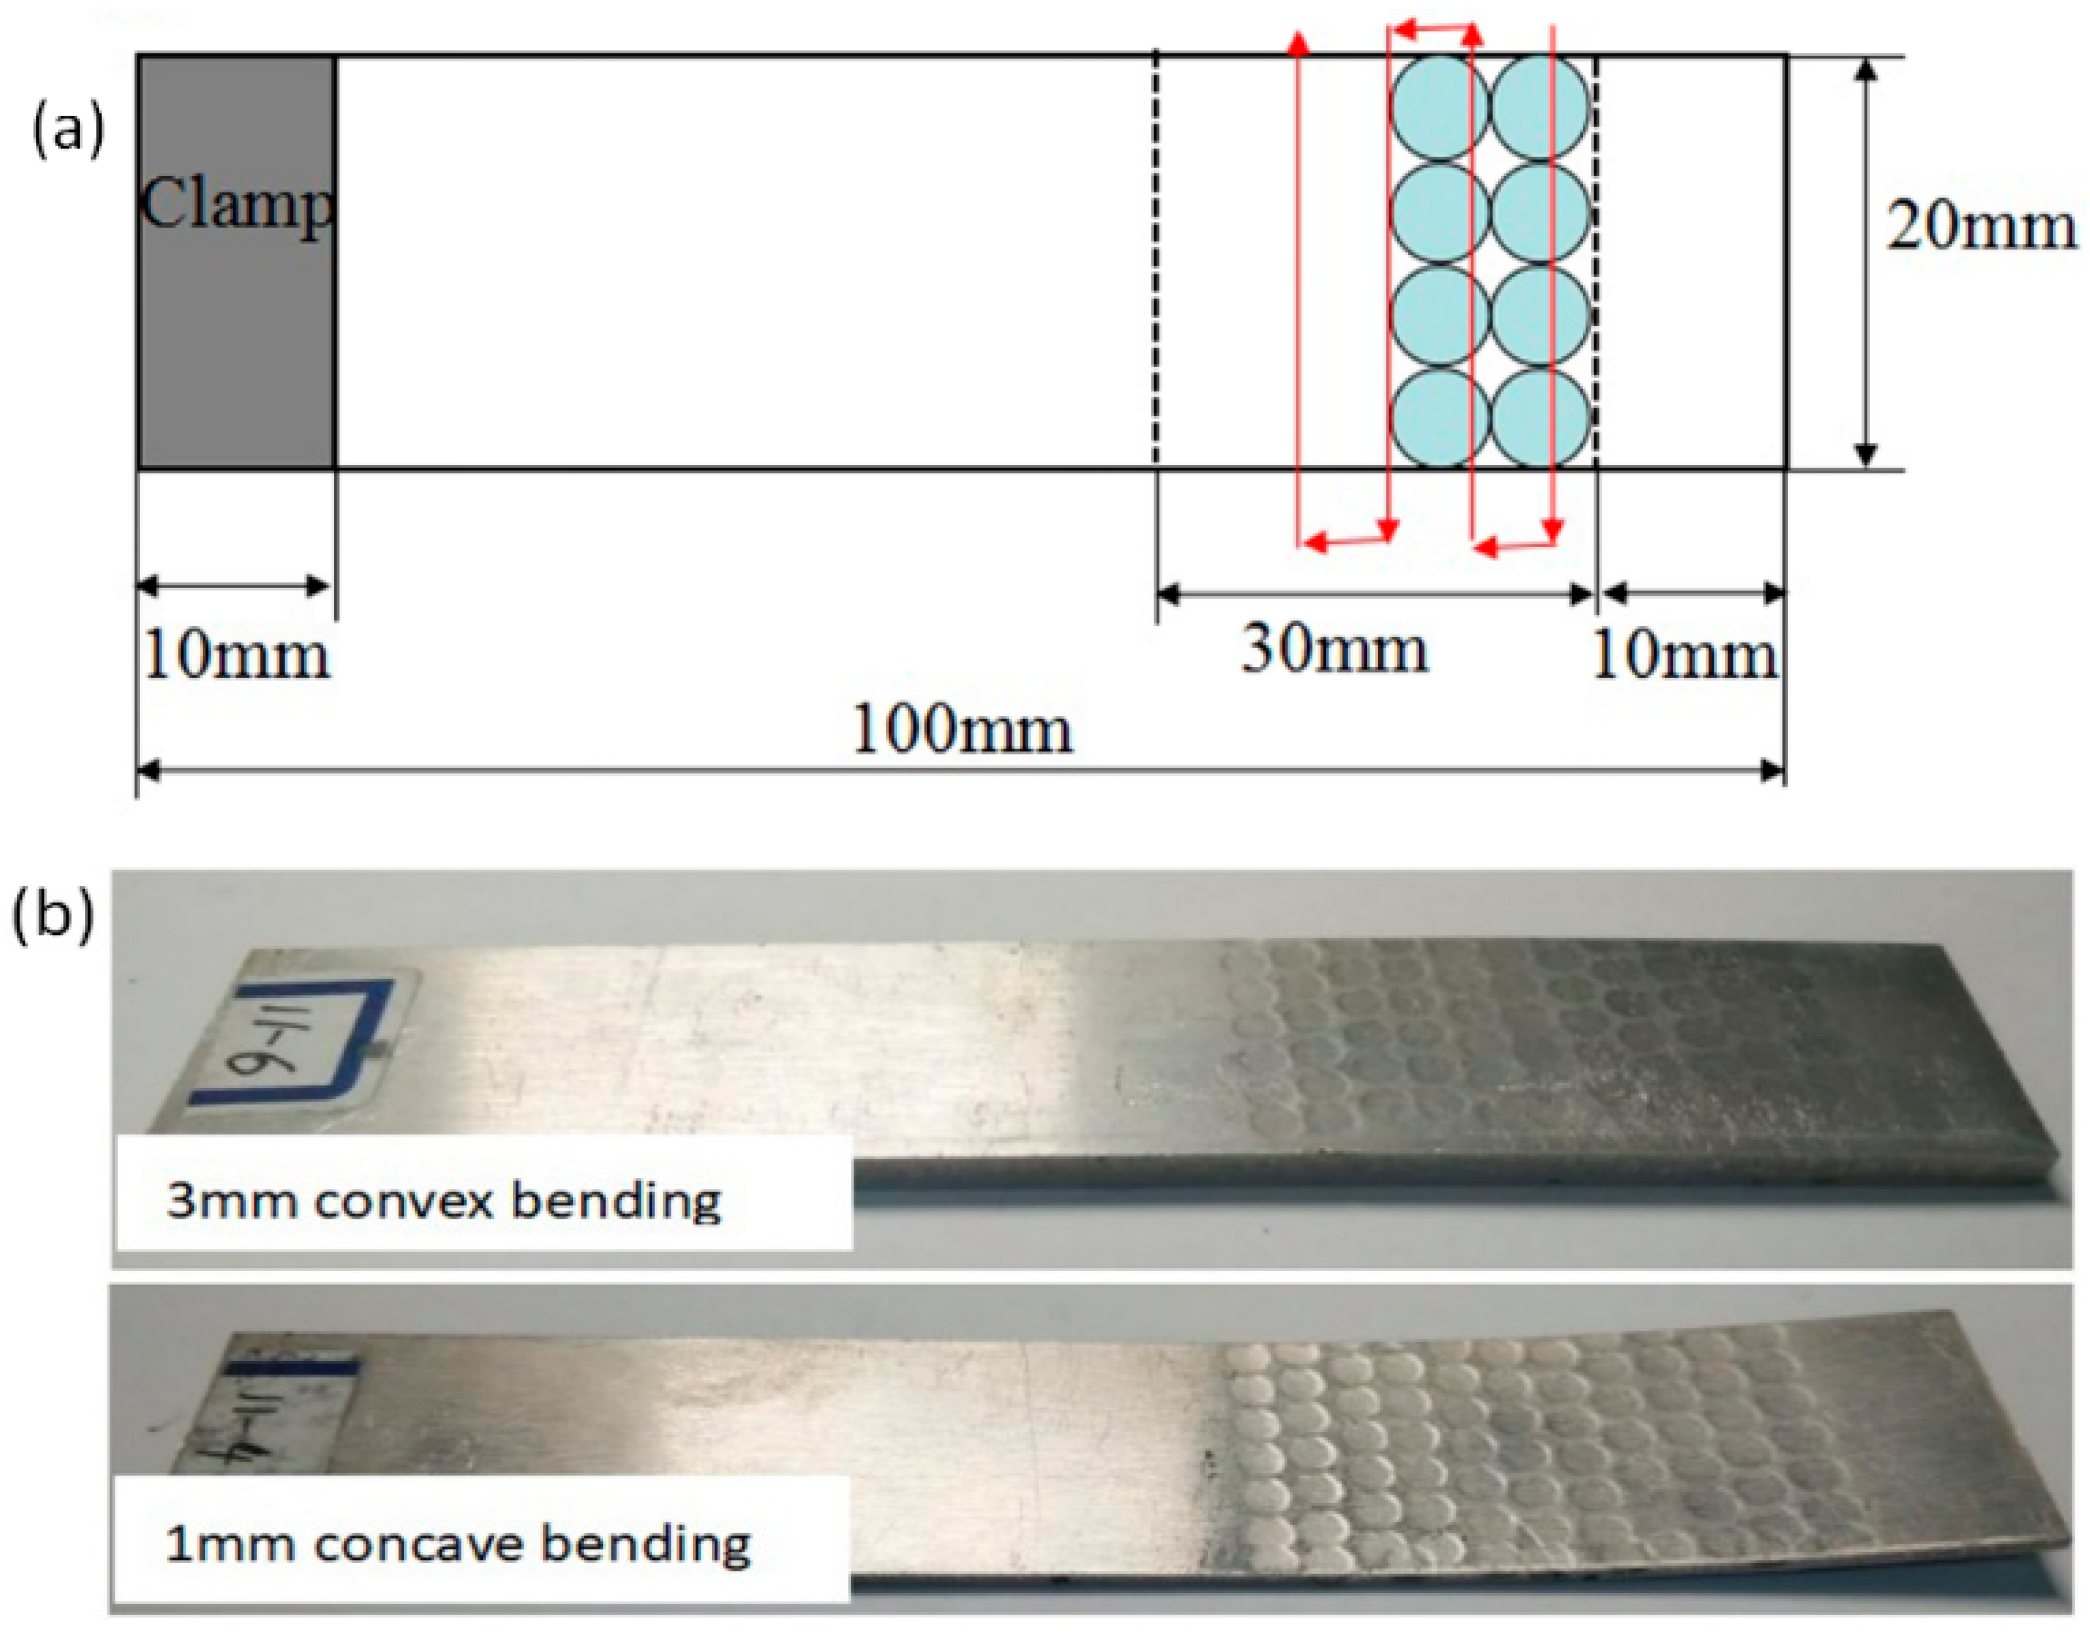
In order to validate the analytical model, a series of experiments were conducted using 2024 aluminum alloy plates with the same length and width but different thicknesses. The parameters of aluminum alloy plate are shown in Table 2. The length of plates was 100 mm, and the width was 20 mm. The plates had three different thicknesses: h1 = 1 mm, h2 = 2 mm, and h3 = 3 mm. Before laser peen forming, the plates were cleaned with alcohol. A 3M black tape of 0.1 mm thickness was placed on the plate surfaces as an absorbent layer. A water film acting as the confining layer and form a 2 mm thick flowing water film on the surface of the workpiece. The plates were clamped at one side like cantilever beams. A Q-switched Nd:YAG laser with a wavelength of 1064 nm was used. The laser pulse length was about 20 ns. The repetition rate ranged was 1 Hz, and laser pulse energy was between 2 J and 6 J. The radius of the circular laser beam spot with a uniform energy distribution was 1.5 mm, scanning speed was 3 mm/s, and number of scanning lines was 11. During the laser shock forming experiment, the laser beam impacted the surface along the normal of the surface as shown in Figure 5. After the laser peen forming, residual stress distributions along the depth direction were measured with an X-350A type X-ray stress meter. Figure 5 also shows typical convex and concave bending results.
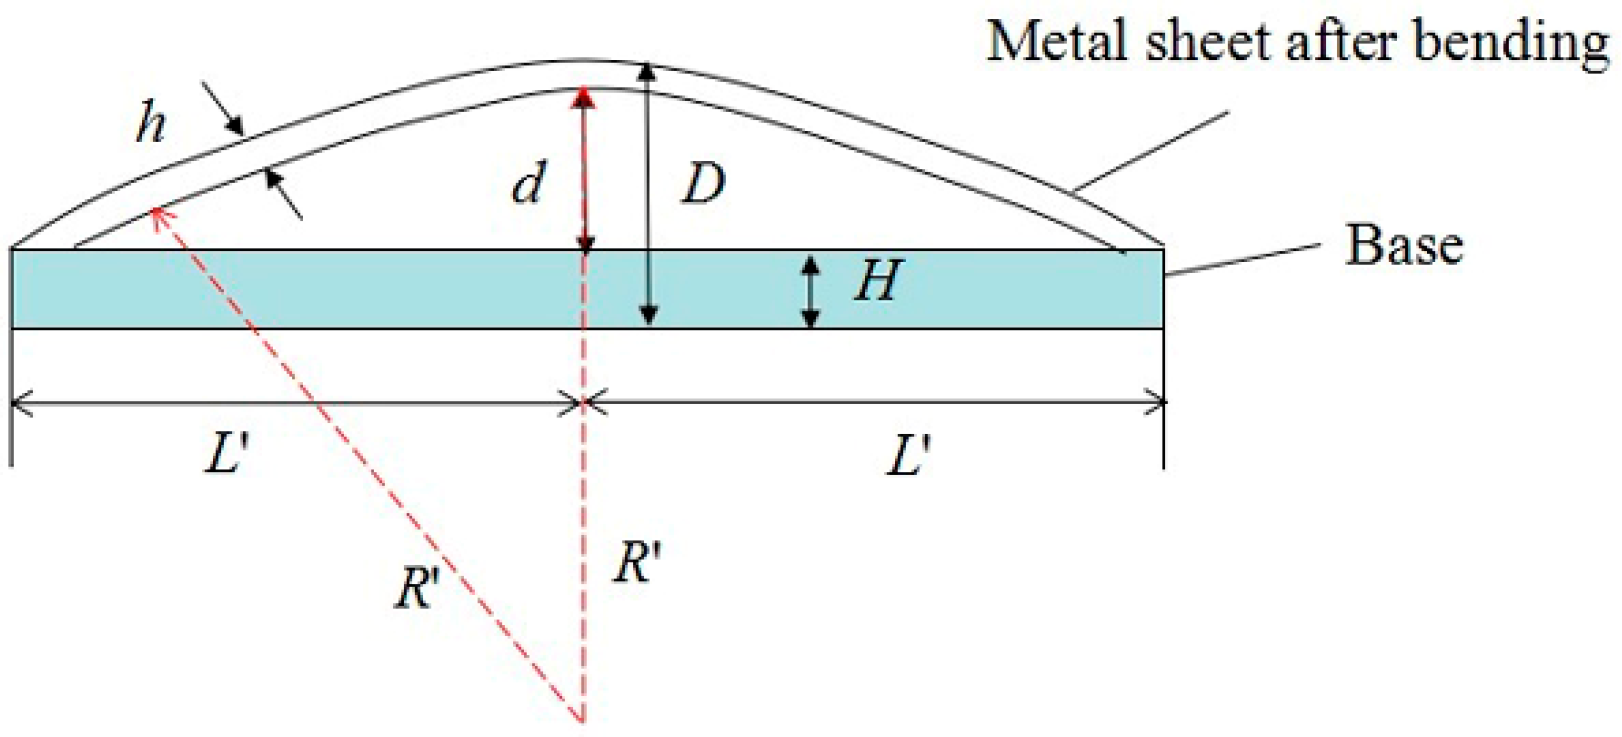
The arc height of the deformed plates was measured, as shown in Figure 6, where h is the thickness of the bending plate. 2 mm thick 2024 aluminum alloy is chosen as the base, and its half-length is L’. D is the maximum height between the bending plate and the base, which can be easily measured. d is arc height, which equals to D-H-h. R’ is the approximate radius of bending plate, and k0 is the curvature. The curvature of the concave geometry is defined to be positive and that of the convex geometry is negative. The same base of L’ = 20 mm was used in this experiment. According to the geometry of the arc, one can deduce the following formula
4. Results and Discussions
4.1. Convex Bending of 3 mm 2024 Aluminum Alloy
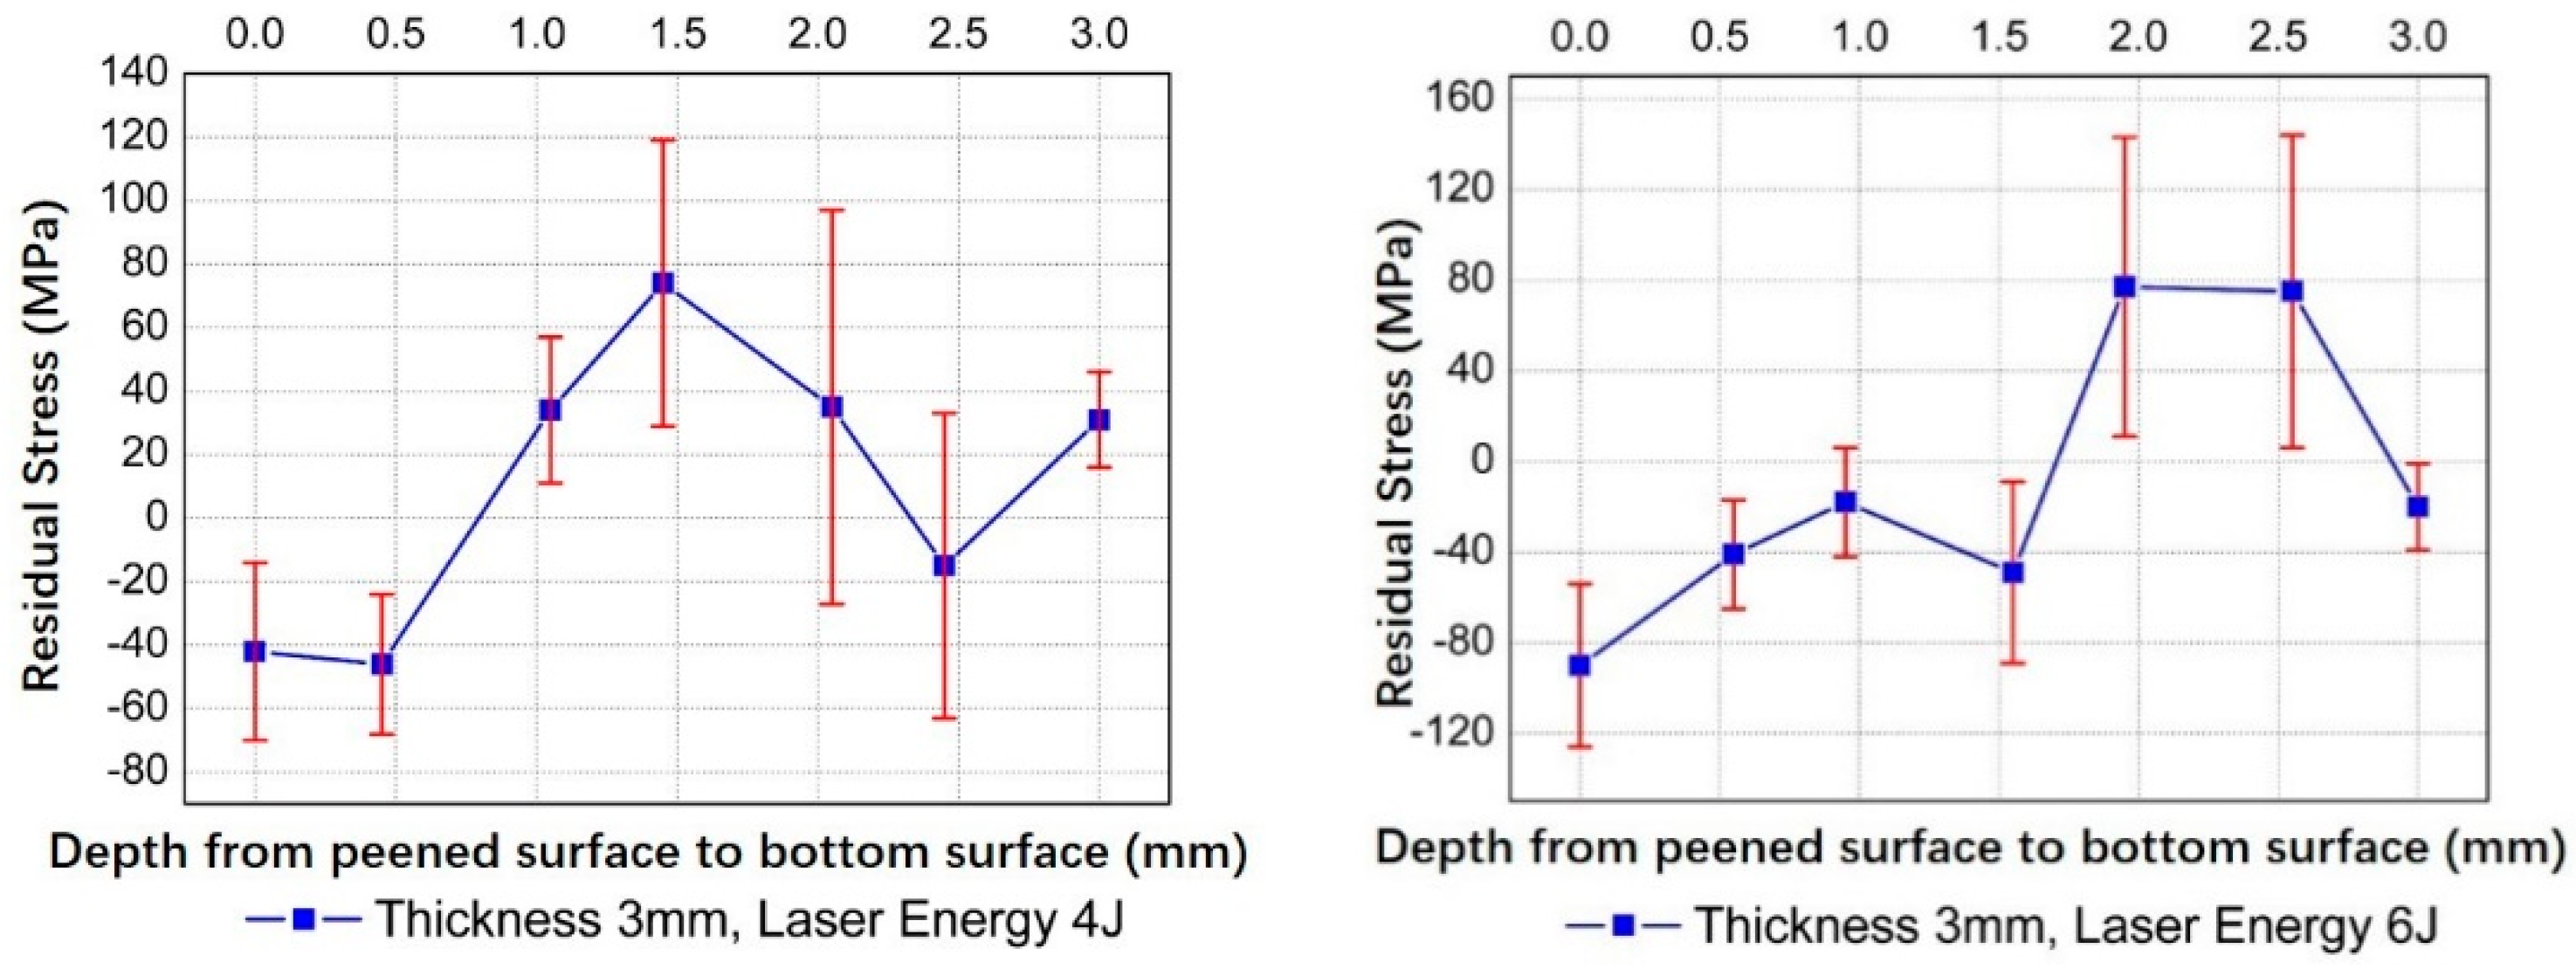
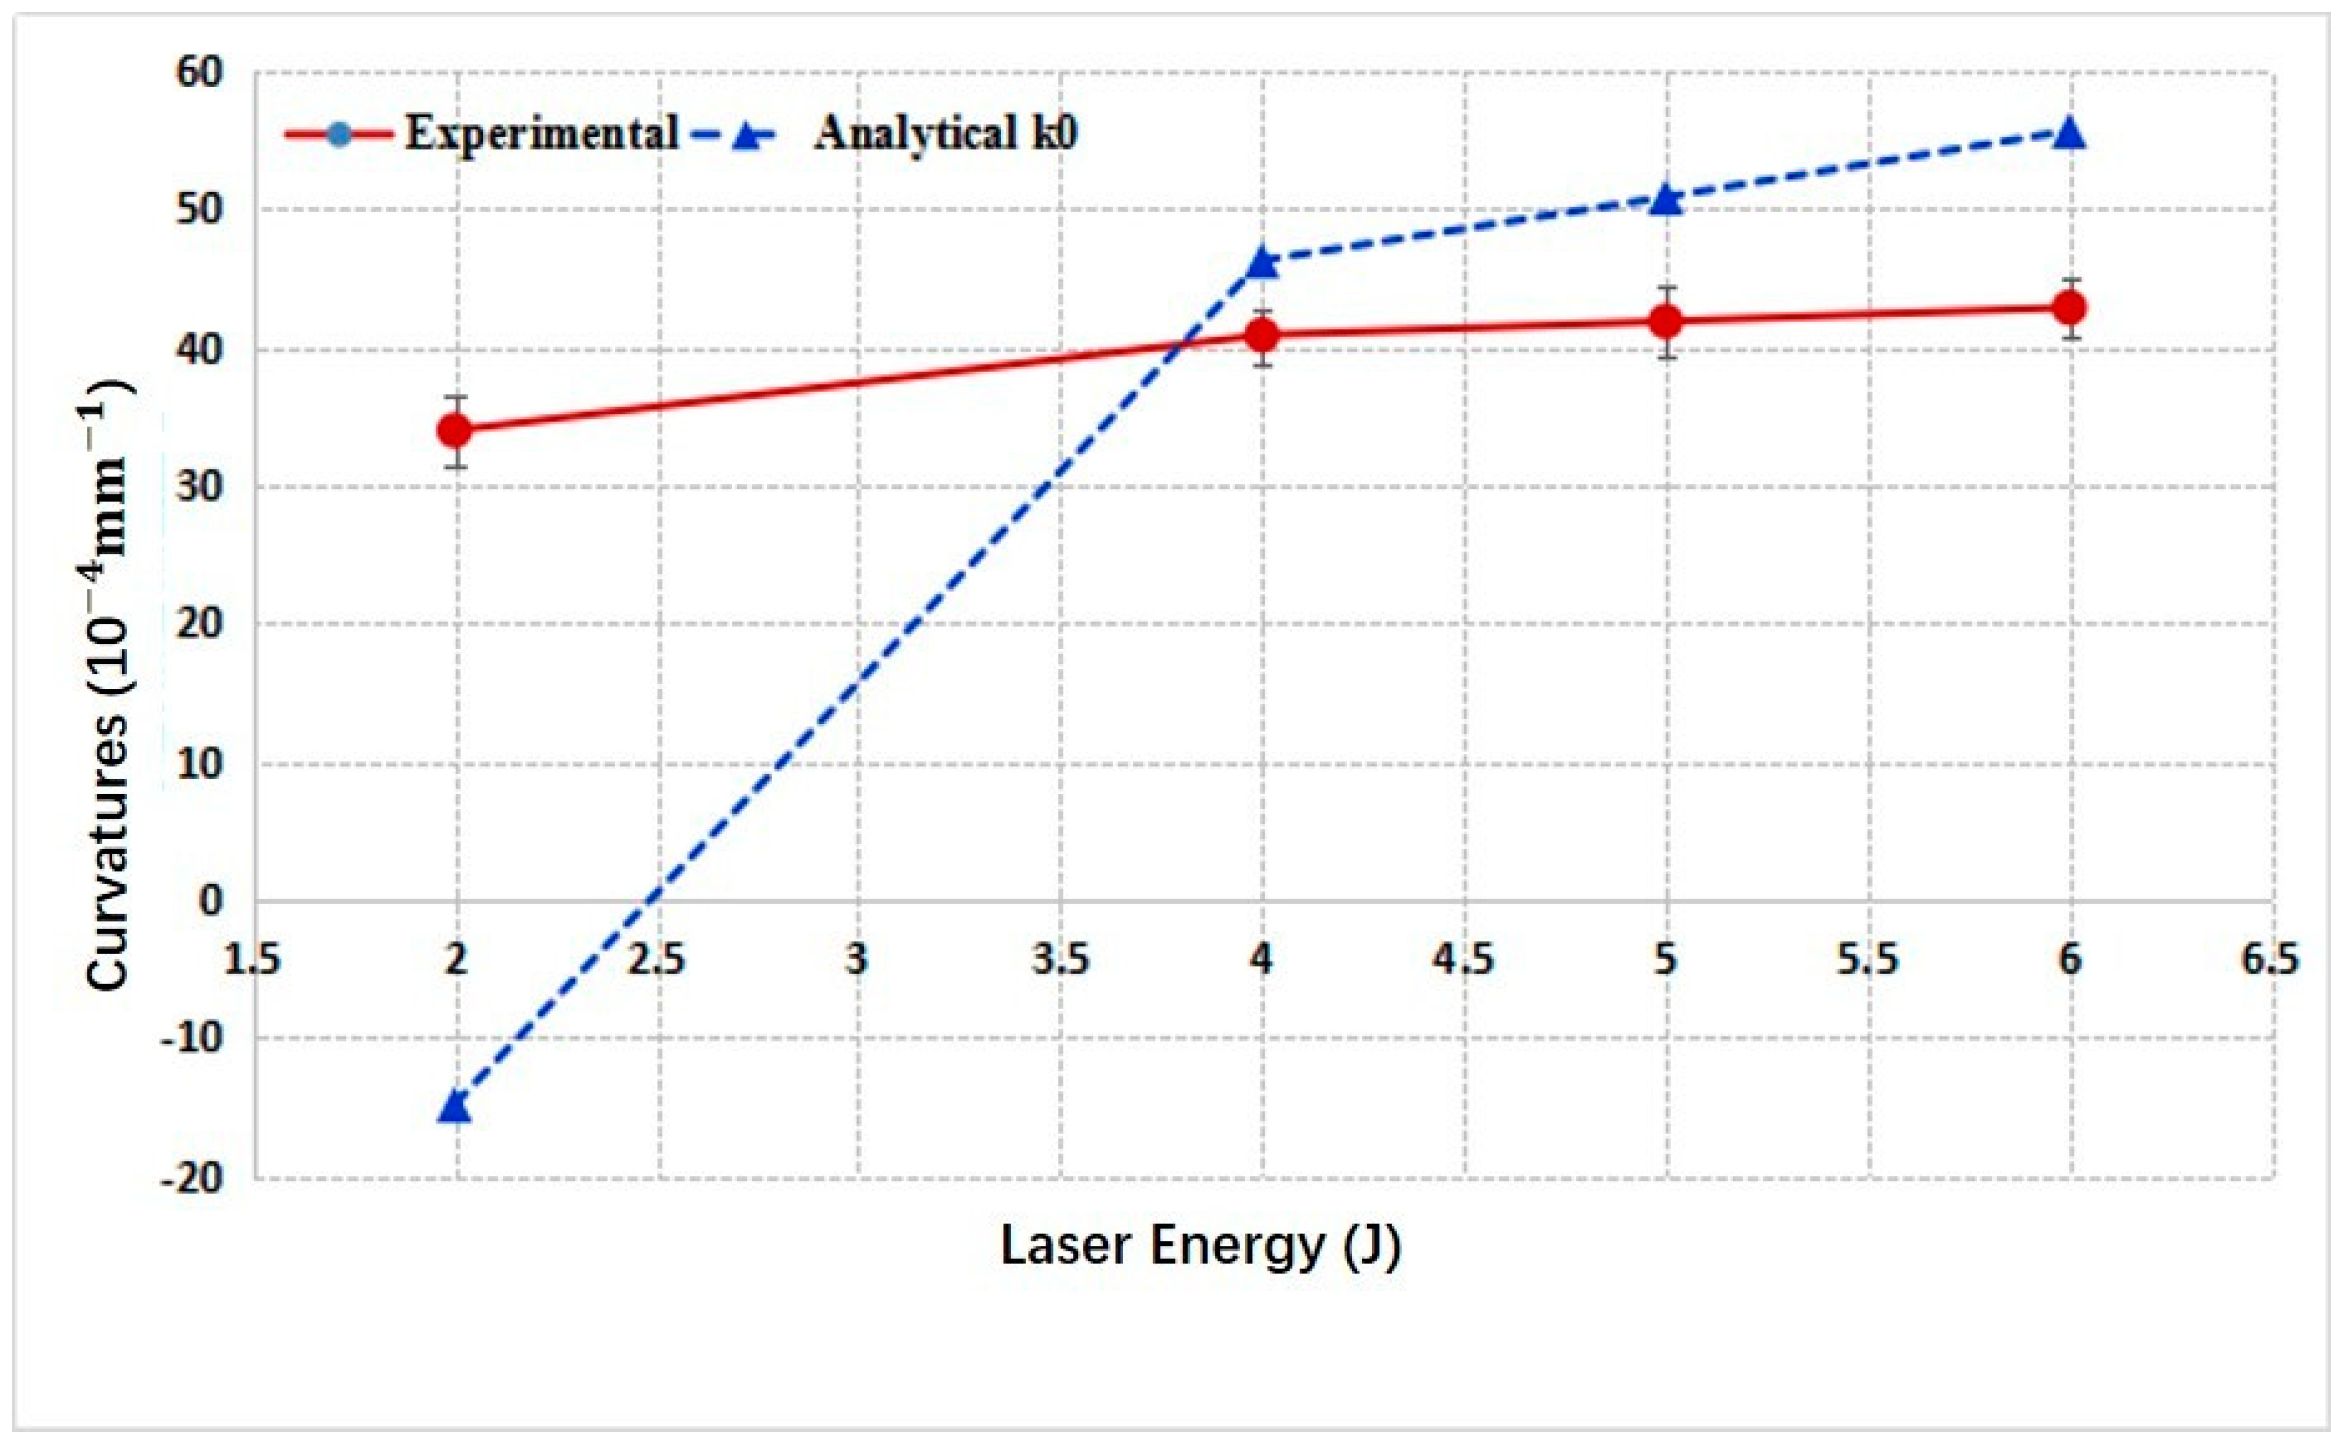
Figure 7 gives the curvatures vs. laser energies of convex bending for 3 mm thick 2024 aluminum alloy obtained through experiments and the analytical model. The trends of two lines are consistent, and the curvatures increase with the laser pulse energies. However, there still exist obvious deviations between them because the analytical model was developed based on many assumptions. As we have assumed, the stresses within the plastic layer were uniformly distributed along the depth direction. In reality, the stress distribution along depth direction may be complex. Figure 8 gives the measured residual stresses along the depth direction of the 3 mm sheet formed with laser energy of 4 J and 6 J. In addition, for the analytical results shown in Figure 7, the stress average coefficient k was set as a constant value of 0.1, while in the experiments, it might vary accordingly to changing laser energies. All these factors contributed to the deviations. Another phenomenon one can note is that the curvatures given by the analytical model increase more rapidly with increasing laser energy than the experimental results, especially for higher laser energy. During LPF, the final contours under all conditions must be the combined effects of SBM and SGM, although we have disregarded the concave bending effects in Table 1, due to Lp < Lth. At lower laser pulse energy, SGM dominates, while with increasing laser energy, the role of SBM played in forming the final contour becomes more and more important, although SGM still dominates the forming process. SBM will weaken the convex bending effect. Therefore, the actual experimental results with higher laser energy, e.g., 6 J in Figure 7, is smaller than those estimated with analytical model.
4.2. Concave Bending of 1 mm 2024 Aluminum Alloy
Figure 9 gives the curvatures vs. laser energies of concave bending obtained through experiments and the analytical model. The trends of two lines are consistent, and the curvatures increase with the laser pulse energy. Similar to Figure 7, curvatures increase more rapidly with increasing laser energies. It is because the final contours are the combined effects of SBM and SGM in the experiments. SGM will weaken the concave bending effect in the actual experiments. As the result, when laser energy increases, the concave curvatures increase moderately, rather than increase rapidly as predicted by analytical model. Additionally, from Figure 9 and Table 1, we can note that when laser energy is 2 J, SBM and SGM coexist, and SGM model overestimates the convex curvature k01. As the result, the analytical model gives the convex prediction finally, while in the experiment the metal sheet is concavely bent. In reality, we will find that for those conditions when SGM and SBM effects are comparable to each other, the analytical model developed will demonstrate the big predicting deviations, shown in the following context.
4.3. Convex Bending of 2 mm 2024 Aluminum Alloy
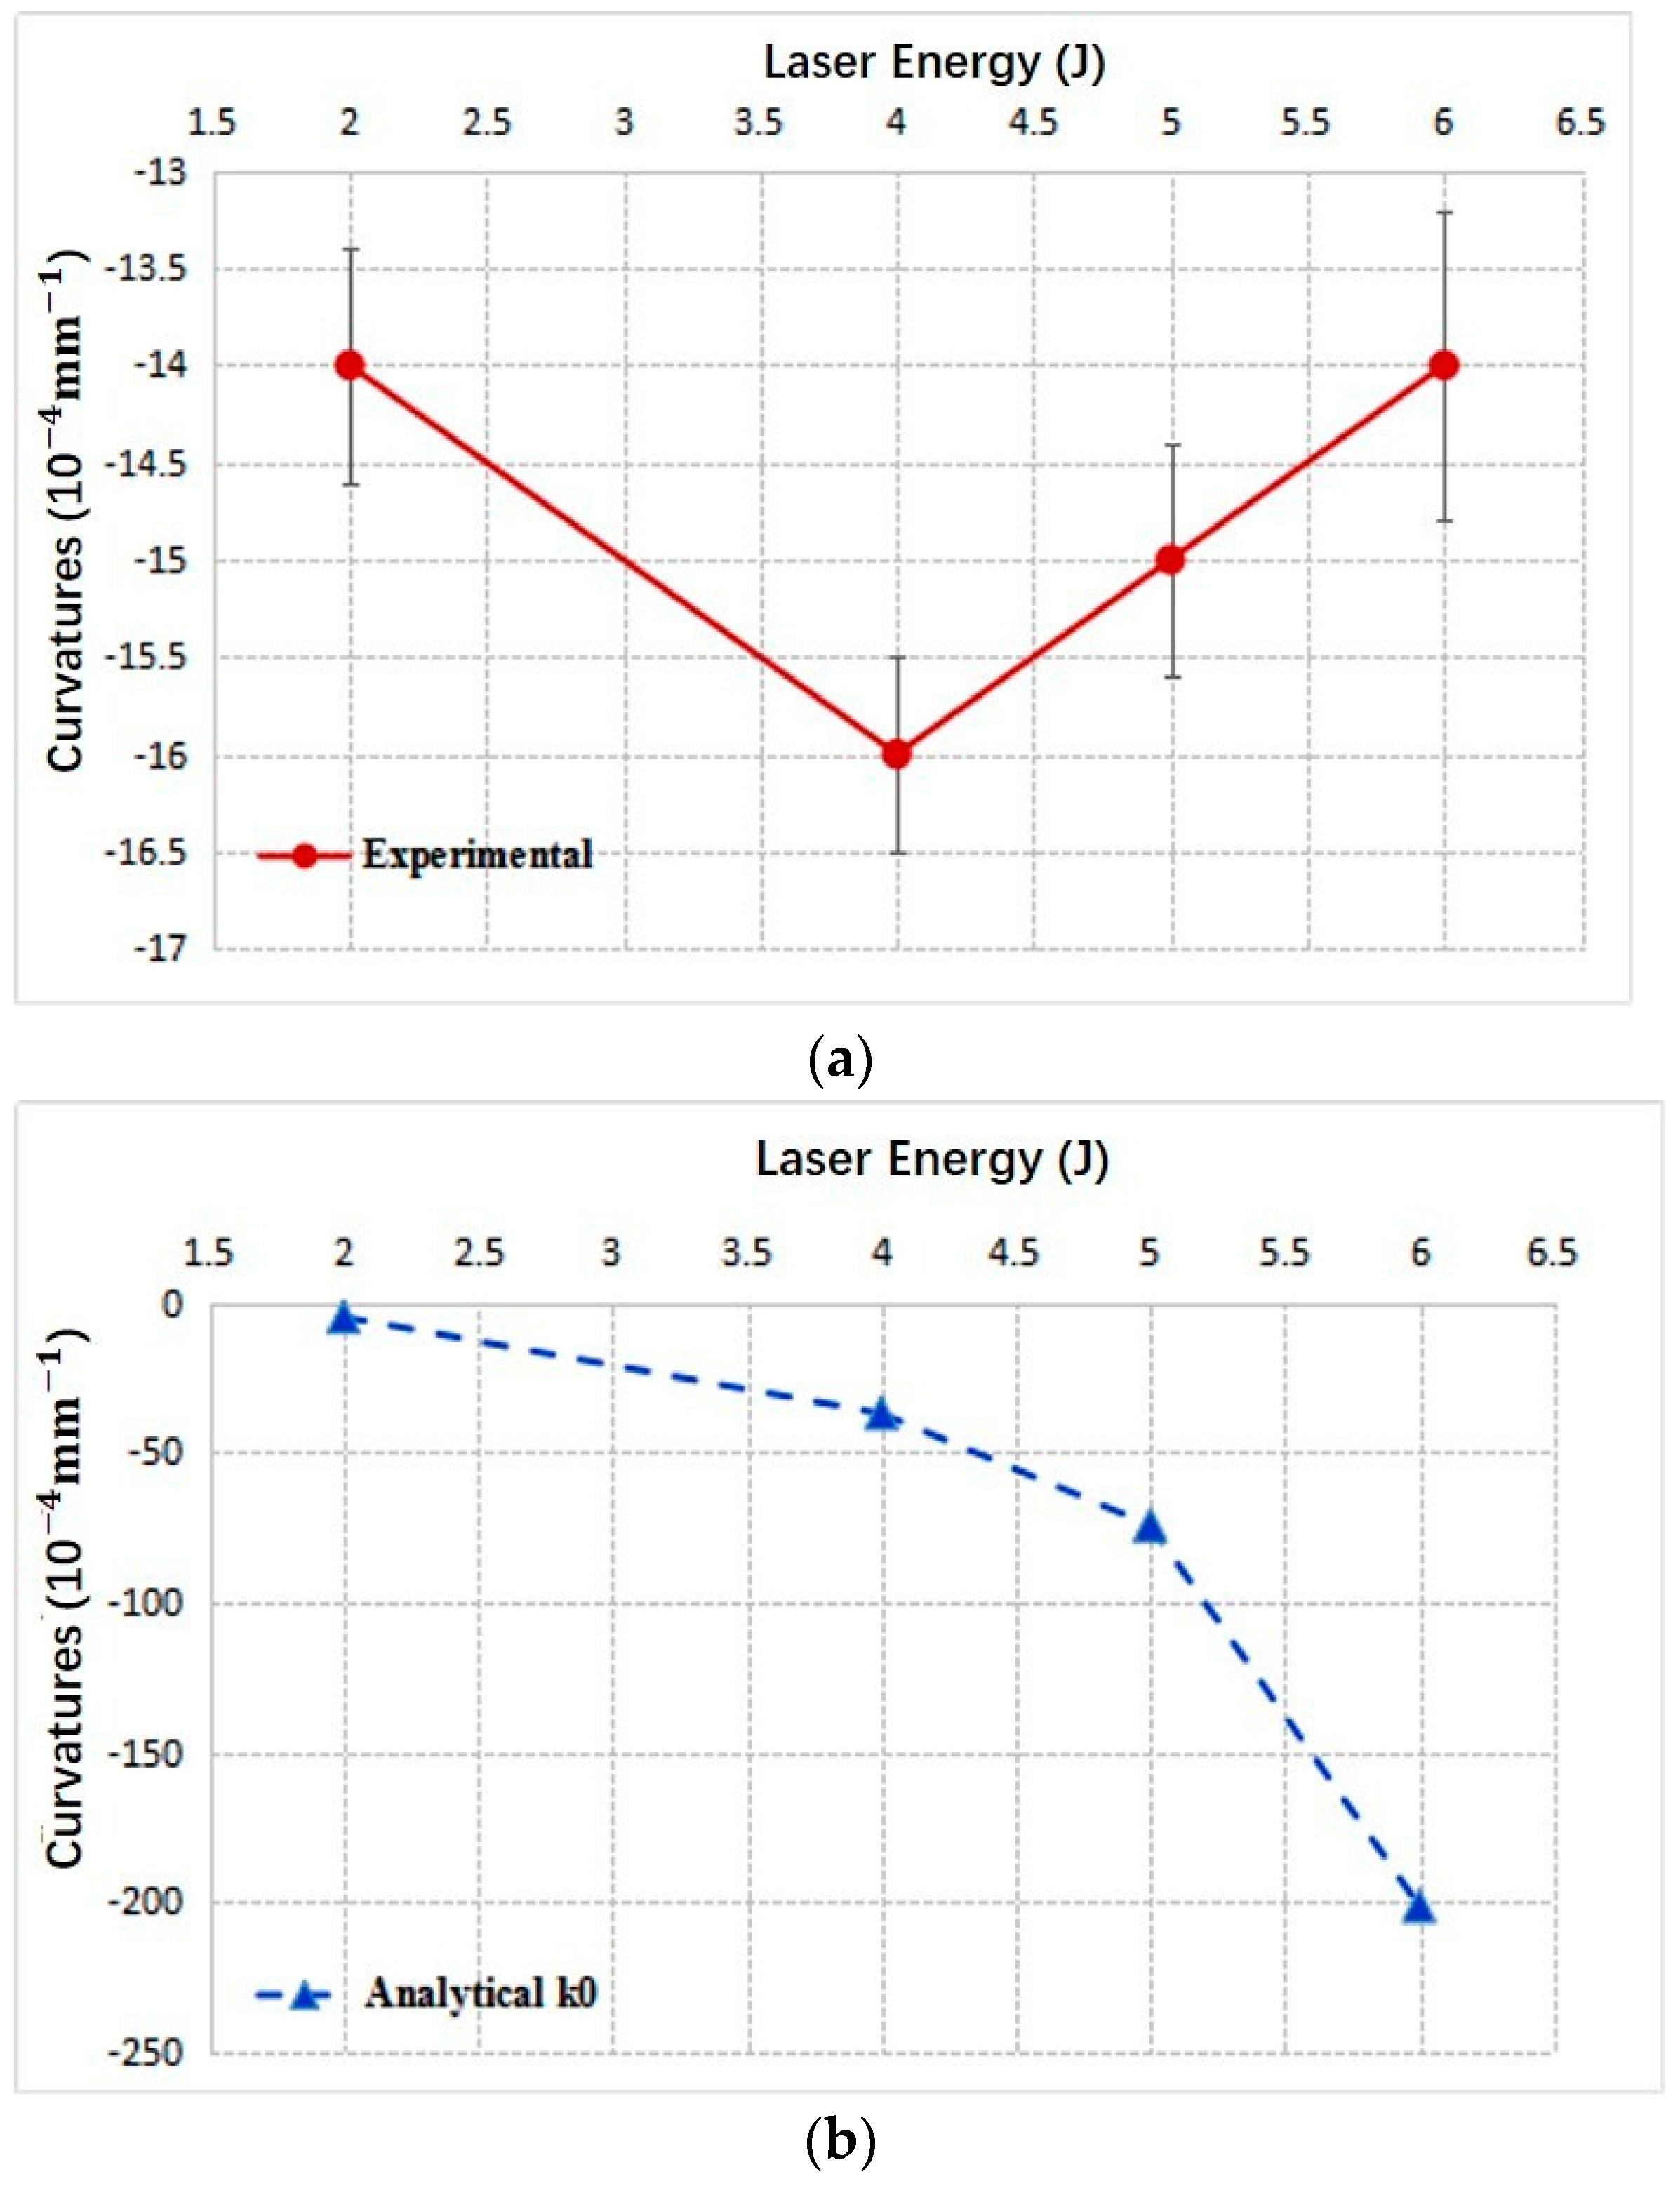
For the 2 mm samples, analytical model predicts the same bending direction as those of the experiments. However, except for laser energy 2 J, the analytical model gives so seriously deviated predicted values. The analytical results are nearly one order of magnitude larger than the experimental ones. Additionally, the trends of the experimental and analytical results are different. In Figure 10a, it is obviously observed that the convex curvatures increase firstly with increasing laser energy, reaching the maximum value at 4 J. Then, with further increasing laser energy, the convex curvatures decrease instead. However, curvature values predicted through the analytical model increase in a monotone manner. This deviation is mainly due to the convex curvature overestimation of the analytical model, especially for those conditions when SGM and SBM are comparable. In the experiment, when SGM overwhelmingly dominates, the curvatures of convex bending increase with laser pulse energy until reaching one certain energy, at which the effect of SBM not only offsets the increasing effect of SGM, but also begins to decrease the convex curvature of convex bending. For the 2 mm sample in our experiment, this turning point is at 4 J laser energy, as shown in Figure 10a. Although we did not conduct the experiments with the energies larger than 6 J because of the maximum energy limitation of our laser equipment, it can be expected that, if increasing laser energy further, the effect of SBM further intensifies, and the plate will turn from convex bending into concave bending. While for the analytical model, because of the overestimation of k01, seen from Table 1, the turning point did not appear in Figure 10b.
5. Conclusions
A combined analytical model was developed for estimating the bending curvatures after laser peen forming. The convex curvature k01 was predicted based on the internal force balance according to stress gradient mechanism, and the concave contribution k02 was developed based on the energy transformation. Their combined effects determine the obtained deformation of targets, that is to say, k0 = k01 + k02. When the depth of laser shock induced plastic deformation is below one certain threshold value (Lp < Lth), SBM should be disregarded. k0 = k01. Under some other conditions, e.g., Lp > h, SBM dominates during LPF. k0 = k02. Experiments have been conducted to evaluate the developed model.
When just SGM or SBM overwhelmingly dominates the forming process, the analytical model can give relatively precise predicted curvatures comparing with those experimental ones. While under the conditions where both SBM and SGM effects are comparable, the accuracy of the analytical results is poor, because of the complex stress distributions within the material and the complex energy coupling process under these conditions. Improvements in the model can be made in the future to account for more complex parameter interactions in LPF.
Author Contributions
Conceptualization, methodology, writing—review and editing: Y.Y.; writing—original draft: Z.N.; investigation: X.H.; data curation, project administration: X.R.; resources: L.L. All authors have read and agreed to the published version of the manuscript.
Funding
This work was supported by Jiangsu Provincial Natural Science Foundation (grant number BEK20171297), Six talent peaks project in Jiangsu Province (grant Number GDZB-020), and Open Project Foundation of the State Key Laboratory of Mechanical System and Vibration, Shanghai Jiao Tong University (grant Number MSV-2015-17), Royal Society International Exchange program and Jiangsu Province Double Innovation program.
Institutional Review Board Statement
Not applicable.
Informed Consent Statement
Not applicable.
Data Availability Statement
Data sharing not applicable.
Conflicts of Interest
The authors declare no conflict of interest.
References
- Hackel, L.; Harris, F. Contour Forming of Metals by Laser Peening. U.S. Patent No. 6410884, 14 December 2005. [Google Scholar]
- Zhou, J.; Huang, S.; Fan, Y.; Jiang, S.; Xiao, L.; Sun, Y.; Chen, Y. Dynamical simulation and experimental study on laser peen forming of 6061-T6 aluminum alloy plate. In Proceedings of the Pacific International Conference on Applications of Lasers and Optics, Beijing, China, 16–18 April 2008. [Google Scholar]
- Wang, Y.; Fan, Y.; Vukelic, S.; Yao, Y.L. Energy-Level Effects on the Deformation Mechanism in Microscale Laser Peen Forming. J. Manuf. Process. 2007, 9, 1–12. [Google Scholar] [CrossRef]
- Hu, Y.; Xu, X.; Yao, Z.; Hu, J. Laser peen forming induced two way bending of thin sheet metals and its mechanisms. J. Appl. Phys. 2010, 108, 073117. [Google Scholar] [CrossRef]
- Hu, Y.; Han, Y.; Yao, Z.; Hu, J. Three-Dimensional Numerical Simulation and Experimental Study of Sheet Metal Bending by Laser Peen Forming. J. Manuf. Sci. Eng. 2010, 132, 061001. [Google Scholar] [CrossRef]
- Zhou, W.F.; Ren, X.; Wang, C.C.; Yang, X.Q.; Larson, E.A. Residual stress induced convex bending in laser peen formed aluminum alloy. J. Laser Appl. 2018, 30, 12001. [Google Scholar] [CrossRef]
- Yu, Q.; Dong, Z.; Miao, R.; Deng, X.; Chen, L. Bending deformation of laser peened aluminium alloy with uniform rectangular spots. Mater. Sci. Technol. 2015, 32, 9–14. [Google Scholar] [CrossRef]
- Rao, X.; Ye, Y.; Zhao, L.; Ren, X.; Li, L. Experimental Study on Special-Shaped Parts of 2024 Aluminum Alloys by Nano-Laser Peen Forming. Laser Optoelectron. Prog. 2018, 55, 021407. [Google Scholar] [CrossRef]
- Qiao, H.; Sun, B.; Zhao, J.; Lu, Y.; Cao, Z. Numerical modeling of residual stress field for linear polarized laser oblique shock peening. Optik 2019, 186, 52–62. [Google Scholar] [CrossRef]
- Ye, Y.; Zeng, R.; Nie, Z.; Ren, Y.; Ren, X. Researches on the curvature adjustment of metal sheet induced by laser shock forming through experiments and simulations. Int. J. Adv. Manuf. Technol. 2020, 108, 2791–2802. [Google Scholar] [CrossRef]
- Ngiejunbwen, L.A.; Shangguan, J.; Asamoah, E. Experimental investigation of sheet metal forming of Aluminum 2024 using nanosecond pulsed Nd: YAG laser. Opt. Laser Technol. 2020, 133, 106528. [Google Scholar] [CrossRef]
- Ballard, P. Contraintes residuelles induites par impact rapide. Application au choc-laser. In Metallurgy; Ecole Polytechnique: Paris, France, 1991. [Google Scholar]
- Peyre, P.; Fabbro, R. Laser shock processing: A review of the physics and applications. Opt. Quantum. Electron. 1995, 27, 1213–1229. [Google Scholar]
- Zhou, N.; Qiao, D.J. Material Dynamics under Pulse Beam Radiation; National Defense Industry Press: Beijing, China, 2002. (In Chinese) [Google Scholar]
- Berthe, L.; Fabbro, R.; Peyre, P.; Tollier, L.; Bartnicki, E. Shock waves from a water-confined laser-generated plasma. J. Appl. Phys. 1997, 82, 2826–2832. [Google Scholar] [CrossRef]
- Fabbro, R.; Fournier, J.; Ballard, P.; Devaux, D.; Virmont, J. Physical study of laser-produced plasma in confined geometry. J. Appl. Phys. 1990, 68, 775–784. [Google Scholar] [CrossRef]
- Calder, C.; Goldsmith, W. Plastic deformation and perforation of thin plates resulting from projectile impact. Int. J. Solids Struct. 1971, 7, 863–881. [Google Scholar] [CrossRef]
Figure 1.
Bending mechanisms of laser peen forming: (a) SGM (b) SBM.

Figure 2.
An illustration of deformation scheme for convex bending in laser peen formation.

Figure 3.
Schematic of concave deformation in laser shock forming. (a) polar coordinates (b) concave deformation.
Figure 3.
Schematic of concave deformation in laser shock forming. (a) polar coordinates (b) concave deformation.

Figure 4.
Schematic of laser-induced shock wave pressure vs. time.

Figure 5.
(a) Processing strategies of laser peen forming and (b) the typical results.

Figure 6.
Geometrical schematic of a curvature.

Figure 7.
Curvatures of 3 mm 2024 aluminum alloy vs. laser pulse energies.

Figure 8.
Stresses measured along the depth of 3 mm target for laser energies of 4 J and 6 J.

Figure 9.
Curvatures of 1 mm 2024 aluminum alloy vs. laser pulse energies.

Figure 10.
Curvatures of 2 mm 2024 aluminum alloy vs. laser pulse energies: (a) experiment (b) analytical model.
Figure 10.
Curvatures of 2 mm 2024 aluminum alloy vs. laser pulse energies: (a) experiment (b) analytical model.


Table 1.
Curvatures k0 of the target sheets calculated using the analytical model.
| Targets | Laser Energies/J | 2 | 4 | 5 | 6 | |
|---|---|---|---|---|---|---|
| Curvatures/10−4 mm−1 | ||||||
| 3 mm | k01 | −1.67 | −7.64 | −13.02 | −21.14 | |
| k02 | Lp < Lth, 0 | Lp < Lth, 0 | Lp < Lth, 0 | Lp < Lth, 0 | ||
| k0 | −1.67 | −7.64 | −13.02 | −21.14 | ||
| 2 mm | k01 | −4.79 | −37.01 | −88.71 | −223.09 | |
| k02 | Lp < Lth, 0 | Lp < Lth, 0 | 14.43 | 21.63 | ||
| k0 | −4.79 | −37.01 | −74.28 | −201.46 | ||
| 1 mm | k01 | −45.85 | Lp > h, 0 | Lp > h, 0 | Lp > h, 0 | |
| k02 | 31.01 | 46.29 | 50.87 | 55.71 | ||
| k0 | −14.84 | 46.29 | 50.87 | 55.71 | ||
Table 2.
Parameters of 2024 aluminum alloy.
| Material | 2024 Aluminum Alloy |
|---|---|
| Density ρ | 2.7 g·cm−3 |
| Elastic modulus E | 72 GPa |
| Poisson’s ratio ν | 0.34 |
| Yield strength σY | 290 MPa |
Publisher’s Note: MDPI stays neutral with regard to jurisdictional claims in published maps and institutional affiliations. |
© 2021 by the authors. Licensee MDPI, Basel, Switzerland. This article is an open access article distributed under the terms and conditions of the Creative Commons Attribution (CC BY) license (http://creativecommons.org/licenses/by/4.0/).
Share and Cite
MDPI and ACS Style
Ye, Y.; Nie, Z.; Huang, X.; Ren, X.; Li, L. An Analytical Model for Estimating the Bending Curvatures of Metal Sheets in Laser Peen Forming. Materials 2021, 14, 462. https://0-doi-org.brum.beds.ac.uk/10.3390/ma14020462
AMA Style
Ye Y, Nie Z, Huang X, Ren X, Li L. An Analytical Model for Estimating the Bending Curvatures of Metal Sheets in Laser Peen Forming. Materials. 2021; 14(2):462. https://0-doi-org.brum.beds.ac.uk/10.3390/ma14020462
Chicago/Turabian StyleYe, Yunxia, Zeng Nie, Xu Huang, Xudong Ren, and Lin Li. 2021. "An Analytical Model for Estimating the Bending Curvatures of Metal Sheets in Laser Peen Forming" Materials 14, no. 2: 462. https://0-doi-org.brum.beds.ac.uk/10.3390/ma14020462
Note that from the first issue of 2016, this journal uses article numbers instead of page numbers. See further details here.