Residual Mechanical Properties and Constitutive Model of High-Strength Seismic Steel Bars through Different Cooling Rates


Abstract
:1. Introduction
2. Materials and Methods
2.1. Materials
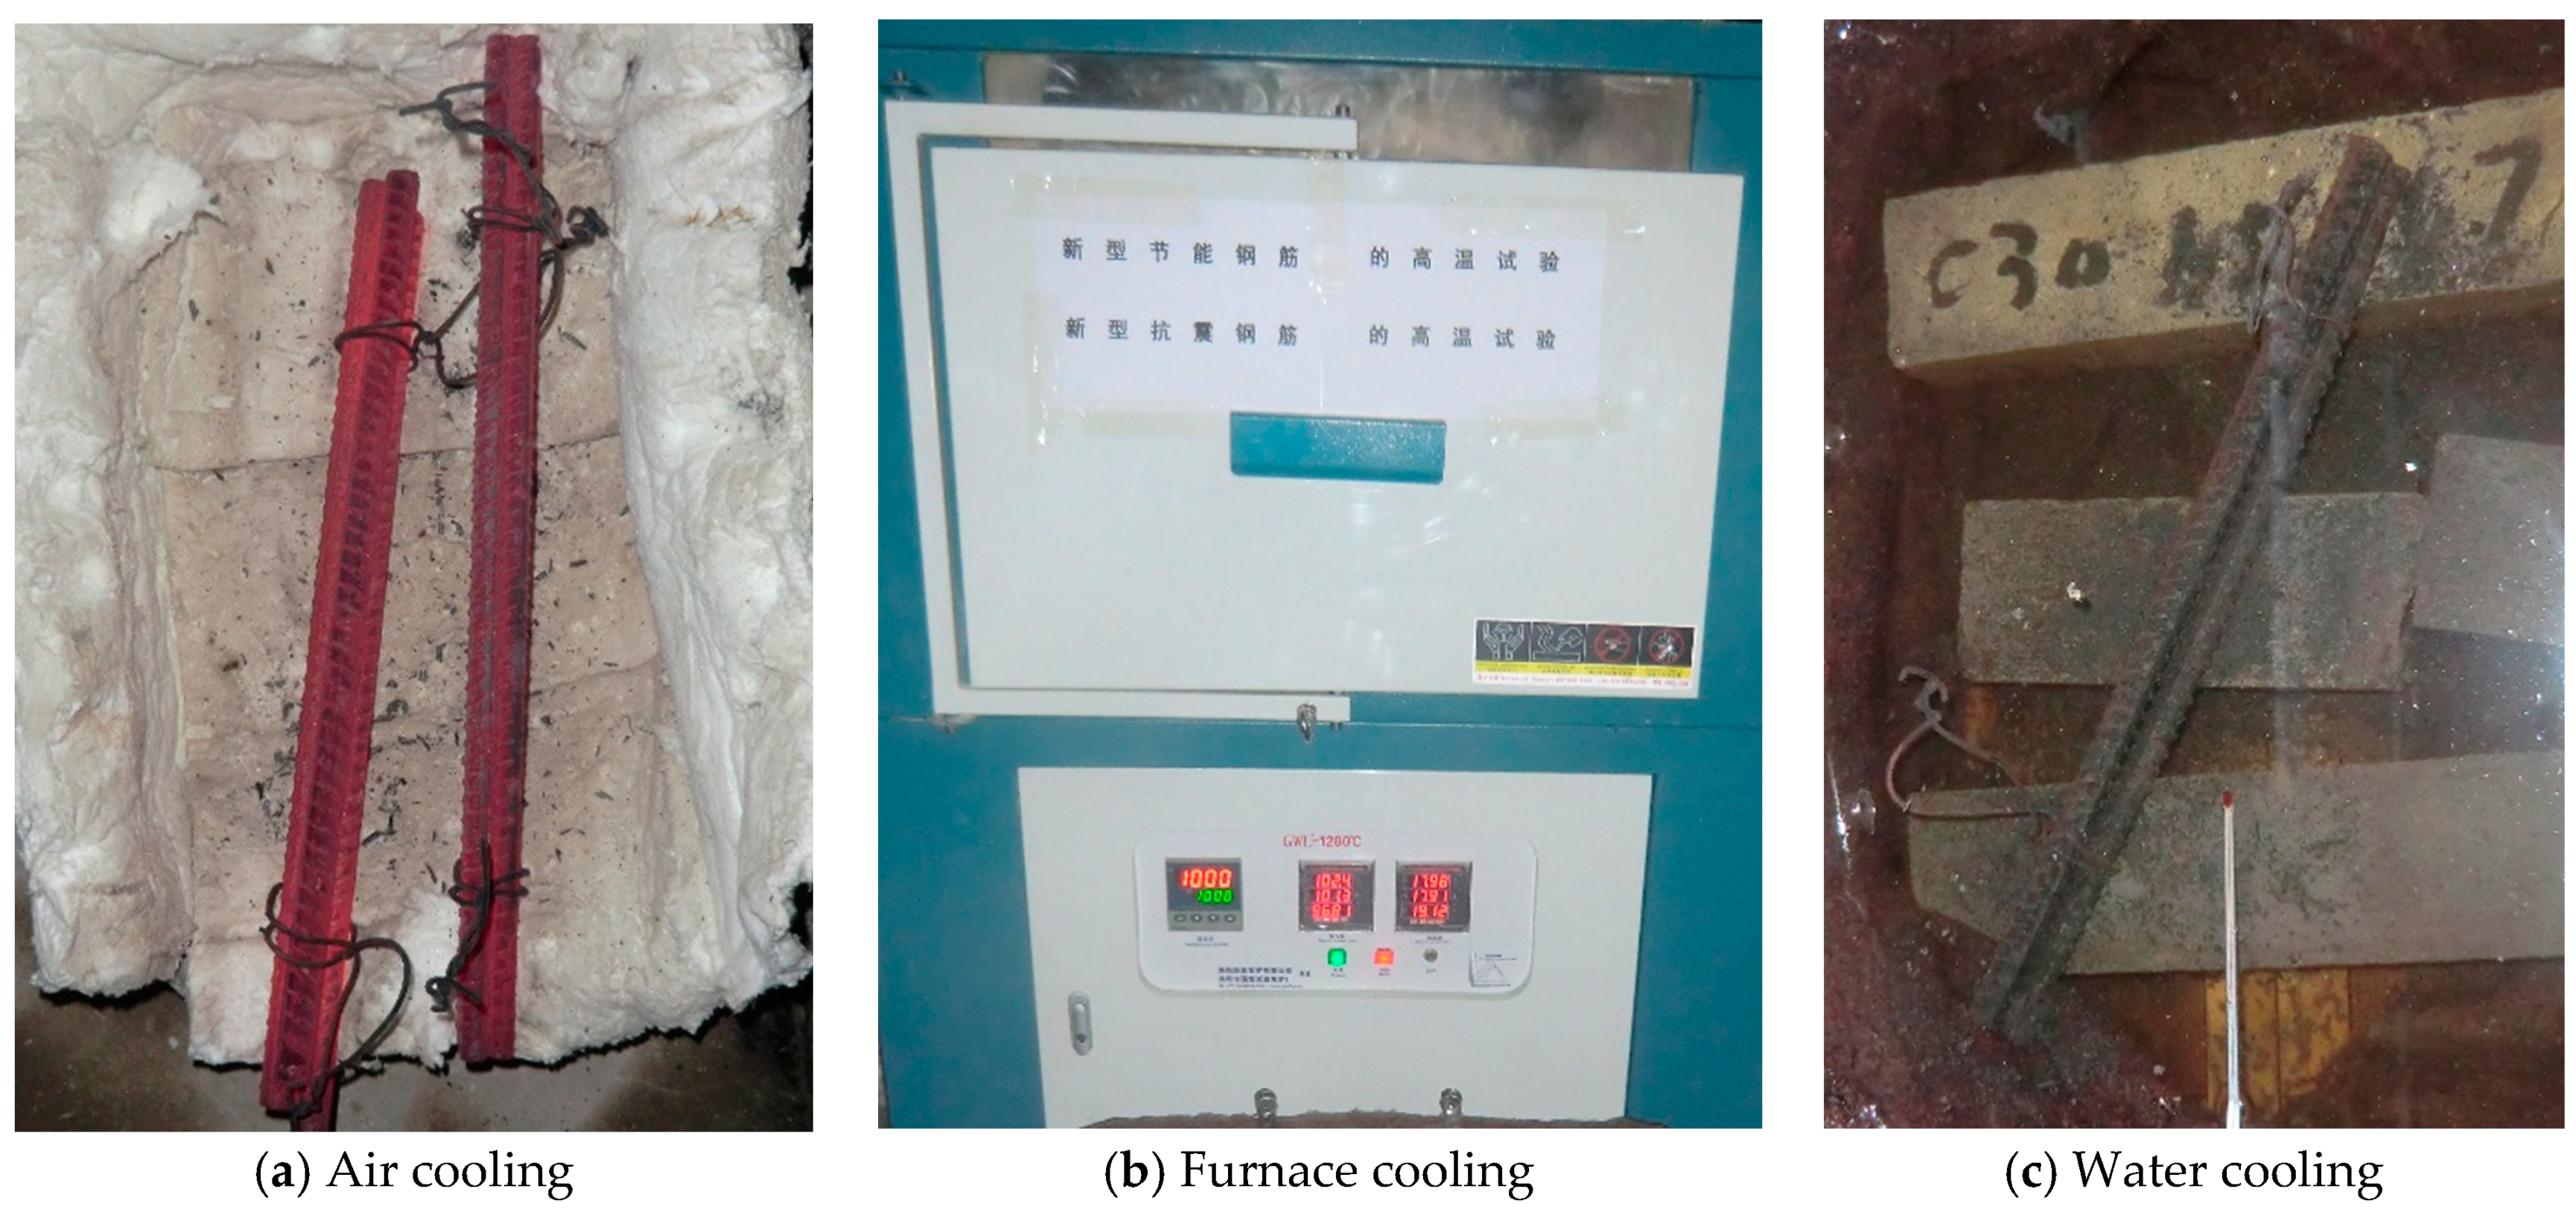
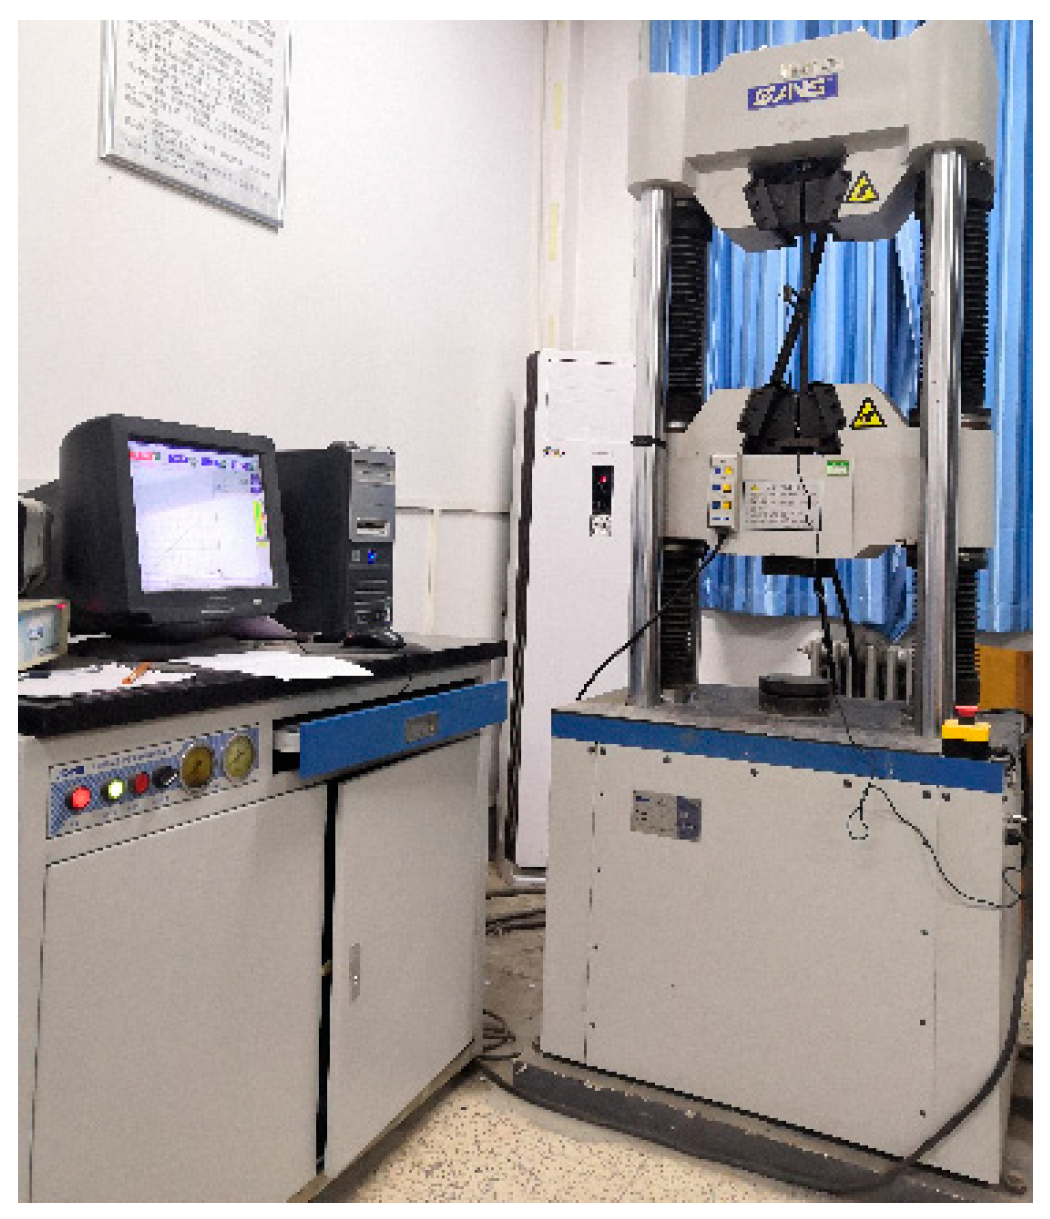
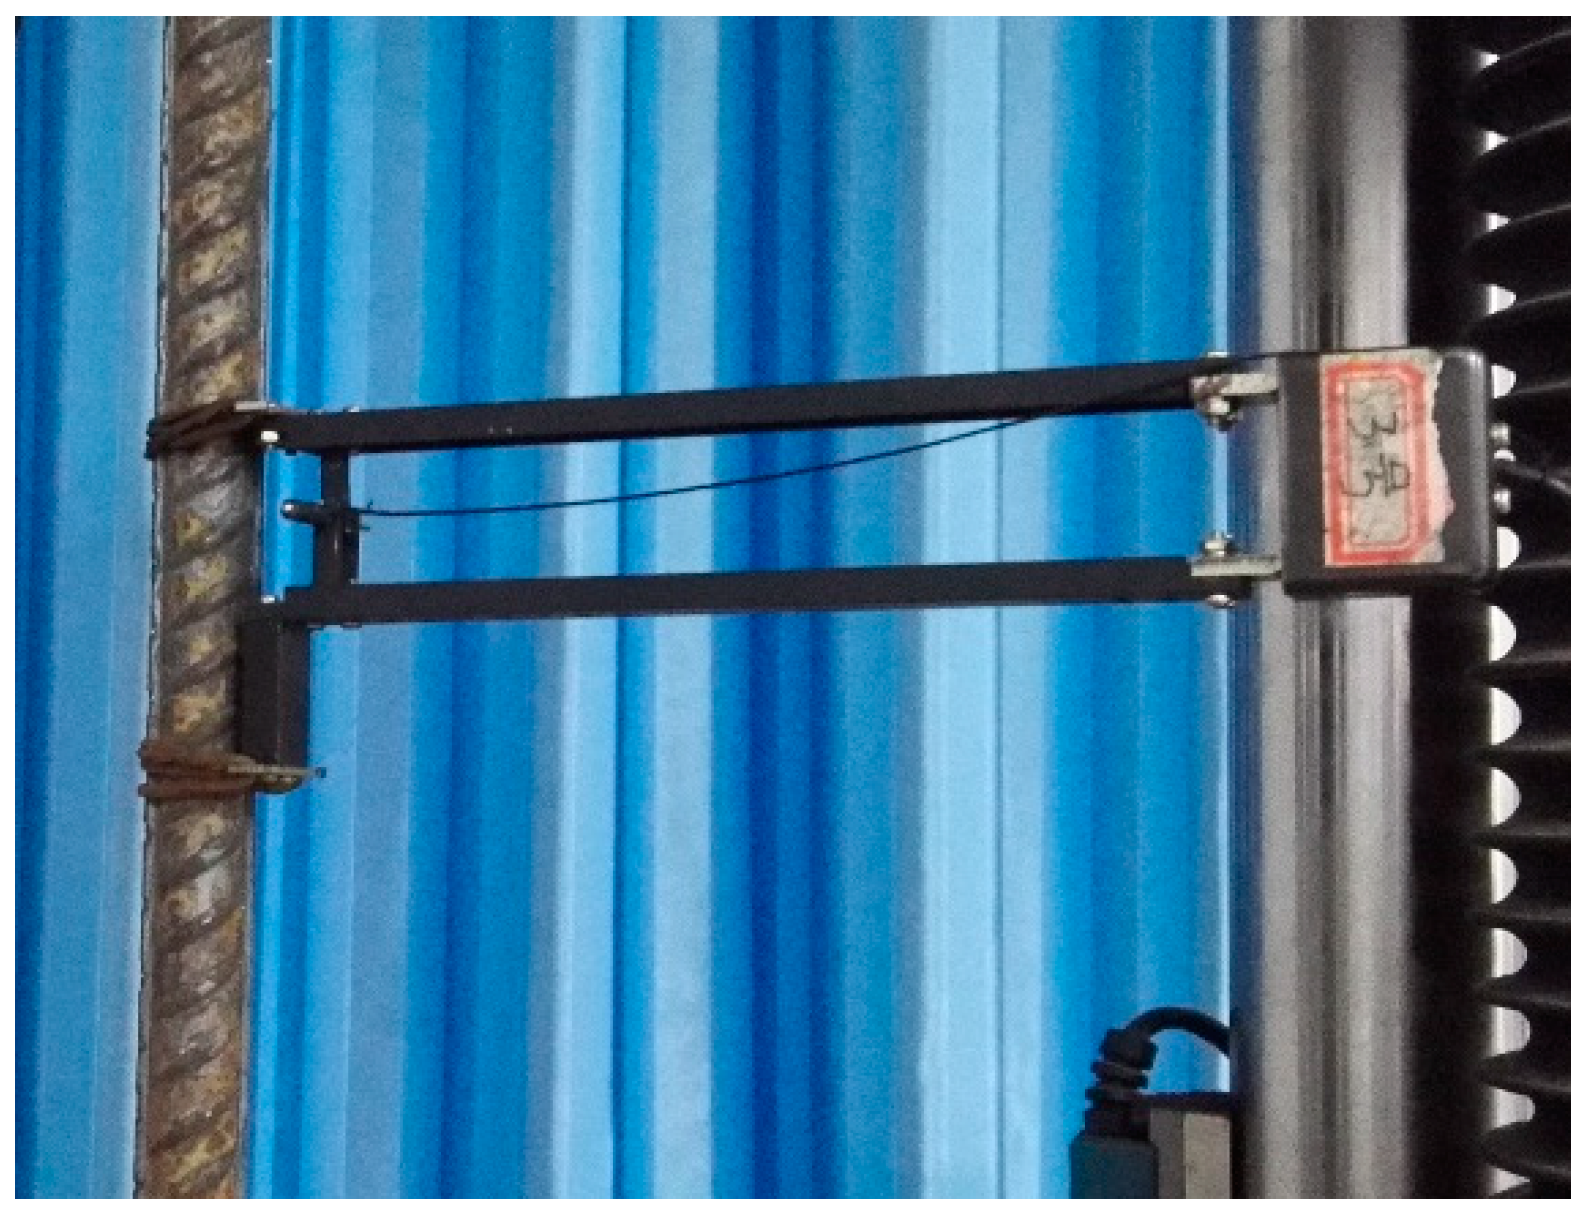
2.2. Methods
3. Results and Discussion
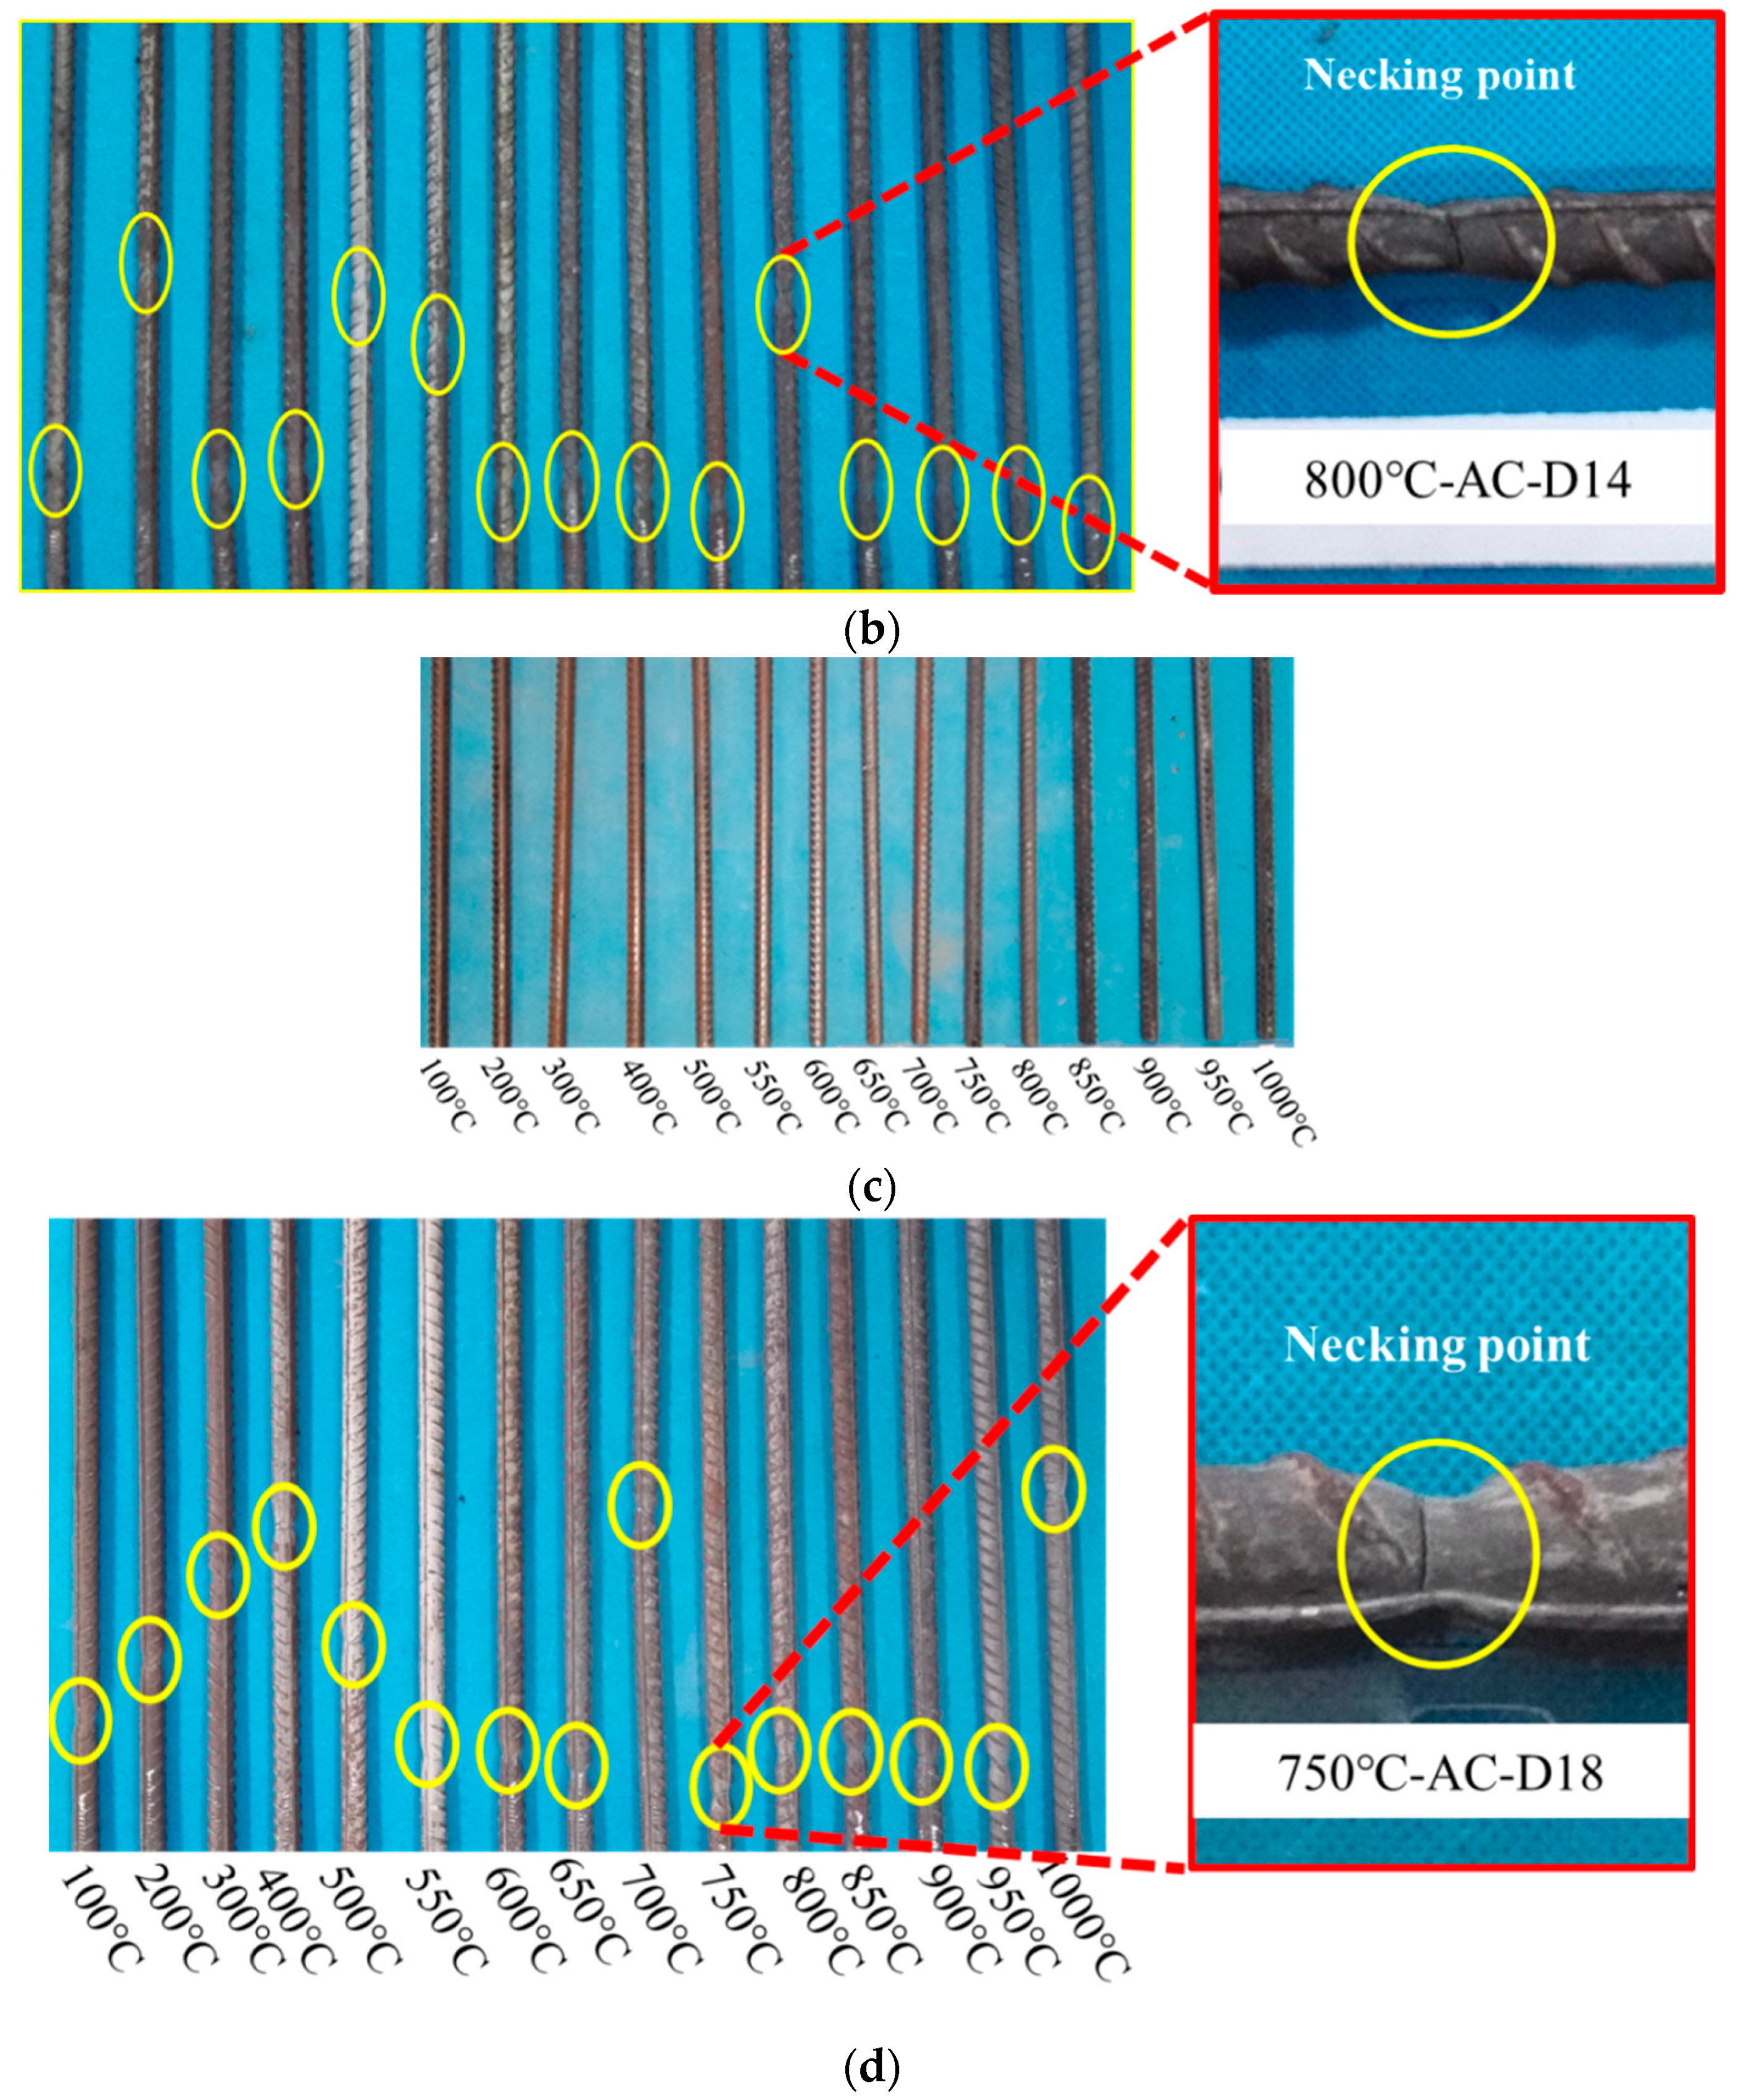
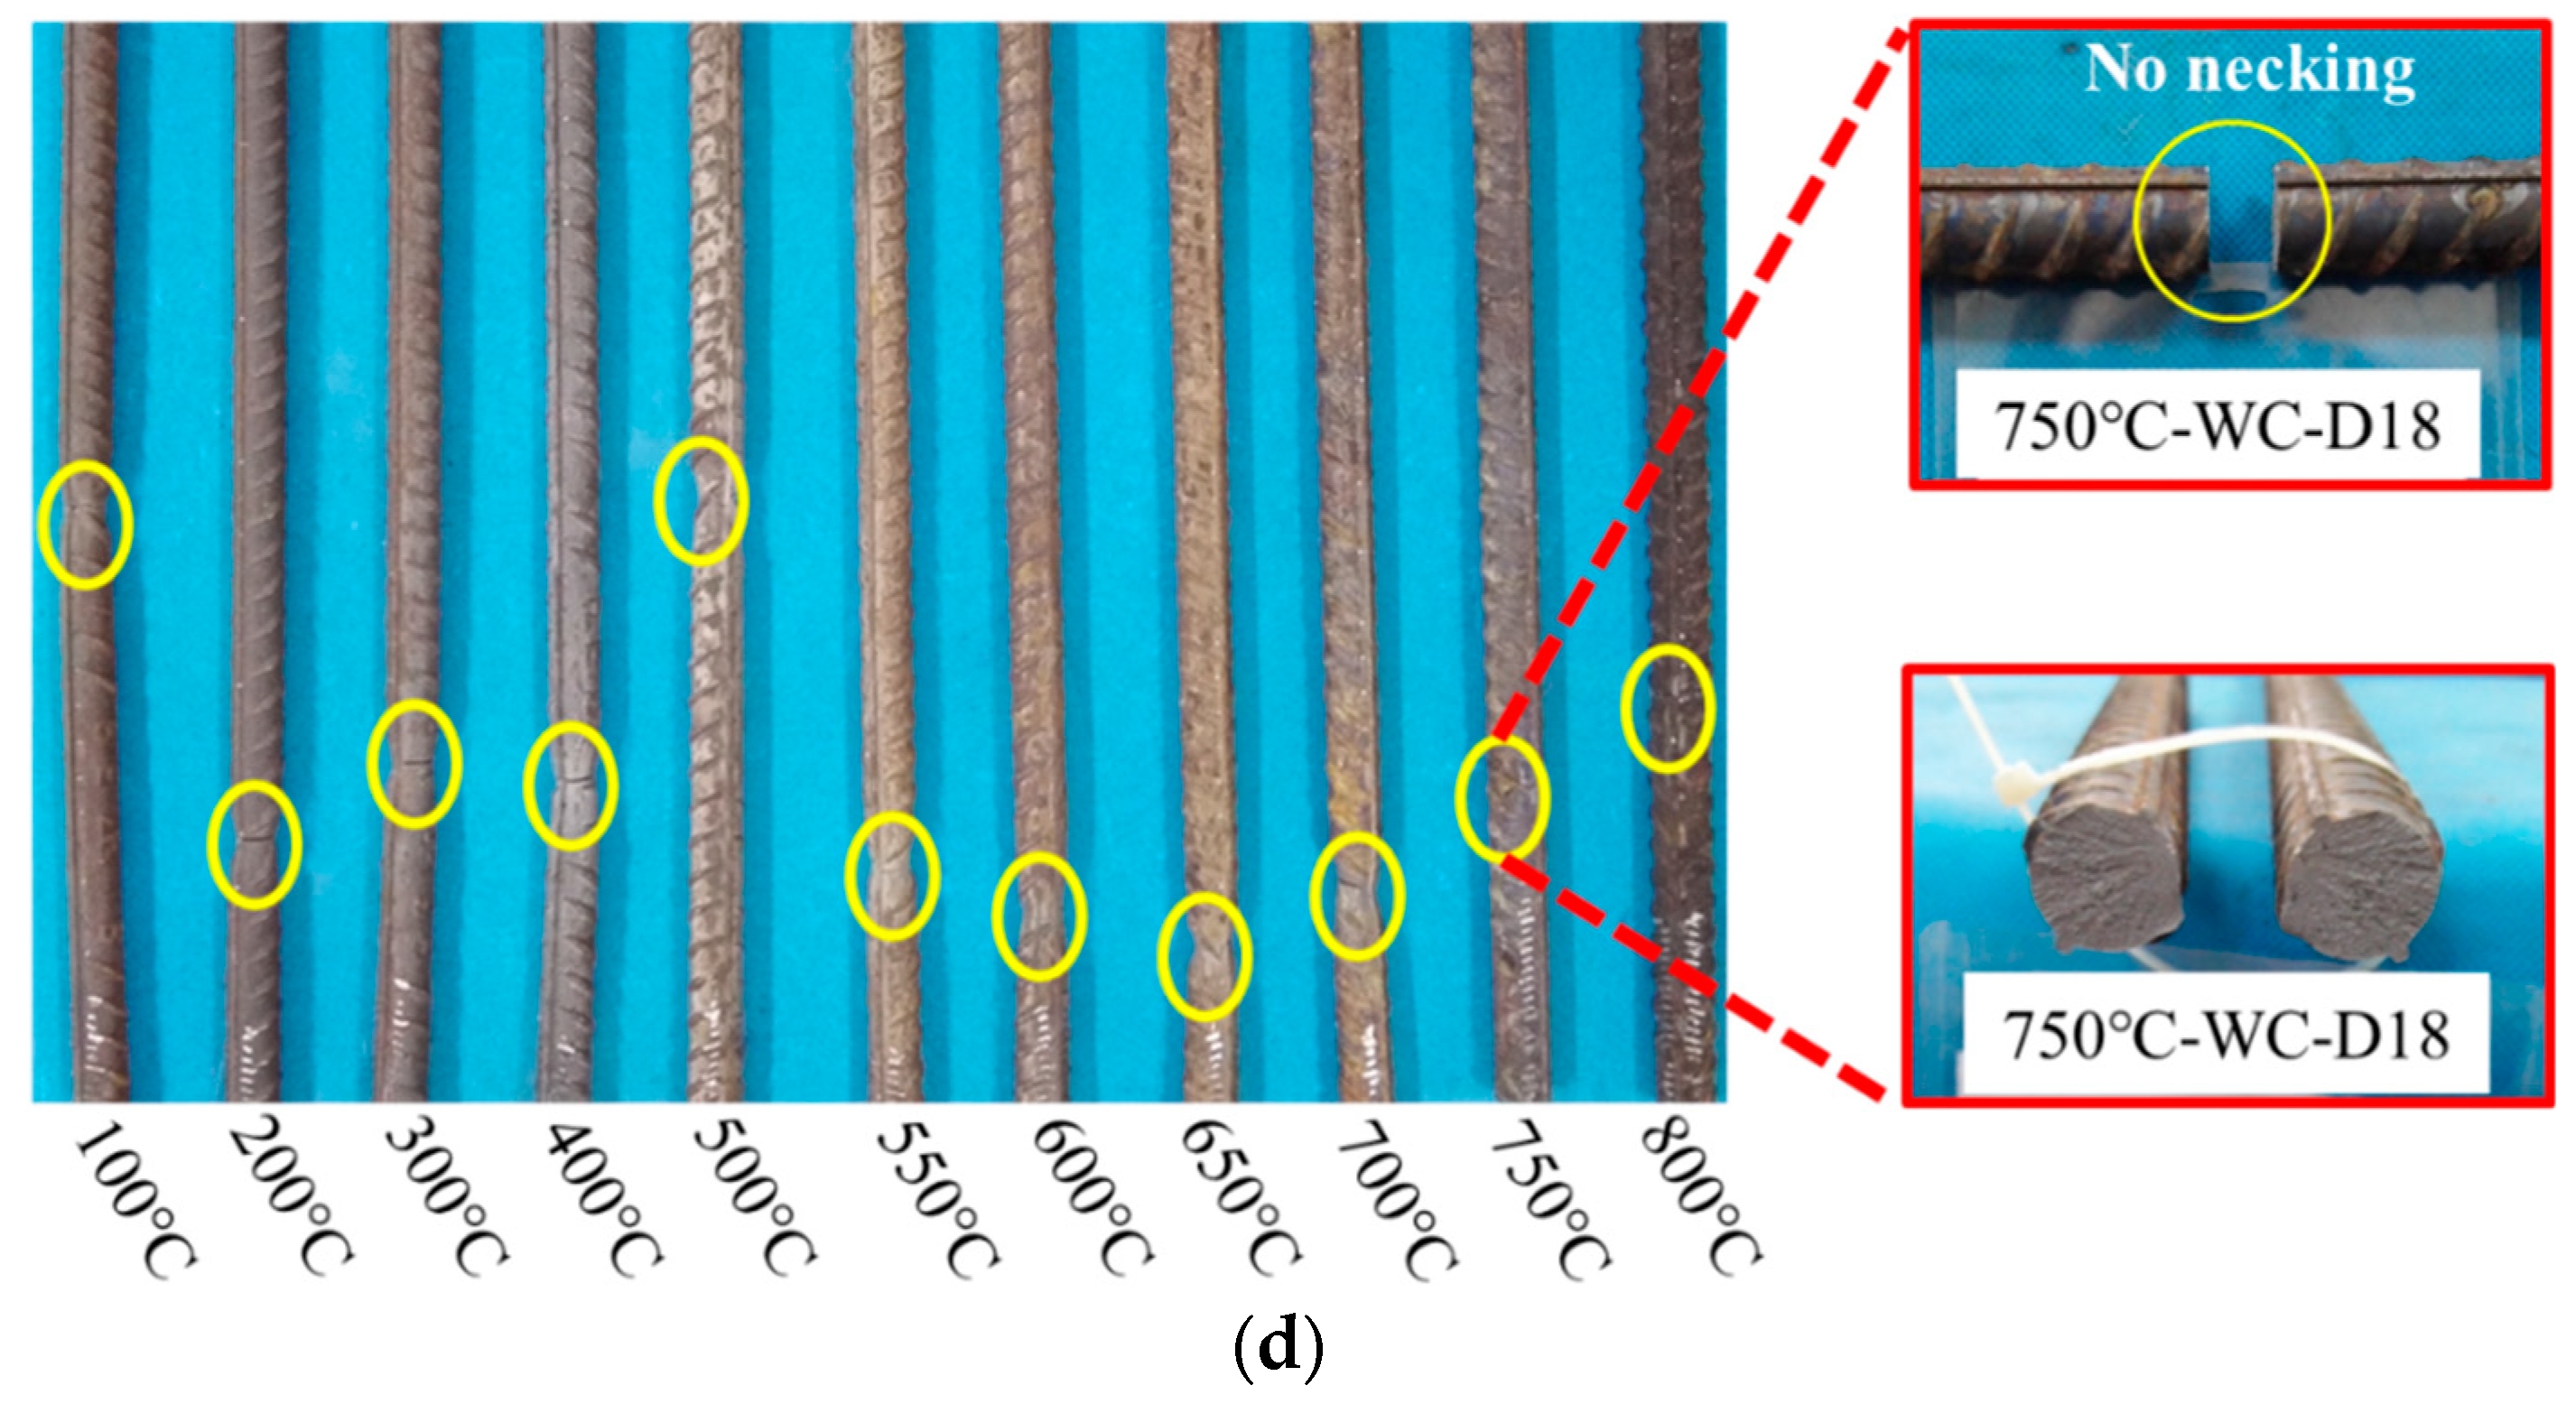
3.1. Morphology Analysis
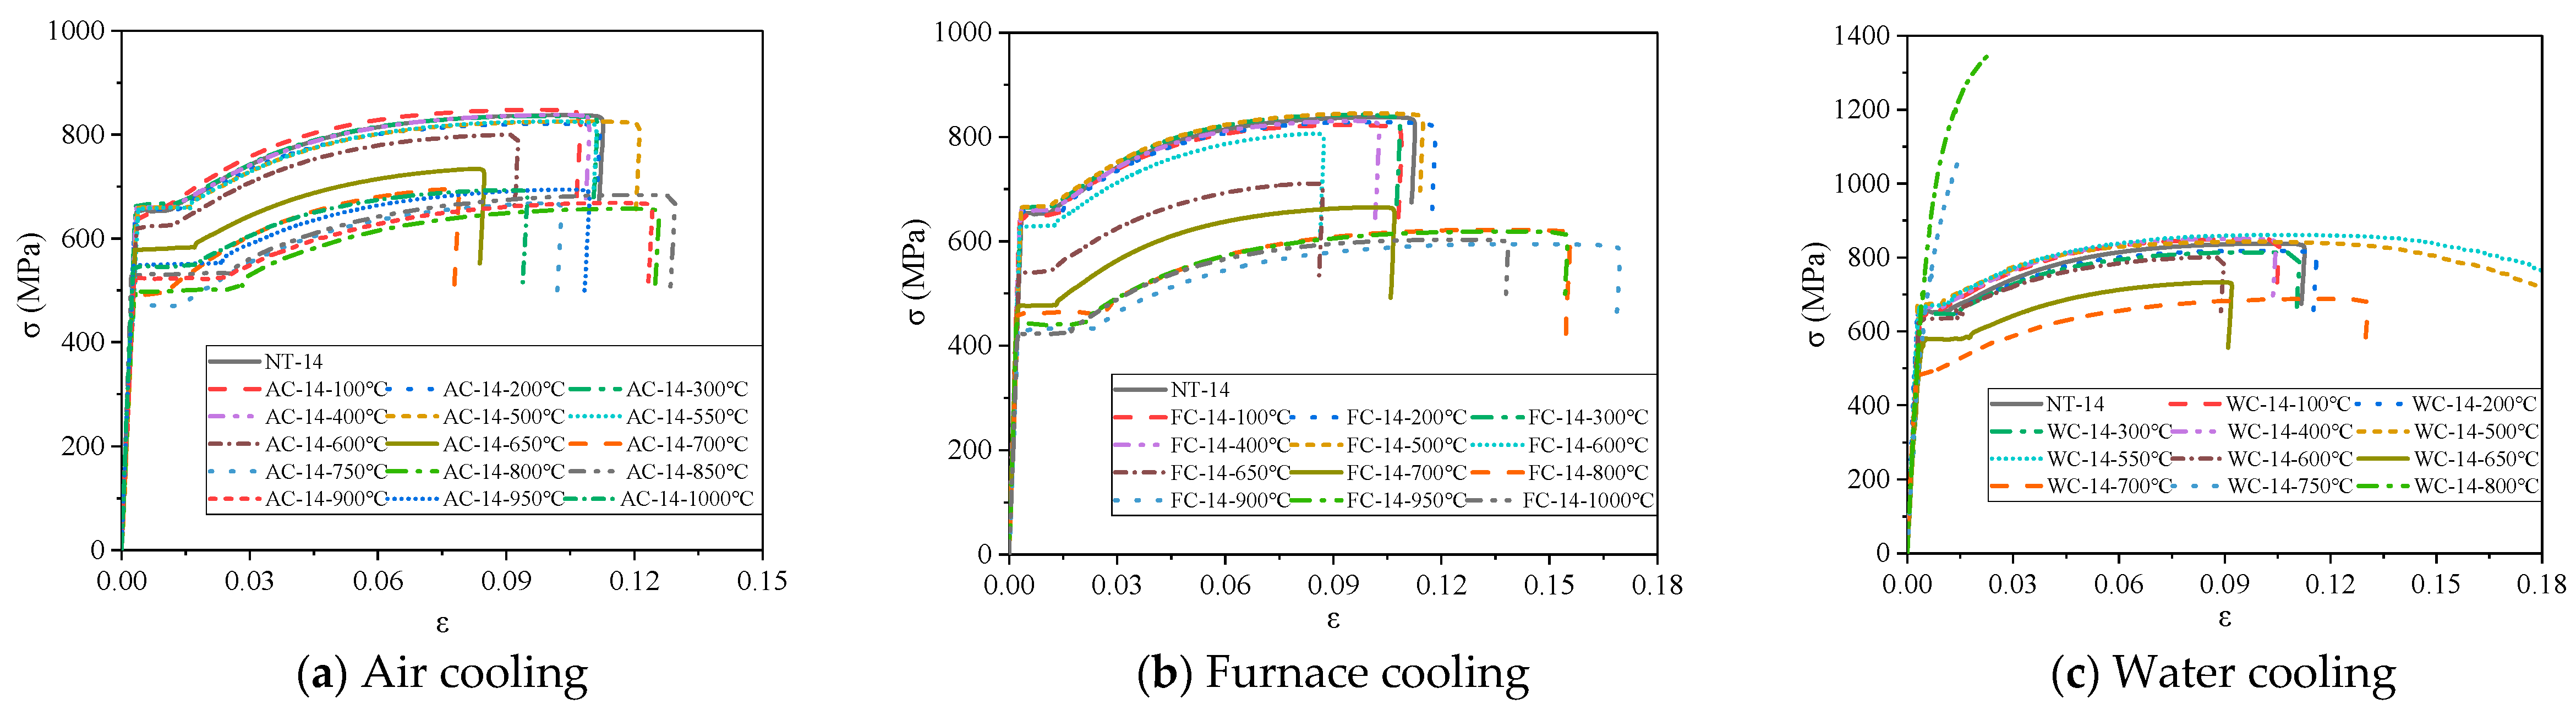
3.2. Stress–Strain Curves
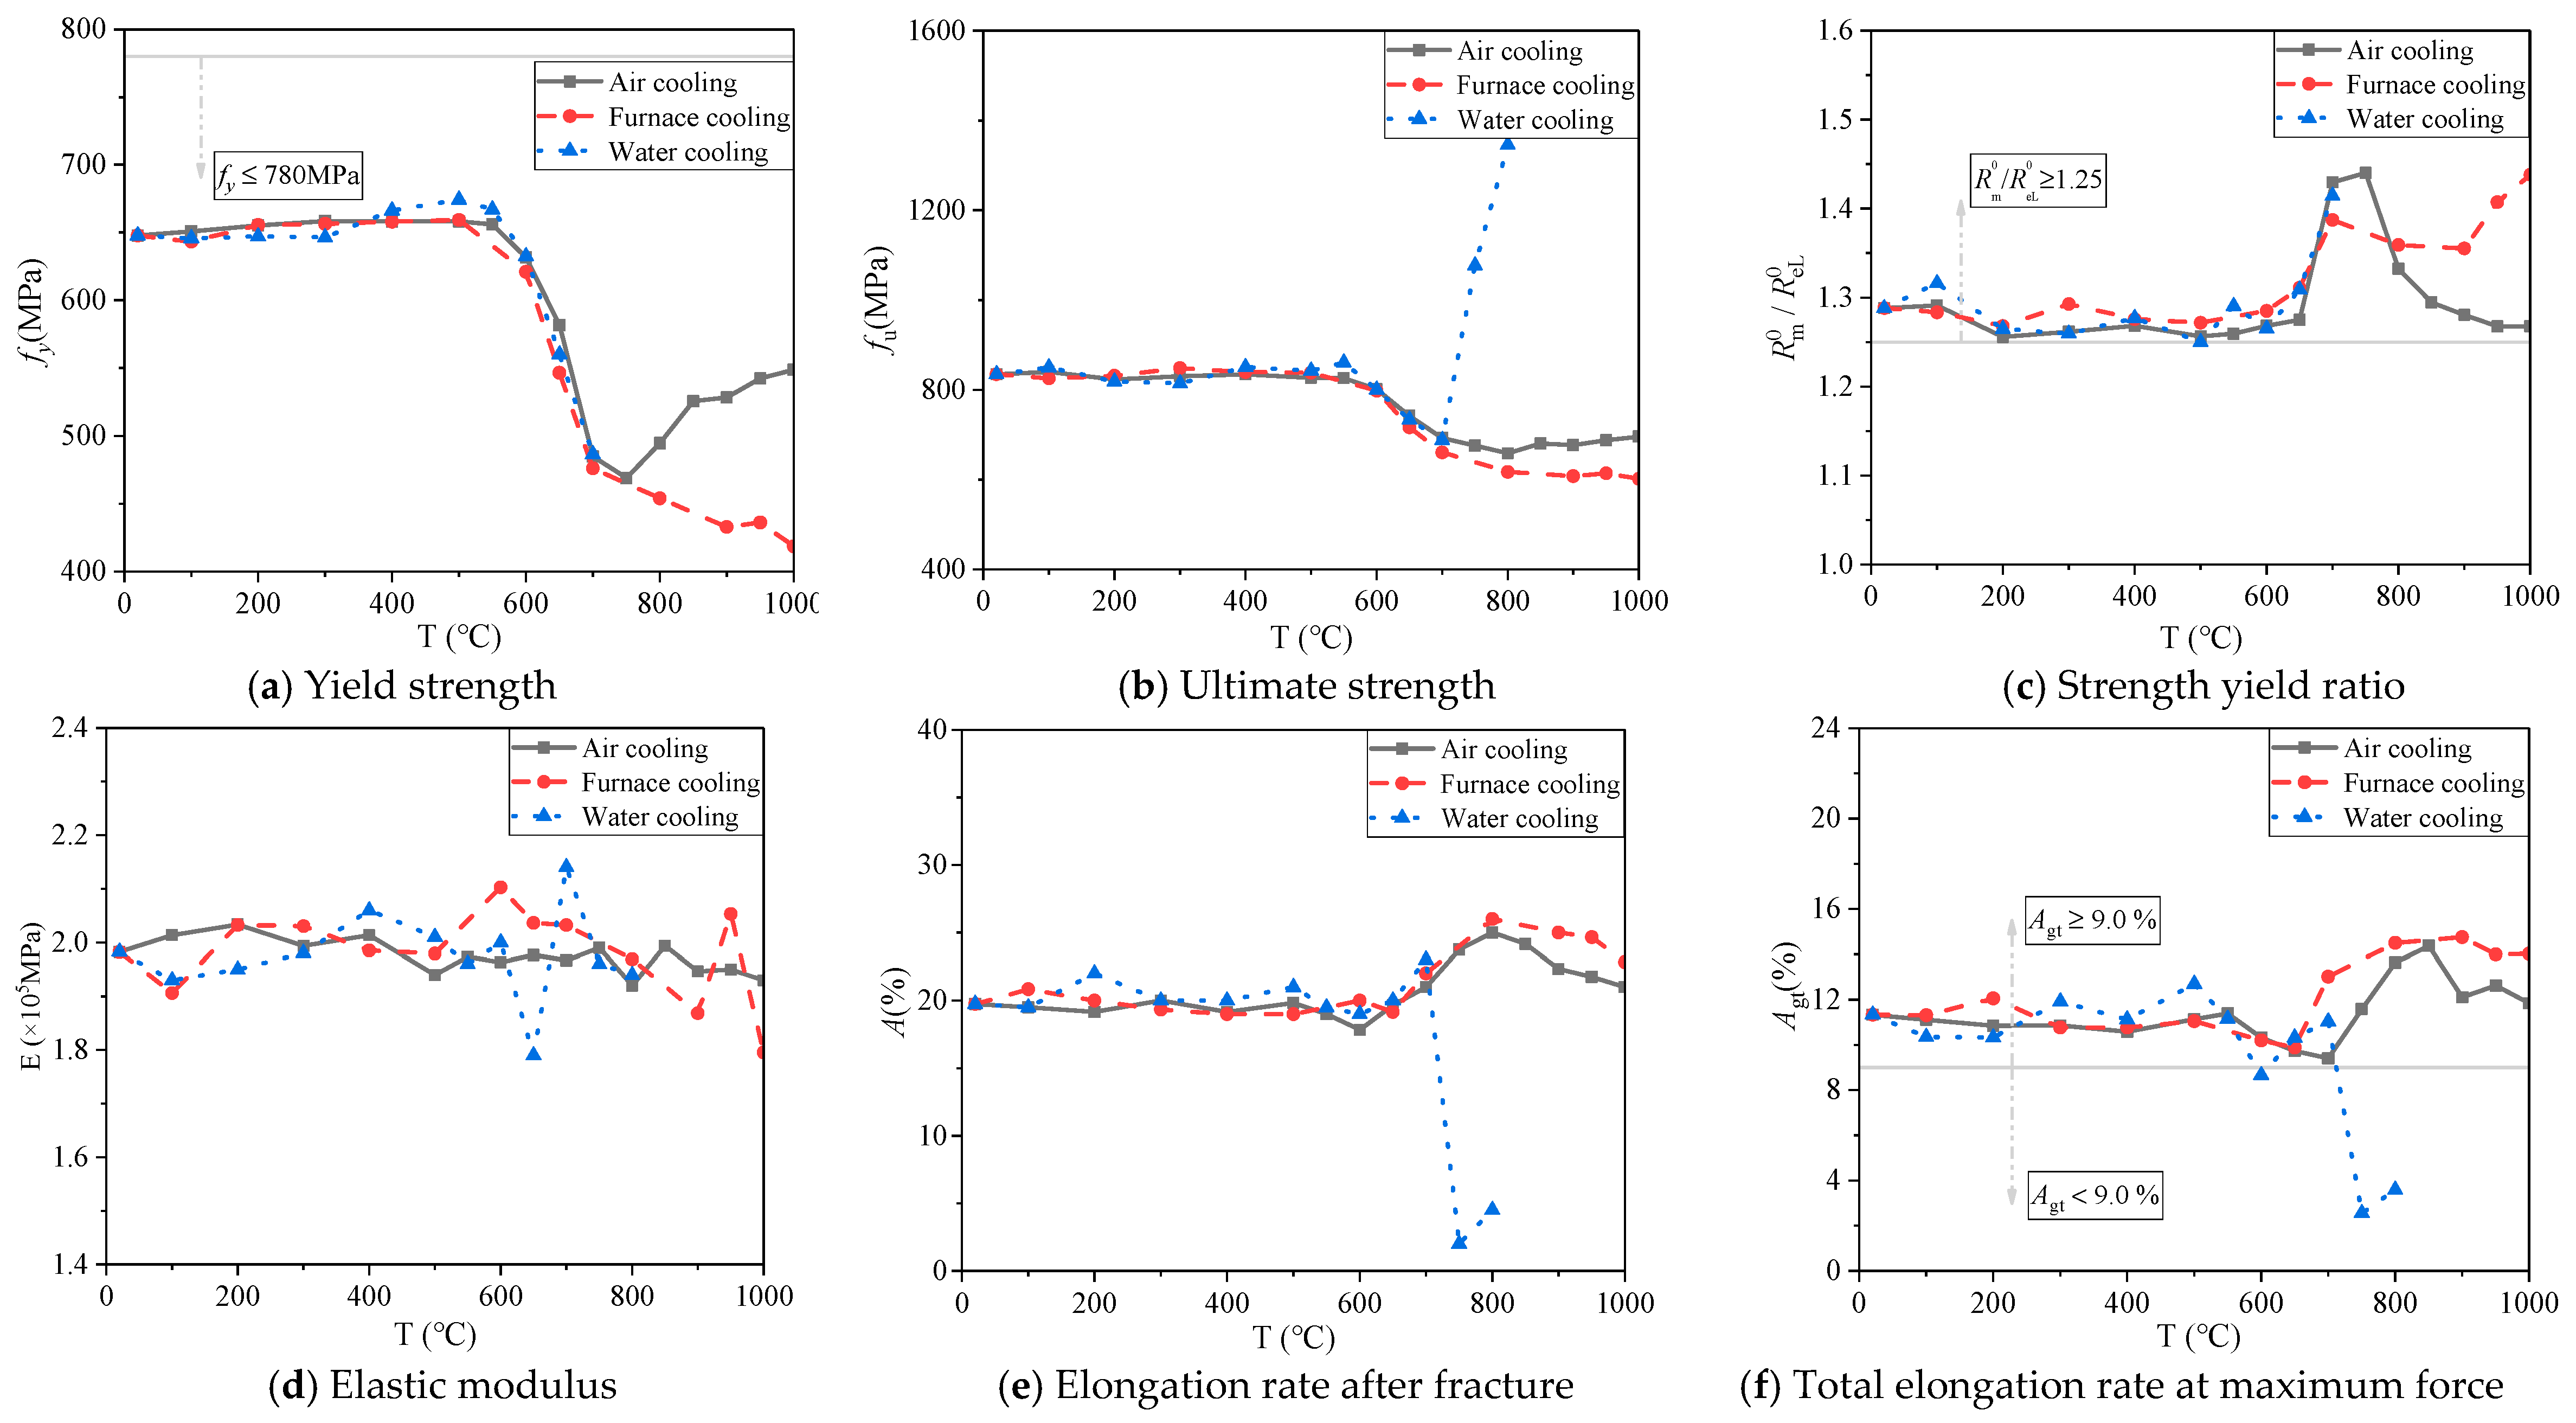
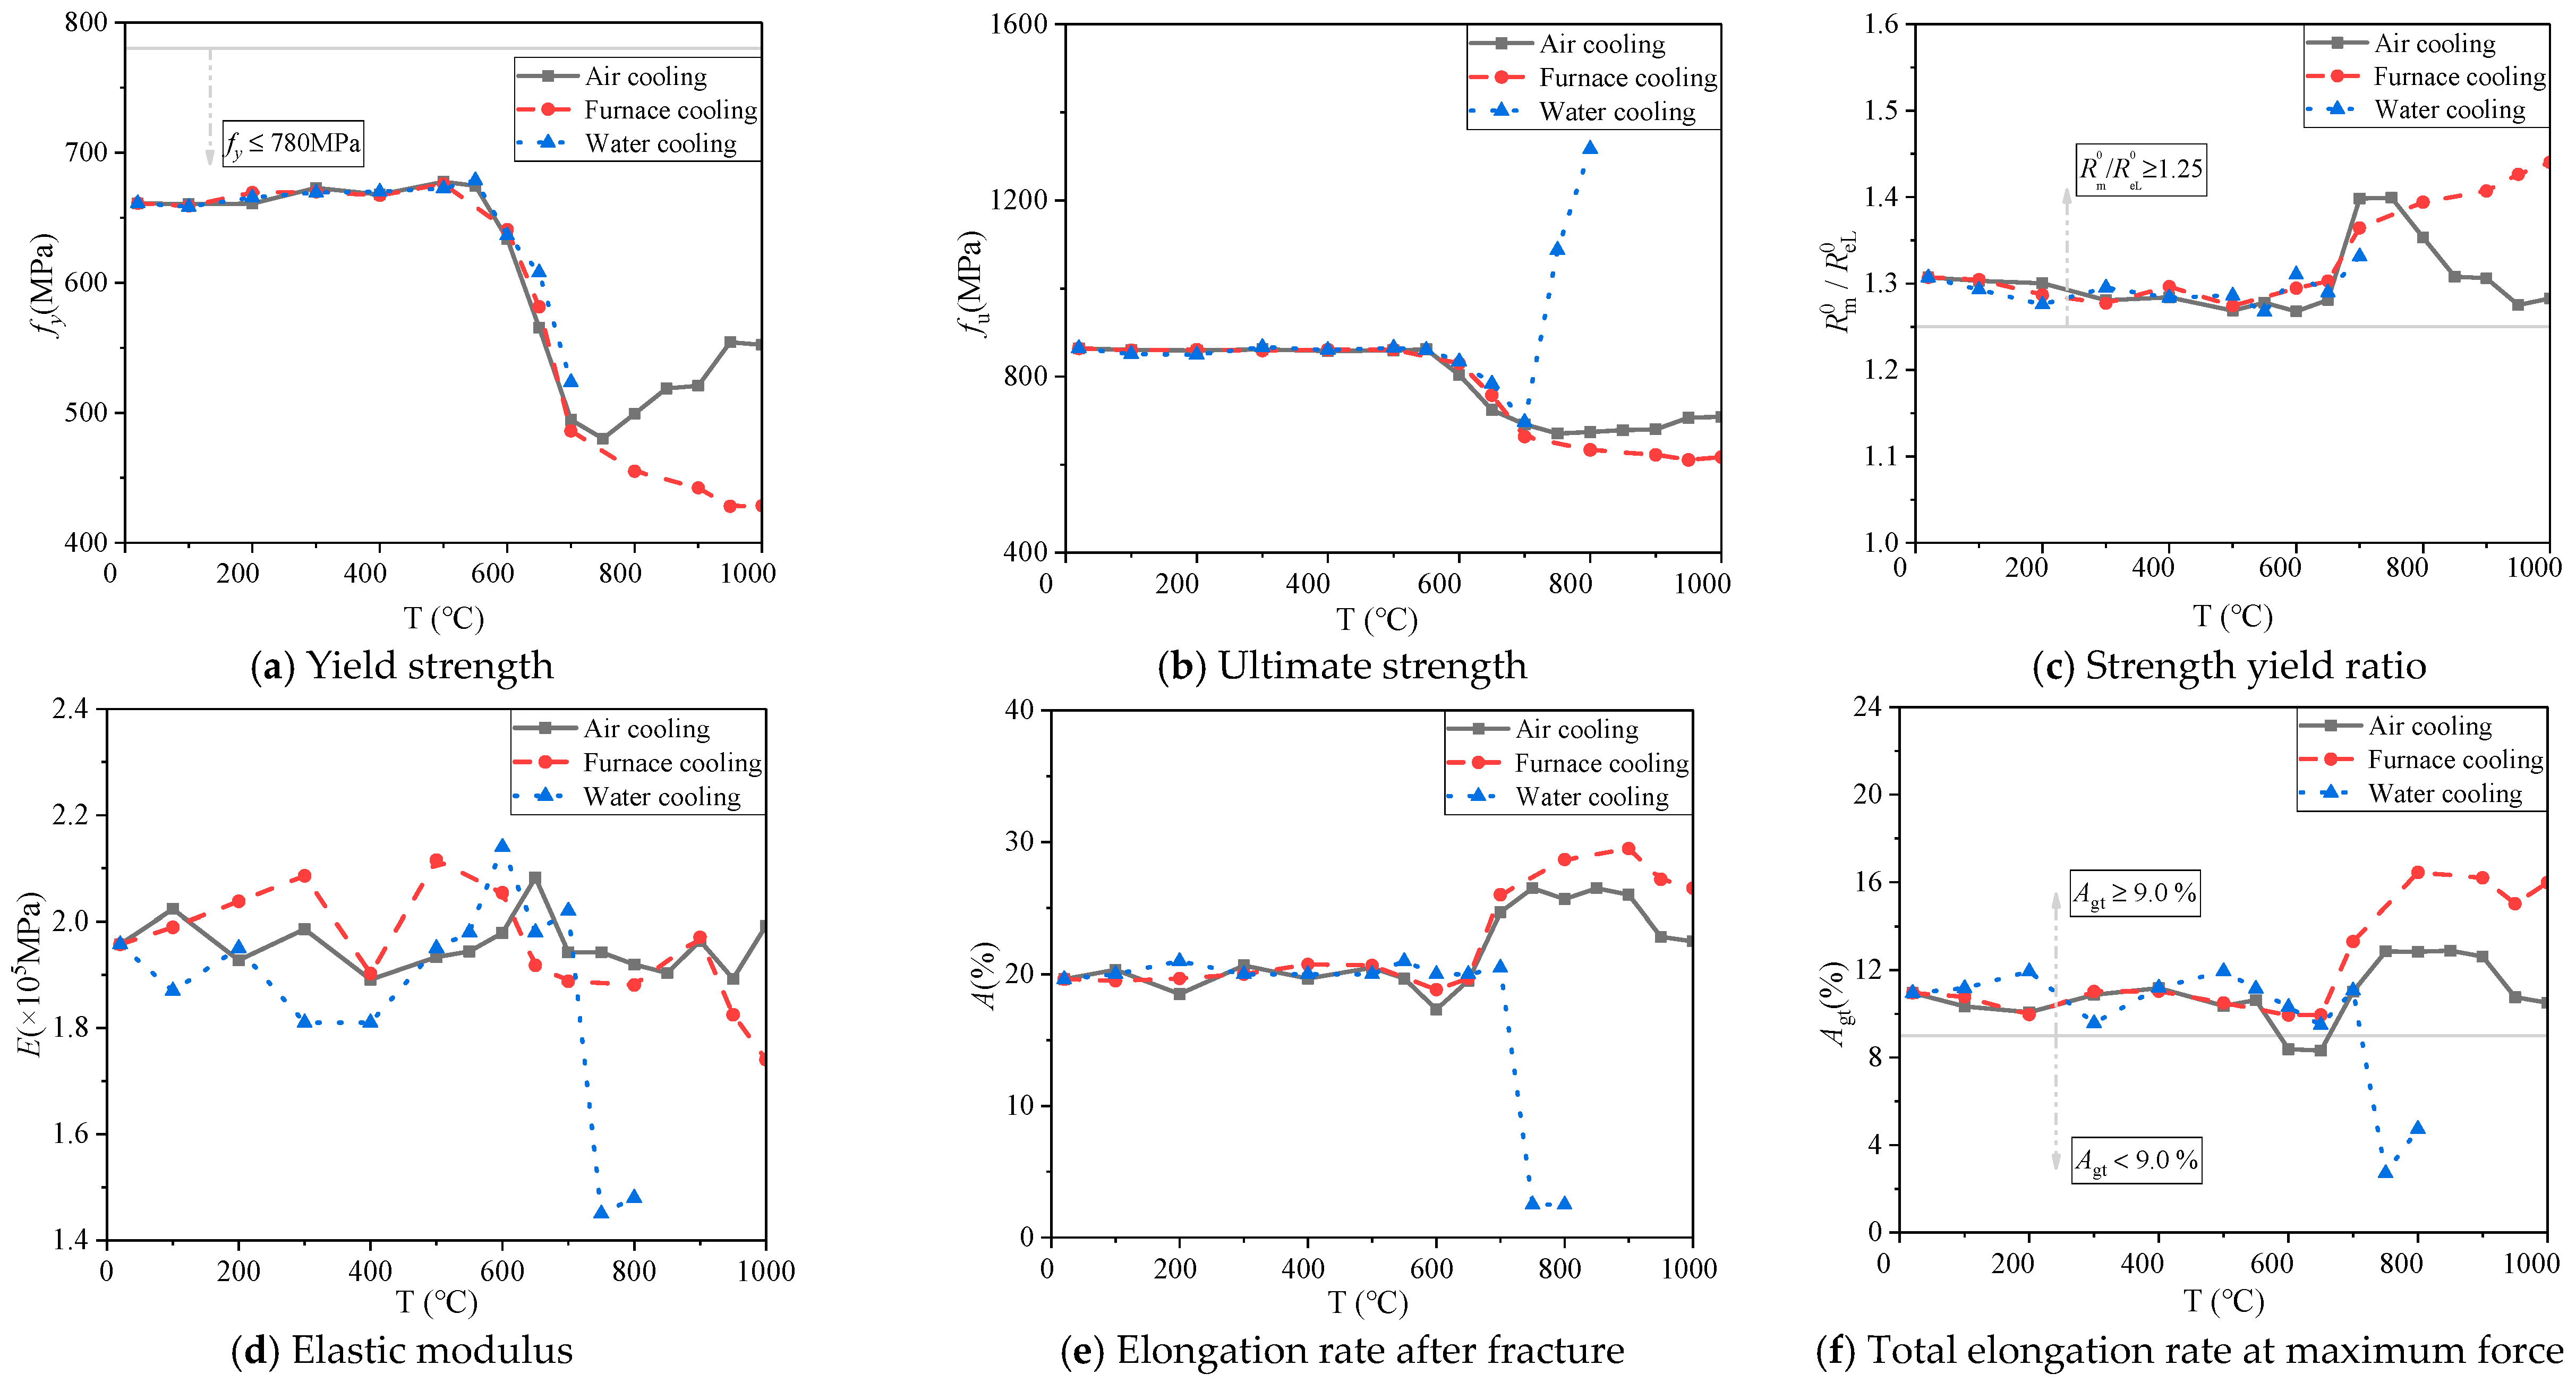
3.3. Mechanical Parameters
3.4. Seismic Resistance Analysis
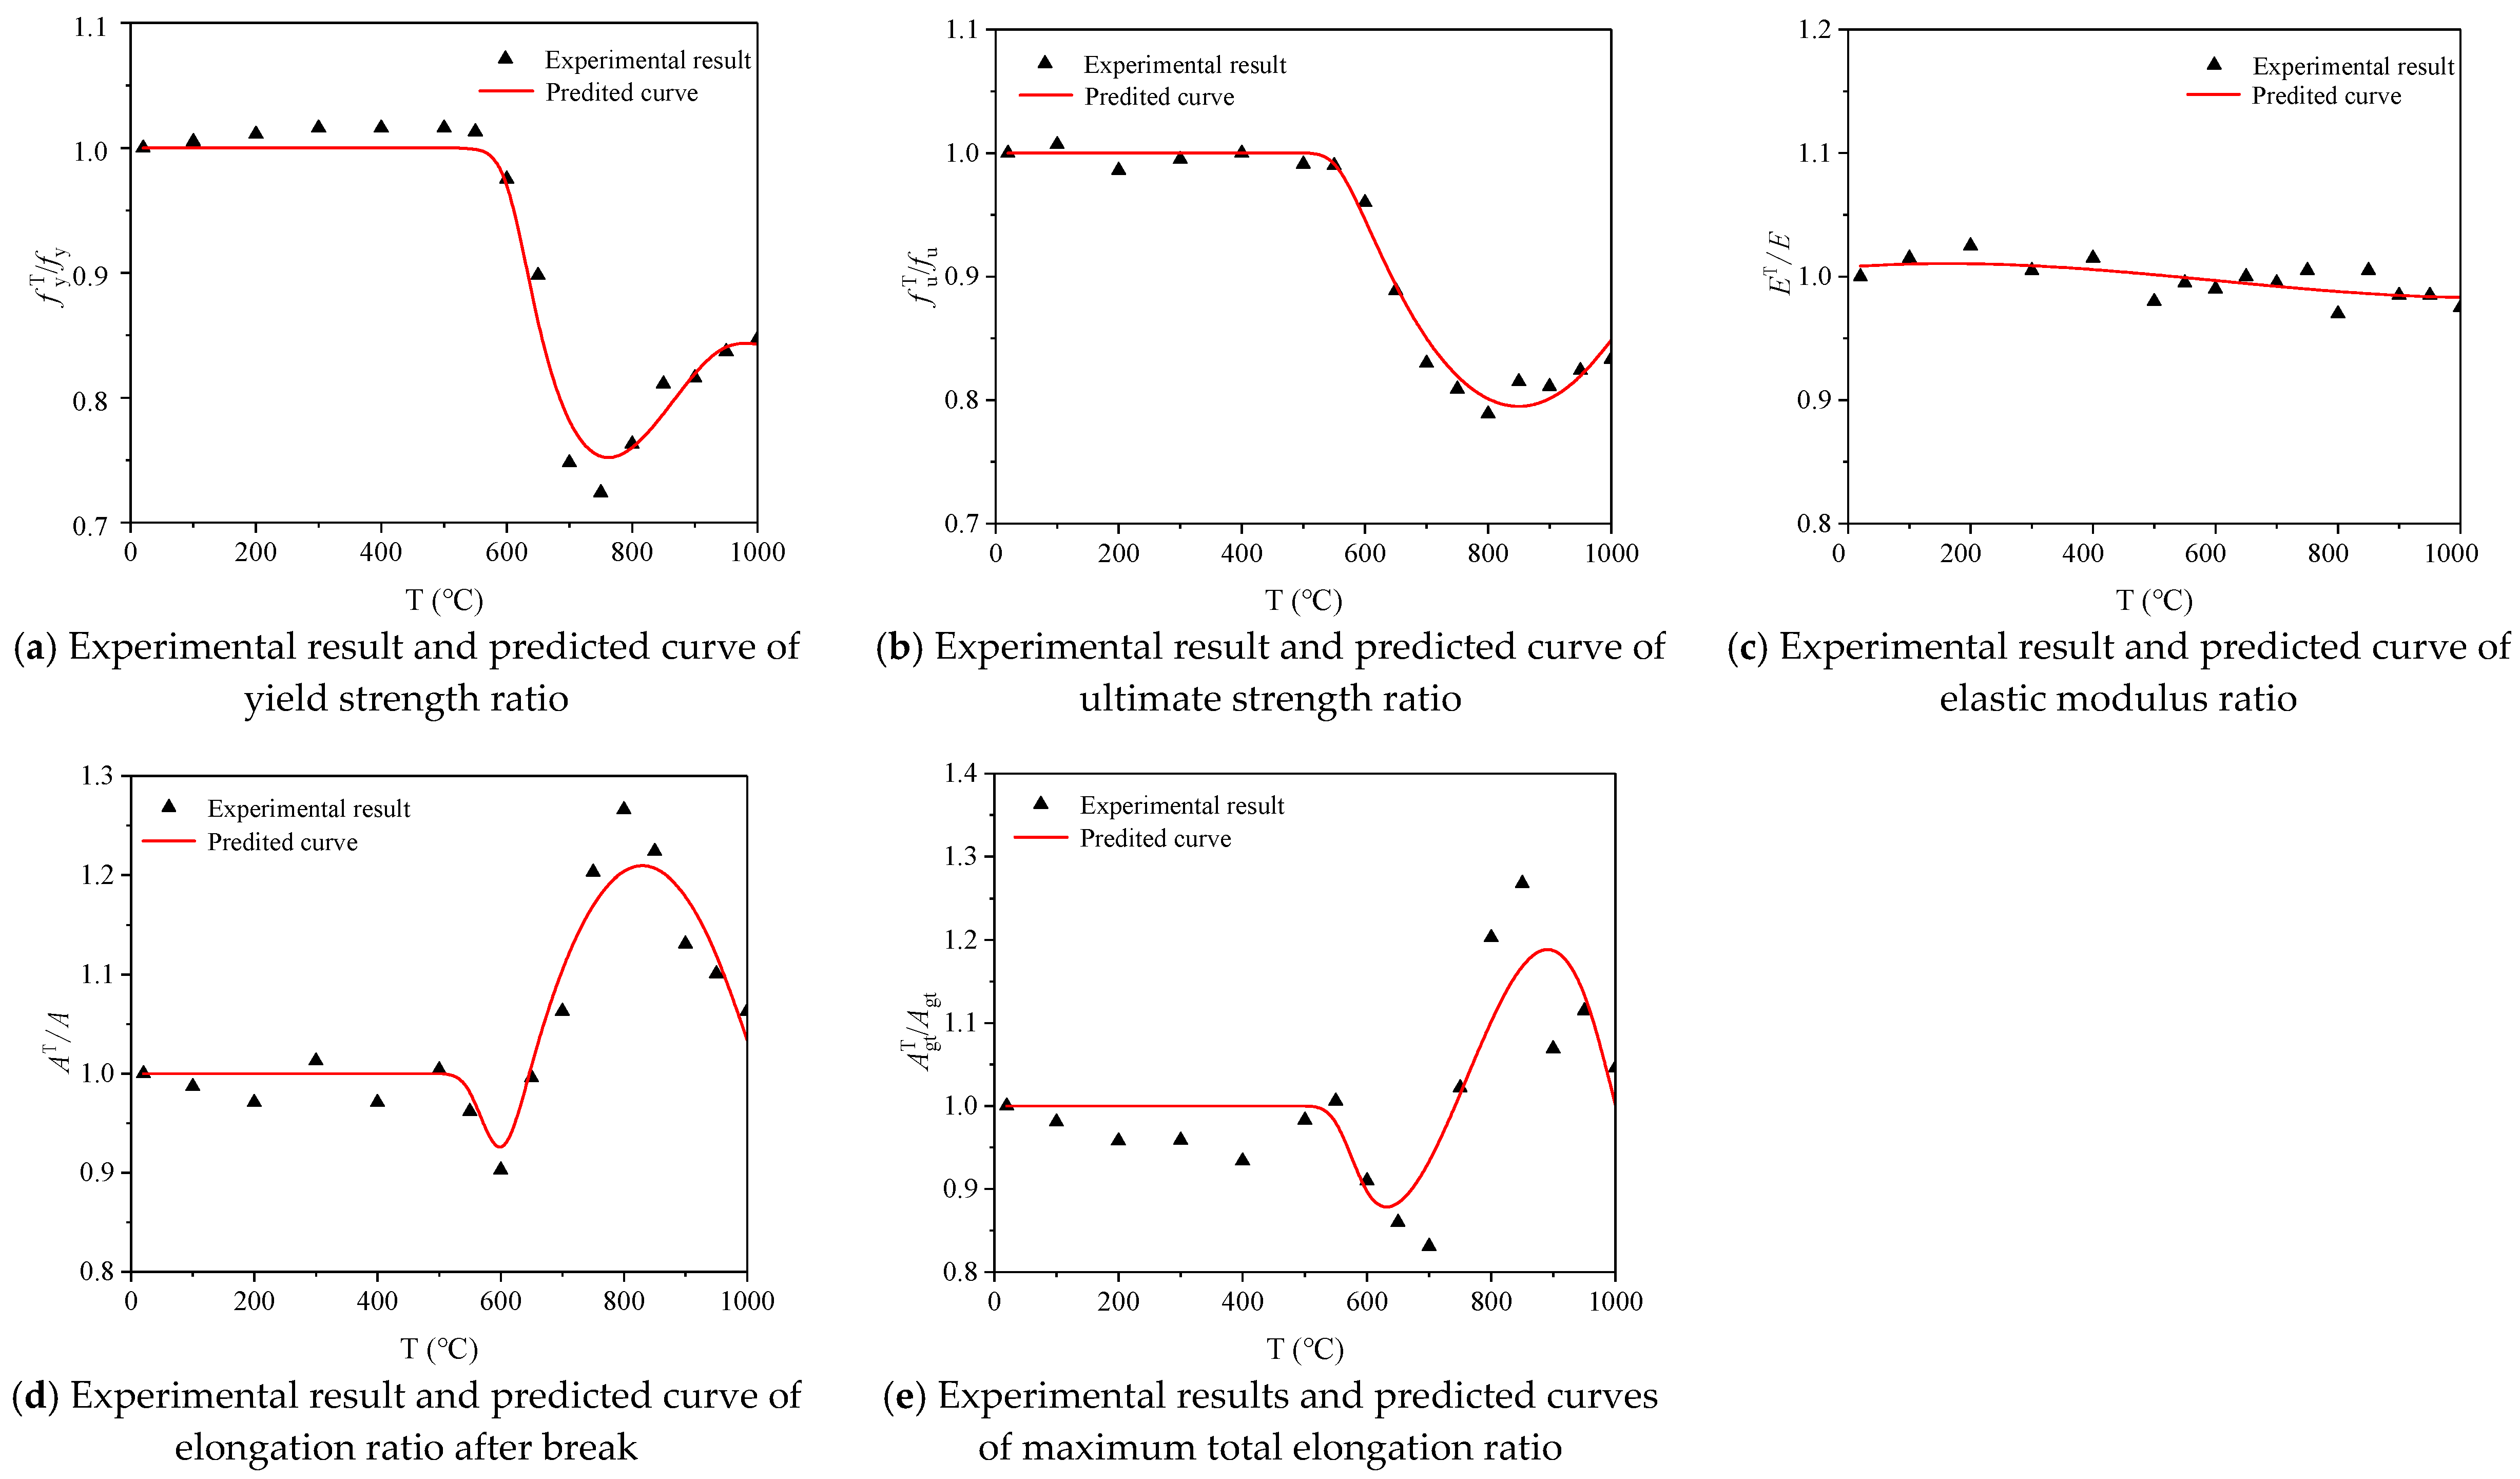
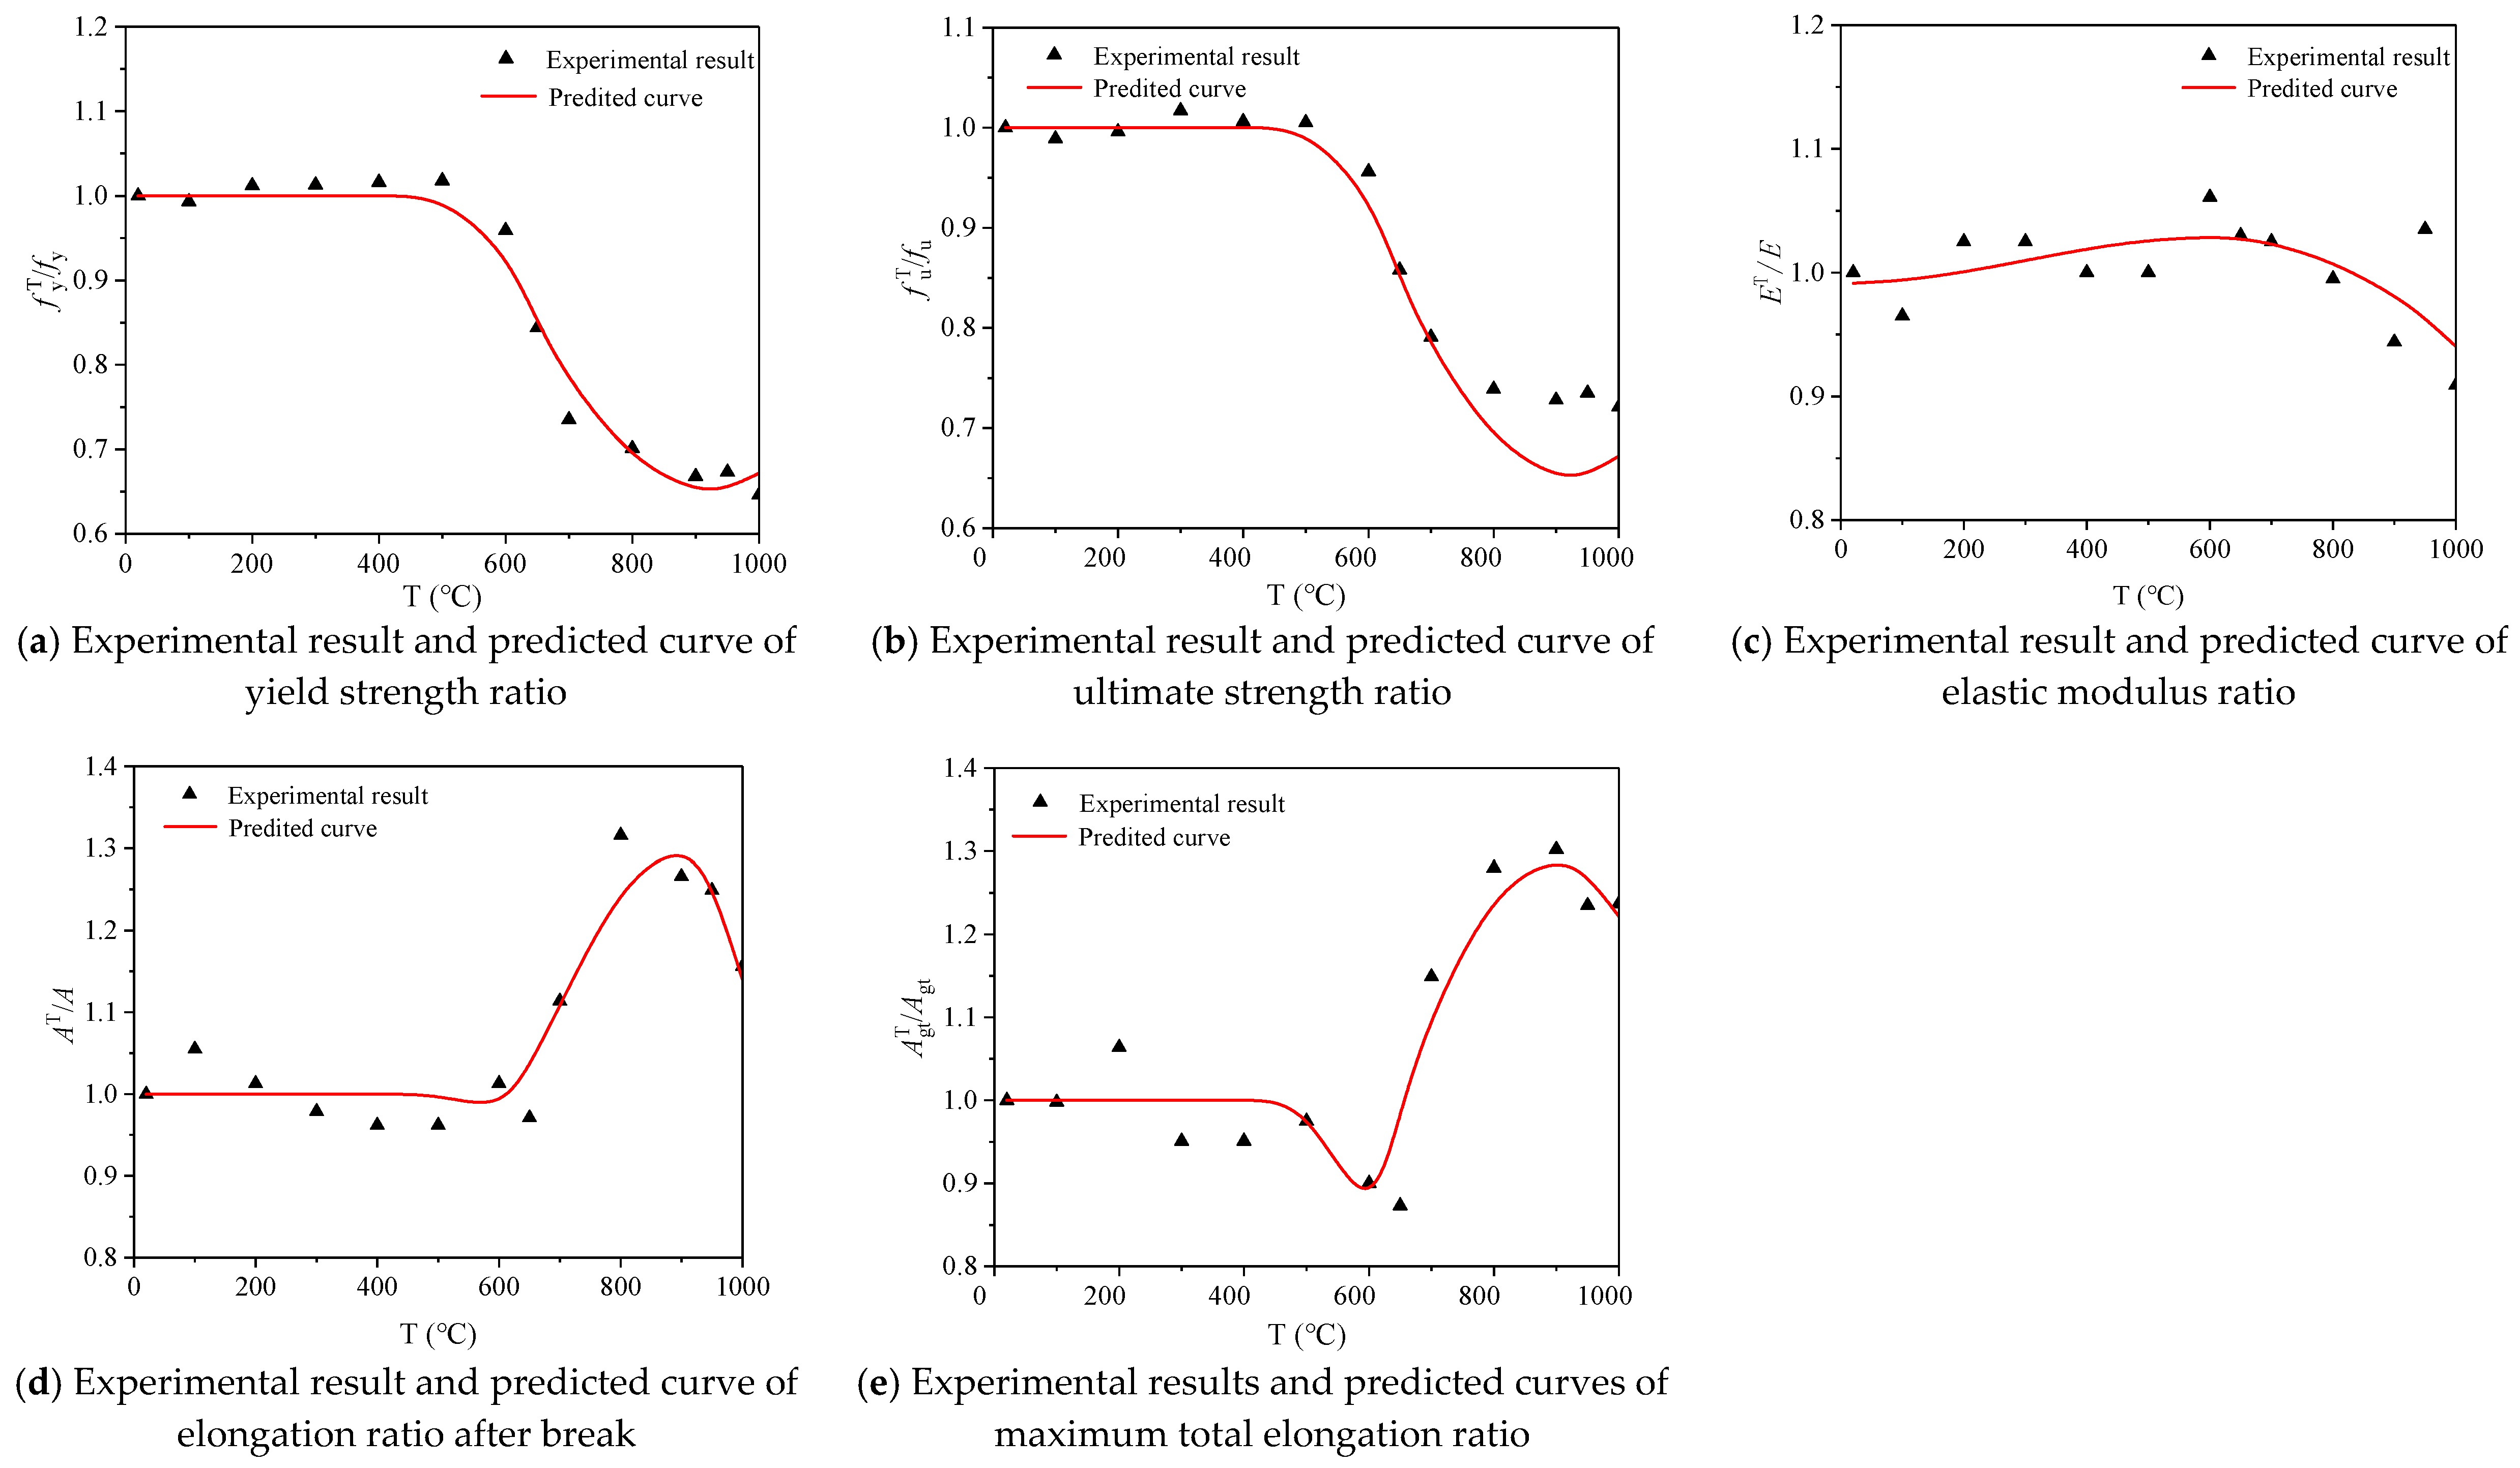
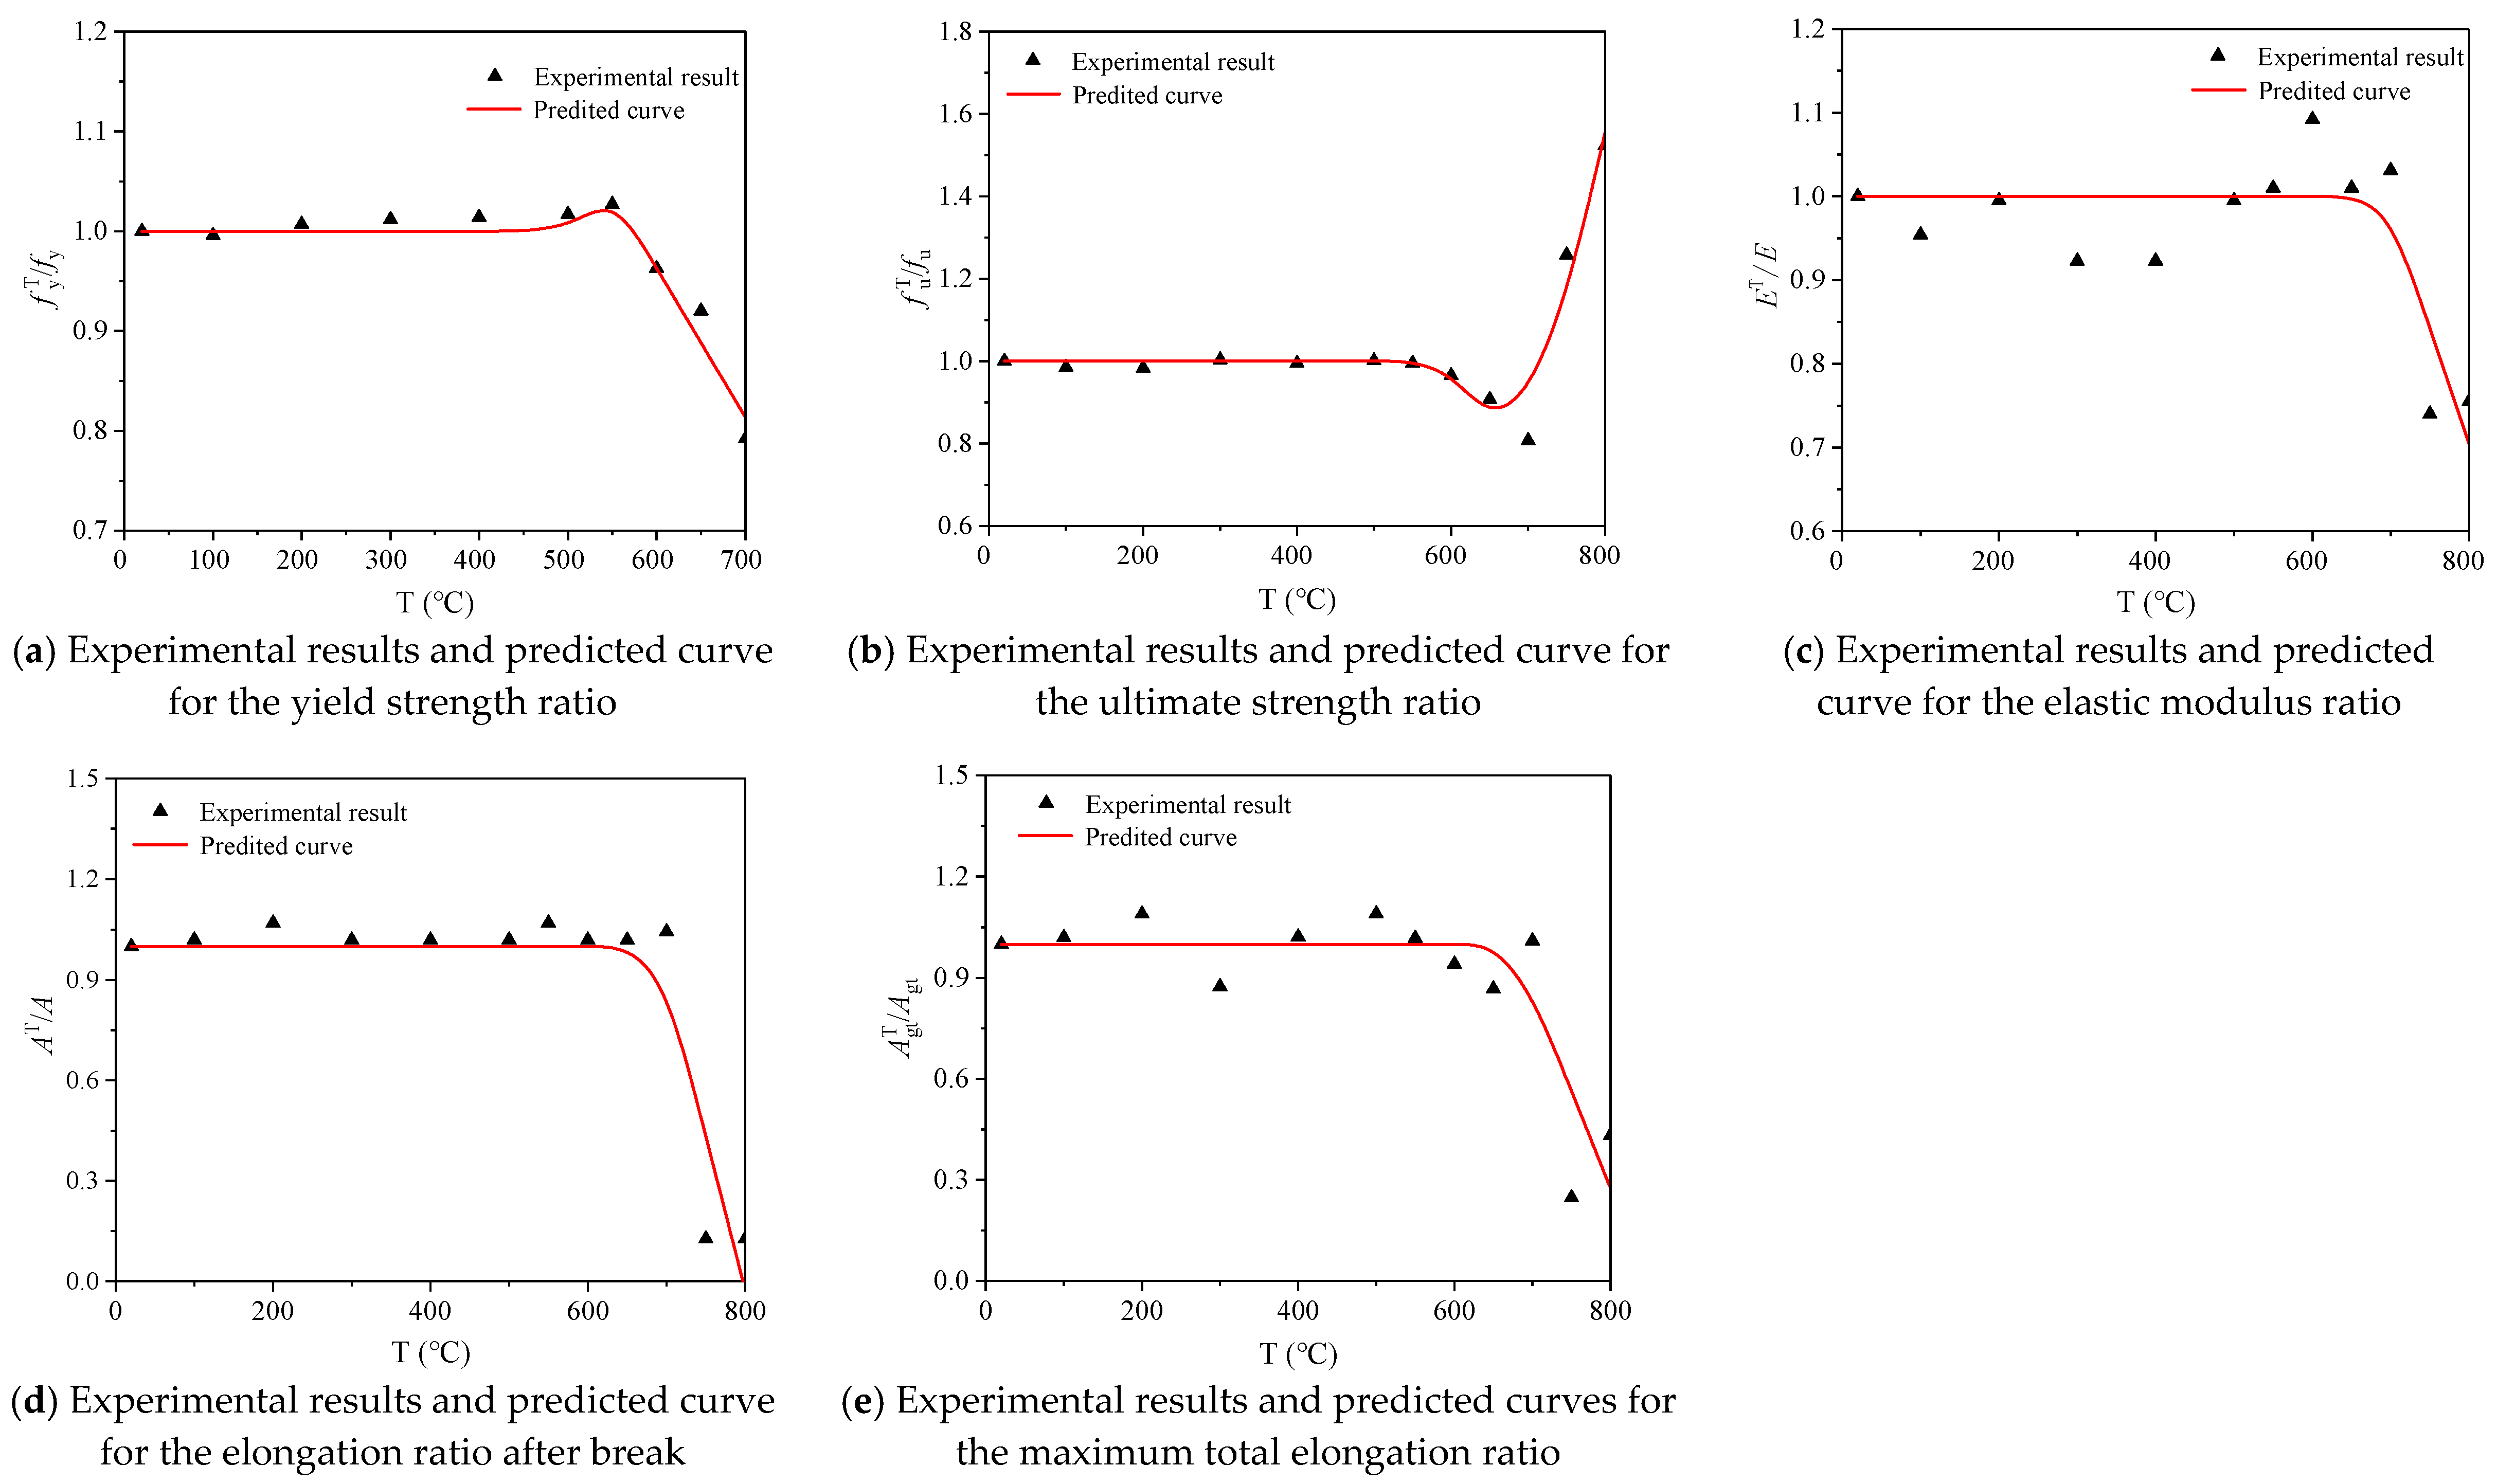
3.5. Calculation Models of Mechanical Parameters
3.6. Constitutive Models
3.6.1. Two-Fold Line Constitutive Model
3.6.2. Three-Fold Line Constitutive Model
3.6.3. Ramberg–Osgood model
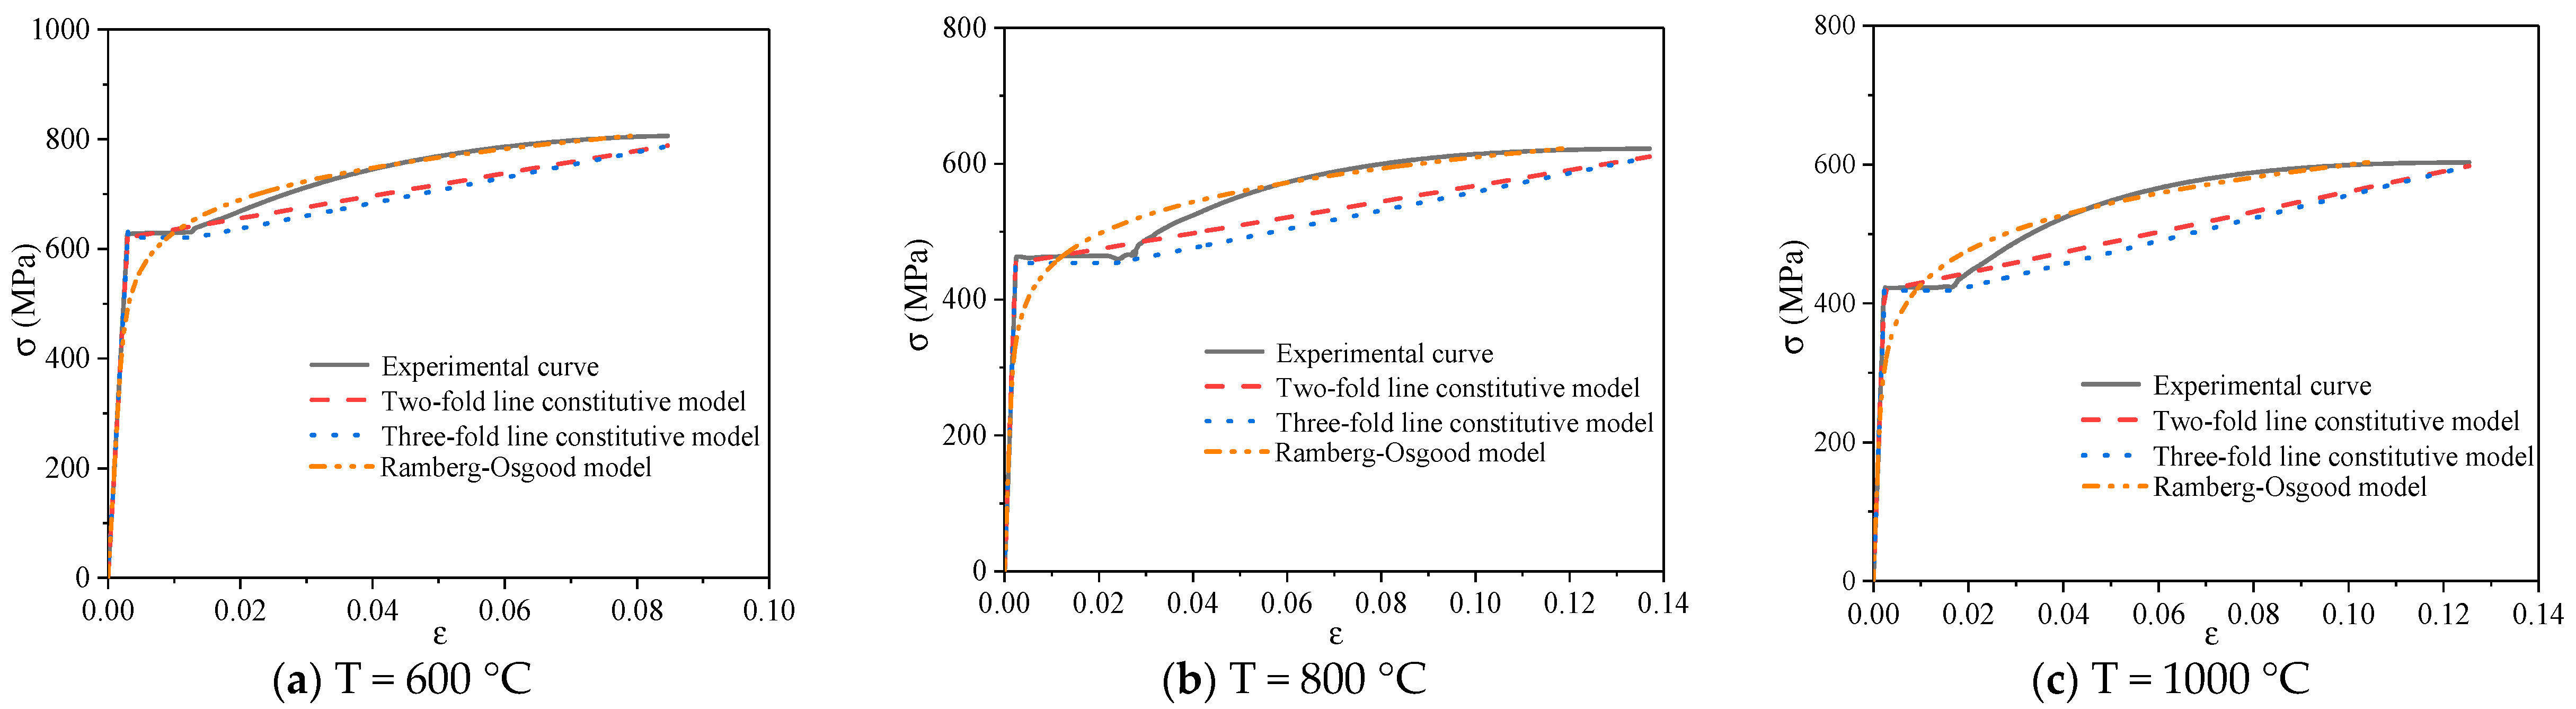
3.6.4. Comparative Analysis of Constitutive Model
4. Conclusions
Author Contributions
Funding
Institutional Review Board Statement
Informed Consent Statement
Data Availability Statement
Acknowledgments
Conflicts of Interest
References
- Ni, X.; Cao, S.; Liang, S.; Li, Y.; Liu, Y. High-strength bar reinforced concrete walls: Cyclic loading test and strength prediction. Eng. Struct. 2019, 198, 1–18. [Google Scholar] [CrossRef]
- Baek, J.; Park, H.; Lee, B.; Shin, H. Shear-Friction Strength of Low-Rise Walls with 550 MPa (80 ksi) Reinforcing Bars under Cyclic Loading. ACI Struct. J. 2018, 115, 65–77. [Google Scholar]
- Li, Y.; Cao, S.; Liang, H.; Ni, X.; Jing, D. Axial compressive behavior of concrete columns with grade 600 MPa reinforcing bars. Eng. Struct. 2018, 172, 497–507. [Google Scholar] [CrossRef]
- Wei, Z.; Nunez, A.; Liu, X.; Dollevoet, R.; Li, Z. Multi-criteria evaluation of wheel/rail degradation at railway crossings. Tribol. Int. 2020, 144, 106107. [Google Scholar] [CrossRef]
- Yan, X.; Di, W.; Yingfeng, T.; Minqiu, H.; Hai, S. Experimental studies on mechanical properties of corroded steel bars after elevated temperature. Procedia Eng. 2017, 210, 622–629. [Google Scholar] [CrossRef]
- Cheng, M.; Hung, S.; Lequesne, R.; Lepage, A. Earthquake-resistant squat walls reinforced with high-strength steel. Am. Conc. Inst. 2016, 113, 1065–1076. [Google Scholar] [CrossRef]
- Li, G.; Jiang, S.; Yin, Y.; Chen, K.; Li, M. Experimental studies on the properties of constructional steel at elevated temperatures. J. Struct. Eng. 2003, 129, 1717–1721. [Google Scholar] [CrossRef]
- Qiang, X.; Bijlaard, F.S.; Kolstein, H. Dependence of mechanical properties of high strength steel S690 on elevated temperatures. Constr. Build. Mater. 2012, 30, 73–79. [Google Scholar] [CrossRef]
- ACI Committee 318. ACI 318-14 Building Code Requirements for Structural Concrete and Commentary; American Concrete Institute: Farmington Hills, MI, USA, 2011. [Google Scholar]
- CEN.EN1992-1-1. Eurocode 2: Design of Concrete Structures—Part 1-1: General Rules and Rules for Buildings; Britsh Standards Institution: London, UK, 2004. [Google Scholar]
- FDEAS 412-2: 2013. Steel for the Reinforcement of Concrete—Part 2: Ribbed Bars; East African Community: Arusha, Tanzania, 2013.
- Outinen, J.; Makelainen, P. Mechanical properties of structural steel at elevated temperatures and after cooling down. Fire Mater. 2004, 28, 237–251. [Google Scholar] [CrossRef]
- Heidarpour, A.; Tofts, N.S.; Korayem, A.H.; Zhao, X.L.; Hutchinson, C. Mechanical properties of very high strength steel at elevated temperatures. Fire Saf. J. 2014, 64, 27–35. [Google Scholar] [CrossRef]
- Chiew, S.P.; Zhao, M.S.; Lee, C.K. Mechanical properties of heat-treated high strength steel under fire/post-fire conditions. J. Constr. Steel Res. 2014, 98, 12–19. [Google Scholar] [CrossRef]
- Chen, J.; Young, B.; Uy, B. Behavior of high strength structural steel at elevated temperatures. J. Struct. Eng. 2006, 132, 1948–1954. [Google Scholar] [CrossRef] [Green Version]
- Kodur, V.; Dwaikat, M.; Fike, R. High-temperature properties of steel for fire resistance modeling of structures. J. Mater. Civ. Eng. 2010, 22, 423–434. [Google Scholar] [CrossRef]
- Kumar, V.; Sharma, U.K.; Singh, B.; Bhargava, P. Effect of temperature on mechanical properties of pre-damaged steel reinforcing bars. Constr. Build. Mater. 2013, 46, 19–27. [Google Scholar] [CrossRef]
- Elghazouli, A.Y.; Cashell, K.A.; Izzuddin, B.A. Experimental evaluation of the mechanical properties of steel reinforcement at elevated temperature. Fire Saf. J. 2009, 44, 909–919. [Google Scholar] [CrossRef] [Green Version]
- Bompa, D.V.; Elghazouli, A.Y. Elevated temperature characteristics of steel reinforcement incorporating threaded mechanical couplers. Fire Saf. J. 2019, 104, 8–21. [Google Scholar] [CrossRef] [Green Version]
- GB/T1499.2. Steel for Reinforced Concrete. Part 2: Hot-Rolled Ribbed Steel Bars; China Standard Press: Beijing, China, 2018.
- Sun, C.; Li, A.; Miao, C.; Qiao, Y. Mechanical properties of 600 MPa reinforced steel after high temperature. J. Chang‘an Univ. (Nat. Sci. Ed.) 2018, 38, 93–101. (In Chinese) [Google Scholar]
- Chen, W. Seismic Performance Analysis of New Seismic Reinforcement; Hefei University of Technology: Hefei, China, 2010. (In Chinese) [Google Scholar]
- Guan, J.; Zhang, Q.; Wang, D.; Yao, X.; Wang, W.; Zhao, S. Research on the mechanical properties and constitutive model of 600 MPa class new seismic reinforcement. J. Appl. Found. Eng. Sci. 2018, 26, 122–131. (In Chinese) [Google Scholar]
- GB 50010. Code for Design of Concrete Structures; China Building Industry Press: Beijing, China, 2010. [Google Scholar]
- ASTM A706/A706M-14. Standard Specification for Deformed and Plain Low-alloy Steel Bars for Concrete Reinforcement; ASTM International: West Conshohocken, PA, USA, 2014. [Google Scholar]
- GB/T 228.1. Tensile Testing of Metallic Materials—Part 1: Methods of Test at Room Temperature; China Standard Press: Beijing, China, 2011.
- Zhang, M.; Du, H.; Chen, L. Experimental study on mechanical properties of HRB400 steel bars after high temperature cooling. China Sci. Technol. 2018, 13, 81–85. (In Chinese) [Google Scholar]
- CEB-FIP MC 90. CEB-FIP Model Code 1990; Thomas Telford House: London, UK, 1993. [Google Scholar]
- Shao, Y.; Bao, W. Simulation Method of Tensile Stress-Strain Relationship of Cast Steel Used in Construction. J. Struct. Eng. Res. Steel Struct.—The 12th Session (ASSF-2010) of Structural Stability and Fatigue Branch of China Association of Steel and Industry. 2010. Available online: http://kns.cnki.net (accessed on 28 August 2010).


| Heating Temperature | |||||
|---|---|---|---|---|---|
| Elastic Modulus ET × 105 (MPa) | Value Range | Yield Strength (MPa) | Strengthen Stiffness × 105 (MPa) | Value Range | |
| 100 °C | 2.01 | ε ≤ 0.0032 | 650.92 | 0.021 | 0.0032 < ε ≤ 0.0917 |
| 200 °C | 2.03 | ε ≤ 0.0032 | 655.36 | 0.018 | 0.0032 < ε ≤ 0.0986 |
| 300 °C | 1.99 | ε ≤ 0.0033 | 658.49 | 0.019 | 0.0033 < ε ≤ 0.0962 |
| 400 °C | 2.01 | ε ≤ 0.0033 | 658.26 | 0.018 | 0.0033 < ε ≤ 0.1030 |
| 500 °C | 1.94 | ε ≤ 0.0034 | 658.19 | 0.016 | 0.0034 < ε ≤ 0.1078 |
| 550 °C | 1.97 | ε ≤ 0.0033 | 656.04 | 0.018 | 0.0033 < ε ≤ 0.0991 |
| 600 °C | 1.96 | ε ≤ 0.0032 | 631.72 | 0.020 | 0.0032 < ε ≤ 0.0888 |
| 650 °C | 1.98 | ε ≤ 0.0029 | 581.62 | 0.021 | 0.0029 < ε ≤ 0.0802 |
| 700 °C | 1.97 | ε ≤ 0.0025 | 484.73 | 0.024 | 0.0025 < ε ≤ 0.0889 |
| 750 °C | 1.99 | ε ≤ 0.0024 | 468.92 | 0.021 | 0.0024 < ε ≤ 0.1030 |
| 800 °C | 1.92 | ε ≤ 0.0026 | 494.58 | 0.014 | 0.0026 < ε ≤ 0.1216 |
| 850 °C | 1.99 | ε ≤ 0.0026 | 525.57 | 0.013 | 0.0026 < ε ≤ 0.1201 |
| 900 °C | 1.95 | ε ≤ 0.0027 | 528.40 | 0.013 | 0.0027 < ε ≤ 0.1183 |
| 950 °C | 1.95 | ε ≤ 0.0028 | 542.43 | 0.014 | 0.0028 < ε ≤ 0.1090 |
| 1000 °C | 1.93 | ε ≤ 0.0028 | 548.72 | 0.016 | 0.0028 < ε ≤ 0.0925 |
| Heating Temperature | |||||
|---|---|---|---|---|---|
| Elastic Modulus ET × 105 (MPa) | Value Range | Yield Strength (MPa) | Strengthen Stiffness × 105 (MPa) | Value Range | |
| 100 °C | 1.91 | ε ≤ 0.0034 | 643.31 | 0.020 | 0.0034 < ε ≤ 0.0923 |
| 200 °C | 2.03 | ε ≤ 0.0032 | 655.55 | 0.019 | 0.0032 < ε ≤ 0.0955 |
| 300 °C | 2.03 | ε ≤ 0.0032 | 656.52 | 0.020 | 0.0032 < ε ≤ 0.0992 |
| 400 °C | 1.98 | ε ≤ 0.0033 | 658.03 | 0.019 | 0.0033 < ε ≤ 0.0971 |
| 500 °C | 1.98 | ε ≤ 0.0033 | 659.32 | 0.017 | 0.0033 < ε ≤ 0.1071 |
| 600 °C | 2.10 | ε ≤ 0.0030 | 621.05 | 0.021 | 0.0030 < ε ≤ 0.0891 |
| 650 °C | 2.04 | ε ≤ 0.0027 | 546.58 | 0.021 | 0.0027 < ε ≤ 0.0854 |
| 700 °C | 2.03 | ε ≤ 0.0023 | 476.05 | 0.017 | 0.0023 < ε ≤ 0.1109 |
| 800 °C | 1.97 | ε ≤ 0.0023 | 454.01 | 0.012 | 0.0023 < ε ≤ 0.1424 |
| 900 °C | 1.87 | ε ≤ 0.0023 | 432.78 | 0.013 | 0.0023 < ε ≤ 0.1330 |
| 950 °C | 2.05 | ε ≤ 0.0021 | 436.15 | 0.014 | 0.0021 < ε ≤ 0.1327 |
| 1000 °C | 1.80 | ε ≤ 0.0023 | 418.59 | 0.015 | 0.0023 < ε ≤ 0.1278 |
| Heating Temperature | |||||
|---|---|---|---|---|---|
| Elastic Modulus ET × 105 (MPa) | Value Range | Yield Strength (MPa) | Strengthen Stiffness × 105 (MPa) | Value Range | |
| 100 °C | 1.93 | ε ≤ 0.0033 | 645.70 | 0.022 | 0.0033 < ε ≤ 0.0947 |
| 200 °C | 1.95 | ε ≤ 0.0033 | 647.20 | 0.018 | 0.0033 < ε ≤ 0.0991 |
| 300 °C | 1.98 | ε ≤ 0.0033 | 646.54 | 0.018 | 0.0033 < ε ≤ 0.0983 |
| 400 °C | 2.06 | ε ≤ 0.0032 | 666.28 | 0.021 | 0.0032 < ε ≤ 0.0929 |
| 500 °C | 2.01 | ε ≤ 0.0034 | 674.22 | 0.018 | 0.0034 < ε ≤ 0.0963 |
| 550 °C | 1.96 | ε ≤ 0.0034 | 667.18 | 0.019 | 0.0034 < ε ≤ 0.1065 |
| 600 °C | 2.00 | ε ≤ 0.0032 | 632.61 | 0.020 | 0.0032 < ε ≤ 0.0850 |
| 650 °C | 1.79 | ε ≤ 0.0031 | 560.16 | 0.020 | 0.0031 < ε ≤ 0.0887 |
| 700 °C | 2.14 | ε ≤ 0.0023 | 486.39 | 0.018 | 0.0023 < ε ≤ 0.1163 |
| 750 °C | 1.84 * | ε ≤ 0.0020 | 349.77 | 0.555 | 0.0020 < ε ≤ 0.0151 |
| 800 °C | 2.00 * | ε ≤ 0.0020 | 384.42 | 0.464 | 0.0020 < ε ≤ 0.0227 |
| Heating Temperature | ||||||
|---|---|---|---|---|---|---|
| Elastic Modulus ET × 105 (MPa) | Value Range | Yield Strength (MPa) | Value Range | Strengthen Stiffness × 105 (MPa) | Value Range | |
| 100 °C | 2.01 | ε ≤ 0.0032 | 650.92 | 0.0032 < ε ≤ 0.0083 | 0.023 | 0.0083 < ε ≤ 0.0917 |
| 200 °C | 2.03 | ε ≤ 0.0032 | 655.36 | 0.0032 < ε ≤ 0.0135 | 0.020 | 0.0135 < ε ≤ 0.0986 |
| 300 °C | 1.99 | ε ≤ 0.0033 | 658.49 | 0.0033 < ε ≤ 0.0141 | 0.021 | 0.0141 < ε ≤ 0.0962 |
| 400 °C | 2.01 | ε ≤ 0.0033 | 658.26 | 0.0033 < ε ≤ 0.0130 | 0.020 | 0.0130 < ε ≤ 0.1030 |
| 500 °C | 1.94 | ε ≤ 0.0034 | 658.19 | 0.0034 < ε ≤ 0.0158 | 0.018 | 0.0158< ε ≤ 0.1078 |
| 550 °C | 1.97 | ε ≤ 0.0033 | 656.04 | 0.0033 < ε ≤ 0.0160 | 0.020 | 0.0160 < ε ≤ 0.9991 |
| 600 °C | 1.96 | ε ≤ 0.0032 | 631.72 | 0.0032 < ε ≤ 0.0122 | 0.022 | 0.0122 < ε ≤ 0.0888 |
| 650 °C | 1.98 | ε ≤ 0.0029 | 581.62 | 0.0029 < ε ≤ 0.0170 | 0.025 | 0.0170 < ε ≤ 0.0802 |
| 700 °C | 1.97 | ε ≤ 0.0025 | 484.73 | 0.0025 < ε ≤ 0.0096 | 0.026 | 0.0096 < ε ≤ 0.0889 |
| 750 °C | 1.99 | ε ≤ 0.0024 | 468.92 | 0.0024 < ε ≤ 0.0137 | 0.023 | 0.0137 < ε ≤ 0.1030 |
| 800 °C | 1.92 | ε ≤ 0.0026 | 494.58 | 0.0026 < ε ≤ 0.0269 | 0.017 | 0.0269 < ε ≤ 0.1216 |
| 850 °C | 1.99 | ε ≤ 0.0026 | 525.57 | 0.0026 < ε ≤ 0.0257 | 0.016 | 0.0257 < ε ≤ 0.1201 |
| 900 °C | 1.95 | ε ≤ 0.0027 | 528.40 | 0.0027 < ε ≤ 0.0254 | 0.016 | 0.0254 < ε ≤ 0.1183 |
| 950 °C | 1.95 | ε ≤ 0.0028 | 542.43 | 0.0028 < ε ≤ 0.0233 | 0.017 | 0.0233 < ε ≤ 0.1090 |
| 1000 °C | 1.93 | ε ≤ 0.0028 | 548.72 | 0.0028 < ε ≤ 0.0178 | 0.020 | 0.0178 < ε ≤ 0.0925 |
| Heating Temperature | ||||||
|---|---|---|---|---|---|---|
| Elastic Modulus ET × 105 (MPa) | Value Range | Yield Strength (MPa) | Value Range | Strengthen Stiffness × 105 (MPa) | Value Range | |
| 100 °C | 1.91 | ε ≤ 0.0034 | 643.31 | 0.0034 < ε ≤ 0.0138 | 0.023 | 0.0138 < ε ≤ 0.0923 |
| 200 °C | 2.03 | ε ≤ 0.0032 | 655.55 | 0.0032 < ε ≤ 0.0148 | 0.022 | 0.0148 < ε ≤ 0.0955 |
| 300 °C | 2.03 | ε ≤ 0.0032 | 656.52 | 0.0032 < ε ≤ 0.0128 | 0.022 | 0.0128 < ε ≤ 0.0992 |
| 400 °C | 1.98 | ε ≤ 0.0033 | 658.03 | 0.0033 < ε ≤ 0.0149 | 0.022 | 0.0149 < ε ≤ 0.0971 |
| 500 °C | 1.98 | ε ≤ 0.0033 | 659.32 | 0.0033 < ε ≤ 0.0113 | 0.019 | 0.0113 < ε ≤ 0.1071 |
| 600 °C | 2.10 | ε ≤ 0.0030 | 621.05 | 0.0030 < ε ≤ 0.0130 | 0.023 | 0.0130 < ε ≤ 0.0891 |
| 650 °C | 2.04 | ε ≤ 0.0027 | 546.58 | 0.0027 < ε ≤ 0.0124 | 0.023 | 0.0124 < ε ≤ 0.0854 |
| 700 °C | 2.03 | ε ≤ 0.0023 | 476.05 | 0.0023 < ε ≤ 0.0131 | 0.019 | 0.0131 < ε ≤ 0.1109 |
| 800 °C | 1.97 | ε ≤ 0.0023 | 454.01 | 0.0023 < ε ≤ 0.0238 | 0.014 | 0.0238 < ε ≤ 0.1424 |
| 900 °C | 1.87 | ε ≤ 0.0023 | 432.78 | 0.0023 < ε ≤ 0.0238 | 0.016 | 0.0238 < ε ≤ 0.1330 |
| 950 °C | 2.05 | ε ≤ 0.0021 | 436.15 | 0.0021 < ε ≤ 0.0203 | 0.016 | 0.0203 < ε ≤ 0.1327 |
| 1000 °C | 1.80 | ε ≤ 0.0023 | 418.59 | 0.0023 < ε ≤ 0.0168 | 0.016 | 0.0168 < ε ≤ 0.1278 |
| Heating Temperature | ||||||
|---|---|---|---|---|---|---|
| Elastic Modulus ET × 105 (MPa) | Value Range | Yield Strength (MPa) | Value Range | Strengthen Stiffness × 105 (MPa) | Value Range | |
| 100 °C | 1.93 | ε ≤ 0.0033 | 645.70 | 0.0033 < ε ≤ 0.0092 | 0.024 | 0.0092 < ε ≤ 0.0947 |
| 200 °C | 1.95 | ε ≤ 0.0033 | 647.20 | 0.0033 < ε ≤ 0.0146 | 0.020 | 0.0146 < ε ≤ 0.0991 |
| 300 °C | 1.98 | ε ≤ 0.0033 | 646.54 | 0.0033 < ε ≤ 0.0142 | 0.020 | 0.0142 < ε ≤ 0.0983 |
| 400 °C | 2.06 | ε ≤ 0.0032 | 666.28 | 0.0032 < ε ≤ 0.0104 | 0.022 | 0.0104 < ε ≤ 0.0929 |
| 500 °C | 2.01 | ε ≤ 0.0034 | 674.22 | 0.0034 < ε ≤ 0.0100 | 0.020 | 0.0100 < ε ≤ 0.0963 |
| 550 °C | 1.96 | ε ≤ 0.0034 | 667.18 | 0.0034 < ε ≤ 0.0129 | 0.021 | 0.0129 < ε ≤ 0.1065 |
| 600 °C | 2.00 | ε ≤ 0.0032 | 632.61 | 0.0032 < ε ≤ 0.0141 | 0.024 | 0.0141 < ε ≤ 0.0850 |
| 650 °C | 1.79 | ε ≤ 0.0031 | 560.16 | 0.0031 < ε ≤ 0.0178 | 0.024 | 0.0178 < ε ≤ 0.0887 |
| 700 °C | 2.14 | ε ≤ 0.0023 | 486.39 | 0.0023 < ε ≤ 0.0092 | 0.019 | 0.0092 < ε ≤ 0.1163 |
| 750 °C | 1.84 | - | - | - | - | - |
| 800 °C | 2.00 | - | - | - | - | - |
| Heating Temperature | ||||
|---|---|---|---|---|
| Elastic Modulus ET × 105 (MPa) | Yield Strength (MPa) | α | n | |
| 100 °C | 2.01 | 650.92 | 1.56 | 10.34 |
| 200 °C | 2.03 | 655.36 | 2.03 | 11.47 |
| 300 °C | 1.99 | 658.49 | 1.58 | 11.51 |
| 400 °C | 2.01 | 658.26 | 1.89 | 10.77 |
| 500 °C | 1.94 | 658.19 | 1.96 | 11.30 |
| 550 °C | 1.97 | 656.04 | 2.08 | 10.80 |
| 600 °C | 1.96 | 631.72 | 2.35 | 9.82 |
| 650 °C | 1.98 | 581.62 | 2.93 | 9.34 |
| 700 °C | 1.97 | 484.73 | 2.17 | 7.06 |
| 750 °C | 1.99 | 468.92 | 2.92 | 7.16 |
| 800 °C | 1.92 | 494.58 | 3.85 | 8.15 |
| 850 °C | 1.99 | 525.57 | 3.29 | 9.43 |
| 900 °C | 1.95 | 528.40 | 3.96 | 9.58 |
| 950 °C | 1.95 | 542.43 | 2.87 | 9.91 |
| 1000 °C | 1.93 | 548.72 | 2.84 | 9.75 |
| Heating Temperature | ||||
|---|---|---|---|---|
| Elastic Modulus ET × 105 (MPa) | Yield Strength (MPa) | α | n | |
| 100 °C | 1.91 | 643.31 | 1.40 | 11.31 |
| 200 °C | 2.03 | 655.55 | 1.97 | 10.87 |
| 300 °C | 2.03 | 656.52 | 1.74 | 10.56 |
| 400 °C | 1.98 | 658.03 | 1.81 | 11.03 |
| 500 °C | 1.98 | 659.32 | 1.57 | 11.07 |
| 600 °C | 2.10 | 621.05 | 2.05 | 9.65 |
| 650 °C | 2.04 | 546.58 | 2.79 | 8.74 |
| 700 °C | 2.03 | 476.05 | 2.76 | 7.72 |
| 800 °C | 1.97 | 454.01 | 3.57 | 8.37 |
| 900 °C | 1.87 | 432.78 | 3.90 | 8.08 |
| 950 °C | 2.05 | 436.15 | 3.32 | 7.91 |
| 1000 °C | 1.80 | 418.59 | 2.84 | 7.46 |
| Heating Temperature | ||||
|---|---|---|---|---|
| Elastic Modulus ET × 105 (MPa) | Yield Strength (MPa) | α | n | |
| 100 °C | 1.93 | 645.70 | 1.30 | 10.36 |
| 200 °C | 1.95 | 647.20 | 1.85 | 10.81 |
| 300 °C | 1.98 | 646.54 | 1.72 | 11.52 |
| 400 °C | 2.06 | 666.28 | 1.60 | 10.94 |
| 500 °C | 2.01 | 674.22 | 1.39 | 12.39 |
| 550 °C | 1.96 | 667.18 | 1.31 | 11.39 |
| 600 °C | 2.00 | 632.61 | 1.82 | 10.82 |
| 650 °C | 1.79 | 560.16 | 1.88 | 9.58 |
| 700 °C | 2.14 | 486.39 | 2.08 | 8.56 |
| 750 °C | 1.96 | 645.70 | 0.08 | 3.65 |
| 800 °C | 1.94 | 647.20 | 0.01 | 5.25 |
Publisher’s Note: MDPI stays neutral with regard to jurisdictional claims in published maps and institutional affiliations. |
© 2021 by the authors. Licensee MDPI, Basel, Switzerland. This article is an open access article distributed under the terms and conditions of the Creative Commons Attribution (CC BY) license (http://creativecommons.org/licenses/by/4.0/).
Share and Cite
Yao, X.; Qin, P.; Guan, J.; Li, L.; Zhang, M.; Gao, Y. Residual Mechanical Properties and Constitutive Model of High-Strength Seismic Steel Bars through Different Cooling Rates. Materials 2021, 14, 469. https://0-doi-org.brum.beds.ac.uk/10.3390/ma14020469
Yao X, Qin P, Guan J, Li L, Zhang M, Gao Y. Residual Mechanical Properties and Constitutive Model of High-Strength Seismic Steel Bars through Different Cooling Rates. Materials. 2021; 14(2):469. https://0-doi-org.brum.beds.ac.uk/10.3390/ma14020469
Chicago/Turabian StyleYao, Xianhua, Peiqiao Qin, Junfeng Guan, Lielie Li, Min Zhang, and Yongwei Gao. 2021. "Residual Mechanical Properties and Constitutive Model of High-Strength Seismic Steel Bars through Different Cooling Rates" Materials 14, no. 2: 469. https://0-doi-org.brum.beds.ac.uk/10.3390/ma14020469