
Thermal Study and Emission Characteristics of Rice Husk Using TG-MS


Department of Mechanical, Energy and Materials Engineering, School of Industrial Engineering, University of Extremadura, Av. Elvas, s/n, 06006 Badajoz, Spain
*
Author to whom correspondence should be addressed.
Materials 2021, 14(20), 6203; https://0-doi-org.brum.beds.ac.uk/10.3390/ma14206203
Submission received: 10 September 2021
/
Revised: 14 October 2021
/
Accepted: 15 October 2021
/
Published: 19 October 2021
(This article belongs to the Special Issue Application of Biomass-Derived Carbonaceous Materials in Energy and Environment)
Abstract
:Rice husks are a by-product that is generated in large quantities in Spain. However, they are not used efficiently. One of their possible applications is its thermal use in power generation equipment. For that purpose, it is important to know the characteristics of rice husks and their thermal behavior, as well as their possible pollutant emission to the atmosphere with respect to its thermal use as a biofuel. In this work, the thermal characteristics of rice husks and their thermal behavior were studied by using thermogravimetry and mass spectroscopy for two different atmospheres (oxidizing and inert). This way, the thermal profiles and the main characteristics were studied, as well as the emission of possible pollutants to the atmosphere, such as CO2, CH4, NO2, NH3, SO2, and H2S. Moreover, three different methods (FWO, KAS, and Starink) were used to carry out a thermal analysis, in order to obtain the main thermal parameters such as activation energy. The results of the analysis predicted that rice husks could be used as biofuel in industrial thermal equipment based on its acceptable calorific value, good thermal characteristics, and low gas emissions both in oxidizing and inert atmosphere (although they have a high ash content).
1. Introduction
Spain is a country with a high agricultural production, large cultivation areas, and a considerable number of agro-food industries, wherein large amounts of waste are generated due to the normal development of their activities. Recently, a significant advance has taken place in the management of biomass waste. In fact, terms such as by-product (replacing waste) are usually used, thanks to the implementation of steps that allow a suitable recycling of wastes [1]. However, there are no global solutions that might be applicable to all these by-products, with some solutions causing environmental problems if they are not suitably managed.
Every year, large amounts of agricultural wastes are not properly used in Spain. In particular, the rice industry has produced over 789,000 t of this product in 2019 in this country [2]. The main waste that is generated is the husk that covers the grains of the rice. This by-product does not have an application in the elaboration of concentrated feed for animals due to its high silica content (SiO2) [3], which significantly reduces its digestibility [4]. Due to its physical-chemical constitution, rice husks also represent a waste of very difficult biodegradation. This fact, apart from the fact that in rice processing plants the amount of husk generated is around 20 wt.% of total production, and considering the very low specific weight of the bulk husk (100 kg m−3), results in the evacuation and the transport of rice husks representing a major problem that implies high costs and a harmful impact to the environment [5].
In order to solve these problems and promote the use of clean and efficient energy from agricultural waste in rural areas, the use of this kind of waste (such as rice husks) as an energy source through thermal processes can be an interesting solution. The use of this by-product as a source of energy generation represents an important advance in this direction, viable from a technical point of view, as well as convenient from an economic and ecological point of view [6].
Some authors have studied the thermal characterization of rice husks and their behavior during combustion through several techniques [7,8,9]. On the other hand, other thermal processes, such as the pyrolysis of this by-product, have been studied by other researchers [3,10,11]. Gasification processes as a method for thermal use of rice husks was also investigated [12,13,14]. However, there are no studies simultaneously dealing with energy and environmental aspects of this by-product, analyzing its behavior both in oxidizing and inert atmosphere.
The simultaneous use of thermogravimetric analysis and mass spectroscopy has attracted the interest of researchers due to its versatility and quickness, providing semi-quantitative information [15].
On the other hand, in order to design energy conversion systems for biomass, it is necessary the use of kinetic studies [16]. This way, some kinetic methods, such as Flynn-Wall-Ozawa (FWO) [17], Kissinger-Akahira-Sunose (KAS) [18,19] or Starink method [20], are popular due to their ease to obtain some parameters and therefore to understand the mechanisms of thermal processes [21,22,23,24,25]. However, most kinetic studies are focused on pyrolysis of this kind of products.
In this work, the possibilities offered by rice husks as a raw material for their use as a biofuel were studied. This study was carried out through two ways: determining the thermal profiles of the by-product through thermogravimetry, followed by the kinetic analysis through FWO, KAS, and Starink methods; and determining the gas emissions that could be problematic for the environment by using mass spectrometry in two different atmospheres (oxidizing and inert). This way, it would be possible to obtain a wide knowledge about thermal properties and environmental aspects, establishing the foundations for a possible thermal use of this by-product.
2. Materials and Methods
2.1. Sample Preparation
To carry out this study, rice husks were obtained from a rice company in the region of Extremadura (Miajadas, Spain). It was not necessary to carry out any drying or conditioning pre-treatment, since the by-product has a moisture level compatible with the analysis (<10 wt.%). Only grinding was carried out to reduce the particle size of the samples to less than 250 μm for characterization, thermogravimetry, and mass spectrometry tests.
2.2. Sample Characterization
To obtain the properties of the rice husk samples, different characterization tests (shown in Table 1) were carried out, according to the indicated standards.
2.3. TG-MS Analysis
In this study, the thermogravimetric experiments were carried out by using a thermobalance with a maximum sensibility of 5 μg and an accuracy higher than 0.2% of total weight and temperature (SDT Q600, TA Instruments, New Castle, DE, USA). All of the tests were carried out in inert atmosphere (argon) and oxidizing atmosphere (synthetic air) at 100 mL min−1 and for five linear heating rates (5, 10, 20, 30, 40 °C min−1). The weight used for the experiments was 10.0 ± 0.1 mg, and the particle size was below 250 μm, in order to assure that the experiments would be carried out in the kinetic regime, eliminating heat and mass transfer effects on the results [33,34]. The analysis was made in a temperature range of 20–800 °C.
Thermogravimetric-mass spectrometric (TG/MS) analysis was also carried out in order to analyze qualitatively the evolved volatiles during combustion and pyrolysis of the examined samples. This study was carried out by using a coupled TG-MS system (Thermogravimetric system, SDT Q600, TA Instruments, New Castle, DE, USA; Mass Spectrometer, Pfeiffer Tecnovac Thermostar GDS301 T3, Tecnovac, Madrid, Spain). A fused silicon capillary line was used as the pressure reducing system and for the transfer of the evolved volatiles of pyrolysis to the MS. The capillary was continuously heated at 200 °C to prevent the condensation of the gaseous products in it. The mass to charge ratios were the following: m/z = 16, 44 (attributed to carbon-based evolved gases, CH4 and CO2, respectively); 17, 46 (attributed to nitrogen-based gases, NH3 and NO2, respectively); and 34, 64 (attributed to sulphur-based evolved gases, H2S and SO2, respectively). These ratios were continuously monitored.
2.4. Kinetic Analysis
Various thermal characteristics, such as activation energy, were calculated using three different methods (FWO, KAS and Starink). Concerning the kinetic analysis, the FWO method was used, in order to check the mechanism that was selected [17]. The kinetics of pyrolysis of biomass can be expressed by a single-step reaction [16]. This kinetic model can be described by the following equation (Equation (1)):
where dα/dt is the rate of reaction; A, Ea, and R are the pre-exponential factor (min−1), activation energy (kJ mol−1), and universal gas constant (8.314 J (K mol)−1), respectively; and f(α) is the conversion function used by the reaction model, depending on the control reaction mechanism and α is the conversion degree.
For non-isothermal conditions in a linear heating rate, the FWO assumes that the activation energy is constant for a certain duration of the reaction, obtaining Equation (2):
The integral of temperature does not have an exact analytical solution [35]. Nevertheless, it can be approximated by the empirical interpolation proposed by Doyle [36] and applying the natural logarithm to Doyle’s approximation the following equation is obtained:
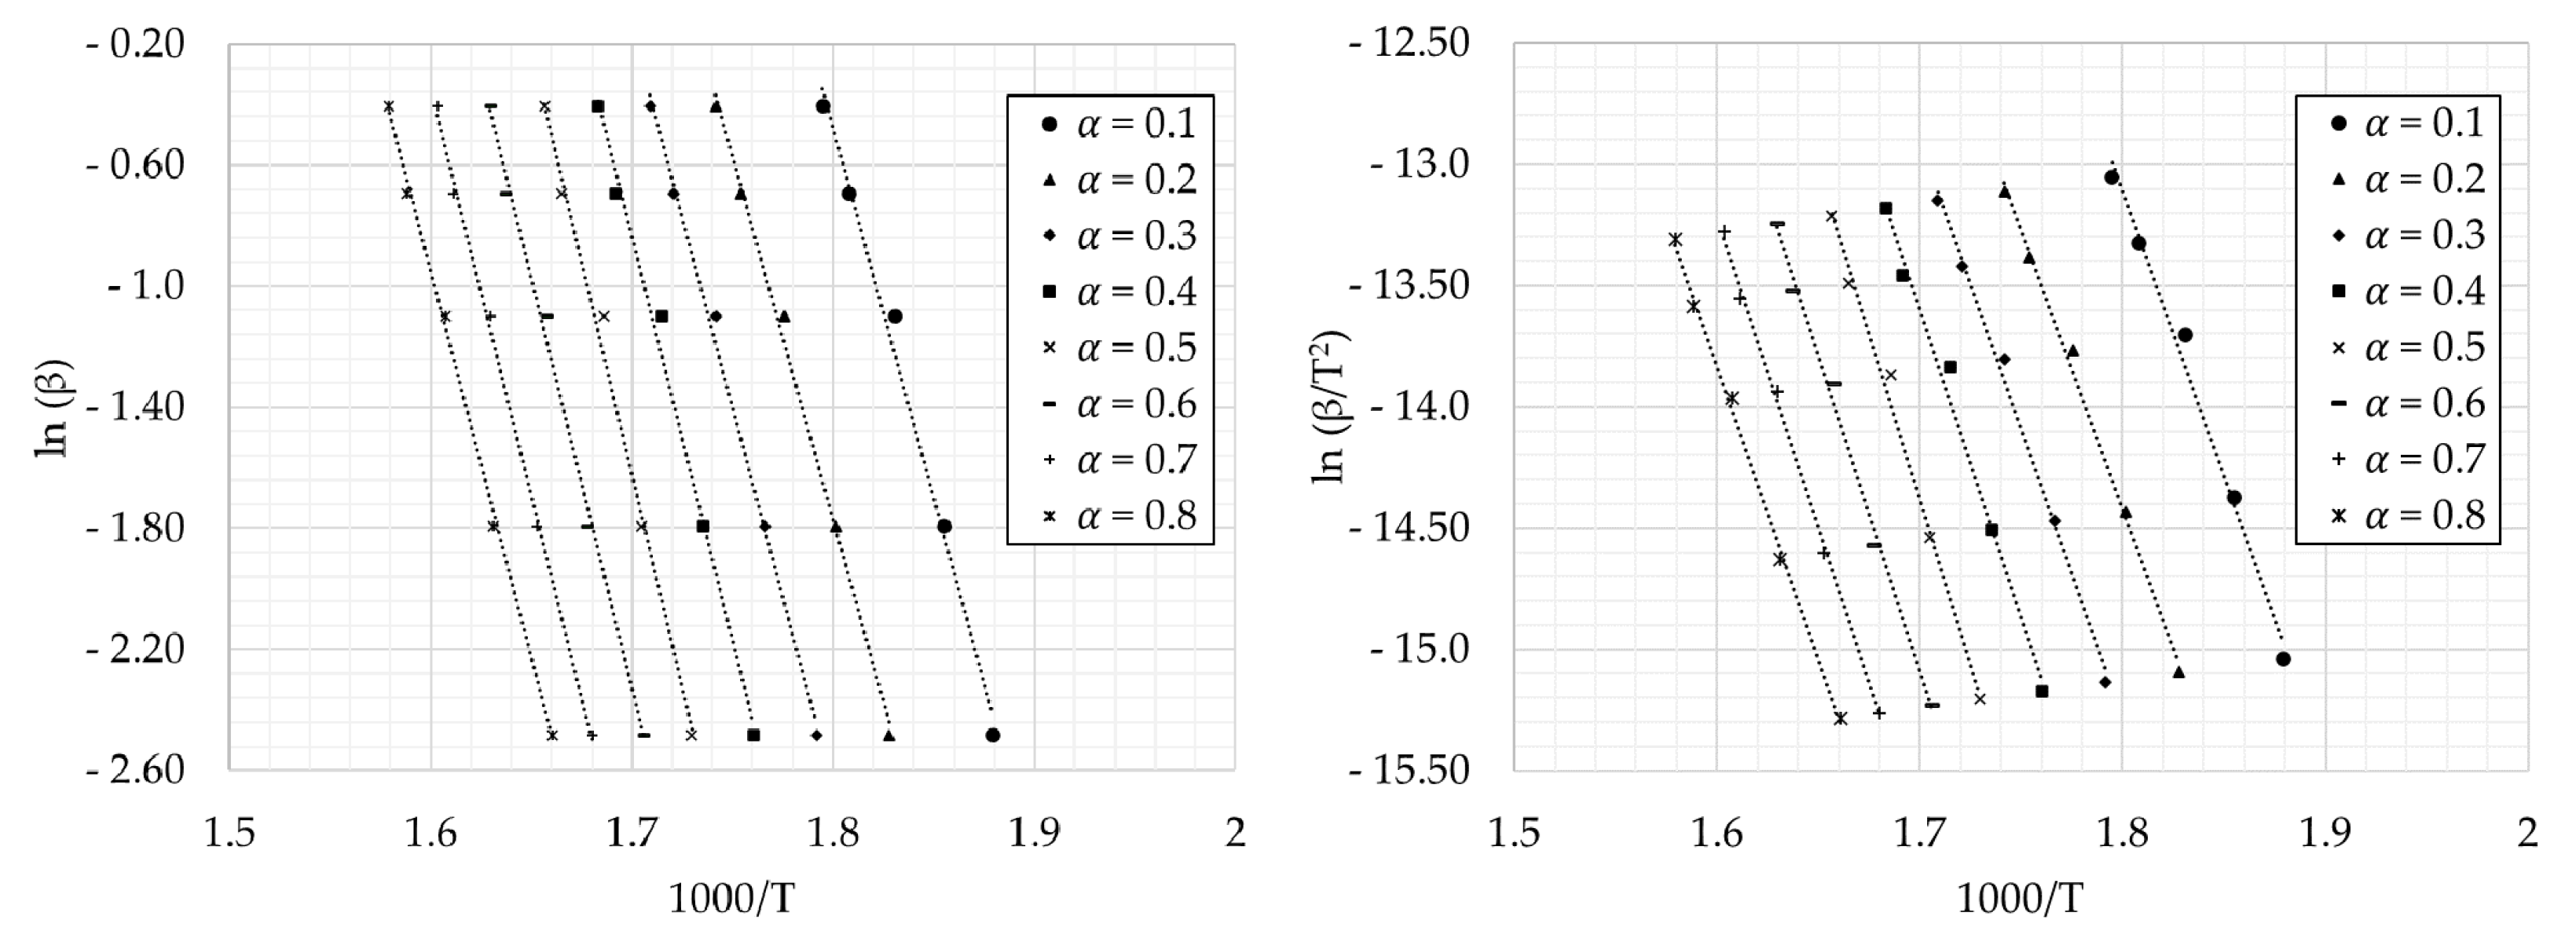
where g(α) is a constant for each conversion value. The sub-indexes i and α indicate different values of heating rate (β) and degree of conversion (α), respectively. The activation energies were calculated from the slope −1.052Eα/R generated when ln(βi), natural logarithm of heating rates versus 1000/Tαi was plotted.
This way, the activation energy can be calculated by representing ln(β/T2) versus 1000/T.
Starink [20] analyzed FWO and KAS methods jointly and concluded that both methods can be adjusted to Equation (5):
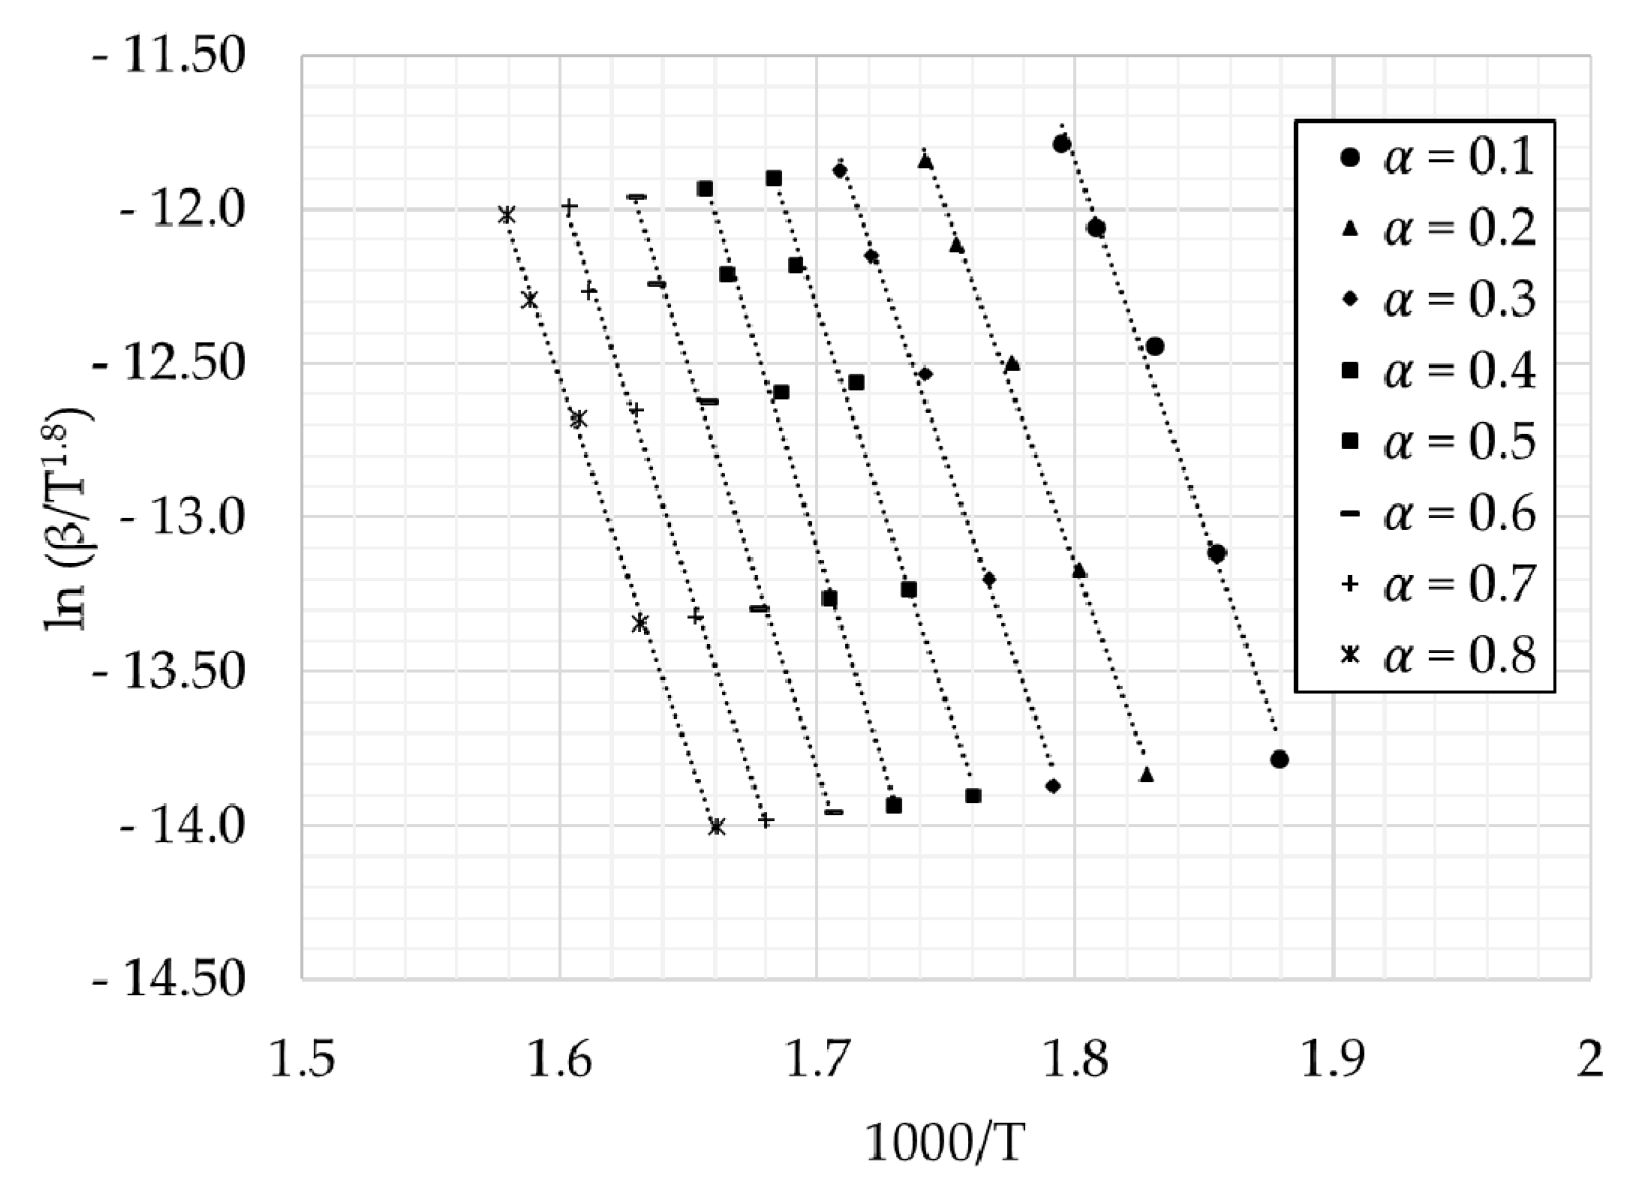
where, for FWO method, s = 0 and B = 0.457 and, for KAS method, s = 2 and B = 1. By optimizing constants, Starink proposed the following values: s = 1.0037 and B = 1.8. Therefore, the Starink method can be expressed as follows:
Consequently, the activation energy can also be calculated by plotting ln(β/T1.8) versus 1000/T.
3. Results and Discussion
3.1. Characterization of the By-Product
Table 2 shows the characterization results for the rice husks.
It should be pointed out the low percentages of N and S in rice husks in the ultimate analysis, which will imply low levels of the corresponding nitrogen and sulphur-based emissions. Chen et al. [37] showed an N value almost equal (0.48%) to that obtained in this work. Authors like Wang et al. [38] reported similar values for N and S, although slightly higher (0.69 % and 0.01 %, respectively). Other positive aspect was the heating value, exceeding 18 MJ kg−1, very similar value compared to those reported by Lopes Grotto et al. [39] for rice husk from two types of genetically improved rice. Other authors, such as Su et al. [3] reported an HHV value of slightly more than 15 kJ kg−1.
The negative note is the high ash content obtained in the proximate analysis. This circumstance should be taken into account when using this by-product in a thermal generation equipment. Nevertheless, other authors, like Worasuwannarak et al. [40] and Chen et al. [41] showed ash contents above 13 %. Moreover, its bulk density is too low, and therefore the long-distance transportation of this by-product would not be economically efficient.
3.2. Thermal Decomposition
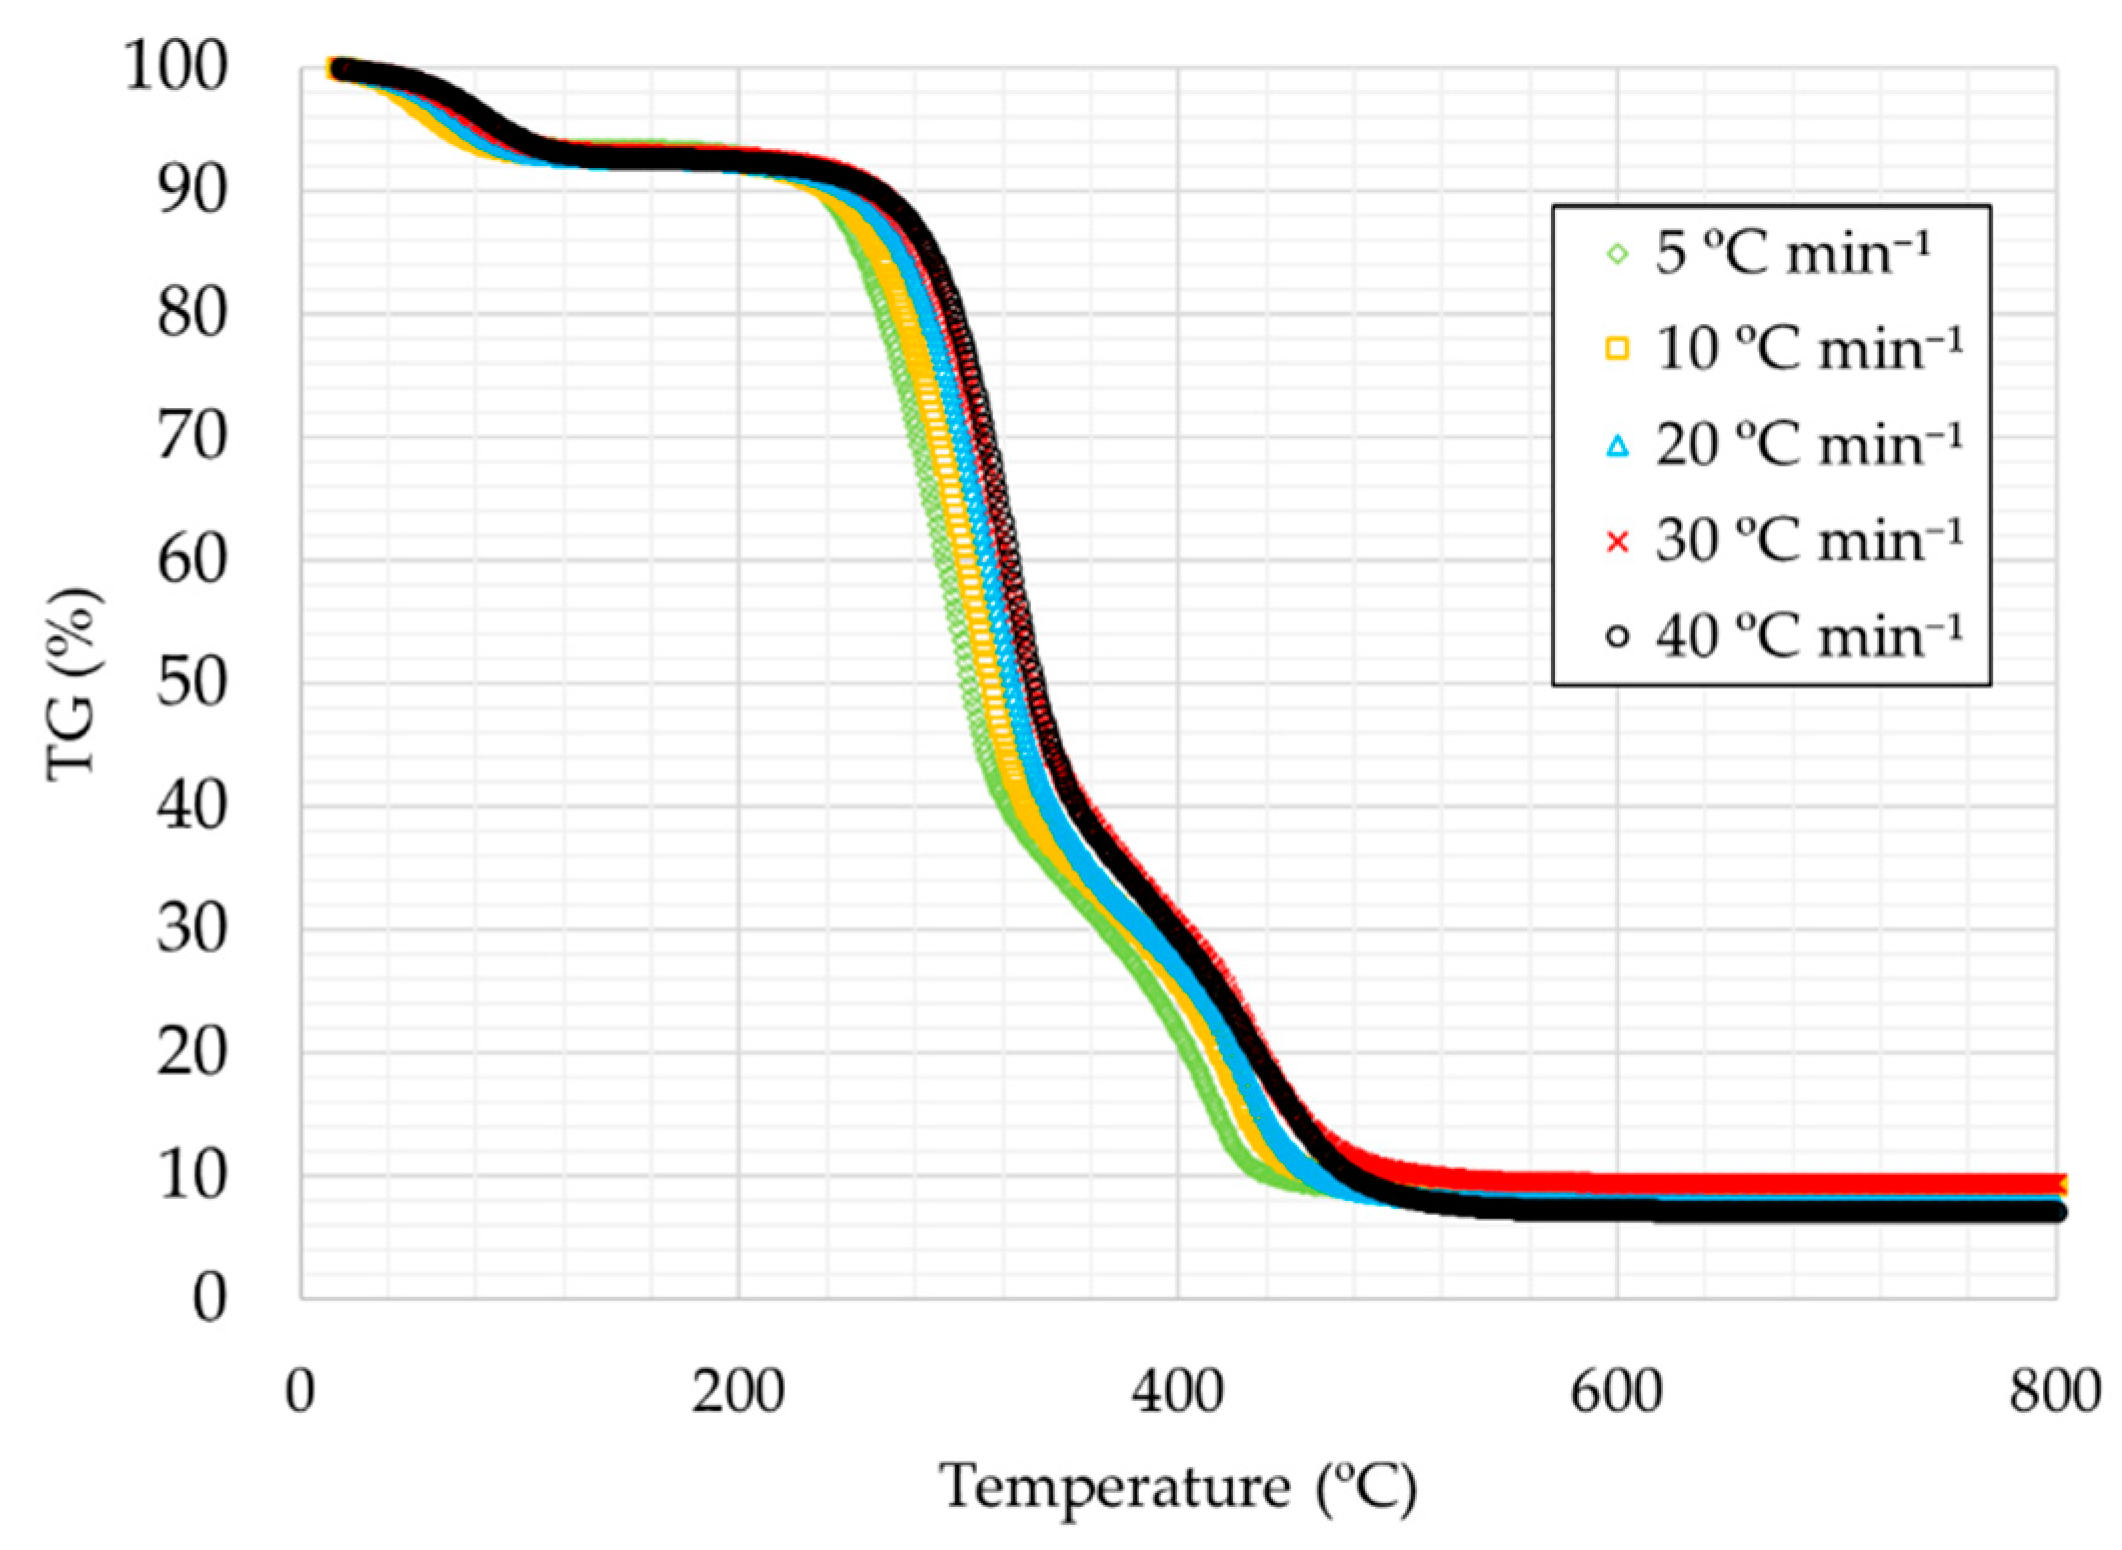
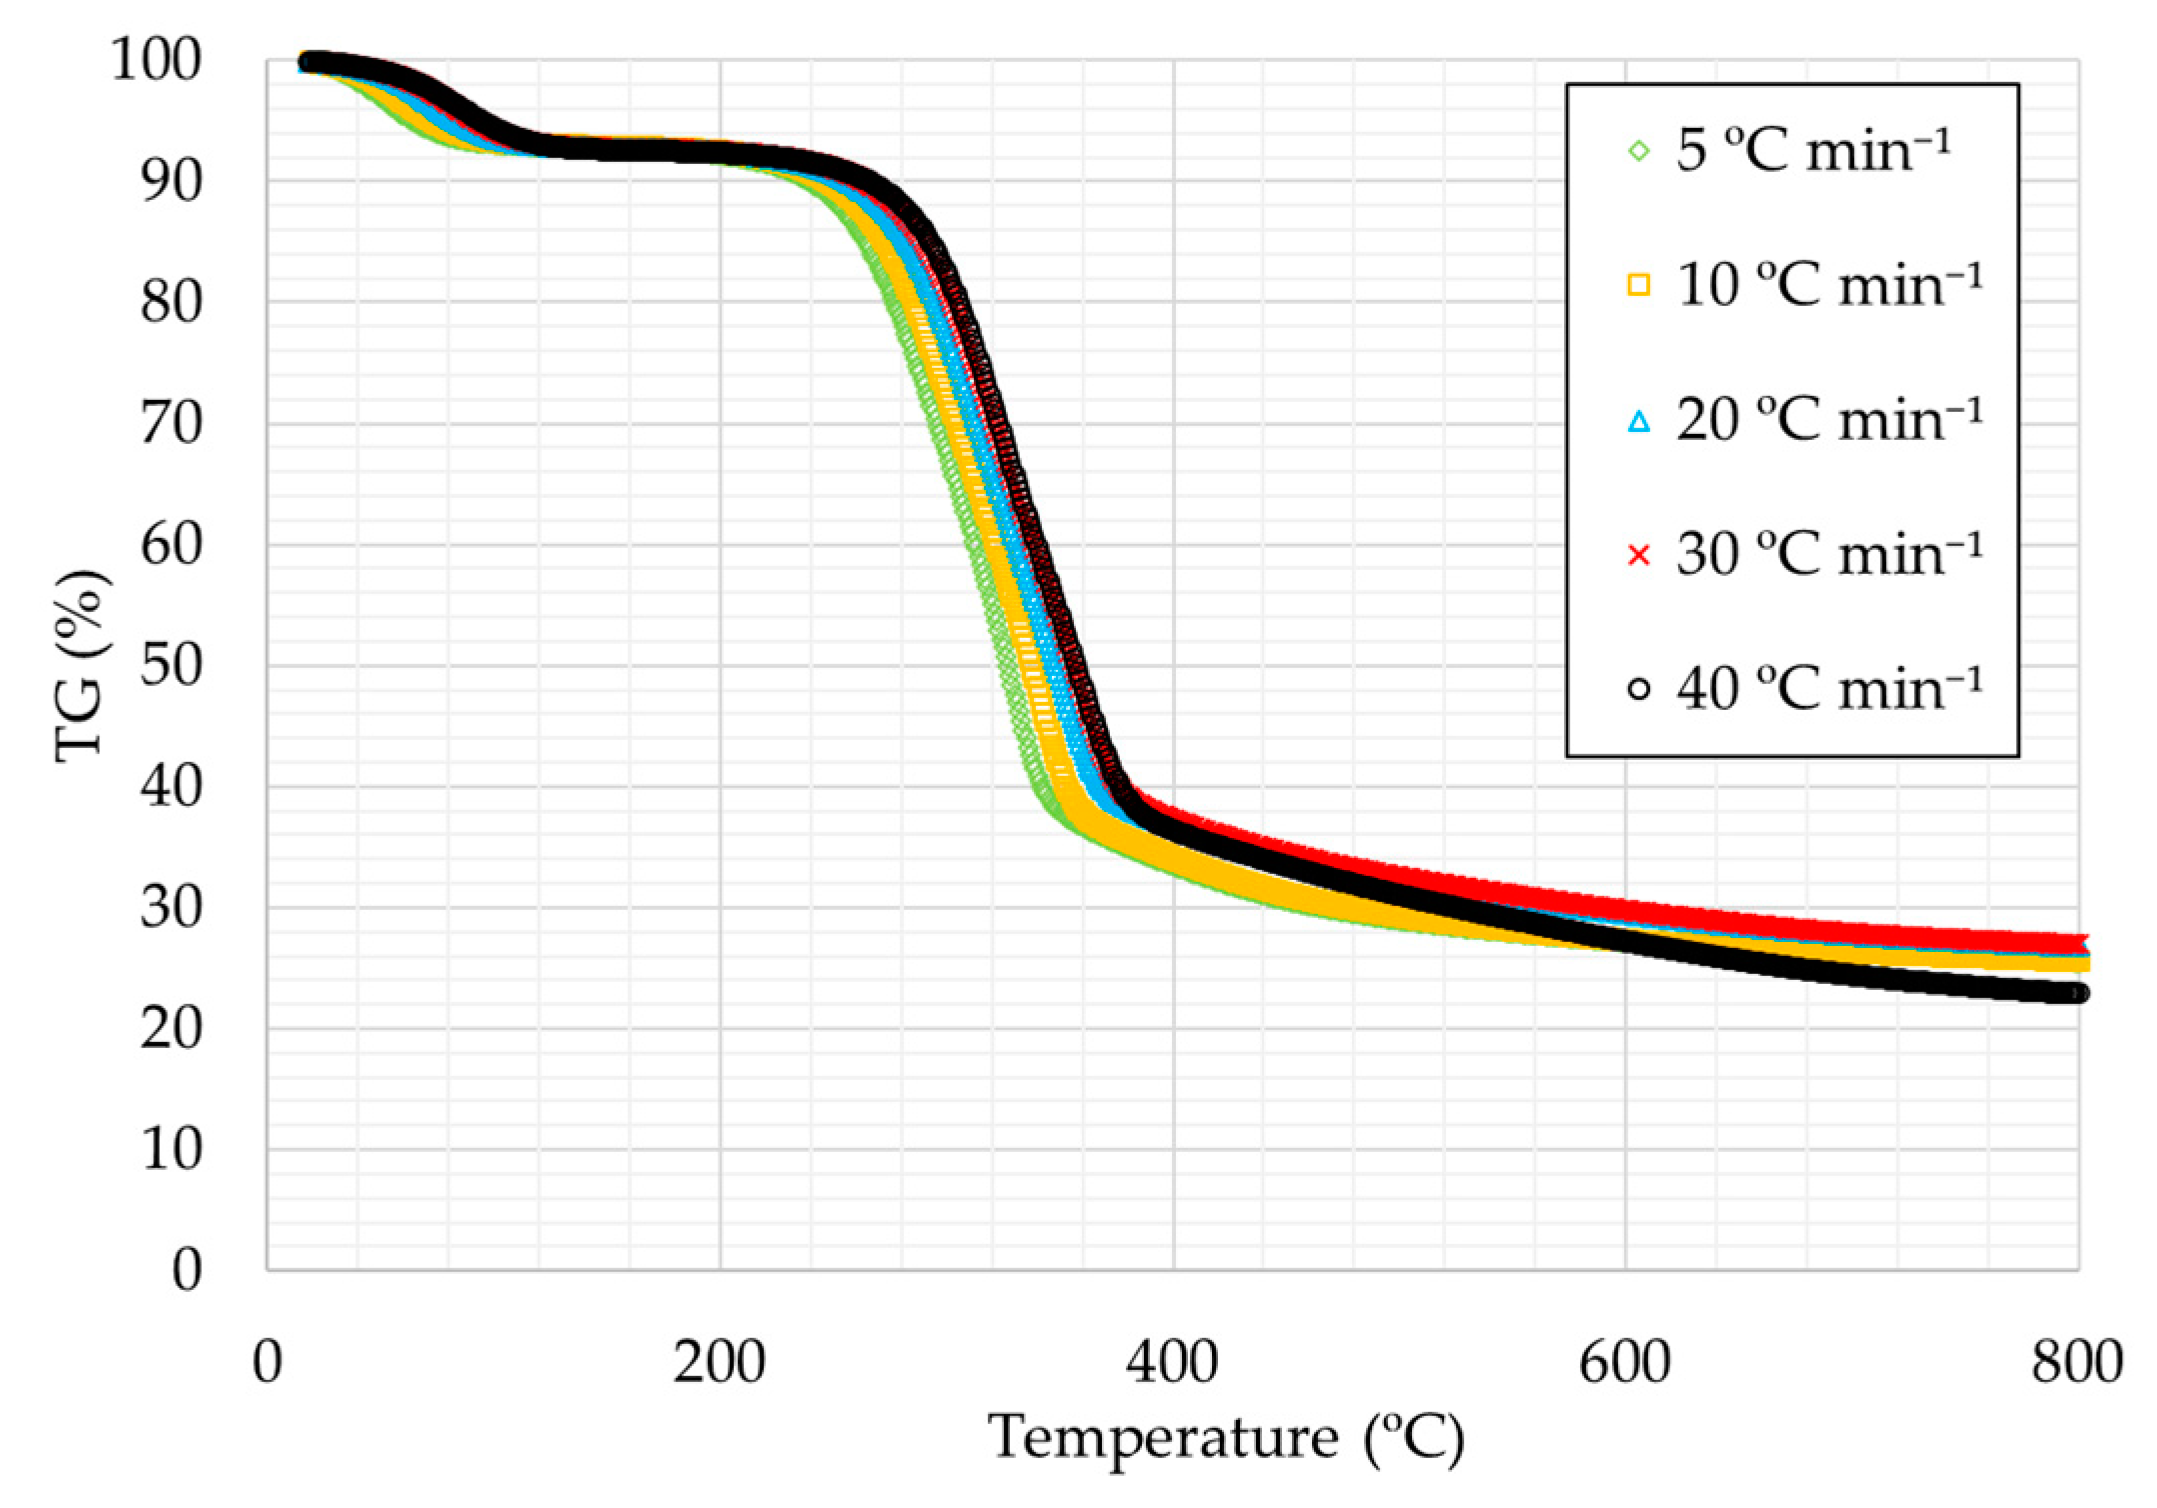
Figure 1 and Figure 2 present the thermogravimetry curves (TG) for rice husks for all the heating rates studied, under oxidative atmosphere (Figure 1) and under inert atmosphere (Figure 2), respectively.
The curves are very similar in all cases, with the first decrease being caused by the removal of moisture, followed by a very pronounced decrease due to the removal of volatiles in the first instance and finally to the degradation of fixed carbon. The curves show at higher temperatures that there is a certain percentage that is not degraded, which corresponds to the by-product ash in the case of Figure 1 and to the addition of ash and fixed carbon in the case of Figure 2.
It can also be observed that as the heating ramp was higher the thermal decomposition temperatures are slightly higher, a trend that can be observed in TG curves of many substances [42].
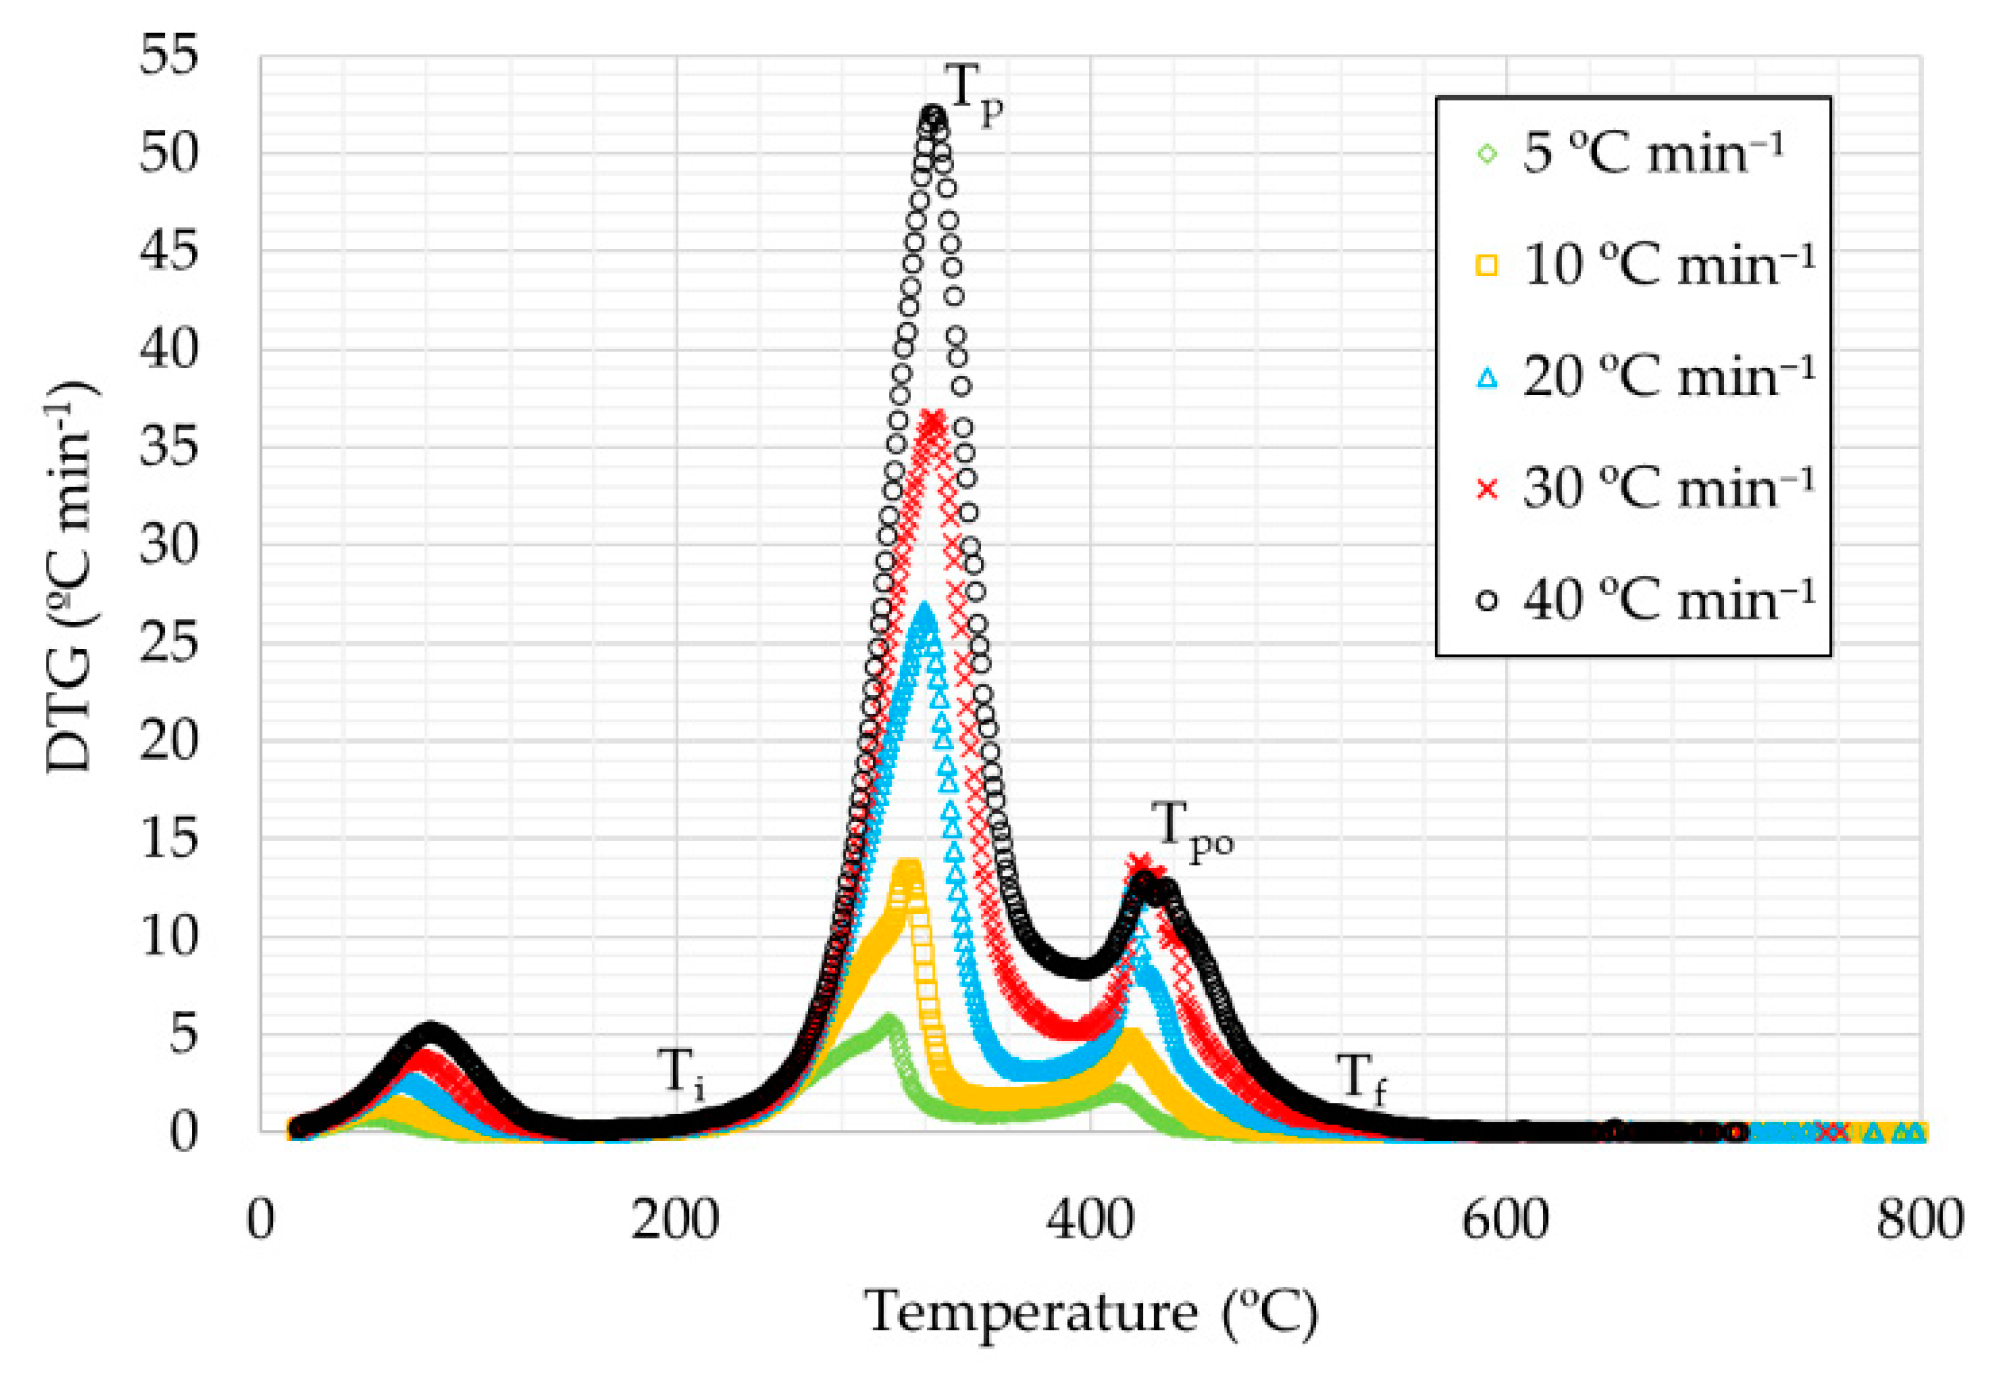
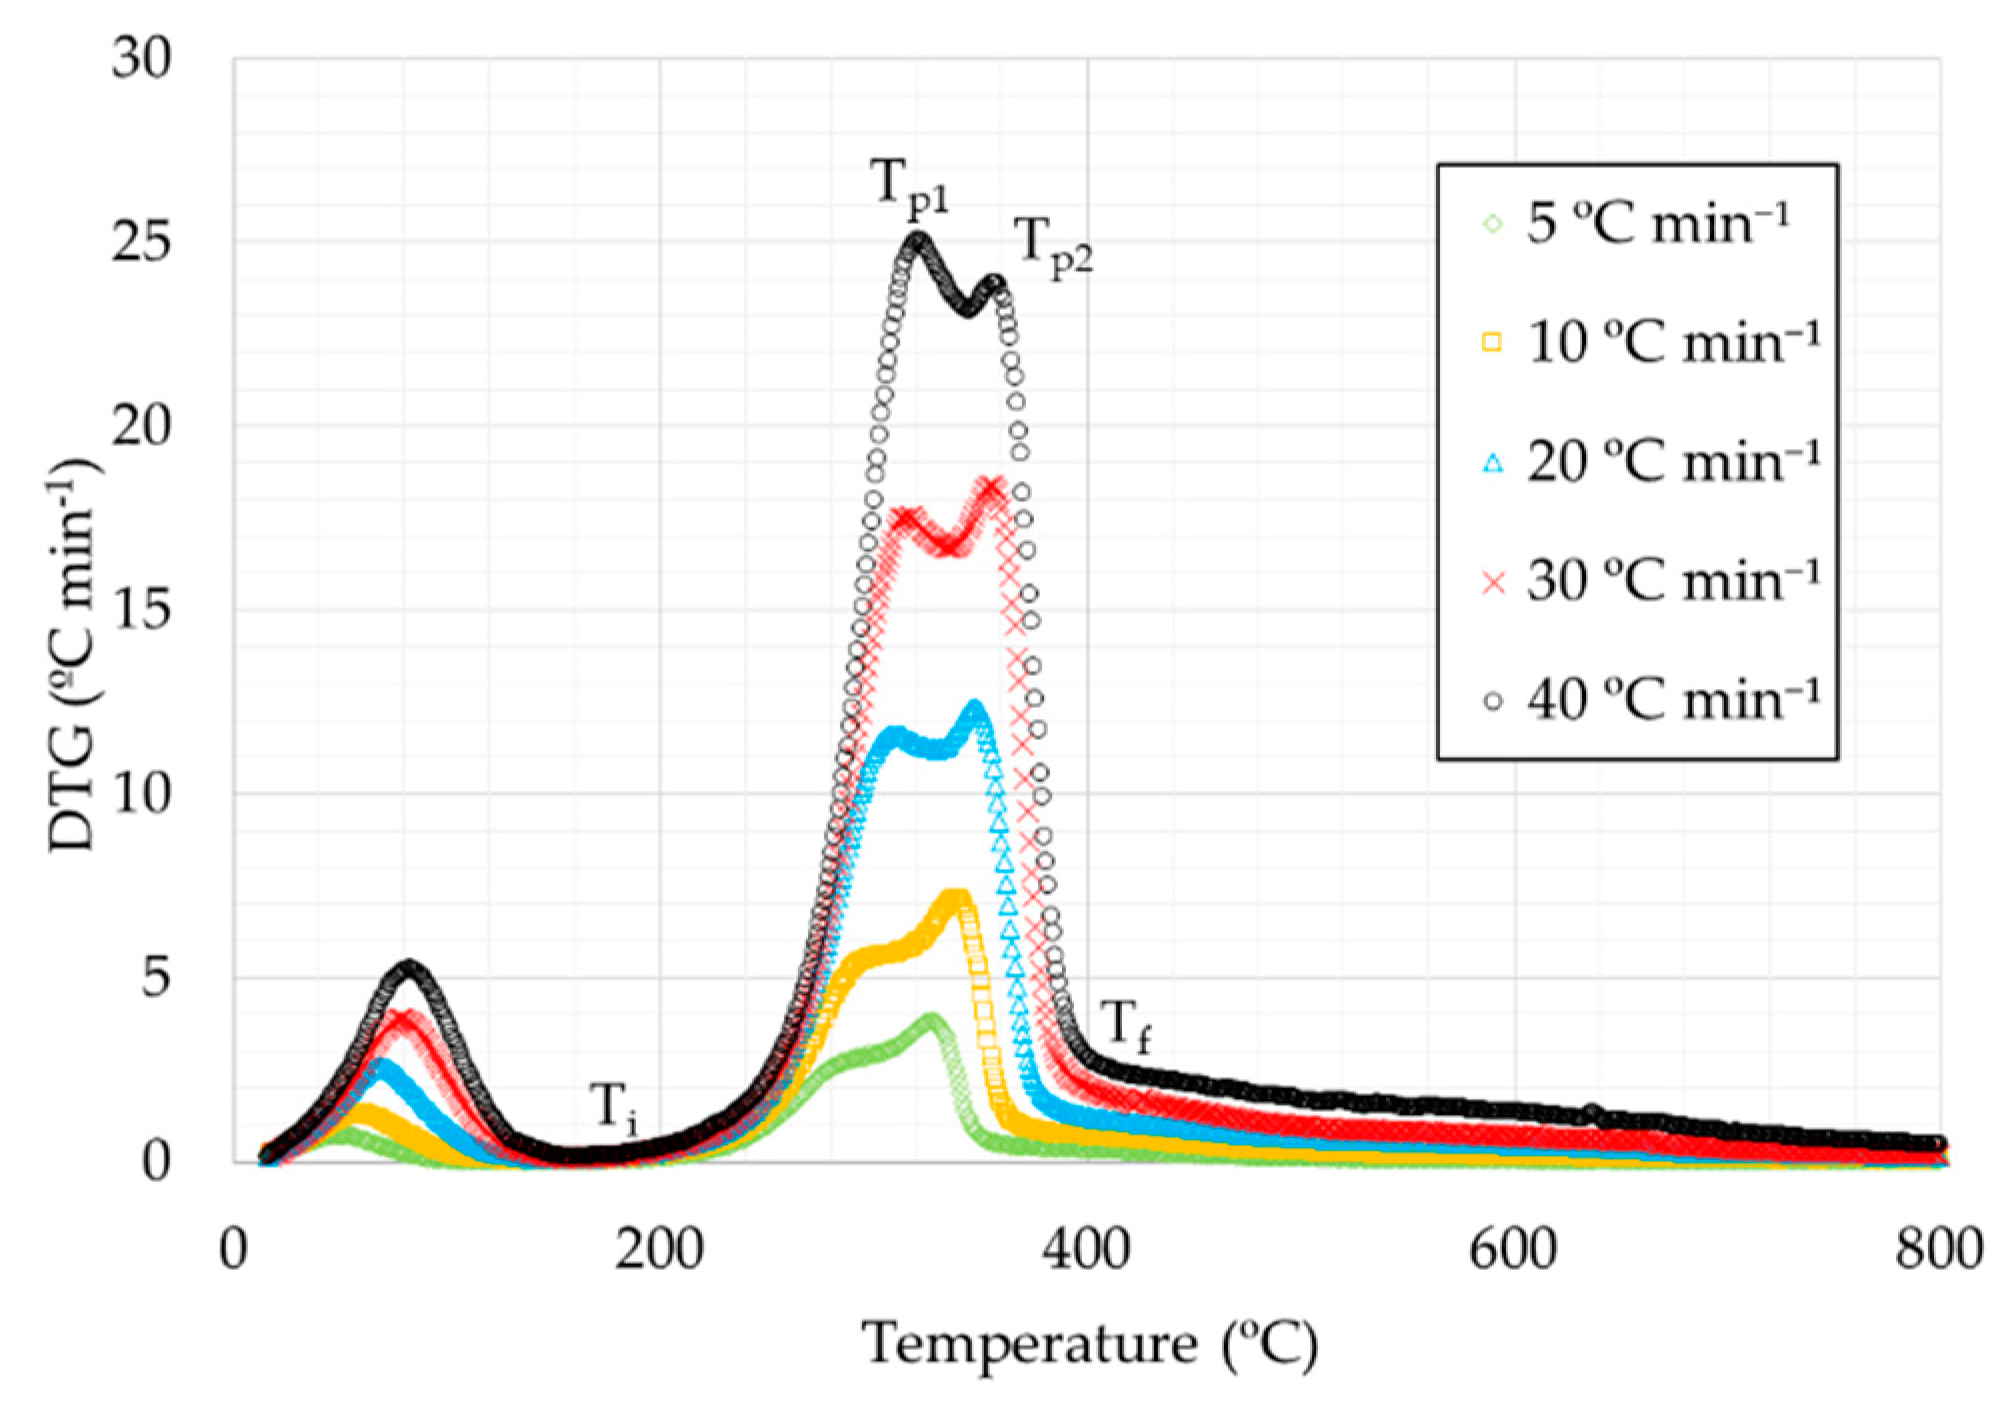
Derivative thermogravimetry curves (DTG) for rice husks are shown in Figure 3 and Figure 4. It can be seen that the curves for the different heating rates were similar, consisting in a small peak in the initial part, a more pronounced peak in the intermediate temperature range, and a long final peak. In oxidizing atmosphere, a third peak can also be observed.
Based on the whole temperature range considered, samples could be separated into three different stages, according to each peak in DTG curve. The first stage corresponds to the lowest temperature range, from room temperature up to 177–217 °C, depending on the heating rate. In this stage a small weight loss is produced, due to the water loss on account of evaporation and the release of some light volatiles [43]. The second step corresponds to the highest weight loss, caused by devolatilization, and produced in the temperature range between 177–217 and 372–408 °C. The plots showed a double peak in the case of inert atmosphere, where the highest peak corresponds to the highest temperature. This fact was not observed for the plot at the highest heating rate (40 °C min−1), as the highest peak took place at lower temperature. Moreover, in the two first curves (5 and 10 °C min−1, respectively), the temperature of the first peak can not be established. The third stage is related to the highest temperatures from 372–408 °C. This stage is the most different one between oxidative and inert atmosphere. Regarding oxidizing atmosphere curves, a peak was observed, corresponding to the weight loss due to char combustion. The final waste is related to the ash amount of the sample. In the curves corresponding to inert atmosphere, the weight loss is too slow, possibly due to the decomposition of carbonaceous materials contained in the by-product [44].
Considering the chemical composition of rice husks, the second step is usually attributed to the degradation of hemicellulose and cellulose and the third step to the degradation of lignin. Some authors show a chemical composition of rice husks consisting of 20–21% hemicellulose, 29–38% cellulose, and 15–20% lignin [37,45].
The main characteristics for thermal decomposition are shown in Table 3:
It can be observed that, in all cases, as the heating rate increased, the peaks were obtained at higher temperatures except for the heating rate at 40 °C min−1 in inert atmosphere, where this effect was observed in the first peak and not in the second one as in the remaining cases. Moreover, it can be observed in the corresponding figure at inert atmosphere that the first peak of the second stage was more and more pronounced, with the highest peak for the curve corresponding to the highest heating rate. Moreover, DTGmax values were higher for higher heating rates, for both atmospheres, obtaining higher values for the tests in oxidizing atmosphere.
3.3. Kinetic Analysis
For a correct use of the model, the appropriate temperature ranges are the ones between Ti and Tf (see Table 3), corresponding to the tests in inert atmosphere. Conversion values (α) were chosen in the same range (0.1–0.8) for all the heating rates. FWO, KAS, and Starink plots are shown in Figure 5.
By using the values obtained from Figure 5, the subsequent equations corresponding to the model used can be obtained. Therefore, the activation energies from the slope of these lines are calculated. The values of activation energy and their corresponding correlation coefficients, obtained in this research work, are shown in Table 4.
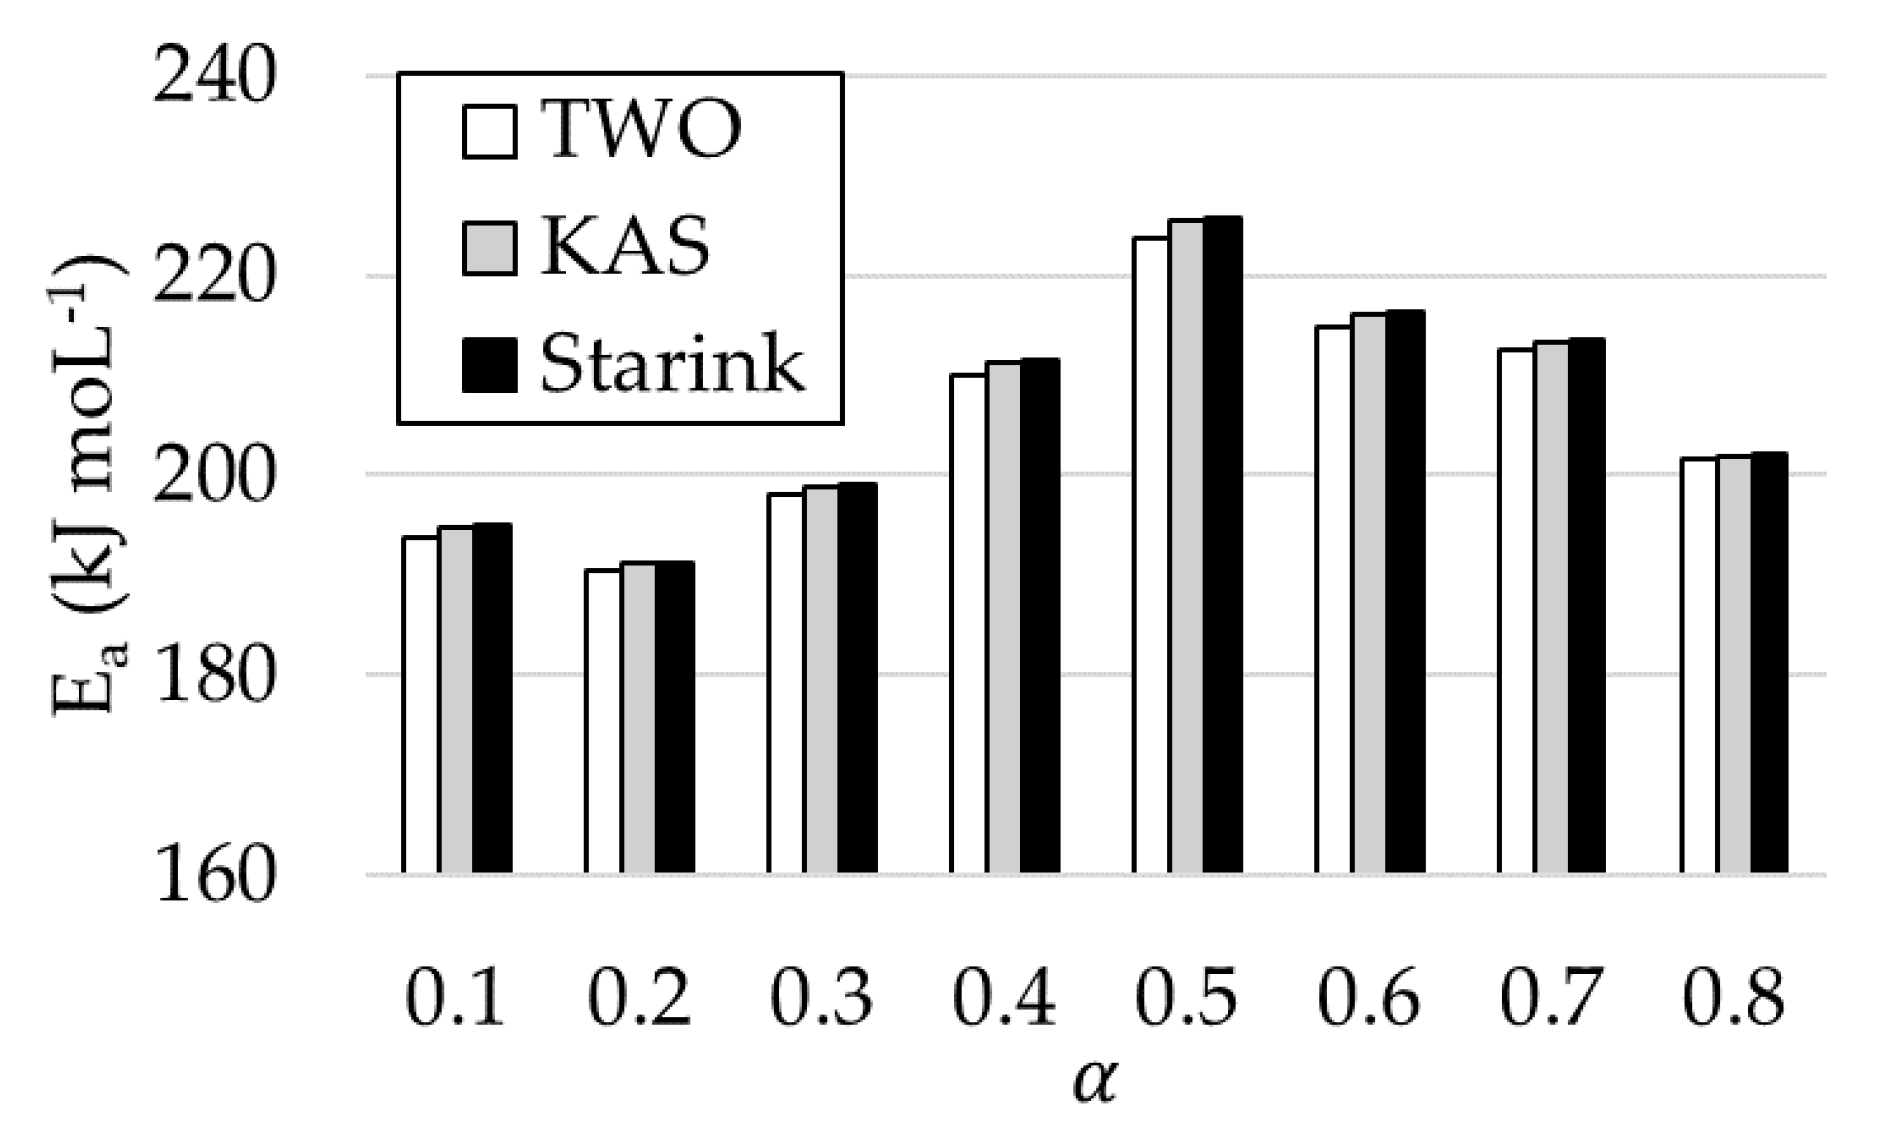
The activation energy is the minimum value of energy that is necessary to start the reaction. Therefore, a reaction will be more difficult to be started when the activation energy is higher. The activation energy calculated by FWO method was in a range of 193.87–223.67 kJ moL−1, with an average value of 205.64 kJ moL−1. For KAS method, Ea was between 194.90 and 225.26 kJ moL−1, with an average value of 206.61 kJ moL−1. Finally, Ea values obtained by using the Starink method were very similar to the former (between 195.08 and 225.63 kJ moL−1, and an average value of 206.82 kJ moL−1). In turn, a slight increase in Ea as α was higher, decreasing slightly from α = 0.5. This trend was repeated in all the methods used. In general, an increase in the activation energy with temperature is due to parallel and complex reactions [46,47].
In almost all cases, the correlation coefficients exceeded the value of 0.990, which were considered acceptable, being higher for the highest degrees of conversion. Nevertheless, these values were lower for intermediate conversions. This irregular trend is, in general, due to the abovementioned complex reactions.
Figure 6 shows the activation energy values obtained for the three methods used at different conversion degrees. The patterns were similar, to the values obtained by the Starink method being higher than the ones obtained by using the remaining methods.
Gai et al. [48] obtained Ea values for rice husks at different conversion degrees through the Starink method. These values were between 88.99 and 50.49 kJ moL−1, with an average value of 79 kJ moL−1. All these values were substantially below the values obtained in this work. Gai also calculated the activation energy for corn stover by the Starink method, obtaining a value of 129 kJ moL−1. On the contrary, Jia et al. [49] obtained very similar results through the FWO method for the by-product studied in this study, with a maximum value of 219.80 kJ moL−1 and a minimum of 194.37 kJ moL−1, for a conversion degree (α) range between 0.1 and 0.8.
Özsin et al. [46] obtained activation energy values for several by-products obtained through the same methods studied in this research work. For chestnut shells, according to the FWO method, a value of 175.9 kJ moL−1 was obtained; according to the KAS method, 175.2 kJ moL−1, and according to Starink method, 175.5 kJ moL−1. These values were below the ones obtained for rice husks, but they were very close. Özsin also obtained activation energy values for cherry stones (Ea: 268.5 kJ moL−1 by FWO method, 272.2 kJ moL−1 by KAS and Starink method) and for grape seeds (Ea: 187.3 kJ mol−1 (FWO), 186.6 kJ moL−1 (KAS), 186.9 kJ moL−1 (Starink)). Moreover, in all cases, as it happened in this work, Ea values increased with the conversion degree. However, this value decreased at the highest α values.
The activation energy obtained by the FWO method for olive pomace was reported by Özveren et al. [50], with a value of 300 kJ moL−1, approximately. Nevertheless, Brachi et al. [51] obtained an activation energy value of 210 kJ moL−1, approximately. Very different values were obtained by Miranda el al. [52] for the activation energy of grape pomace (31.26, 16.92 and 41.98 kJ moL−1, for each stage), obtained by using the Criado method. Other similar wastes, such as coffee ground residues, showed activation energies between 220-250 kJ moL−1, approximately [53]. Huang et al. [54] obtained the activation energy of spent mushroom substrate by FWO (Ea = 171.49 kJ moL−1) and KAS (Ea = 170.18 kJ moL−1) methods, and observed the same trend concerning the degree of conversion. Similarly, Khiari et al. [55] obtained a mean Ea value of 223.87 and 231.21 kJ moL−1 for FWO and KAS methods, respectively. Finally, for other kind of biofuel like coal, Otero et al. [56] reported a value of 114.4 kJ moL−1 by using the FWO method.
3.4. Evolved Gases
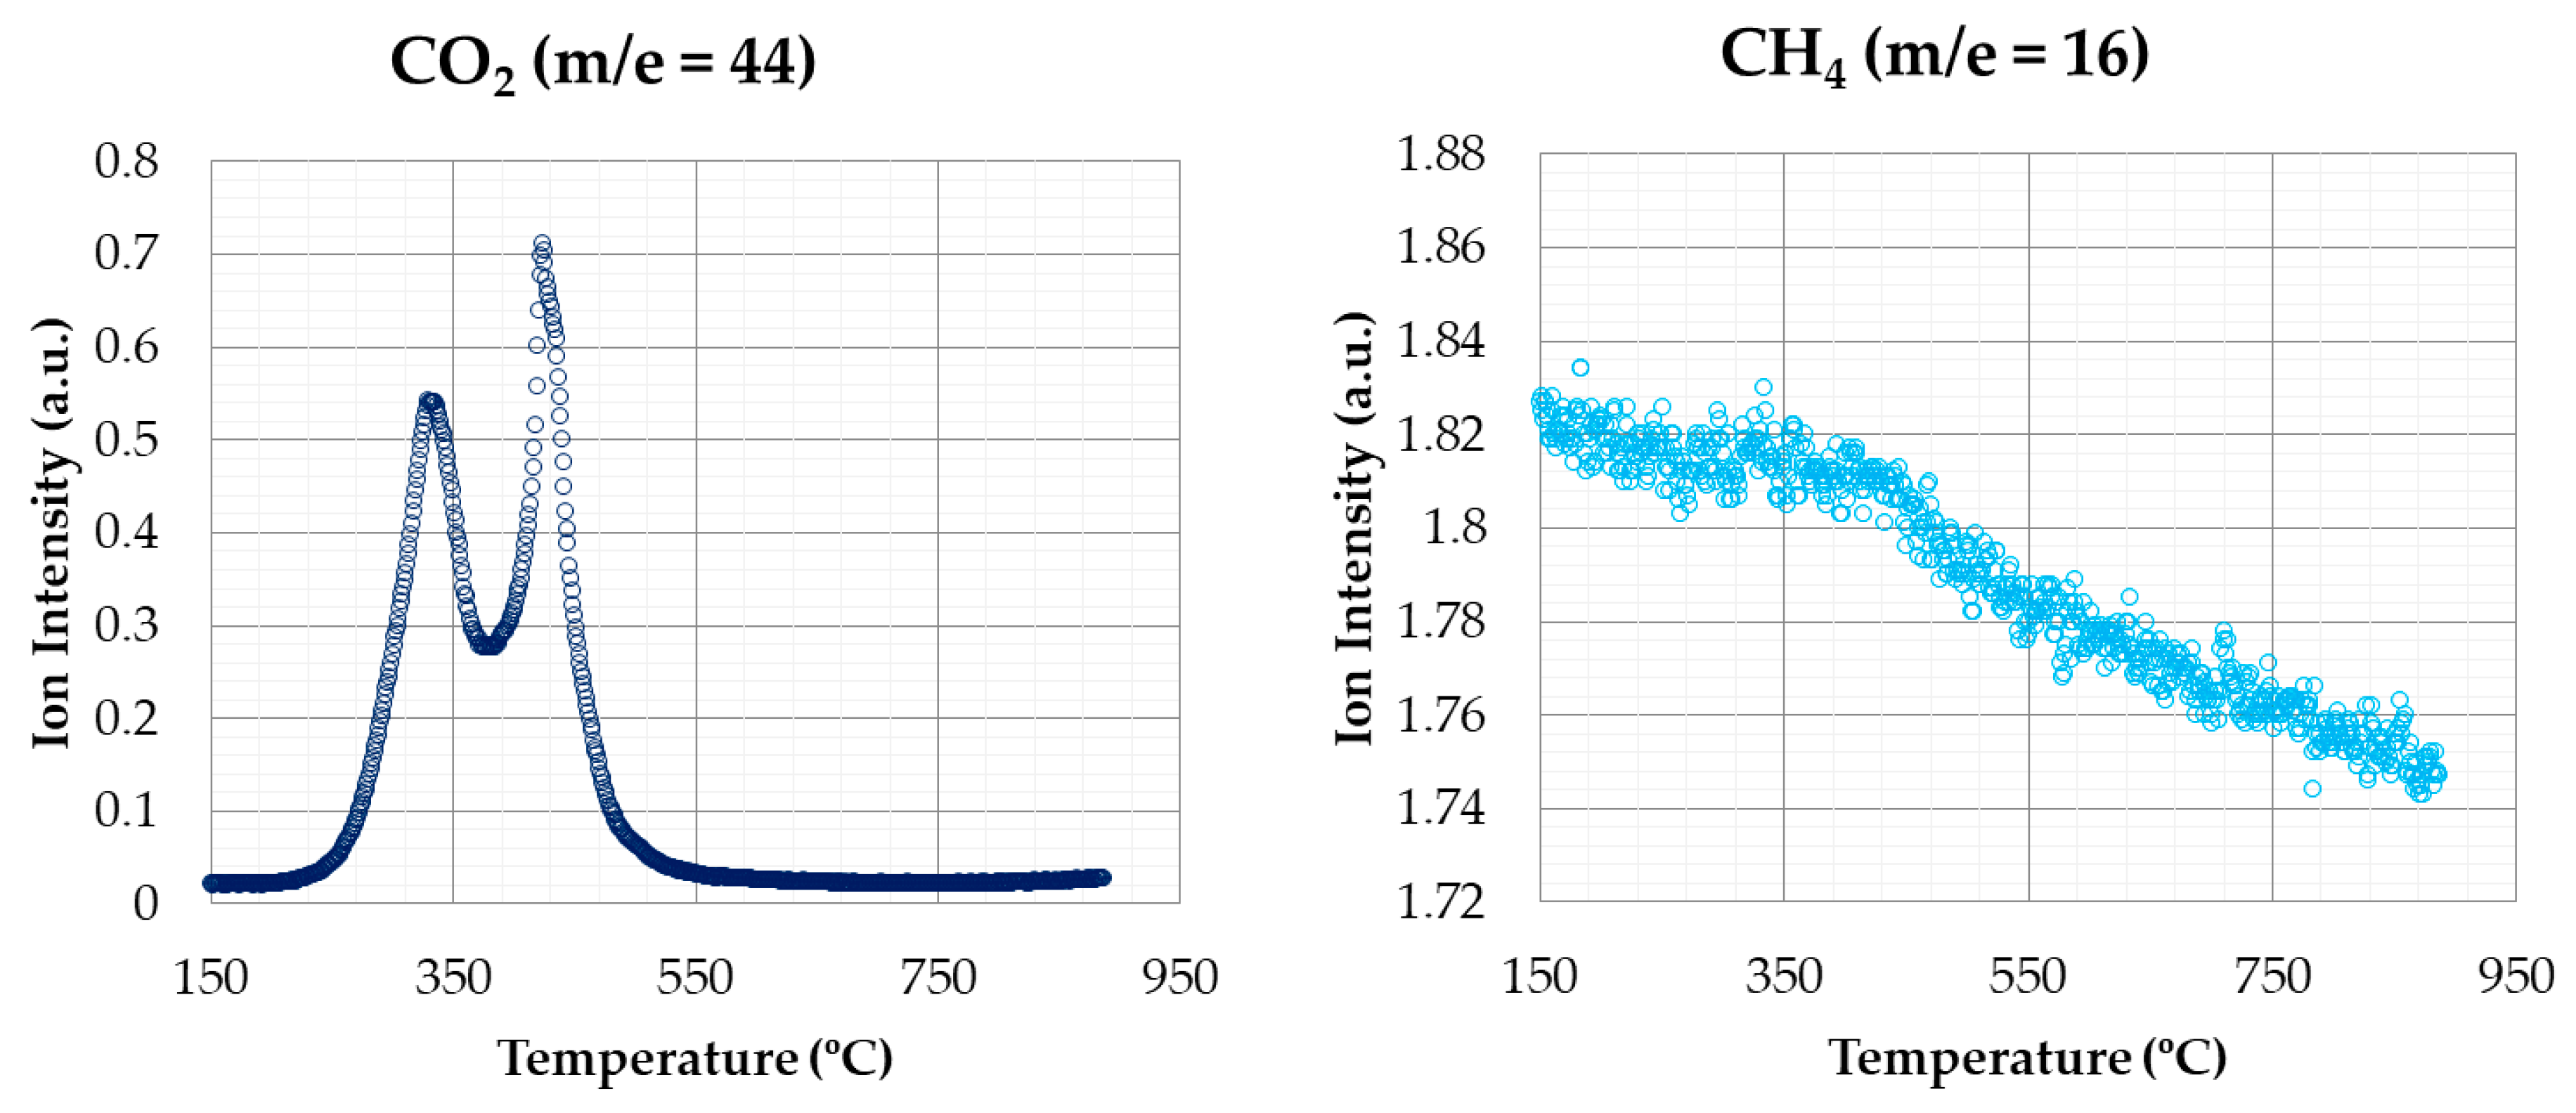
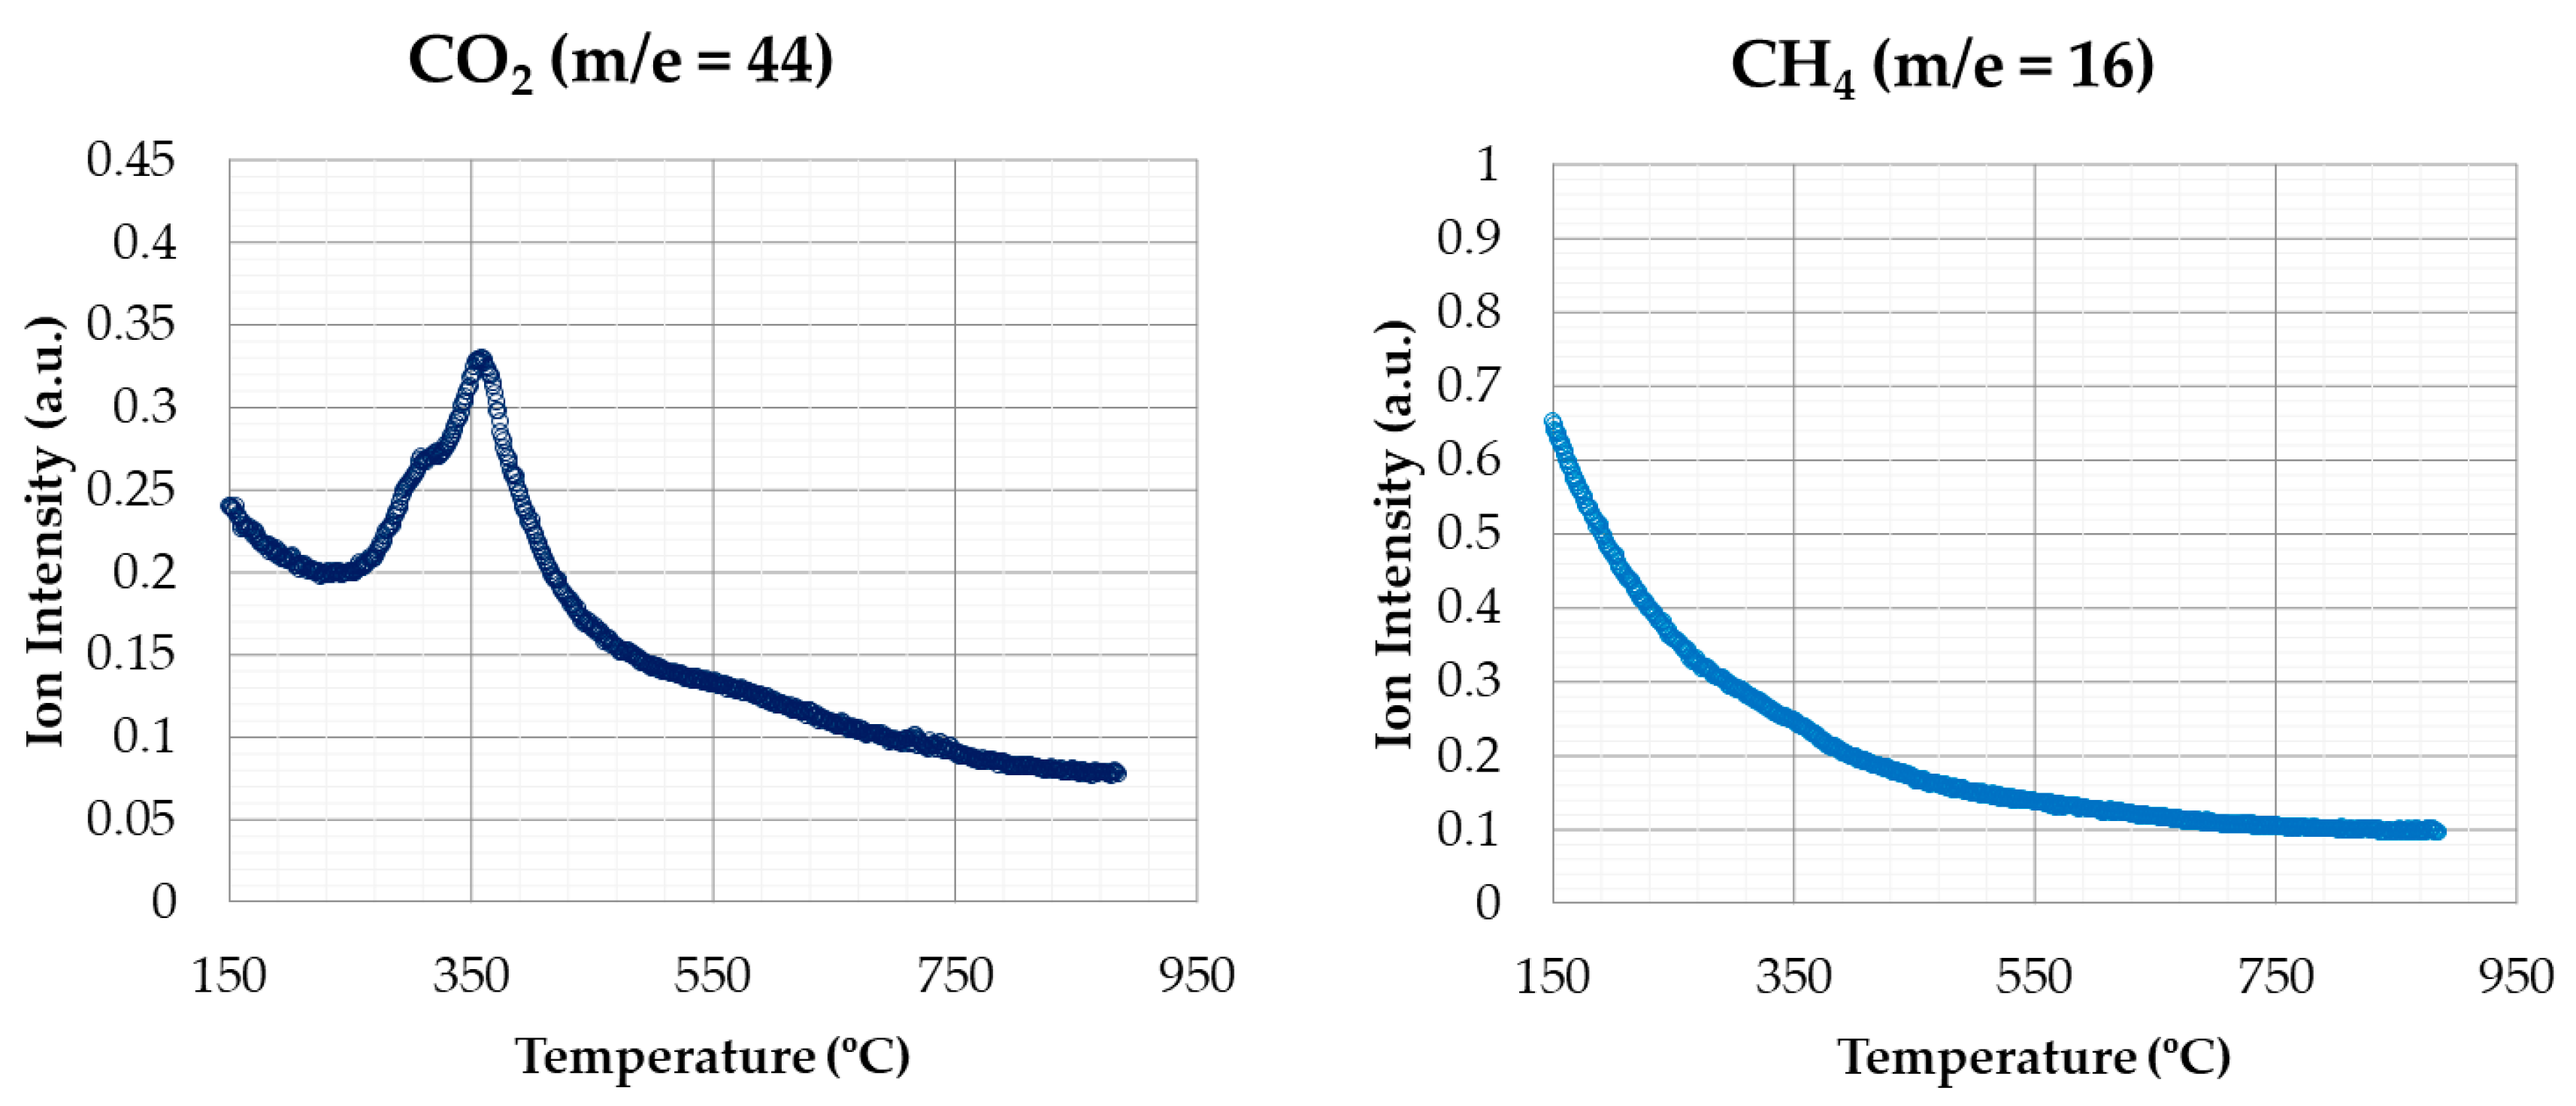
The signal variation of the emissions of the gases can be obtained by the sampling capability of the mass spectrometer. Figure 7 shows the emission of CO2 and CH4 in combustion tests (oxidizing atmosphere) for a heating rate of 20 °C min−1.
CO2 is one of the most abundant released gases during combustion, and is involved in most of the thermal degradation events. The pattern of CO2 shows that the release of this compound was produced both in the second stage (corresponding to devolatilization) and the last one (corresponding to char combustion), with the second stage being higher.
CH4 signal hardly showed variations. It can be observed a slight increase around 350–450 °C, approximately. In this case, the different stages are not as defined as in the case of CO2. Therefore, CH4 emissions, although having a weak signal, are produced during the whole combustion process.
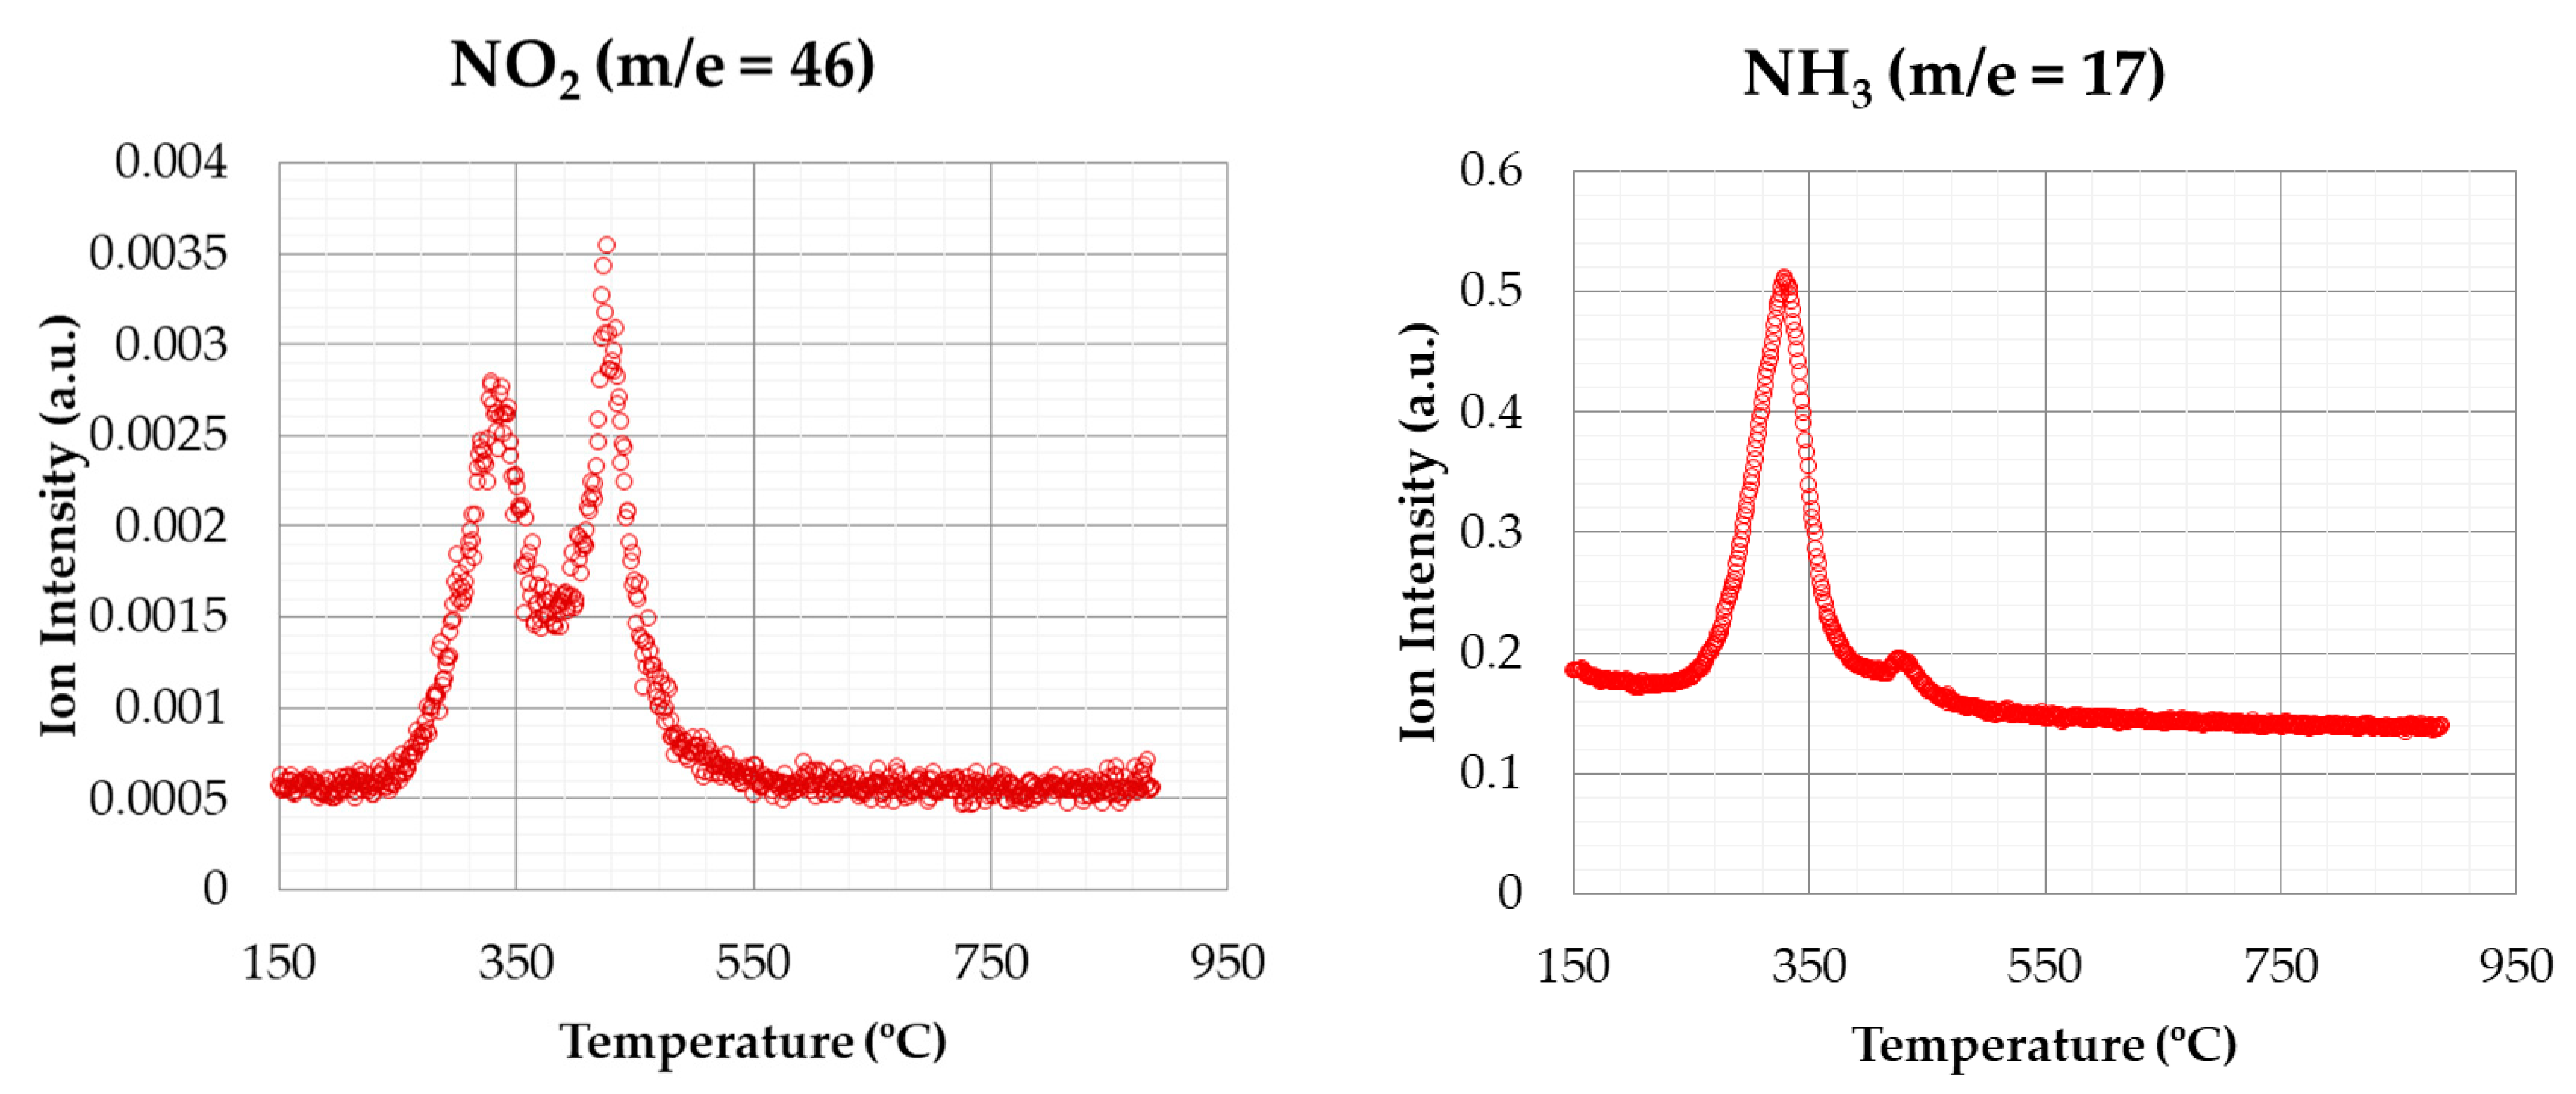
Figure 8 shows the emissions for nitrogen containing compounds (NO2 and NH3), corresponding to the same conditions of the previous test. Concerning NO2 emissions, a similar behaviour to CO2 emissions was observed, with two emission peaks clearly pronounced, corresponding to devolatilization and char combustion stages, respectively. Regarding NH3 emissions, a peak was observed in the first stage of degradation, with a second peak that was much lower in the second stage. Therefore, most of the NH3 was evolved during the devolatilization process.
The results about CO2 and NO2 emissions in oxidizing atmosphere shown by [38] indicate that the first emission peak was more intense than the second one, opposite to the profile shown in this work.
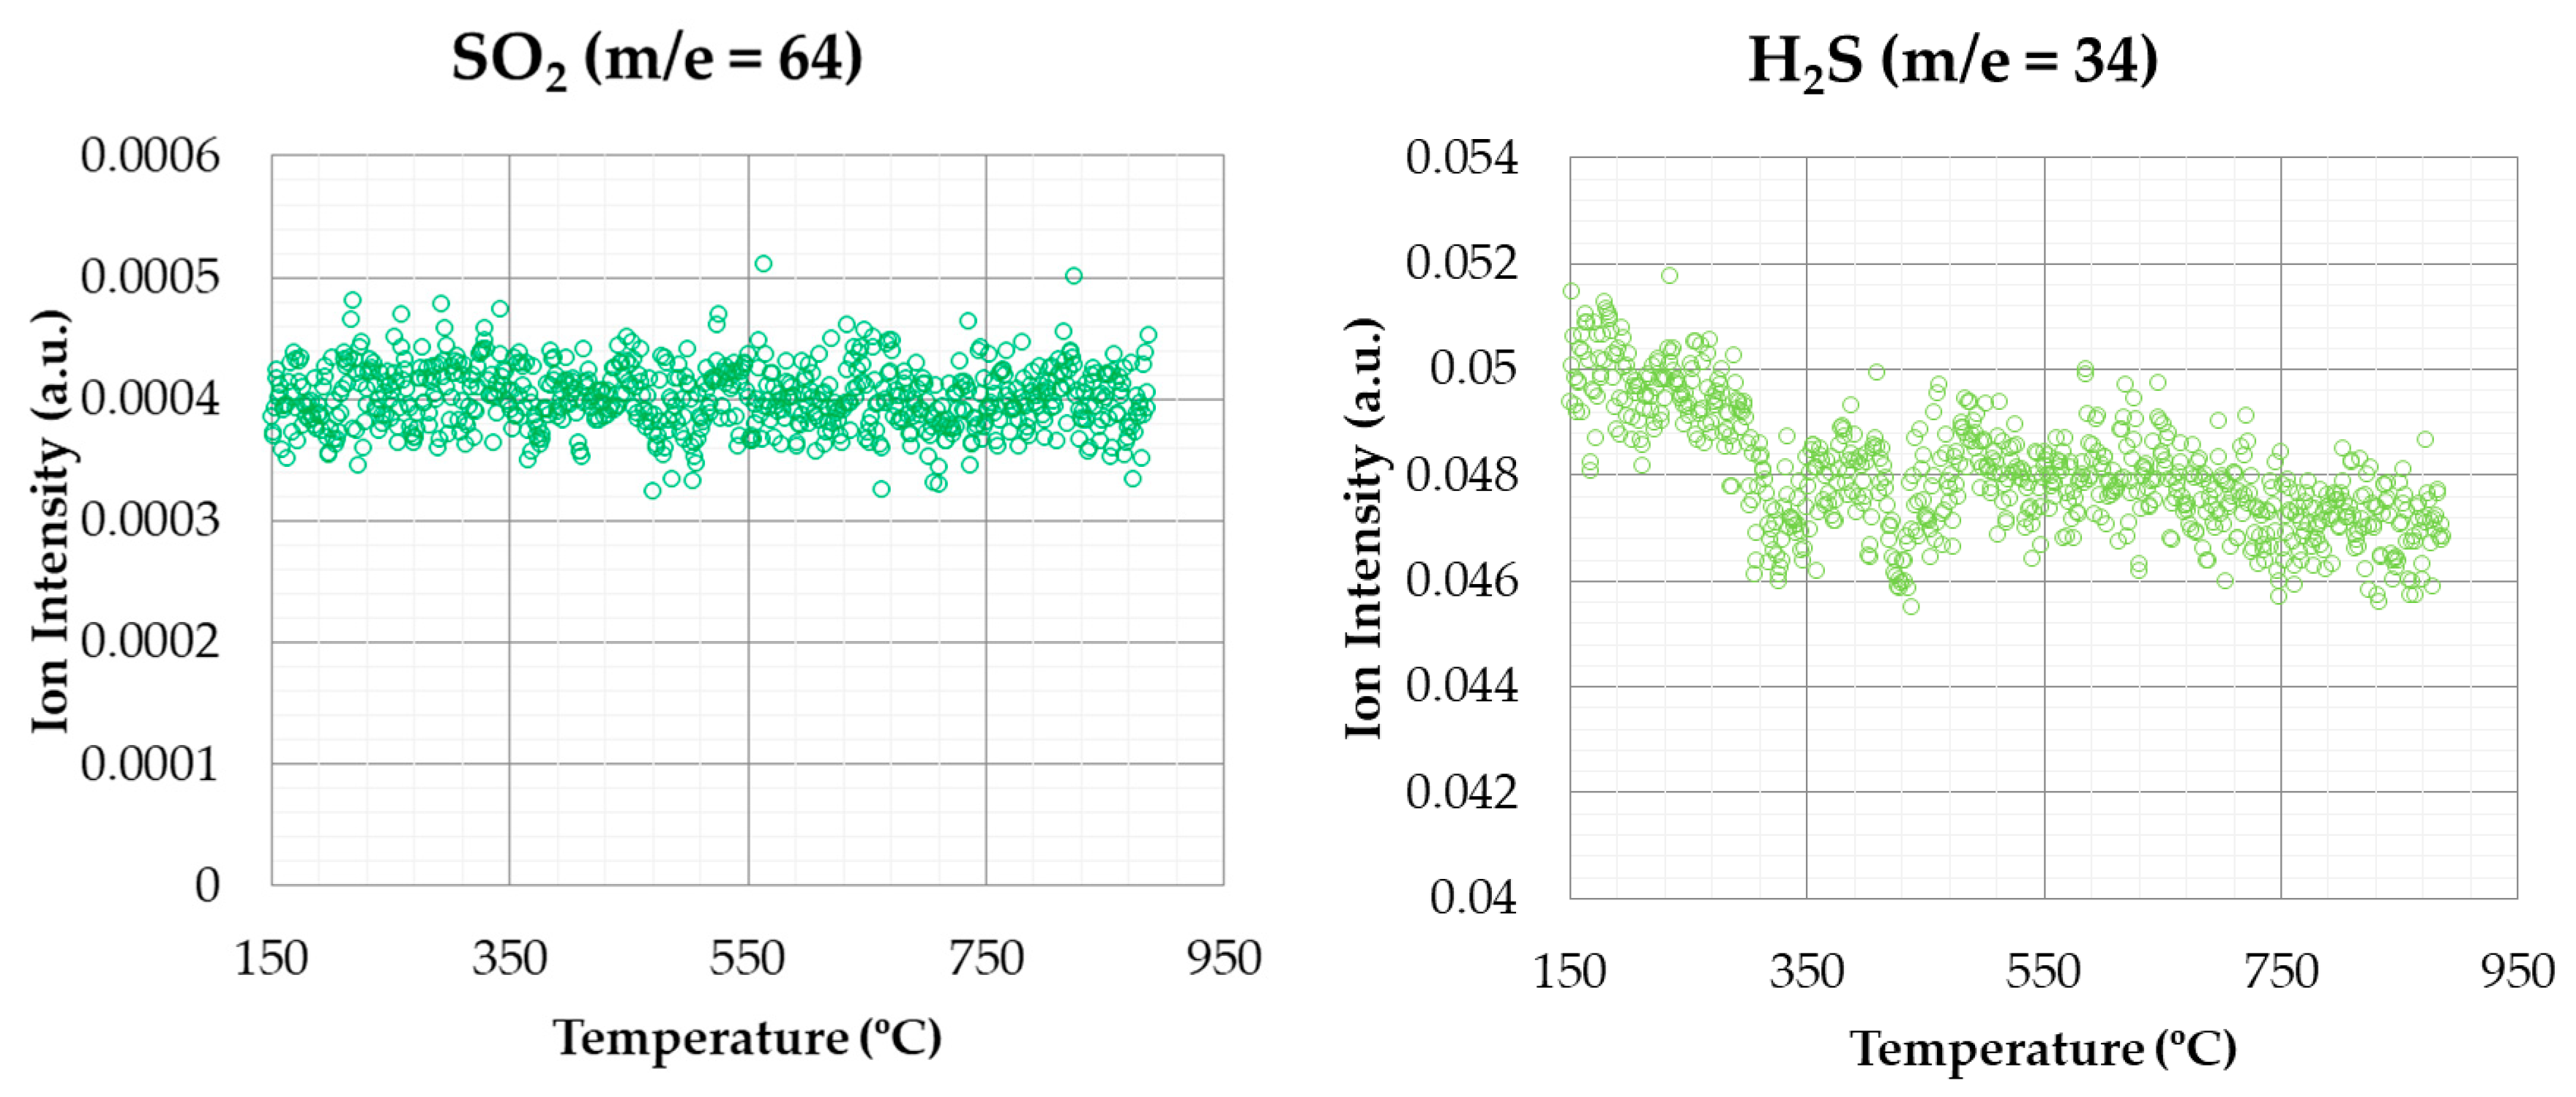
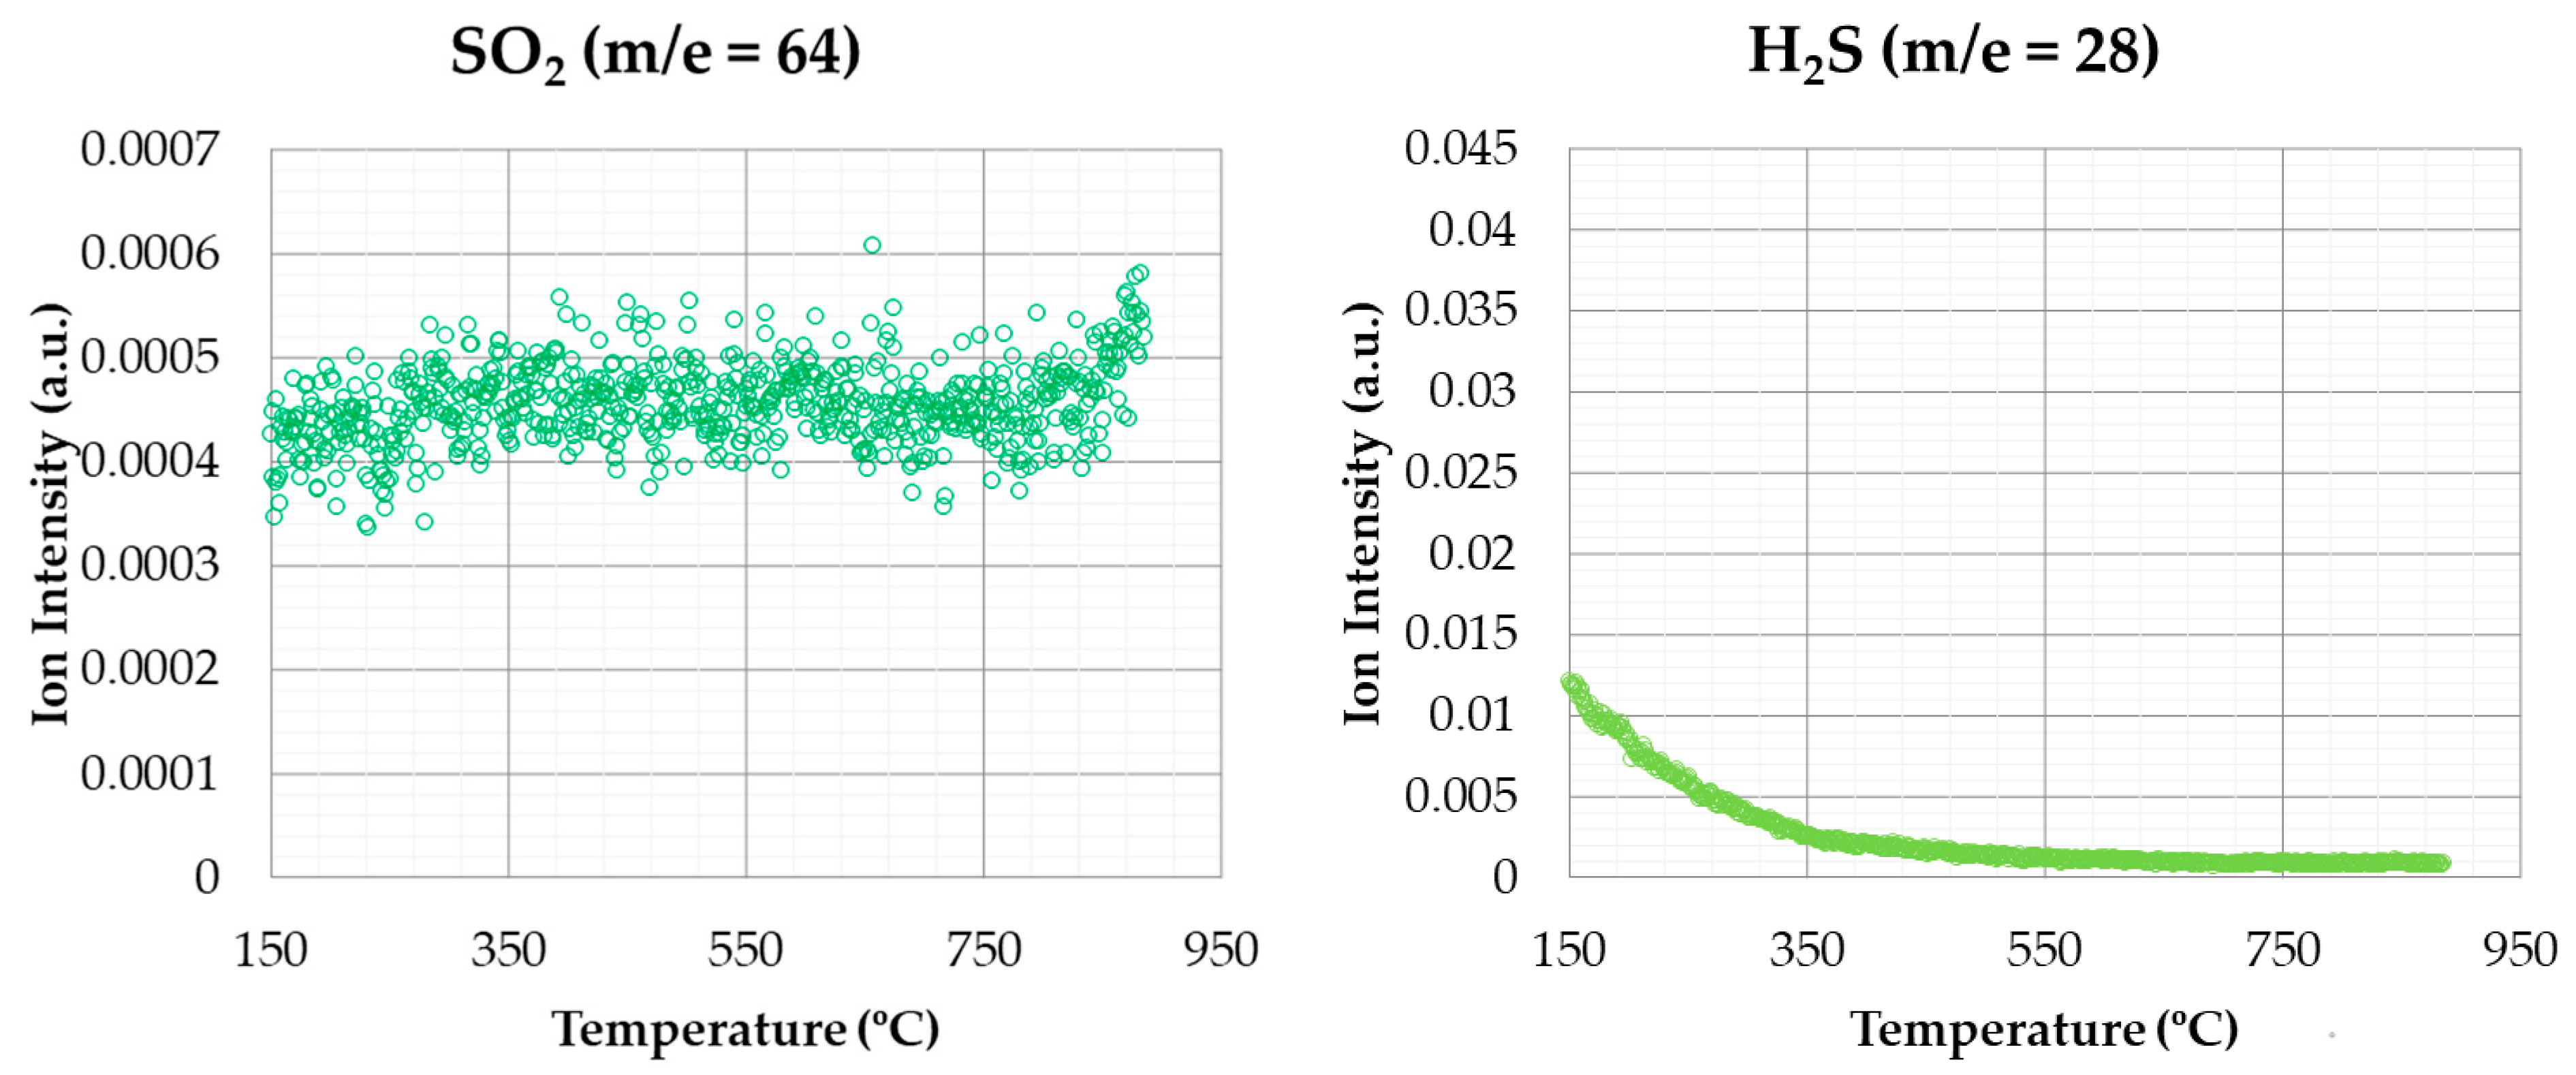
SO2 and H2S emissions, for the same conditions of the previous case, are shown in Figure 9.
With regard to sulphur-based compounds, it can be observed that there was no signal that indicates the release of SO2 or H2S emissions during the stages of thermal degradation. This fact can be due to the low percentage of sulphur in its composition (see Table 1). Nevertheless, some authors [38] found a small emission peak for SO2 in rice husks, probably due to the higher S percentage in this case.
The profiles obtained for CO2, NO2, and NH3, were similar to those obtained by other authors for other biomass wastes (for instance, spent mushroom substrate [54] or sewage sludge [57]) but not for the signal produced by SO2, this being almost negligible in this work.
Figure 10 shows the emissions of CO2 and CH4 for the thermal degradation test under inert atmosphere with a heating rate of 20 °C min−1. As in the previous case, most CO2 emissions were produced during the devolatilization stage. Other authors, such as Worasuwannarak et al. [40] showed a similar behaviour concerning CO2 and CH4 emissions for this same by-product. In this case, as there was not any char degradation, the second peak was not observed for CO2 in oxidizing atmosphere (see Figure 7). As in the previous case, the highest values of CO2 emissions were generated between 350 °C, approximately. Quantitatively, a higher amount of CO2 was released with oxidizing atmosphere than in the case of inert atmosphere.
Other biomass samples showed the same trend, for instance in the case of olive stones [58].
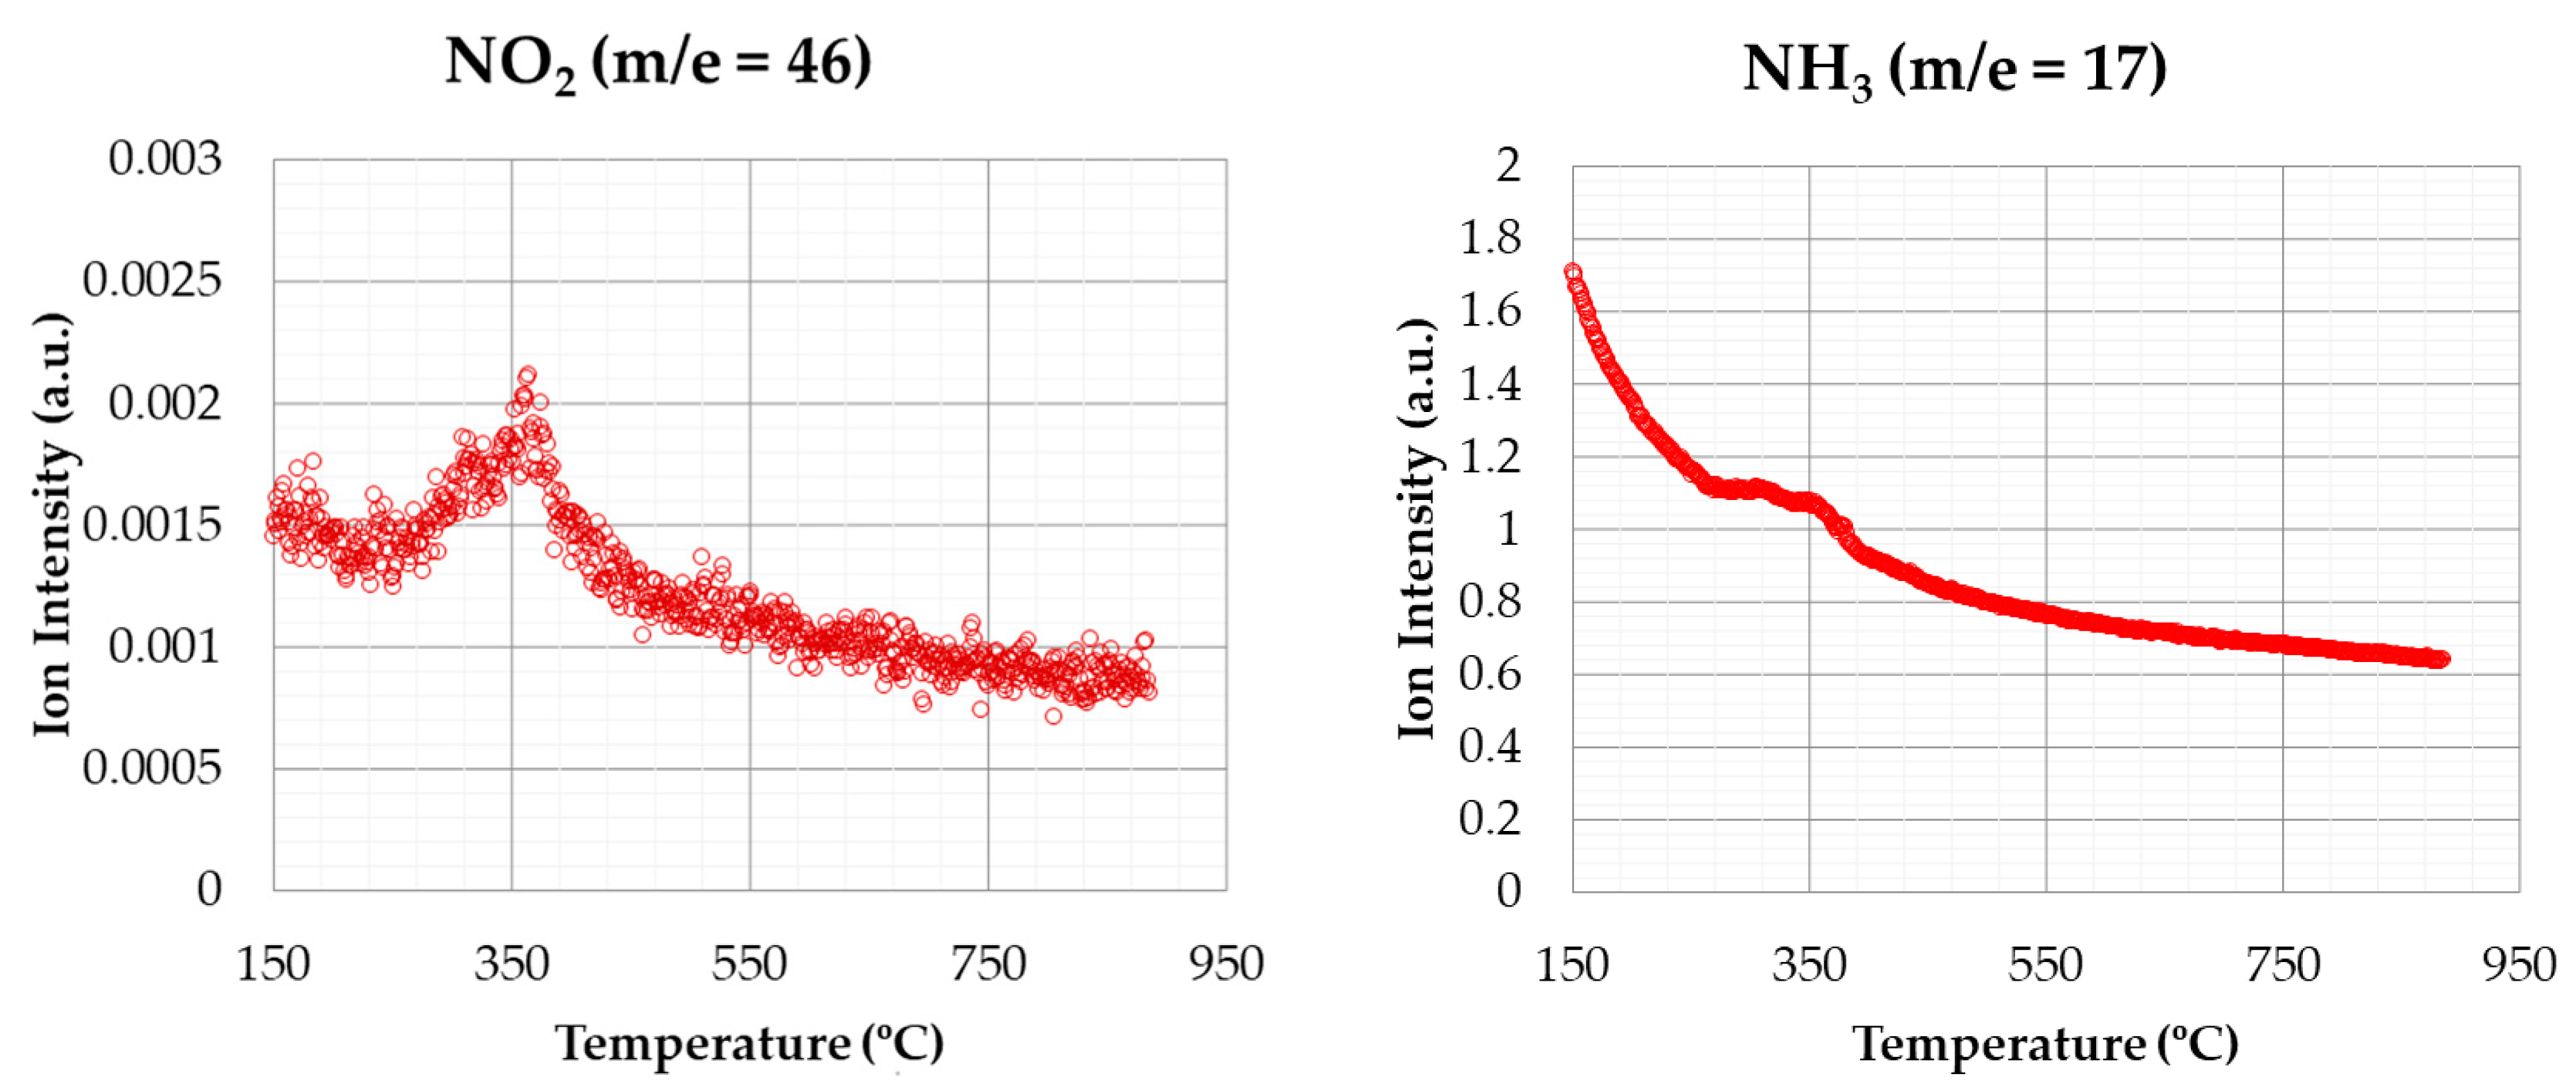
Figure 11 shows the emissions of nitrogen-based compounds (NO2 and NH3) for the test under inert atmosphere, undergoing the above conditions. The signal related to NO2 generation only showed one peak at 350 °C, approximately, which corresponded to the devolatilization stage. According to this statement, it can be assumed that all the NO2 generated is produced in this stage, as other variations were not observed in the remaining stages. Regarding the NH3 emissions, a small peak can be observed at around 350 °C. This fact suggests that there was a low NH3 generation during the thermal process at this temperature. This peak was also observed in the test at oxidizing atmosphere, but the signal was less pronounced. As in the case of carbon compounds, in the inert atmosphere test, the amount of the emission was less significant than at oxidizing atmosphere.
Figure 12 shows the SO2 and H2S emissions for the thermal degradation in inert atmosphere, with the same heating rate (like the above-mentioned case). As in the tests with oxidizing atmosphere, it was not possible to observe any variation in SO2 and H2S signals. Therefore, it could be assumed that such emissions were not evolved under the atmospheres used in this study. This result, as in the case of oxidizing atmosphere, could be due to the low sulphur percentage in rice husk composition (see Table 1).
The profiles obtained for the evolved CO2 and NO2 gases under inert atmosphere were similar to those shown by Yang et al. [59] for peat, although obtaining maximum peaks at different temperatures. CO2 and NH3 profiles for chestnut shells, cherry stone, or grape seed were also similar [46]. However, other authors obtained different profiles for other kinds of biomass, such as oil palm or sawdust [60].
4. Conclusions
The results confirmed that rice husks can be used as a biofuel due to their suitable thermal characteristics and its low gas emission. However, its use is recommended in the same place where this by-product is generated, because of its low density. It would also be possible to use it more widely if a densification treatment were carried out (such as pelletizing) to increase its energy density. Also, the high amount of ash that was obtained should be considered, as this fact makes the use of this by-product in domestic boilers impossible. However, it is not an obstacle to be used in industrial equipments with higher power.
Rice husks showed energy activation values close to those found in similar by-products, hardly exceeding 200 kJ moL−1. The results showed that the average values obtained for each method (FWO, KAS, and Starink) were similar and followed the same pattern regarding the degree of conversion. Therefore, it can be assumed that these methods are valid for the calculation of thermal properties of biomass by-products such as rice husks.
Regarding the released gases in inert and oxidizing atmosphere, their levels were not problematic. The emission profiles were like those observed in other biomass by-products, with CH4 (for both atmospheres) and NH3 (for inert atmosphere) emissions being almost negligible. Finally, emissions of sulphur-based gases were not observed for any atmosphere studied.
Author Contributions
Conceptualization and methodology, J.I.A. and M.T.M., Investigation, J.I.A., M.T.M., I.M. and F.J.S.; Writing—original draft preparation, J.I.A. and M.T.M.; Writing—review and editing, J.I.A., M.T.M., I.M. and F.J.S.; Supervision, J.I.A. and M.T.M. All authors have read and agreed to the published version of the manuscript.
Funding
This research was funded by Junta de Extremadura for its support through the economic aid for research groups (GR18137), as well as for the support of research, development and innovation projects in the Extremadura Region (IB18083).
Institutional Review Board Statement
Not applicable.
Informed Consent Statement
Not applicable.
Data Availability Statement
Data available on request due to restrictions eg privacy or ethical. The data presented in this study are available on request from the corresponding author.
Conflicts of Interest
The authors declare no conflict of interest.
References
- Sepúlveda, F.J.; Arranz, J.I.; Miranda, M.T.; Montero, I.; Rojas, C.V. Drying and pelletizing analysis of waste from cork granulated industry. Energies 2018, 11, 109. [Google Scholar] [CrossRef] [Green Version]
- Catón, A. Production Data 2019/2020 Campaign. Agrifood Cooperatives of Spain. Available online: http://www.agro-alimentarias.coop/ficheros/doc/06097.pdf (accessed on 5 December 2020).
- Su, Y.; Liu, L.; Zhang, S.; Xu, D.; Du, H.; Cheng, Y.; Wang, Z.; Xiong, Y. A green route for pyrolysis poly-generation of typical high ash biomass, rice husk: Effects on simultaneous production of carbonic oxide-rich syngas, phenol-abundant bio-oil, high-adsorption porous carbon and amorphous silicon dioxide. Bioresour. Technol. 2020, 295, 122243. [Google Scholar] [CrossRef]
- Medina, D.; Palma, A.; Castro, H. Using of extracted biomass from rice by-products as thermal insulation. Actas Ing. 2016, 2, 39–45. [Google Scholar]
- Piñeros, Y.; Ángela, C.; Otálvaro, M.; Ana, A.; Campos, M.; Cortés, W.; Proaños, J.; Velasco, G.A.; Castro, Y.P. Aplicación de Tecnologías Para el Aprovechamiento de la Cascarilla de Arroz; Universidad Jorge Tadeo Lozano: Bogatá, Colombia, 2011. [Google Scholar]
- Kang, S.B.; Kim, J.J.; Choi, K.S.; Sim, B.S.; Oh, H.Y. Development of a test facility to evaluate performance of a domestic wood pellet boiler. Renew. Energy 2013, 54, 2–7. [Google Scholar] [CrossRef]
- Chokphoemphun, S.; Eiamsa-Ard, S.; Promvonge, P.; Chuwattanakul, V. Rice husk combustion characteristics in a rectangular fluidized-bed combustor with triple pairs of chevron-shaped discrete ribbed walls. Case Stud. Therm. Eng. 2019, 14, 100511. [Google Scholar] [CrossRef]
- Weng, W.; Costa, M.; Aldén, M.; Li, Z. Single particle ignition and combustion of pulverized pine wood, wheat straw, rice husk and grape pomace. Proc. Combust. Inst. 2019, 37, 2663–2671. [Google Scholar] [CrossRef]
- Fernandes, I.J.; Calheiro, D.; Kieling, A.G.; Moraes, C.A.M.; Rocha, T.L.A.C.; Brehm, F.A.; Modolo, R.C.E. Characterization of rice husk ash produced using different biomass combustion techniques for energy. Fuel 2016, 165, 351–359. [Google Scholar] [CrossRef]
- Vieira, F.R.; Romero Luna, C.M.; Arce, G.L.A.F.; Ávila, I. Optimization of slow pyrolysis process parameters using a fixed bed reactor for biochar yield from rice husk. Biomass Bioenergy 2020, 132. [Google Scholar] [CrossRef]
- Xu, S.; Hu, Y.; Wang, S.; He, Z.; Qian, L.; Feng, Y.; Sun, C.; Liu, X.; Wang, Q.; Hui, C.; et al. Investigation on the co-pyrolysis mechanism of seaweed and rice husk with multi-method comprehensive study. Renew. Energy 2019, 132, 266–277. [Google Scholar] [CrossRef]
- Huang, X.; Wu, J.; Wang, M.; Ma, X.; Jiang, E.; Hu, Z. Syngas production by chemical looping gasification of rice husk using Fe-based oxygen carrier. J. Energy Inst. 2019, 93, 1261–1270. [Google Scholar] [CrossRef]
- Susastriawan, A.A.P.; Saptoadi, H. Purnomo Comparison of the gasification performance in the downdraft fixed-bed gasifier fed by different feedstocks: Rice husk, sawdust, and their mixture. Sustain. Energy Technol. Assess. 2019, 34, 27–34. [Google Scholar] [CrossRef]
- Gao, X.; Xu, F.; Bao, F.; Tu, C.; Zhang, Y.; Wang, Y.; Yang, Y.; Li, B. Simulation and optimization of rice husk gasification using intrinsic reaction rate based CFD model. Renew. Energy 2019, 139, 611–620. [Google Scholar] [CrossRef]
- Statheropoulos, M.; Kyriakou, S.; Tzamtzis, N. Performance evaluation of a TG/MS system. Thermochim. Acta 1998, 322, 167–173. [Google Scholar] [CrossRef]
- White, J.E.; Catallo, W.J.; Legendre, B.L. Biomass pyrolysis kinetics: A comparative critical review with relevant agricultural residue case studies. J. Anal. Appl. Pyrolysis 2011, 91, 1–33. [Google Scholar] [CrossRef]
- Ozawa, T.A. New Method of Analyzing Thermogravimetric Data. Bull. Chem. Soc. Jpn. 1965, 38, 1881–1886. [Google Scholar] [CrossRef] [Green Version]
- Kissinger, H.E. Reaction Kinetics in Differential Thermal Analysis. Anal. Chem. 1957, 29, 1702–1706. [Google Scholar] [CrossRef]
- Akahira, T.; Sunose, T. Method of determining activation deterioration constant of electrical insulating materials. Res. Rep. Chiba Inst. Technol. (Sci. Technol.) 1971, 16, 22–31. [Google Scholar]
- Starink, M.J. A new method for the derivation of activation energies from experiments performed at constant heating rate. Thermochim. Acta 1996, 288, 97–104. [Google Scholar] [CrossRef]
- Devnani, G.L.; Sinha, S. Extraction, characterization and thermal degradation kinetics with activation energy of untreated and alkali treated Saccharum spontaneum (Kans grass) fiber. Compos. Part. B Eng. 2019, 166, 436–445. [Google Scholar] [CrossRef]
- Lei, Z.; Wang, S.; Fu, H.; Gao, W.; Wang, B.; Zeng, J.; Xu, J. Thermal pyrolysis characteristics and kinetics of hemicellulose isolated from Camellia Oleifera Shell. Bioresour. Technol. 2019, 282, 228–235. [Google Scholar] [CrossRef] [PubMed]
- Masawat, N.; Atong, D.; Sricharoenchaikul, V. Thermo-kinetics and product analysis of the catalytic pyrolysis of Pongamia residual cake. J. Environ. Manag. 2019, 242, 238–245. [Google Scholar] [CrossRef]
- Rony, A.H.; Kong, L.; Lu, W.; Dejam, M.; Adidharma, H.; Gasem, K.A.M.; Zheng, Y.; Norton, U.; Fan, M. Kinetics, thermodynamics, and physical characterization of corn stover (Zea mays) for solar biomass pyrolysis potential analysis. Bioresour. Technol. 2019, 284, 466–473. [Google Scholar] [CrossRef]
- Fernandez, A.; Mazza, G.; Rodriguez, R. Thermal decomposition under oxidative atmosphere of lignocellulosic wastes: Different kinetic methods application. J. Environ. Chem. Eng. 2018, 6, 404–415. [Google Scholar] [CrossRef]
- UNE-EN ISO 16948. Solid Biofuels—Determination of Total Content of Carbon, Hydrogen and Nitrogen; AENOR: Madrid, Spain, 2015. [Google Scholar]
- UNE-EN ISO 16994. Solid Biofuels—Determination of Total Content of Sulfur and Chlorine; AENOR: Madrid, Spain, 2017. [Google Scholar]
- UNE-EN ISO 18122. Solid Biofuels—Determination of Ash Content; AENOR: Madrid, Spain, 2016. [Google Scholar]
- UNE-EN ISO 18123. Solid Biofuels—Determination of the Content of Volatile Matter; AENOR: Madrid, Spain, 2016. [Google Scholar]
- UNE-EN ISO 18134-2. Solid Biofuels—Determination of Moisture Content—Oven dry Method—Part 2: Total Moisture—Simplified Method; AENOR: Madrid, Spain, 2017. [Google Scholar]
- UNE-EN ISO 14918. Solid Biofuels—Determination of Calorific Value; AENOR: Madrid, Spain, 2011. [Google Scholar]
- UNE-EN ISO 17828. Solid Biofuels—Determination of Bulk Density; AENOR: Madrid, Spain, 2016. [Google Scholar]
- Miller, R.S.; Bellan, J. A generalized biomass pyrolysis model based on superimposed cellulose, hemicellulose and lignin kinetics. Combust. Sci. Technol. 1997, 126, 97–137. [Google Scholar] [CrossRef]
- Shen, D.K.; Gu, S.; Luo, K.H.; Bridgwater, A.V.; Fang, M.X. Kinetic study on thermal decomposition of woods in oxidative environment. Fuel 2009, 88, 1024–1030. [Google Scholar] [CrossRef] [Green Version]
- Tang, T.; Chaudhri, M. Analysis of dynamic kinetic data from solid-state reactions. J. Therm. Anal. 1980, 18, 247–261. [Google Scholar] [CrossRef]
- Lyon, R.E. An integral method of nonisothermal kinetic analysis. Thermochim. Acta 1997, 297, 117–124. [Google Scholar] [CrossRef]
- Chen, C.; Qu, B.; Wang, W.; Wang, W.; Ji, G.; Li, A. Rice husk and rice straw torrefaction: Properties and pyrolysis kinetics of raw and torrefied biomass. Environ. Technol. Innov. 2021, 24, 101872. [Google Scholar] [CrossRef]
- Wang, T.; Hou, H.; Ye, Y.; Rong, H.; Li, J.; Xue, Y. Combustion behavior of refuse-derived fuel produced from sewage sludge and rice husk/wood sawdust using thermogravimetric and mass spectrometric analyses. J. Clean. Prod. 2019, 222, 1–11. [Google Scholar] [CrossRef]
- Lopes Grotto, C.G.; Gomes Colares, C.J.; Rodrigues Lima, D.; Henrique Pereira, D.; Teixeira do Vale, A. Energy potential of biomass from two types of genetically improved rice husks in Brazil: A theoretical-experimental study. Biomass Bioenergy 2020, 142, 105816. [Google Scholar] [CrossRef]
- Worasuwannarak, N.; Sonobe, T.; Tanthapanichakoon, W. Pyrolysis behaviors of rice straw, rice husk, and corncob by TG-MS technique. J. Anal. Appl. Pyrolysis 2007, 78, 265–271. [Google Scholar] [CrossRef]
- Chen, D.; Chen, F.; Cen, K.; Cao, X.; Zhang, J.; Zhou, J. Upgrading rice husk via oxidative torrefaction: Characterization of solid, liquid, gaseous products and a comparison with non-oxidative torrefaction. Fuel 2020, 275, 117936. [Google Scholar] [CrossRef]
- Mohamed, M.G.; Chen, T.C.; Kuo, S.W. Solid-state chemical transformations to enhance gas capture in benzoxazine-linked conjugated microporous polymers. Macromolecules 2021, 54, 5866–5877. [Google Scholar] [CrossRef]
- Janse, A.M.C.; De Jonge, H.G.; Prins, W.; Van Swaaij, W.P.M. Combustion kinetics of char obtained by flash pyrolysis of pine wood. Ind. Eng. Chem. Res. 1998, 37, 3909–3918. [Google Scholar] [CrossRef] [Green Version]
- Hu, M.; Chen, Z.; Guo, D.; Liu, C.; Xiao, B.; Hu, Z.; Liu, S. Thermogravimetric study on pyrolysis kinetics of Chlorella pyrenoidosa and bloom-forming cyanobacteria. Bioresour. Technol. 2015, 177, 41–50. [Google Scholar] [CrossRef]
- Valverde, A.; Sarria, B.; Monteagudo, J.P. Comparative analysis of the Fhysicochimicals Characteristics of the rice husk. Sci. Tech. 2007, 37, 255–260. [Google Scholar] [CrossRef]
- Özsin, G.; Pütün, A.E. Kinetics and evolved gas analysis for pyrolysis of food processing wastes using TGA/MS/FT-IR. Waste Manag. 2017, 64, 315–326. [Google Scholar] [CrossRef]
- Ma, Z.; Chen, D.; Gu, J.; Bao, B.; Zhang, Q. Determination of pyrolysis characteristics and kinetics of palm kernel shell using TGA-FTIR and model-free integral methods. Energy Convers. Manag. 2015, 89, 251–259. [Google Scholar] [CrossRef]
- Gai, C.; Dong, Y.; Zhang, T. The kinetic analysis of the pyrolysis of agricultural residue under non-isothermal conditions. Bioresour. Technol. 2013, 127, 298–305. [Google Scholar] [CrossRef] [PubMed]
- Jia, C.; Chen, J.; Liang, J.; Song, S.; Liu, K.; Jiang, A.; Wang, Q. Pyrolysis characteristics and kinetic analysis of rice husk. J. Therm. Anal. Calorim. 2020, 139, 577–587. [Google Scholar] [CrossRef]
- Özveren, U.; Özdoǧan, Z.S. Investigation of the slow pyrolysis kinetics of olive oil pomace using thermo-gravimetric analysis coupled with mass spectrometry. Biomass Bioenergy 2013, 58, 168–179. [Google Scholar] [CrossRef]
- Brachi, P.; Miccio, F.; Miccio, M.; Ruoppolo, G. Isoconversional kinetic analysis of olive pomace decomposition under torrefaction operating conditions. Fuel Process. Technol. 2015, 130, 147–154. [Google Scholar] [CrossRef]
- Miranda, T.; Román, S.; Montero, I.; Nogales-Delgado, S.; Arranz, J.I.; Rojas, C.V.; González, J.F. Study of the emissions and kinetic parameters during combustion of grape pomace: Dilution as an effective way to reduce pollution. Fuel Process. Technol. 2012, 103, 160–165. [Google Scholar] [CrossRef]
- Fermoso, J.; Mašek, O. Thermochemical decomposition of coffee ground residues by TG-MS: A kinetic study. J. Anal. Appl. Pyrolysis 2018, 130, 249–255. [Google Scholar] [CrossRef] [Green Version]
- Huang, J.; Liu, J.; Chen, J.; Xie, W.; Kuo, J.; Lu, X.; Chang, K.; Wen, S.; Sun, G.; Cai, H.; et al. Combustion behaviors of spent mushroom substrate using TG-MS and TG-FTIR: Thermal conversion, kinetic, thermodynamic and emission analyses. Bioresour. Technol. 2018, 266, 389–397. [Google Scholar] [CrossRef]
- Khiari, B.; Moussaoui, M.; Jeguirim, M. Tomato-processing by-product combustion: Thermal and kinetic analyses. Materials 2019, 12, 553. [Google Scholar] [CrossRef] [Green Version]
- Otero, M.; Sánchez, M.E.; Gómez, X. Co-firing of coal and manure biomass: A TG-MS approach. Bioresour. Technol. 2011, 102, 8304–8309. [Google Scholar] [CrossRef]
- Huang, L.; Xie, C.; Liu, J.; Zhang, X.; Chang, K.L.; Kuo, J.; Sun, J.; Xie, W.; Zheng, L.; Sun, S.; et al. Influence of catalysts on co-combustion of sewage sludge and water hyacinth blends as determined by TG-MS analysis. Bioresour. Technol. 2018, 247, 217–225. [Google Scholar] [CrossRef]
- Sfakiotakis, S.; Vamvuka, D. Study of co-pyrolysis of olive kernel with waste biomass using TGA/DTG/MS. Thermochim. Acta 2018, 670, 44–54. [Google Scholar] [CrossRef]
- Yang, J.; Chen, H.; Zhao, W.; Zhou, J. TG-FTIR-MS study of pyrolysis products evolving from peat. J. Anal. Appl. Pyrolysis 2016, 117, 296–309. [Google Scholar] [CrossRef]
- Salema, A.A.; Ting, R.M.W.; Shang, Y.K. Pyrolysis of blend (oil palm biomass and sawdust) biomass using TG-MS. Bioresour. Technol. 2019, 274, 439–446. [Google Scholar] [CrossRef] [PubMed]
Figure 1.
TG curves for the heating rates studied under oxidative atmosphere.

Figure 2.
TG curves for the heating rates studied under inert atmosphere.

Figure 3.
DTG curves for the heating rates studied under oxidative atmosphere.

Figure 4.
DTG curves for the heating rates studied under inert atmosphere.

Figure 5.
FWO, KAS, and Starink plots for the values of conversion degree.


Figure 6.
Activation energy obtained by FWO, KAS, and Starink methods, at different conversion rates.
Figure 6.
Activation energy obtained by FWO, KAS, and Starink methods, at different conversion rates.

Figure 7.
CO2 and CH4 emissions (oxidizing atmosphere).

Figure 8.
NO2 and NH3 emissions (oxidizing atmosphere).

Figure 9.
SO2 and H2S emissions (oxidizing atmosphere).

Figure 10.
CO2 and CH4 emissions (inert atmosphere).

Figure 11.
NO2 and NH3 emissions (inert atmosphere).

Figure 12.
SO2 and H2S emissions (inert atmosphere).


Table 1.
Test carried out for characterization.
| % C, H and N | UNE-EN ISO 16948 [26] |
| % S | UNE-EN ISO 16994 [27] |
| % Ash | UNE-EN ISO 18122 [28] |
| % Volatile Matter | UNE-EN ISO 18123 [29] |
| % Moisture content | UNE-EN ISO 18134-2 [30] |
| Heating value | UNE-EN ISO 14918 [31] |
| Bulk density | UNE-EN ISO 17828 [32] |
Table 2.
Characterization for Rice Husk.
| Ultimate Analysis | Value |
| C (%) (db) | 40.8 ± 0.03 |
| H (%) (db) | 5.99 ± 0.21 |
| N (%) (db) | 0.5 ± 0.02 |
| S (%) (db) | 0.064 ± 0.004 |
| Proximate Analysis | Value |
| Ash (%) (db) | 9.68 ± 0.11 |
| Volatile matter (%) (db) | 80.66 ± 0.58 |
| Fixed carbon (%) (db) | 9.66 |
| Moisture (%) (wb) | 9.72 ± 0.002 |
| HHV (MJ kg−1) (db) | 18.14 ± 0.04 |
| Bulk density (kg m−3) (wb) | 122.76 ± 1.48 |
db, dry basis; wb, wet basis.
Table 3.
Thermal Decomposition Parameters.
| Heating Rate | 5 | 10 | 20 | 30 | 40 |
|---|---|---|---|---|---|
| Oxidative atmosphere | |||||
| Ti (°C) | 207 | 212 | 225 | 228 | 238 |
| Tp (°C) | 303 | 312 | 320 | 324 | 326 |
| Tpo (°C) | 413 | 418 | 420 | 423 | 438 |
| Tf (°C) | 442 | 458 | 479 | 491 | 506 |
| DTGmax (°C min−1) | 5.66 | 13.43 | 26.65 | 36.47 | 47.49 |
| Inert atmosphere | |||||
| Ti (°C) | 177 | 185 | 197 | 209 | 217 |
| Tp1 (°C) | - | - | 309 | 317 | 321 |
| Tp2 (°C) | 327 | 338 | 348 | 355 | 357 |
| Tf (°C) | 372 | 391 | 399 | 403 | 408 |
| DTGmax (°C min−1) | 3.84 | 7.18 | 12.32 | 18.39 | 25.05 |
Where Ti is the initial temperature; Tp is the main peak temperature in oxidative atmosphere; Tpo is the temperature of the second peak (only in oxidizing atmosphere), Tp1 is the temperature of the first peak; Tp2 is the temperature of the second peak (inert atmosphere); Tf is the final temperature of the thermal degradation; and DTGmax is the value of the derivative of the weight loss at Tp (oxidizing atmosphere) and at Tp2 or Tp1, in the case of 40 °C min−1, for the inert atmosphere.
Table 4.
Activation Energy and R2 Values at Different Conversion Degrees.
| Conversion Value | FWO Method | KAS Method | Starink Method | |||
|---|---|---|---|---|---|---|
| α | Ea | R2 | Ea | R2 | Ea | R2 |
| 0.1 | 193.87 | 0.990 | 194.90 | 0.989 | 195.08 | 0.989 |
| 0.2 | 190.53 | 0.996 | 191.12 | 0.995 | 191.35 | 0.995 |
| 0.3 | 198.09 | 0.996 | 198.89 | 0.995 | 199.10 | 0.995 |
| 0.4 | 210.00 | 0.991 | 211.26 | 0.990 | 211.44 | 0.990 |
| 0.5 | 223.67 | 0.992 | 225.48 | 0.992 | 225.63 | 0.992 |
| 0.6 | 214.84 | 0.994 | 216.04 | 0.993 | 216.24 | 0.994 |
| 0.7 | 212.43 | 0.998 | 213.35 | 0.998 | 213.57 | 0.998 |
| 0.8 | 201.66 | 0.998 | 201.88 | 0.997 | 202.16 | 0.997 |
| Avg. | 205.64 | 0.994 | 206.61 | 0.994 | 206.82 | 0.994 |
Publisher’s Note: MDPI stays neutral with regard to jurisdictional claims in published maps and institutional affiliations. |
© 2021 by the authors. Licensee MDPI, Basel, Switzerland. This article is an open access article distributed under the terms and conditions of the Creative Commons Attribution (CC BY) license (https://creativecommons.org/licenses/by/4.0/).
Share and Cite
MDPI and ACS Style
Arranz, J.I.; Miranda, M.T.; Montero, I.; Sepúlveda, F.J. Thermal Study and Emission Characteristics of Rice Husk Using TG-MS. Materials 2021, 14, 6203. https://0-doi-org.brum.beds.ac.uk/10.3390/ma14206203
AMA Style
Arranz JI, Miranda MT, Montero I, Sepúlveda FJ. Thermal Study and Emission Characteristics of Rice Husk Using TG-MS. Materials. 2021; 14(20):6203. https://0-doi-org.brum.beds.ac.uk/10.3390/ma14206203
Chicago/Turabian StyleArranz, José Ignacio, María Teresa Miranda, Irene Montero, and Francisco José Sepúlveda. 2021. "Thermal Study and Emission Characteristics of Rice Husk Using TG-MS" Materials 14, no. 20: 6203. https://0-doi-org.brum.beds.ac.uk/10.3390/ma14206203
Note that from the first issue of 2016, this journal uses article numbers instead of page numbers. See further details here.