
The Influence of Physical Properties and Increasing Woven Fabric Layers on the Noise Absorption Capacity


Abstract
:1. Introduction
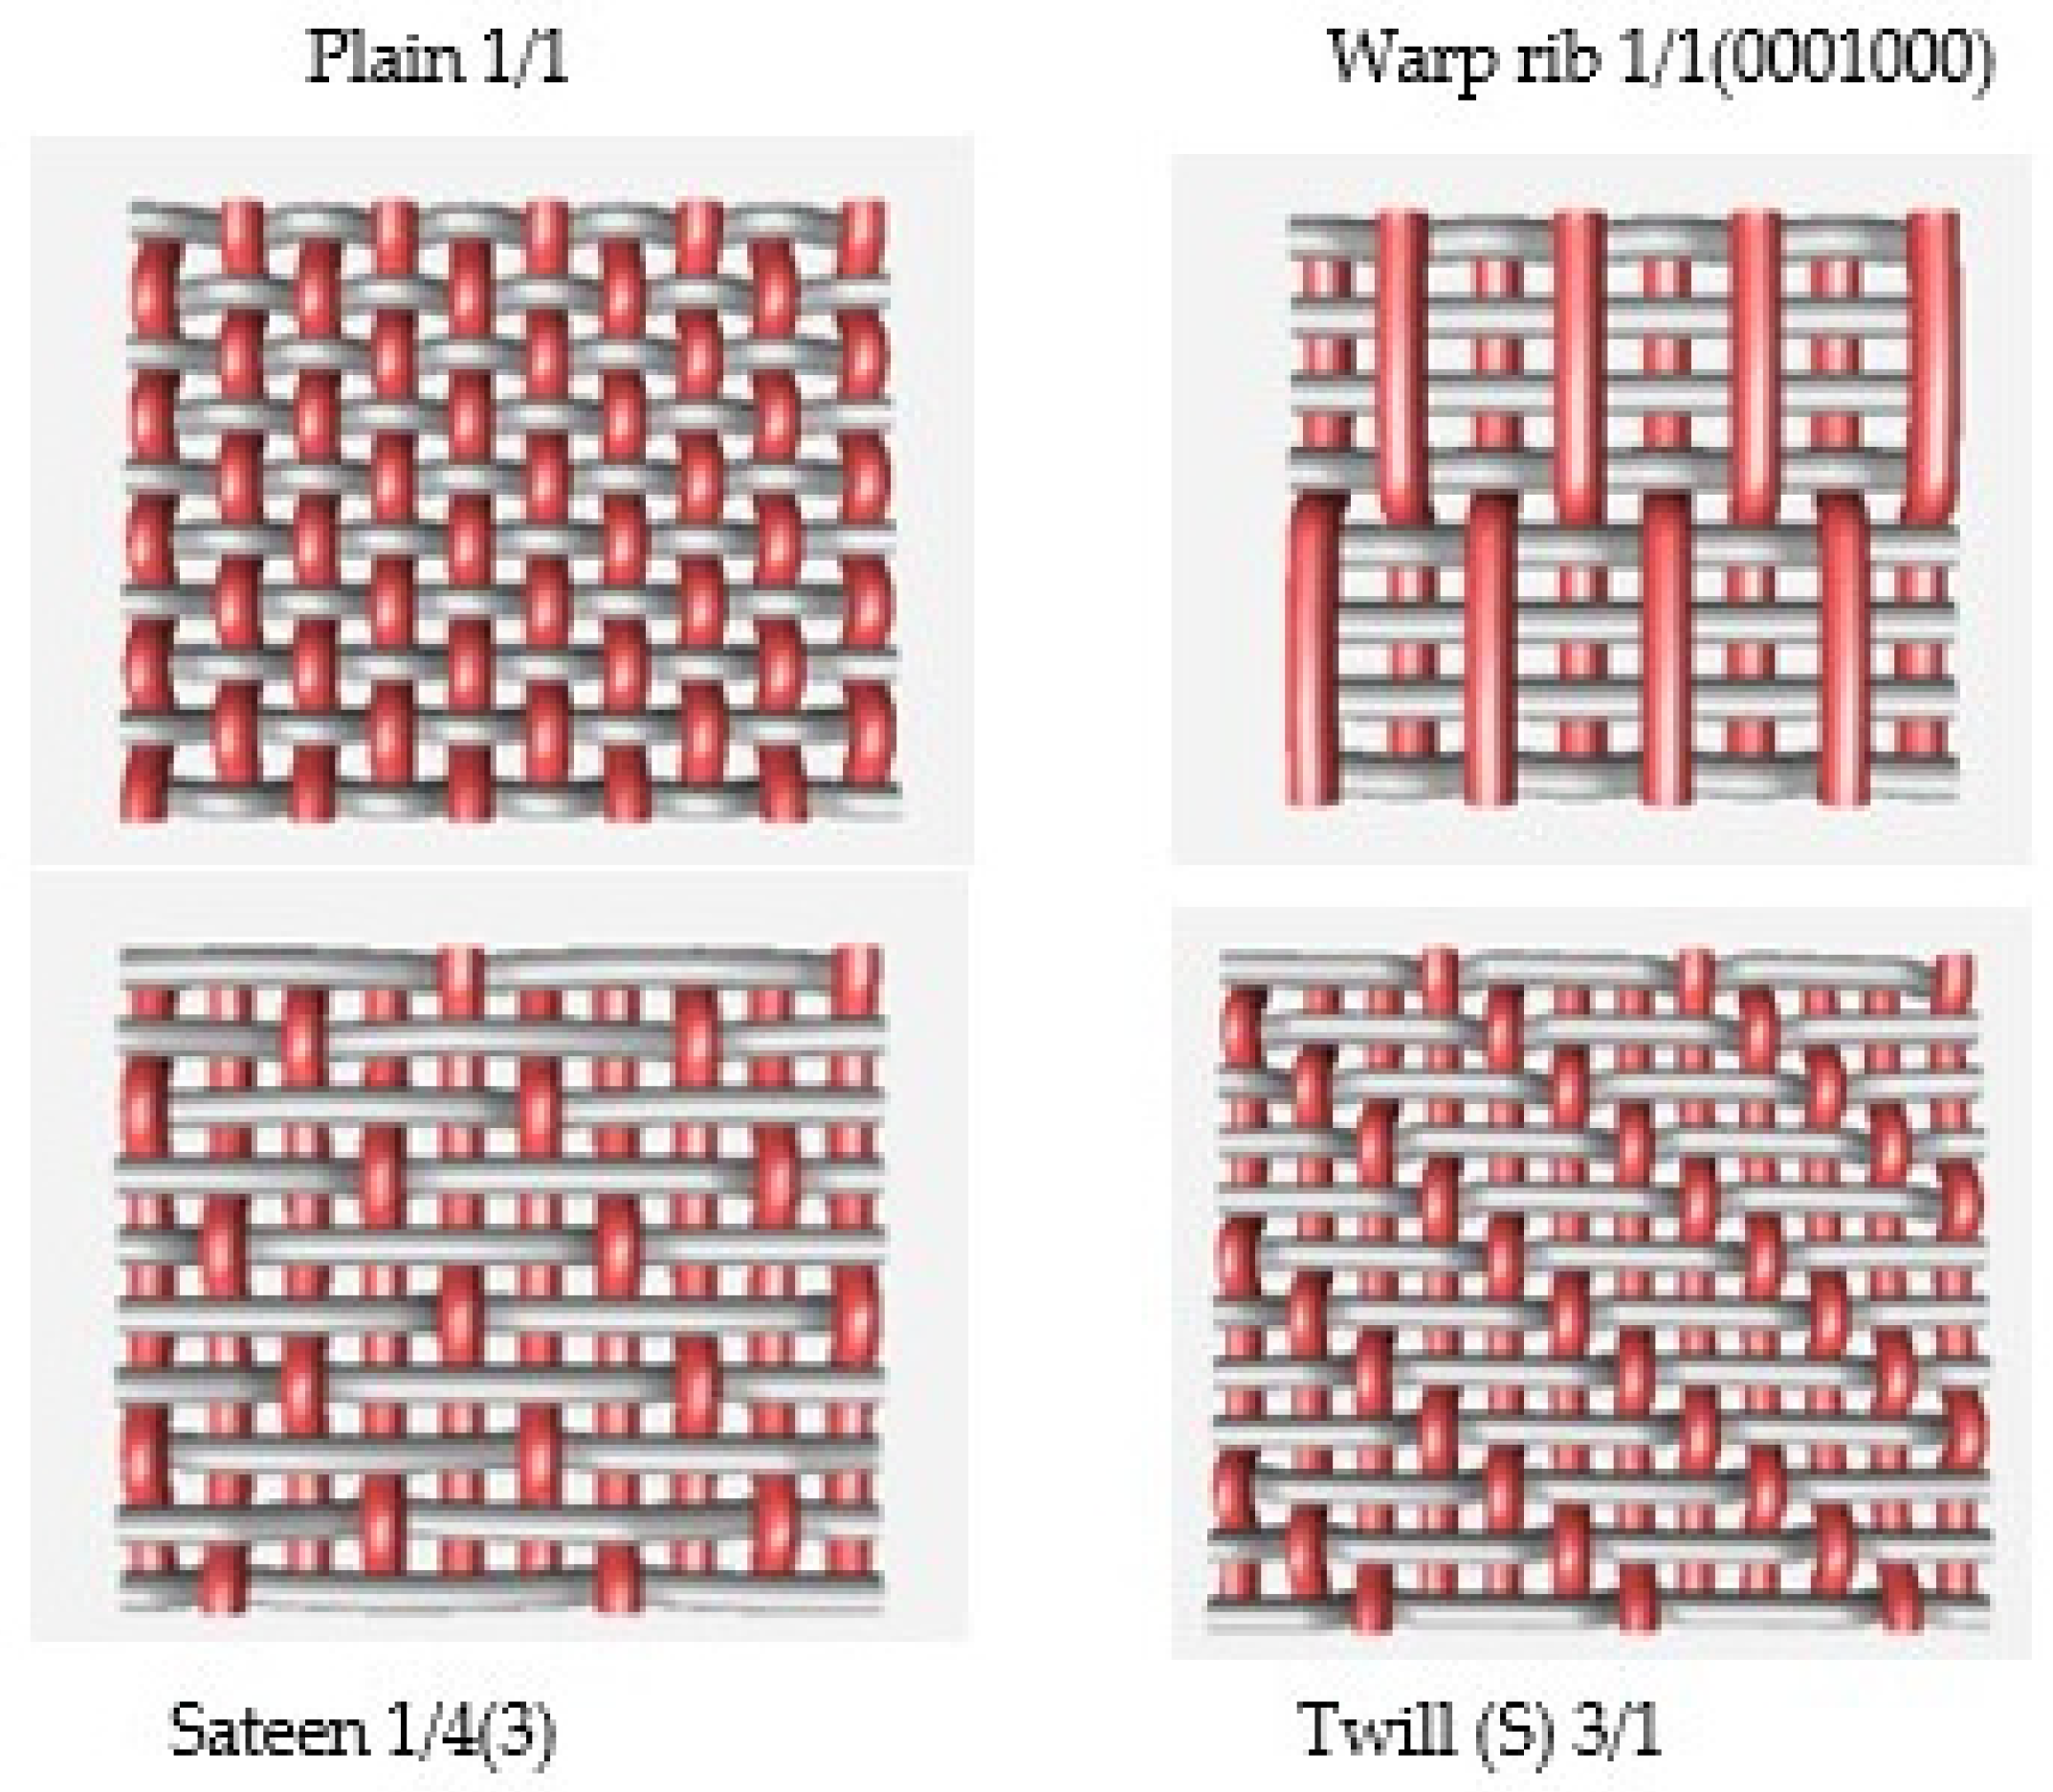
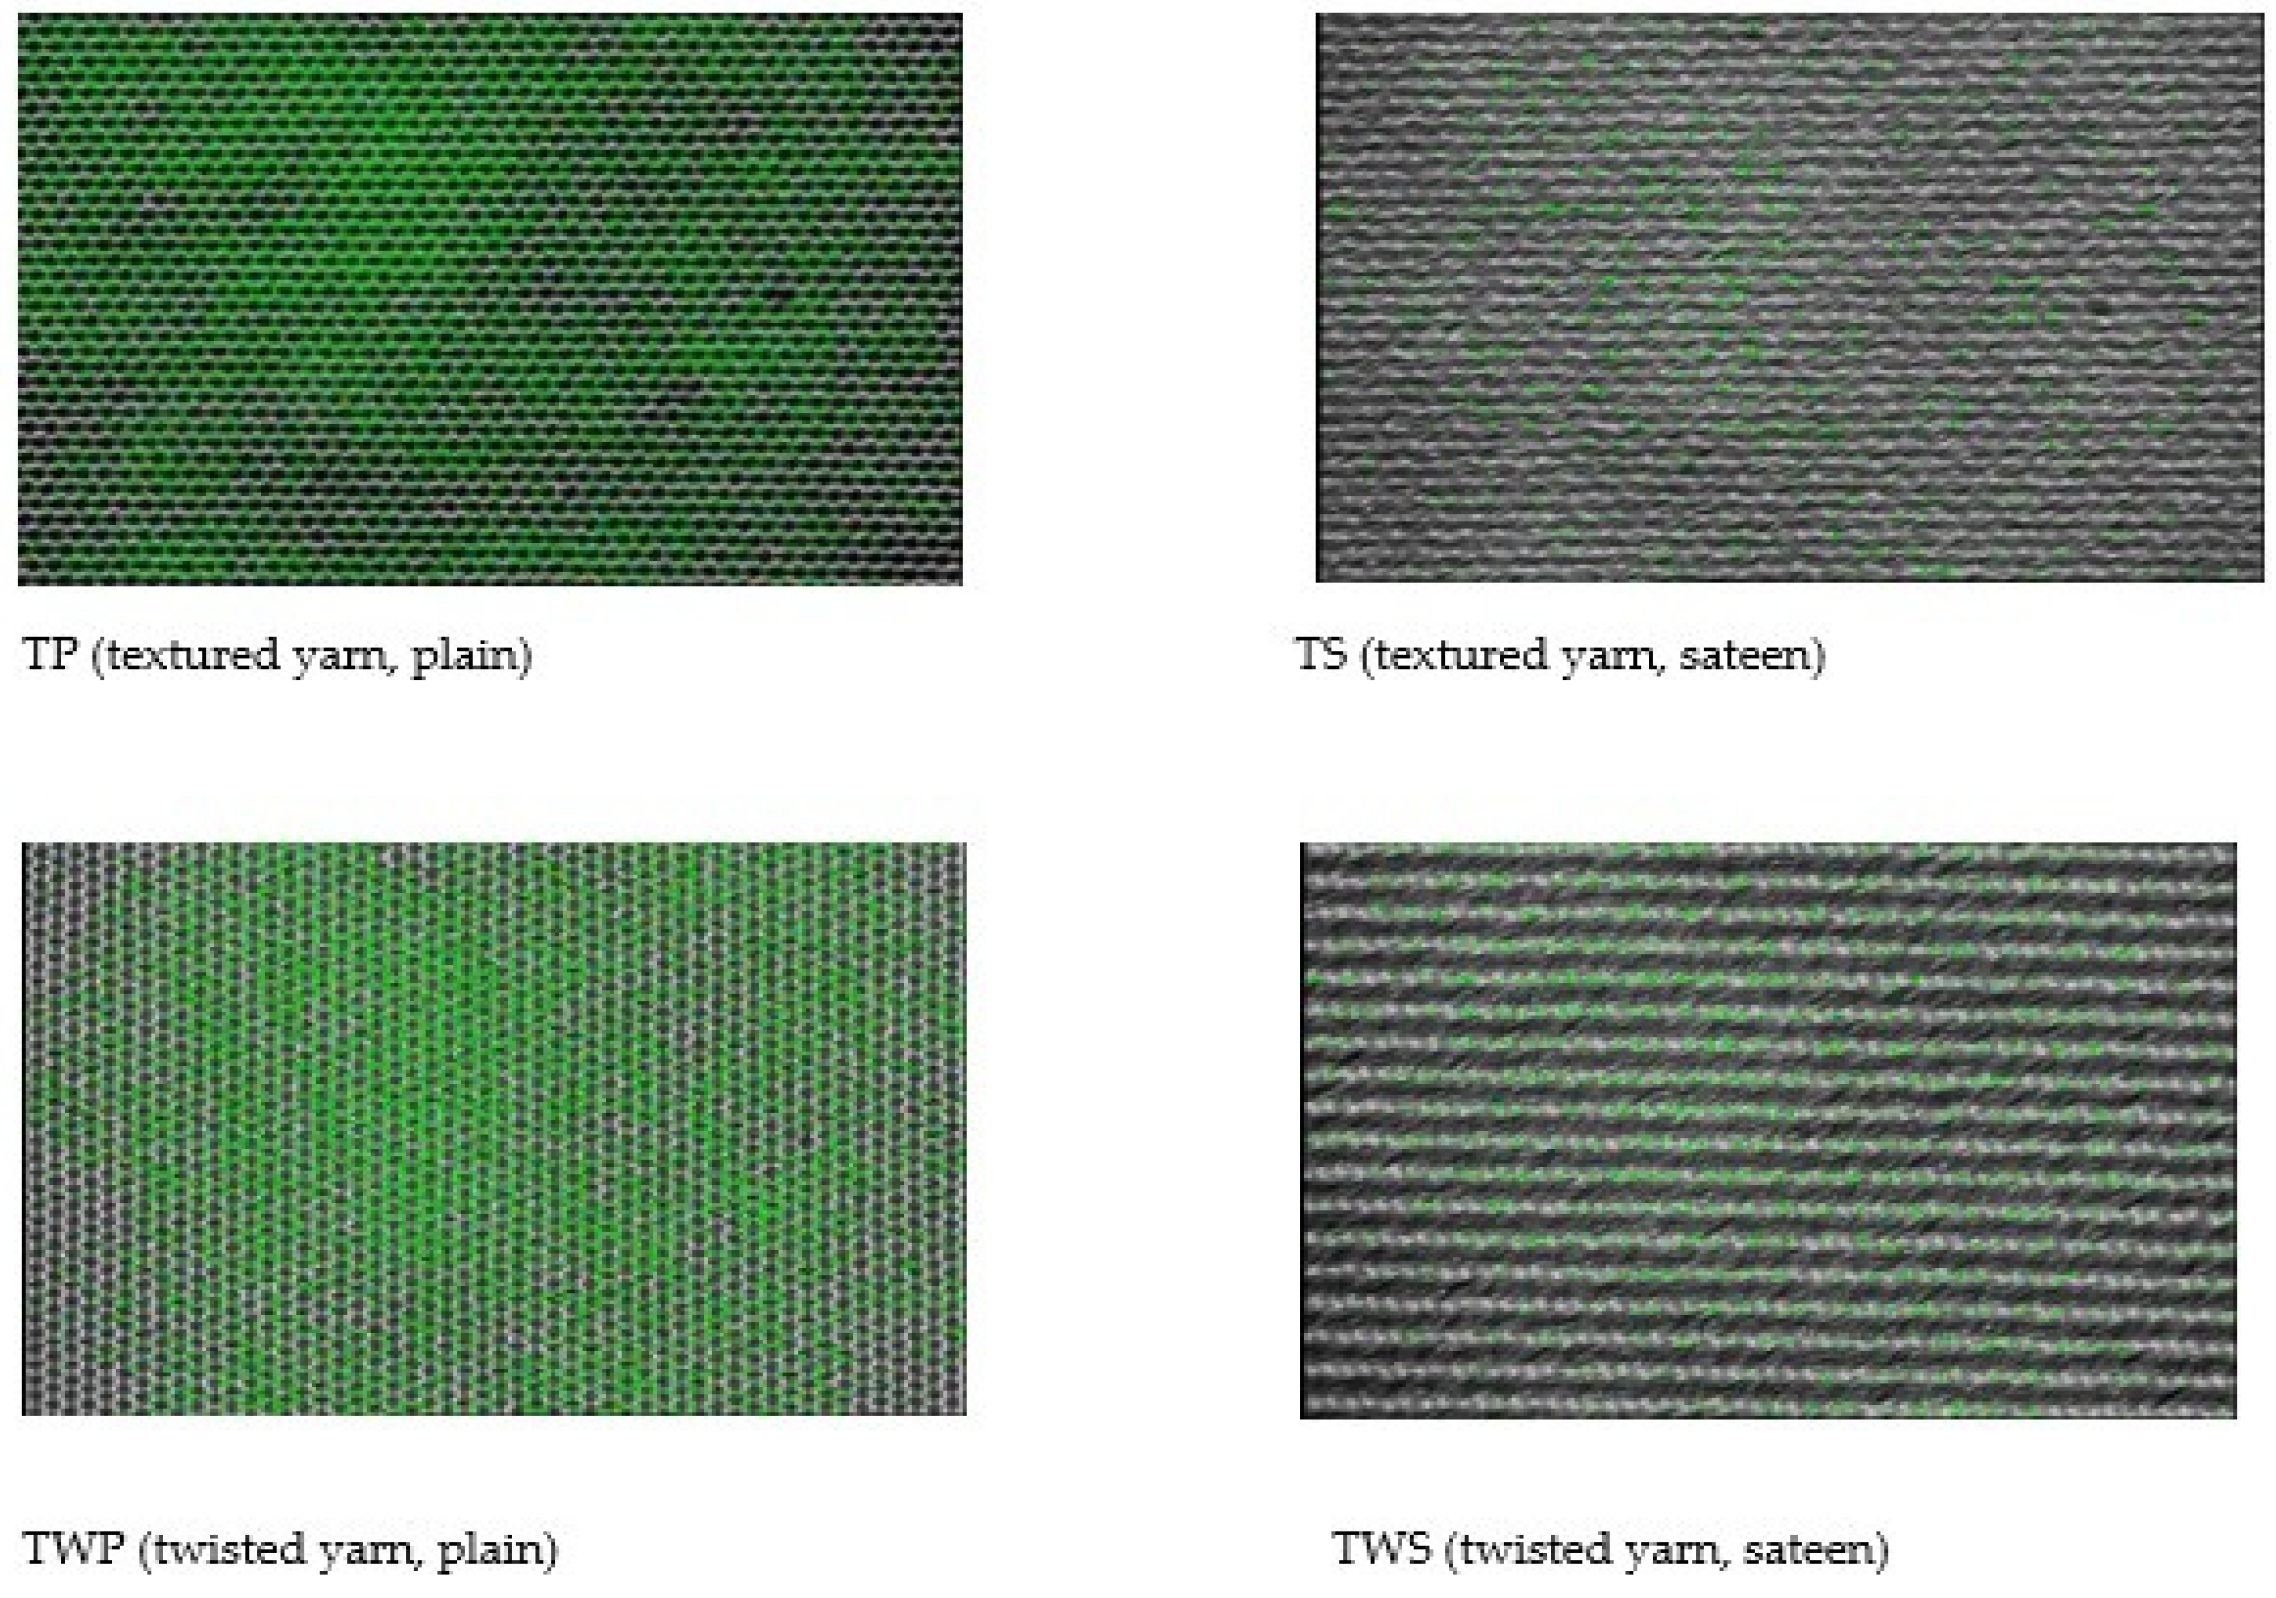
2. Material
3. Methods
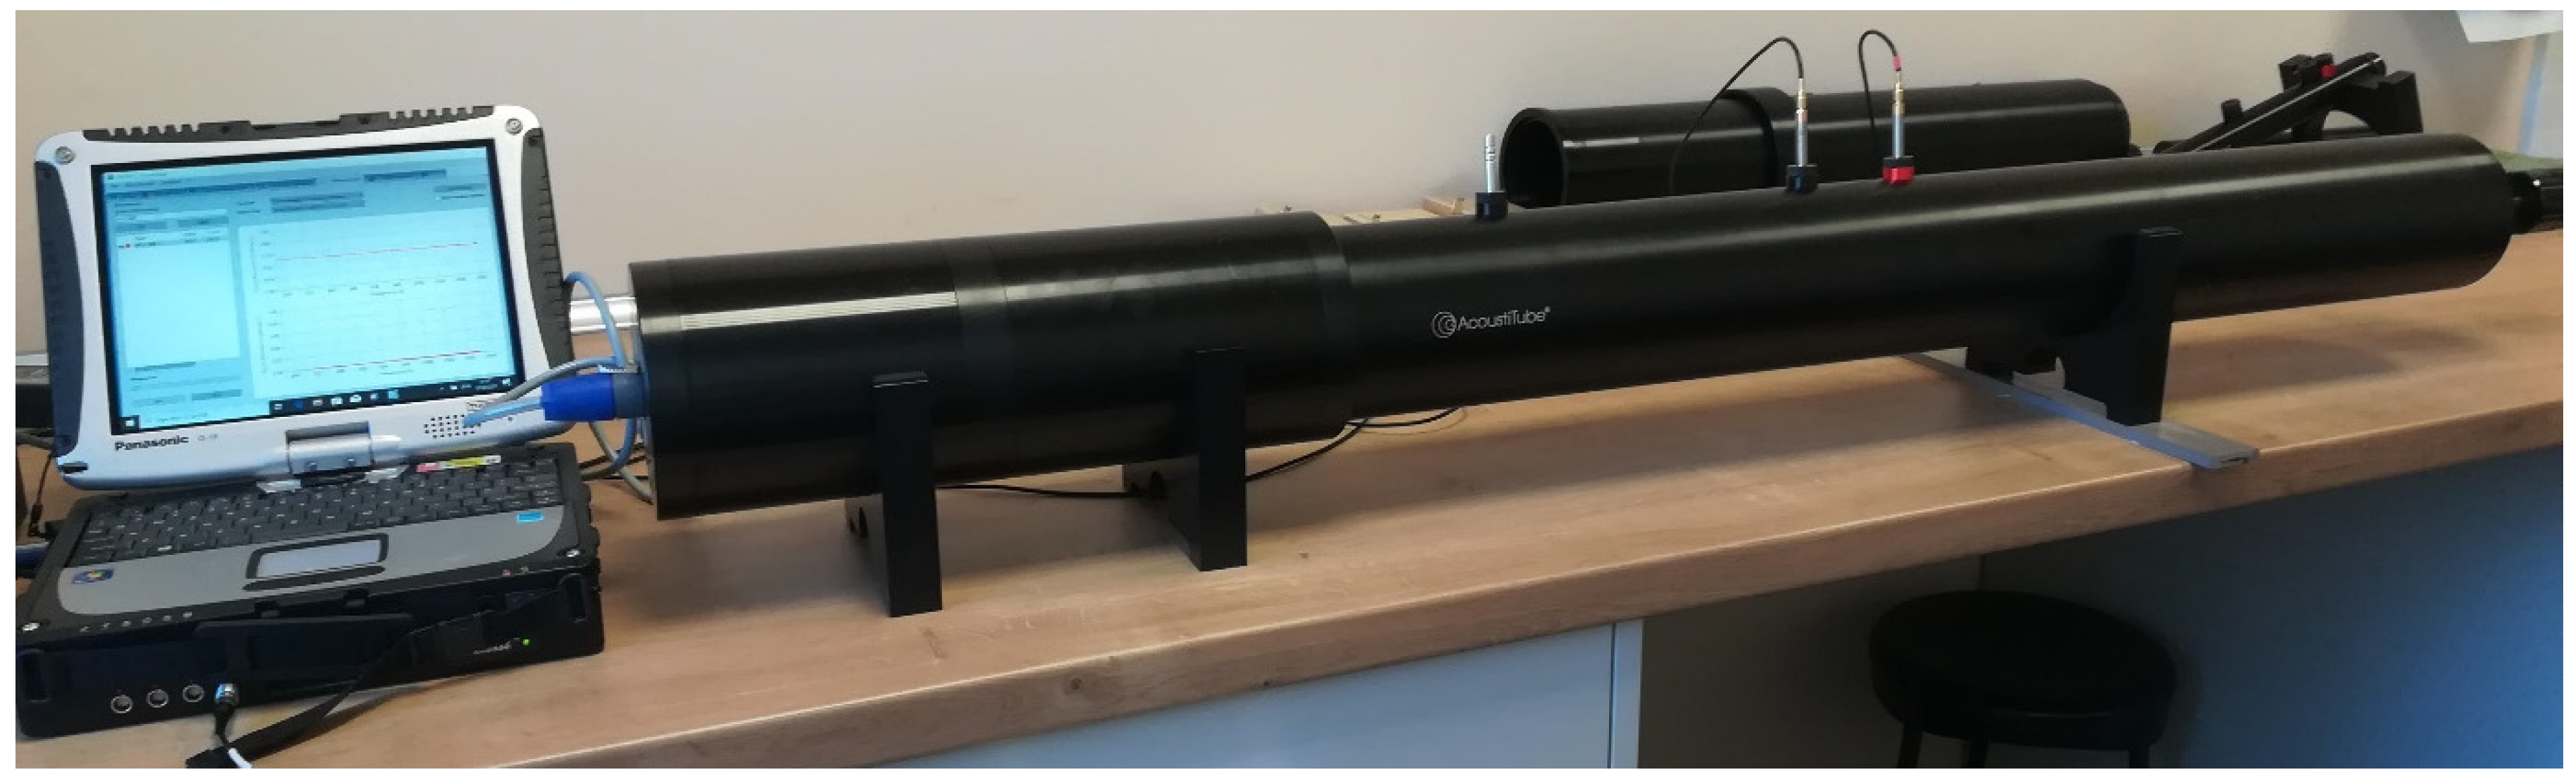
3.1. Acoustic Test
3.2. The Percentage Number of Yarn in the Fabric (Volume Porosity)
- h—Fabric thickness [m],
- Mp—Mass per unit area [kg/m2],
- Q—Raw material (polymer) density [kg/m3] for polyester, 1.38 g/cm3 = 1380 kg/m3.
3.3. Measurement of Surface Roughness Test
3.4. Porosity Test
4. Results and Discussion
4.1. Noise Reduction Properties Comparison
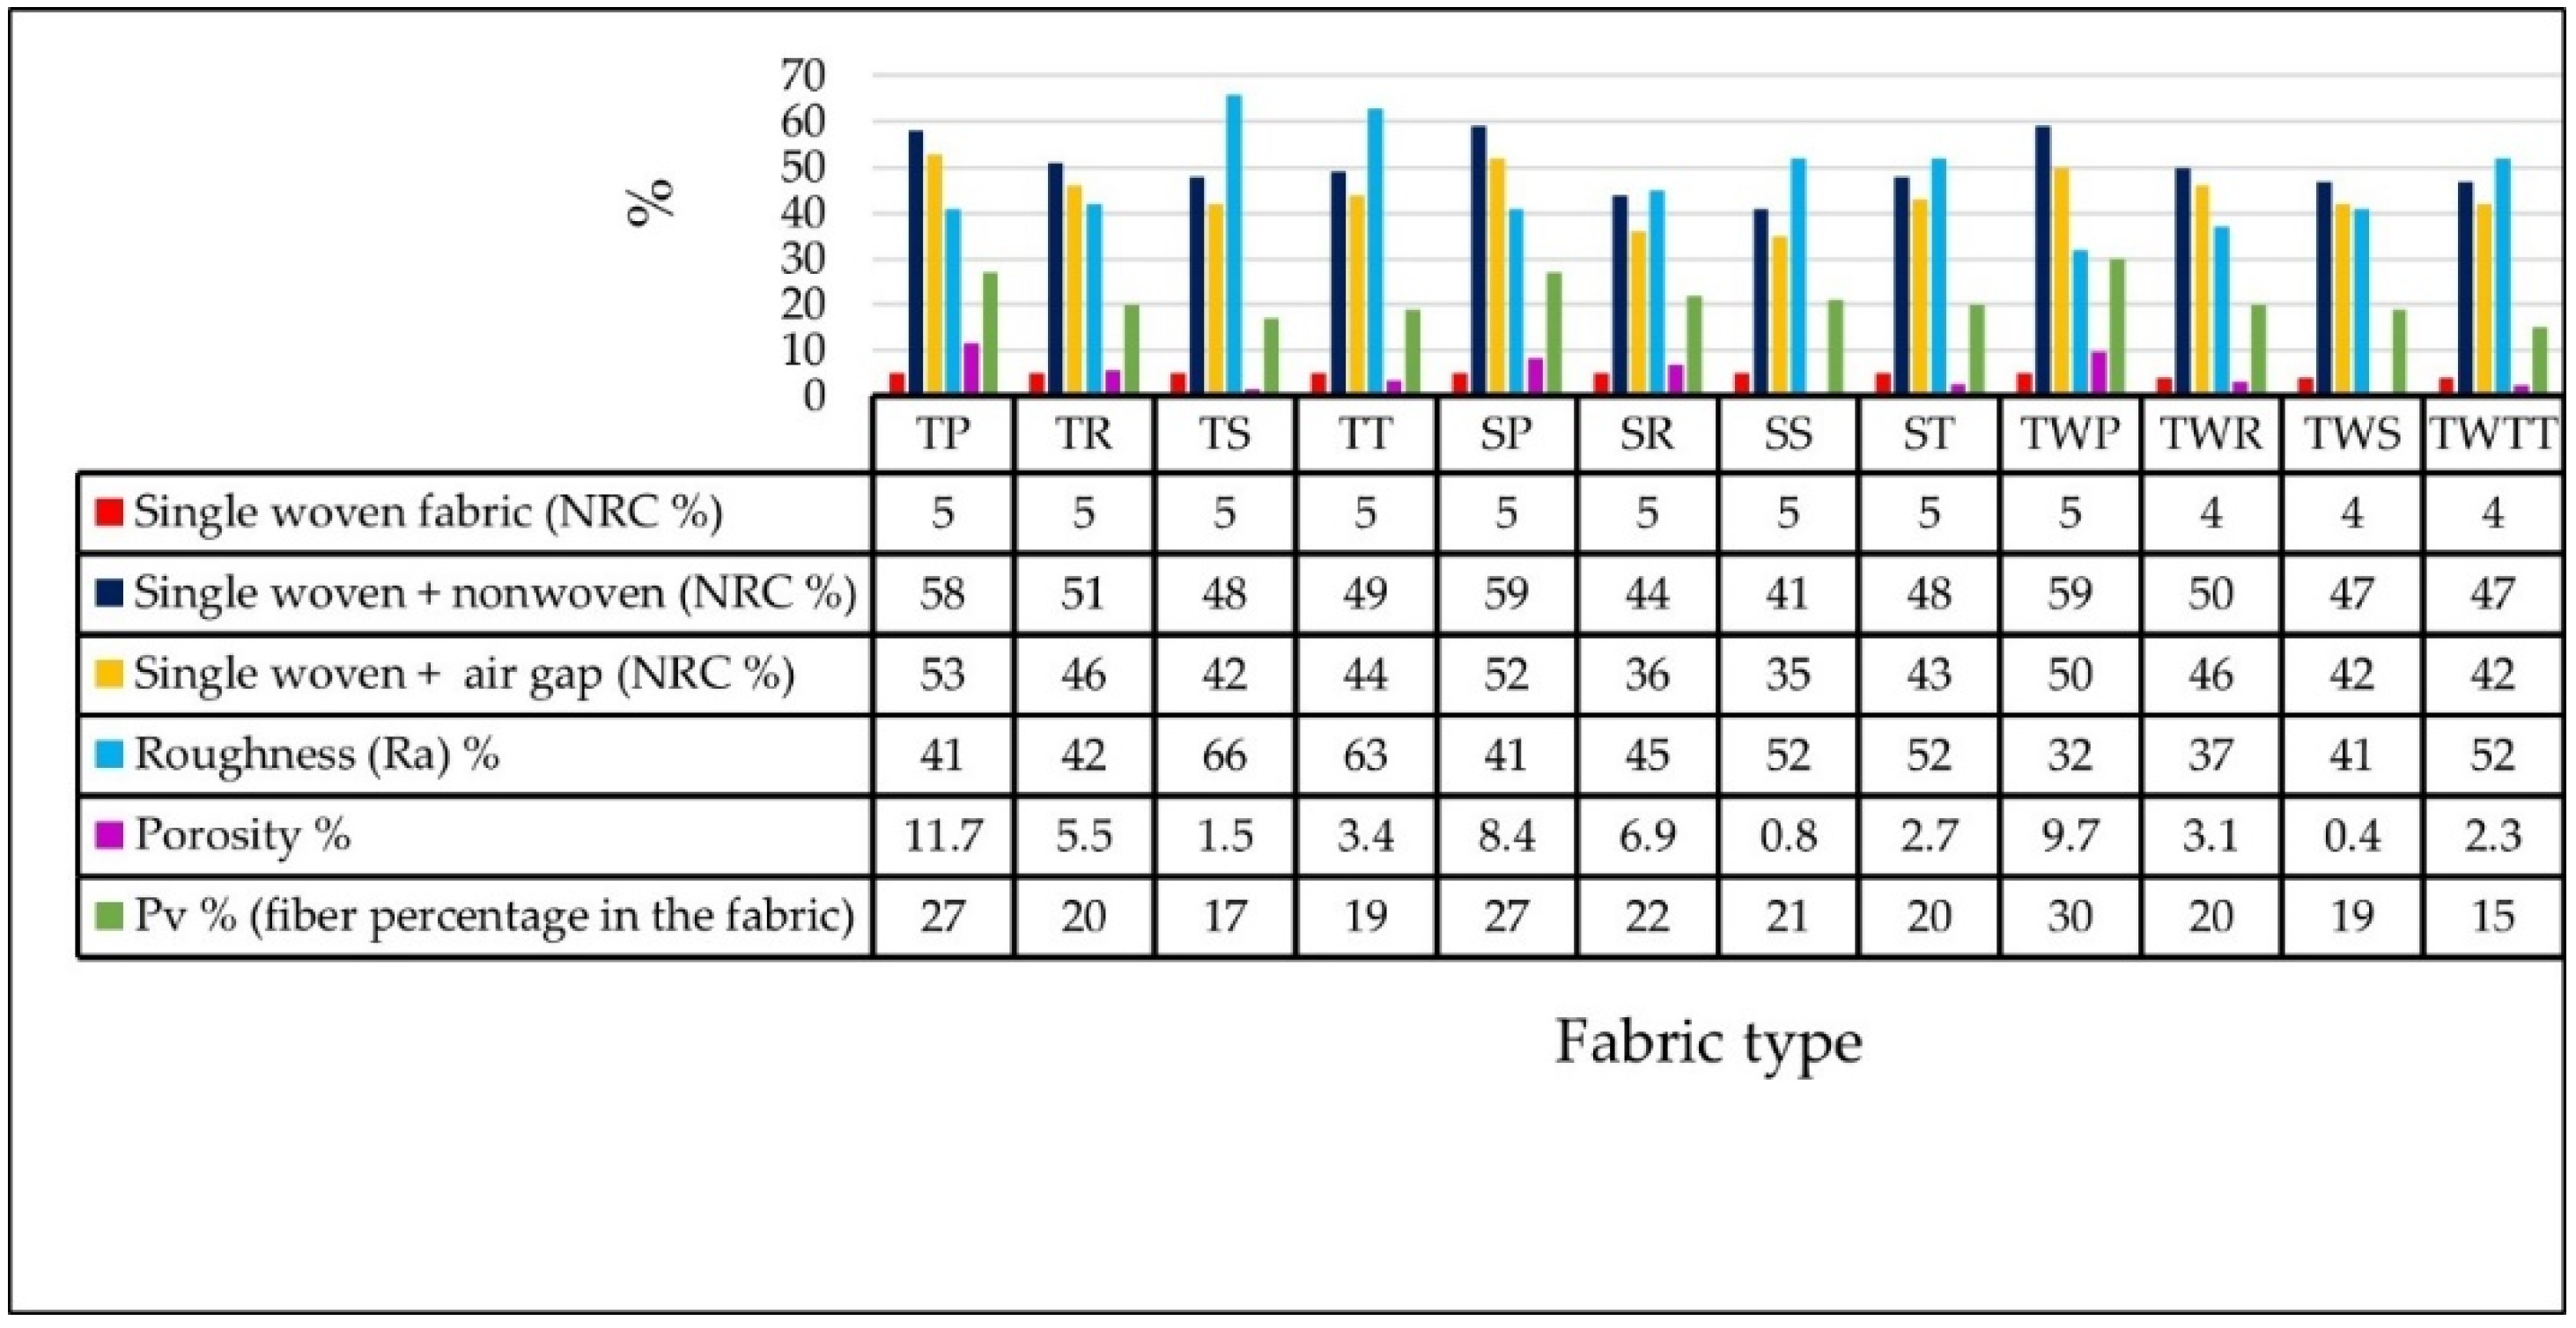
4.2. The Relationship between Physical Fabric Characteristics and Noise Reduction Coefficient of the Fabrics
4.3. Roughness Result
4.4. Percentage of PES Fiber Volume (Pv%)
4.5. Porosity Test Results
4.6. The Acoustic Results, Based on the Range of Frequencies
5. Summary and Conclusions
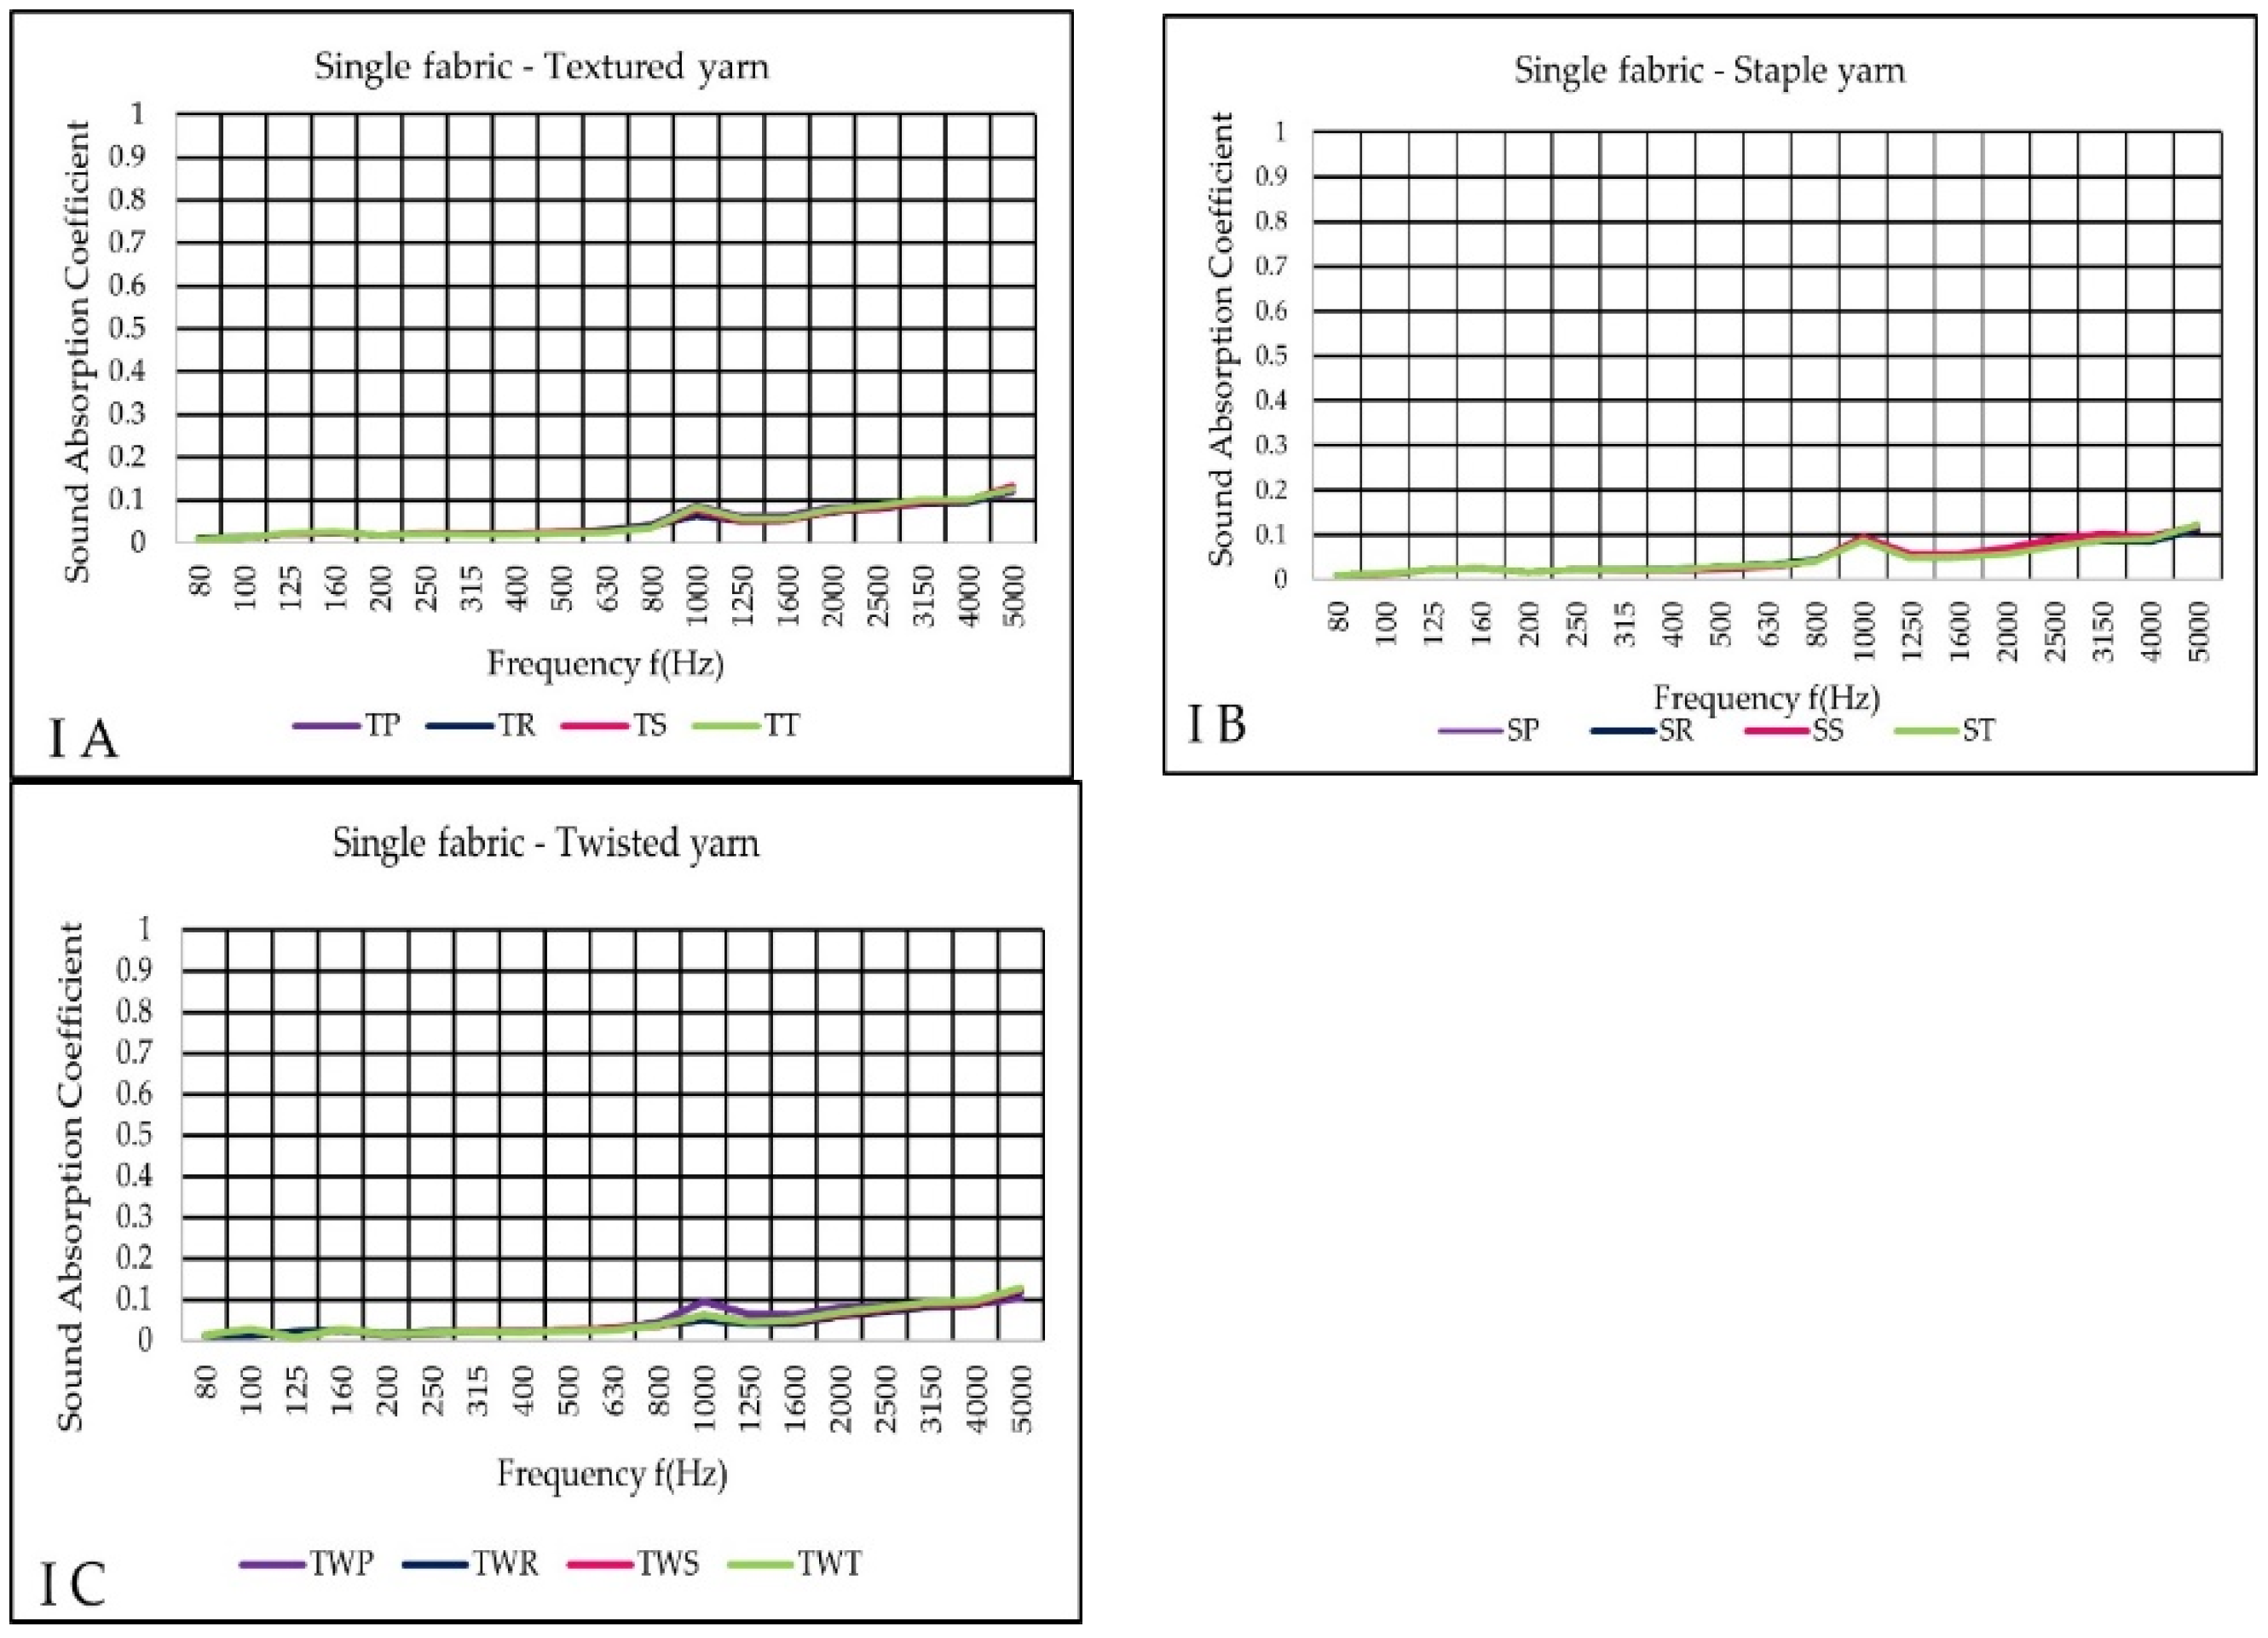
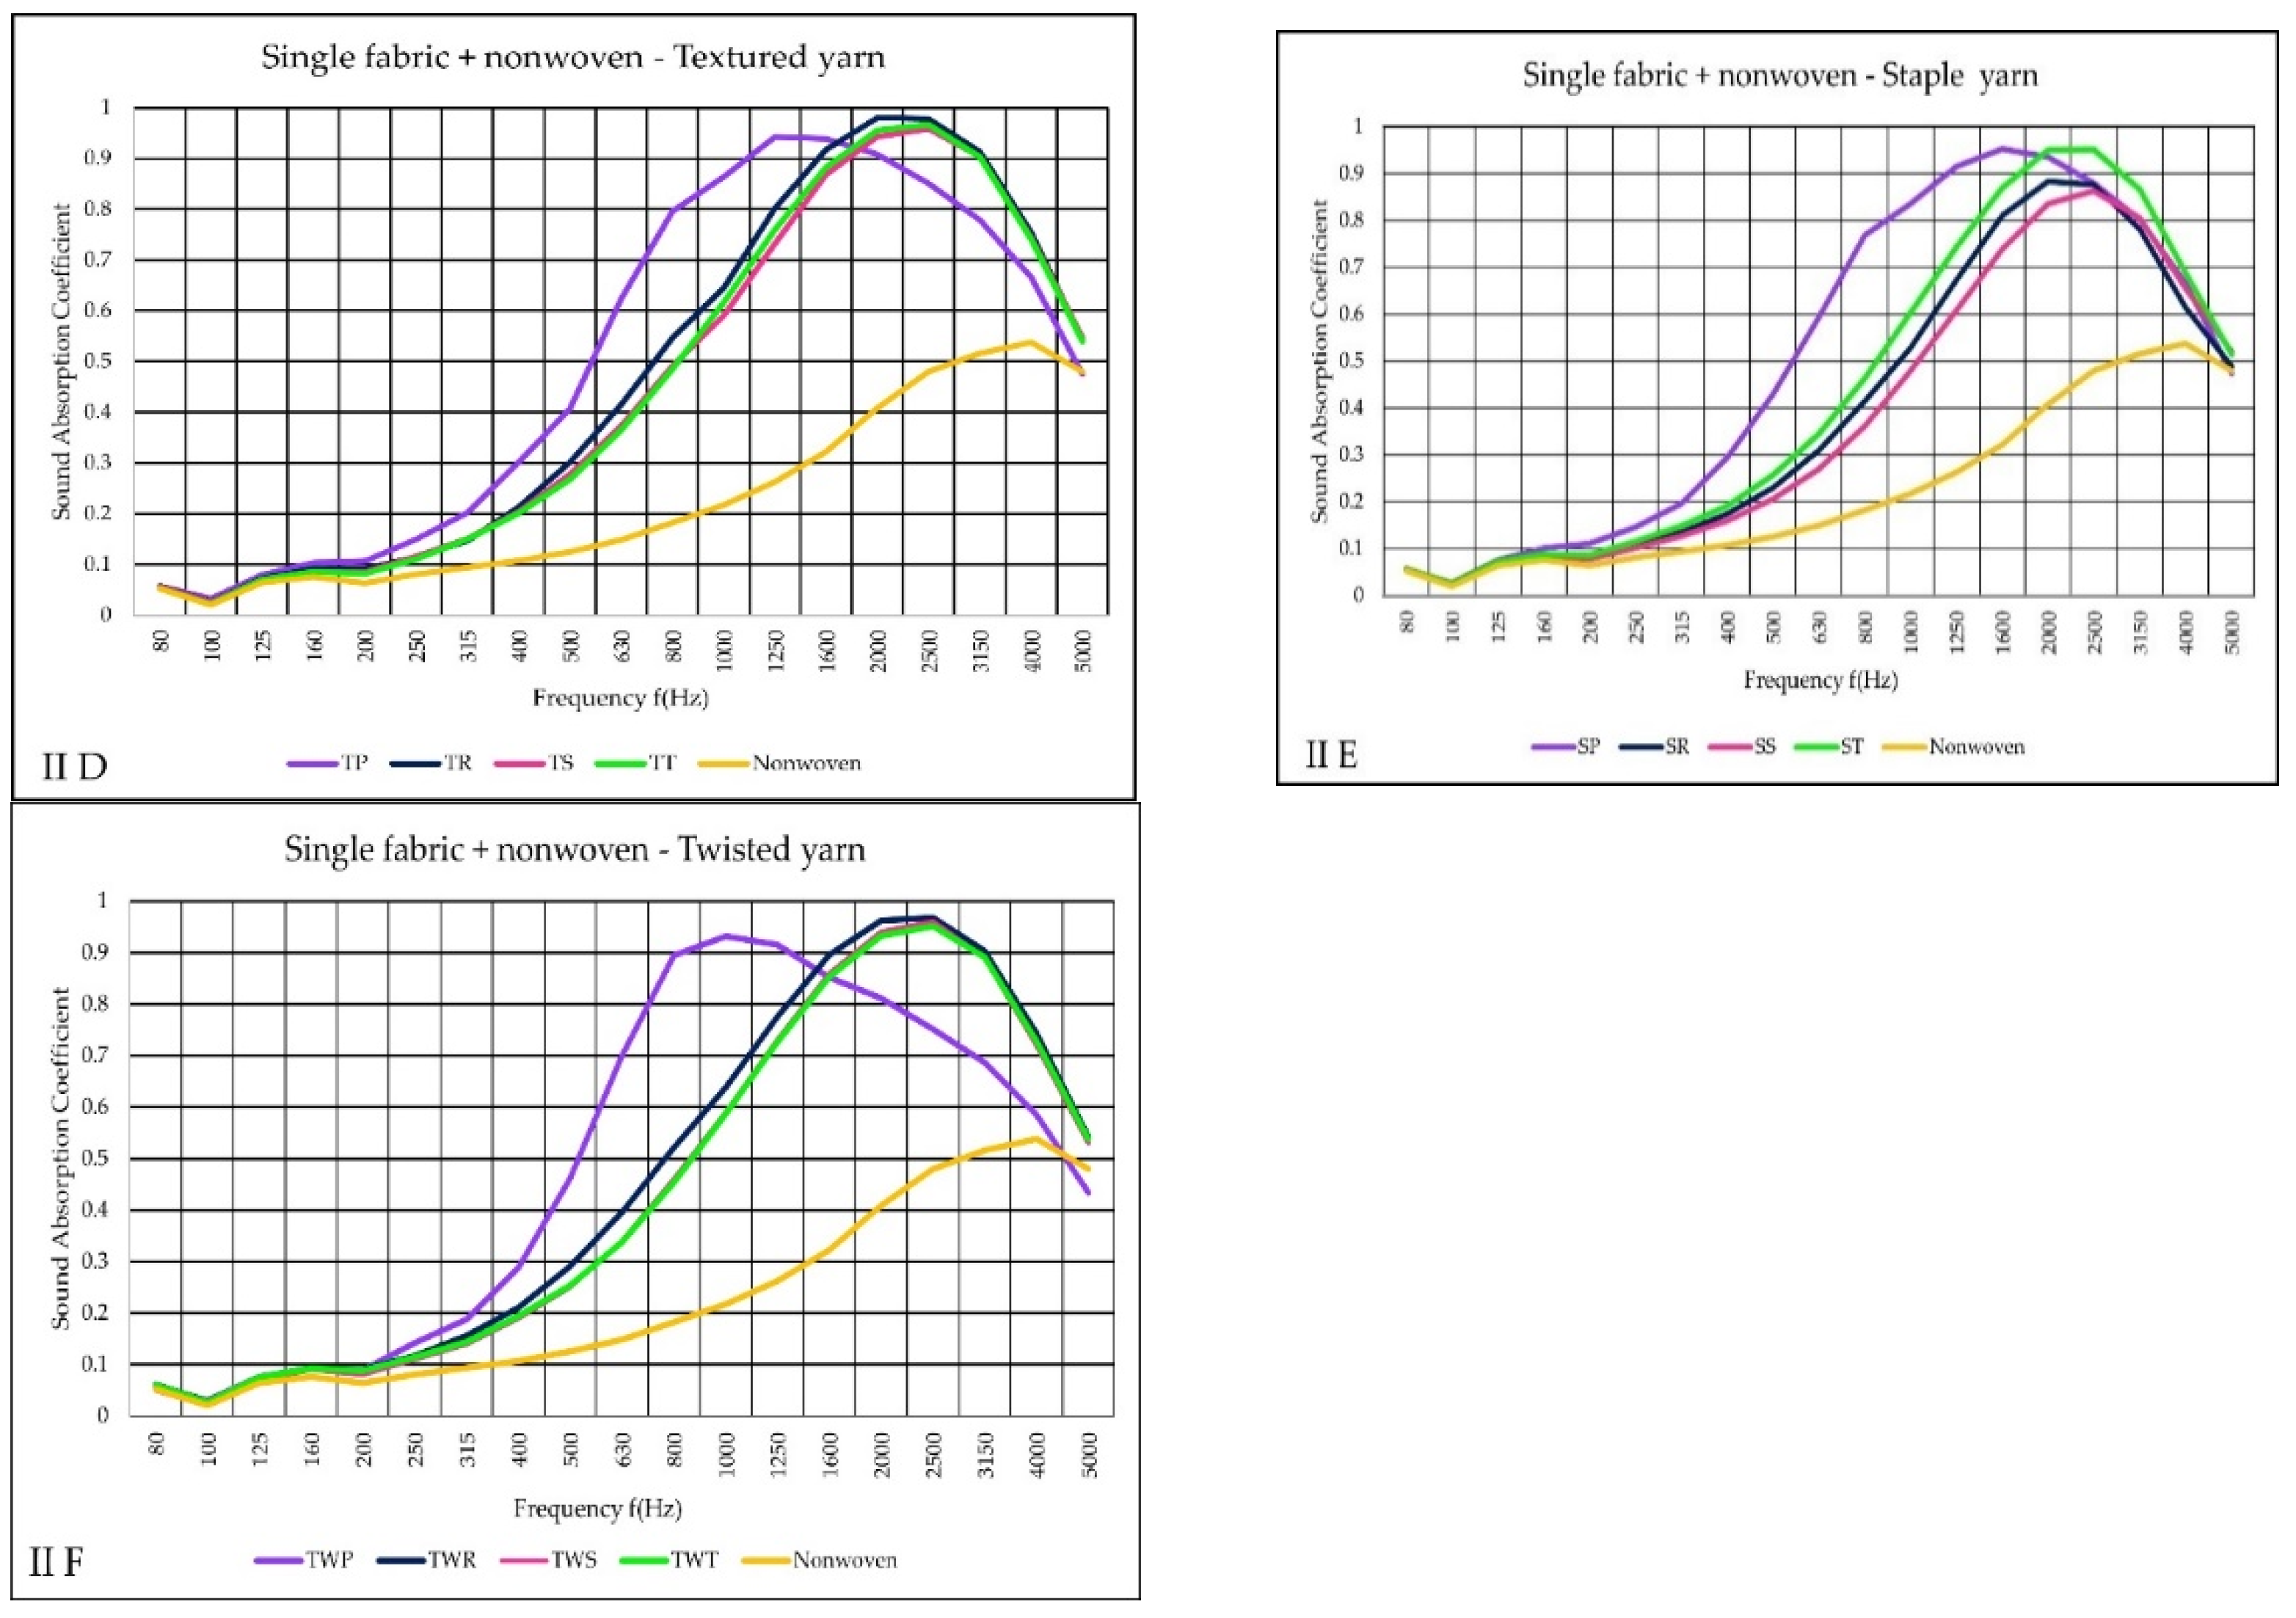
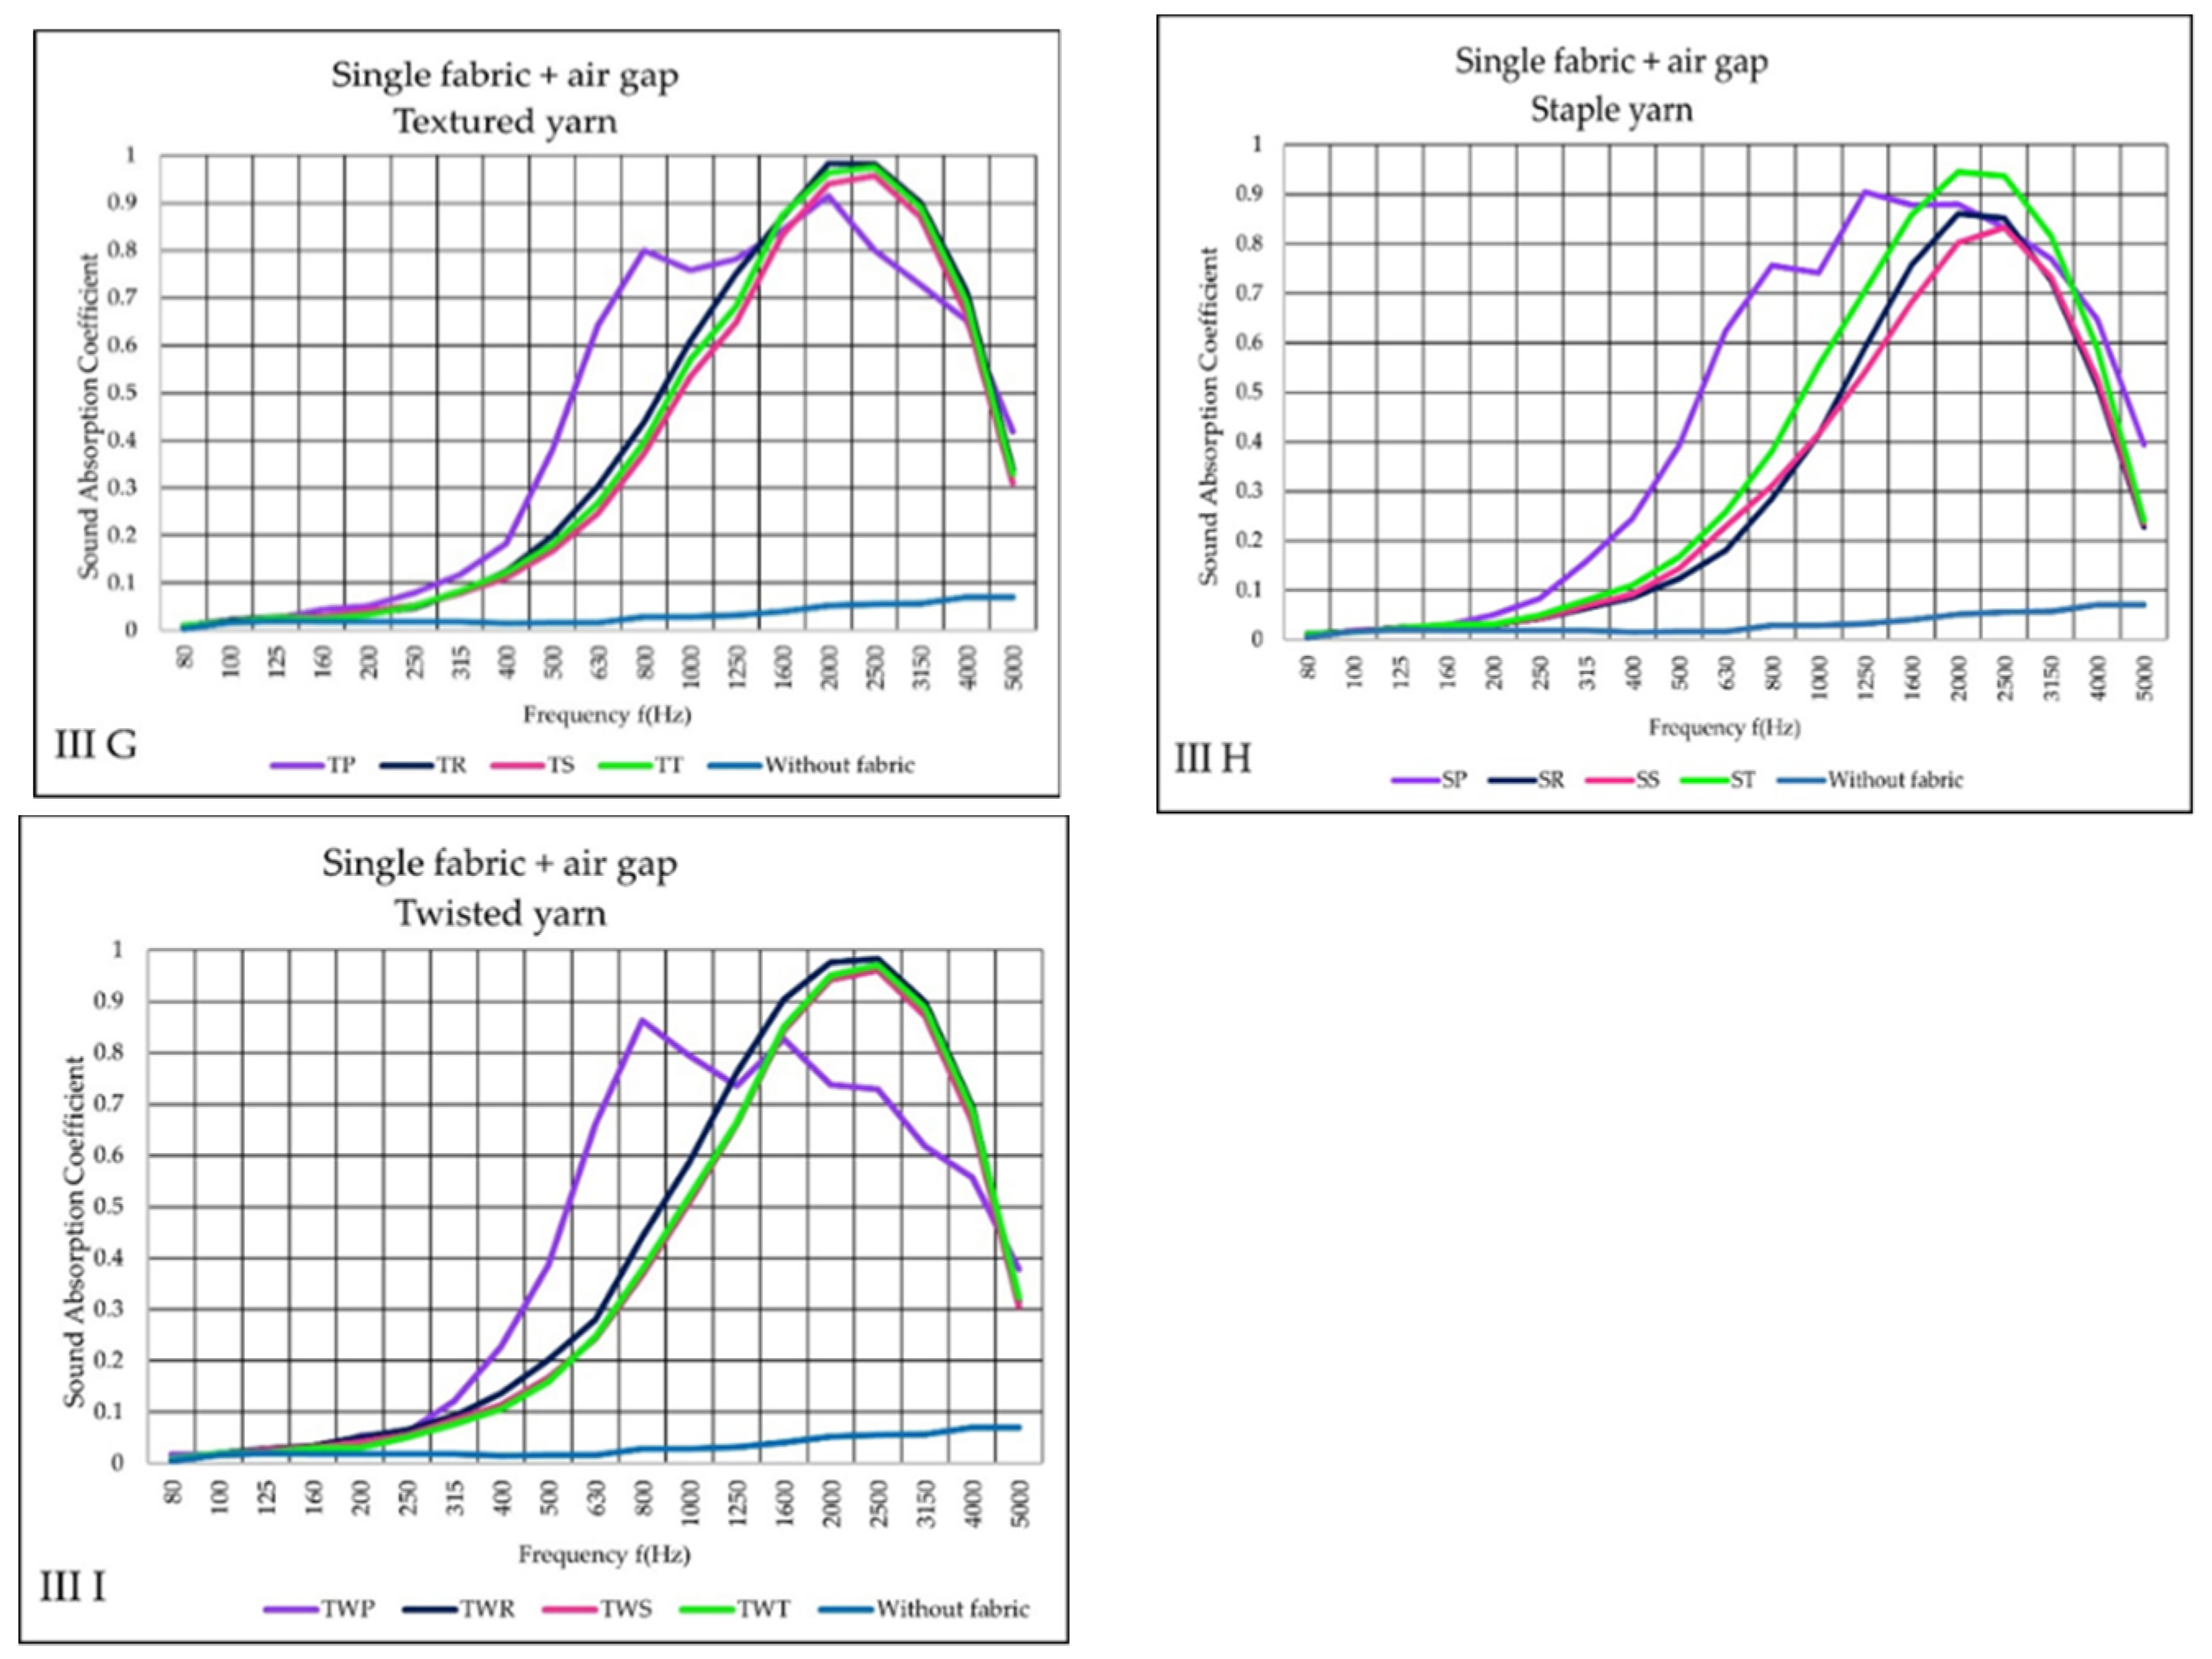
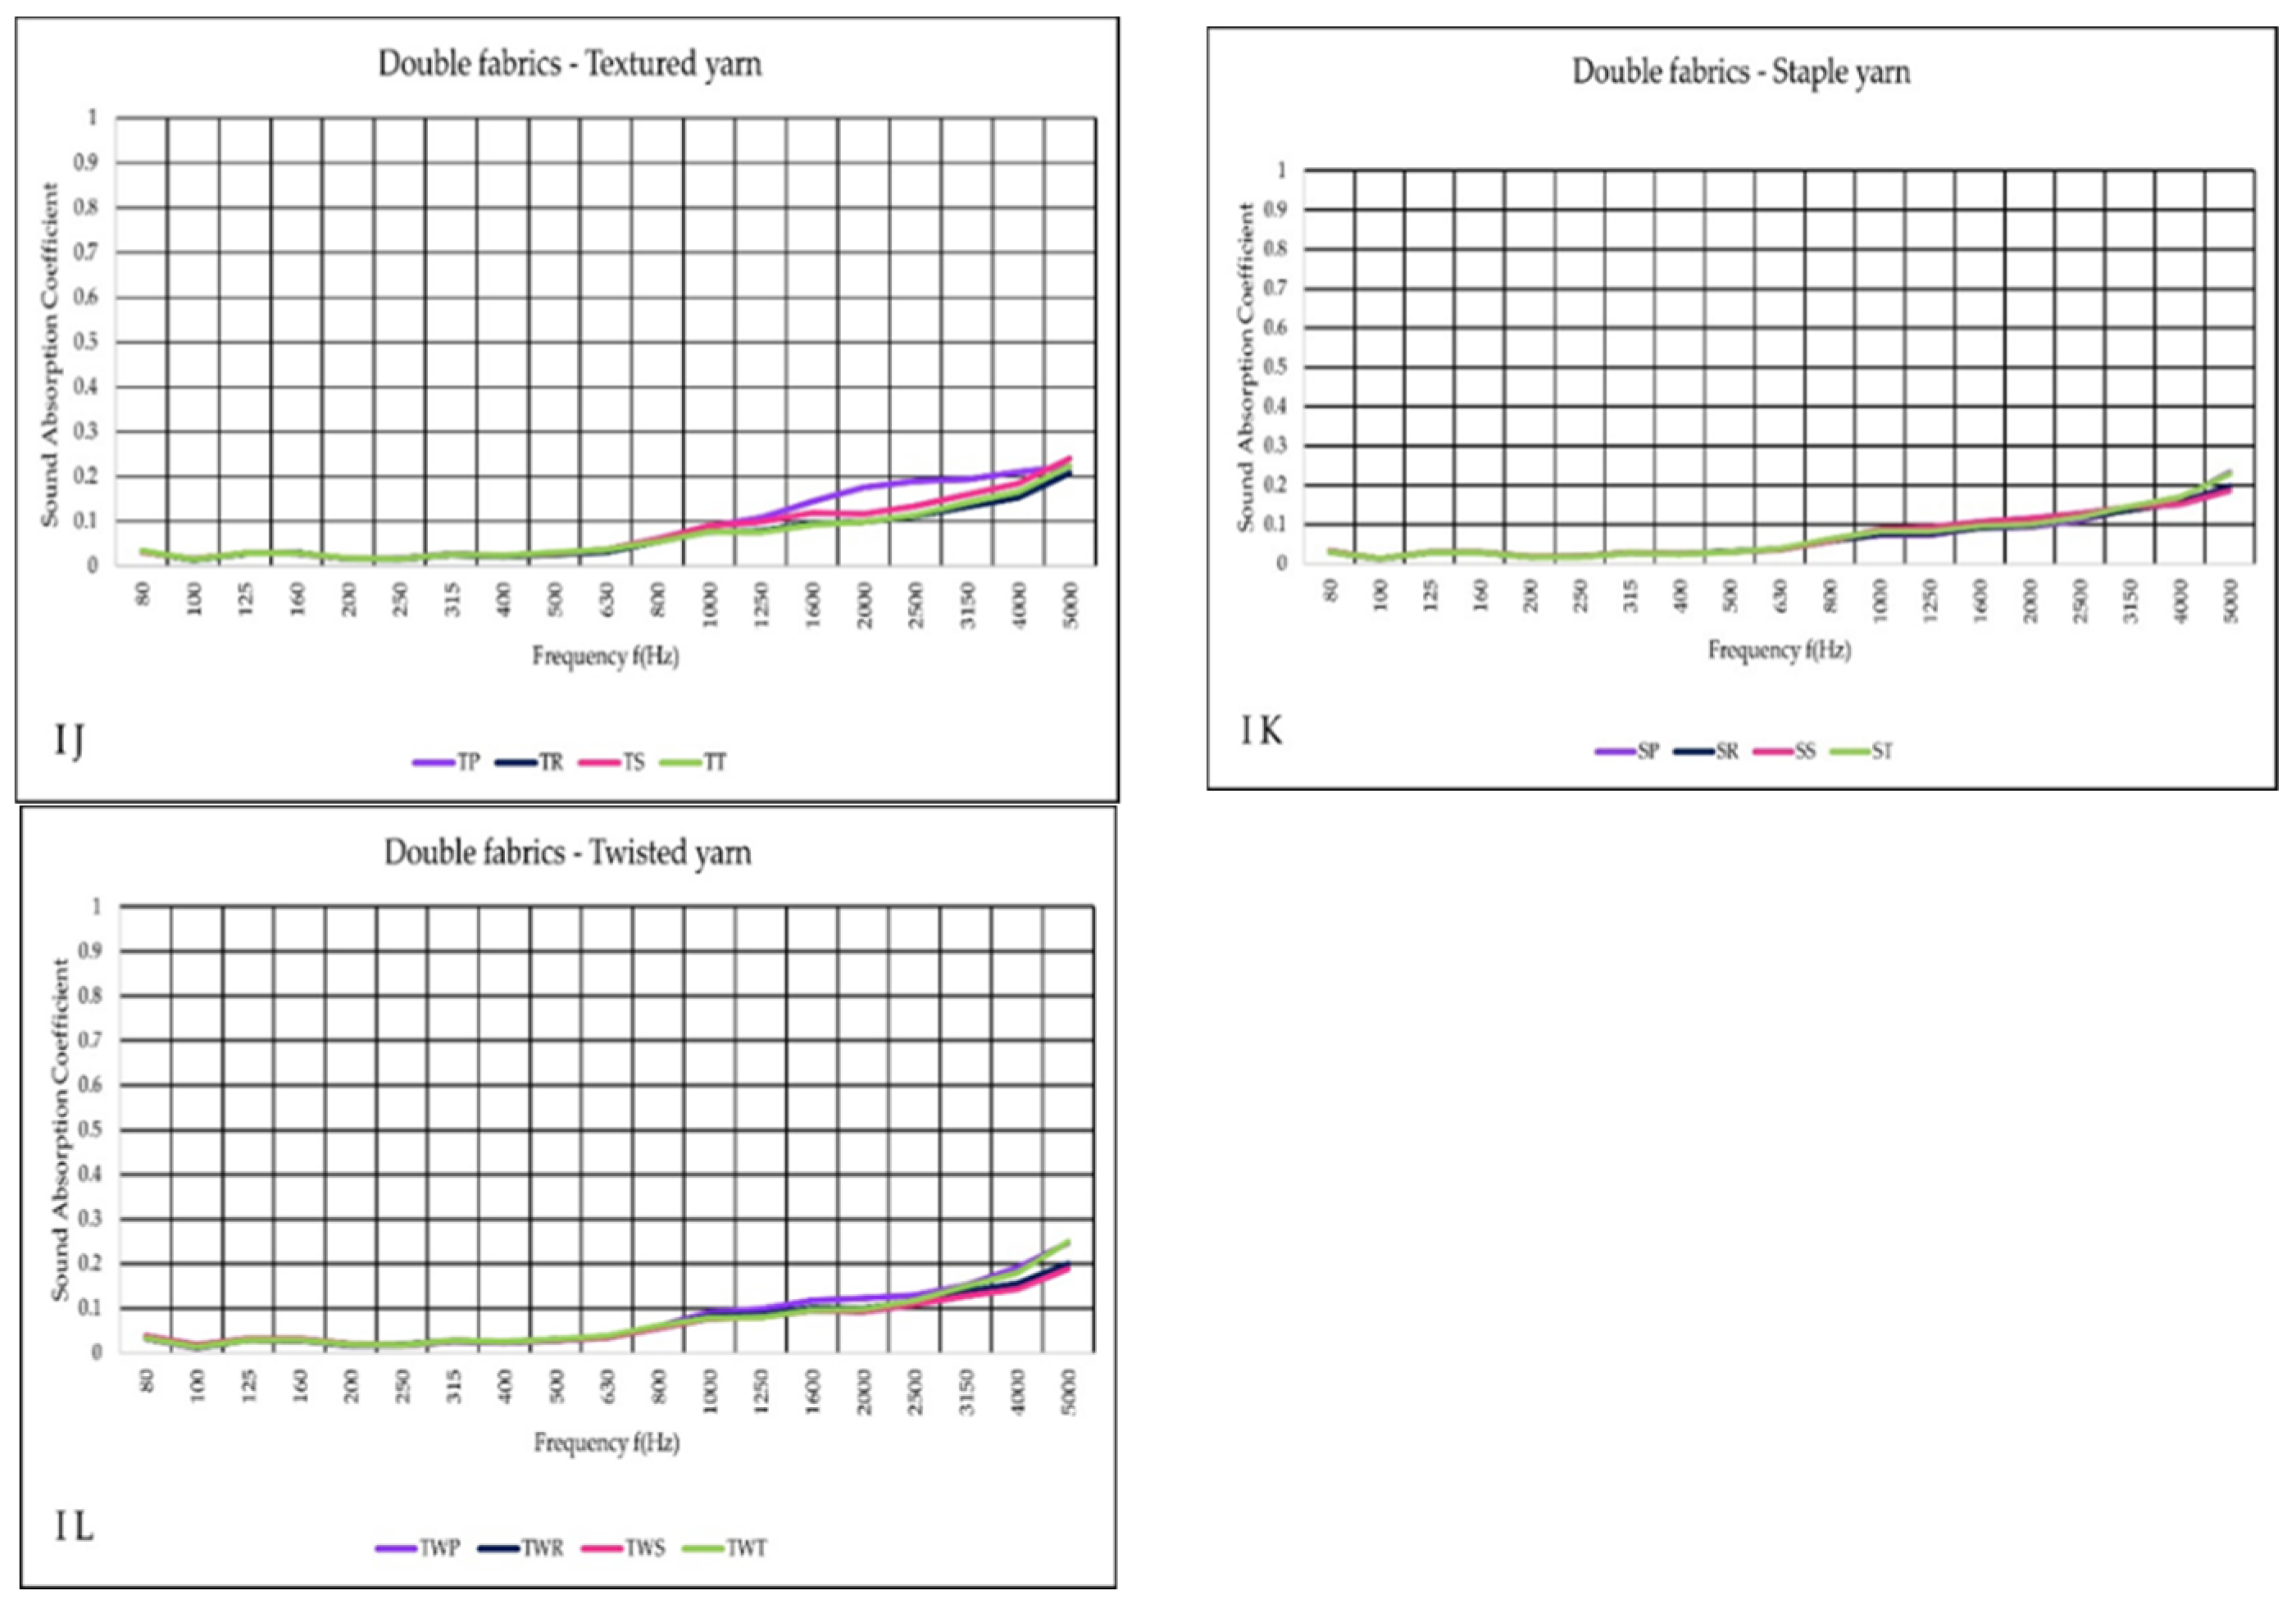
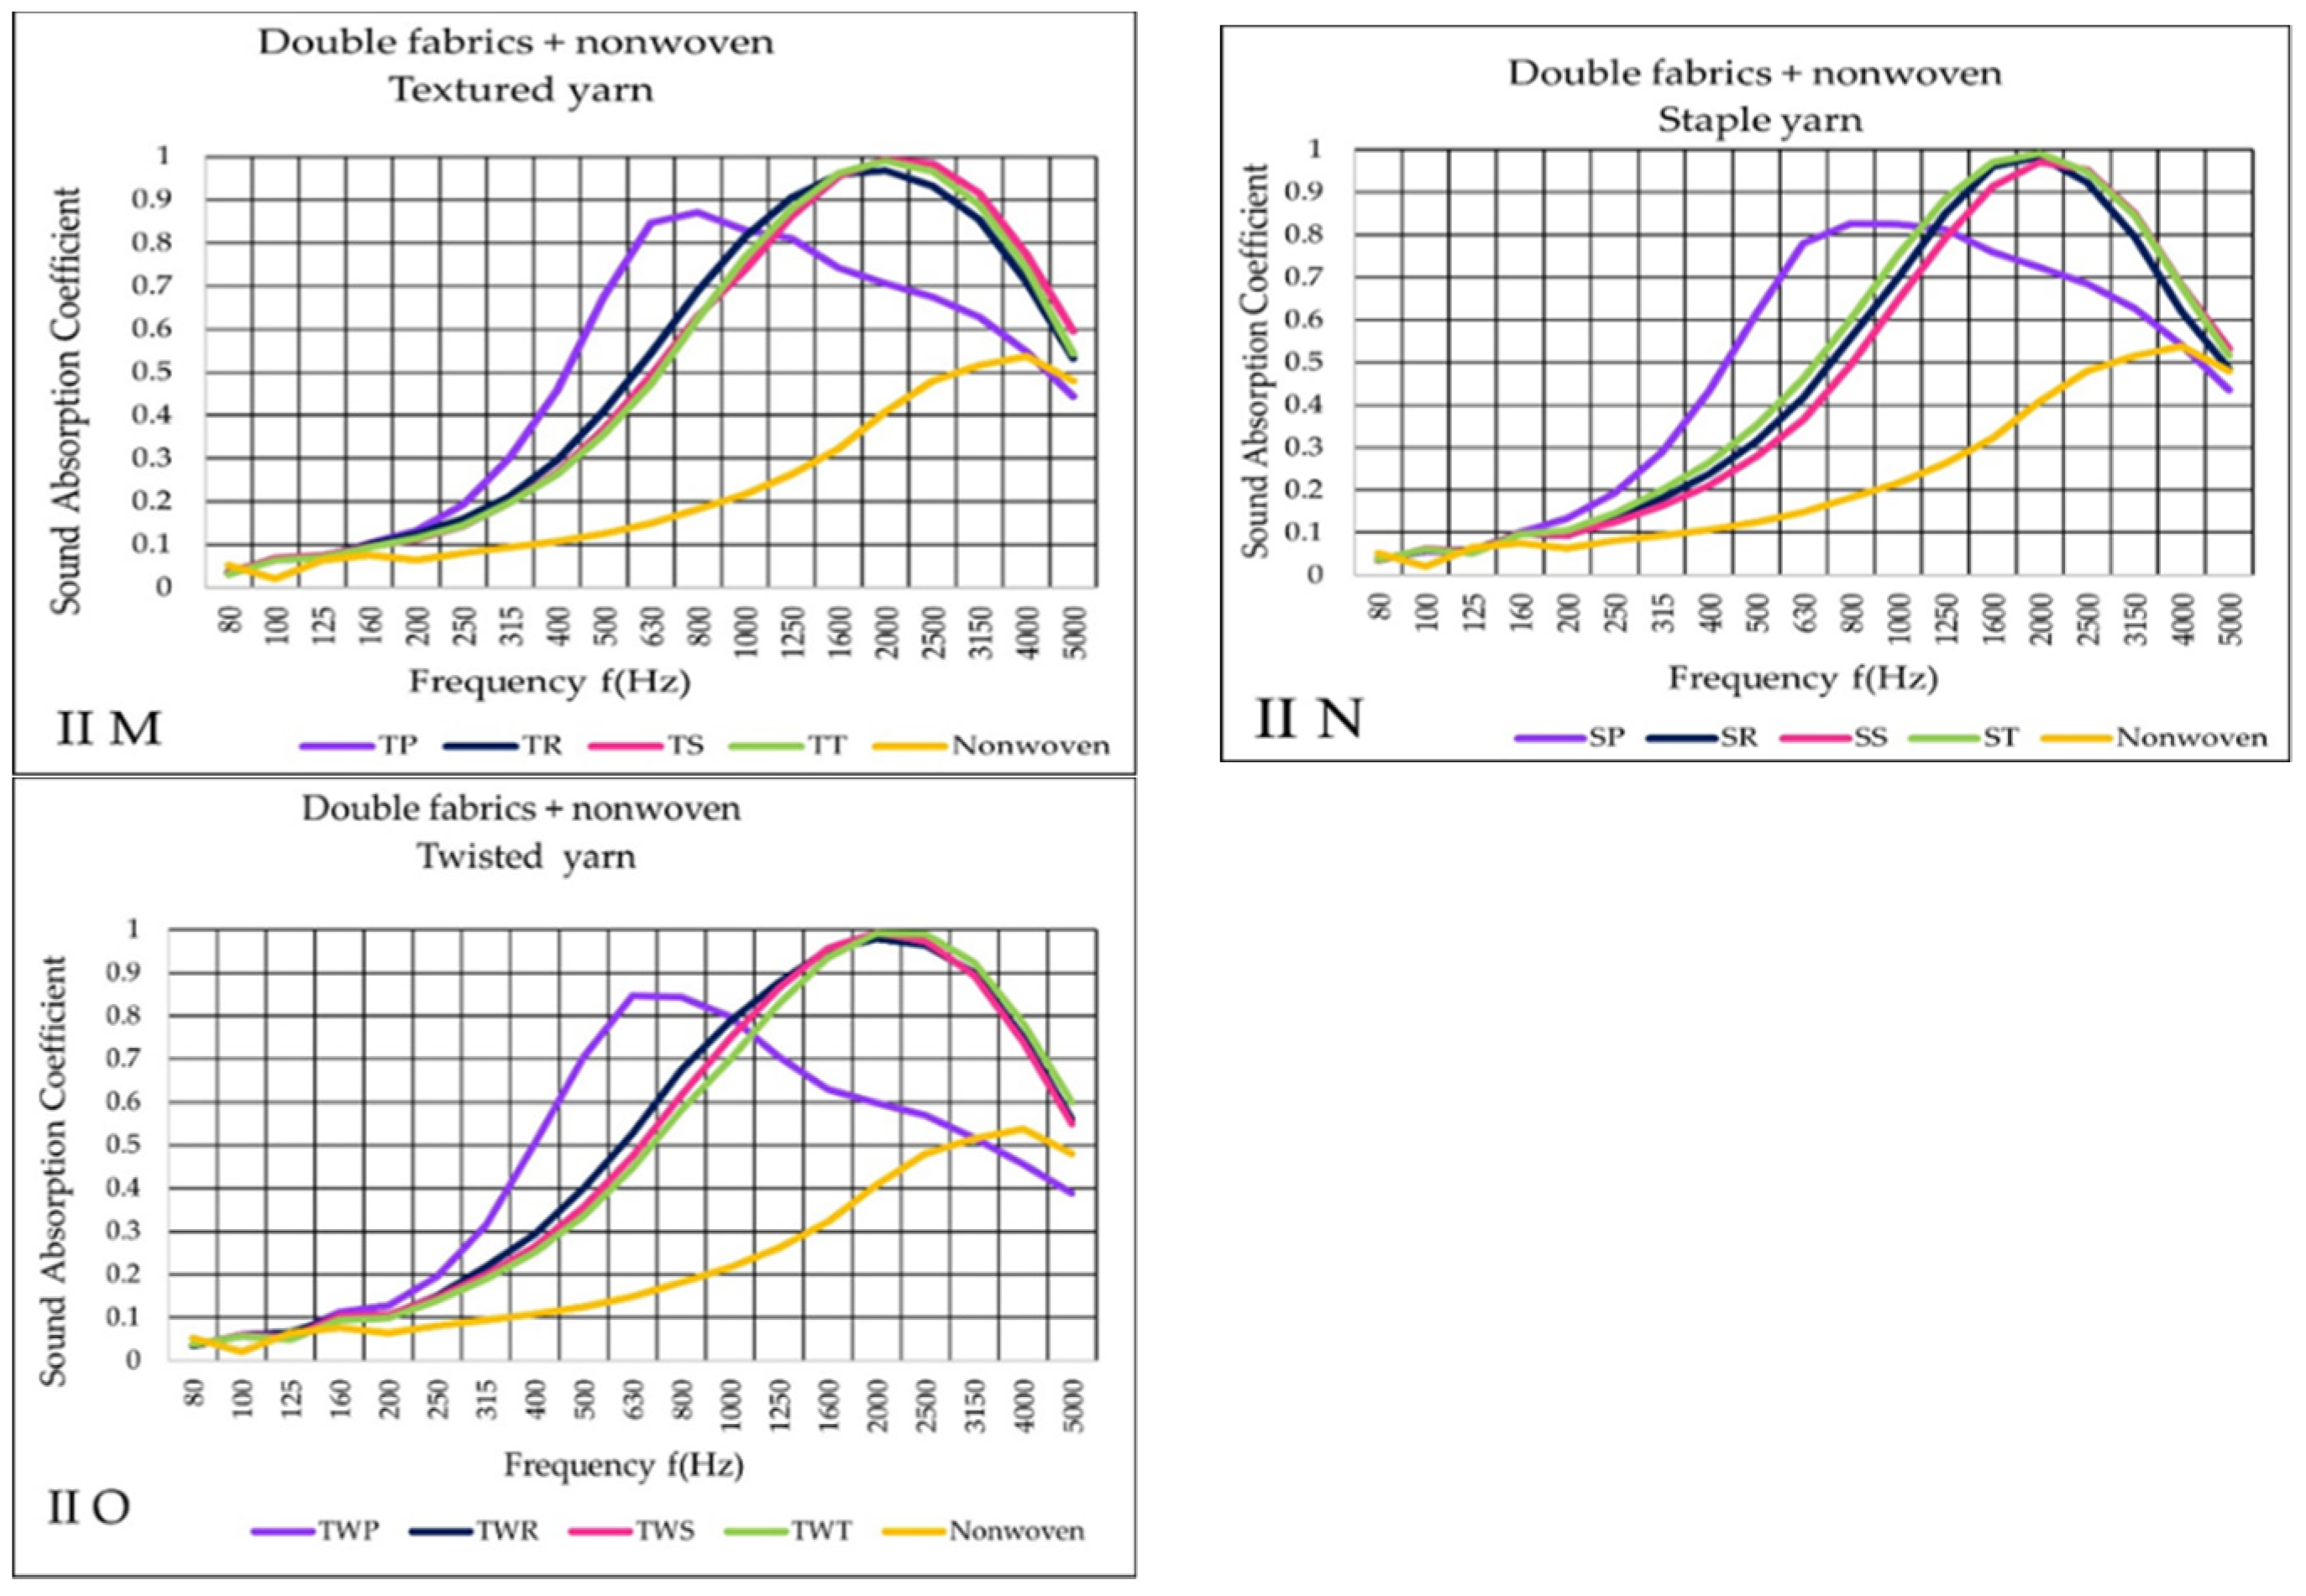
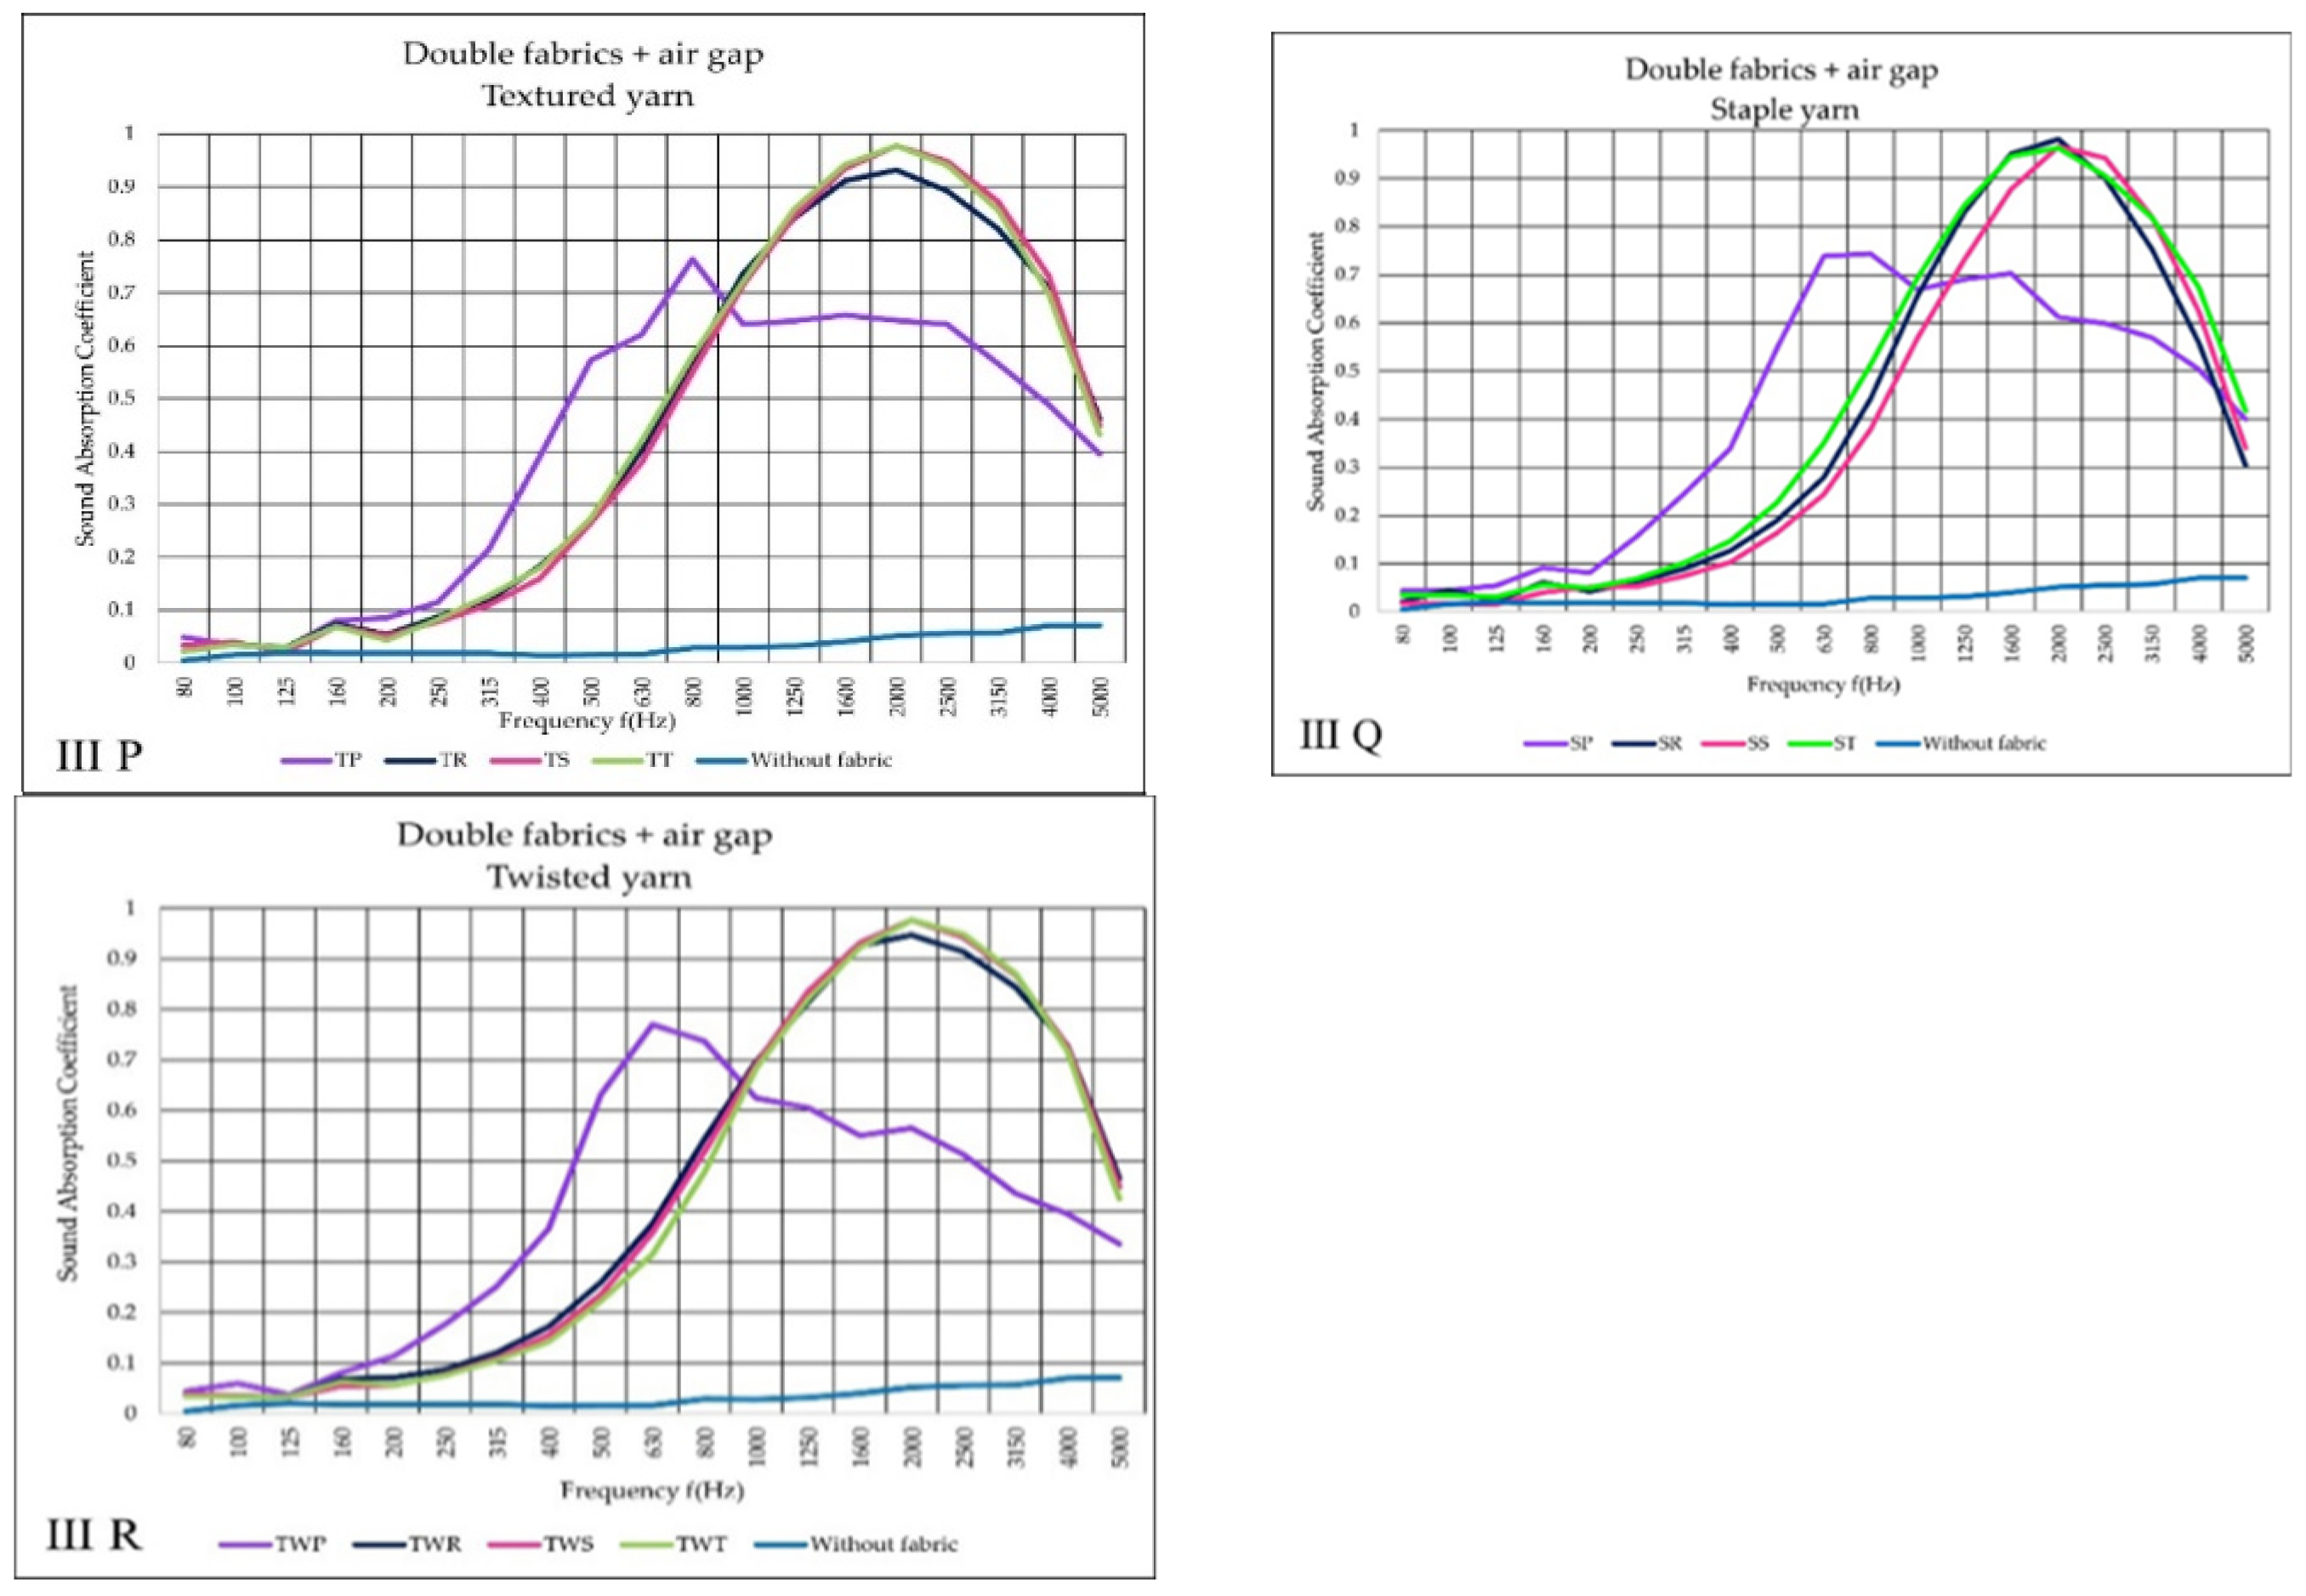
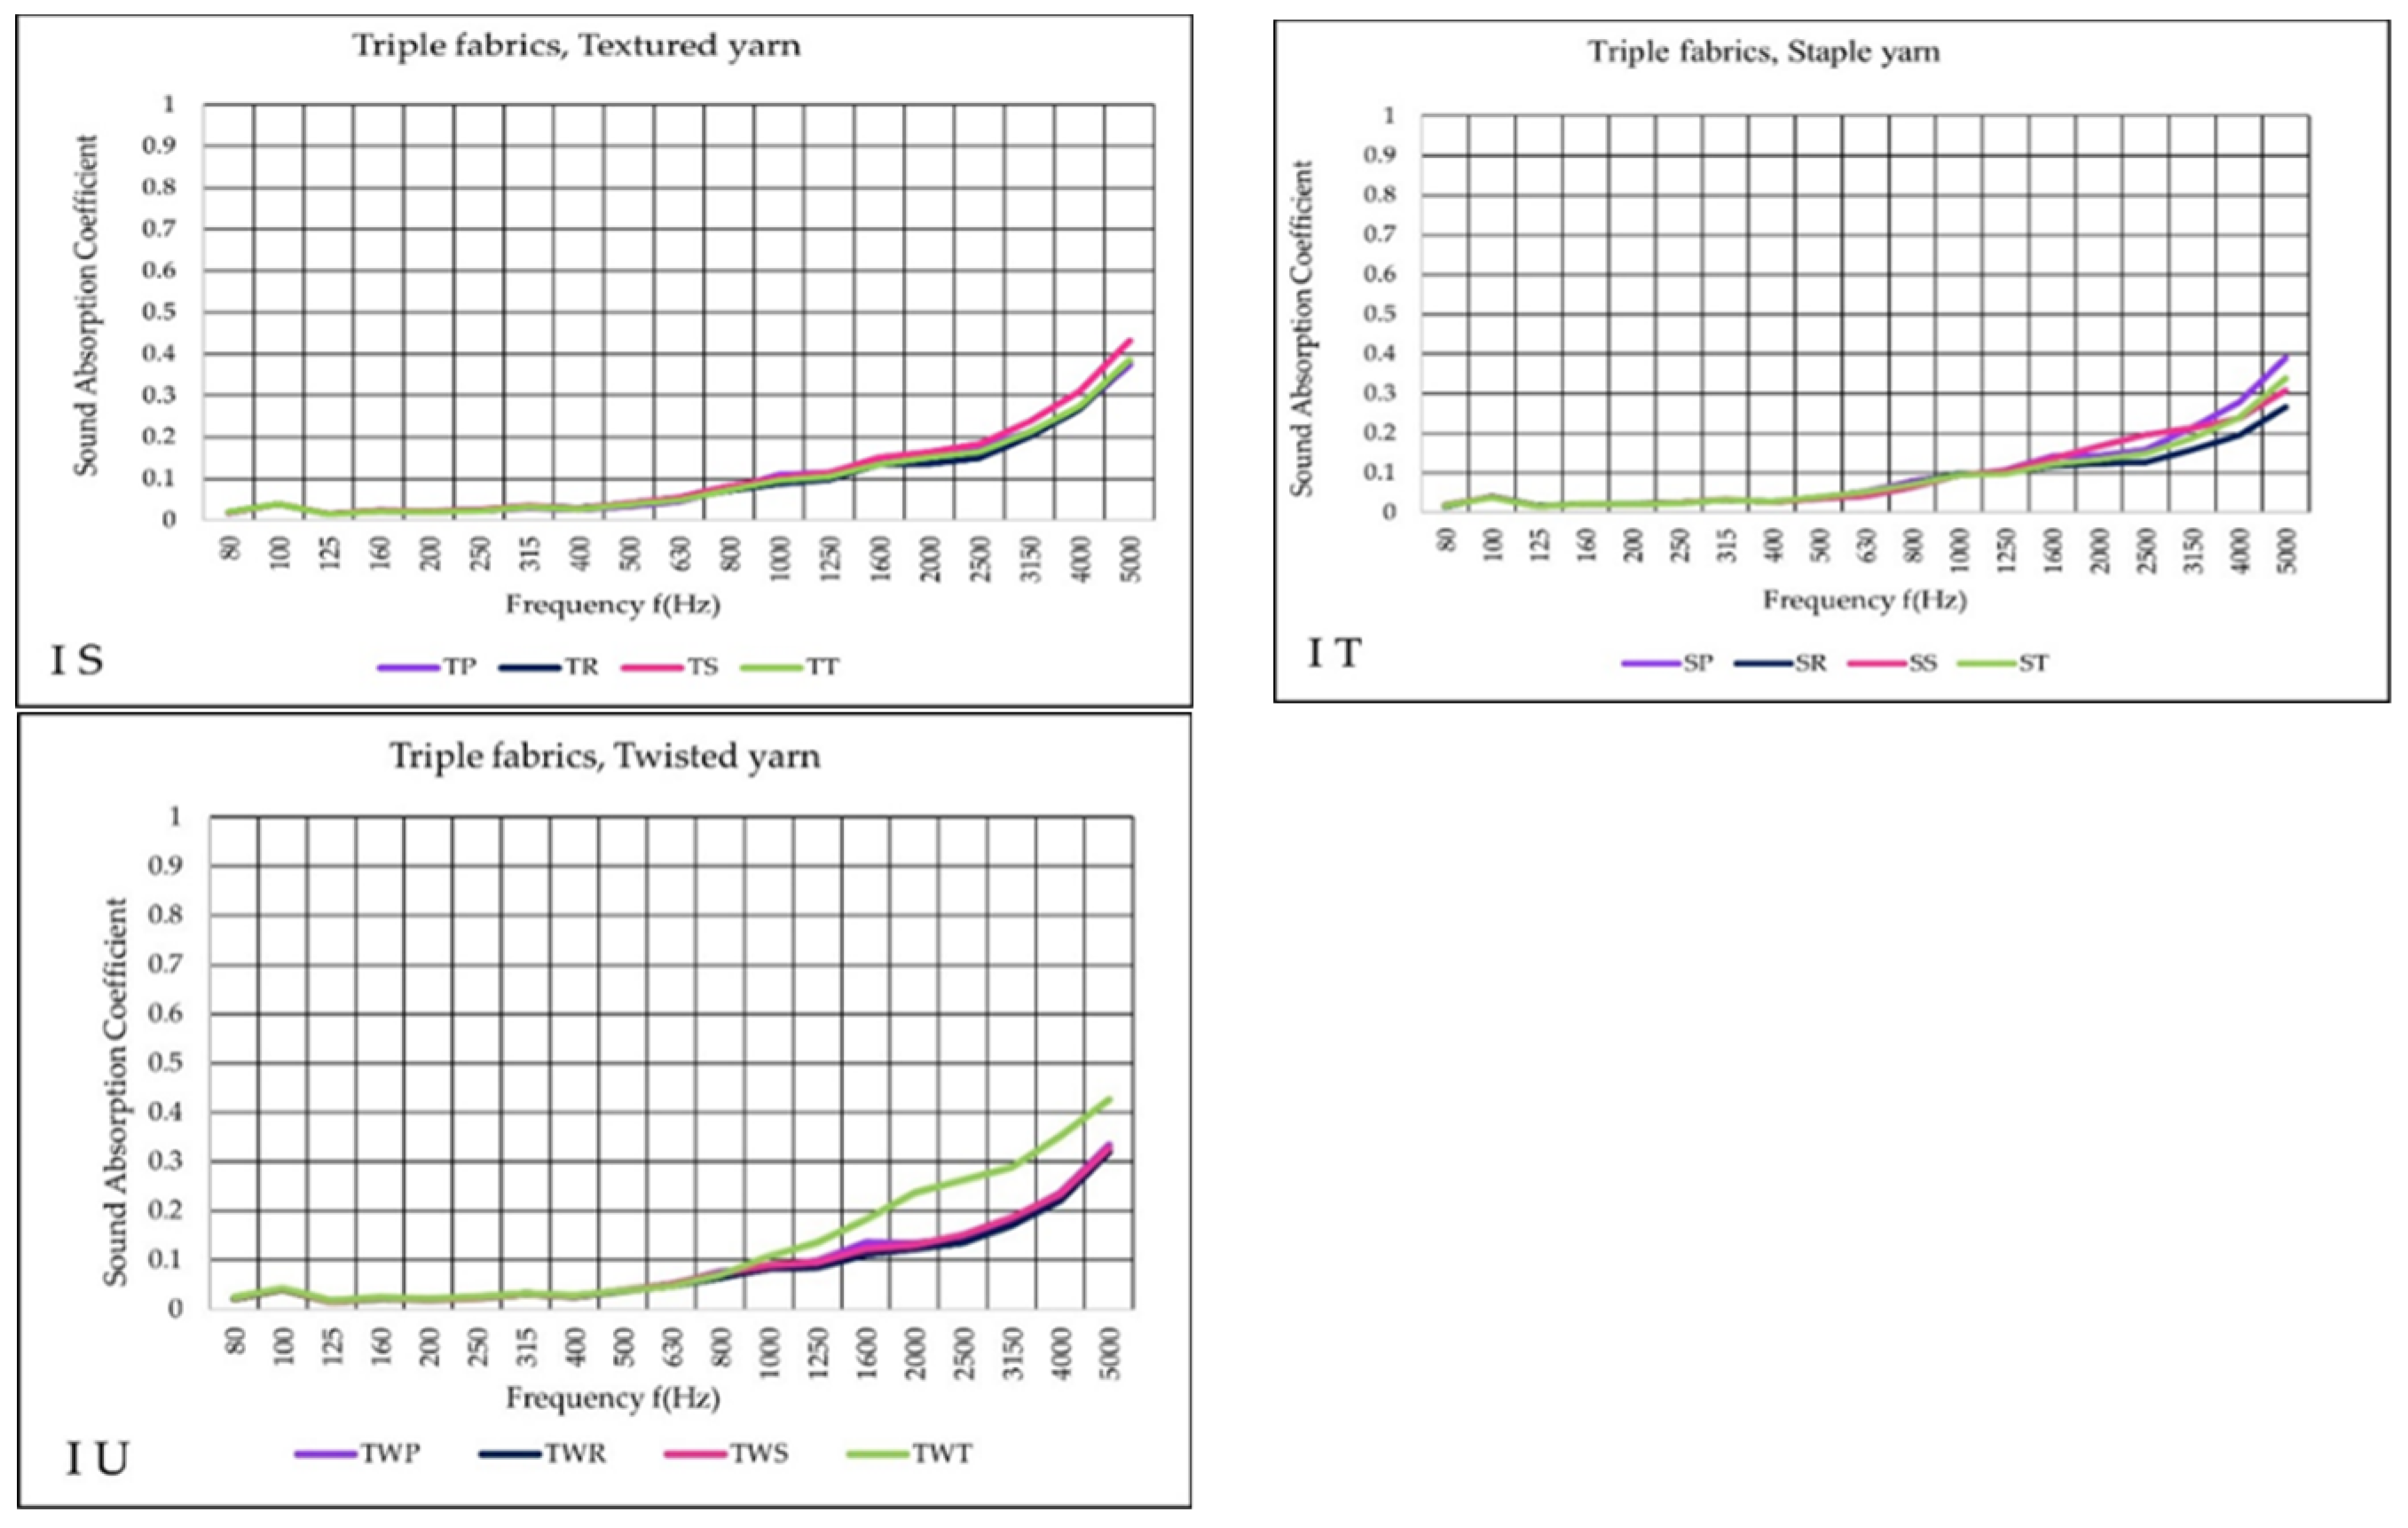
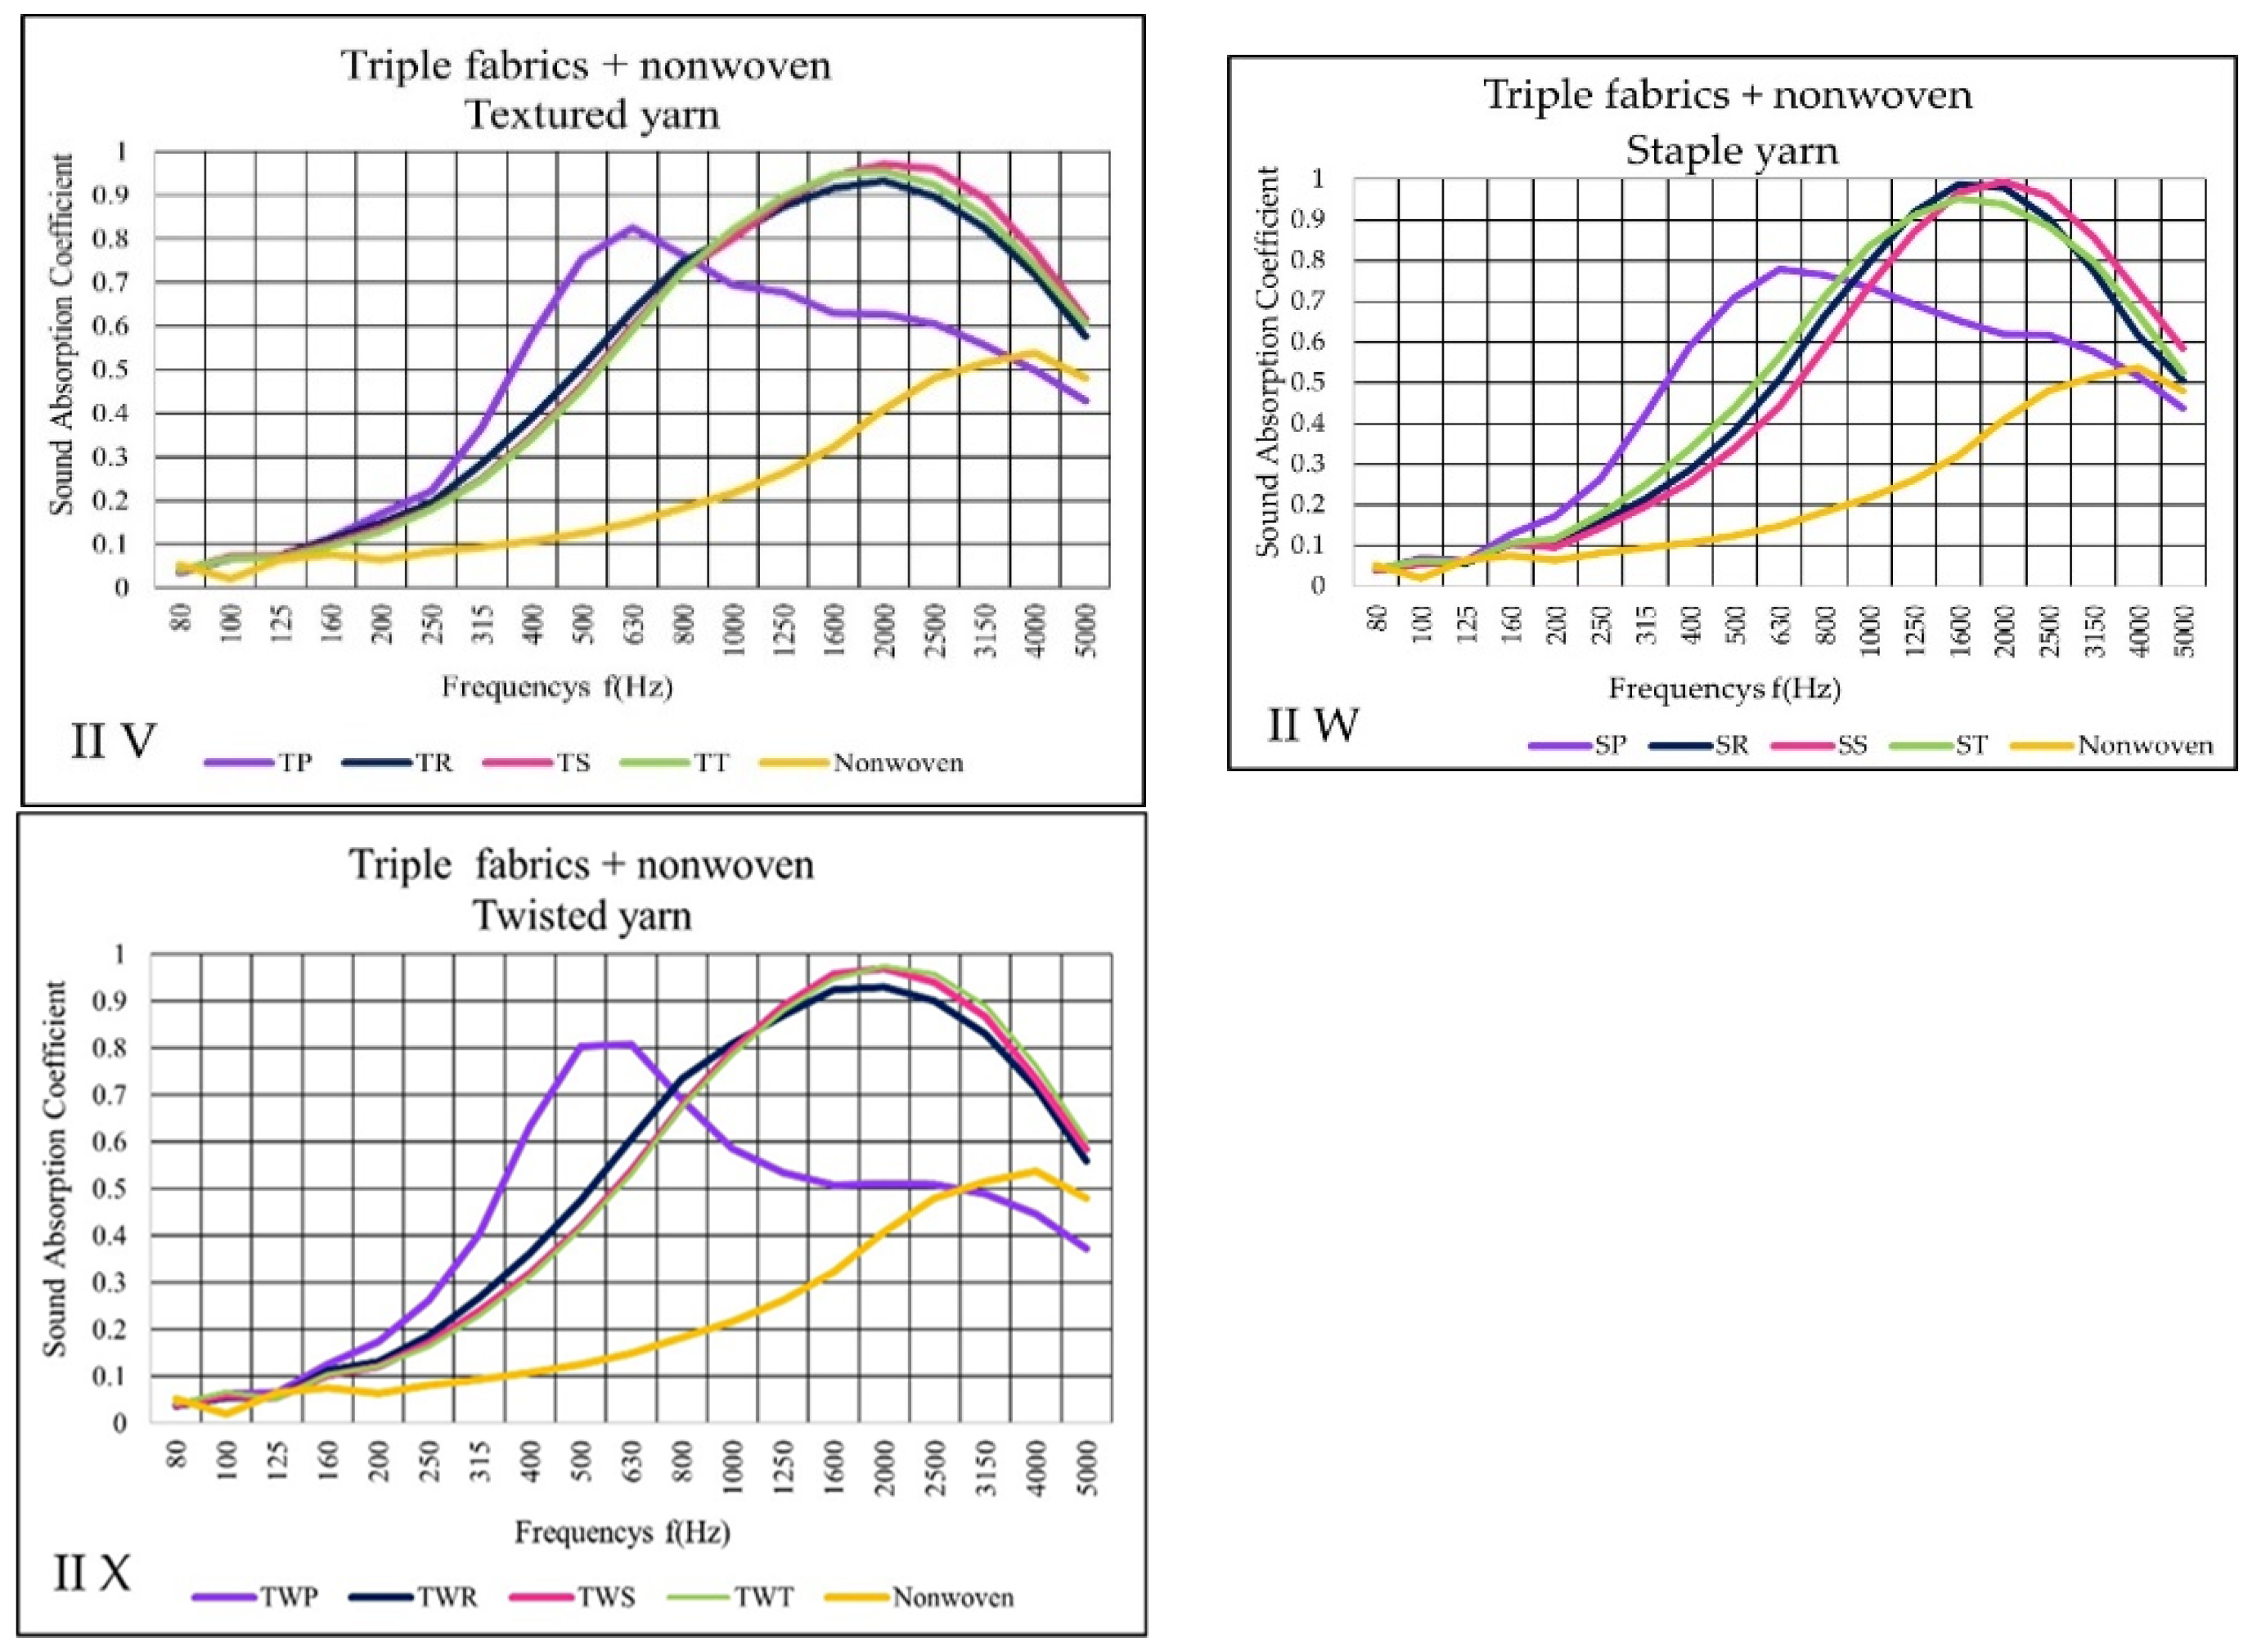
- The noise reduction coefficient (NRC) results enable us to compare the absorption capacity of various fabrics. Textiles made of textured and twisted yarn show comparable NRC findings for variants II and III and greater absorption than staple yarn fabrics except for the plain fabric and ST. In variants II and III, plain fabrics have a greater sound absorption capacity than other fabric structures, particularly single layer woven fabric and double woven TP fabric. Variant I result cannot be considered an absorber material due to the NRC being below 0.2. The second (II) variant achieves a significant reduction in noise than the I and II variant. The III variant shows intermediate results that are much higher than those of the I variant and lower than those of the II variant.
- When the surface roughness of the woven fabric is reduced, the noise reduction coefficient performance of the fabric rises. This phenomenon is directly related to the possibility of wave scattering from the surface as an increase in roughness. Furthermore, higher PES fiber content and porosity indicate that plain fabrics have higher noise reduction coefficient results than other weaves such as rib, sateen, and twill.
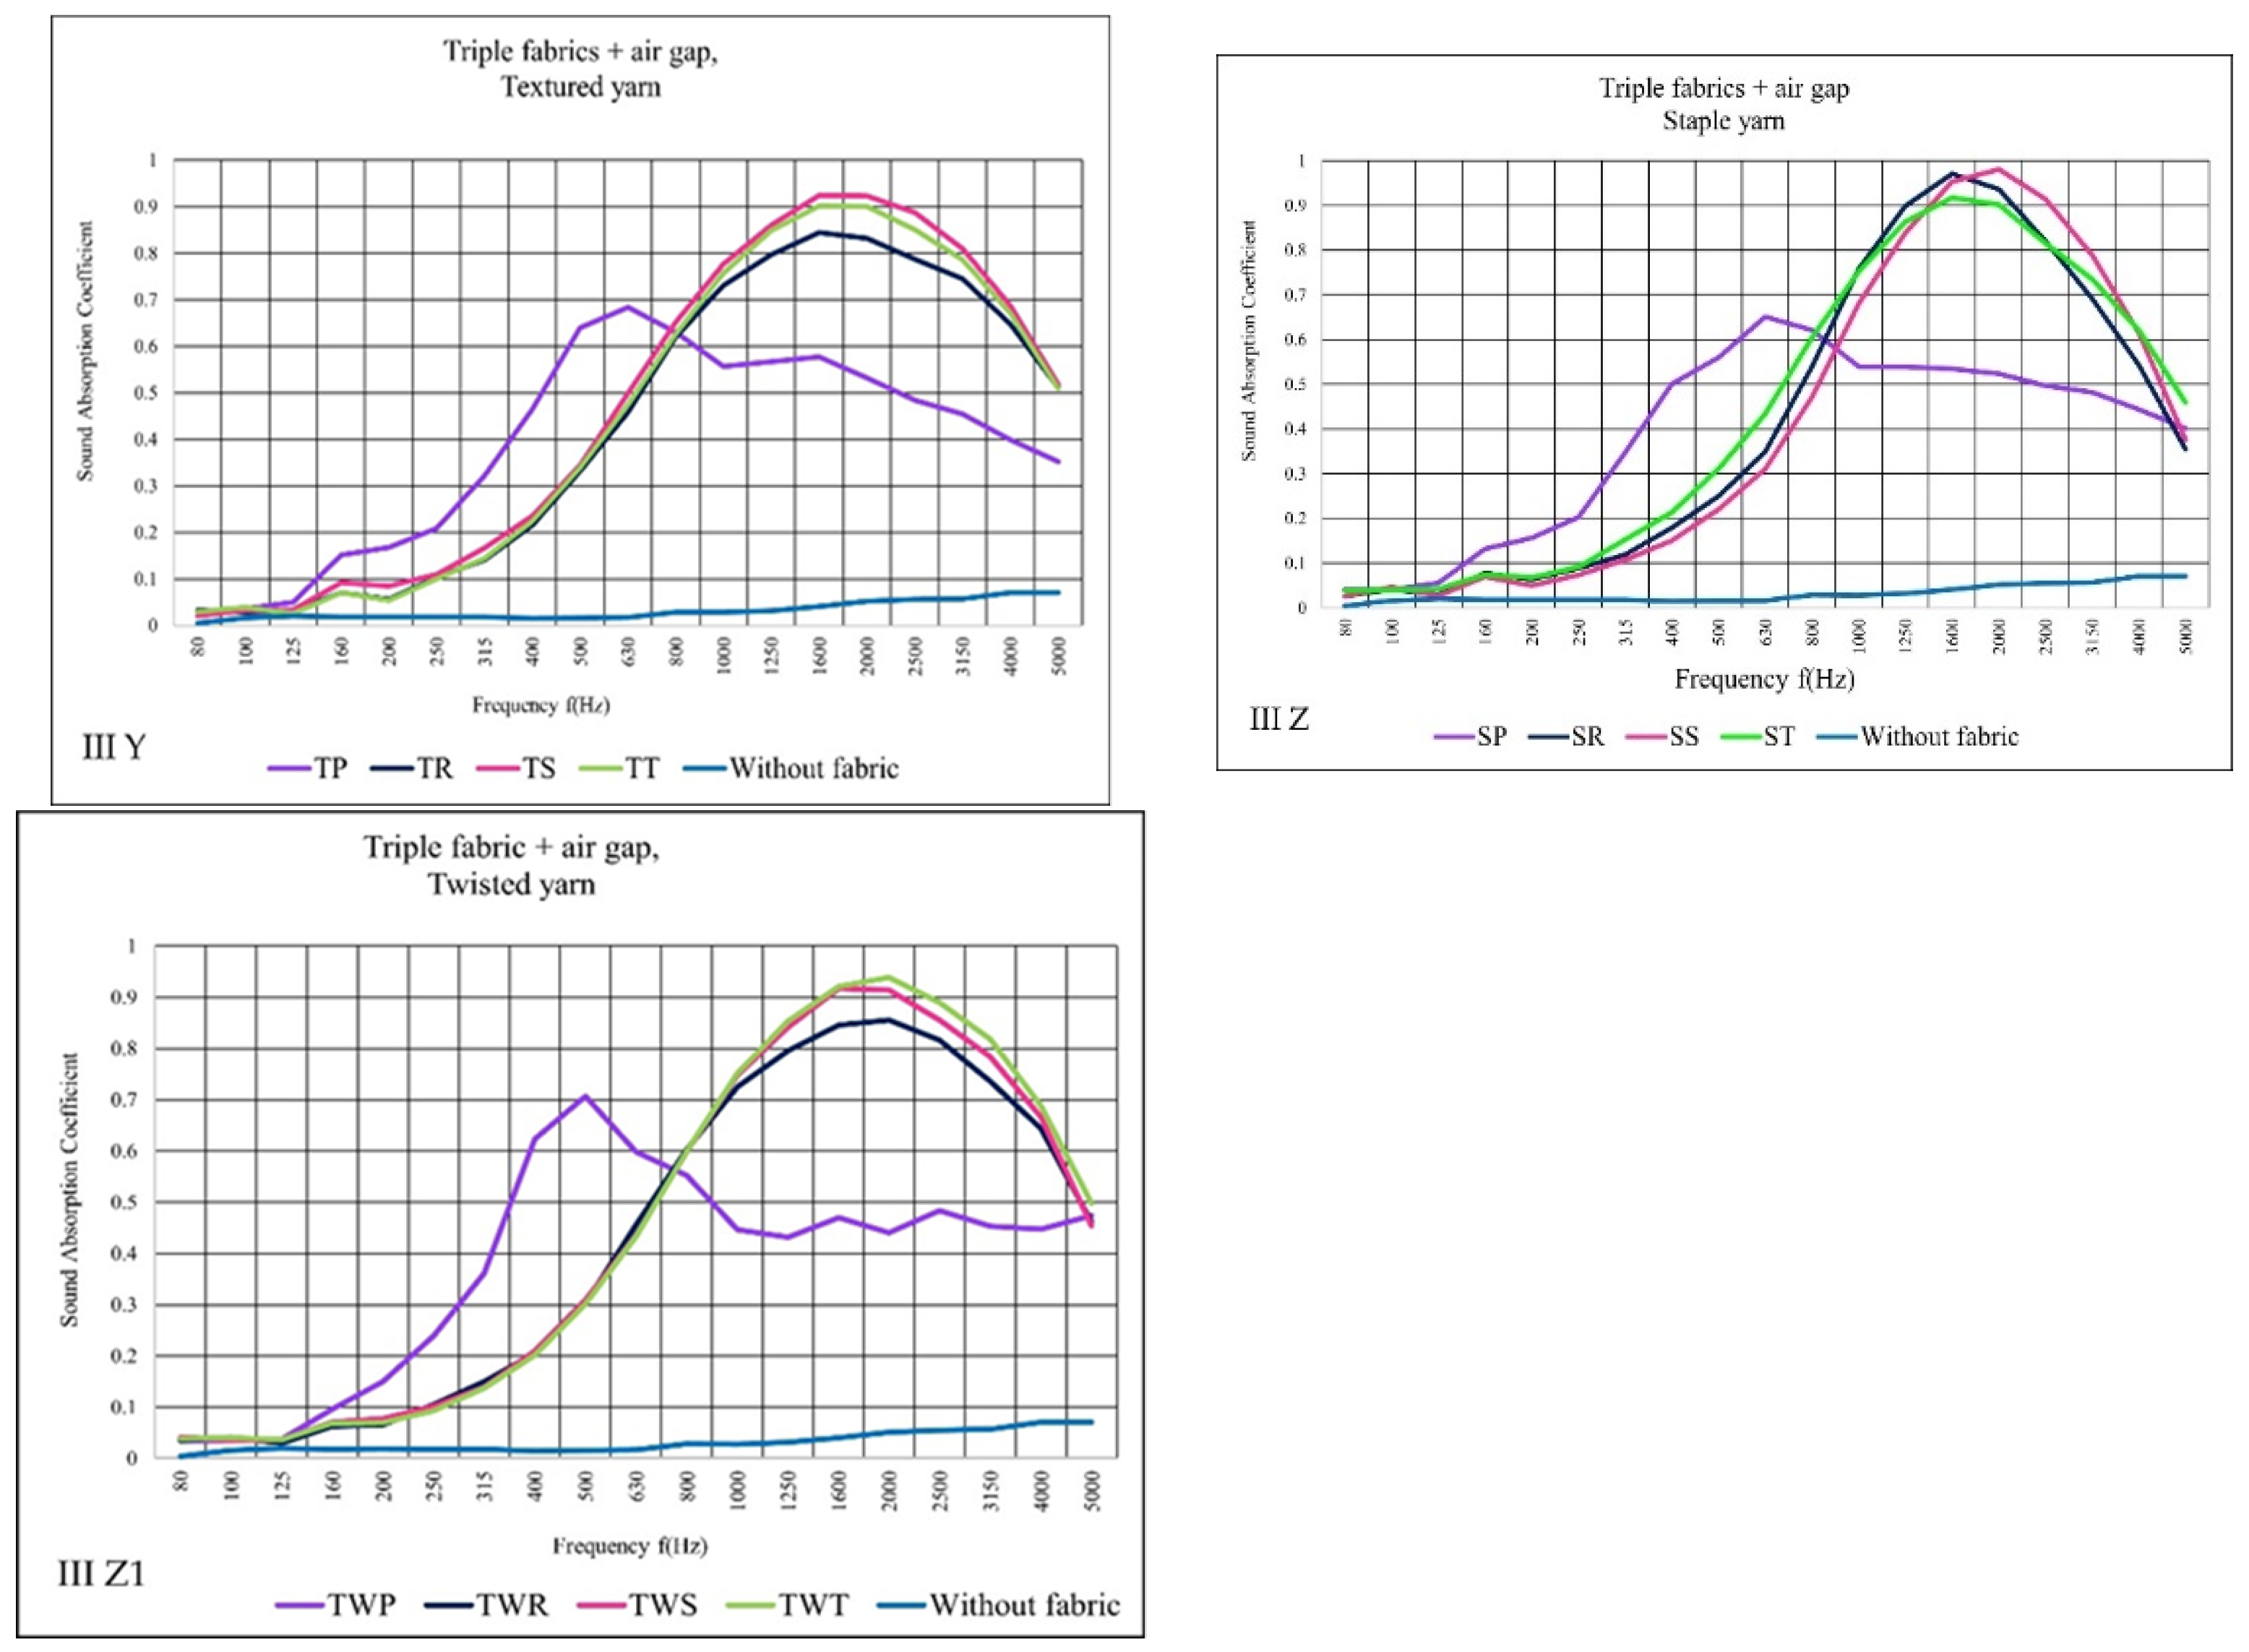
- In general, based on the sound absorption coefficient, the I variant, sound absorption (α), demonstrates no sound absorption properties. On the other hand, apart from plain fabrics, the sound absorption coefficient of all fabrics in II variant is between 0.9 and 1 (α) at higher frequencies (1600 to 2500 Hz). Similarly, plain fabrics’ sound absorption coefficient (α) decreases as the number of woven fabric layers rises in variant II (TWP), and in variant III, TP, SP, and TWP. However, these fabrics have a more excellent absorption at low frequencies (200 to 1000 Hz) than the others.
- Combining woven and nonwoven fabrics has advantages in improving sound barrier properties. The first is to make the sound absorption performance better for both textiles. Secondly, integrated materials may have better mechanical characteristics than nonwoven itself. Thirdly, the aesthetic value of such mixed materials can be achieved by giving elaborated woven fabrics as a front layer. Generally, the absorption improvement at low frequencies for single layer plain fabrics together with nonwoven or air gaps gives a clue for further investigation into developing such materials for the application of low sound absorber materials.
Author Contributions
Funding
Institutional Review Board Statement
Informed Consent Statement
Data Availability Statement
Acknowledgments
Conflicts of Interest
References
- Möser, M. Engineering acoustics: An introduction to noise control. J. Acoust. Soc. Am. 2004, 116, 2707–2708. [Google Scholar]
- Segura-Alcaraz, P.; Segura-Alcaraz, J.; Montava, I.; Bonet-Aracil, M. The use of fabrics to improve the acoustic absorption: Influence of the Woven Fabric Thread Density over a Nonwoven. Autex Res. J. 2018, 18, 269–279. [Google Scholar] [CrossRef] [Green Version]
- Shoshani, Y.; Rosenhouse, G. Noise absorption by woven fabrics. Appl. Acoust. 1990, 30, 321–333. [Google Scholar] [CrossRef]
- Tang, X.; Yan, X. Acoustic energy absorption properties of fibrous materials: A review. Compos. Part A Appl. Sci. Manuf. 2017, 101, 360–380. [Google Scholar] [CrossRef]
- Arenas, J.P.; Crocker, M.J. Recent trends in porous sound-absorbing materials. Sound Vib. 2010, 44, 12–18. [Google Scholar]
- Atalla, N.; Sgard, F. Modeling of perforated plates and screens using rigid frame porous models. J Sound Vib. 2007, 303, 195–208. [Google Scholar] [CrossRef]
- Chevillotte, F. Controlling sound absorption by an upstream resistive layer. Appl. Acoust. 2012, 73, 56–60. [Google Scholar] [CrossRef]
- Yang, Y.; Li, B.; Chen, Z.; Sui, N.; Chen, Z.; Xu, T.; Li, Y.; Fu, R.; Jing, Y. Sound insulation of multilayer glass-fiber felts: Role of morphology. Text. Res. J. 2017, 87, 261–269. [Google Scholar] [CrossRef]
- Witczak, E.; Jasińska, I.; Lao, M.; Krawczyńska, I.; Kamińska, I. The influence of structural parameters of acoustic panels textile fronts on their sound absorption properties. Appl. Acoust. 2021, 178, 107964. [Google Scholar] [CrossRef]
- Liu, J.; Bao, W.; Shi, L.; Zuo, B.; Gao, W. General regression neural network for prediction of sound absorption coefficients of sandwich structure nonwoven absorbers. Appl. Acoust. 2014, 76, 128–137. [Google Scholar] [CrossRef]
- Wang, Y.; Zhang, C.; Ren, L.; Ichchou, M.; Galland, M.A.; Bareille, O. Sound absorption of a new bionic multi-layer absorber. Compos. Struct. 2014, 108, 400–408. [Google Scholar] [CrossRef]
- Pieren, R.; Heutschi, K. Predicting sound absorption coefficients of lightweight multilayer curtains using the equivalent circuit method. Appl. Acoust. 2015, 92, 27–41. [Google Scholar] [CrossRef]
- Zhao, H.; Wang, Y.; Yu, D.; Yang, H.; Zhong, J.; Wu, F.; Wen, J. A double porosity material for low frequency sound absorption. Compos. Struct. 2020, 239, 111978. [Google Scholar] [CrossRef]
- Allard, J.F. Propagation of Sound in Porous Media, Modelling Sound Absorbing Materials; Elsevier Applied Science: London, UK, 1993. [Google Scholar]
- Everest, F.A.; Pohlmann, K.C. Master Handbook of Acoustics, 5th ed.; McGraw-Hill/TAB Electronics: New York, NY, USA, 2009. [Google Scholar]
- Memon, H.; Abro, Z.A.; Ahmed, A.; Khoso, N.A. Considerations while designing acoustic home textiles: A review. J. Text. Appar. Technol. Manag. 2015, 9, 3. [Google Scholar]
- Vigran, T.E. Building Acoustics; CRC Press: Trondheim, Norway, 2014. [Google Scholar]
- Champoux, Y.; Allard, J.F. Dynamic tortuosity and bulk modulus in air-saturated porous media. J. Appl. Phys. 1991, 70, 1975–1979. [Google Scholar] [CrossRef]
- Barburski, M.; Blaszczak, J.R.; Pawliczak, Z. Influence of designs of weaves on acoustic attenuation of fabrics. J. Ind. Text. 2019, 49, 33–45. [Google Scholar] [CrossRef]
- Samuel, B.T.; Barburski, M.; Blaszczak, J.R.; Witczak, E.; Abramczyk, K. The Influence of Yarn and Weave Structures on Acoustic Materials and the Effect of Different Acoustic Signal Incidence Angles on Woven Fabric Absorption Possibilities. Materials 2021, 14, 2814. [Google Scholar] [CrossRef] [PubMed]
- Tang, X.; Yan, X. Multi-layer fibrous structures for noise reduction. J. Text. Inst. 2017, 108, 2096–2106. [Google Scholar] [CrossRef]
- Pieren, R. Sound absorption modeling of thin woven fabrics backed by an air cavity. Text. Res. J. 2012, 82, 864–874. [Google Scholar] [CrossRef]
- Segura Alcaraz, M.P.; Bonet-Aracil, M.; Segura Alcaraz, J.G.; Montava Segui, I. Sound absorption of textile material using a microfibers resistive layer. IOP Conf. Ser. Mater. Sci. Eng. 2017, 254, 072022. [Google Scholar] [CrossRef]
- Shoshani, Y.K. Noise absorption by a combination of woven and nonwoven fabrics. J. Text. Inst. 1991, 82, 500–503. [Google Scholar] [CrossRef]
- PN-ISO. Textiles—Fabrics—Determination of linear and Area Mass; PN-ISO 3801:1993; Polish Committee for Standardization: Warsaw, Poland, 1993. [Google Scholar]
- PN EN ISO. Acoustics—Determination of Sound Absorption Coefficient and Impedance in Impedance Tubes—Transfer Function Method; PN-EN ISO 10534-2:2003; Polish Committee for Standardization: Warsaw, Poland, 2003. [Google Scholar]
- DIN ENISO. Geometrical Product Specifications (GPS)—Surface Texture: Profile Method—Terms, Definitions, and Surface Texture Parameters; DIN-ENISO 4287: 2010-07 (ISO 4287: 1997); German Version EN ISO 4287 (1998); German Institute for Standardization: Berlin, Germany, 2010. [Google Scholar]
- PN EN ISO. Textiles—Standard Atmospheres for Conditioning and Testing; PN-EN ISO 139:2006/A1:2012; Polish Committee for Standardization: Warsaw, Poland, 2013. [Google Scholar]
- Su, W.; Li, X.Y.; Liu, S.S. Discussion on feasibility of nonwoven sound-absorbing materials used for road noise-deafening barrier. J. Zhejiang Fashion Inst. Technol. 2009, 2, 8–12. [Google Scholar]
- Liu, Y.; Lyu, L.; Guo, J.; Wang, Y. Sound absorption performance of the poplar seed Fiber/PCL composite materials. Materials 2020, 13, 1465. [Google Scholar] [CrossRef] [PubMed] [Green Version]


| Yarn Type | Weave Type | Sample Code | Warp Density (Threads/cm) | Weft Density (Threads/cm) | Mass Per Unit Area, (g/m2) |
|---|---|---|---|---|---|
| Textured yarn | Plain | TP | 31 ± 0 | 18 ± 0 | 195 ± 1.5 |
| Rib | TR | 38 ± 0 | 17 ± 0 | 224 ± 2.8 | |
| Sateen | TS | 34 ± 0.4 | 20 ± 0.6 | 213 ± 2.1 | |
| Twill | TT | 32 ± 0 | 18 ± 0.6 | 210 ± 4.2 | |
| Staple yarn | Plain | SP | 32 ± 0.2 | 17 ± 0.6 | 213 ± 1.6 |
| Rib | SR | 35 ± 0 | 17 ± 0.5 | 211 ± 1.5 | |
| Sateen | SS | 33 ± 1.1 | 16 ± 0 | 202 ± 0.5 | |
| Twill | ST | 33 ± 0.2 | 18 ± 0 | 210 ± 3.3 | |
| Twisted yarn | Plain | TWP | 31 ± 0 | 17 ± 0.8 | 189 ± 0.75 |
| Rib | TWR | 35 ± 0.1 | 16 ± 0.6 | 203 ± 2 | |
| Sateen | TWS | 35 ± 0 | 17 ± 1 | 195 ± 0.63 | |
| Twill | TWT | 34 ± 0.2 | 20 ± 1 | 197 ± 0.8 |
| Position of Tested Sample Inside the Impedance Tube | |
|---|---|
| Variant I. Woven fabric |  |
| Variant II. Woven fabric + nonwoven |  |
| Variant III. Woven fabric + air gap |  |
| Arrangement and Set of Woven Fabrics | ||
|---|---|---|
| Woven fabric | Double woven fabrics | Triple woven fabrics |
 |  |  |
| Variant I | Variant II | Variant III | |||||||
|---|---|---|---|---|---|---|---|---|---|
| Sample Code | Single Woven Fabric NRC/Reflection % | Double Woven Fabric NRC/Reflection % | Triple Woven Fabric NRC/Reflection % | Single Woven + Nonwoven NRC/Reflection % | Double Woven Fabric + Nonwoven NRC/Reflection % | Triple Woven Fabric + Nonwoven NRC/Reflection % | Single Woven Fabric + Air Gap NRC/Reflection % | Double Woven Fabric + Air Gap NRC/Reflection % | Triple Woven Fabric + Air Gap NRC/Reflection % |
| TP | 0.05/95 | 0.08/92 | 0.08/92 | 0.58/42 | 0.6/40 | 0.57/43 | 0.53/47 | 0.49/51 | 0.48/52 |
| TR | 0.05/95 | 0.05/95 | 0.07/93 | 0.51/49 | 0.59/41 | 0.61/39 | 0.46/54 | 0.51/49 | 0.5/50 |
| TS | 0.05/95 | 0.06/94 | 0.08/92 | 0.48/52 | 0.56/44 | 0.6/40 | 0.42/58 | 0.51/49 | 0.54/46 |
| TT | 0.05/95 | 0.06/94 | 0.08/92 | 0.49/51 | 0.56/44 | 0.6/40 | 0.44/56 | 0.51/49 | 0.52/48 |
| SP | 0.05/95 | 0.05/95 | 0.07/93 | 0.59/41 | 0.59/41 | 0.58/42 | 0.52/48 | 0.5/50 | 0.46/54 |
| SR | 0.05/95 | 0.06/94 | 0.07/93 | 0.44/56 | 0.53/47 | 0.58/42 | 0.36/64 | 0.47/53 | 0.51/49 |
| SS | 0.05/95 | 0.06/94 | 0.08/92 | 0.41/59 | 0.51/49 | 0.55/45 | 0.35/65 | 0.44/56 | 0.49/51 |
| ST | 0.05/95 | 0.06/94 | 0.07/93 | 0.48/52 | 0.56/44 | 0.6/40 | 0.43/57 | 0.49/51 | 0.51/49 |
| TWP | 0.05/95 | 0.06/94 | 0.07/93 | 0.59/41 | 0.57/43 | 0.56/44 | 0.49/51 | 0.5/50 | 0.46/54 |
| TWR | 0.04/96 | 0.06/94 | 0.07/93 | 0.5/50 | 0.58/42 | 0.6/40 | 0.46/54 | 0.5/50 | 0.5/50 |
| TWS | 0.04/96 | 0.05/95 | 0.07/93 | 0.47/53 | 0.56/44 | 0.59/41 | 0.42/58 | 0.5/50 | 0.52/48 |
| TWT | 0.04/96 | 0.06/94 | 0.1/90 | 0.47/53 | 0.54/46 | 0.58/42 | 0.42/58 | 0.49/51 | 0.52/48 |
Publisher’s Note: MDPI stays neutral with regard to jurisdictional claims in published maps and institutional affiliations. |
© 2021 by the authors. Licensee MDPI, Basel, Switzerland. This article is an open access article distributed under the terms and conditions of the Creative Commons Attribution (CC BY) license (https://creativecommons.org/licenses/by/4.0/).
Share and Cite
Samuel, B.T.; Barburski, M.; Witczak, E.; Jasińska, I. The Influence of Physical Properties and Increasing Woven Fabric Layers on the Noise Absorption Capacity. Materials 2021, 14, 6220. https://0-doi-org.brum.beds.ac.uk/10.3390/ma14206220
Samuel BT, Barburski M, Witczak E, Jasińska I. The Influence of Physical Properties and Increasing Woven Fabric Layers on the Noise Absorption Capacity. Materials. 2021; 14(20):6220. https://0-doi-org.brum.beds.ac.uk/10.3390/ma14206220
Chicago/Turabian StyleSamuel, Bethalihem Teferi, Marcin Barburski, Ewa Witczak, and Izabela Jasińska. 2021. "The Influence of Physical Properties and Increasing Woven Fabric Layers on the Noise Absorption Capacity" Materials 14, no. 20: 6220. https://0-doi-org.brum.beds.ac.uk/10.3390/ma14206220