
Reactivity of Binary Construction and Demolition Waste Mix as Supplementary Cementitious Materials

 , , ,
, , ,
Abstract
:1. Introduction
2. Materials and Methods
2.1. Materials
2.2. Methods
2.2.1. Pozzolan Activity Test
2.2.2. Instrumental Techniques
2.2.3. Pozzolanic Reaction Modelling
3. Results
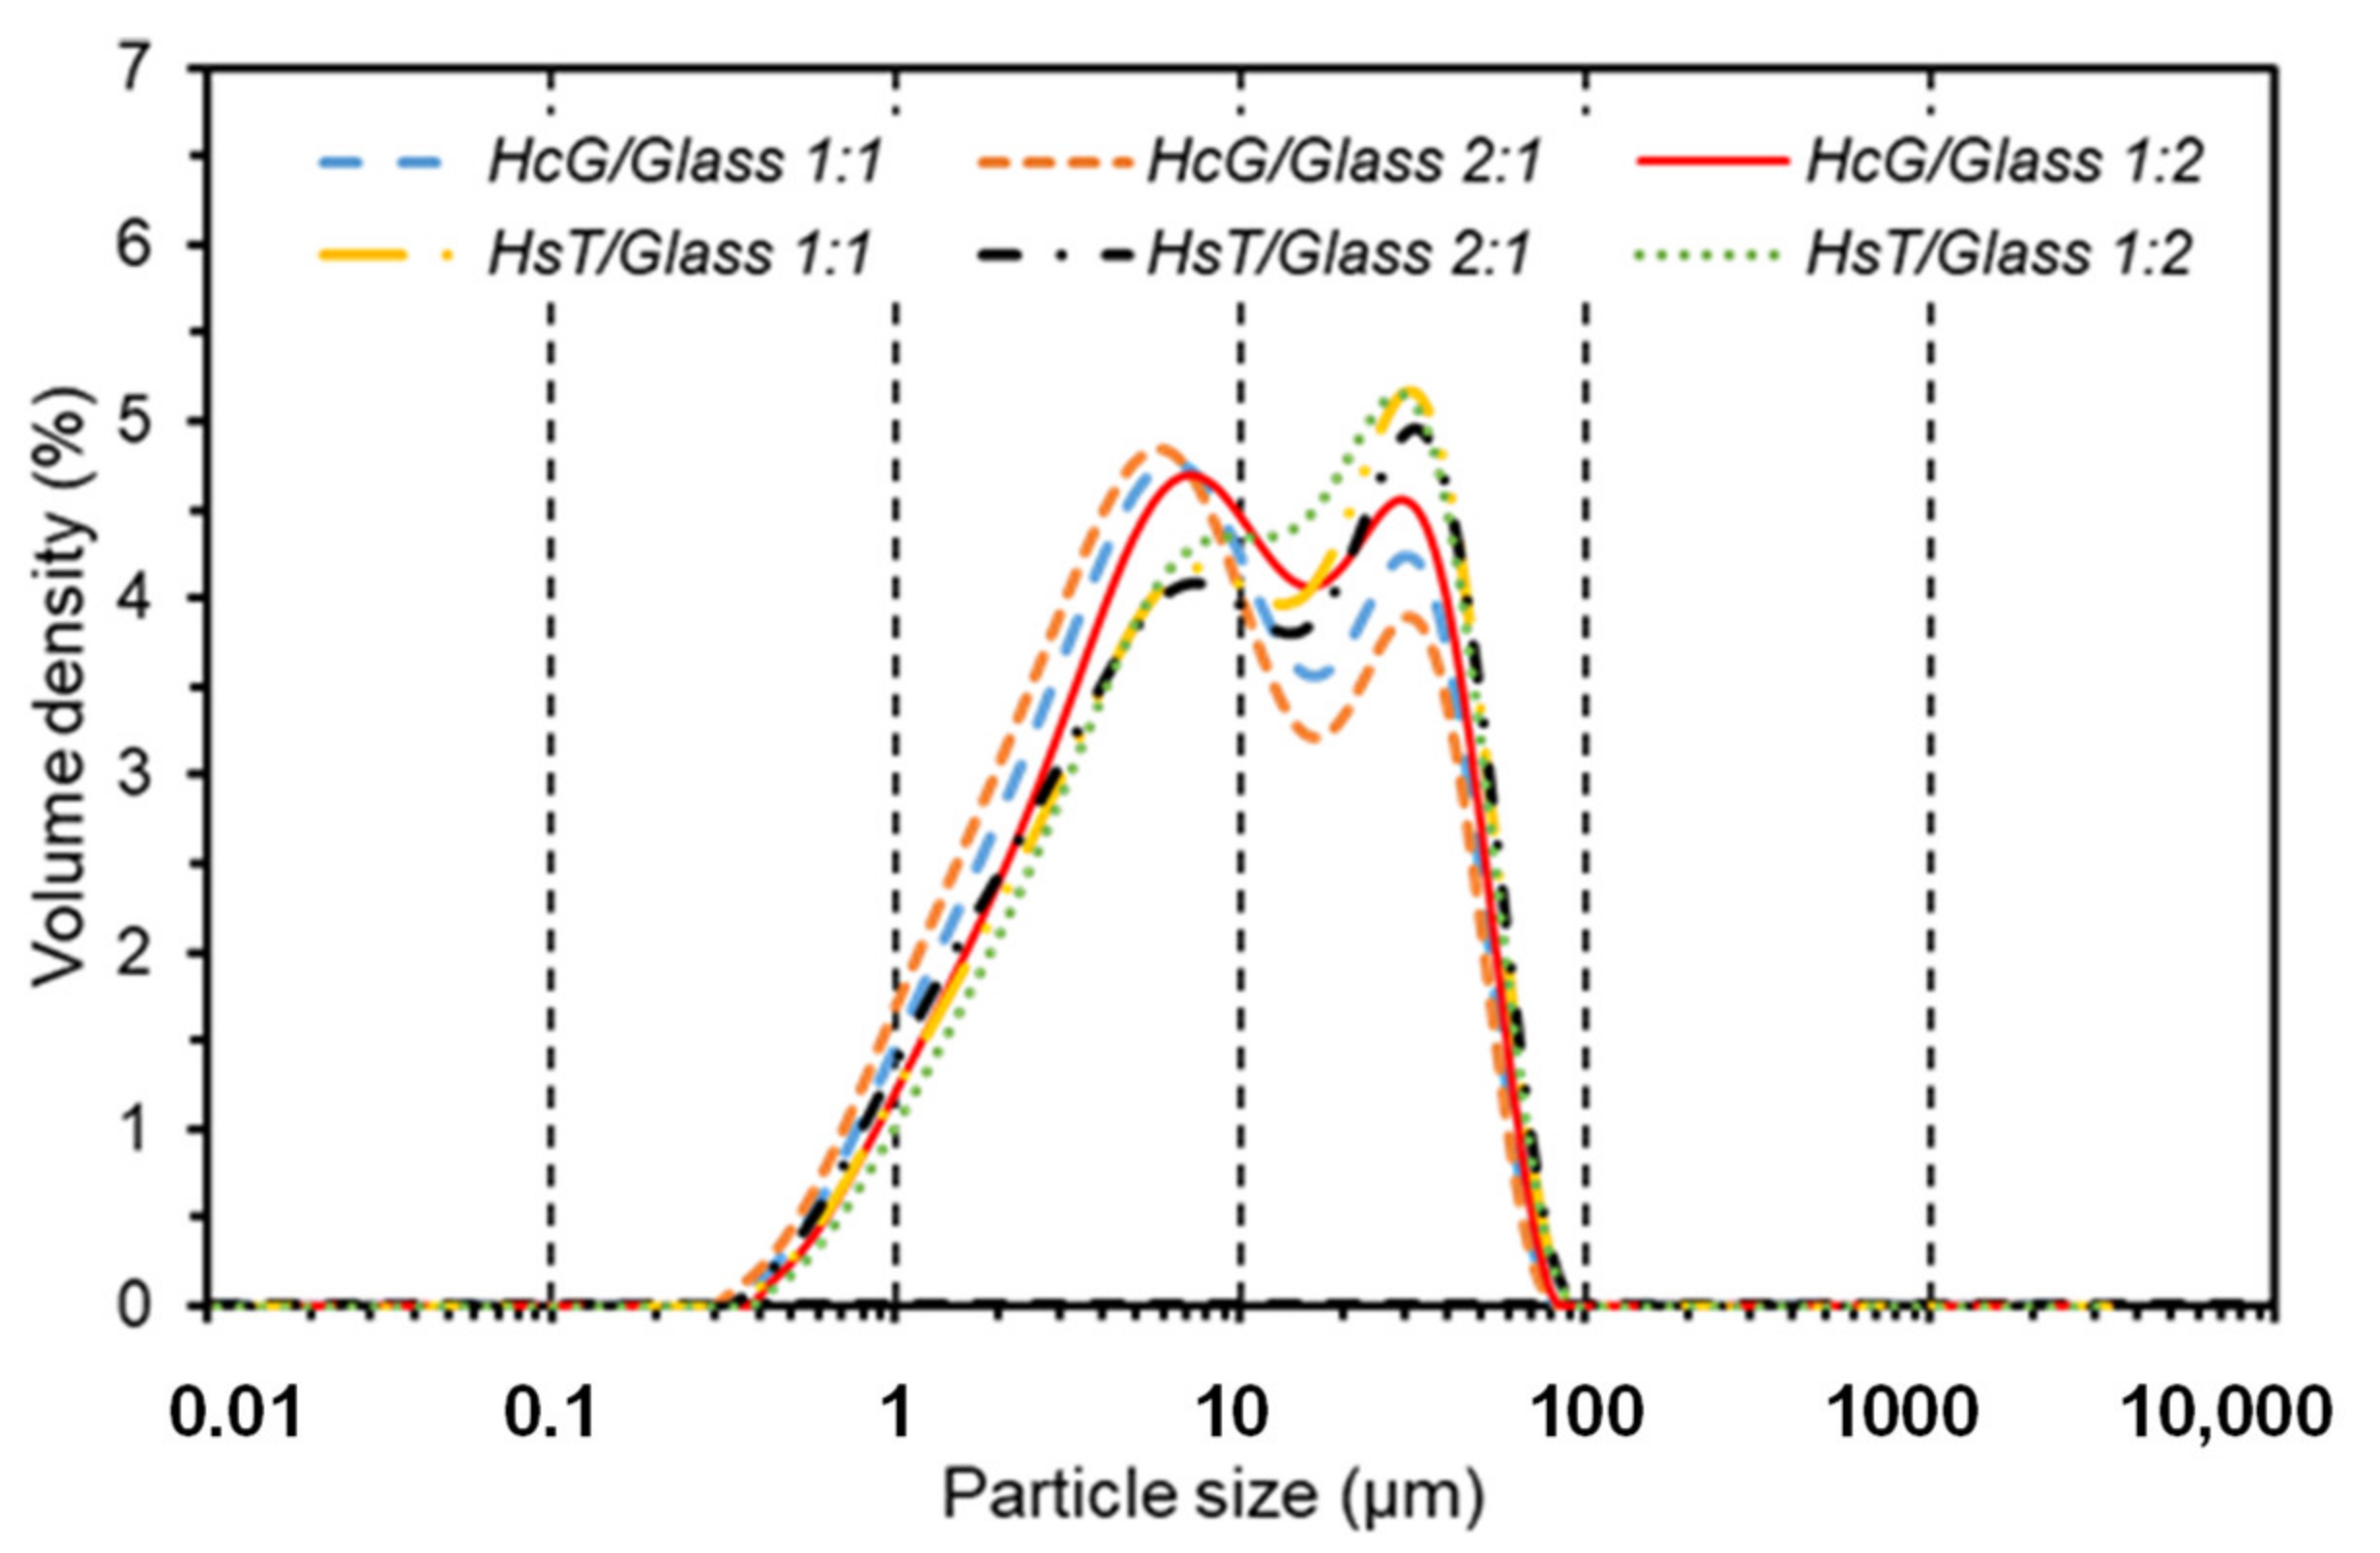
3.1. Granulometric and Chemical Characterization of Blended Pozzolans
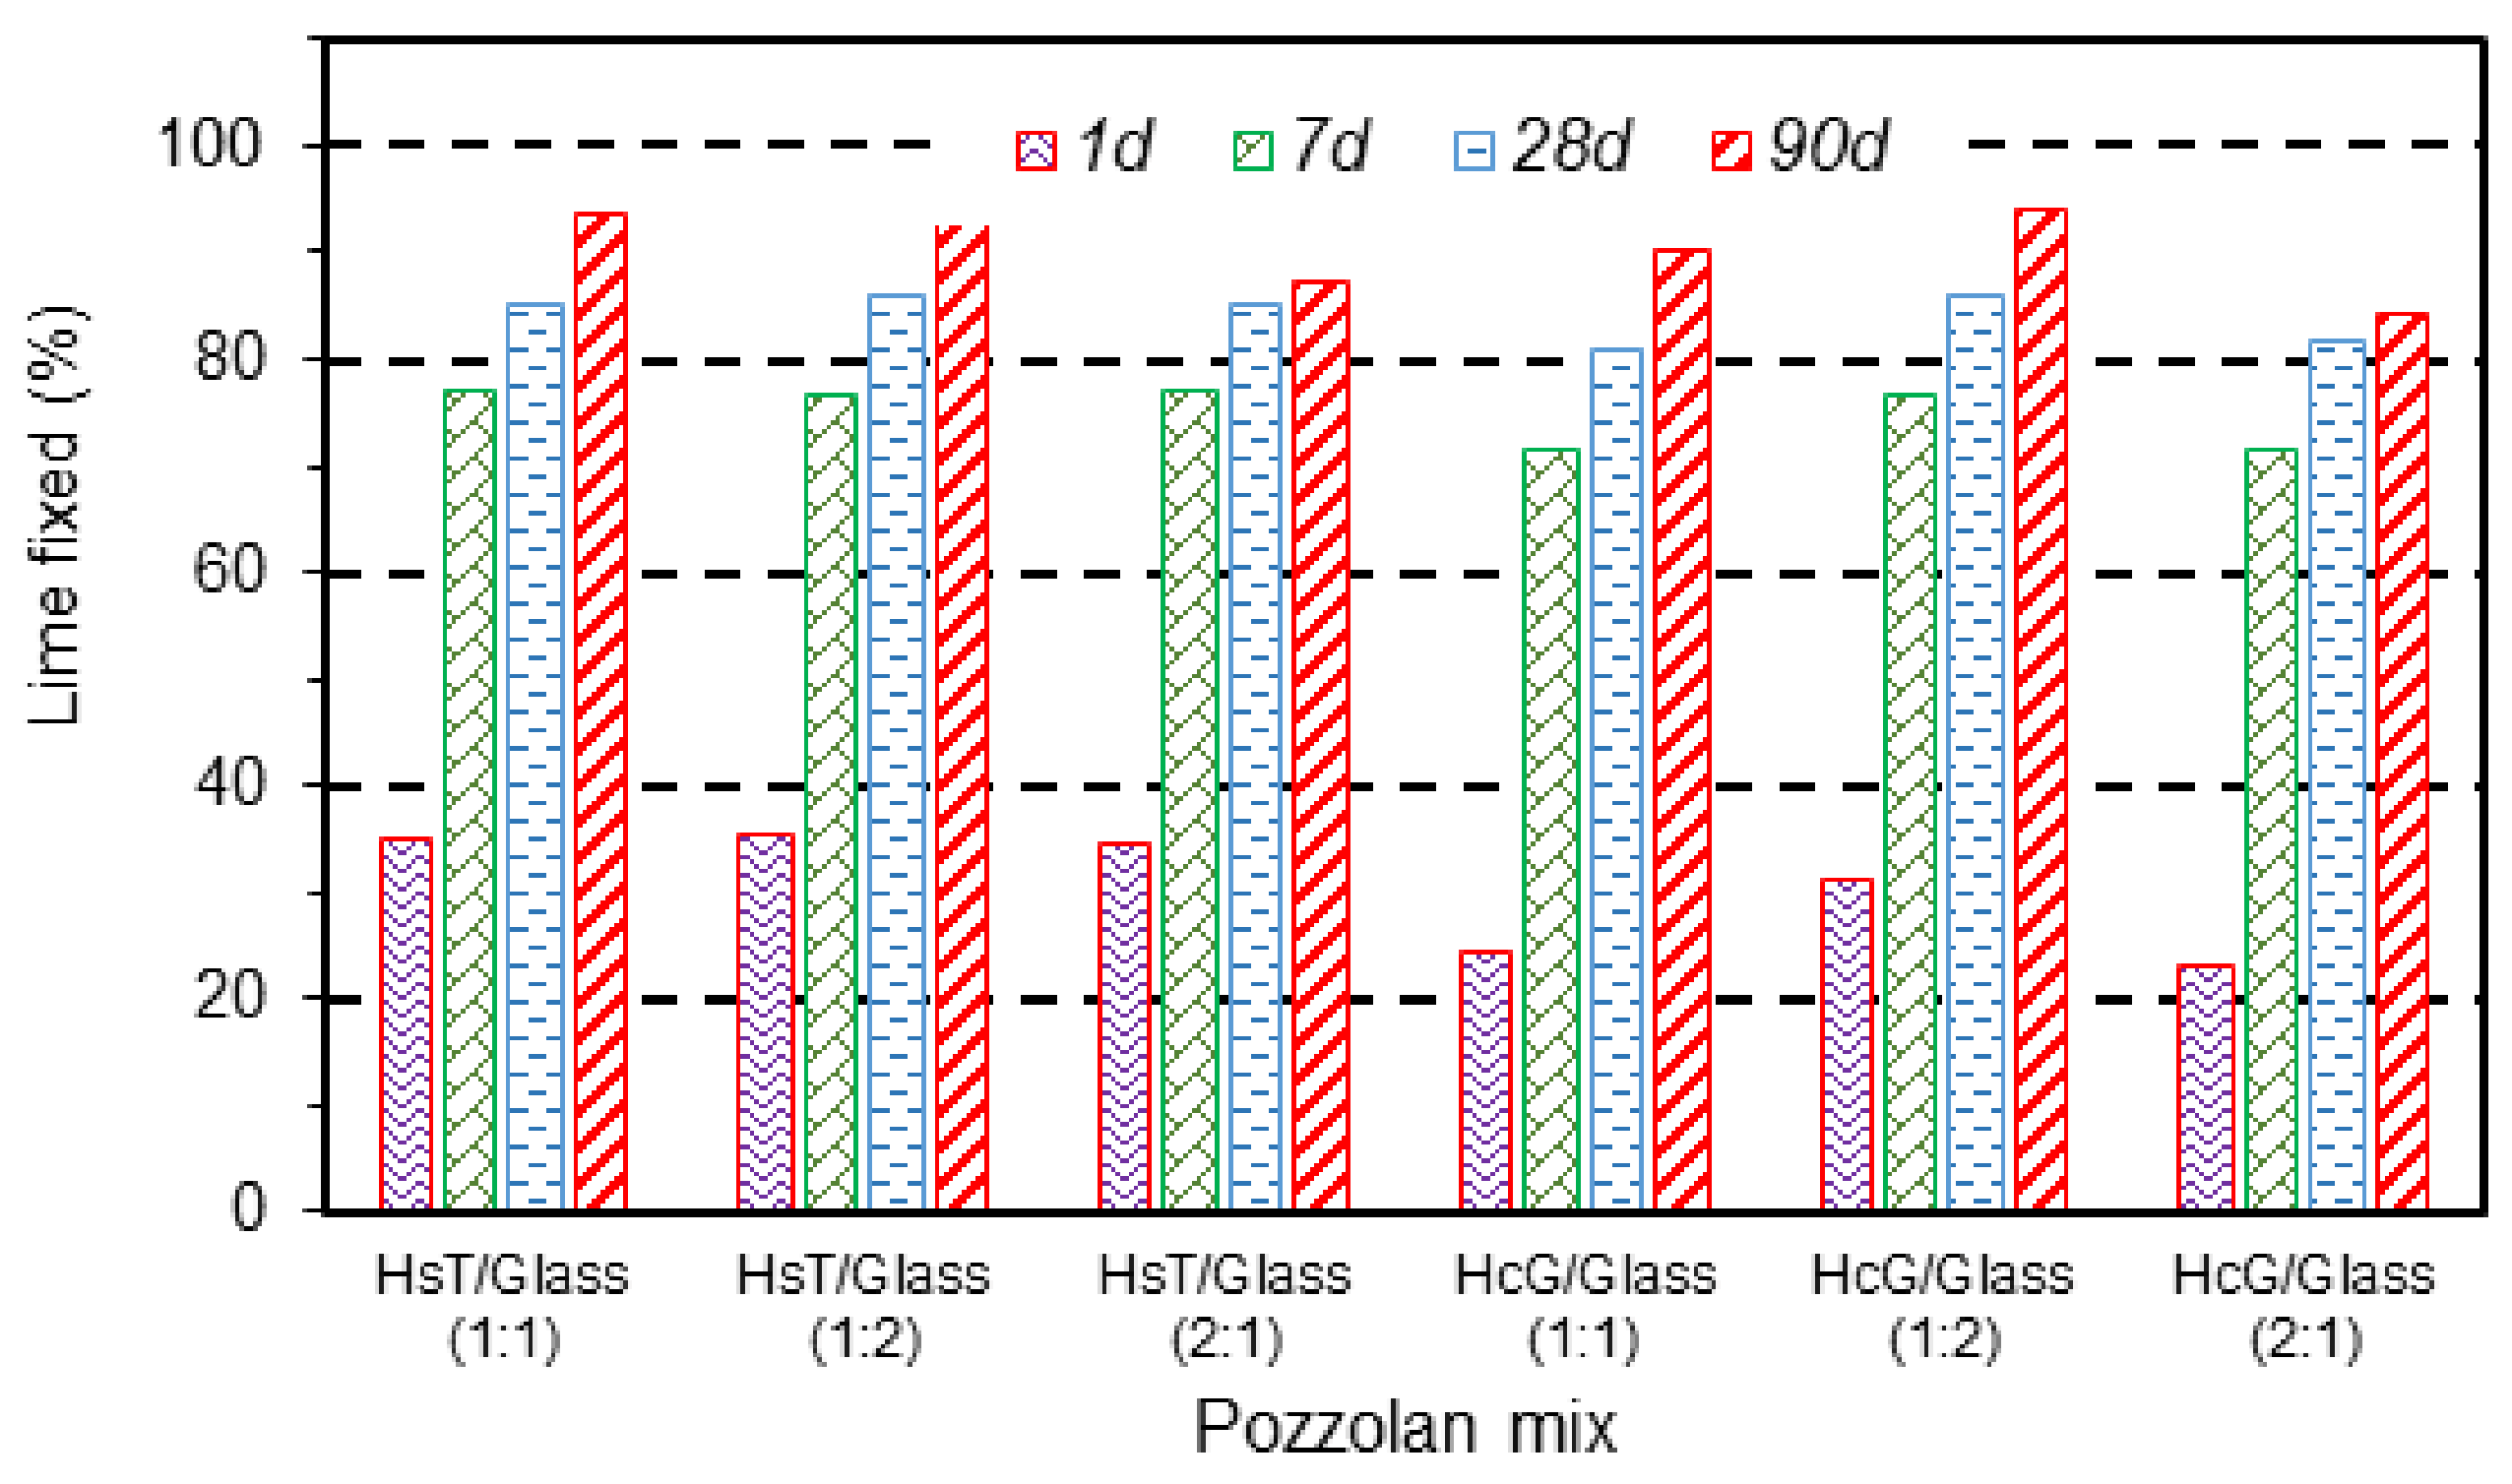
3.2. Evolution of Pozzolanic Activity and Modeling
3.3. XRD Analysis
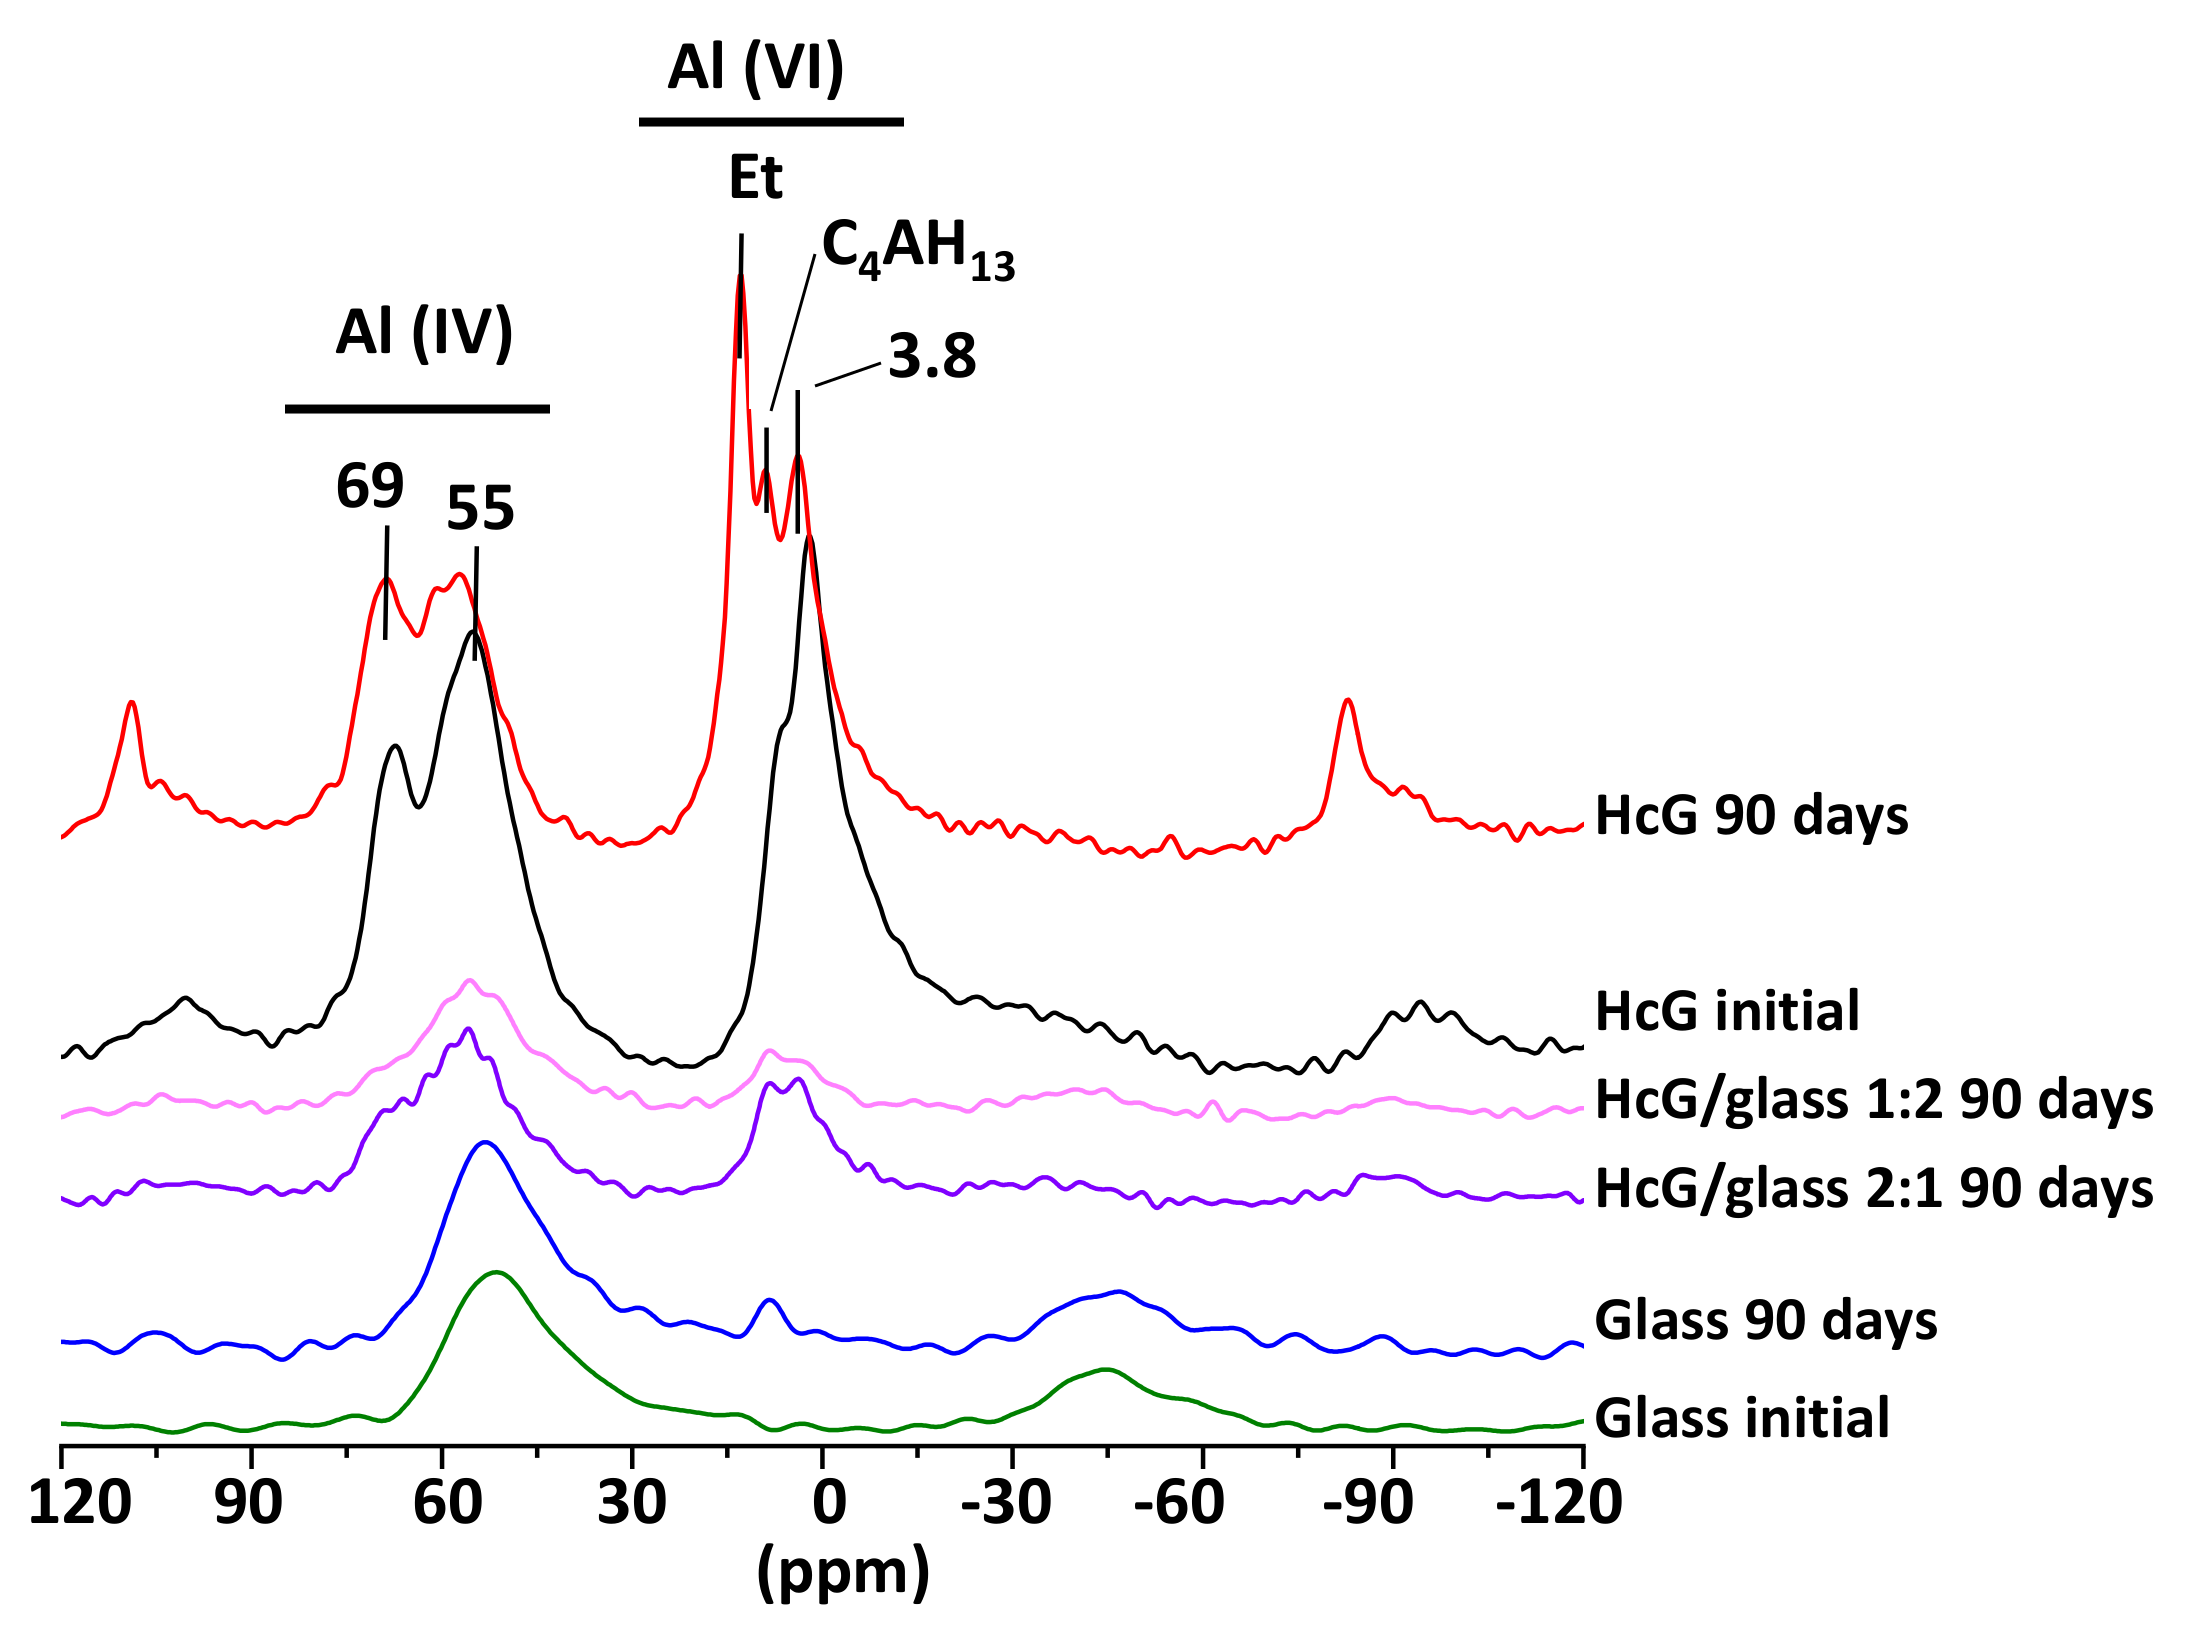
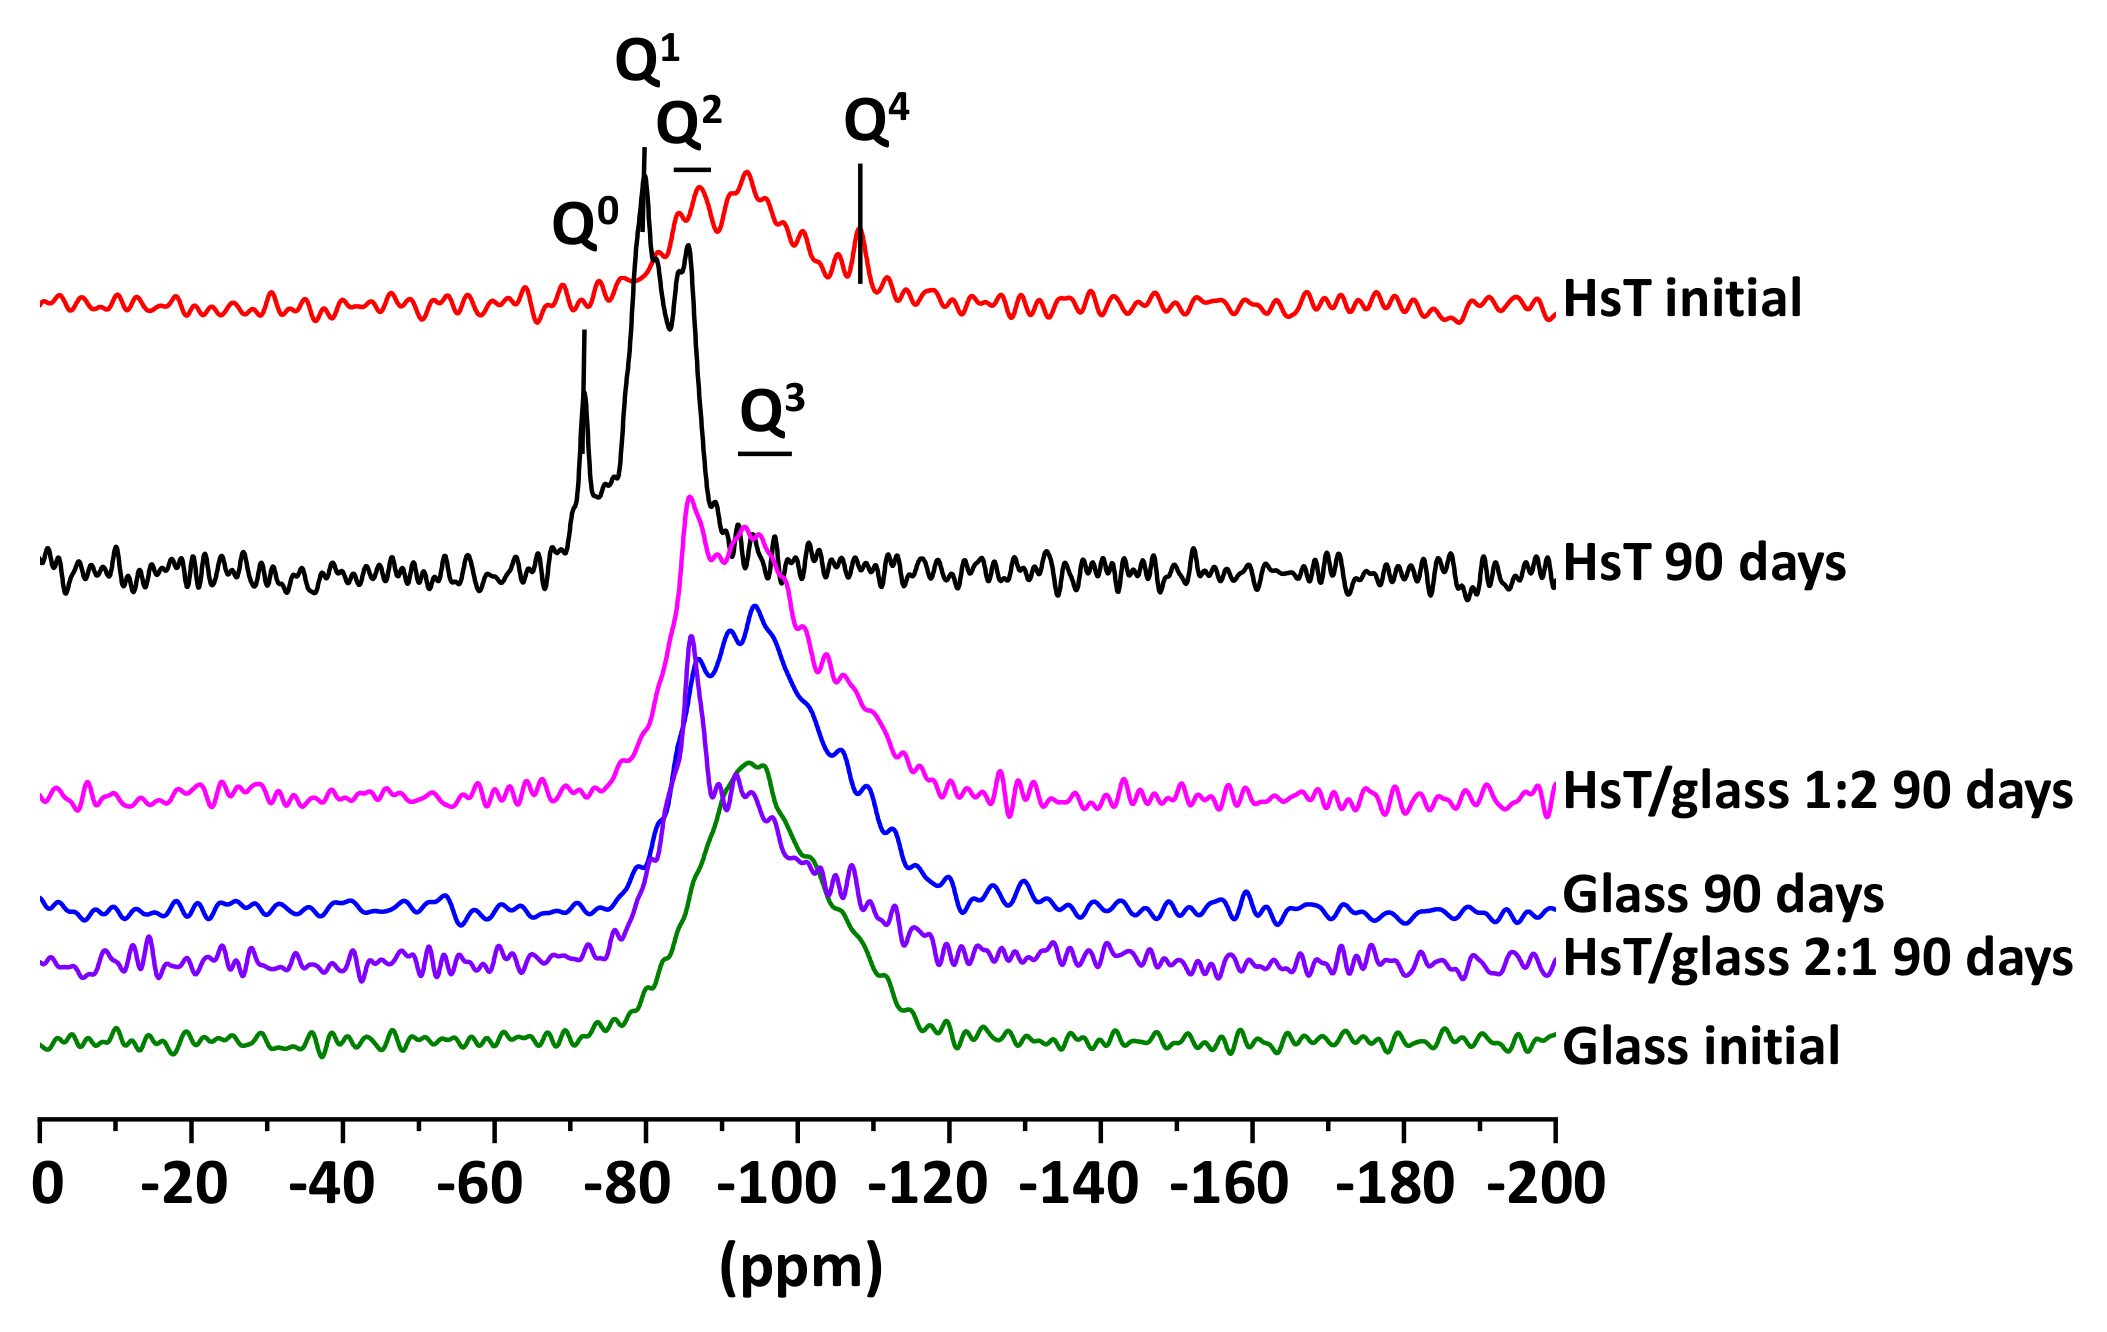
3.4. NMR Analysis
3.5. FT-IR Analysis
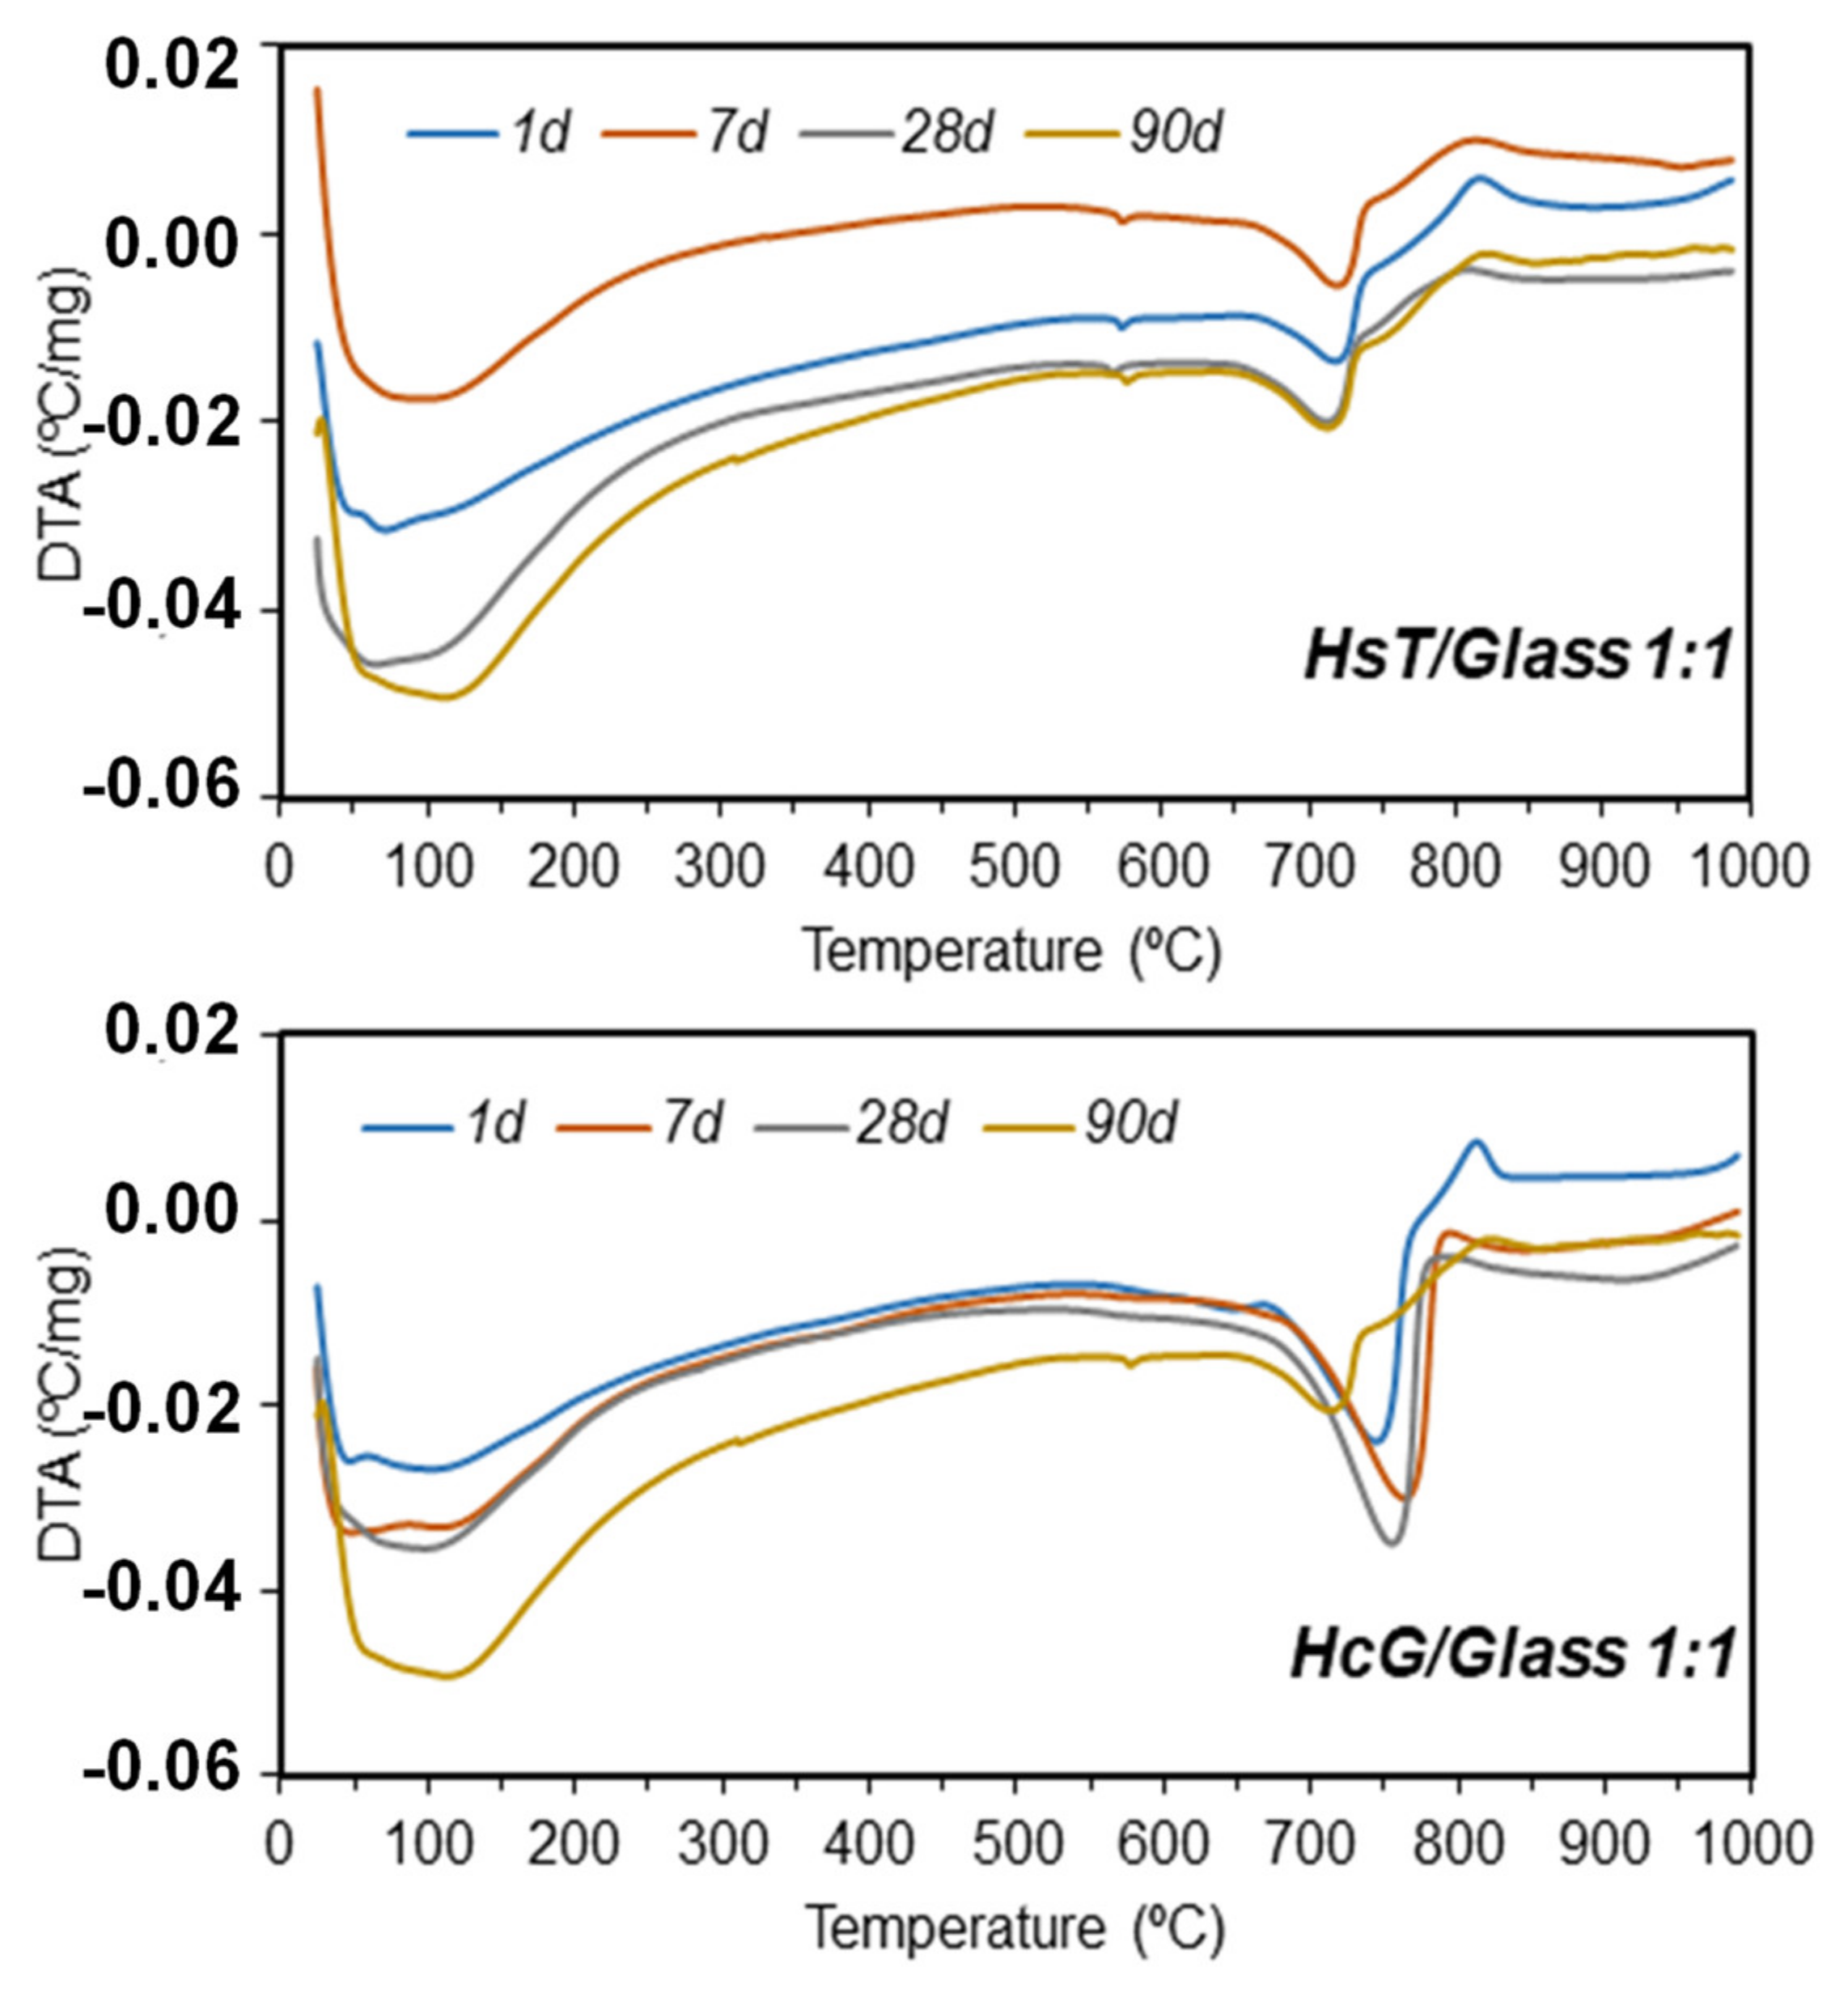
3.6. TG/DTA Analysis
3.7. SEM Analysis
3.8. DSC Analysis
4. Discussion of Results
5. Conclusions
Author Contributions
Funding
Institutional Review Board Statement
Informed Consent Statement
Data Availability Statement
Acknowledgments
Conflicts of Interest
References
- Gardiner, R.; Hajek, P. Municipal waste generation, R&D intensity, and economic growth nexus-A case of EU regions. Waste Manag. 2020, 114, 124–135. [Google Scholar] [PubMed]
- Ghisellini, P.; Ripa, M.; Ulgiati, S. Exploring environmental and economic costs and benefits of a circular economy approach to the construction and demolition sector. A literature review. J. Clean. Prod. 2018, 178, 618–643. [Google Scholar] [CrossRef]
- Tomić, T.; Schneider, D.R. Circular economy in waste management—Socio-economic effect of changes in waste management system structure. J. Environ. Manag. 2020, 267, 110564. [Google Scholar] [CrossRef] [PubMed]
- Rakhshan, K.; Morel, J.C.; Daneshkhah, A. A probabilistic predictive model for assessing the economic reusability of load-bearing building components: Developing a Circular Economy framework. Sust. Prod. Consump. 2021, 27, 630–642. [Google Scholar]
- Ministerio de Fomento. Spanish Building Instruction EHE-08. In Instrucción de Hormigón Estructural; Ministerio de Fomento: Madrid, Spain, 2008. [Google Scholar]
- Medina, C.; Zhu, W.; Howind, T.; Frías, M.; De Rojas, M.I.S. Effect of the constituents (asphalt, clay materials, floating particles and fines) of construction and demolition waste on the properties of recycled concretes. Contr. Build. Mater. 2015, 79, 22–23. [Google Scholar] [CrossRef]
- Rathore, P.; Sarmah, S.P. Economic, environmental and social optimization of solid waste management in the context of circular economy. Comput. Ind. Eng. 2020, 145, 106510. [Google Scholar] [CrossRef]
- Medina, C.; Frías, M.; De Rojas, M.I.S.; Thomas, C.; Polanco, J.A. Gas permeability in concrete containing recycled ceramic sanitary ware aggregate. Constr. Build. Mater. 2012, 37, 597–605. [Google Scholar] [CrossRef]
- Del Bosque, I.F.S.; Van den Heede, P.; de Belie, N.; De Rojas, M.I.S.; Medina, C. Carbonation of concrete with construction and demolition waste based recycled aggregates and cement with recycled content. Constr. Build. Mater. 2020, 234, 117336. [Google Scholar] [CrossRef]
- Moreno, J.; Vegas, I.; Gebremariam, A.T.; García, V. Treatment of end-of-life concrete in an innovative heating-air classification system for circular cement-based products. J. Clean. Prod. 2020, 263, 121515. [Google Scholar] [CrossRef]
- Plaza, P.; del Bosque, I.F.S.; Frías, M.; De Rojas, M.I.S.; Medina, C. Use of recycled coarse and fine aggregates in structural eco-concretes. Physical and mechanical properties and CO2 emissions. Constr. Build. Mater. 2021, 285, 122926. [Google Scholar] [CrossRef]
- Pade, C.; Guimaraes, M. The CO2 uptake of concrete in a 100 year perspective. Cem. Concr. Res. 2007, 37, 1348–1356. [Google Scholar] [CrossRef]
- Kim, Y.J.; Choi, Y.W. Utilization of waste concrete powder as a substitution material for cement. Constr. Build. Mater. 2012, 30, 500–504. [Google Scholar] [CrossRef]
- Asensio, E.; Medina, C.; Frías, M.; de Rojas, M.I.S. Fired clay based construction and demolition in cements. Design of new eco-efficient cements. J. Clean. Prod. 2020, 265, 121610. [Google Scholar] [CrossRef]
- Gebremariam, A.T.; Vahidi, A.; Di Maio, F.; Moreno-Juez, J.; Vegas-Ramiro, I.; Lagosz, A.; Mróz, R. Comprehensive study on the most sustainable concrete design made of recycled concrete, glass and mineral wool from C&D wastes. Constr. Build. Mater. 2021, 273, 121697. [Google Scholar]
- Frías, M.; Vigil de la Villa, R.; Martínez-Ramírez, S.; Fernández-Carrasco, L.; Villar-Cociña, E.; García-Giménez, R. Multi-Technique characterization of a fine fraction of CDW and assessment of reactivity in a CDW/Lime system. Minerals 2020, 10, 590. [Google Scholar] [CrossRef]
- Caneda, L.; Monasterio, M.; Moreno, J.; Martínez, S.; García, R.; Frías, M. Behaviour and properties of eco-cement pastes elaborated with recycled concrete powder from construction and demolition wastes. Materials 2021, 14, 1299. [Google Scholar] [CrossRef]
- Moreno, J.; Vegas, I.; Frías, M.; Vigil, R.; Guede, E. Laboratory scale study and semi-industrial validation of viability of inorganic CDW fine fractions as SCMs in blended cements. Constr. Build. Mater. 2021, 271, 121823. [Google Scholar] [CrossRef]
- Snellings, R.; Mertens, G.; Elsen, J. Supplementary cementitious Materials. Rev. Mineral. Geochem. 2012, 74, 211–278. [Google Scholar] [CrossRef]
- Goñi, S.; Frías, M.; Vegas, I.; García, R.; Vigil, R. Quantitative correlations among textural characteristics of CSH gel and mechanical properties: Case of ternary Portland cements containing activated paper sludge and Fly ash. Cem. Concr. Comp. 2012, 34, 911–916. [Google Scholar] [CrossRef]
- Maier, M.; Beuntner, N.; Thienel, K.C. Mineralogical characterization and reactivity test of common clays suitable as supplementary cementitious material. Appl. Clay Sci. 2021, 202, 105990. [Google Scholar] [CrossRef]
- EN-191-1. Cement—Part 1. Composition, Specifications and Conformity Criteria for Common Cements. 2011. Available online: www.ecovidrio.es (accessed on 14 April 2021).
- Shi, C.; Zheng, K. A review on the use of waste glasses in the production of cement and concrete. Resour. Conserv. Recycl. 2007, 52, 234–247. [Google Scholar] [CrossRef]
- Khmiri, A.; Chaaboumi, M.; Samet, B. Chemical behaviour of ground waste glass when used as partial cement replacement in mortars. Constr. Build. Mater. 2013, 44, 74–80. [Google Scholar] [CrossRef]
- Zheng, K. Pozzolanic reaction of glass powder and its role in controlling alkali–silica reaction. Cem. Concr. Comp. 2016, 67, 30–38. [Google Scholar] [CrossRef]
- Alhasanat, M.B.A.; Al Qadi, A.N.; Al-Thyabat, S.; Haddad, M.; Nofal, B.G. Addition of waste glass to self-compacted concrete: Critical review. Modern Appl. Sci. 2016, 10, 2009–2010. [Google Scholar] [CrossRef]
- Kiang, H.D.; Tan, H. Properties of high volume glass powder concrete. Cem. Concr. Comp. 2017, 75, 22–29. [Google Scholar]
- Cai, Y.; Xuan, D.; Poon, C.S. Effects of nano-SiO2 and glass powder on mitigating alkali-silica reaction of cement glass mortars. Constr. Build. Mater. 2019, 201, 295–302. [Google Scholar] [CrossRef]
- Shao, Y.; Lefort, T.; Moras, S.; Rodríguez, D. Studies on concrete containing ground waste glass. Cem. Concr. Res. 2000, 30, 91–100. [Google Scholar] [CrossRef]
- Topcu, I.B.; Canbaz, M. Properties of concrete containing waste glass. Cem. Concr. Res. 2004, 34, 267–274. [Google Scholar] [CrossRef]
- Corinaldesi, V.; Gnappi, G.; Moriconi, G.; Montenero, A. Reuse of ground waste glass as aggregate for mortars. Waste Manag. 2005, 25, 197–201. [Google Scholar] [CrossRef]
- Ismail, Z.Z.; Al-Hashmi, E.A. Recycling of waste glass as a partial replacement for fine aggregate in concrete. Waste Manag. 2009, 29, 655–659. [Google Scholar] [CrossRef]
- Idir, R.; Cyr, M.; Tagnit-Hamou, A. Pozzolanic properties of fine and coarse colour mixed glass cullet. Cem. Concr. Comp. 2011, 33, 19–29. [Google Scholar] [CrossRef]
- Penacho, P.; de Brito, J.; Veiga, M.R. Physico-mechanical and performance characterization of mortars incorporating fine glass waste aggregate. Cem. Concr. Comp. 2014, 50, 47–59. [Google Scholar] [CrossRef]
- Jani, Y.; Hogland, W. Waste glass in the production of cement and concrete-A review. J. Environ. Chem. Eng. 2014, 2, 1767–1775. [Google Scholar] [CrossRef]
- Danner, T.; Norden, G.; Justnes, H. Characterisation of calcined raw clays suitable as supplementary cementitious materials. Appl. Clay Sci. 2018, 162, 391–402. [Google Scholar] [CrossRef]
- Liu, G.; Florea, M.V.A.; Brouwers, H.J.H. The hydration and microstructure characteristics of cement pastes with high volume organic-contaminated waste glass powder. Constr. Build. Mater. 2018, 187, 1177–1189. [Google Scholar] [CrossRef]
- Elaqra, H.; Rustom, R. Effect of using glass powder as cement replacement on rheological and mechanical properties of cement paste. Constr. Build. Mater. 2018, 179, 326–335. [Google Scholar] [CrossRef]
- García, R.; Vigil, R.; Martínez-Ramírez, S.; Fernández Carrasco, L.; Frías, M. Influence of ZnO on the activation of kaolinite based coal waste: Pozzolanic activity and mineralogy in the pozzolan/lime system. Appl. Clay Sci. 2018, 156, 202–212. [Google Scholar] [CrossRef] [Green Version]
- Rietveld, H.M. A profile refinement method for nuclear and magnetic structures. J. Appl. Crystallogr. 1969, 2, 65–71. [Google Scholar] [CrossRef]
- Rodríguez-Carvajal, J. Recent advances in magnetic structure determination by neutron powder diffraction. Phys. B 1993, 55, 192–202. [Google Scholar] [CrossRef]
- Young, R.A. (Ed.) The Rietveld Method; International Union of Crystallography: Chester, UK; Oxford University Press: Oxford, UK, 1995. [Google Scholar]
- Villar-Cociña, E.; Valencia-Morales, E.; González-Rodríguez, R.; Hernández-Ruiz, J. Kinetics of the pozzolanic reaction between lime and sugar cane straw ash by electrical conductivity measurement: A kinetic–diffusive model. Cem. Concr. Res. 2003, 33, 517–524. [Google Scholar] [CrossRef]
- Villar-Cociña, E.; Frías, M.; Valencia, E. Sugar cane wastes as pozzolanic materials: Application of mathematic model. ACI Mat. J. 2008, 105, 258–264. [Google Scholar]
- Villar-Cociña, E.; Frías, M.; Hernández-Ruiz, J.; Savastano, H., Jr. Pozzolanic behaviour of a bagasse ash from the boiler of a Cuban sugar factory. Adv. Cem. Res. 2013, 25, 136–142. [Google Scholar] [CrossRef]
- Soria, F. Puzolanas y cementos puzolánicos. Mater. Constr. 1963, 13, 47–59. [Google Scholar] [CrossRef] [Green Version]
- Frías, M.; Rodríguez, O.; Nebreda, B.; García, R.; Villar-Cociña, E. Influence of activation temperature of kaolinite-based clay wastes on pozzolanic activity and kinetic parameters. Adv. Cem. Res. 2010, 22, 135–142. [Google Scholar] [CrossRef]
- Rosell-Lam, M.; Villar-Cociña, E.; Frías, M. Study on the pozzolanic properties of a natural Cuban zeolitic rock by conductimetric method: Kinetic parameters. Constr. Build. Mater. 2011, 25, 644–650. [Google Scholar] [CrossRef]
- Villar-Cociña, E.; Valencia Morales, E.; Santos, S.F.; Savastano, H., Jr.; Frías, M. Pozzolanic behaviour of bamboo leaf ash as active addition: Characterization and determination of the kinetic parameters. Cem. Concr. Comp. 2011, 33, 68–73. [Google Scholar] [CrossRef]
- Quintana, E.; Villar-Cociña, E. A kinetic study about the pozzolanic reactivity of loessic soils by conductometric methods: Kinetic parameters. Adv. Cem. Res. 2011, 23, 3–10. [Google Scholar] [CrossRef]
- García, R.; Vigil de la Villa, R.; Frías, M.; Rodríguez, O.; Martínez-Ramírez, S.; Fernández-Carrasco, L.; de Soto, I.S.; Villar-Cociña, E. Mineralogical study of calcined coal waste in a pozzolan/Ca (OH)2 system. Appl. Clay Sci. 2015, 108, 45–54. [Google Scholar] [CrossRef]
- Villar-Cociña, E.; Rodier, L.; Savastano, H., Jr.; Lefrán, M.; Frías, M. A comparative study on the pozzolanic activity between bamboo leaves ash and silica fume: Kinetic parameters. Waste Biomass Valor. 2020, 11, 1627–1634. [Google Scholar] [CrossRef]
- Ashraf, W.; Olek, J. Carbonation behavior of hydraulic and non-hydraulic calcium silicates: Potential of utilizing low-lime calcium silicates in cement-based materials. J. Mater. Sci. 2016, 51, 6173–6191. [Google Scholar] [CrossRef]
- Yu, P.; Kirkpatrick, R.I.; Poe, B.; McMillan, P.F.; Cong, X. Structure of calcium silicate hydrate (C–S–H); near-mid-and far infrared spectroscopy. J. Am. Ceram. Soc. 1999, 82, 742–748. [Google Scholar] [CrossRef]
- Fernández-Carrasco, L.; Torrens-Martín, D.; Morales, L.M.; Martínez-Ramírez, S. Infrared spectroscopy in the analysis of building and construction materials. In Infrared Spectroscopy: Materials Science, Engineering and Technology; IntechOpen: Athens, Greece, 2012; pp. 369–382. [Google Scholar]
- Tran, T.H.; Kato, K.; Wada, K.; Fujioka, K.; Matsuzaki, H. Processes involved in calcite and aragonite precipitation during carbonate chimney formation on Conical Seamount, Mariana Forearc: Evidence from geochemistry and carbon, oxygen, and strontium isotopes. J. Geochem. Expl. 2014, 137, 55–64. [Google Scholar] [CrossRef]
- Rossi, C.; Lozano, R.P. Hydrochemical controls on aragonite versus calcite precipitation in cave dripwaters. Geochm. Cosmochi. Act. 2016, 192, 70–96. [Google Scholar] [CrossRef]
- Rahhal, V.; Talero, R. Calorimetry of Portland cement with silica fume, diatomite and quartz additions. Constr. Build. Mater. 2009, 23, 3367–3374. [Google Scholar] [CrossRef]
- De la Villa, R.V.; Frías, M.; García-Giménez, R.; Martínez-Ramírez, S.; Fernández-Carrasco, L. Chemical and mineral transformations that occur in mine waste and washery rejects during pre-utilization calcination. Int. J. Coal Geol. 2014, 132, 123–130. [Google Scholar] [CrossRef]
- Qoku, E.; Bier, T.A.; Westphal, T. Phase assemblage in ettringite-forming cement pastes: A X-ray diffraction and thermal analysis characterization. J. Build. Eng. 2017, 12, 37–50. [Google Scholar] [CrossRef]
- Irbe, L.; Beddoe, R.E. The role of aluminium in C-A-S-H during sulfate attack on concrete. Cem. Concr. Res. 2019, 116, 71–80. [Google Scholar] [CrossRef]
- De la Villa, R.V.; Frías, M.; de Rojas, M.I.S.; Vegas, I.; García, R. Mineralogical and morphological changes of calcined paper sludge at different temperatures and retention in furnace. Appli. Clay Sci. 2007, 36, 279–286. [Google Scholar] [CrossRef]


| Oxides (%) | HsT/Glass 1:1 | HsT/Glass 1:2 | HsT/Glass 2:1 | HcG/Glass 1:1 | HcG/Glass 1:2 | HcG/Glass 2:1 |
|---|---|---|---|---|---|---|
| SiO2 | 60.14 | 62.89 | 56.18 | 39.82 | 49.48 | 29.36 |
| Al2O3 | 5.03 | 3.67 | 6.28 | 1.98 | 1.66 | 2.25 |
| CaO | 14.15 | 12.52 | 15.49 | 29.98 | 22.97 | 36.39 |
| Fe2O3 | 1.61 | 1.37 | 1.82 | 1.06 | 1.01 | 1.10 |
| MgO | 2.51 | 2.86 | 2.11 | 2.38 | 2.77 | 1.94 |
| SO3 | 1.39 | 0.99 | 1.75 | 0.55 | 0.44 | 0.64 |
| Na2O | 7.03 | 9.02 | 4.90 | 6.72 | 8.81 | 4.50 |
| K2O | 1.81 | 1.28 | 2.30 | 0.37 | 0.33 | 0.40 |
| P2O5 | n.d. | n.d. | n.d. | n.d. | n.d. | n.d. |
| TiO2 | 0.18 | 0.14 | 0.21 | 0.11 | 0.09 | 0.12 |
| MnO | 0.03 | 0.02 | 0.03 | 0.05 | 0.04 | 0.06 |
| LOI | 5.97 | 4.08 | 7.73 | 16.82 | 11.24 | 22.05 |
| (µm) | HcG/Glass 1:1 | HcG/Glass 2:1 | HcG/Glass 1:2 | HsT/Glass 1:1 | HsT/Glass 2:1 | HsT/Glass 1:2 |
|---|---|---|---|---|---|---|
| D10 | 1.57 | 1.41 | 1.81 | 1.80 | 10.60 | 41.00 |
| D50 | 7.77 | 6.82 | 9.11 | 1.65 | 9.99 | 41.60 |
| D90 | 36.1 | 34.6 | 37.7 | 2.03 | 11.20 | 40.50 |
| Blended Pozzolan | τ (h) | K (h−1) | Ccorr | R2 |
|---|---|---|---|---|
| HsT/glass 1:1 | 74.1 ± 5.2 | (3.32 ± 0.13). 10−3 | 1.40 ± 0.52 | 0.9781 |
| HsT/glass 1:2 | 66.8 ± 1.0 | (4.38 ± 0.70). 10−3 | 1.26 ± 0.56 | 0.9743 |
| HsT/glass 2:1 | 59.9 ± 5.1 | (3.29 ± 0.67). 10−3 | 2.23 ± 0.12 | 0.9903 |
| HcG/glass 1:1 | 89.2 ± 3.3 | (1.72 ± 0.47). 10−3 | 1.96 ± 0.14 | 0.9849 |
| HcG/glass 1:2 | 74.0 ± 1.8 | (3.46 ± 0.24). 10−3 | 1.33 ± 0.27 | 0.9827 |
| HcG/glass 2:1 | 79.1 ± 8.0 | (1.69 ± 0.12). 10−3 | 2.58 ± 0.28 | 0.9929 |
| HsT | 87.7 ± 8.4 | (6.58 ± 0.98). 10−4 | 5.68 ± 0.83 | 0.8943 |
| HcG | 140 ± 15.2 | (1.18 ± 0.12). 10−4 | 12.52 ± 0.4 | 0.8765 |
| Glass | 57.1 ± 0.2 | (1.14 ± 0.23). 10−2 | 0.48 ± 0.2 | 0.9970 |
| ACMW | 37.5 ± 3.5 | (6.05 ± 0.80). 10−3 | 3.11 ± 0.43 | 0.9720 |
| SCBA | 33.2 ± 3.6 | (5.35 ± 0.66). 10−3 | 0.04 ± 0.02 | 0.9946 |
| BLAsh | 4.3 ± 0.1 | (4.78 ± 0.09). 10−1 | 0.22 ± 0.01 | 0.9942 |
| SF | 4.1 ± 0.2 | (5.11 ± 0.08). 10−1 | 0.17 ± 0.01 | 0.9934 |
| PS | 34.8 ± 3.4 | (8.69 ± 0.94). 10−3 | 2.39 ± 0.51 | 0.9722 |
| Zeolite | 78.1 ±1.6 | (6.88 ± 0.24). 10−3 | 0.02 ± 0.01 | 0.9996 |
| Mixture | Time (Days) | M (%) | Q (%) | F (%) | Cal (%) | A.M. (%) | RB | χ2 |
|---|---|---|---|---|---|---|---|---|
| HcG/ glass 1:1 | Initial | 5 | 5 | 5 | 26 | 59 | 23.5 | 6.6 |
| 1 | 2 | 2 | 2 | 65 | 29 | 21.2 | 6.5 | |
| 7 | 2 | 2 | 2 | 73 | 21 | 22.1 | 7.0 | |
| 28 | tra | 2 | tra | 78 | 20 | 21.3 | 6.8 | |
| 90 | tra | tra | tra | 69 | 31 | 19.2 | 5.4 | |
| HcG/ glass 1:2 | Initial | 3 | 3 | 4 | 18 | 72 | 17.5 | 6.6 |
| 1 | tra | 2 | 3 | 32 | 63 | 20.2 | 5.8 | |
| 7 | tra | tra | tra | 58 | 42 | 21.1 | 6.3 | |
| 28 | tra | tra | tra | 67 | 33 | 19.6 | 5.5 | |
| 90 | tra | tra | tra | 69 | 31 | 18.7 | 6.5 | |
| HcG/ glass 2:1 | Initial | 7 | 7 | 7 | 35 | 44 | 16.8 | 5.4 |
| 1 | 2 | 2 | tra | 67 | 29 | 18.4 | 6.2 | |
| 7 | tra | 2 | tra | 61 | 37 | 15.2 | 5.5 | |
| 28 | tra | tra | tra | 57 | 43 | 17.7 | 6.9 | |
| 90 | tra | tra | tra | 51 | 49 | 19.1 | 7.3 | |
| HsT/ glass 1:1 | Initial | 2 | 24 | 4 | 12 | 58 | 19.5 | 7.5 |
| 1 | tra | 24 | 2 | 19 | 55 | 17.4 | 5.6 | |
| 7 | tra | 22 | 2 | 23 | 53 | 18.9 | 6.0 | |
| 28 | tra | 21 | tra | 38 | 41 | 14.7 | 5.2 | |
| 90 | tra | 18 | tra | 49 | 33 | 16.5 | 6.6 | |
| HsT/ glass 1:2 | Initial | 1 | 16 | 3 | 8 | 72 | 22.0 | 8.3 |
| 1 | tra | 16 | tra | 21 | 63 | 32.2 | 9.7 | |
| 7 | tra | 14 | tra | 25 | 61 | 20.4 | 7.2 | |
| 28 | tra | 13 | tra | 40 | 47 | 16.7 | 5.6 | |
| 90 | tra | 11 | tra | 44 | 45 | 15.5 | 4.5 | |
| HsT/ glass 2:1 | Initial | 3 | 32 | 5 | 16 | 44 | 17.3 | 7.0 |
| 1 | tra | 32 | 4 | 25 | 39 | 18.2 | 8.5 | |
| 7 | tra | 32 | 4 | 27 | 37 | 19.1 | 6.4 | |
| 28 | tra | 31 | 3 | 37 | 29 | 17.6 | 5.6 | |
| 90 | tra | 29 | 3 | 40 | 28 | 16.2 | 5.5 |
| HsT/Glass | |||
|---|---|---|---|
| 1:1 | 2:1 | 1:2 | |
| 1 day | 1.89 | 2.45 | 1.49 |
| 7 days | 3.68 | 3.56 | 2.98 |
| 28 days | 4.02 | 4.00 | 3.63 |
| 90 days | 4.40 | 4.02 | 4.51 |
| HcG/glass | |||
| 1 day | 1.92 | 2.04 | 1.65 |
| 7 days | 3.34 | 3.33 | 3.33 |
| 28 days | 3.93 | 3.75 | 3.87 |
| 90 days | 4.14 | 4.19 | 4.08 |
Publisher’s Note: MDPI stays neutral with regard to jurisdictional claims in published maps and institutional affiliations. |
© 2021 by the authors. Licensee MDPI, Basel, Switzerland. This article is an open access article distributed under the terms and conditions of the Creative Commons Attribution (CC BY) license (https://creativecommons.org/licenses/by/4.0/).
Share and Cite
Mencía, R.V.d.l.V.; Rojas, M.F.; Martínez-Ramírez, S.; Fernández-Carrasco, L.; Cociña, E.V.; García-Giménez, R. Reactivity of Binary Construction and Demolition Waste Mix as Supplementary Cementitious Materials. Materials 2021, 14, 6481. https://0-doi-org.brum.beds.ac.uk/10.3390/ma14216481
Mencía RVdlV, Rojas MF, Martínez-Ramírez S, Fernández-Carrasco L, Cociña EV, García-Giménez R. Reactivity of Binary Construction and Demolition Waste Mix as Supplementary Cementitious Materials. Materials. 2021; 14(21):6481. https://0-doi-org.brum.beds.ac.uk/10.3390/ma14216481
Chicago/Turabian StyleMencía, Raquel Vigil de la Villa, Moisés Frías Rojas, Sagrario Martínez-Ramírez, Lucía Fernández-Carrasco, Ernesto Villar Cociña, and Rosario García-Giménez. 2021. "Reactivity of Binary Construction and Demolition Waste Mix as Supplementary Cementitious Materials" Materials 14, no. 21: 6481. https://0-doi-org.brum.beds.ac.uk/10.3390/ma14216481