
Effect of Ground Granulated Blast Furnace Slag Replacement Ratio on Structural Performance of Precast Concrete Beams


1
Department of Architectural Engineering, Kongju National University, 1223-24, Cheonandaero, Seobuk, Cheonan 31080, Korea
2
Department of Architectural Engineering & Urban Systems Engineering, Kongju National University, 1223-24, Cheonandaero, Seobuk, Cheonan 31080, Korea
*
Author to whom correspondence should be addressed.
Materials 2021, 14(23), 7159; https://0-doi-org.brum.beds.ac.uk/10.3390/ma14237159
Submission received: 18 October 2021
/
Revised: 20 November 2021
/
Accepted: 22 November 2021
/
Published: 24 November 2021
(This article belongs to the Special Issue Concrete Structures with Fiber-Reinforced Cementitious and Composite Materials)
Abstract
:This study was conducted to investigate the effect of ground granulated blast furnace slag on the structural performance of precast concrete beams, evaluating the flexural, shear and bonding performance by using the replacement ratio of the ground granulated blast furnace slag as a variable. The design strength of the concrete was set at 45 MPa in consideration of the characteristics of precast concrete products, and the replacement ratio of the ground granulated blast furnace slag to replace cement was 30 to 70%. The experimental results showed that all specimens had similar behavioral characteristics regardless of the replacement ratio of the ground granulated blast furnace slag. Comparison of the prediction results obtained by ACI 318-19 and EC 2 showed that the mean flexural strength and shear strength were higher than 1.19 and 1.43, respectively, and the mean bond strength was 1.57, satisfying the required performance. Therefore, the experimental results showed that in using the ground granulated blast furnace slag as an admixture for precast concrete, the cement replacement ratio may be increased up to 70% without causing any problems in securing the structural performance. Summarizing the results of the present study, a ground granulated blast furnace slag replacement ratio of 50% or lower may be reasonably applied.
1. Introduction
Since the development of Portland cement in the early 19th century, concrete has been applied to architectural and civil engineering structures as a key structural material because of its simple manufacturing method and excellent durability. And with the advances of the construction industry, many developments and studies have been made to secure the required quality and performance. Various approaches have been proposed to improve concrete quality and performance. In particular, the recycling of industrial byproducts to secure a cement replacement can provide both environmental and economic advantages.
Steel slag, a byproduct from the steel industry, is largely divided according to the production process into blast furnace slag and steel furnace slag. Blast furnace slag, generated from the process of producing pig iron from a blast furnace using iron ore, coke and limestone as raw materials, is further divided into water-cooled slag and air-cooled slag according to the cooling method. The production of blast furnace slag is dependent on the iron-making process, and about 300 kg of blast furnace slag is generally generated when 1 ton of molten steel is produced. Water-cooled slag accounts for about 70–80% of generated blast furnace slag; the rest is air-cooled slag. Blast furnace slag has a chemical composition similar to that of conventional construction materials such as cement and natural aggregate, and its stability allows for recycling into various forms, including cement replacement, admixture, aggregate and bricks [1,2,3,4,5]. As the properties are dependent on the cooling method, water-cooled slag is applied to uses of relatively high added value, such as raw material for cement and admixtures for concrete; however, due to its non-reactivity, air-cooled slag is used as aggregate for roads or aggregate for filling.
According to the results of previous studies, Majhi et al., (2020) [2], Wang and Zhi (2003) [6], Macphee and Cao (1993) [7], Ramezanianpour (2014) [8], Rashad (2018) [9], Jiang et al., (2018) [10] and Haha et al., (2012) [11] showed that concrete manufactured using ground granulated blast furnace slag has advantages of improved rheological properties due to reduced fluidity and hydration heat, increasing the durability in the pozzolanic reaction and enhancing the long-term strength by self-hydration. In addition, Song and Saraswathy (2006) [12], Caijun and Yinyu (1989) [13], Gruskovnjak et al., (2008) [14], Taylor (1997) [15], Shi et al., (2020) [16] and Duży et al., (2021) [17] showed that ground granulated blast furnace slag is known to have excellent workability and high resistance to chemical penetration by acids, seawater and sewage. And Yue et al., (2021) [18] suggest a method for predicting the durability of concrete using ground granulated blast furnace slag. In particular, Özbay et al., (2016) [19] and Kim et al., (2014) [20] reported that the utilization of ground granulated blast furnace slag as a cement replacement has a very significant impact on the environment, because the carbon dioxide emission involved in cement production can be reduced and the cost of concrete production can be saved. However, as reported by Yazıcı et al., (2010) [21], Escalante-Garcia and Sharp (1998) [22] and Lee et al., (2013) [23], since ground granulated blast furnace slag has a latent hydraulic property that causes hydration with cement hydrate as a catalyst, limitation of the replacement ratio and appropriate curing measures are required for successful expression of the initial strength.
As the demand for iron is increasing, the generation of steel slag is increasing every year. Although most steel slag is recycled at present, it is necessary to find high value-added applications to utilize it more positively according to advances of the construction industry. Gradually breaking free from the traditional labor-intensive methods of the construction industry, new construction methods and structural systems are drawing attention to make site management easier and minimize on-site work [24]. Precast concrete is part of these new construction methods; it allows for easy quality control because the members are manufactured in factories.
High-strength concrete is used to increase the durability of precast concrete products, and the application of ground granulated blast furnace slag may effectively improve the workability and chemical resistance of high-strength concrete. In addition, steam curing for expression of the initial strength may resolve the limitation of the replacement ratio of ground granulated blast furnace slag and the problems related to curing, and thus it may allow for extensive recycling. However, research on the structural performance of precast concrete members using ground granulated blast furnace slag is still loose ends.
Therefore, the present study was conducted to investigate the effect of ground granulated blast furnace slag on the structural performance of precast concrete beams in terms of flexural, shear and bonding strength by using the replacement ratio of the ground granulated blast furnace slag as a variable. The experimental results were compared with predictions by ACI 318-19 and EC 2 as well as with results provided in previous reports. Based on this comparison, an appropriate replacement ratio of ground granulated blast furnace slag was investigated to secure structural stability of precast concrete beam members manufactured using ground granulated blast furnace slag. And it is expected that the results of this study can be used as basic data to review the appropriate replacement ratio of ground granulated blast furnace slag in the manufacture of precast concrete members.
2. Experimental Program
2.1. Materials
Considering the properties of existing precast concrete products, the concrete was designed with a design strength of 45 MPa by varying the replacement ratio of ground granulated blast furnace slag, as shown in Table 1. In the concrete specimen names, the number represents the replacement ratio of ground granulated blast furnace slag. Specimen C4010 is a concrete specimen prepared by substituting ground granulated blast furnace slag and fly ash at ratios of 40% and 10%, respectively. The fineness of the ground granulated blast furnace slag included in the concrete mix was higher than that of cement by about 20% or more. Therefore, as the replacement ratio was increased, the amount of the applied air-entraining agent (AE) was increased to secure the workability of the concrete. Both the coarse and fine aggregates used in the concrete mixing were natural aggregates; their maximum dimensions were 25 mm and 5 mm, respectively.
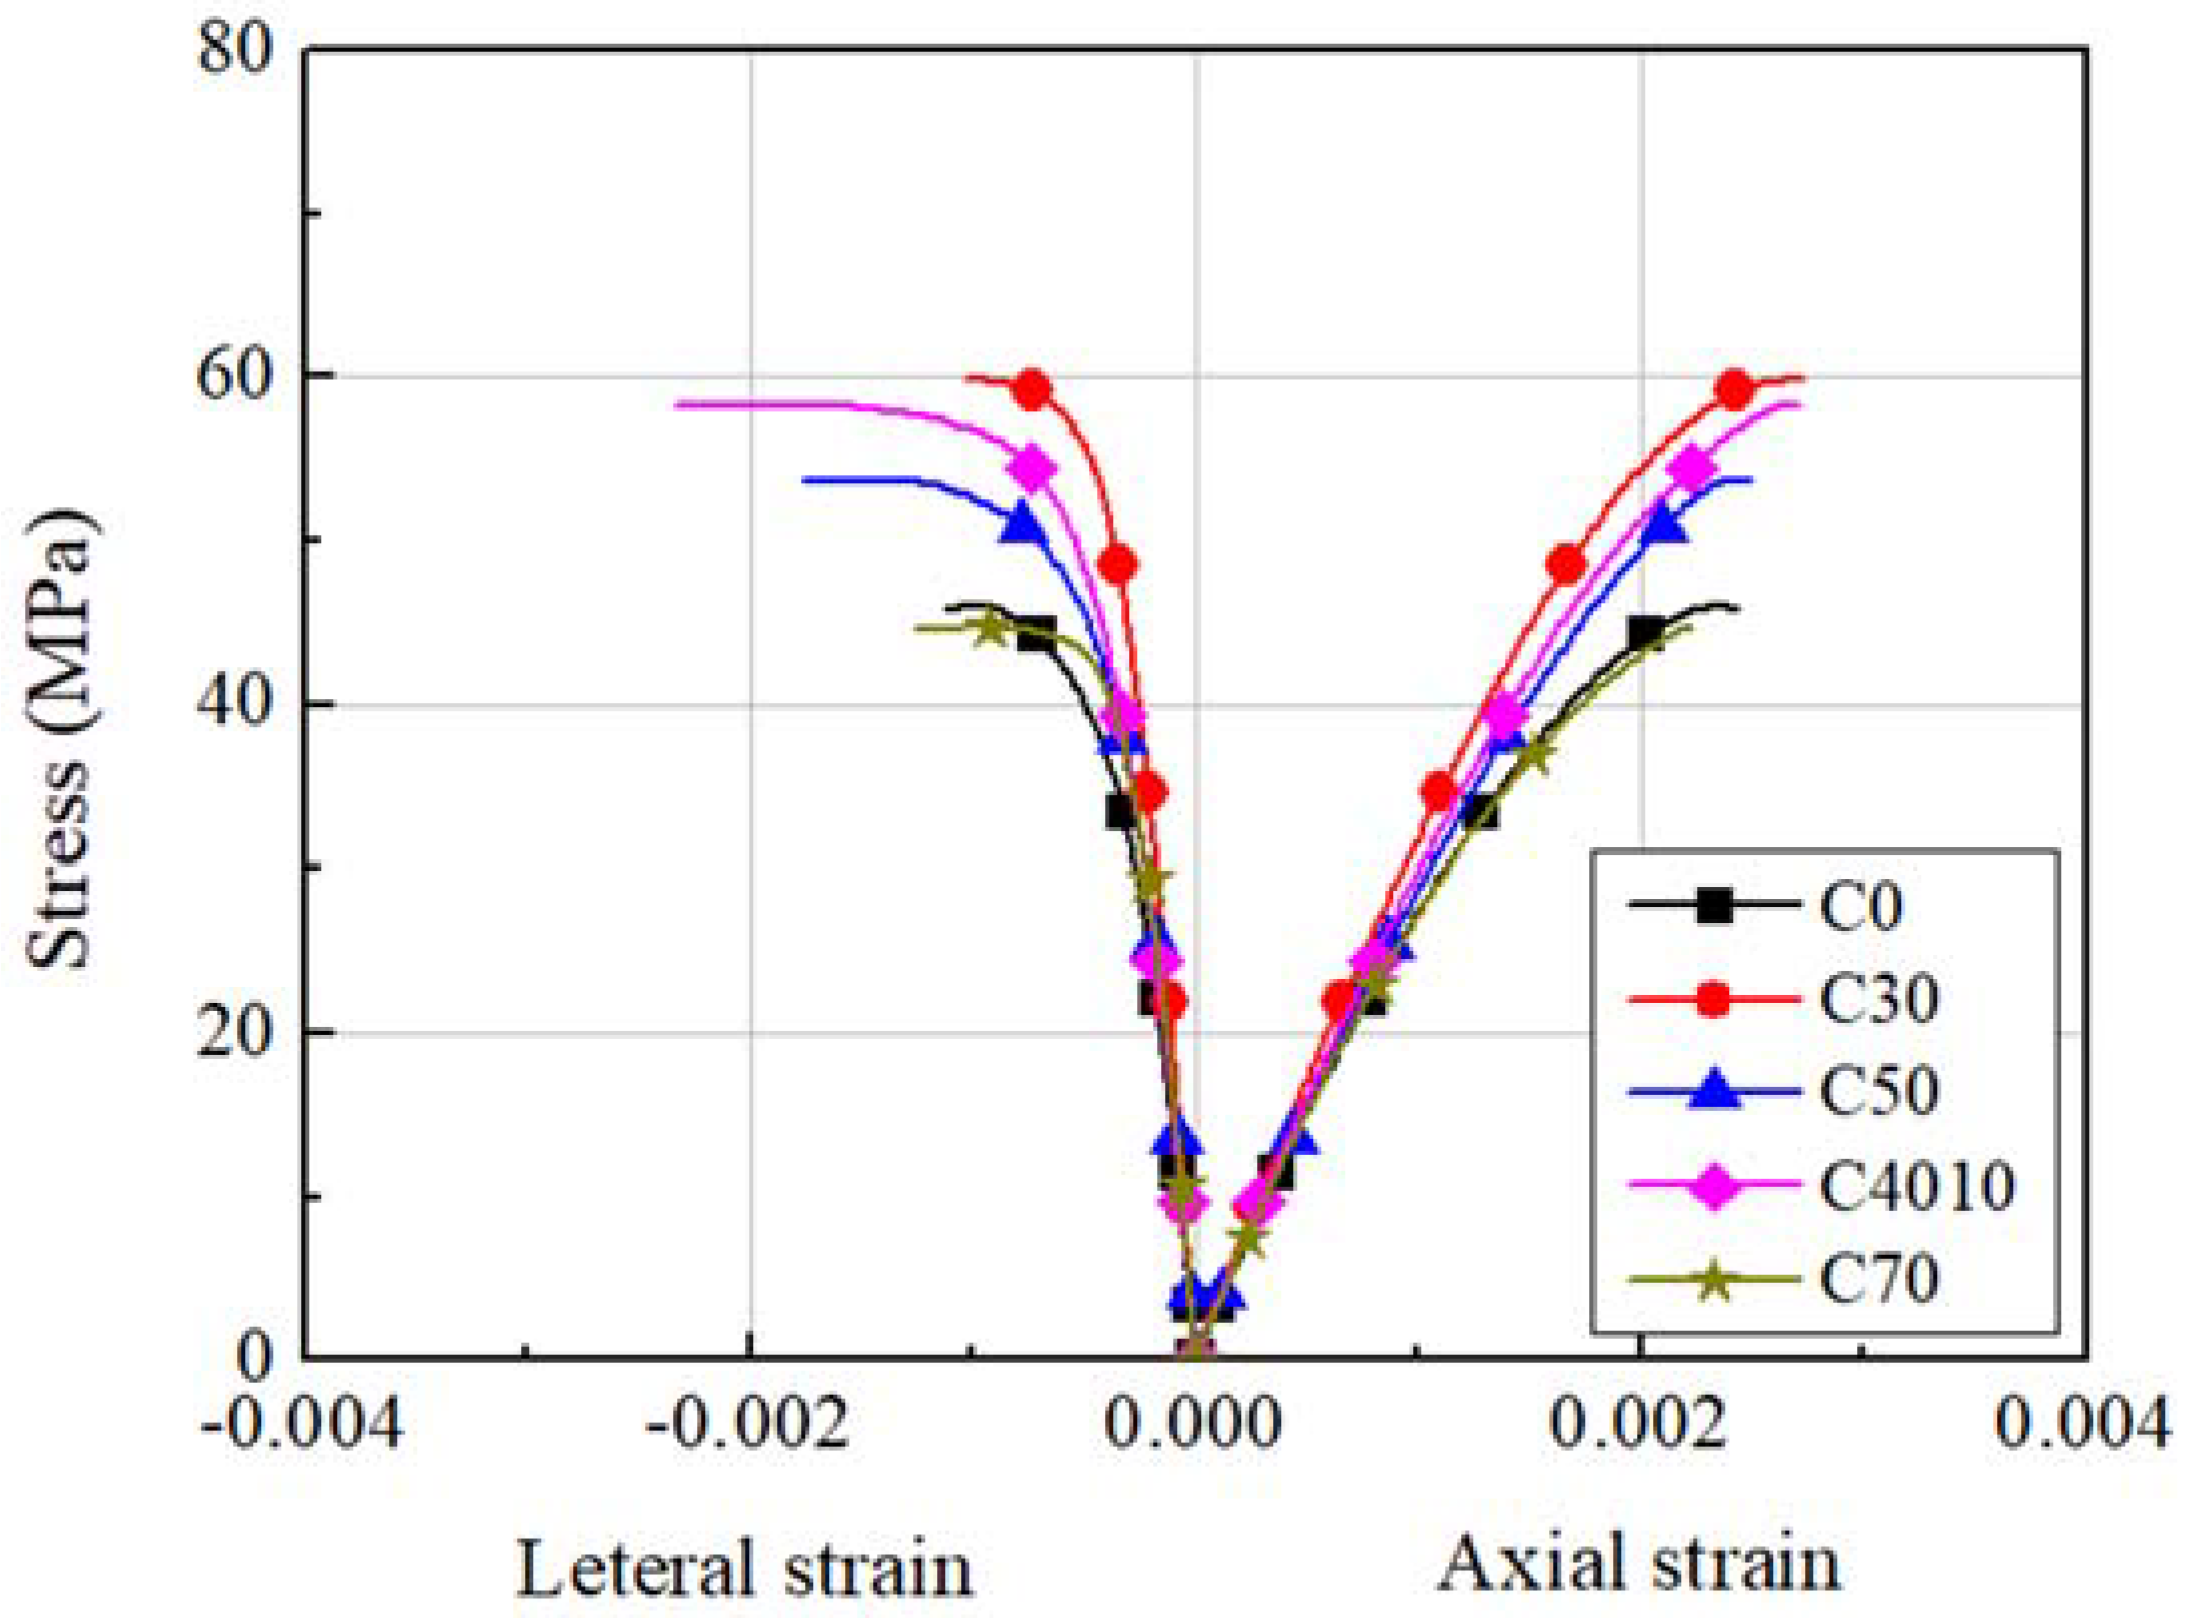
To investigate the compressive strength of the concrete, circular concrete cylinders of Φ100 × 200 mm were prepared when the specimens were placed, and the cylinders were cured under the same conditions as the specimens. The compressive strength of the concrete was tested on the days of experiment for each specimen series; the test results are shown in Figure 1. Regardless of the replacement ratio of the ground granulated blast furnace slag, the compressive strength of the concrete was from 45.2 to 58.0 MPa, higher than the design strength, and the elastic modulus was from 29.3 to 32.6 GPa.
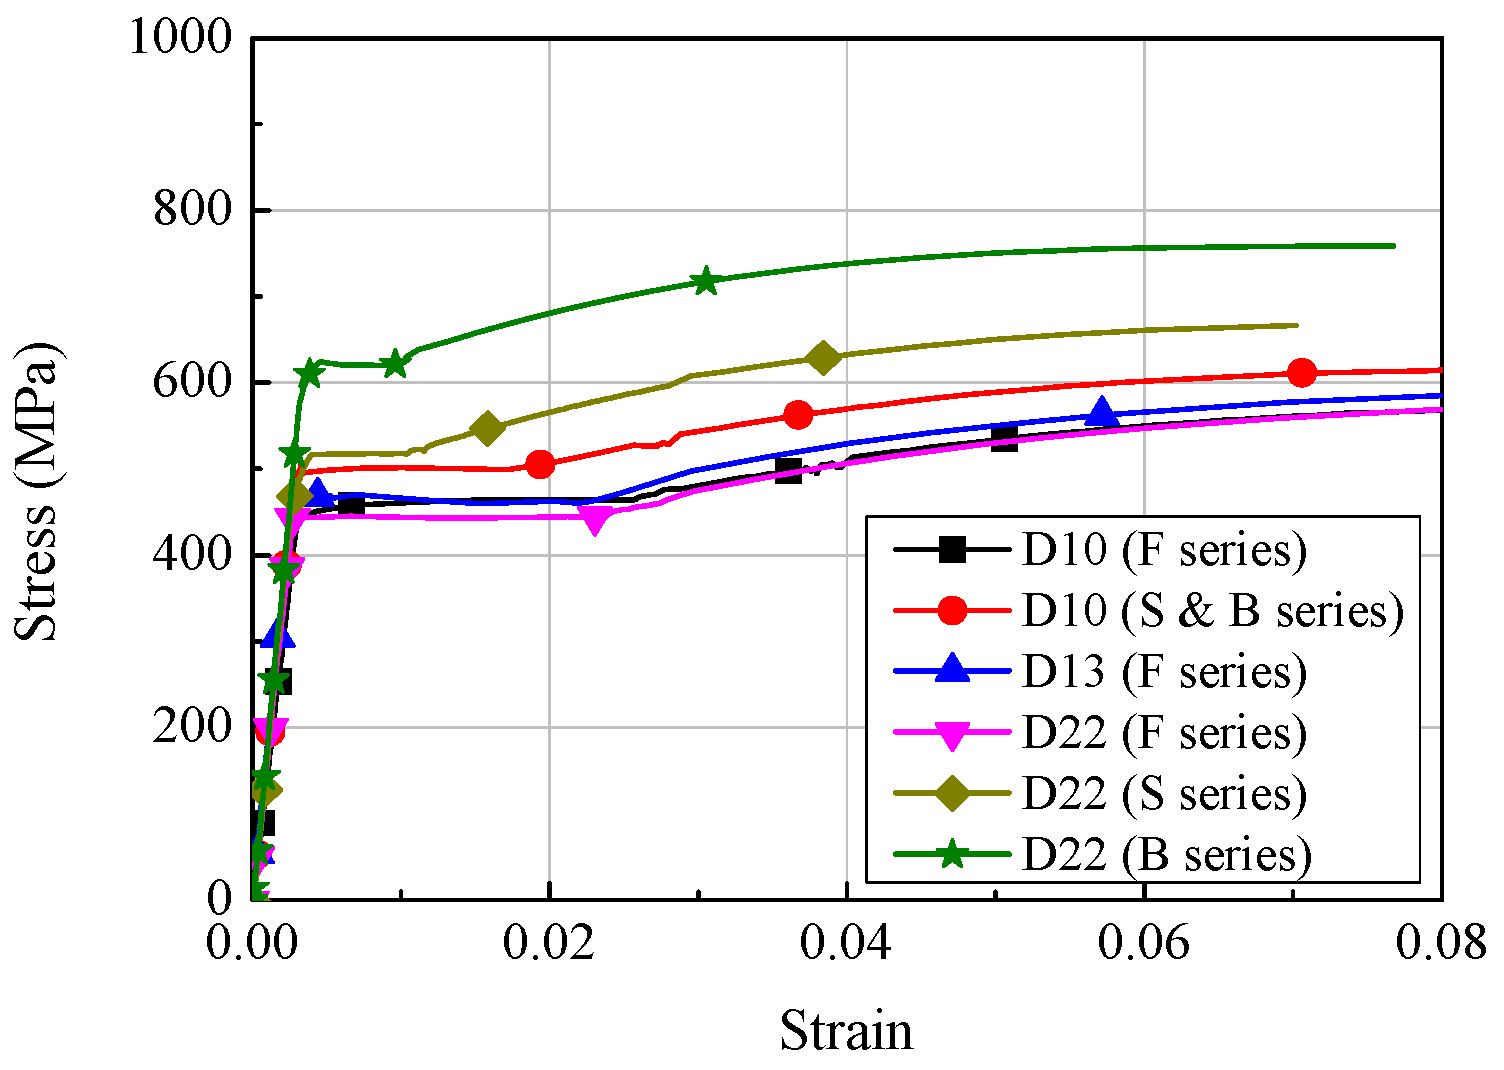
Figure 2 shows the stress-strain relationships of the reinforcements used in the preparation of the specimens. For the F series, D22 and D13 were used as tensile reinforcement and compressive reinforcement, respectively, and their yield strengths were 448.7 MPa and 471.0 MPa, respectively. D10, having a yield strength of 496.6 MPa, was employed as a shear reinforcement. For the S series, D22, having a yield strength of 544.0 MPa, was used as a tensile reinforcement, and D10, which was also used for the F series, was employed as a compressive reinforcement. For the B series, D22, having a yield strength of 626.8 MPa, was used as a longitudinal reinforcement, and D10, having a yield strength of 517.3 MPa, was used as shear reinforcement. The elastic modulus of the reinforcements used to prepare the specimen was from 154 to 185 GPa.
2.2. Specimens
To evaluate the structural performance of the precast concrete beam members depending on the replacement ratio of ground granulated blast furnace slag, specimens of the F, S and B series, 5 for each series, were fabricated, as shown in Table 2. The F series specimens were prepared for the evaluation of the flexural performance, and the S and B specimens for the evaluation for shear and bond performance, respectively. In addition, the number in the name of the specimen means the replacement ratio of ground granulated blast furnace slag and fly ash as shown in Section 2.1.
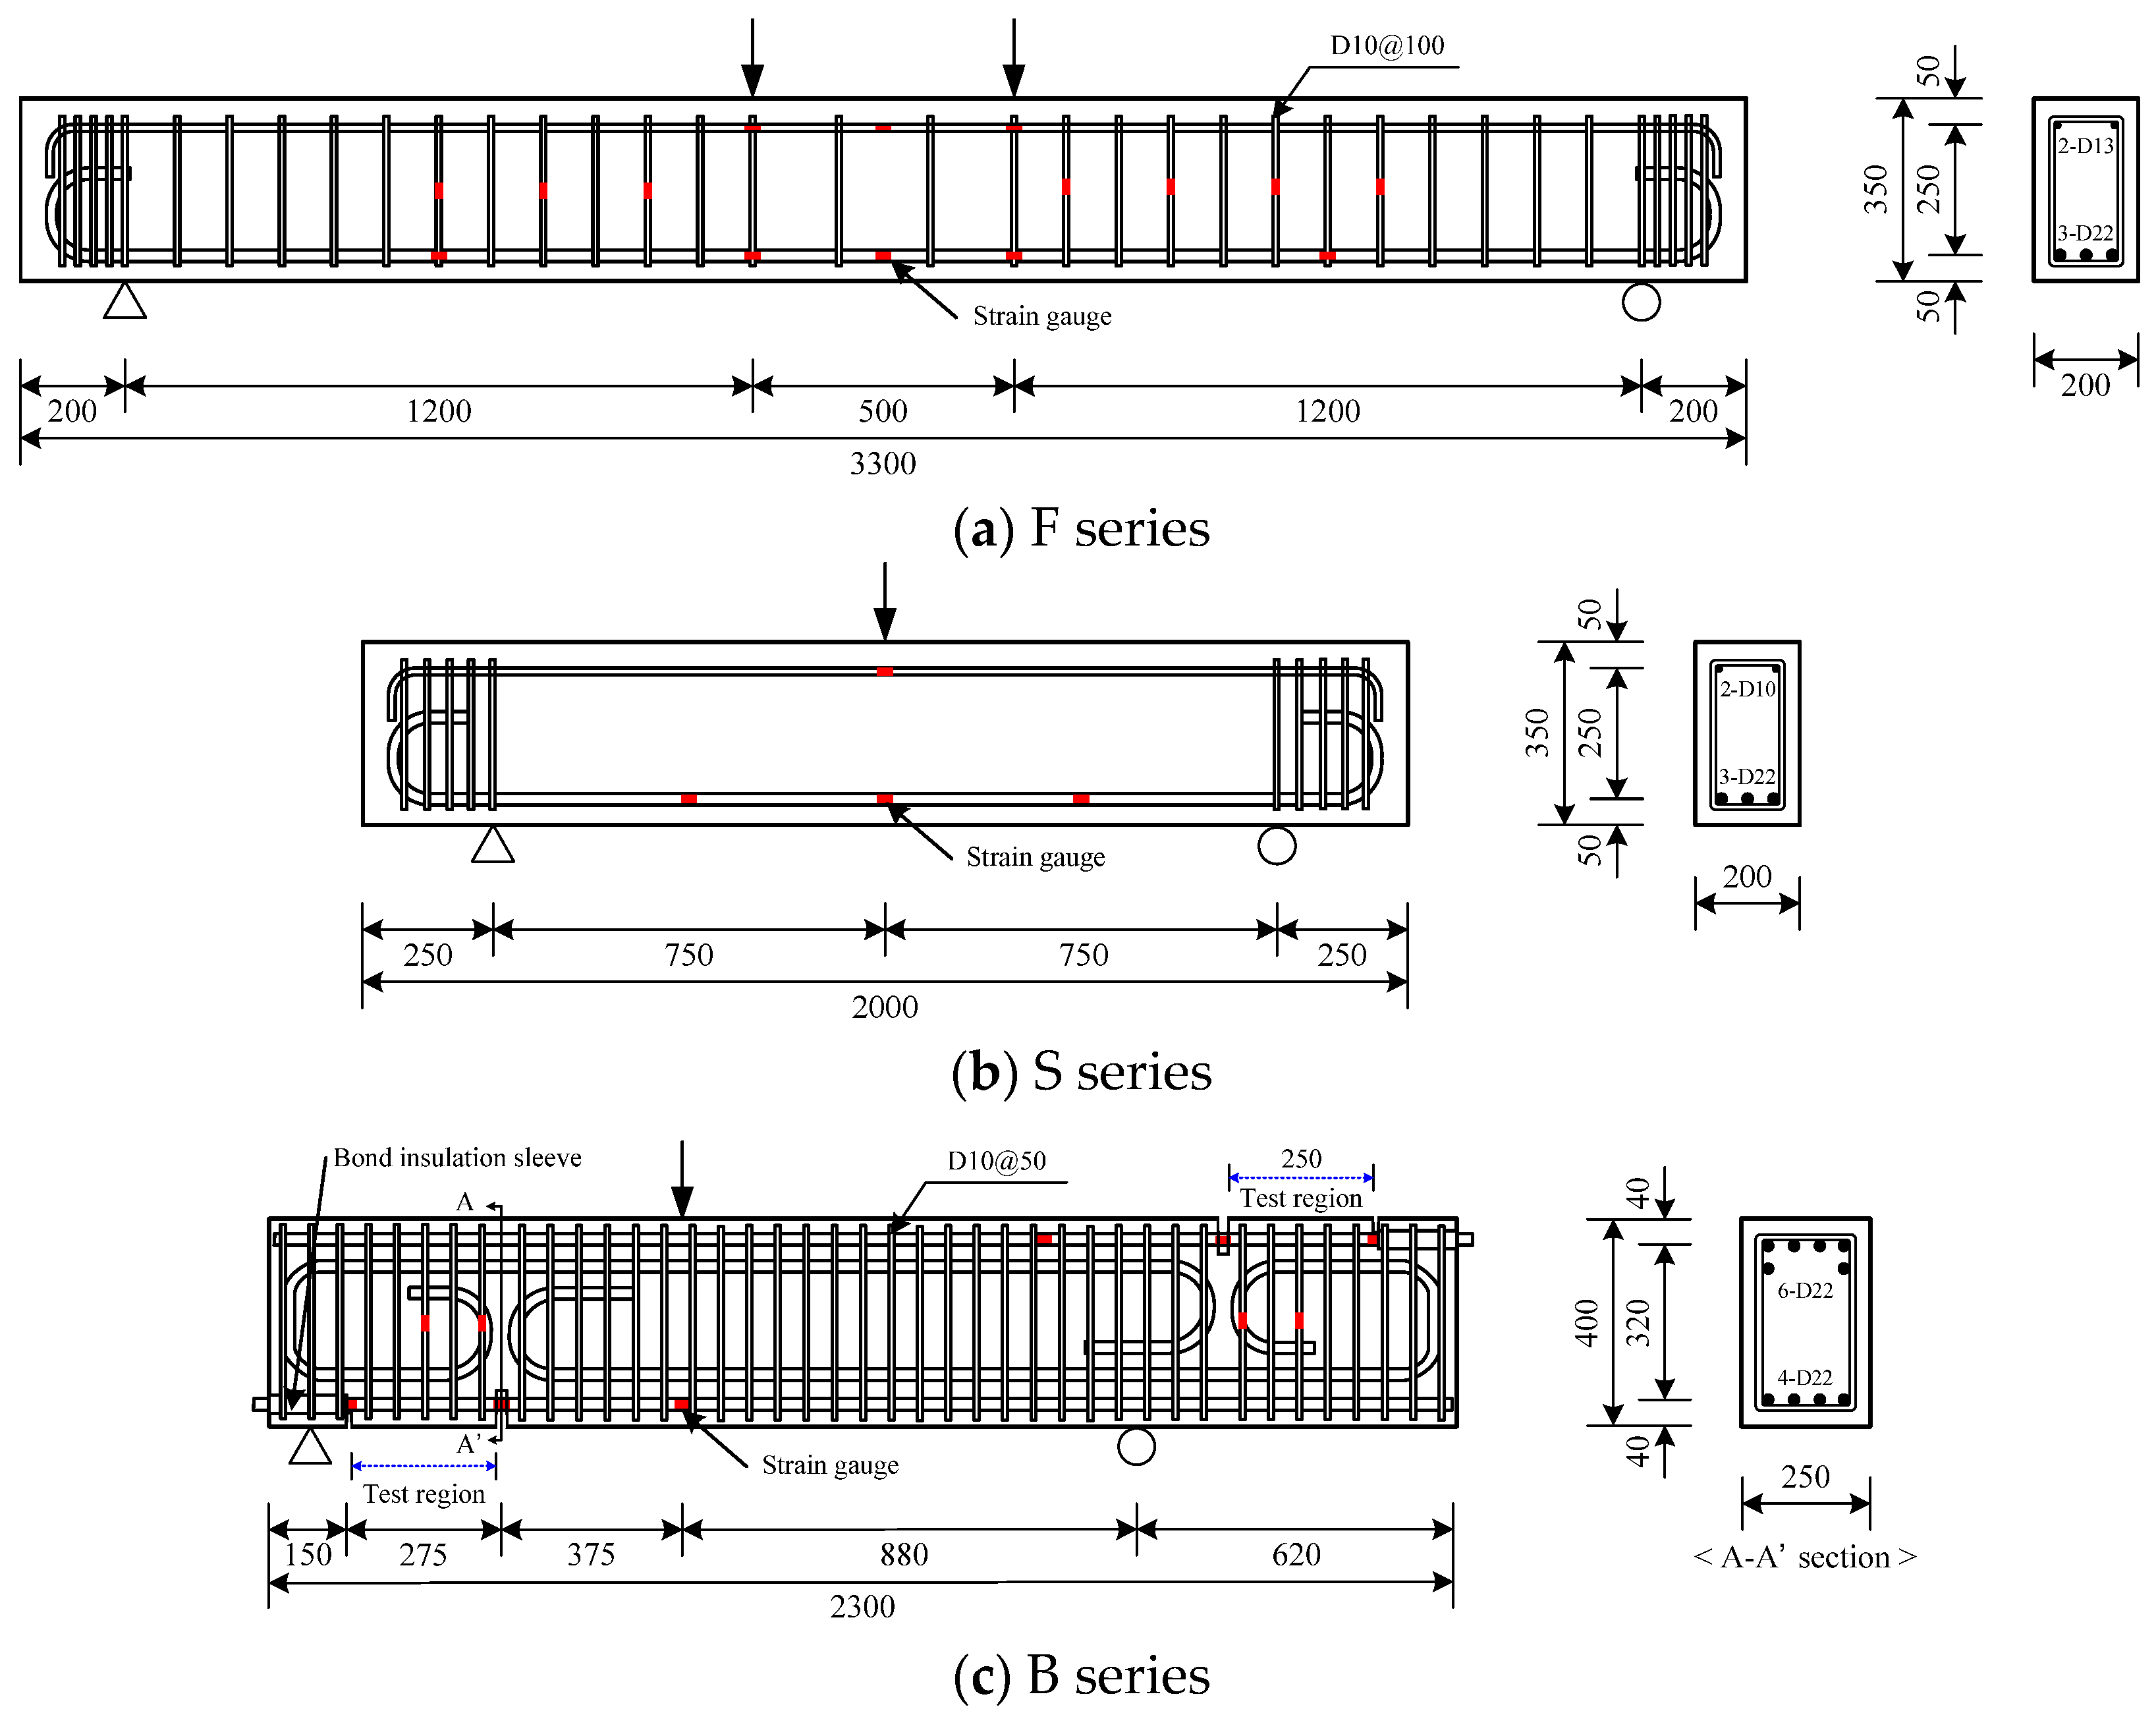
As shown in Table 2 and Figure 3, the F series specimens were 3300 mm long and had a cross-sectional area of 200 × 350 mm. To make the flexural failure dominant, the shear span-to-depth ratio (a/d) was designed to be 4.0, and thus the clear span was 2900 mm long. The F series had a tensile reinforcement ratio of 1.94%, and shear reinforcements were arranged in the experimental interval in a gap of 100 mm to prevent shear failure. The S series specimens were 2000 mm long and had a cross-sectional area of 200 × 350 mm. To induce shear failure, no shear reinforcements were arranged in the S series specimens. The B series specimens were 2300 mm long and had a cross-sectional area of 250 × 400 mm. To prevent flexural failure from preceding bond failure, two-fold longitudinal reinforcements were arranged. In addition, shear reinforcements were densely arranged with gaps of 50 mm to prevent shear failure. As shown in Figure 3, the experimental interval for the B series was designed to be 250 mm, which was the distance between the grooves to induce cracks. Because of the crack-inducing grooves, transfer of the tensile force within the experimental interval was possible only by bonding at the interface between reinforcements and concrete. To prevent the longitudinal reinforcement from being affected by the reaction force at the ends of the experimental interval, the bonds between the reinforcements and the concrete were insulated using steel pipes. For the B series, an experimental interval was designed at both the top and bottom ends of the specimens to evaluate the bond performance of the top and bottom longitudinal reinforcements. Strain gauges were attached to the tensile reinforcements, compressive reinforcements and shear reinforcements of all the specimens to measure the strain of the reinforcements.
2.3. Loading and Measurement Methods
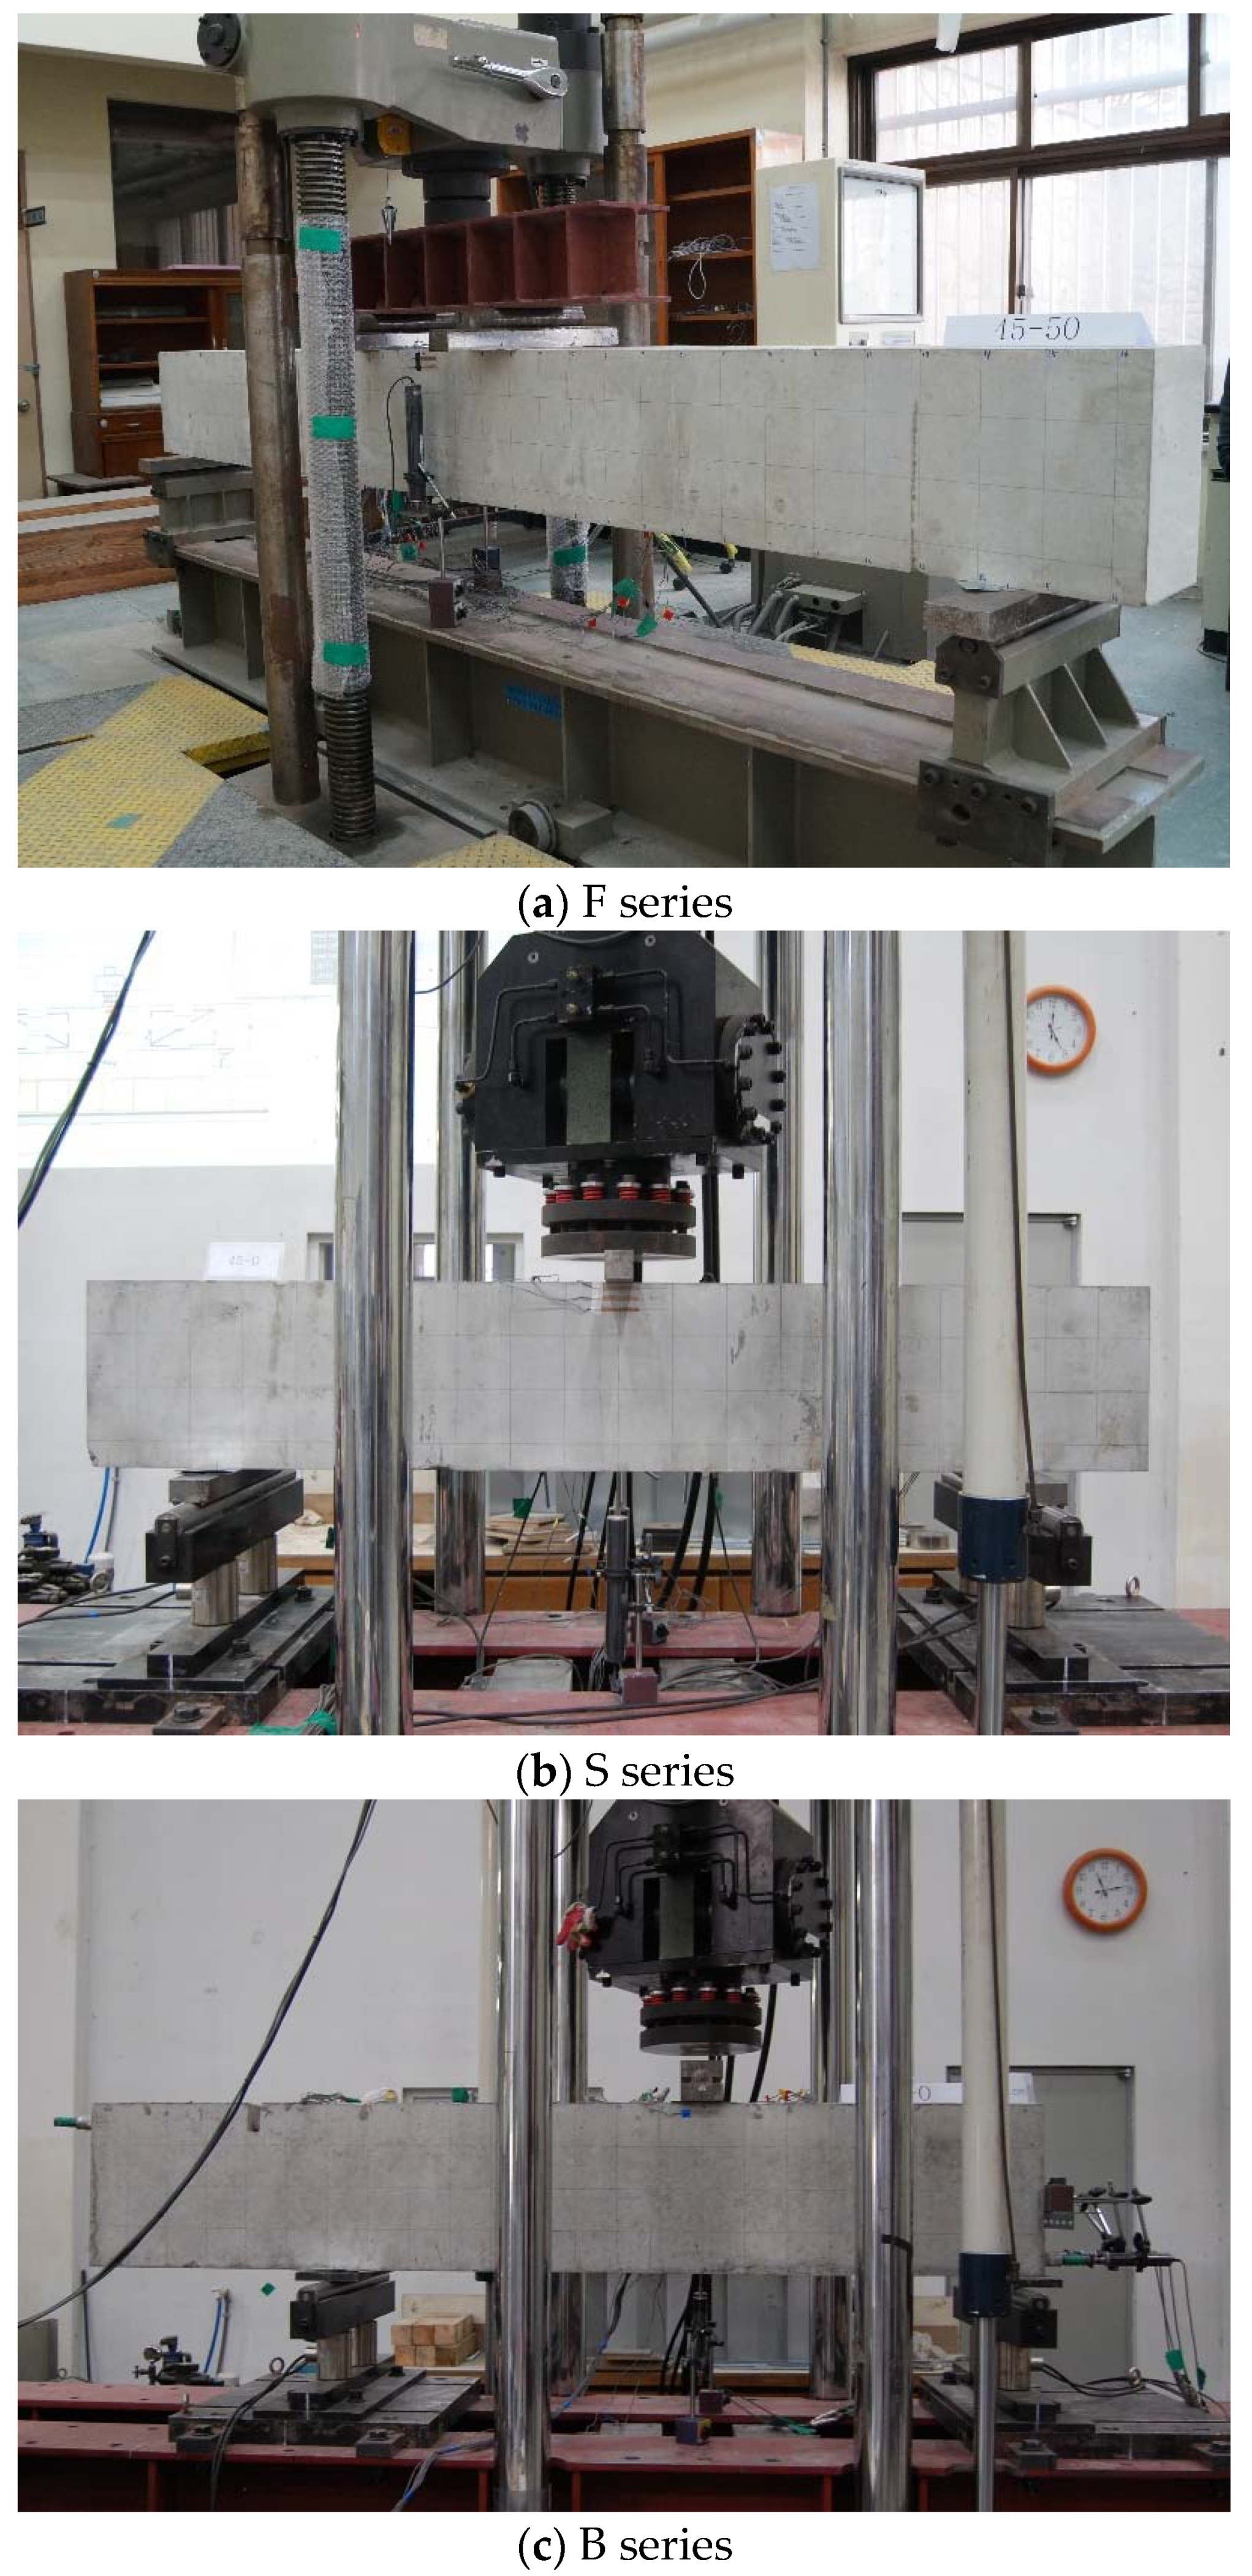
Loading to the specimens was performed using a universal testing machine (UTM) (Shimadzu, Kyoto, Japan) in the shape of a simple beam, as shown in Figure 4. Four-point loading was applied to the F series to induce a clear flexural interval; 3-point loading was used for the S and B series. Regardless of the specimen series, load control was applied up to the maximum load, and displacement control was applied after the maximum load until the stress decreased to 85% of the maximum load or lower.
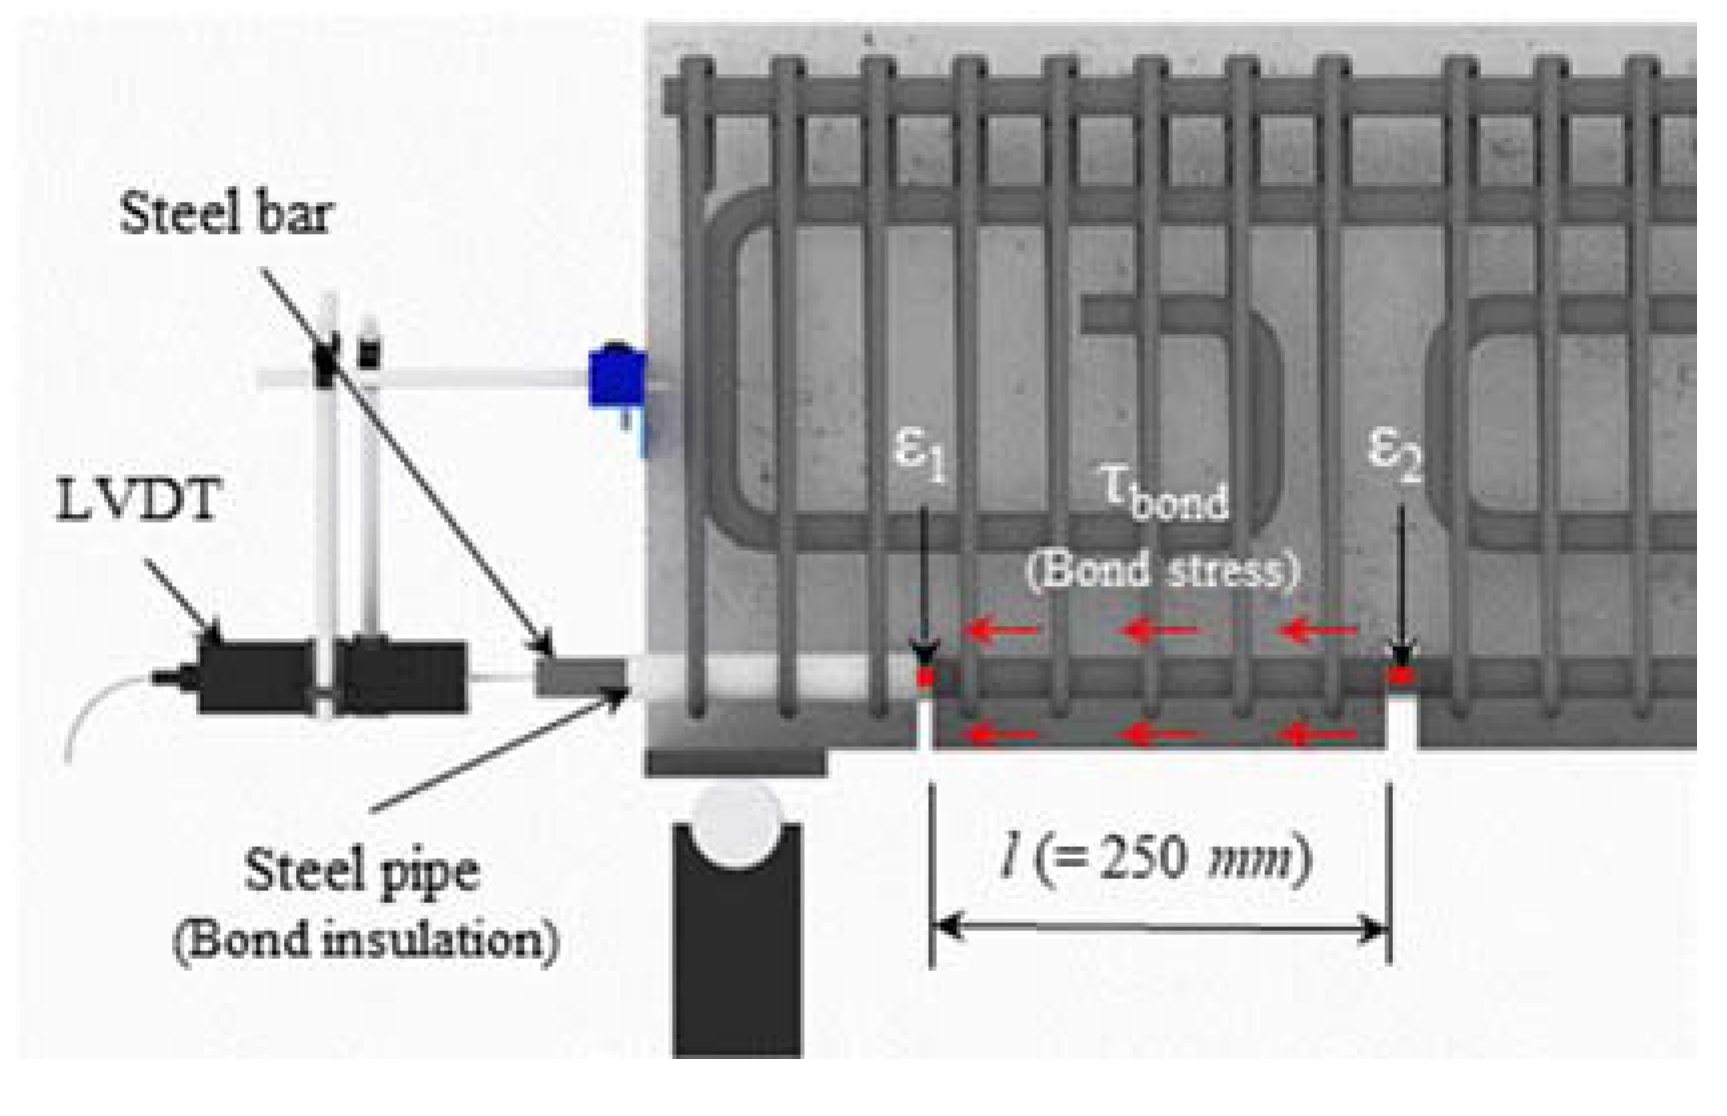
The deflection of the beam by loading was measured by installing a linear variable differential transducer (LVDT) (Tokyo Measuring Instruments Lab., Tokyo, Japan) at the central bottom of the loading point where the maximum deformation of the specimens was generated. In addition, strain gauges for concrete were attached to positions 10 mm and 30 mm away from the compressive edge to measure the strain of the concrete at the loading point. As shown in Figure 4c, an additional LVDT was installed at the center of the longitudinal reinforcements arranged at the ends of the B series specimens to measure the slip of the inner and corner longitudinal reinforcements by bond failure.
3. Evaluation of Flexural Performance
3.1. Load-Deflection Relationships
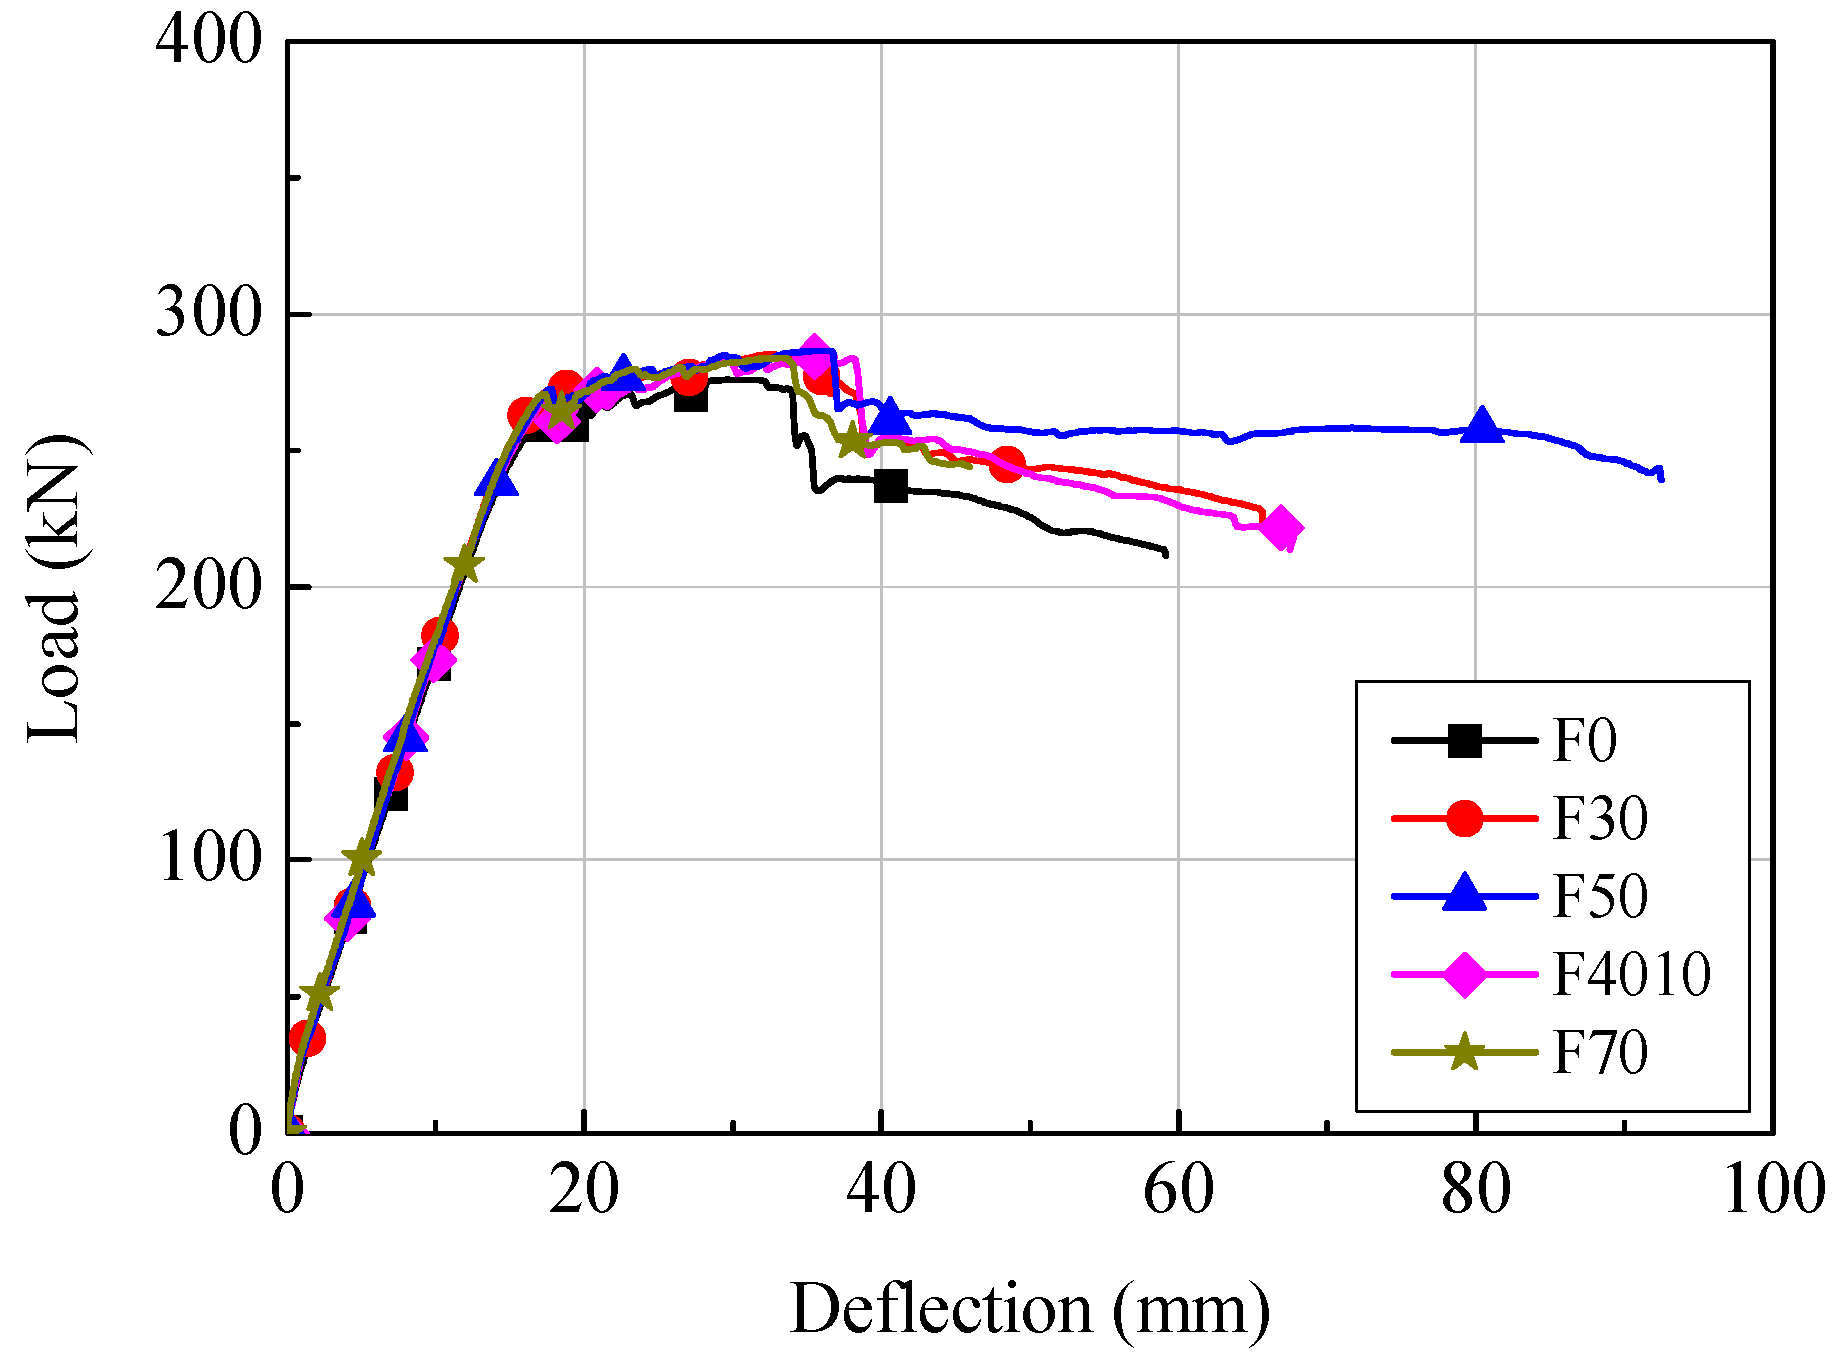
Figure 5 shows the load-deflection relationships of the F series specimens based on the load measured using the UTM and the displacement measured using the LVDT installed at the central bottom of the specimens. In all specimens, regardless of the replacement ratio of the ground granulated blast furnace slag, when the load was increased after the generation of flexural cracks, the tensional reinforcements reached yield strain with the growth of flexural cracks. After the maximum stress, the specimens showed typical flexural behavior in which the resisting force was decreased by the crushing of concrete at the compressive edges.
Flexural cracks of the F series specimens were generated at loads of 24.3 to 32.3 kN; the deflection was 0.46 to 1.04 mm. The tensile reinforcements reached yield strain at 216.8 to 241.5 kN, and the displacement was 12.5 to 14.1 mm. The load and deflection at the maximum stress were 276.2 to 286.7 kN and 29.7 to 36.0 mm, respectively. In the cases of the F series, the stress of all the specimens, except the F50 specimen, significantly decreased (about 10% or more) after the maximum stress. This may be because of the crushing of the concrete that happened at the compressive edges.
3.2. Flexural Strength
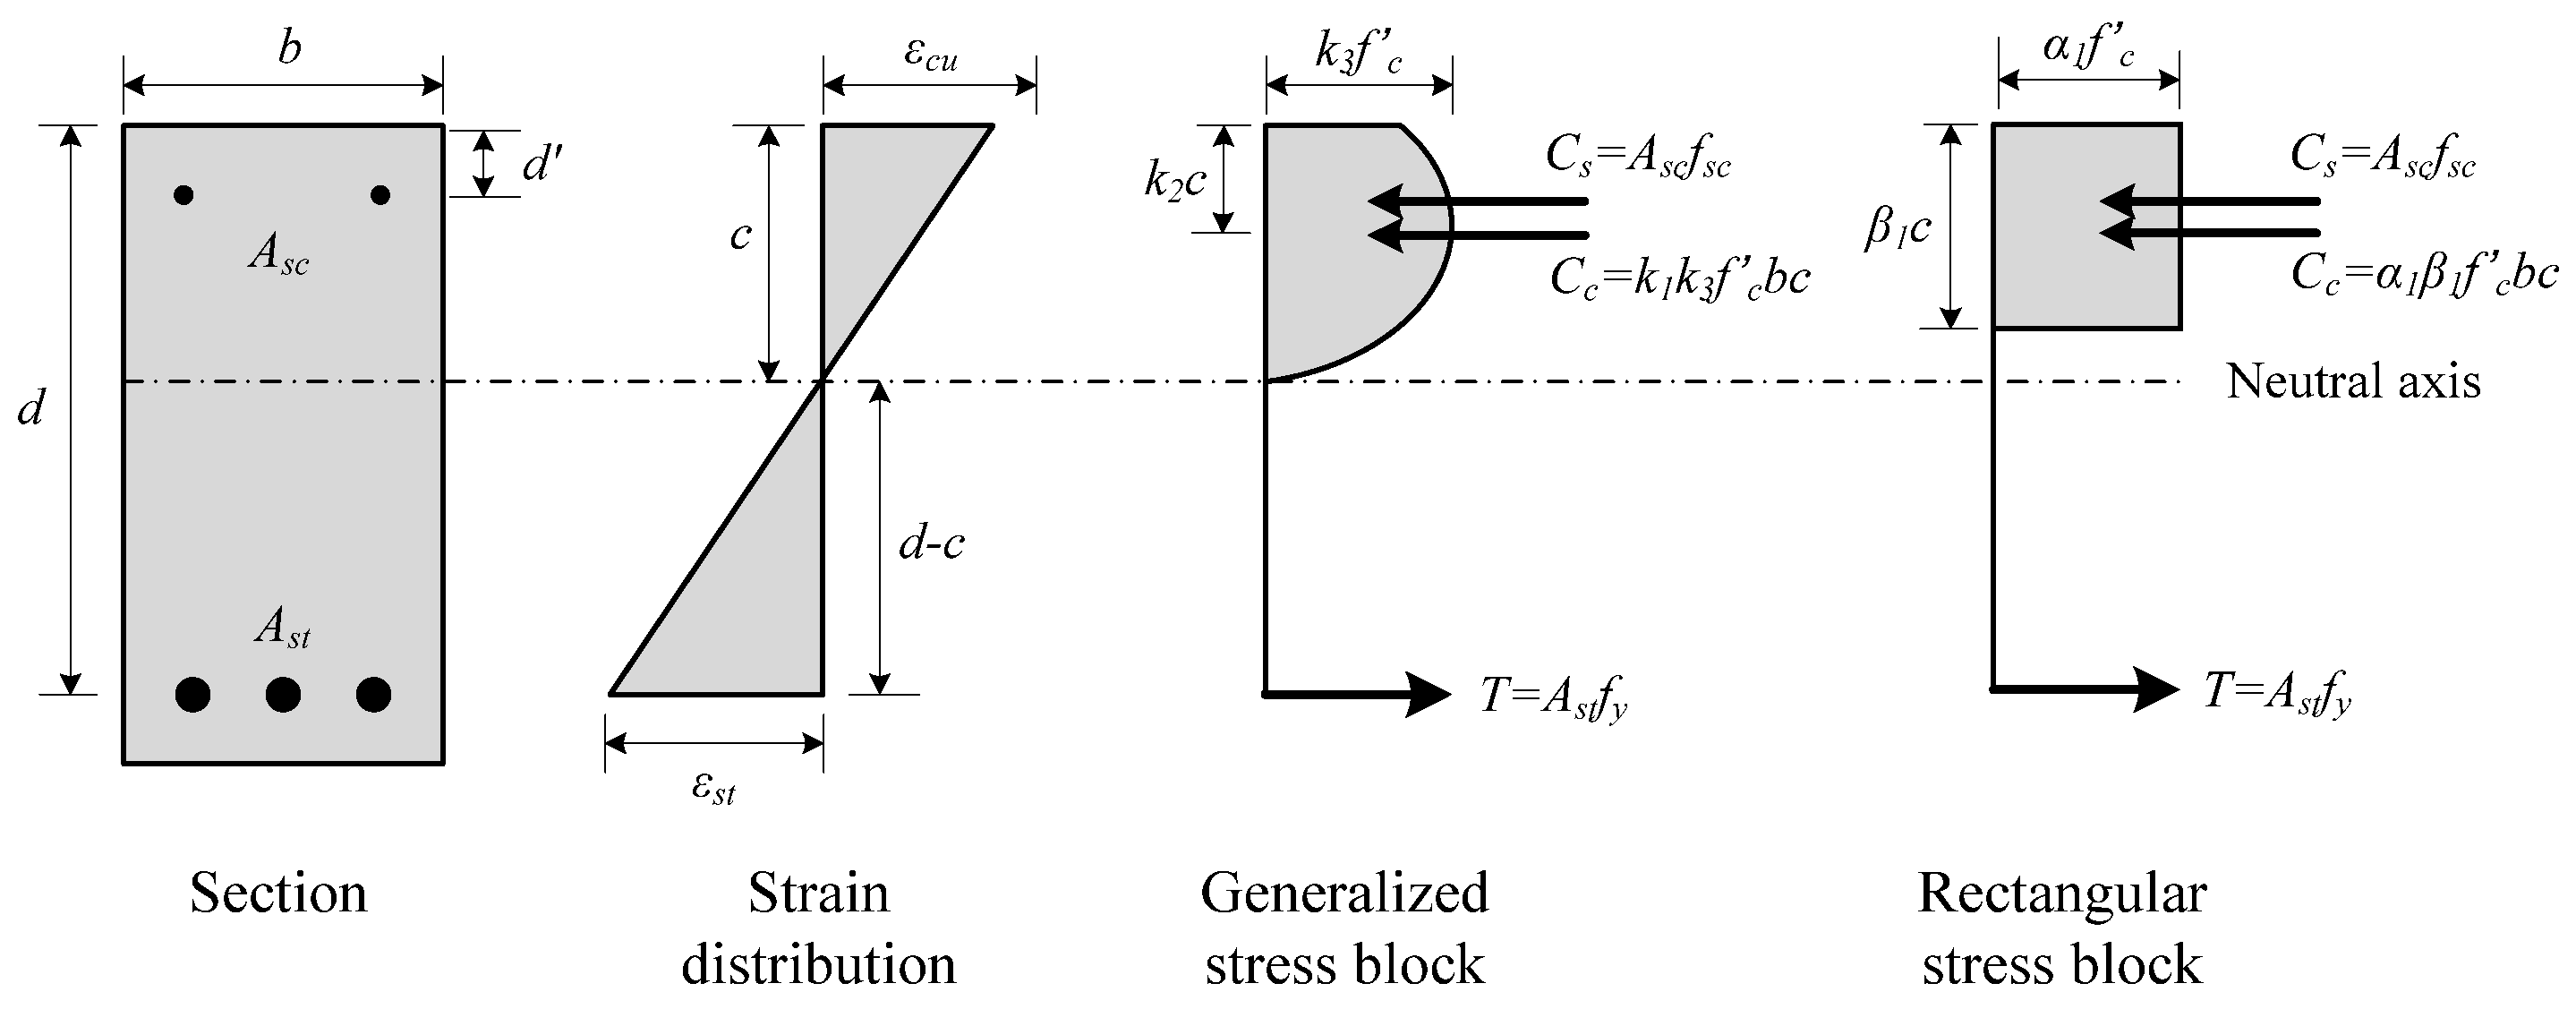
Table 3 compares the flexural strength of the F series specimens between the experimental results and the analytical results. The experimental results shown in Table 3 were obtained through calculation using the load measurements from the load cell of the UTM. The analytical results were obtained using Equations (1) and (2) according to the equilibrium conditions of force and compatibility conditions of strain, as shown in Figure 6. To compare the prediction results depending on the coefficient of the equivalent stress block, the ultimate moment of the F series specimens was calculated by applying the coefficient of the equivalent stress block provided by the ACI 318-19 [25] and EC 2 [26] standards.
Here, is the yield moment, is the ultimate moment, is the tensile force, is the effective death of the beam, is the depth of the neutral axis, and are equivalent rectangular stress block parameters ( and for EC 2), is the compressive strength of concrete, is the beam width, is the cross-sectional area of the compressive reinforcement, is the stress of the compressive reinforcement and is the distance from the compressive edge to the midpoint of the compressive reinforcement.
As shown in Table 3, the mean ratio of the yield moment of the tensile reinforcement in the analytical results to that in the experimental results was 0.99, and the coefficient of variation was 4.32%, indicating that the experimental results were effectively predicted when the replacement ratio of the ground granulated blast furnace slag was used as a variable. With regard to the prediction of the ultimate moment based on ACI 318-19 and EC 2, regardless of the replacement ratio of ground granulated blast furnace slag, the mean ratios of the experimental results to the analytical results were 1.21 and 1.19, respectively, showing that the experimental results were predicted on the safe side. With regard to the ultimate moment, the mean ratio of the experimental results to the analytical results was lower by less than 2% and the coefficient of variation was also lower by less than 1% in the results from the EC 2 than in the results from the ACI 318-19, indicating that the prediction by the EC 2 was better.
3.3. Neutral Axis Depth Ratio
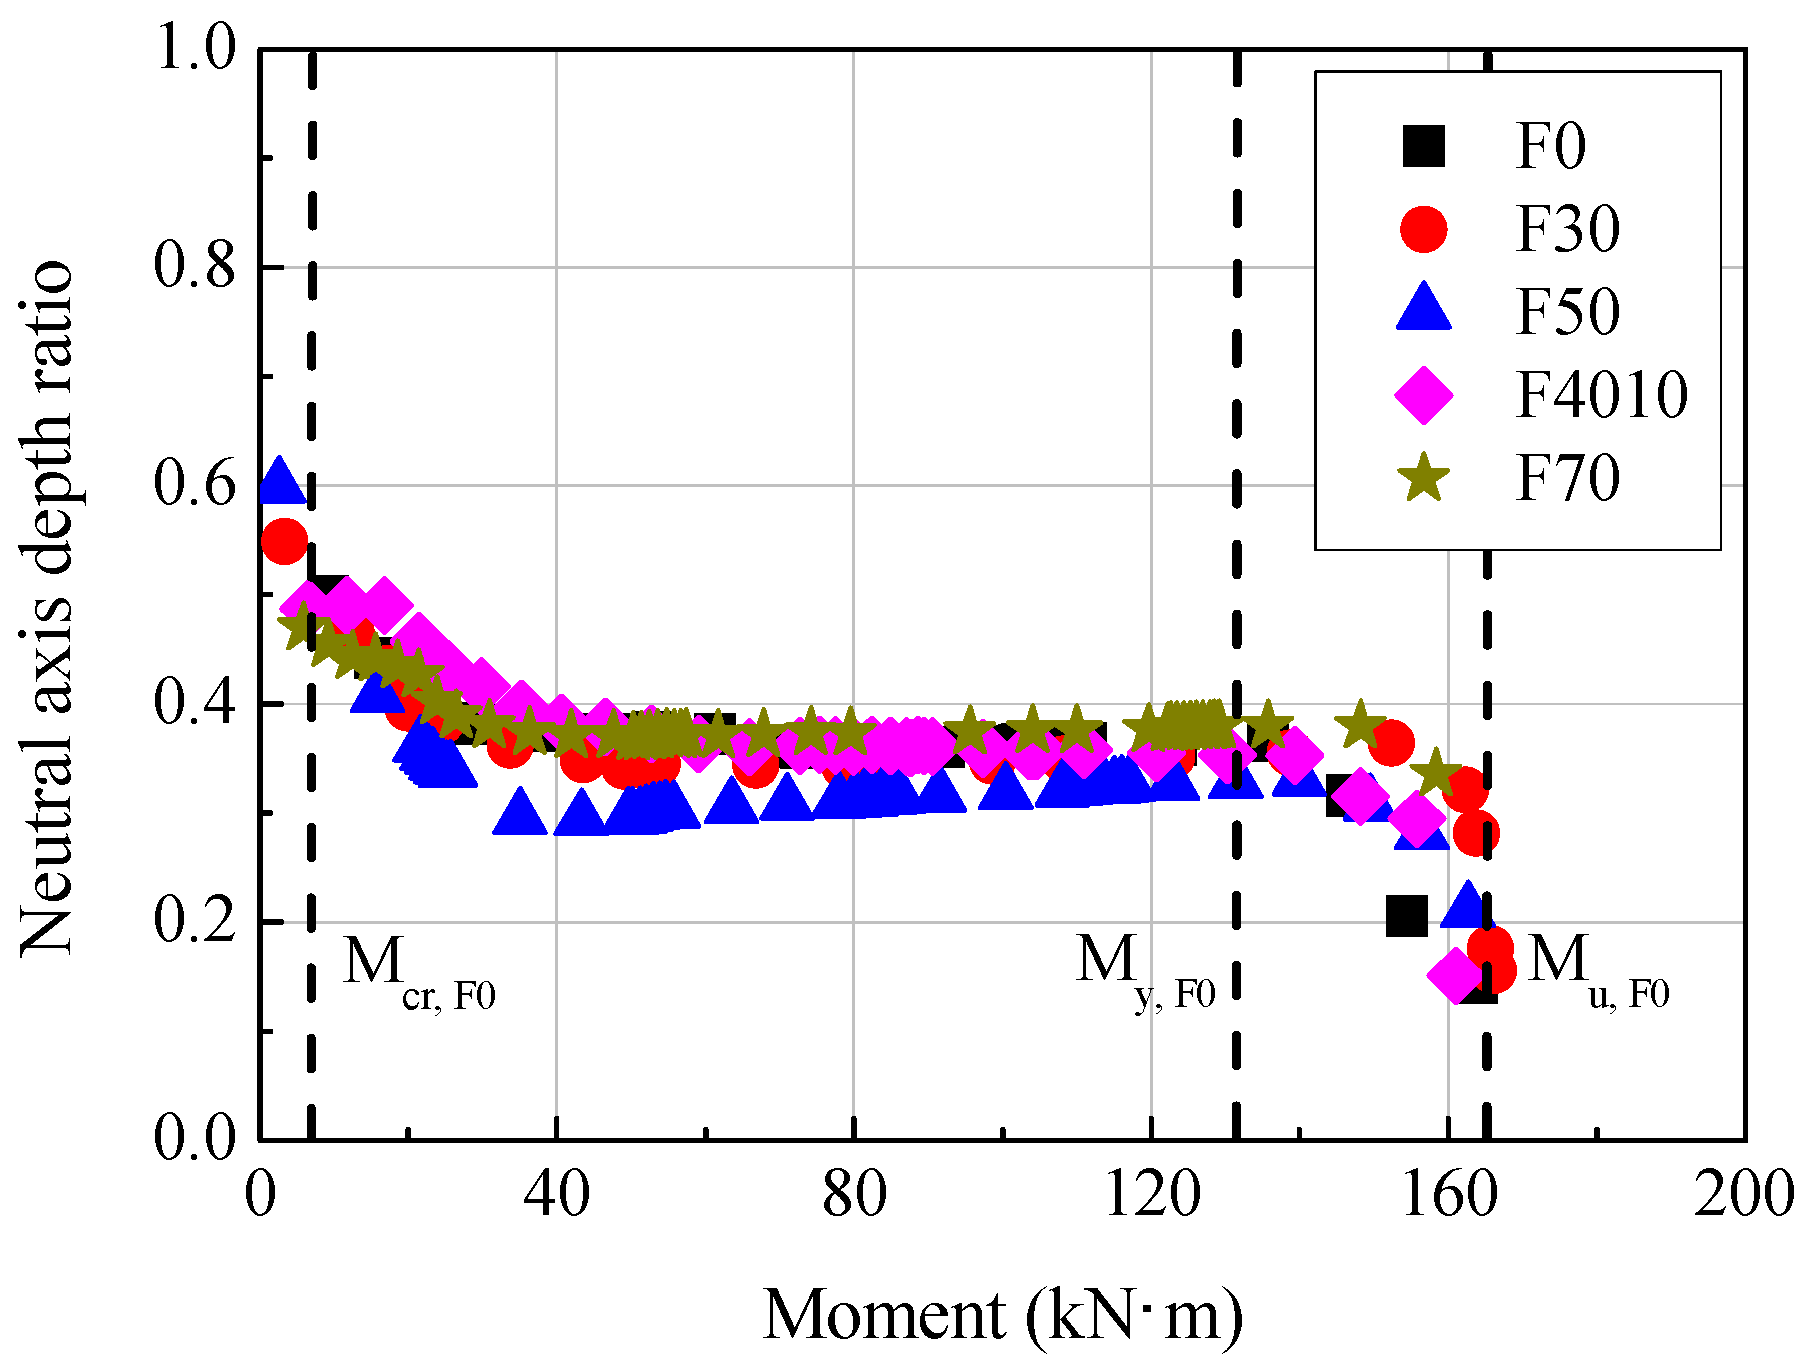
Figure 7 shows the change of the neutral axis depth ratio (c/d) depending on the replacement ratio of ground granulated blast furnace slag. The neutral axis depth in the experimental results was calculated using the strain measured by the strain gauges attached to the tensile reinforcement and the compressive edge concrete according to the Bernoulli-Euler hypothesis, as shown in Figure 6 and Equation (3):
Here, is the strain of the compressive edge concrete and is the strain of the tensile reinforcement.
As shown in Figure 7, the neutral axis depth ratio decreased after the generation of flexural cracks, regardless of the replacement ratio of ground granulated blast furnace slag. The neutral axis depth ratio remained in a range between 0.3 and 0.4 before the yield of the tensile reinforcement, after which it began to decrease again. The neutral axis depth ratio at the ultimate was 0.15 or lower.
3.4. Ductility Factors
Ductility refers to the load resistance capability while maintaining the deformation of the member without a significant decrease of the stress; it is represented by a curvature ductility factor () and a displacement ductility factor (). Table 3 compares the ductility factors of the F series specimens based on the experimental results. The curvature ductility factor and displacement ductility factor were calculated from the experimental results using Equations (4) and (5):
Here, represents the yield curvature of the tensile reinforcement (), is the curvature when the compressive edge strain of the concrete is (), is the yield strain of the tensile reinforcement, is the ultimate strain of the concrete, is the yield displacement of the tensile reinforcement and is the displacement when the compressive edge strain of the concrete is .
As shown in Table 3, among the F series specimens, the curvature ductility factor was lowest in the F0 specimen (6.45) and highest in the F50 specimen (9.86). The F70 specimen was excluded from the analysis because the Bernoulli-Euler hypothesis was not satisfied due to an abnormality of the strain values measured in tensile reinforcement and concrete. The displacement ductility factor was also lowest in the F0 specimen (2.27) and highest in the F50 specimen (2.88). ACI 318-19 [25] secures the member ductility by applying a ductility value 2.5 times as high as the yield strain (when the yield strength of the tensile reinforcement is 400 MPa) or a higher value to the tension-controlled sections, and EC 2 [26] by limiting the value to the neutral axis depth ratio (c/d) (0.25 or lower for C50 at ultimate limit state). As shown in Table 3 and Figure 7, the curvature ductility factor and displacement ductility factor of the specimens prepared by substituting ground granulated blast furnace slag were generally higher than those of the reference specimen F0 by at least 28% and at least 4%, respectively. Therefore, the required ductility may be secured even if the replacement ratio of ground granulated blast furnace slag is increased to 70%.
3.5. Serviceability
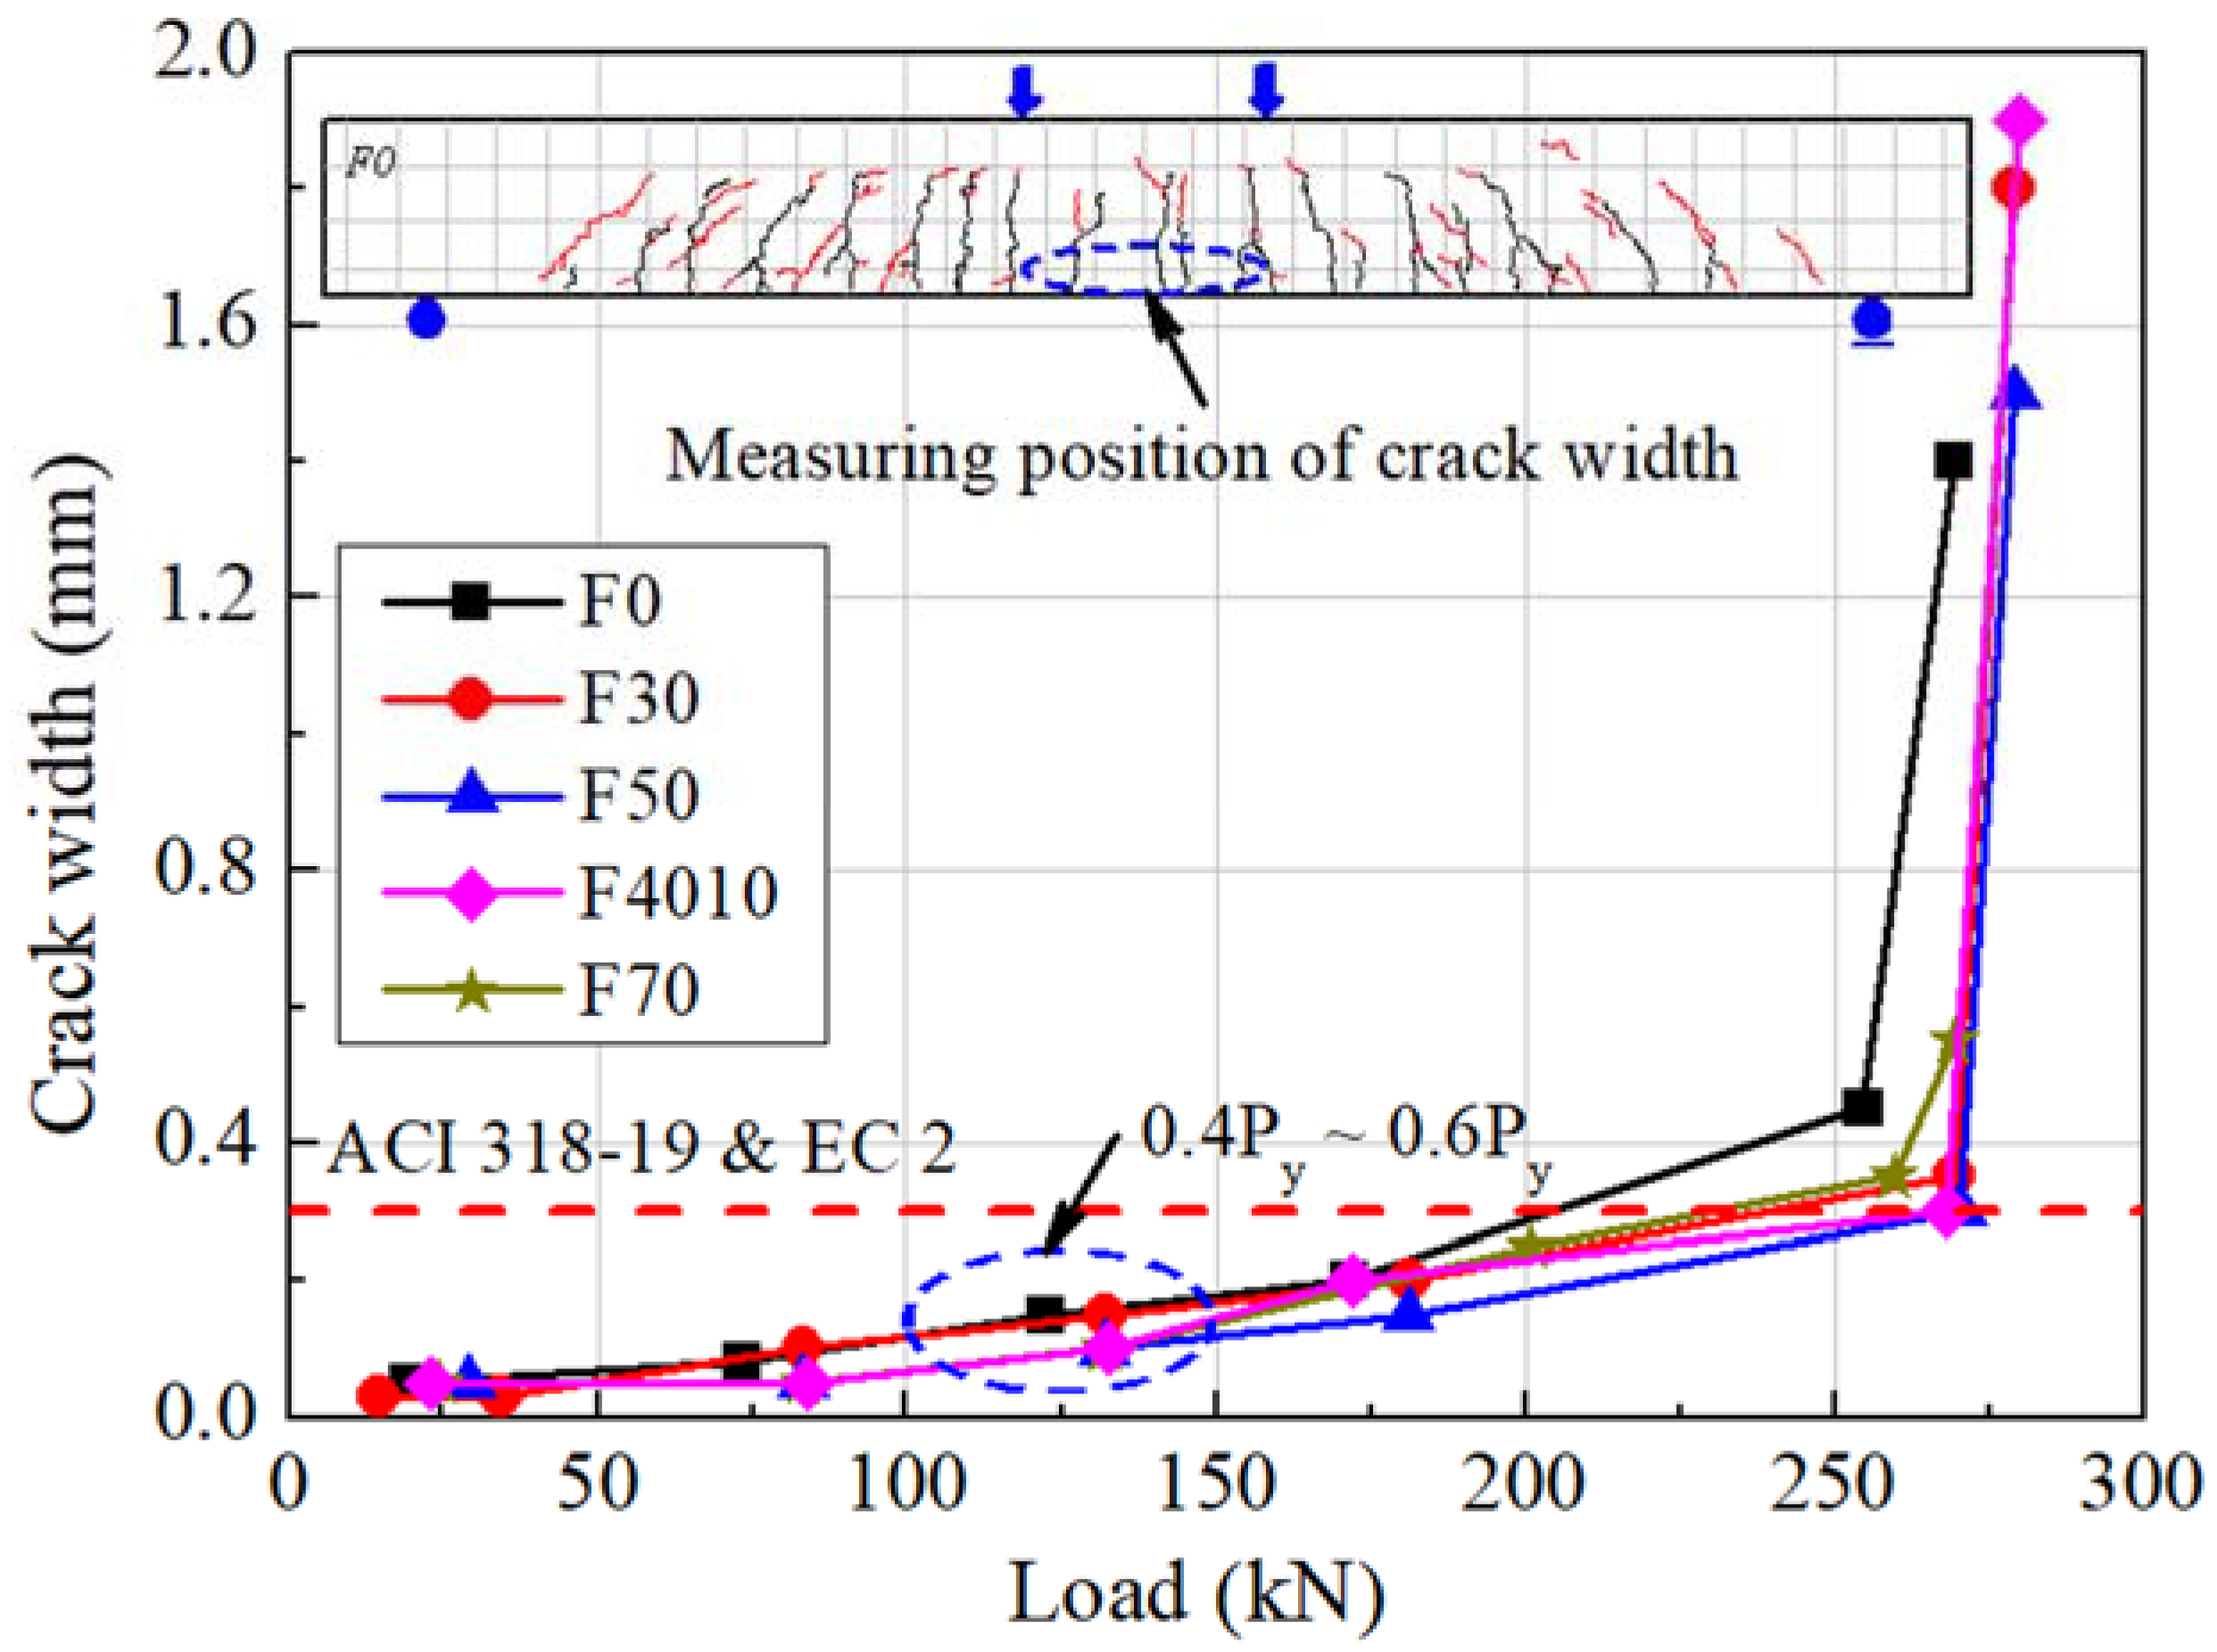
Figure 8 shows the course of the crack width growth in the F series specimens according to the load. The crack width was measured at the position of the tensile reinforcement between the loading points, which is the pure bending zone, and the crack that grew the largest among the crack widths measured at 3–5 places was used. The crack width was increased similarly to the increase of the load, regardless of the replacement ratio of ground granulated blast furnace slag. In the ultimate, the number of the flexural cracks observed in the experimental zone was similar, in the range between 22 and 24. The crack width in the 0.4Py–0.6Py zone, corresponding to the service load state, was less than 0.3 mm, which satisfied the allowable crack width constraints provided by ACI 318-19 [25] and EC 2 [26]. The growth of the crack width by load and the number of generated cracks were similar between the specimens fabricated by substituting ground granulated blast furnace slag and the reference specimen F0, indicating that the replacement ratio of ground granulated blast furnace slag has a negligible impact on the serviceability of the flexural members.
4. Evaluation of Shear Performance
4.1. Shear Force-Deflection Relationships
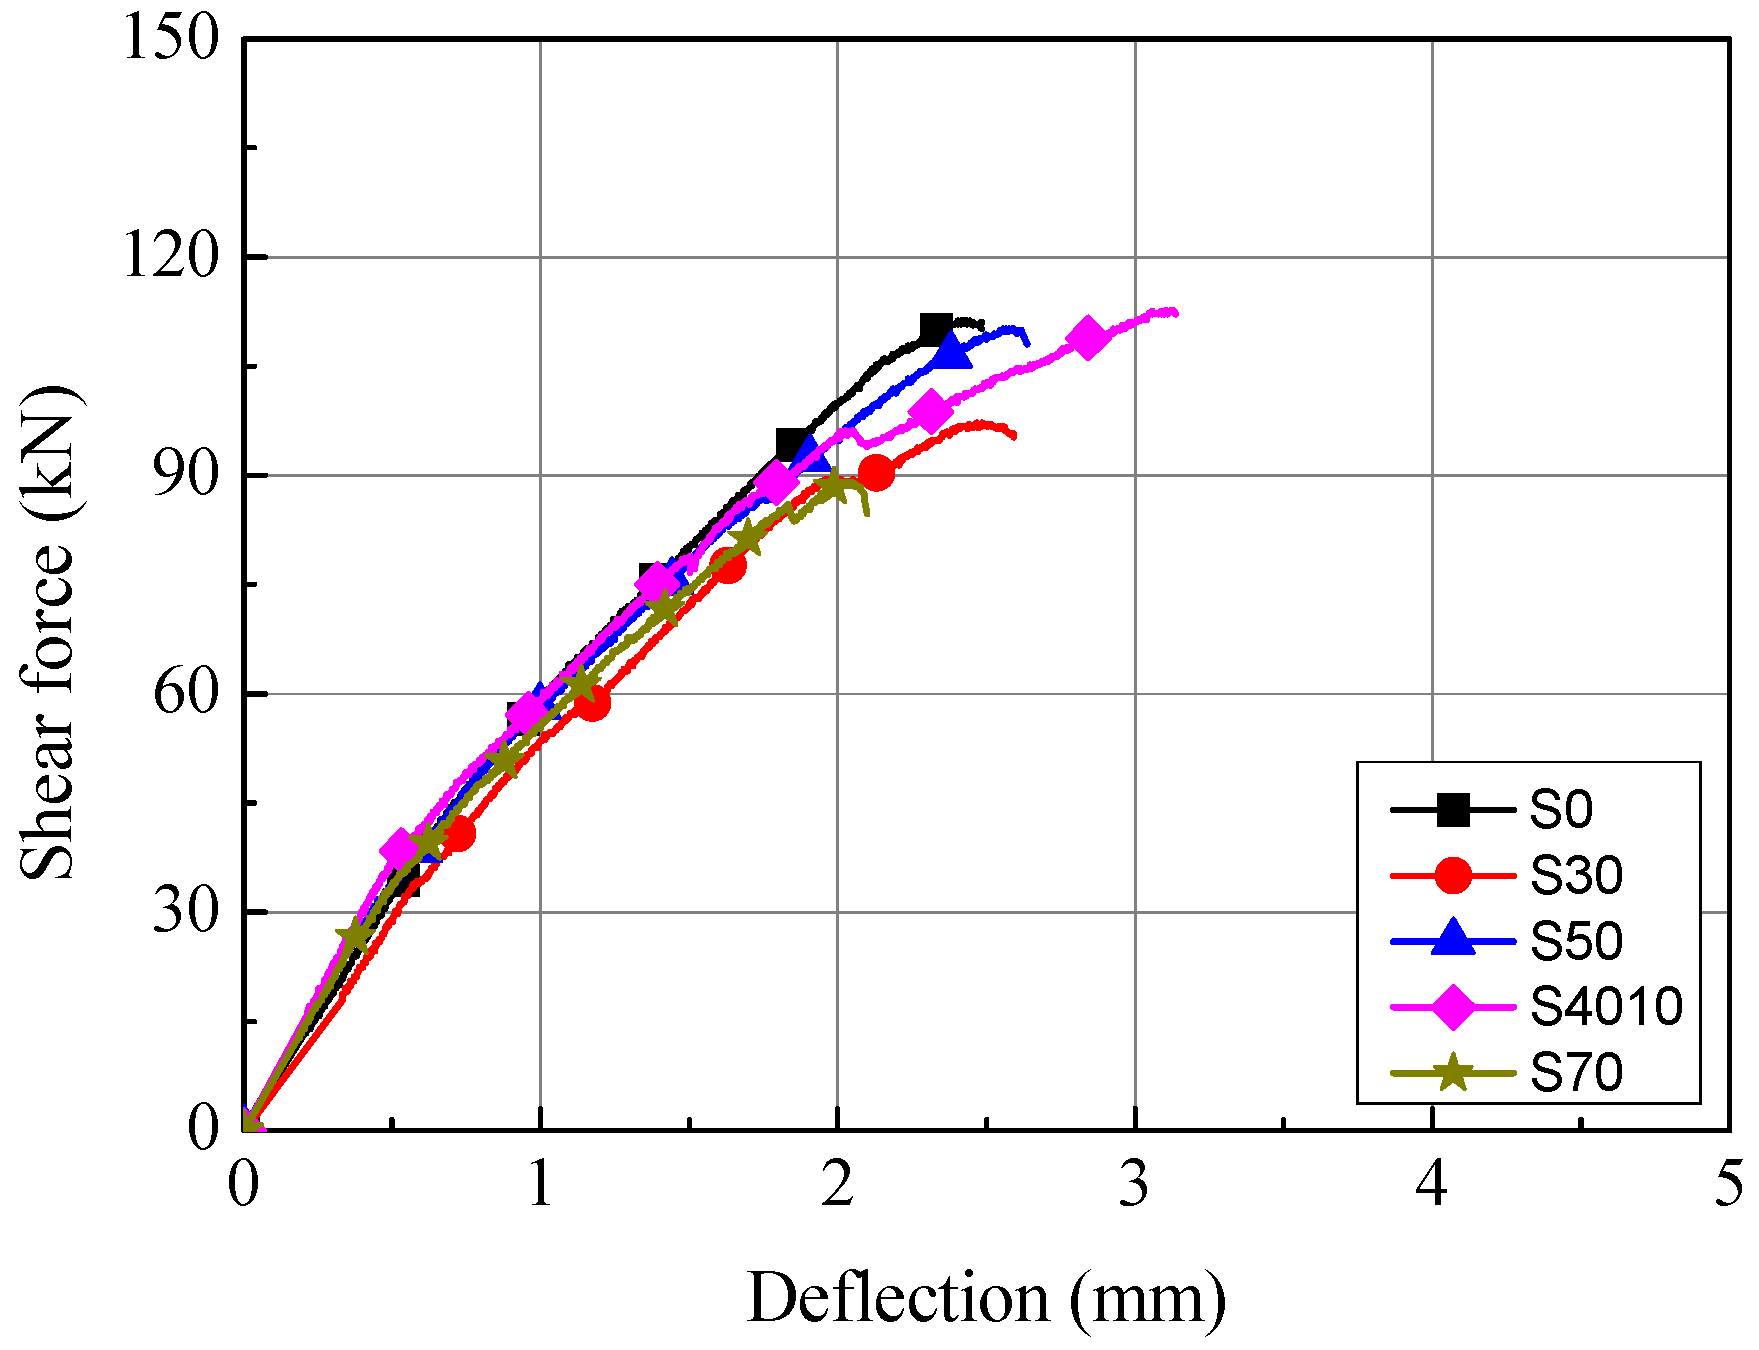
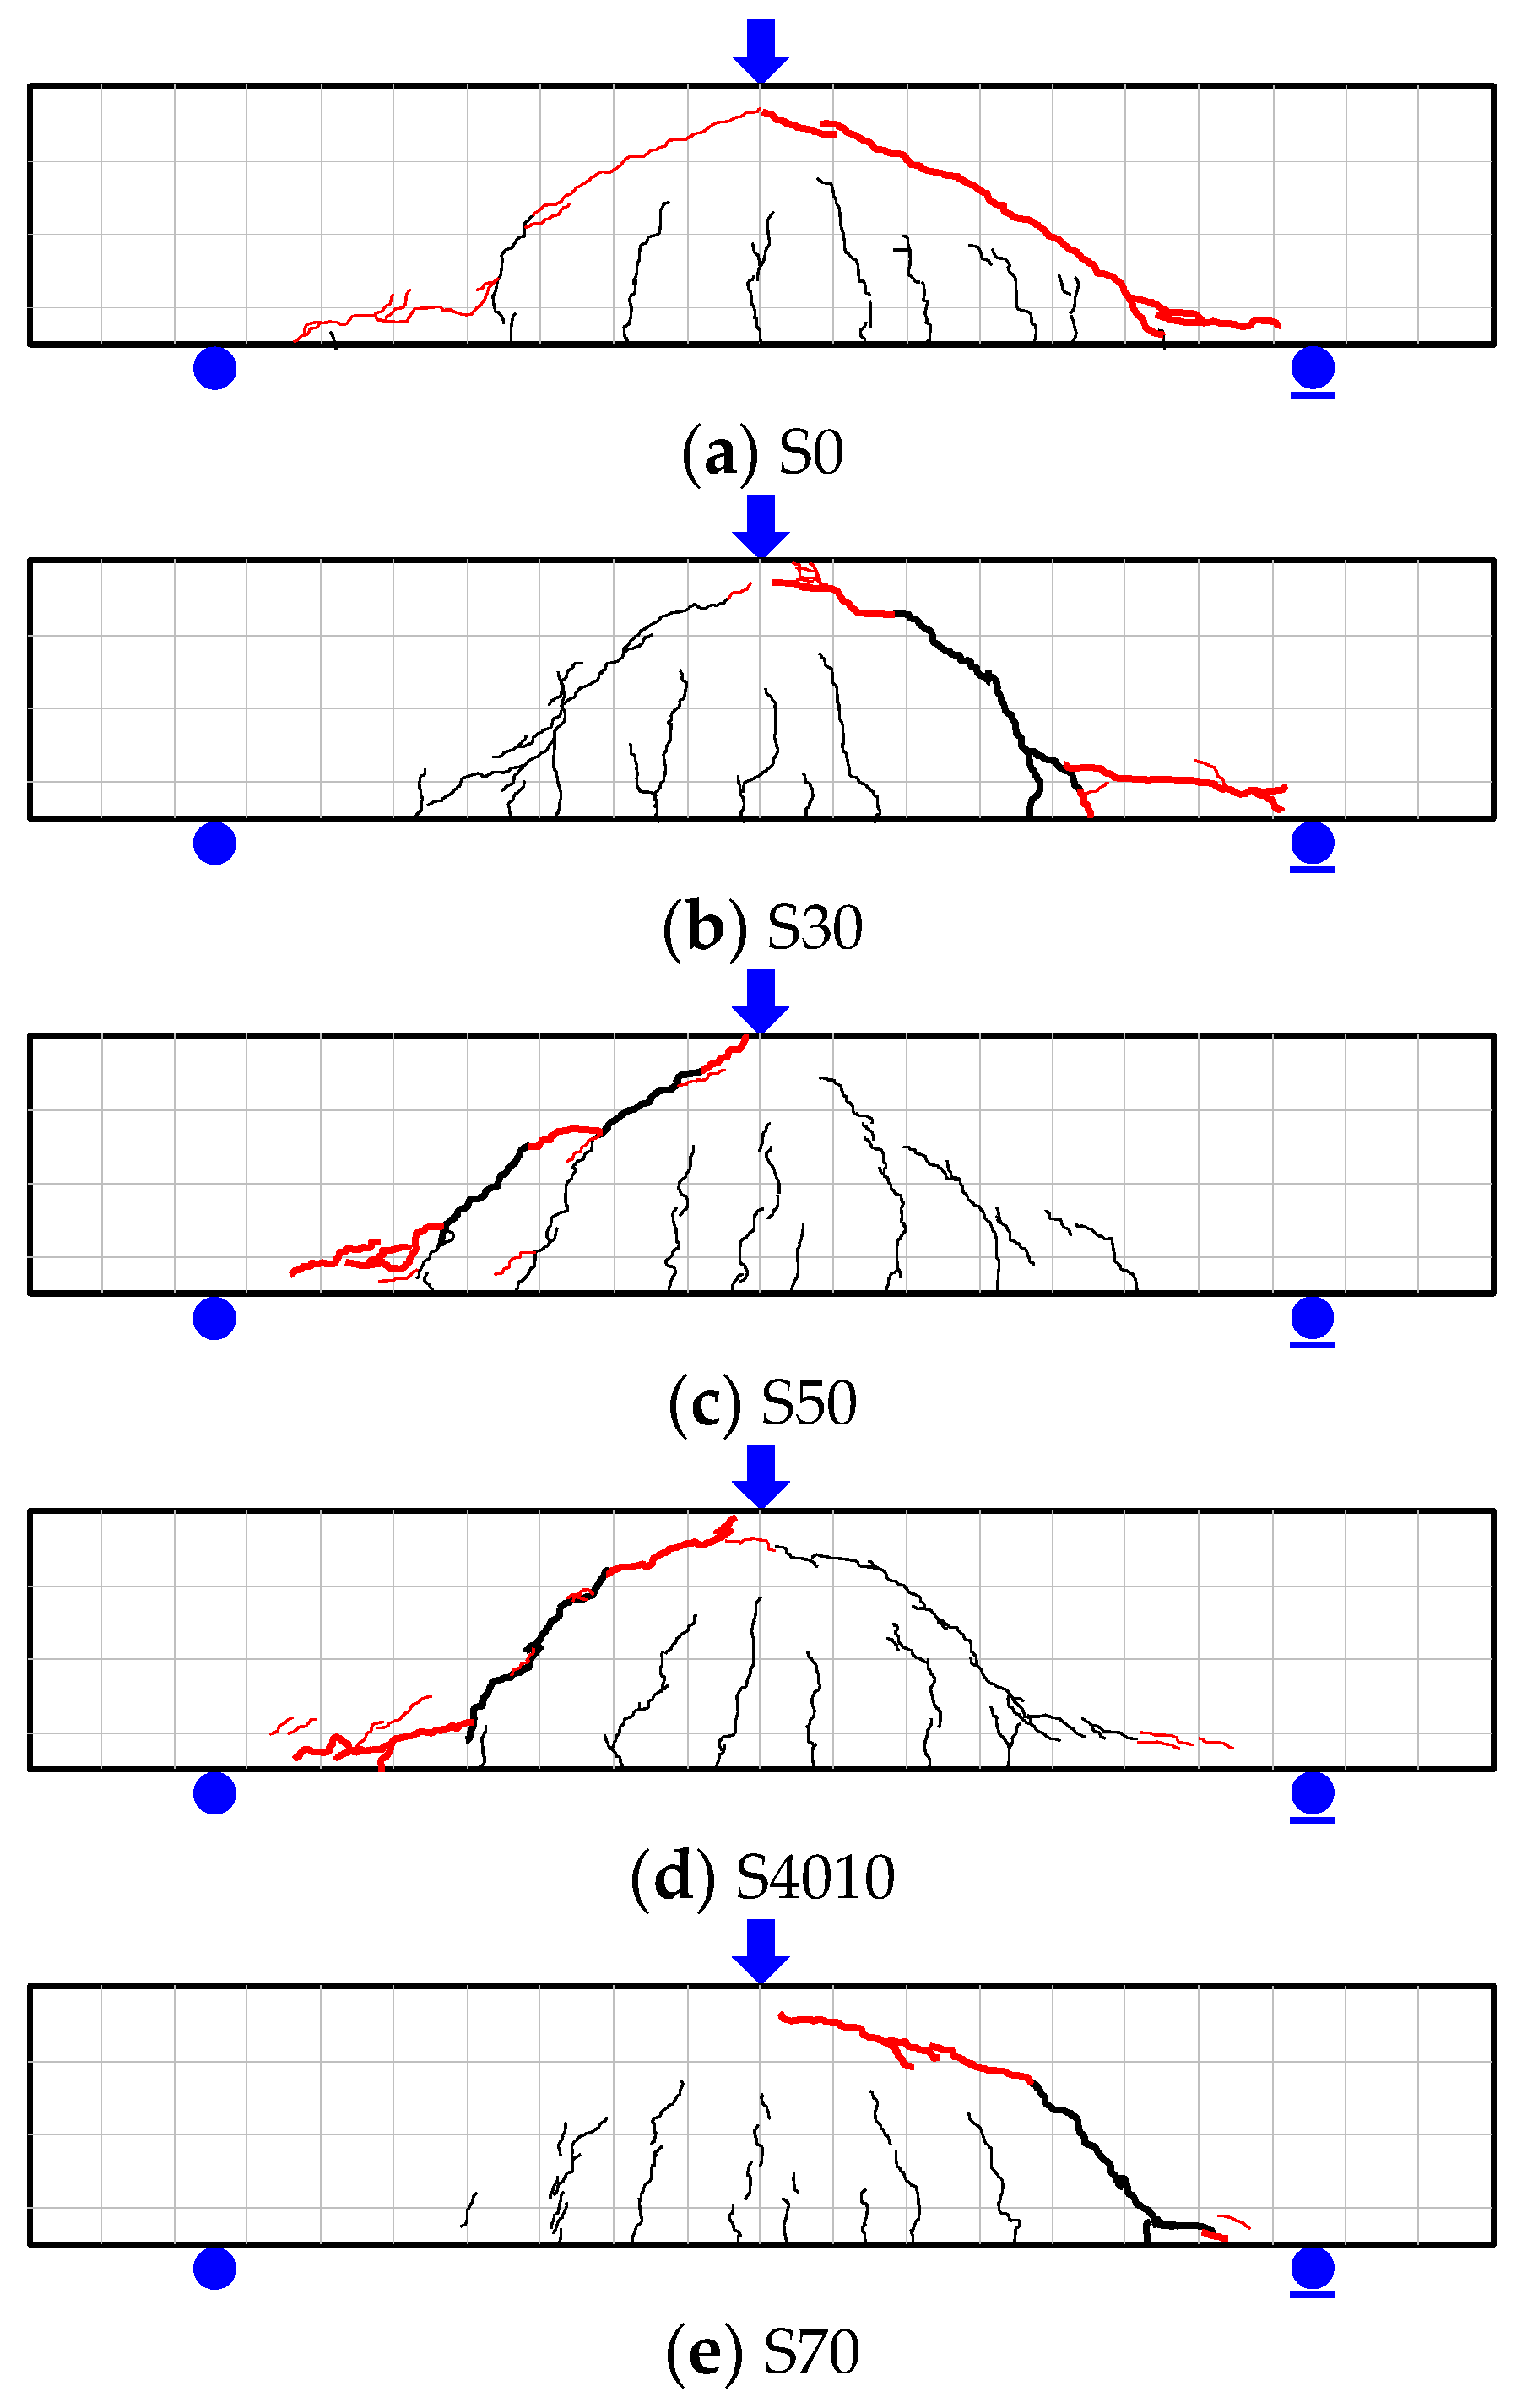
Figure 9 shows the shear force-deflection relationships of the S series specimens based on the load measured in the experiment and the deflection measured by the LVDT installed at the central bottom of the specimens. As shown in Figure 9 and Figure 10, flexural cracks were generated in the S series at the initial stage of loading, regardless of the replacement ratio of ground granulated blast furnace slag. As the shear force increased, diagonal cracks connecting loading and reaction positions were observed. After the generation of diagonal cracks, the S series specimens tended to resist the shear force through stress redistribution by dowel action of the tensile reinforcement, and showed shear behavior in which the stress decreased with the generation of additional diagonal cracks.
As shown in Table 4, the initial flexural cracks and diagonal cracks of the S series specimens were generated at the shear forces of 26.7 to 34.5 kN and 38.2 to 52.6 kN, respectively, for which the deflection was 0.39 to 0.57 mm and 0.60 to 0.86 mm, respectively. Therefore, the shear force and behavior were similar among the S series specimens regardless of the replacement ratio of ground granulated blast furnace slag. The maximum shear force of the S series specimens was highest in the S4010 specimen (112.8 kN) and lowest in the S70 specimen (88.8 kN). The stress of the S70 specimen was about 20% different from that of the reference S0 specimen, for which the concrete compressive strength at the maximum shear force was similar to the S70 specimen. Therefore, as the replacement ratio of ground granulated blast furnace slag increased, consideration is needed to secure the shear performance according to the decrement of the contribution by the concrete to the shear strength.
4.2. Comparison of Shear Strength
Table 4 compares the shear strength between the experimental results and the analytical results. The analytical results for the prediction of the shear strength, shown in Table 4, were obtained using the ACI 318-19 [25] and EC 2 [26] standards, which propose the contribution by the concrete to the shear strength, as described in Equations (6) and (7):
Here, represents the size effect modification factor, wherein , is the coefficient of lightweight concrete, is the ratio of tensional reinforcement, is the axial load, is the gross area of concrete section, is the partial factor for concrete and .
As shown in Table 4, the shear strength of the S series specimens was compared between the analytical and experimental results. According to ACI 318-19, the mean ratio of the experimental results to the analytical results was 1.43, and the coefficient of variation was 10.03%, indicating that the prediction was relatively conservative. According to EC 2, the mean ratio of the experimental results to the analytical results was 1.71, which was about 20% higher than that of ACI 318-19, indicating that the prediction of the experimental results was more conservative. However, EC 2 showed a coefficient of variation of 9.73%, which was about 3% lower in comparison with ACI 318-19, indicating that the accuracy of EC 2 was relatively high. In addition, comparison of the shear strength of the S series specimens between the analytical results and the experimental results confirmed that the specimens satisfied the performance required by the ACI 318-19 and EC 2 standards, regardless of the replacement ratio of ground granulated blast furnace slag. However, considering that the compressive strength of the concrete of the specimens fabricated by substituting ground granulated blast furnace slag tended to decrease in comparison with reference specimen S0 as the replacement ratio increased, it may be reasonable to set the replacement ratio of ground granulated blast furnace slag at 50% or lower to secure the shear performance.
5. Evaluation of Bond Performance
5.1. Bond Stress-Slip Relationships
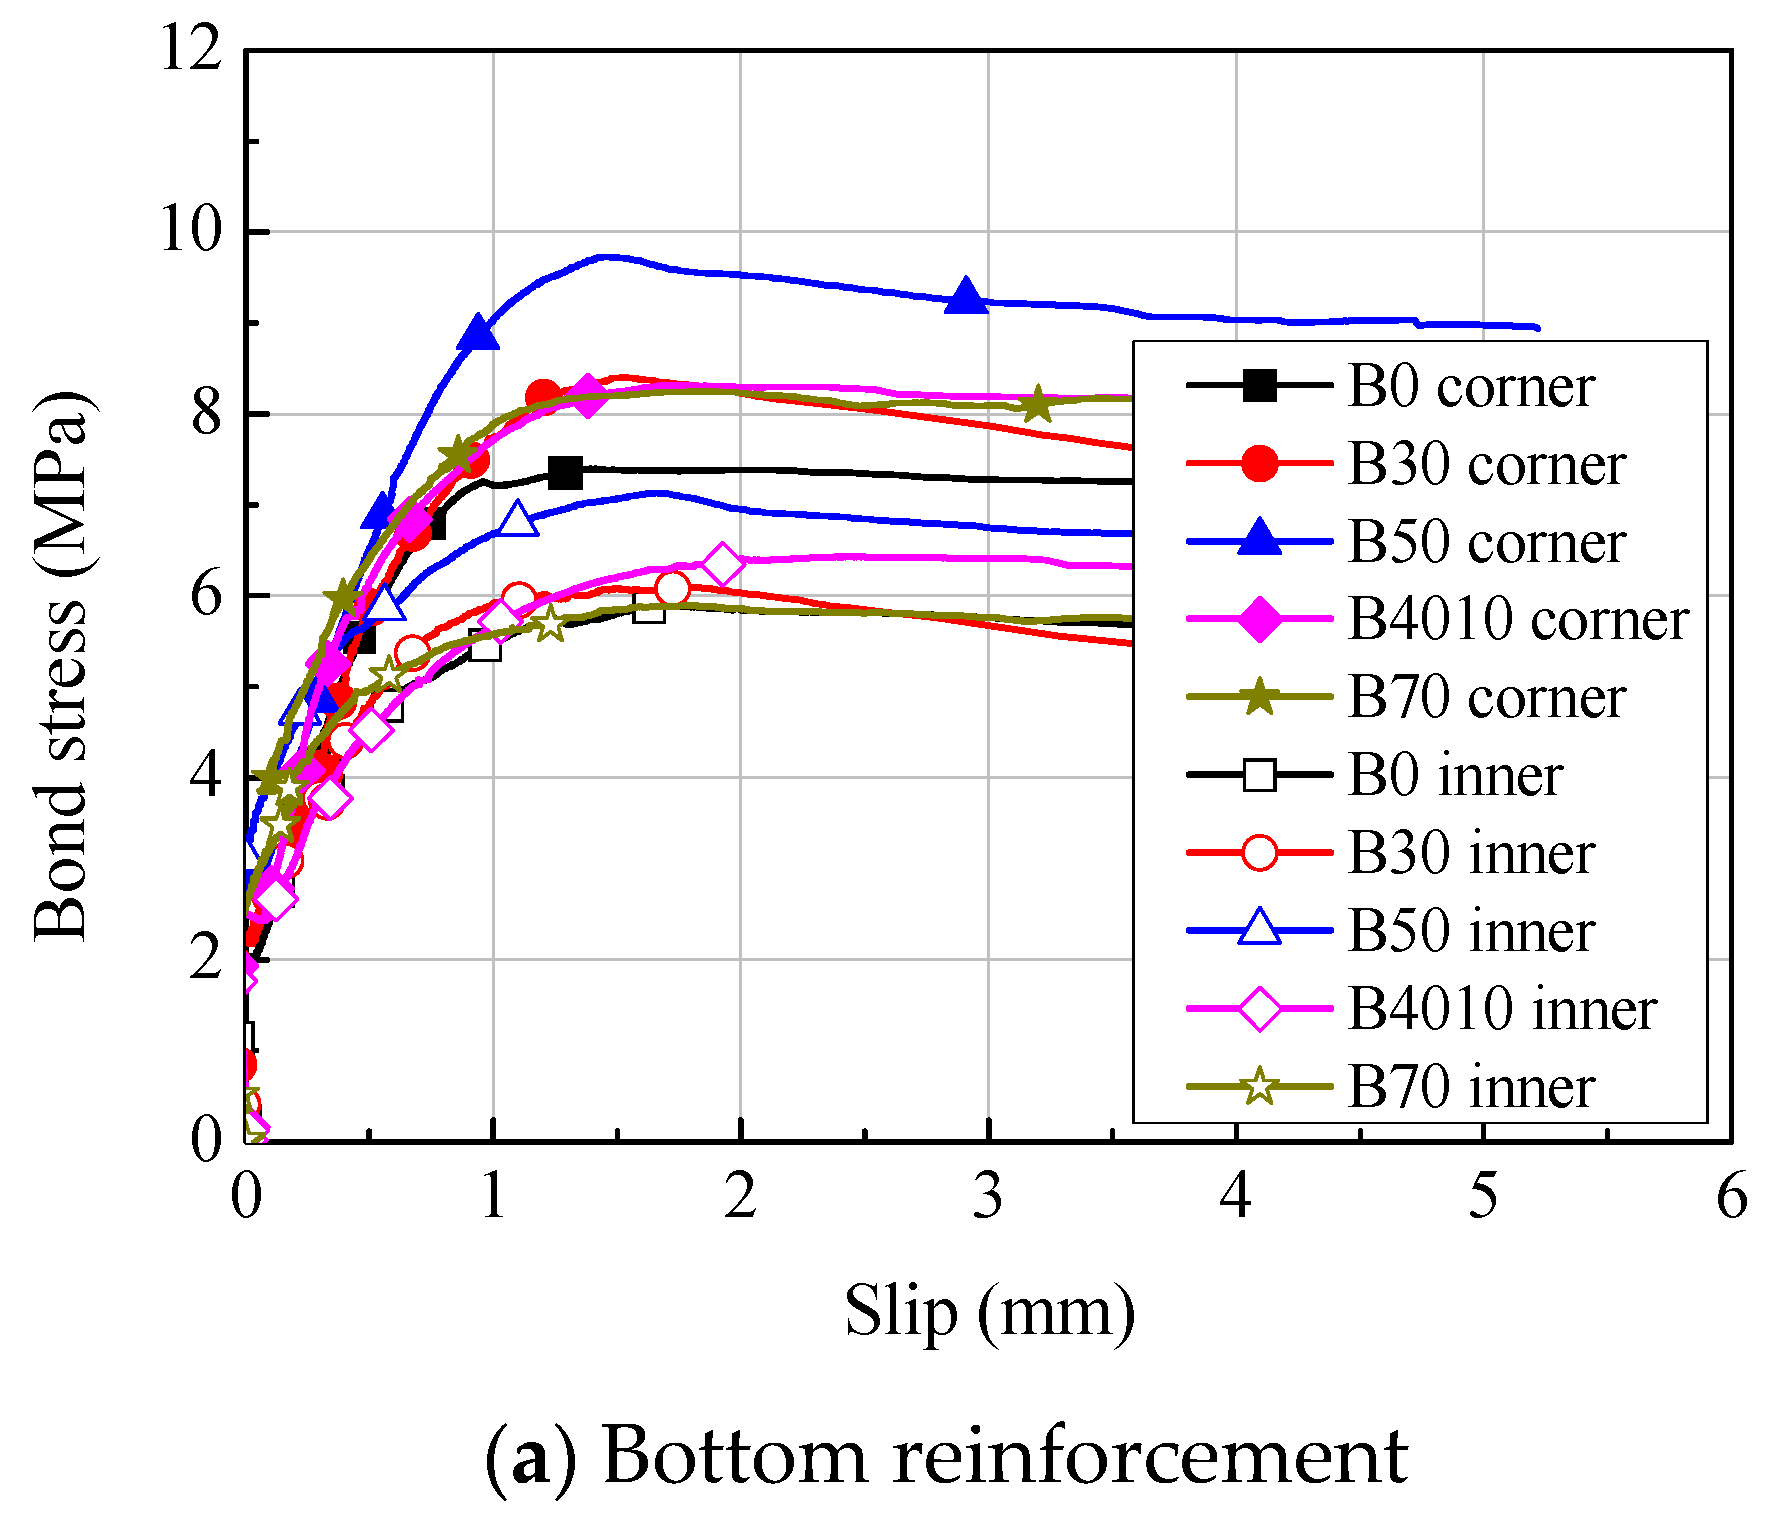
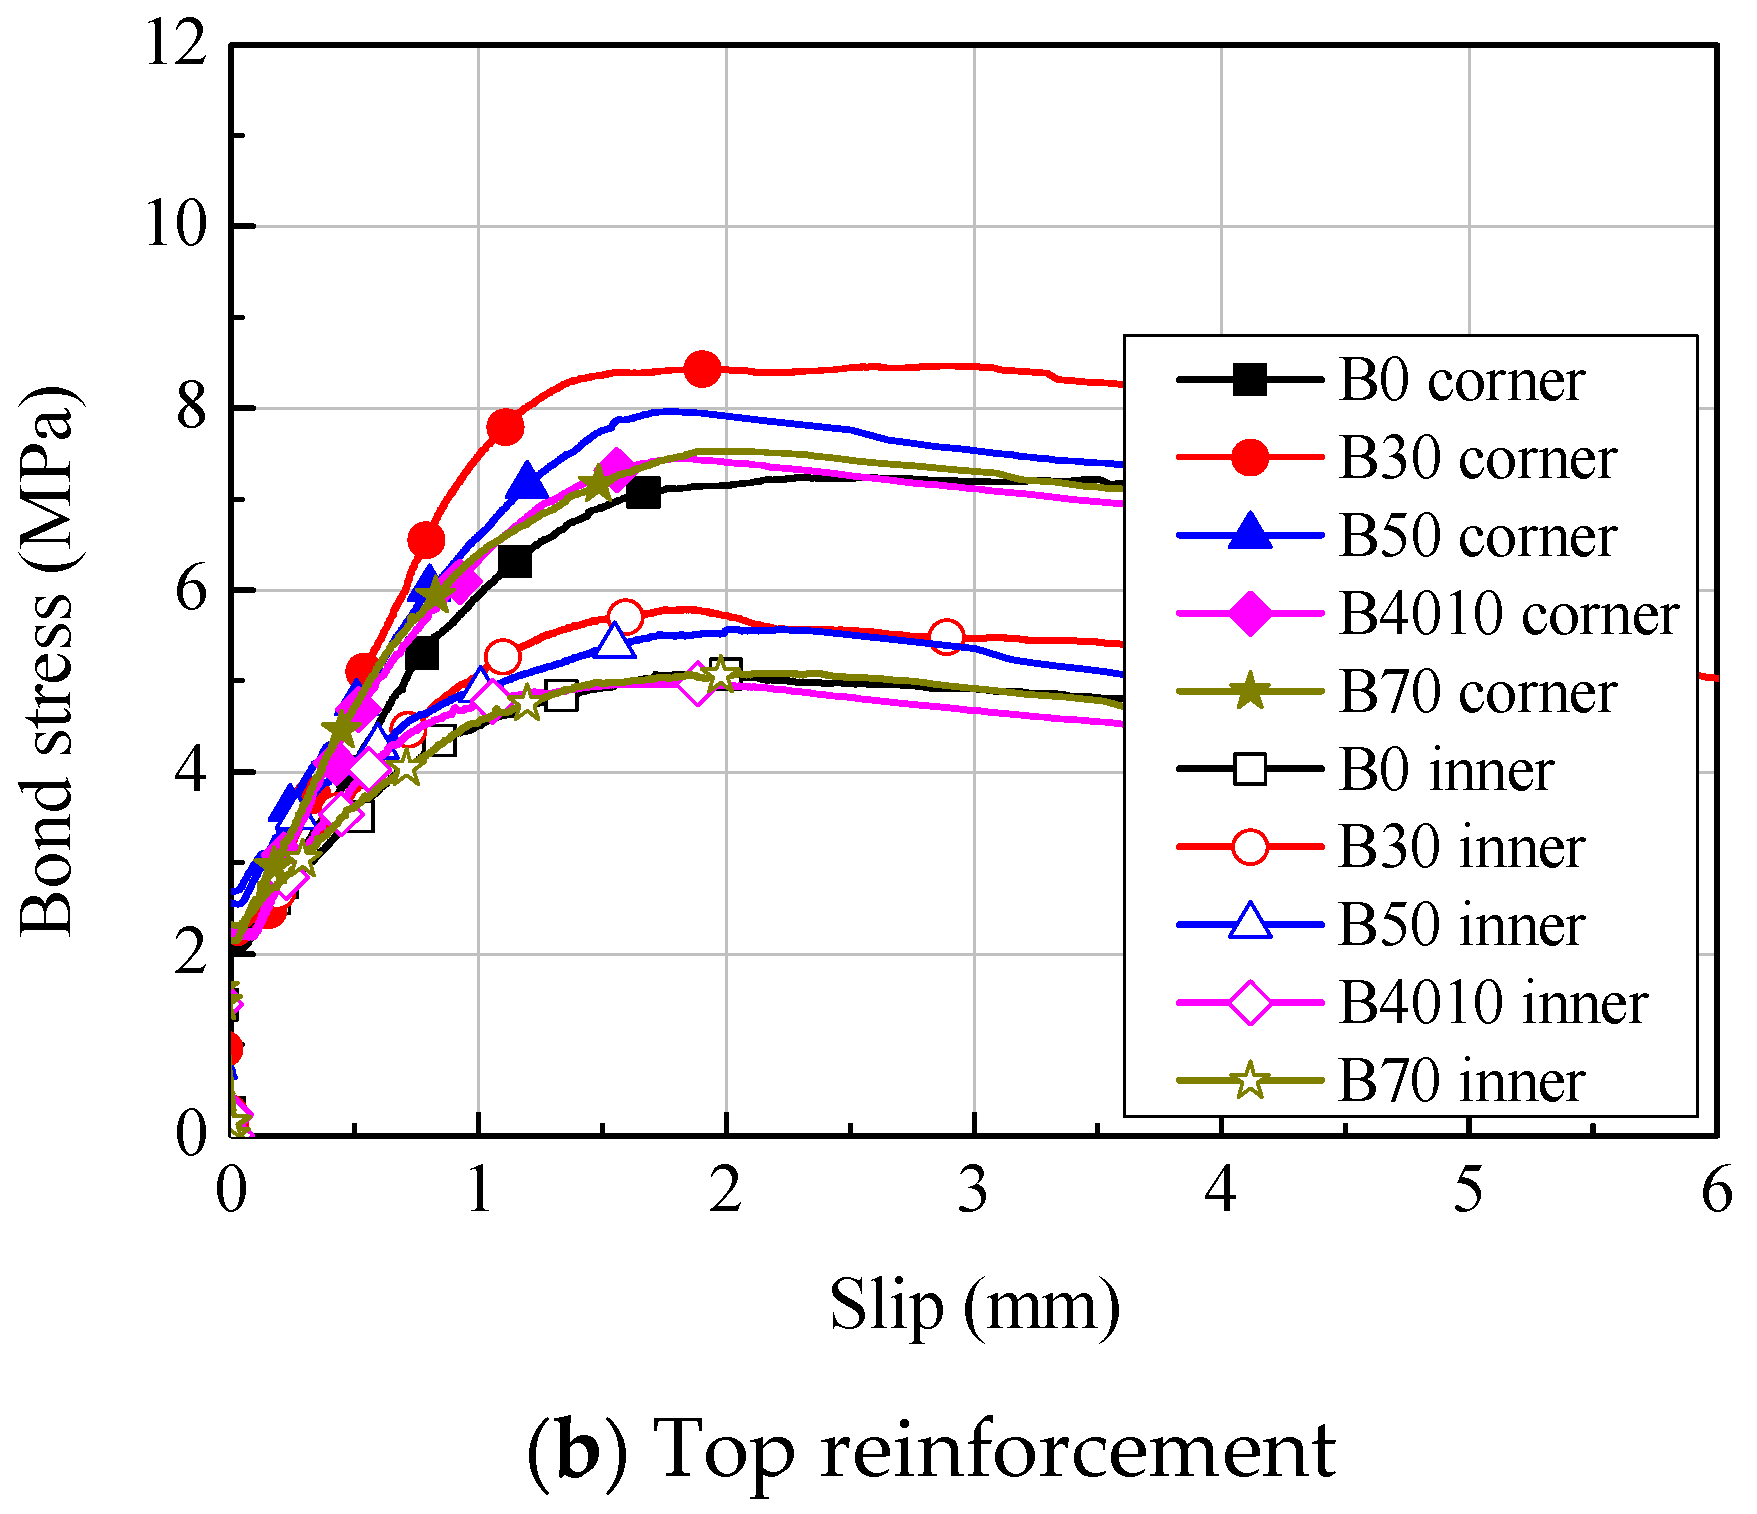
The bond stress-slip relationships and the bond strength of the B series specimens are shown in Figure 11 and Table 5, respectively. The bond stress of the longitudinal reinforcements was calculated using Equation (8) based on the strain distribution measured from the strain gauges attached to the crack-inducing grooves in the experimental zone, as shown in Figure 12. The slip was calculated using Equation (9), considering the elongation of the reinforcement from the value measured from the LVDTs installed at the ends of the specimens.
Here, is the strain of longitudinal reinforcement at the tension end, is the strain of longitudinal reinforcement at 250 mm apart from the tension end, is the elastic modulus of the reinforcement, is the cross-sectional area of the reinforcement, is the sum of the nominal perimeter of the reinforcement, is the the bond length and is the quantity of slip in the reinforcement measured by LVDT at the end of the specimen.
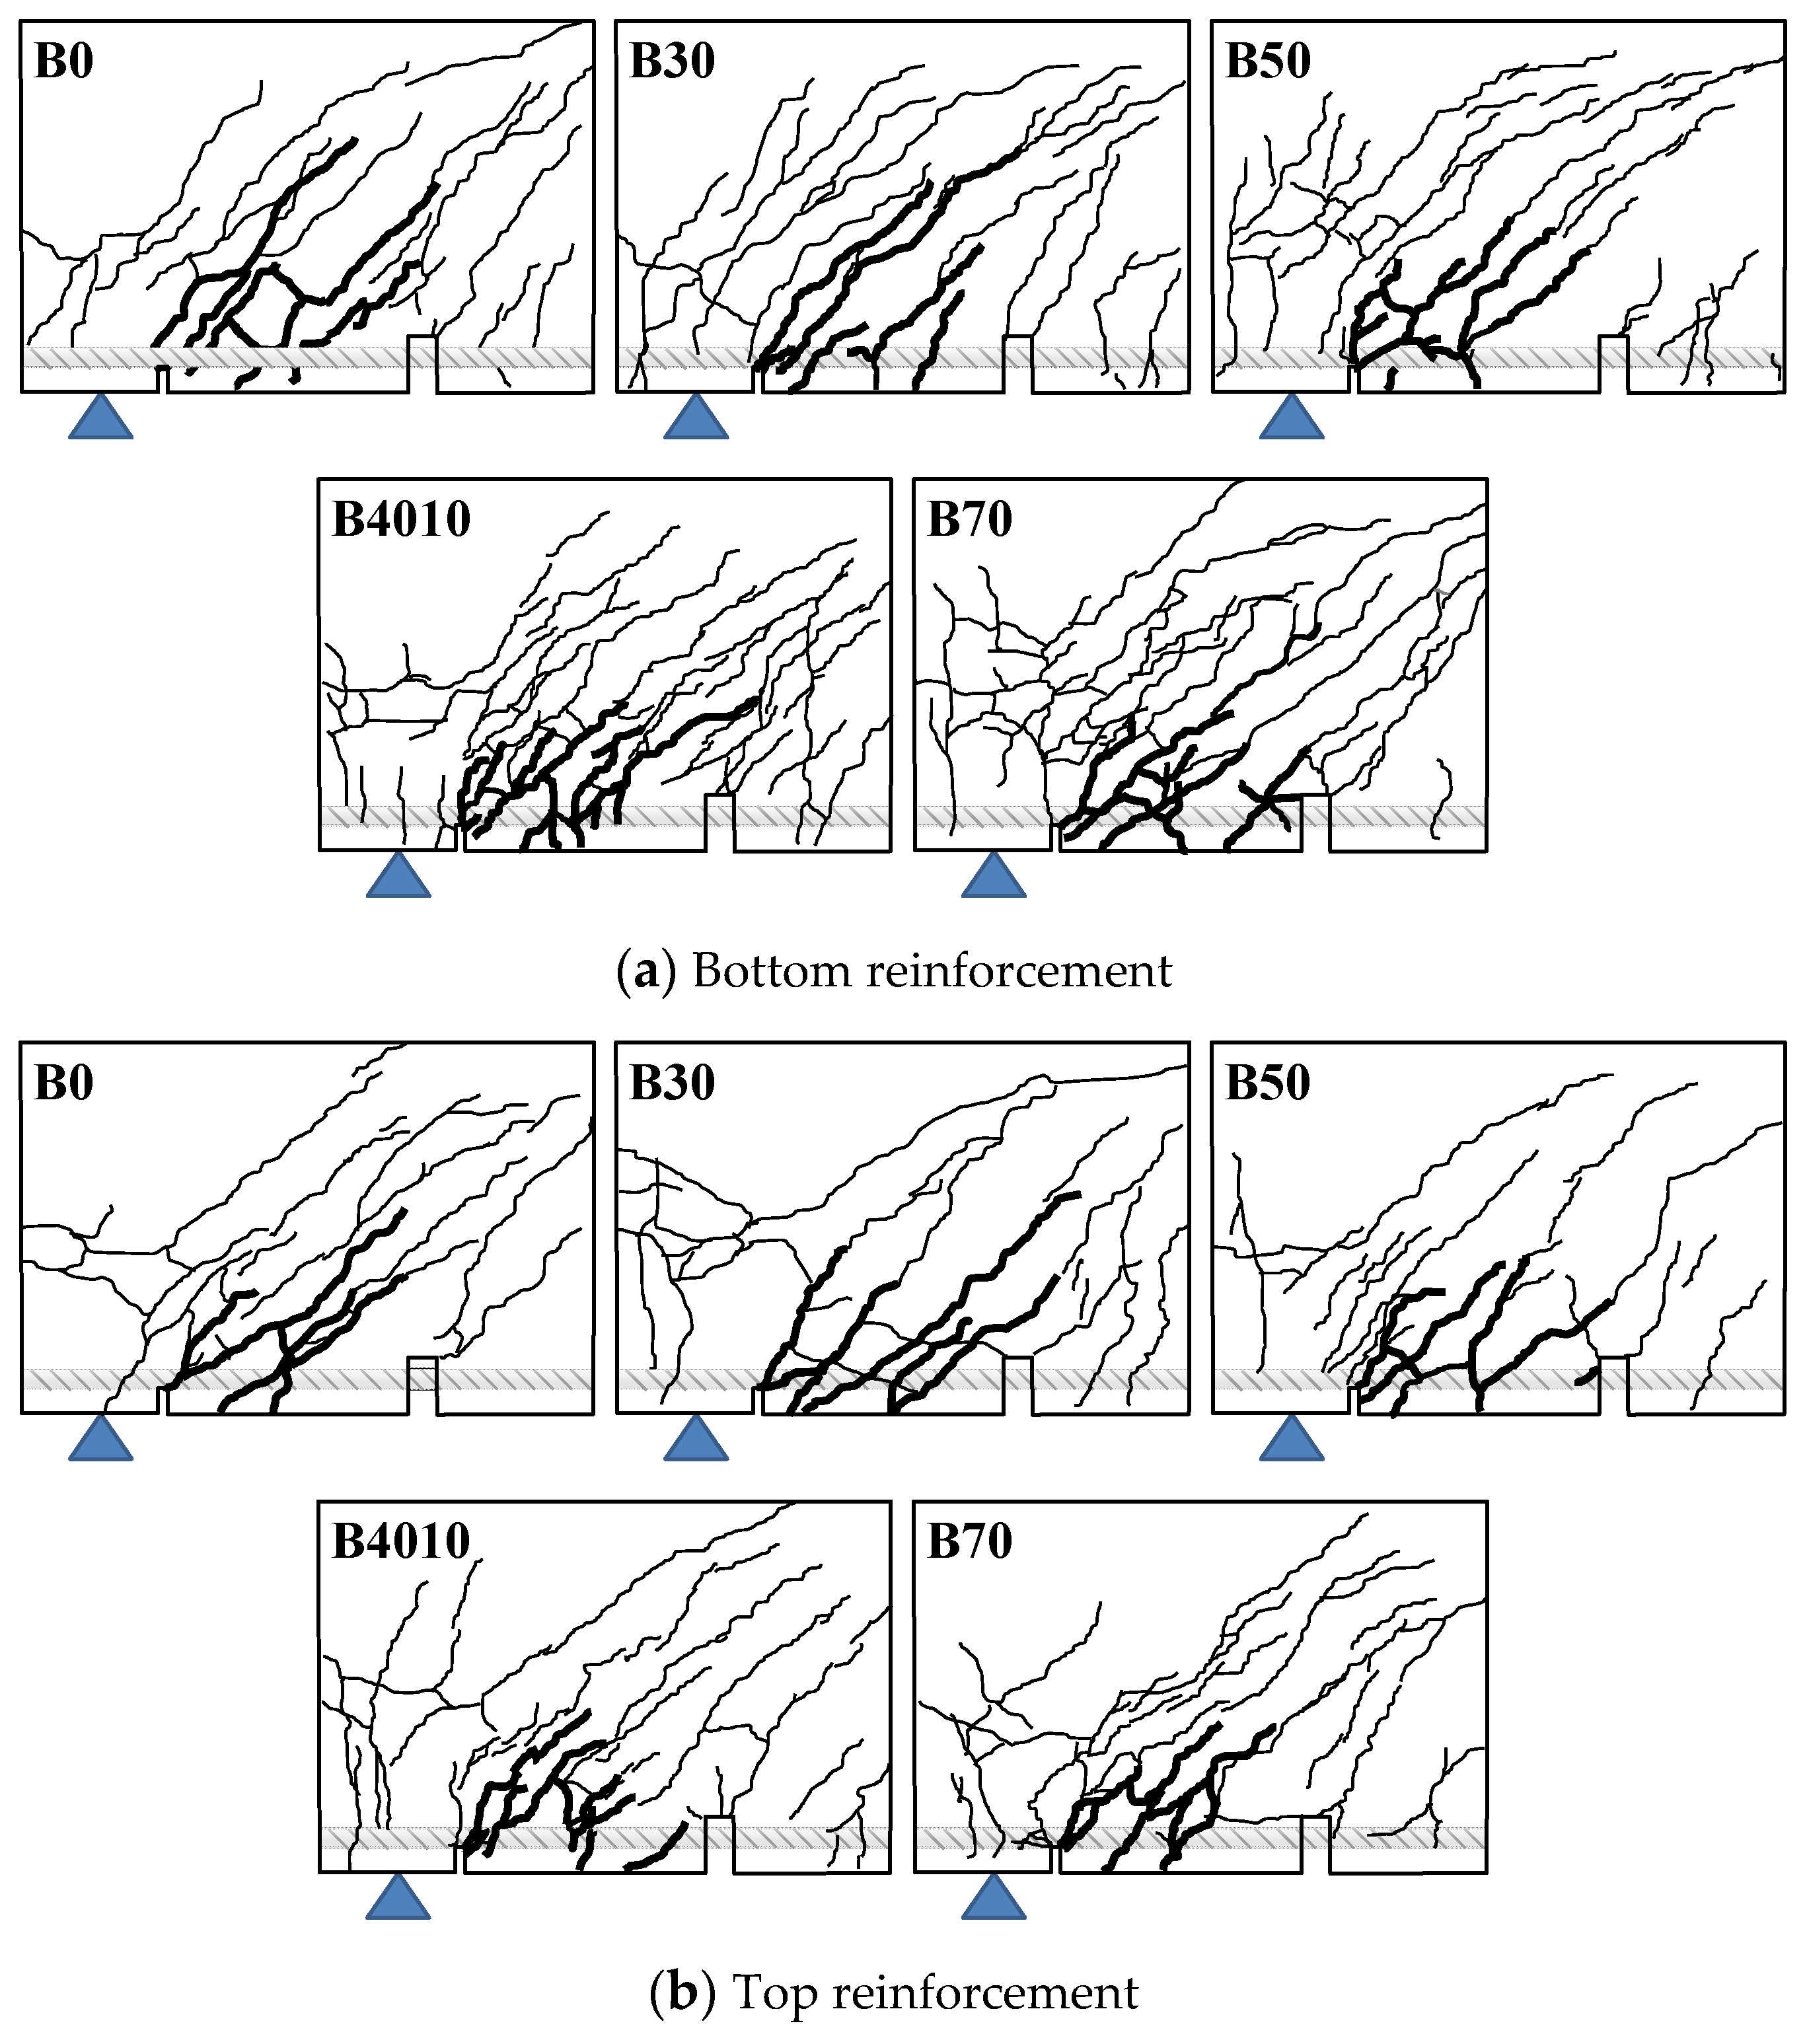
As shown in Figure 11 and Figure 13, regardless of the replacement ratio of ground granulated blast furnace slag, flexural cracks were found in the B series specimens at the crack-inducing grooves located at the boundary of the experimental zone in the early stage of the loading. As the load increased, flexural cracks increased, and many bond cracks were found in the experimental zone. When the maximum bond stress was reached, slip of the inner and corner longitudinal reinforcements was about 2 mm. Then, as the slip significantly increased, bond degradation also considerably occurred, decreasing the stress by bond failure.
As shown in Table 5, regardless of the replacement ratio of ground granulated blast furnace slag, the bond strength of the B series specimens was about 6.89 to 9.73 MPa at the corner longitudinal reinforcements and 4.97 to 7.13 MPa at the inner longitudinal reinforcements, the bond strength being about 37% higher at the corner longitudinal reinforcements than at the inner longitudinal reinforcements. This may be because the constraint of the transverse reinforcement provided more disadvantages to the inner longitudinal reinforcements than to the corner longitudinal reinforcements, and the overlapping of the ring-tension areas in the inner longitudinal reinforcements may have made the generation of bond cracks easier [4].
Comparison of the bond strength between the bottom reinforcements and the top reinforcements of the B series specimens showed that the mean bond strength of the bottom reinforcements was higher in all the B series specimens than those of the top reinforcements, at ratios of about 1.03 to 1.25, except for the B30 specimen. The consolidation effect of compacting during concrete placement may have increased the bond strength at the bottom reinforcements. In addition, the bond strengths in consideration of the compressive strength of the concrete () were compared. The ratio of the mean values of the specimens fabricated by substituting ground granulated blast furnace slag to the value of B0 were 0.84 to 1.19 and 0.90 to 1.04 at the bottom and top reinforcements, respectively. The ratio of the mean values at both the bottom and top reinforcements was 1.00, indicating that the bond performance was similar. Therefore, it was experimentally confirmed that there was no problem in force transmission between the reinforcement and the concrete, even when the replacement rate of ground granulated blast furnace slag was applied up to 70%.
5.2. Comparison of Bond Strength
The bond strength obtained from the experiment with the B series specimens was evaluated in comparison with the prediction results from ACI 318-19 [25], Fujii-Morita [27] and Maeda [28], as shown in Table 5. The prediction formulas according to ACI 318-19, Fujii-Morita and Maeda take into consideration the impacts of the concrete and the shear reinforcements in calculating the bond strength, as shown in Table 6.
Table 5 shows the ratio of the experimental results to the prediction results obtained from the B series specimens. Regardless of the replacement ratio of ground granulated blast furnace slag, the formula proposed by Maeda best predicted the experimental results, with a mean experimental/analytical ratio of 1.26 and a coefficient of variation of 8.8%. The mean experimental/analytical ratios according to the ACI 318-19 and Fujii-Morita formula were 1.57 and 1.47, respectively, and their coefficient of variation were 13.0% and 10.8%, indicating that these formulas underestimated the experimental results in comparison with Maeda’s formula. The coefficient of variation was about 23–48% higher, showing a relatively large deviation.
The bond strength was compared between the inner longitudinal reinforcements and the corner longitudinal reinforcements. The mean experimental/analytical ratios of the ACI 318-19, Fujii-Morita and Maeda formulas were 1.06 to 1.32 and their coefficient of variation were 7.3 to 9.6% for the inner longitudinal reinforcements; these values were 1.46 to 1.81 and 10.9 to 15.7% for the corner longitudinal reinforcements. This showed that predictions were better for inner longitudinal reinforcements than for corner longitudinal reinforcements. The difference may be because the prediction formulas did not consider the constraint by the transverse reinforcement. In addition, according to the positions of the longitudinal reinforcements, ACI 318-19 [25] evaluates the bond strength of the bottom reinforcements to be higher than that of the top reinforcements by about 30% and by about 22% in the case of Fujii-Morita [27]. Maeda [28] reflects the effect of the compressive strength of concrete and may appear differently depending on the compressive strength. However, when 50 MPa is applied, the bottom reinforcements are evaluated higher than the top reinforcements ones by about 14%. The experimental results showed that the mean bond strength of the B series specimens was about 11% higher at the bottom reinforcements than at the top reinforcements, which was similar to the prediction results. However, the absolute values of the bond strength, obtained experimentally, were lower by about 19% or more than the prediction results. The ratios of the bond strength of the bottom reinforcements to that of the top reinforcements were 1.08, 1.25 and 1.07 in the B0, B50 and B70 specimens, respectively. This suggests that the difference of the absolute bond strength between the experimental results and the prediction results may be due to an experimental error rather than being the effect of the replacement ratio of the ground granulated blast furnace slag.
6. Conclusions
This study was conducted to apply ground granulated blast furnace slag to precast concrete members to find an appropriate replacement ratio. The flexural, shear and bond performances of precast concrete beams were evaluated using the replacement ratio of ground granulated blast furnace slag as a variable. Although it may vary depending on the chemical composition of ground granulated blast furnace slag, the following conclusions could be obtained in this study.
- The flexural strength of the F series specimens was predicted by ACI 318-19 and EC 2. The mean ratio of the yield moment of the experimental results to that of the prediction results was 0.99, and the mean ratios of the ultimate moment were 1.21 and 1.19, respectively. This showed that the experimental results were predicted conservatively;
- The mean shear strengths of the S series specimens, measured experimentally, were 1.43 times and 1.71 times higher than the shear strength required by the ACI 318-19 and EC 2 standards, regardless of the replacement ratio of ground granulated blast furnace slag. However, in consideration of the concrete compressive strength, the shear strength of the S series specimens decreased as the replacement ratio of ground granulated blast furnace slag increased. Therefore, consideration is needed to determine the appropriate replacement ratio that can secure the required shear performance;
- The bond strengths of the B series specimens, measured experimentally, were 1.26 to 1.57 times higher than the values predicted by the formulas of ACI 318-19, Fujii-Morita and Maeda, regardless of the replacement ratio of ground granulated blast furnace slag. Therefore, the required bond strength was sufficiently satisfied. The formula proposed by Maeda predicted the experimental results at a mean experimental/analytical ratio of 1.26 with a coefficient of variation of 8.8%, indicating that the prediction was better than those obtained using formulas according to ACI 318-19 and Fujii-Morita;
- In consideration of the experimental results, in using the ground granulated blast furnace slag as an admixture for precast concrete, the cement replacement ratio may be increased up to 70% without causing any problems in securing the structural performance. However, in order to ensure sufficient safety of precast concrete members, it is considered reasonable to apply the replacement ratio of ground granulated blast furnace slag to 50% or less.
Author Contributions
Conceptualization, Y.-J.L. and K.-H.K.; methodology, Y.-J.L.; validation, H.-G.K.; formal analysis, Y.-J.L.; investigation, H.-G.K.; data curation, Y.-J.L.; writing—original draft preparation, Y.-J.L.; writing—review and editing, H.-G.K. and K.-H.K.; supervision, K.-H.K.; project administration, K.-H.K. All authors have read and agreed to the published version of the manuscript.
Funding
This work was supported by the Priority Research Centers Program through the National Research Foundation of Korea (NRF) funded by the Ministry of Education (2019R1A6A1A03032988) and this work was supported by the National Research Foundation of Korea (NRF) grant funded by the Korea government. (MSIT) (2018R1A2B3001656).
Institutional Review Board Statement
Not applicable.
Informed Consent Statement
Not applicable.
Data Availability Statement
The data presented in this study are available upon request from the corresponding author.
Acknowledgments
The authors would like to give sincere thanks to Sampyo Railway Corporation for supporting this work.
Conflicts of Interest
The authors declare no conflict of interest.
References
- Kim, K.-H.; Lim, J.-Y.; Ryu, D.-H.; Choi, S.-W. The present situation of production and it’s utilization of electronic arc furnace oxidizing slag in Korea and other countries. Mag. Korea Concr. Inst. 2007, 19, 51–57. [Google Scholar]
- Majhi, R.K.; Nayak, A.N.; Mukharjee, B.B. Characterization of lime activated recycled aggregate concrete with high-volume ground granulated blast furnace slag. Constr. Build. Mater. 2020, 259, 119882. [Google Scholar] [CrossRef]
- DePree, P.J.; Ferry, C.T. Mitigation of expansive electric arc furnace slag in brownfield redevelopment. In Proceedings of the GeoCongress 2008: Geosustainability and Geohazard Mitigation, New Orleans, LA, USA, 9–12 March 2008; pp. 271–278. [Google Scholar]
- Lee, Y.-J.; Kim, H.-G.; Kim, M.-J.; Kim, D.-H.; Kim, D.-S.; Kim, K.-H. Bond performance of reinforced concrete beams with electric arc furnace slag aggregates. Constr. Build. Mater. 2020, 244, 118366. [Google Scholar] [CrossRef]
- Gencel, O.; Munir, M.J.; Kazmi, S.M.S.; Sutcu, M.; Erdogmus, E.; Velasco, P.M.; Quesada, D.E. Recycling industrial slags in production of fired clay bricks for sustainable manufacturing. Ceram. Int. 2021, 47, 30425–30438. [Google Scholar] [CrossRef]
- Wang, K.; Zhi, G. Evaluating Properties of Blended Cements for Concrete Pavements; No. Final Report; Department of Civil, Construction and Environmental Engineering, Iowa State University: Ames, IA, USA, 2003. [Google Scholar]
- Macphee, D.E.; Cao, H.T. Theoretical description of impact of blast furnace slag on steel passivation in concrete. Mag. Concr. Res. 1993, 45, 63–69. [Google Scholar] [CrossRef]
- Ramezanianpour, A.A. Fly ash. In Cement Replacement Materials; Springer: Berlin, Germany, 2014; pp. 47–156. [Google Scholar]
- Rashad, A.M. An overview on rheology, mechanical properties and durability of high-volume slag used as a cement replacement in paste, mortar and concrete. Constr. Build. Mater. 2018, 187, 89–117. [Google Scholar] [CrossRef]
- Jiang, Y.; Ling, T.-C.; Shi, C.; Pan, S.-Y. Characteristics of steel slags and their use in cement and concrete-A review. Resour. Conserv. Recycl. 2018, 136, 187–197. [Google Scholar] [CrossRef]
- Haha, M.B.; Lothenbach, B.; Le Saout, G.; Winnefeld, F. Influence of slag chemistry on the hydration of alkali-activated blast-furnace slag-Part II: Effect of Al2O3. Cem. Concr. Res. 2012, 42, 4274–4283. [Google Scholar] [CrossRef]
- Song, H.-W.; Saraswathy, V. Studies on the corrosion resistance of reinforced steel in concrete with ground granulated blast-furnace slag-an overview. J. Hazard. Mater. 2006, 138, 226–233. [Google Scholar] [CrossRef]
- Caijun, S.; Yinyu, L. Investigation on some factors affecting the characteristics of alkali-phosphorus slag cement. Cem. Concr. Res. 1989, 19, 527–533. [Google Scholar] [CrossRef]
- Gruskovnjak, A.; Lothenbach, B.; Winnefeld, F.; Figi, R.; Ko, S.C.; Adler, M.; Mäder, U. Hydration mechanisms of super sulphated slag cement. Cem. Concr. Res. 2008, 38, 983–992. [Google Scholar] [CrossRef] [Green Version]
- Taylor, H.F.W. Cement Chemistry; Thomas Telford Publishing: London, UK, 1997. [Google Scholar]
- Shi, D.; Ye, J.; Zhang, W. Effects of activator content on properties, mineralogy, hydration and microstructure of alkali-activated materials synthesized from calcium silicate slag and ground granulated blast furnace slag. J. Build. Eng. 2020, 32, 101791. [Google Scholar] [CrossRef]
- Duży, P.; Sitarz, M.; Adamczyk, M.; Choińska, M.; Hager, I. Chloride ions’ penetration of fly ash and ground granulated blast furnace slags-based alkali-activated mortars. Materials 2021, 14, 6583. [Google Scholar] [CrossRef] [PubMed]
- Yue, Y.; Wang, J.J.; Basheer, P.A.M.; Bai, Y. Establishing the carbonation profile with Raman spectroscopy: Effects of fly ash and ground granulated blast furnace slag. Materials 2021, 14, 1798. [Google Scholar] [CrossRef] [PubMed]
- Özbay, E.; Erdemir, M.; Durmus, H.I. Utilization and efficiency of ground granulated blast furnace slag on concrete properties-A review. Constr. Build. Mater. 2016, 105, 423–434. [Google Scholar] [CrossRef]
- Kim, S.-W.; Lee, Y.-J.; Lee, J.-Y.; Kim, K.-H. Application of electric arc furnace oxidizing slag for environmental load reduction. Asian J. Chem. 2014, 26, 5867–5870. [Google Scholar] [CrossRef]
- Yazıcı, H.; Yardımcı, M.Y.; Yiğiter, H.; Aydın, S.; Türkel, S. Mechanical properties of reactive powder concrete containing high volumes of ground granulated blast furnace slag. Cem. Concr. Compos. 2010, 32, 639–648. [Google Scholar] [CrossRef]
- Escalante-Garcia, J.I.; Sharp, J.H. Effect of temperature on the hydration of the main clinker phases in Portland cements: Part II, blended cements. Cem. Concr. Res. 1998, 28, 1259–1274. [Google Scholar] [CrossRef]
- Lee, Y.-J.; Lee, B.-S.; Lee, J.-S.; Kim, S.-W.; Kim, K.-H. Bond performance of precast RC beams according to replacement ratio of ground granulated blast furnace slag. J. Arch. Inst. Korea 2013, 29, 61–68. [Google Scholar]
- Lee, Y.-J.; Kim, H.-G.; Jeong, C.-Y.; Kim, D.-H.; Han, S.-P.; Kim, K.-H. Effect of surface roughness characteristics on structural performance of hollow core slabs. Materials 2021, 14, 2610. [Google Scholar] [CrossRef]
- ACI Committee 318. Building Code Requirements for Structural Concrete (ACI 318-19) and Commentary (ACI 318R-19); American Concrete Institute (ACI): Farmington Hills, MI, USA, 2019.
- British Standard Institution. Eurocode 2: Design of Concrete Structures (BS EN 1992-1-1:2004); British Standard Institution (BSI): London, UK, 2004. [Google Scholar]
- Fujii, S.; Morita, S. Effect of transverse reinforcement on splitting bond strength. Trans. Jpn. Concr. Inst. 1981, 3, 237–244. [Google Scholar]
- Maeda, M. Study on Bond Splitting Failure of Reinforced Concrete Members. Master’s Thesis, The University of Tokyo, Tokyo, Japan, 1994. [Google Scholar]
Figure 1.
Stress–strain relationships of concrete.

Figure 2.
Stress-strain relationships of concrete.

Figure 3.
Details of specimen (unit: mm).

Figure 4.
Test setup of specimen.

Figure 5.
Load-deflection relationships of F series.

Figure 6.
Stress distribution in the cross-section at ultimate.

Figure 7.
Neutral axis depth ratio-moment relationships of F series.

Figure 8.
Crack width-load relationships of F series.

Figure 9.
Shear force-deflection relationships of S series.

Figure 10.
Crack patterns at failure of S series.

Figure 11.
Average bond stress-slip relationships.


Figure 12.
Measuring method of slip.

Figure 13.
Crack patterns at failure of B series.


Table 1.
Concrete mix proportions.
| Specimens | fck (MPa) | W/B (%) | S/a (%) | Unit Weight (kg/m3) | |||||||
|---|---|---|---|---|---|---|---|---|---|---|---|
| W | C | GGBS | FA | S | G | AE | AD | ||||
| C0 | 45 | 36.0 | 47.9 | 180 | 500 | - | - | 812 | 883 | 1.25 | 3.00 |
| C30 | 34.4 | 172 | 350 | 150 | - | 817 | 888 | 1.75 | |||
| C50 | 32.4 | 162 | 250 | 250 | - | 827 | 899 | 2.00 | |||
| C4010 | 32.4 | 162 | 250 | 200 | 50 | 821 | 892 | 2.50 | |||
| C70 | 30.4 | 152 | 150 | 350 | - | 836 | 909 | 2.50 | |||
W/B: water binder ratio, S/a: fine aggregate modulus, W: water, C: cement, GGBS: ground granulated blast furnace slag, FA: fly ash, S: fine aggregate, G: coarse aggregate, AE: air-entraining agent, AD: water reducing admixture.
Table 2.
Properties of specimens.
| Specimens | f’c (MPa) | Size (mm) | a/d | Reinforcement (MPa) | |||||
|---|---|---|---|---|---|---|---|---|---|
| h | b | l | Tension | Compression | Shear | ||||
| F series | F0 | 46.7 | 200 | 350 | 3300 | 4.0 | 3-D22 fy = 448.7 | 2-D13 fy = 471.0 | D10@100 mm fwy = 496.6 |
| F30 | 58.0 | ||||||||
| F50 | 53.1 | ||||||||
| F4010 | 56.9 | ||||||||
| F70 | 45.2 | ||||||||
| S series | S0 | 46.7 | 200 | 350 | 2000 | 2.5 | 3-D22 fy = 544.0 | 2-D10 fy = 496.6 | - |
| S30 | 58.0 | ||||||||
| S50 | 53.1 | ||||||||
| S4010 | 56.9 | ||||||||
| S70 | 45.2 | ||||||||
| B series | B0 | 46.7 | 250 | 400 | 2300 | 2.0 | 6-D22 fy = 626.8 | D10@50 mm fwy = 517.3 | |
| B30 | 58.0 | ||||||||
| B50 | 53.1 | ||||||||
| B4010 | 56.9 | ||||||||
| B70 | 45.2 | ||||||||
f’c: compressive strength of concrete, h: height of section, b: width of section, l: length, a/d: shear span to depth ratio.
Table 3.
Comparison between analytical and experimental results of F series.
| Specimens | f’c (MPa) | Experimental Result | Experimental/Analytical | |||||||||
|---|---|---|---|---|---|---|---|---|---|---|---|---|
| Moment | Curvature | Deflection | My,exp/My, ana | Mu, exp/Mu, ACI | Mu, exp/Mu, EC2 | |||||||
| My (kN·m) | Mu (kN·m) | φy (mm−1) | φu (mm−1) | φu/φy | Δy (mm) | Δu (mm) | Δu/Δy | |||||
| F0 | 46.7 | 133.4 | 165.7 | 1.34 | 8.46 | 6.45 | 13.1 | 29.7 | 2.27 | 0.97 | 1.18 | 1.17 |
| F30 | 58.0 | 133.3 | 171.4 | 1.33 | 12.58 | 9.46 | 12.8 | 34.4 | 2.69 | 0.97 | 1.20 | 1.19 |
| F50 | 53.1 | 130.1 | 172.4 | 1.31 | 12.92 | 9.86 | 12.5 | 36.0 | 2.88 | 0.94 | 1.22 | 1.20 |
| F4010 | 56.9 | 139.0 | 170.8 | 1.36 | 11.24 | 8.26 | 13.6 | 35.6 | 2.62 | 1.01 | 1.20 | 1.19 |
| F70 | 45.2 | 144.9 | 170.4 | 1.40 | - | - | 14.1 | 33.2 | 2.35 | 1.05 | 1.22 | 1.20 |
| Mean | 0.99 | 1.21 | 1.19 | |||||||||
| COV (%) | 4.32 | 1.26 | 1.25 | |||||||||
My: yield moment, Mu: ultimate moment, φy: yield curvature, φu: ultimate curvature, Δy: deflection at yield moment, Δu: deflection at ultimate moment.
Table 4.
Comparison between analytical and experimental results of S series.
| Specimens | f’c (MPa) | Experimental Result | Experimental/Analytical | ||||||
|---|---|---|---|---|---|---|---|---|---|
| At Flexural Crack | At Diagonal Tension Crack | At Peak | Vu, exp/Vu, ACI | Vu, exp/Vu, EC2 | |||||
| Vcr (kN) | Δcr (mm) | Vd (kN) | Δd (mm) | Vu (kN) | Δu (mm) | ||||
| S0 | 46.7 | 34.5 | 0.51 | 52.6 | 0.86 | 111.2 | 2.40 | 1.61 | 1.89 |
| S30 | 58.0 | 33.8 | 0.57 | 49.2 | 0.79 | 97.2 | 2.49 | 1.26 | 1.54 |
| S50 | 53.1 | 28.2 | 0.41 | 49.4 | 0.80 | 110.2 | 2.58 | 1.49 | 1.80 |
| S4010 | 56.9 | 35.4 | 0.48 | 49.4 | 0.76 | 112.8 | 3.10 | 1.48 | 1.80 |
| S70 | 45.2 | 26.7 | 0.39 | 38.2 | 0.60 | 88.8 | 2.01 | 1.30 | 1.53 |
| Mean | 1.43 | 1.71 | |||||||
| COV (%) | 10.03 | 9.73 | |||||||
Vcr: shear force at flexural crack, Δcr: deflection at flexural crack, Vd: shear force at diagonal tension crack, Δd: deflection at diagonal tension crack, Vu: shear force at peak, Δu: deflection at peak.
Table 5.
Comparison between analytical and experimental results of B series.
| Specimens | f’c (MPa) | Experimental Result (MPa) | Experimental/Analytical | ||||||||||
|---|---|---|---|---|---|---|---|---|---|---|---|---|---|
| ACI 318-19 (Considering Ktr) | Fujii-Morita | Maeda | |||||||||||
| τcorner | τinner | τmean | τcorner/τana | τinner/τana | τmean/τana | τcorner/τana | τinner/τana | τmean/τana | τcorner/τana | τinner/τana | τmean/τana | ||
| B0-B | 46.7 | 7.40 | 5.90 | 6.65 | 1.58 | 1.26 | 1.42 | 1.54 | 1.22 | 1.38 | 1.33 | 1.06 | 1.20 |
| B30-B | 58.0 | 7.69 | 6.00 | 6.85 | 1.47 | 1.15 | 1.31 | 1.43 | 1.12 | 1.27 | 1.31 | 1.03 | 1.17 |
| B50-B | 53.1 | 9.73 | 7.13 | 8.43 | 1.95 | 1.43 | 1.69 | 1.89 | 1.39 | 1.64 | 1.70 | 1.25 | 1.47 |
| B4010-B | 56.9 | 6.89 | 5.82 | 6.36 | 1.33 | 1.12 | 1.23 | 1.30 | 1.09 | 1.19 | 1.18 | 1.00 | 1.09 |
| B70-B | 45.2 | 7.74 | 5.76 | 6.75 | 1.68 | 1.25 | 1.46 | 1.63 | 1.22 | 1.42 | 1.40 | 1.05 | 1.23 |
| B0-T | 46.7 | 7.24 | 5.08 | 6.16 | 2.01 | 1.41 | 1.71 | 1.83 | 1.29 | 1.56 | 1.49 | 1.05 | 1.27 |
| B30-T | 58.0 | 8.46 | 5.76 | 7.11 | 2.10 | 1.43 | 1.77 | 1.92 | 1.31 | 1.62 | 1.62 | 1.10 | 1.36 |
| B50-T | 53.1 | 7.97 | 5.57 | 6.77 | 2.07 | 1.45 | 1.76 | 1.89 | 1.32 | 1.61 | 1.57 | 1.10 | 1.34 |
| B4010-T | 56.9 | 7.32 | 4.97 | 6.15 | 1.83 | 1.25 | 1.54 | 1.68 | 1.14 | 1.41 | 1.41 | 0.96 | 1.18 |
| B70-T | 45.2 | 7.53 | 5.09 | 6.31 | 2.12 | 1.43 | 1.78 | 1.94 | 1.31 | 1.62 | 1.57 | 1.06 | 1.31 |
| Mean | 1.81 | 1.32 | 1.57 | 1.71 | 1.24 | 1.47 | 1.46 | 1.06 | 1.26 | ||||
| COV (%) | 15.7 | 9.6 | 13.0 | 13.3 | 7.9 | 10.8 | 10.9 | 7.3 | 8.8 | ||||
Publisher’s Note: MDPI stays neutral with regard to jurisdictional claims in published maps and institutional affiliations. |
© 2021 by the authors. Licensee MDPI, Basel, Switzerland. This article is an open access article distributed under the terms and conditions of the Creative Commons Attribution (CC BY) license (https://creativecommons.org/licenses/by/4.0/).
Share and Cite
MDPI and ACS Style
Lee, Y.-J.; Kim, H.-G.; Kim, K.-H. Effect of Ground Granulated Blast Furnace Slag Replacement Ratio on Structural Performance of Precast Concrete Beams. Materials 2021, 14, 7159. https://0-doi-org.brum.beds.ac.uk/10.3390/ma14237159
AMA Style
Lee Y-J, Kim H-G, Kim K-H. Effect of Ground Granulated Blast Furnace Slag Replacement Ratio on Structural Performance of Precast Concrete Beams. Materials. 2021; 14(23):7159. https://0-doi-org.brum.beds.ac.uk/10.3390/ma14237159
Chicago/Turabian StyleLee, Yong-Jun, Hyeong-Gook Kim, and Kil-Hee Kim. 2021. "Effect of Ground Granulated Blast Furnace Slag Replacement Ratio on Structural Performance of Precast Concrete Beams" Materials 14, no. 23: 7159. https://0-doi-org.brum.beds.ac.uk/10.3390/ma14237159
Note that from the first issue of 2016, this journal uses article numbers instead of page numbers. See further details here.