
The Influence of Tool Wear on the Mechanical Performance of AA6061-T6 Refill Friction Stir Spot Welds

 ,
,
Abstract
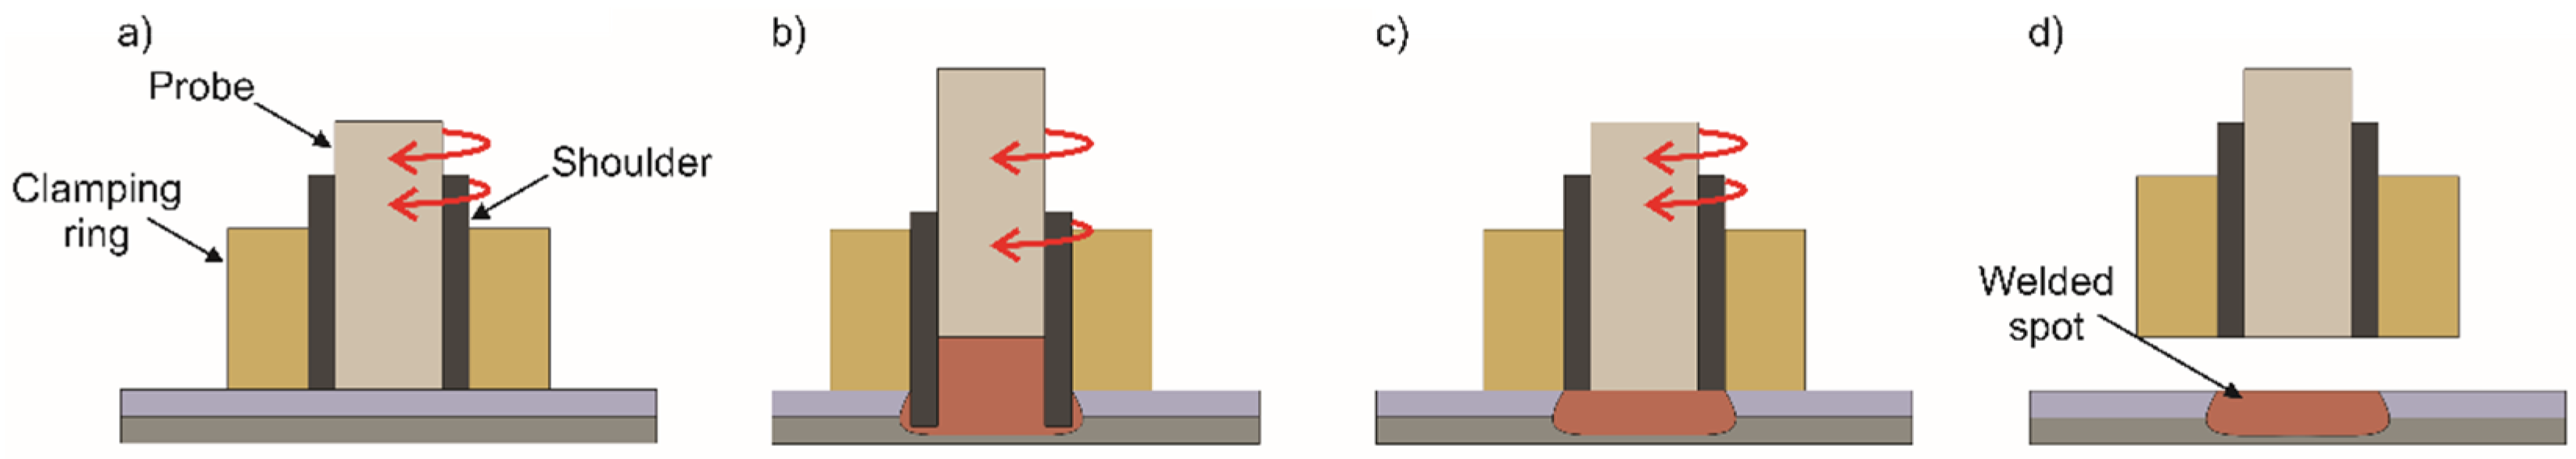
:1. Introduction
2. Materials and Methods
2.1. Base Materials and Welding Equipment
2.2. Mechanical Testing and Optimization of Welding Parameters
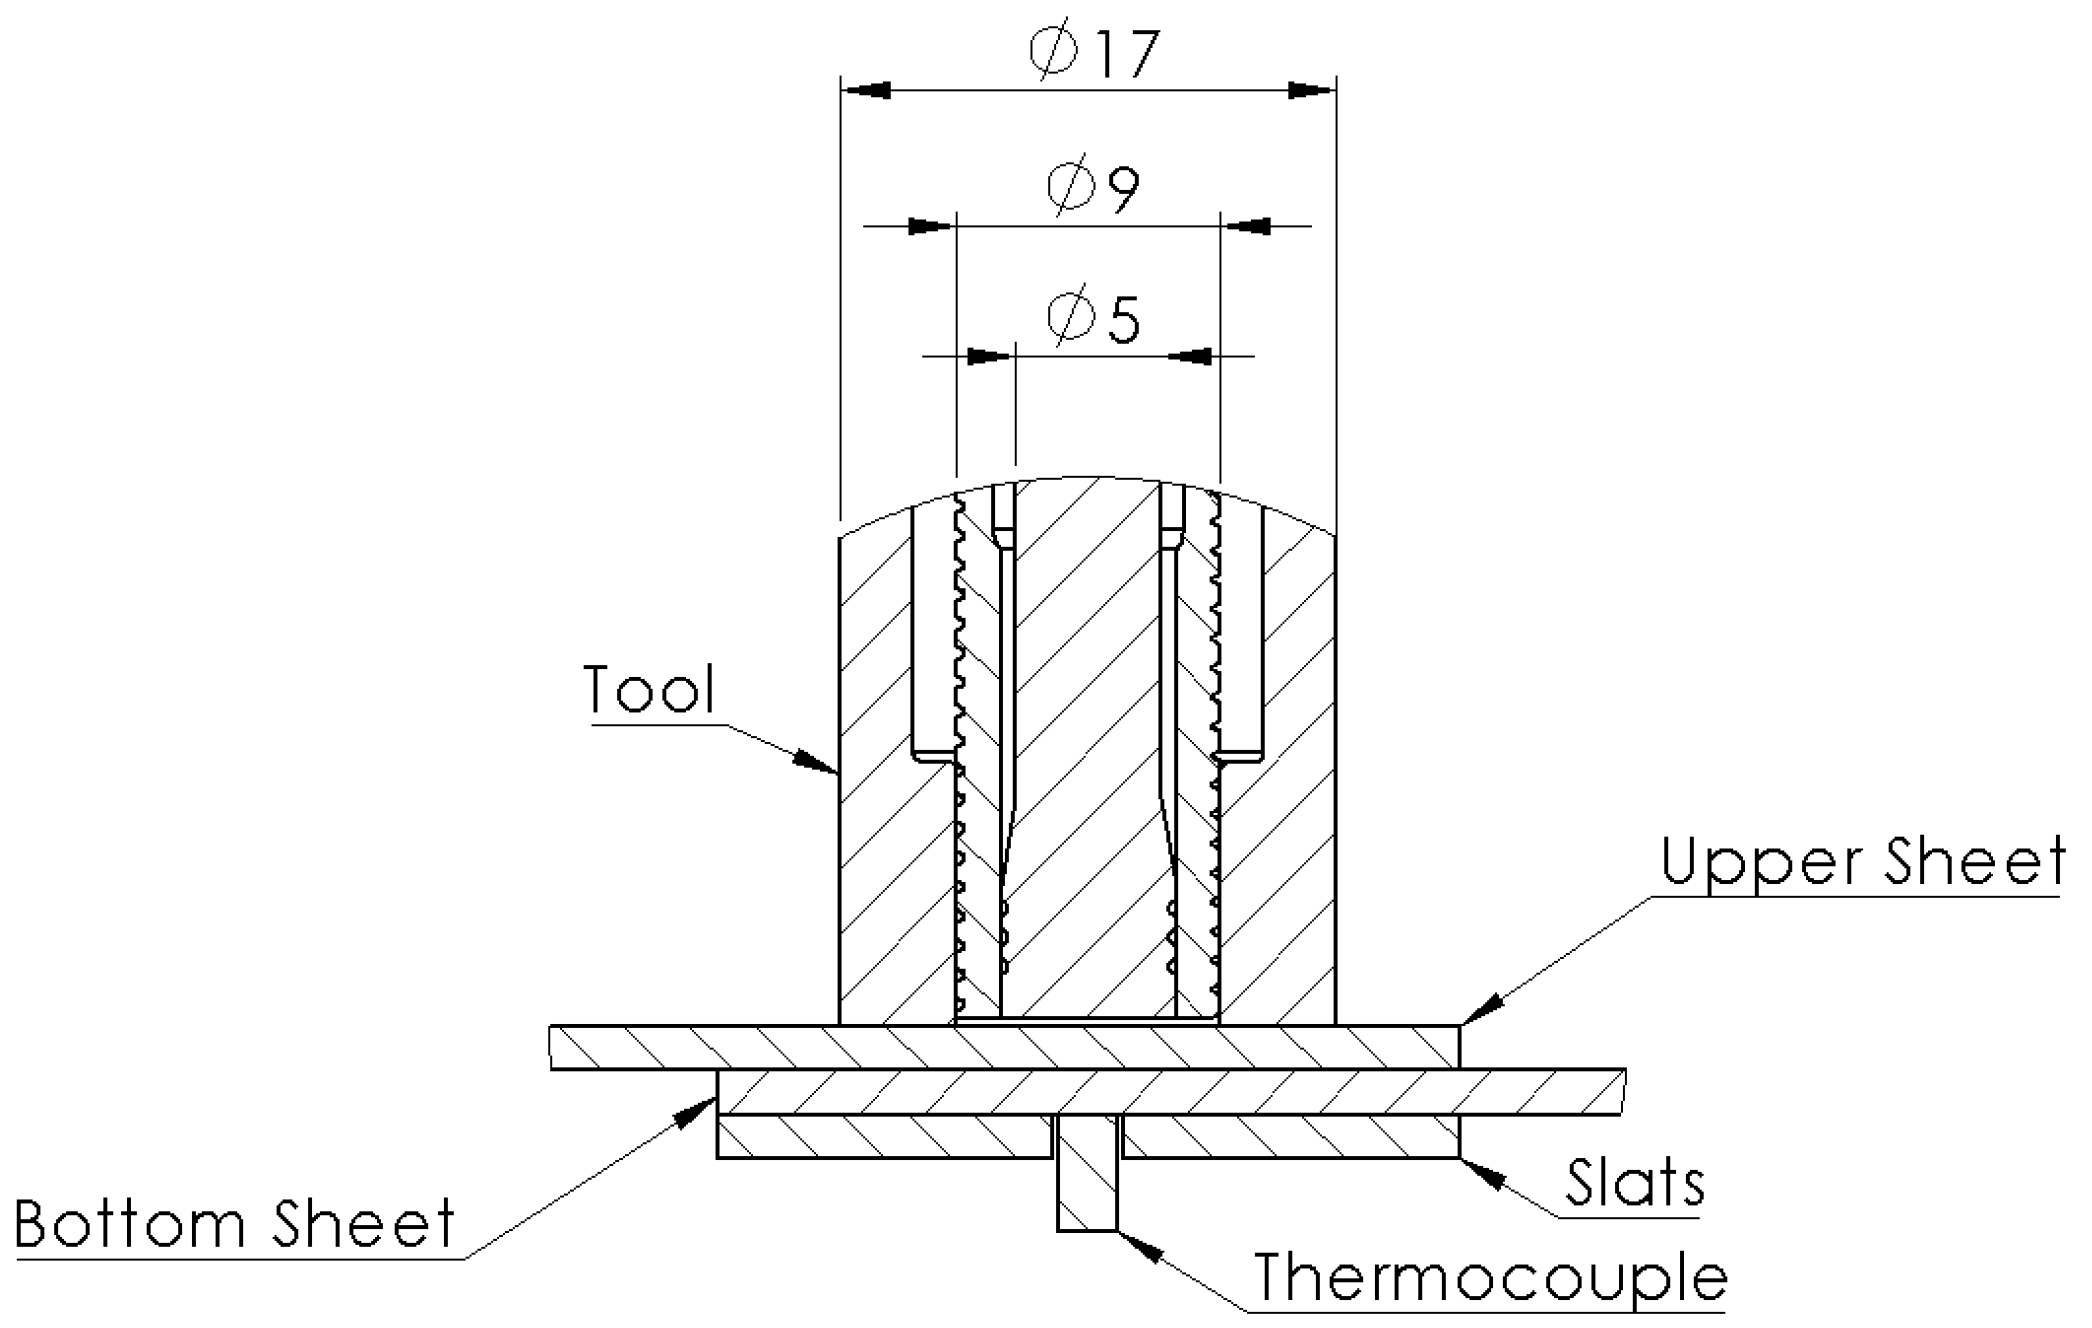
2.3. Microstructural Analysis, Local Mechanical Properties, and Thermal Characterization
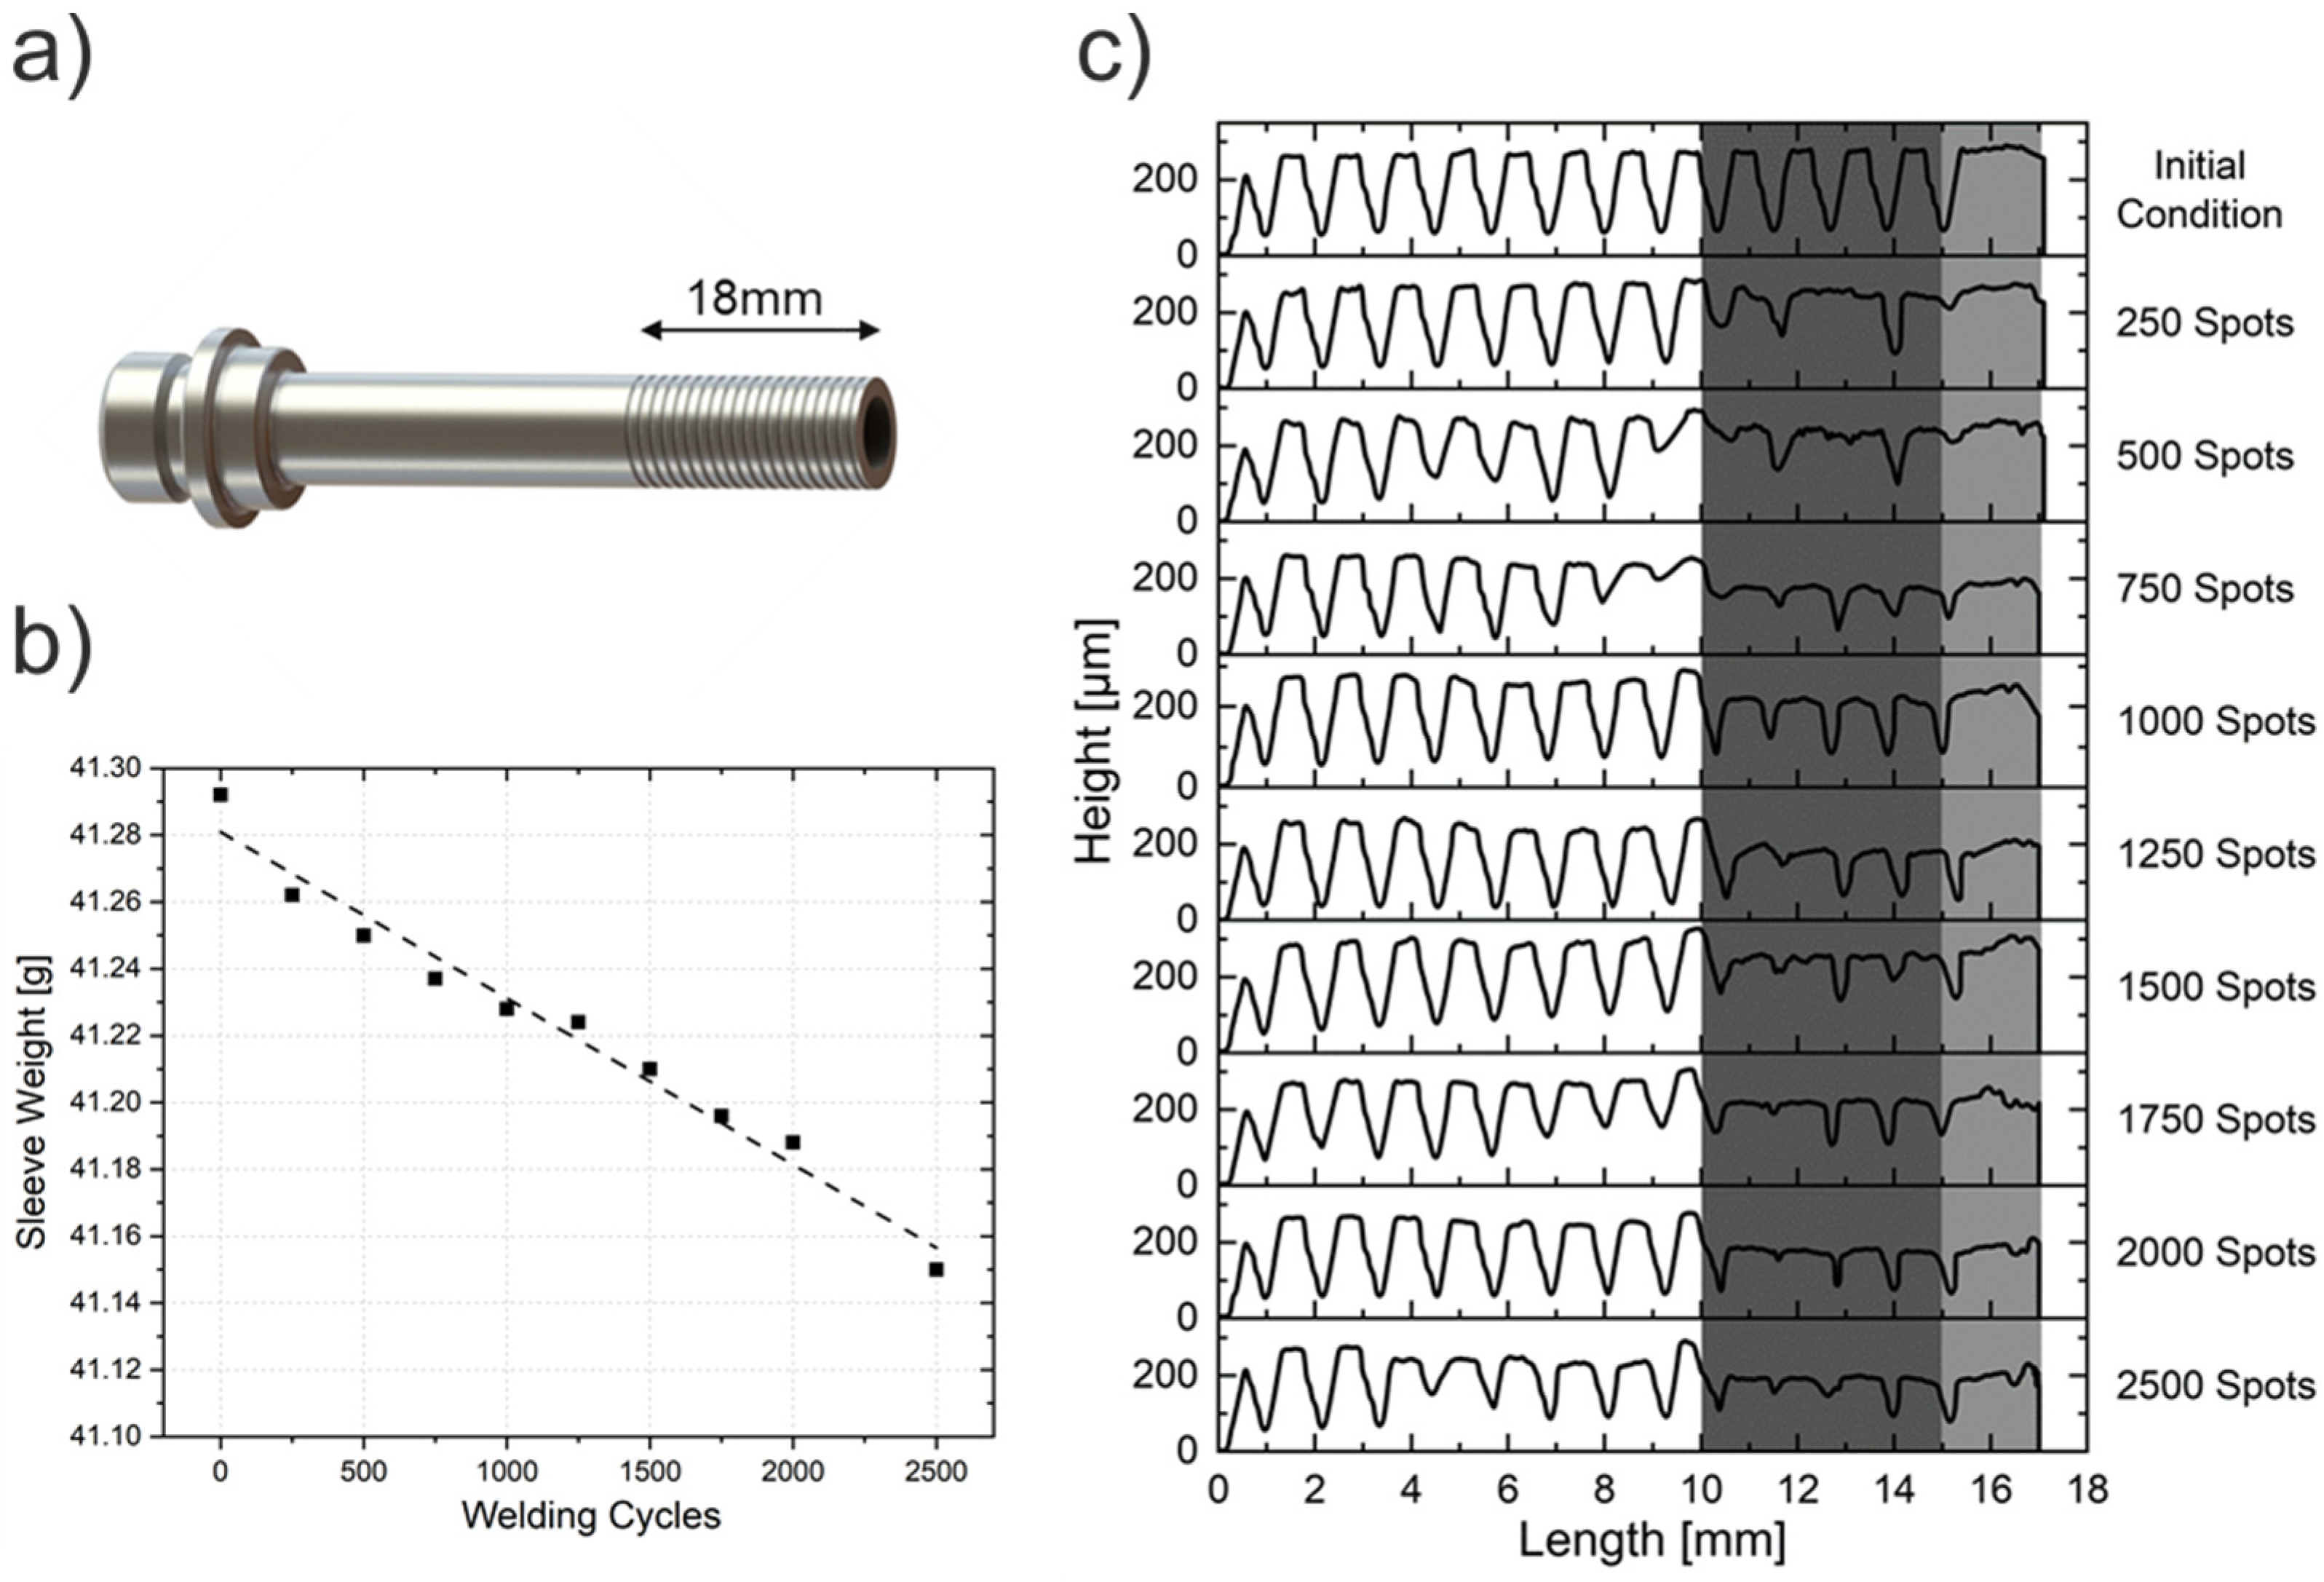
2.4. Tool Wear Analysis
3. Results and Discussion
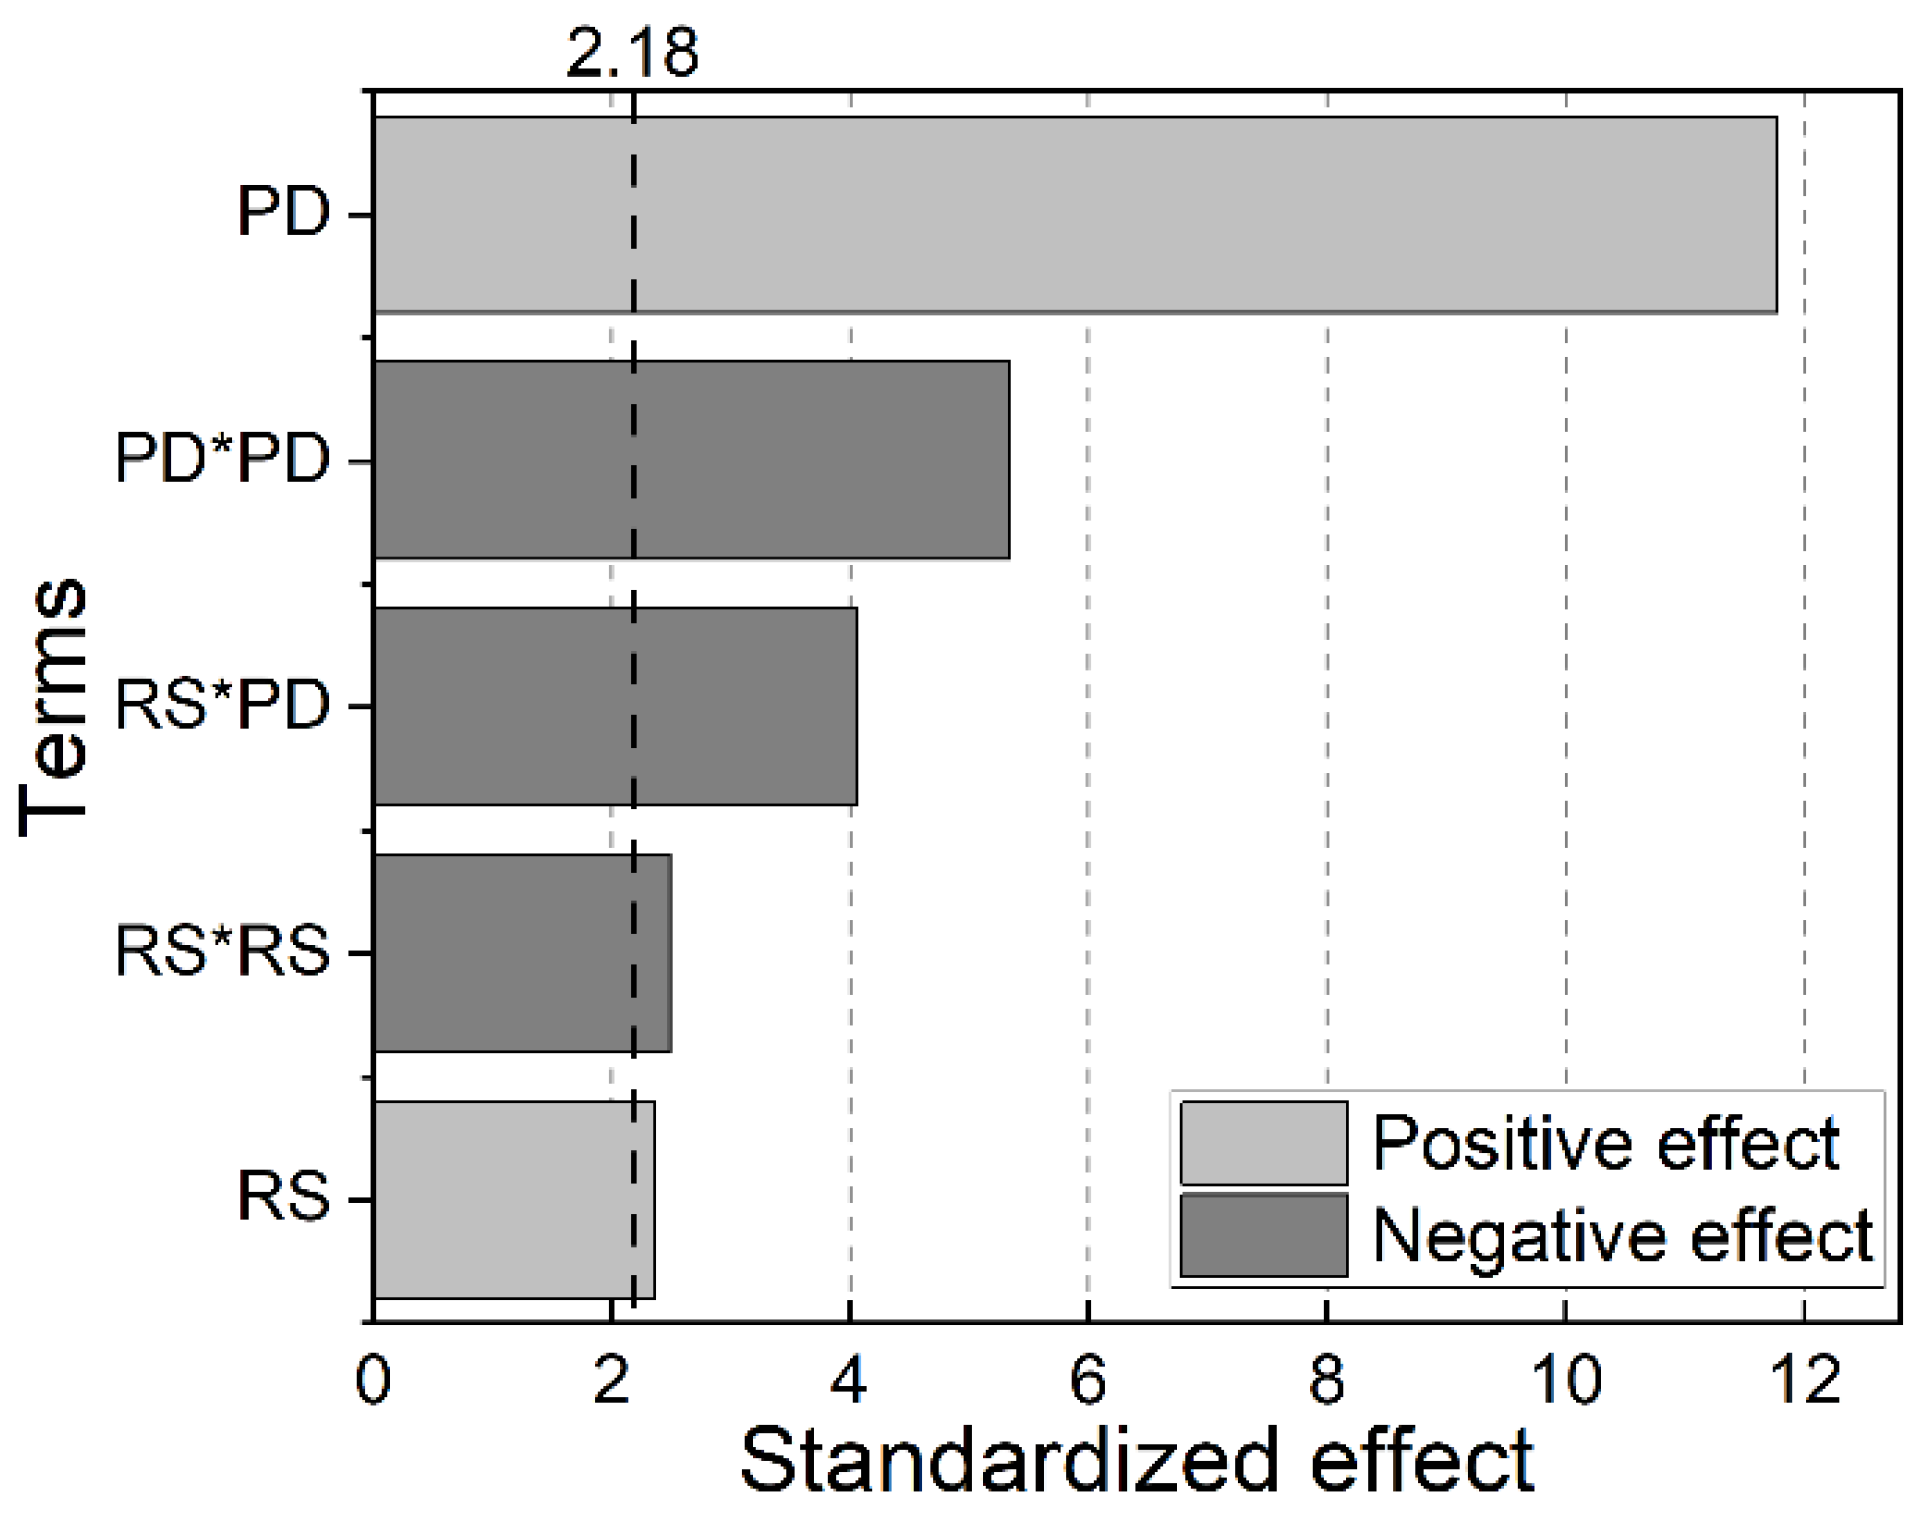
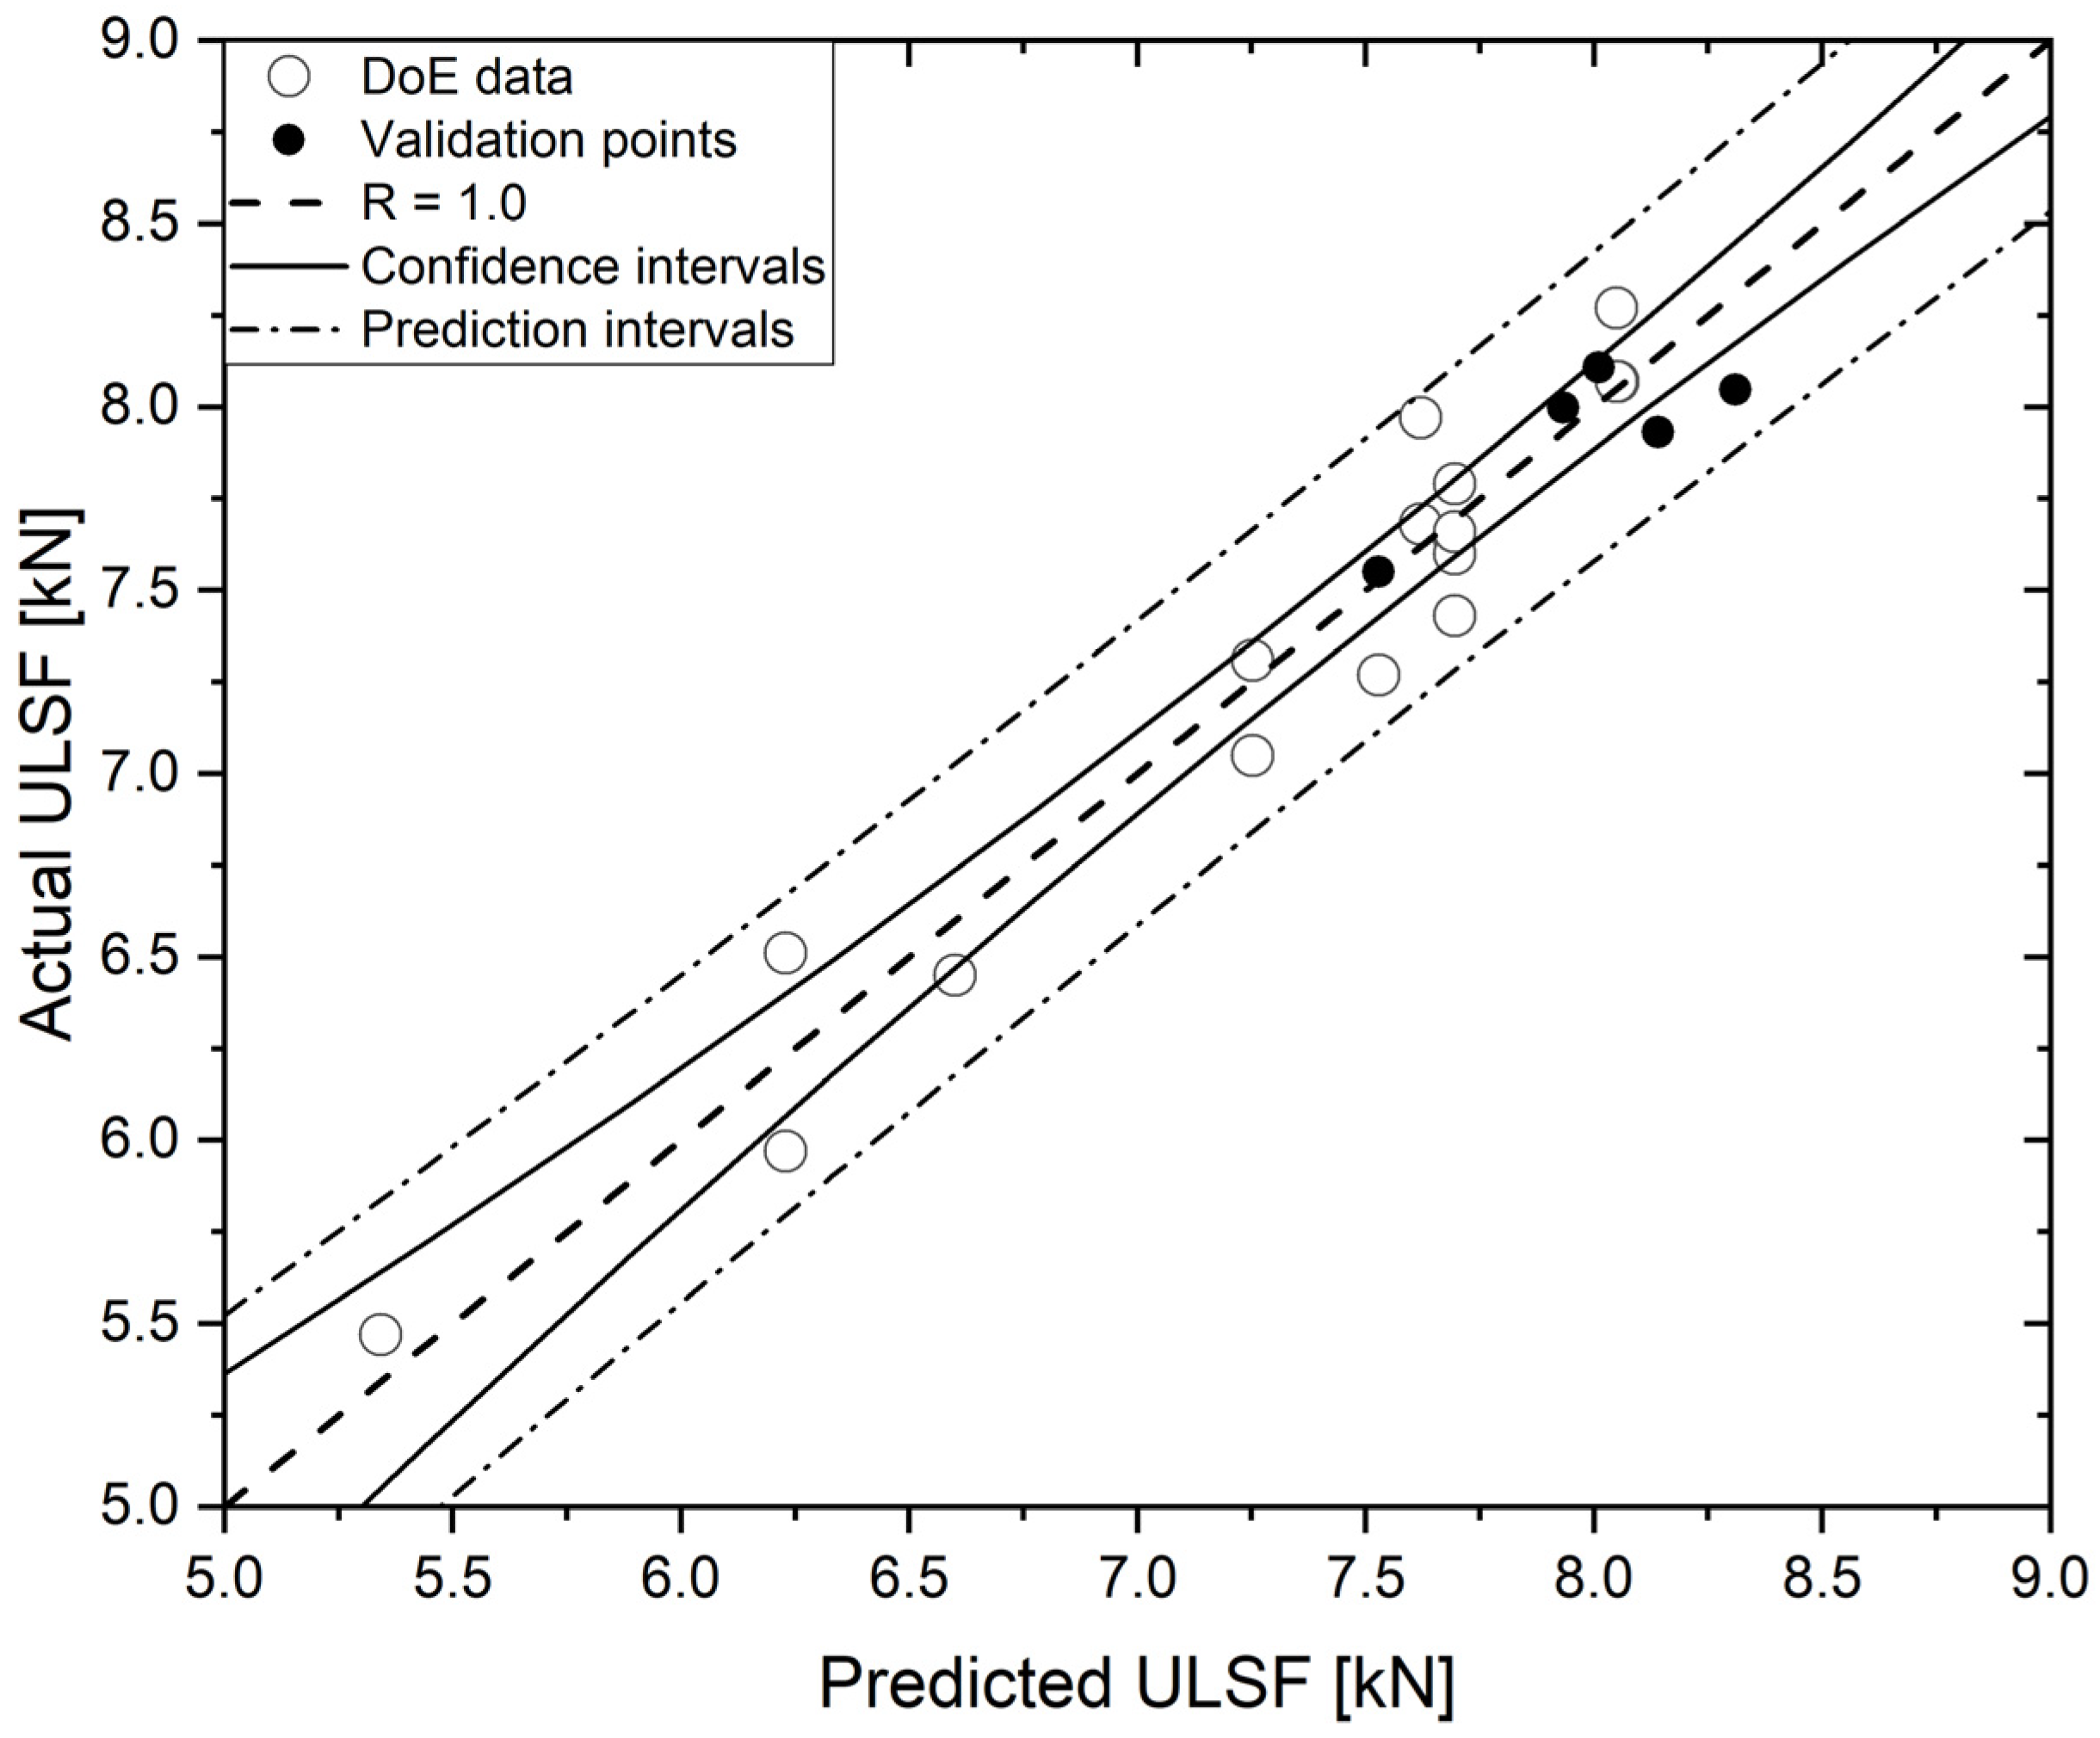
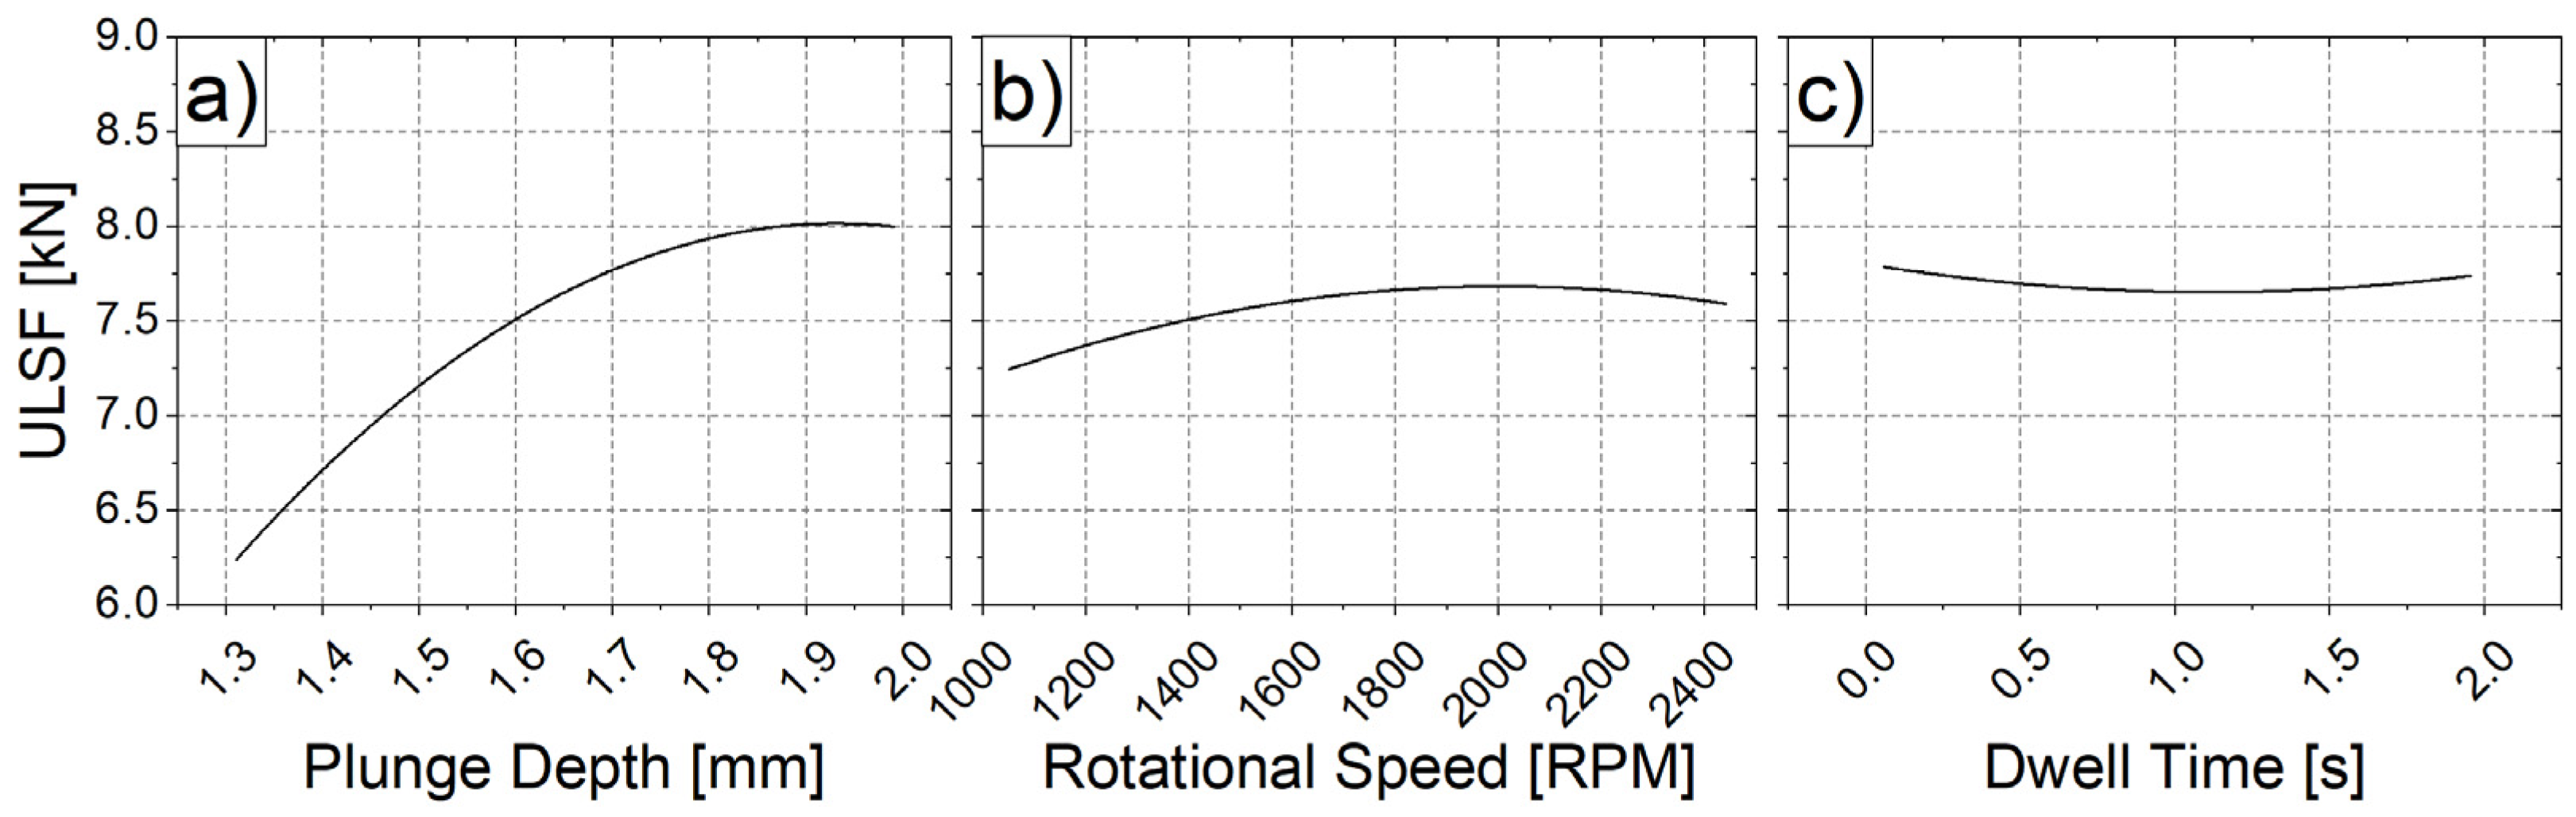
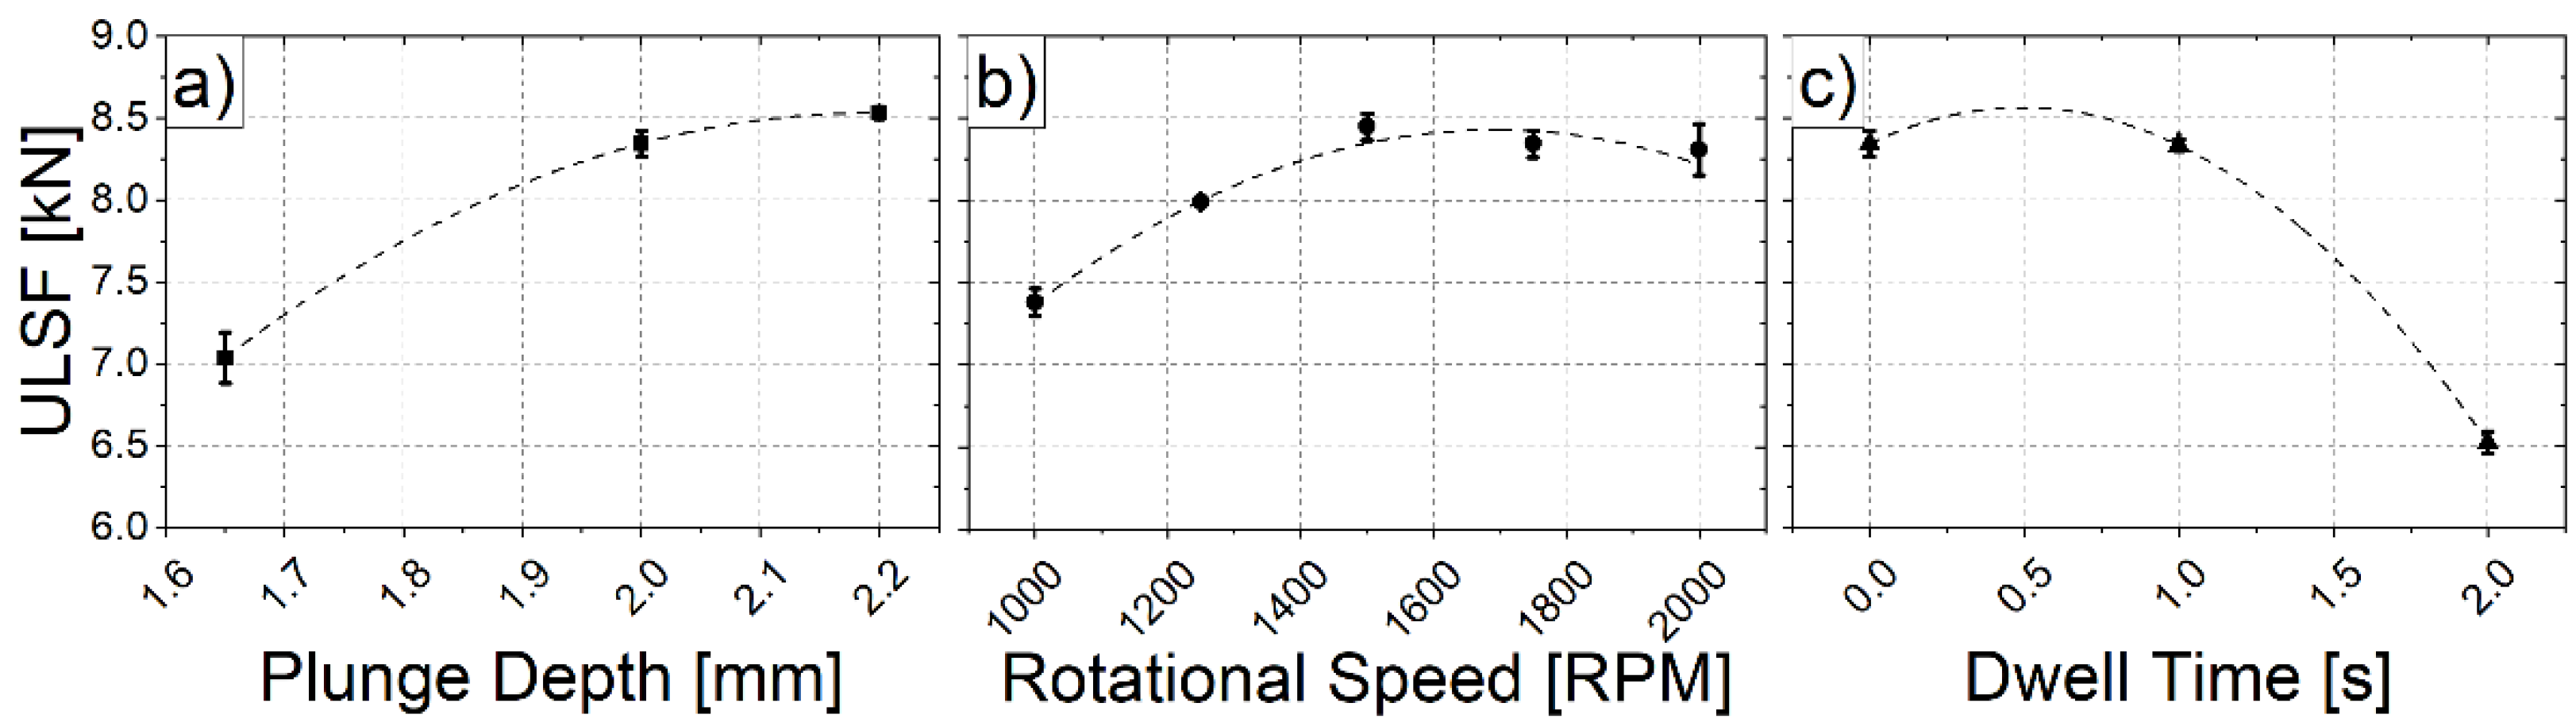
3.1. Process Parameters Optimization
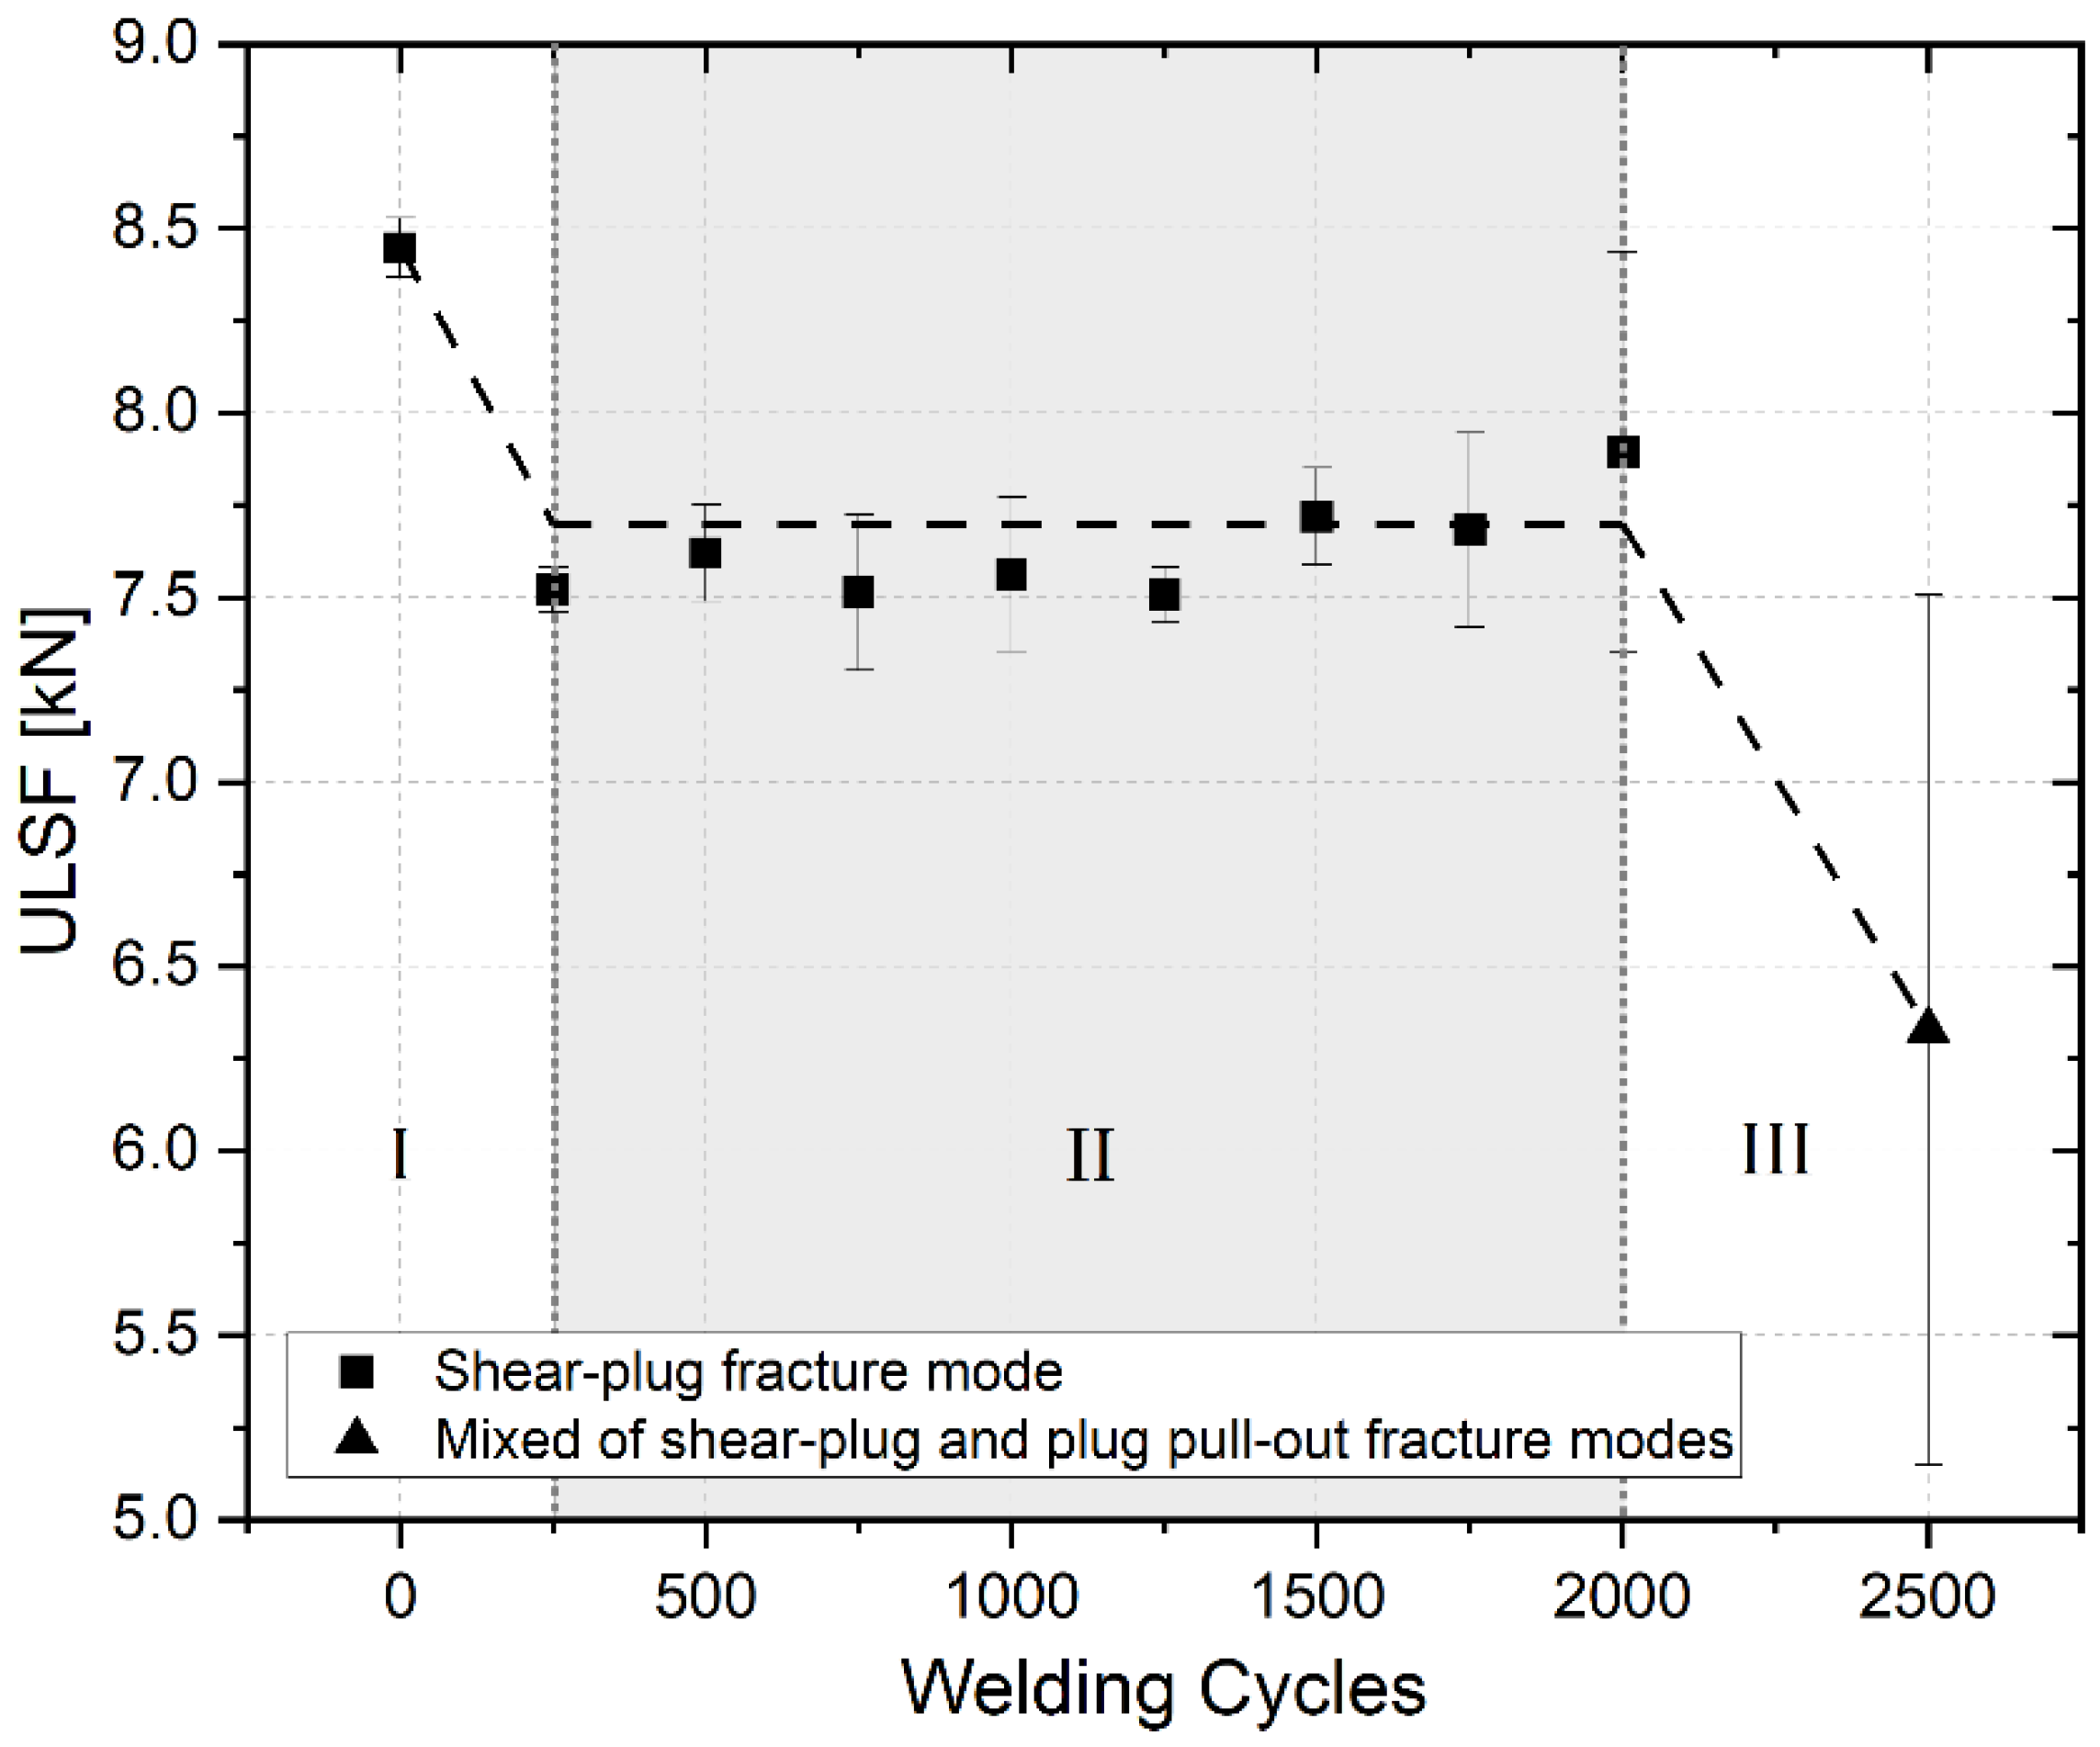
3.2. Tool Wear Evolution and Weld Mechanical Performance Investigation
3.3. Microstructural Analysis, Temperature Measurements, and Microhardness Analyses
4. Conclusions
- The RFSSW process parameters were optimized for AA6061-T6 through a Box-Behnken design of experiments (BBD) and one-factor-at-a-time (OFAT) approaches, for the purpose of maximizing the obtained ultimate lap shear force (ULSF) response. The optimized parameter set—a plunge depth (DP) of 2 mm, a rotational speed (RS) of 1500 RPM and, a dwell time (DT)of 0 s—produced joints with an average ULSF of 8.45 ± 0.08 kN.
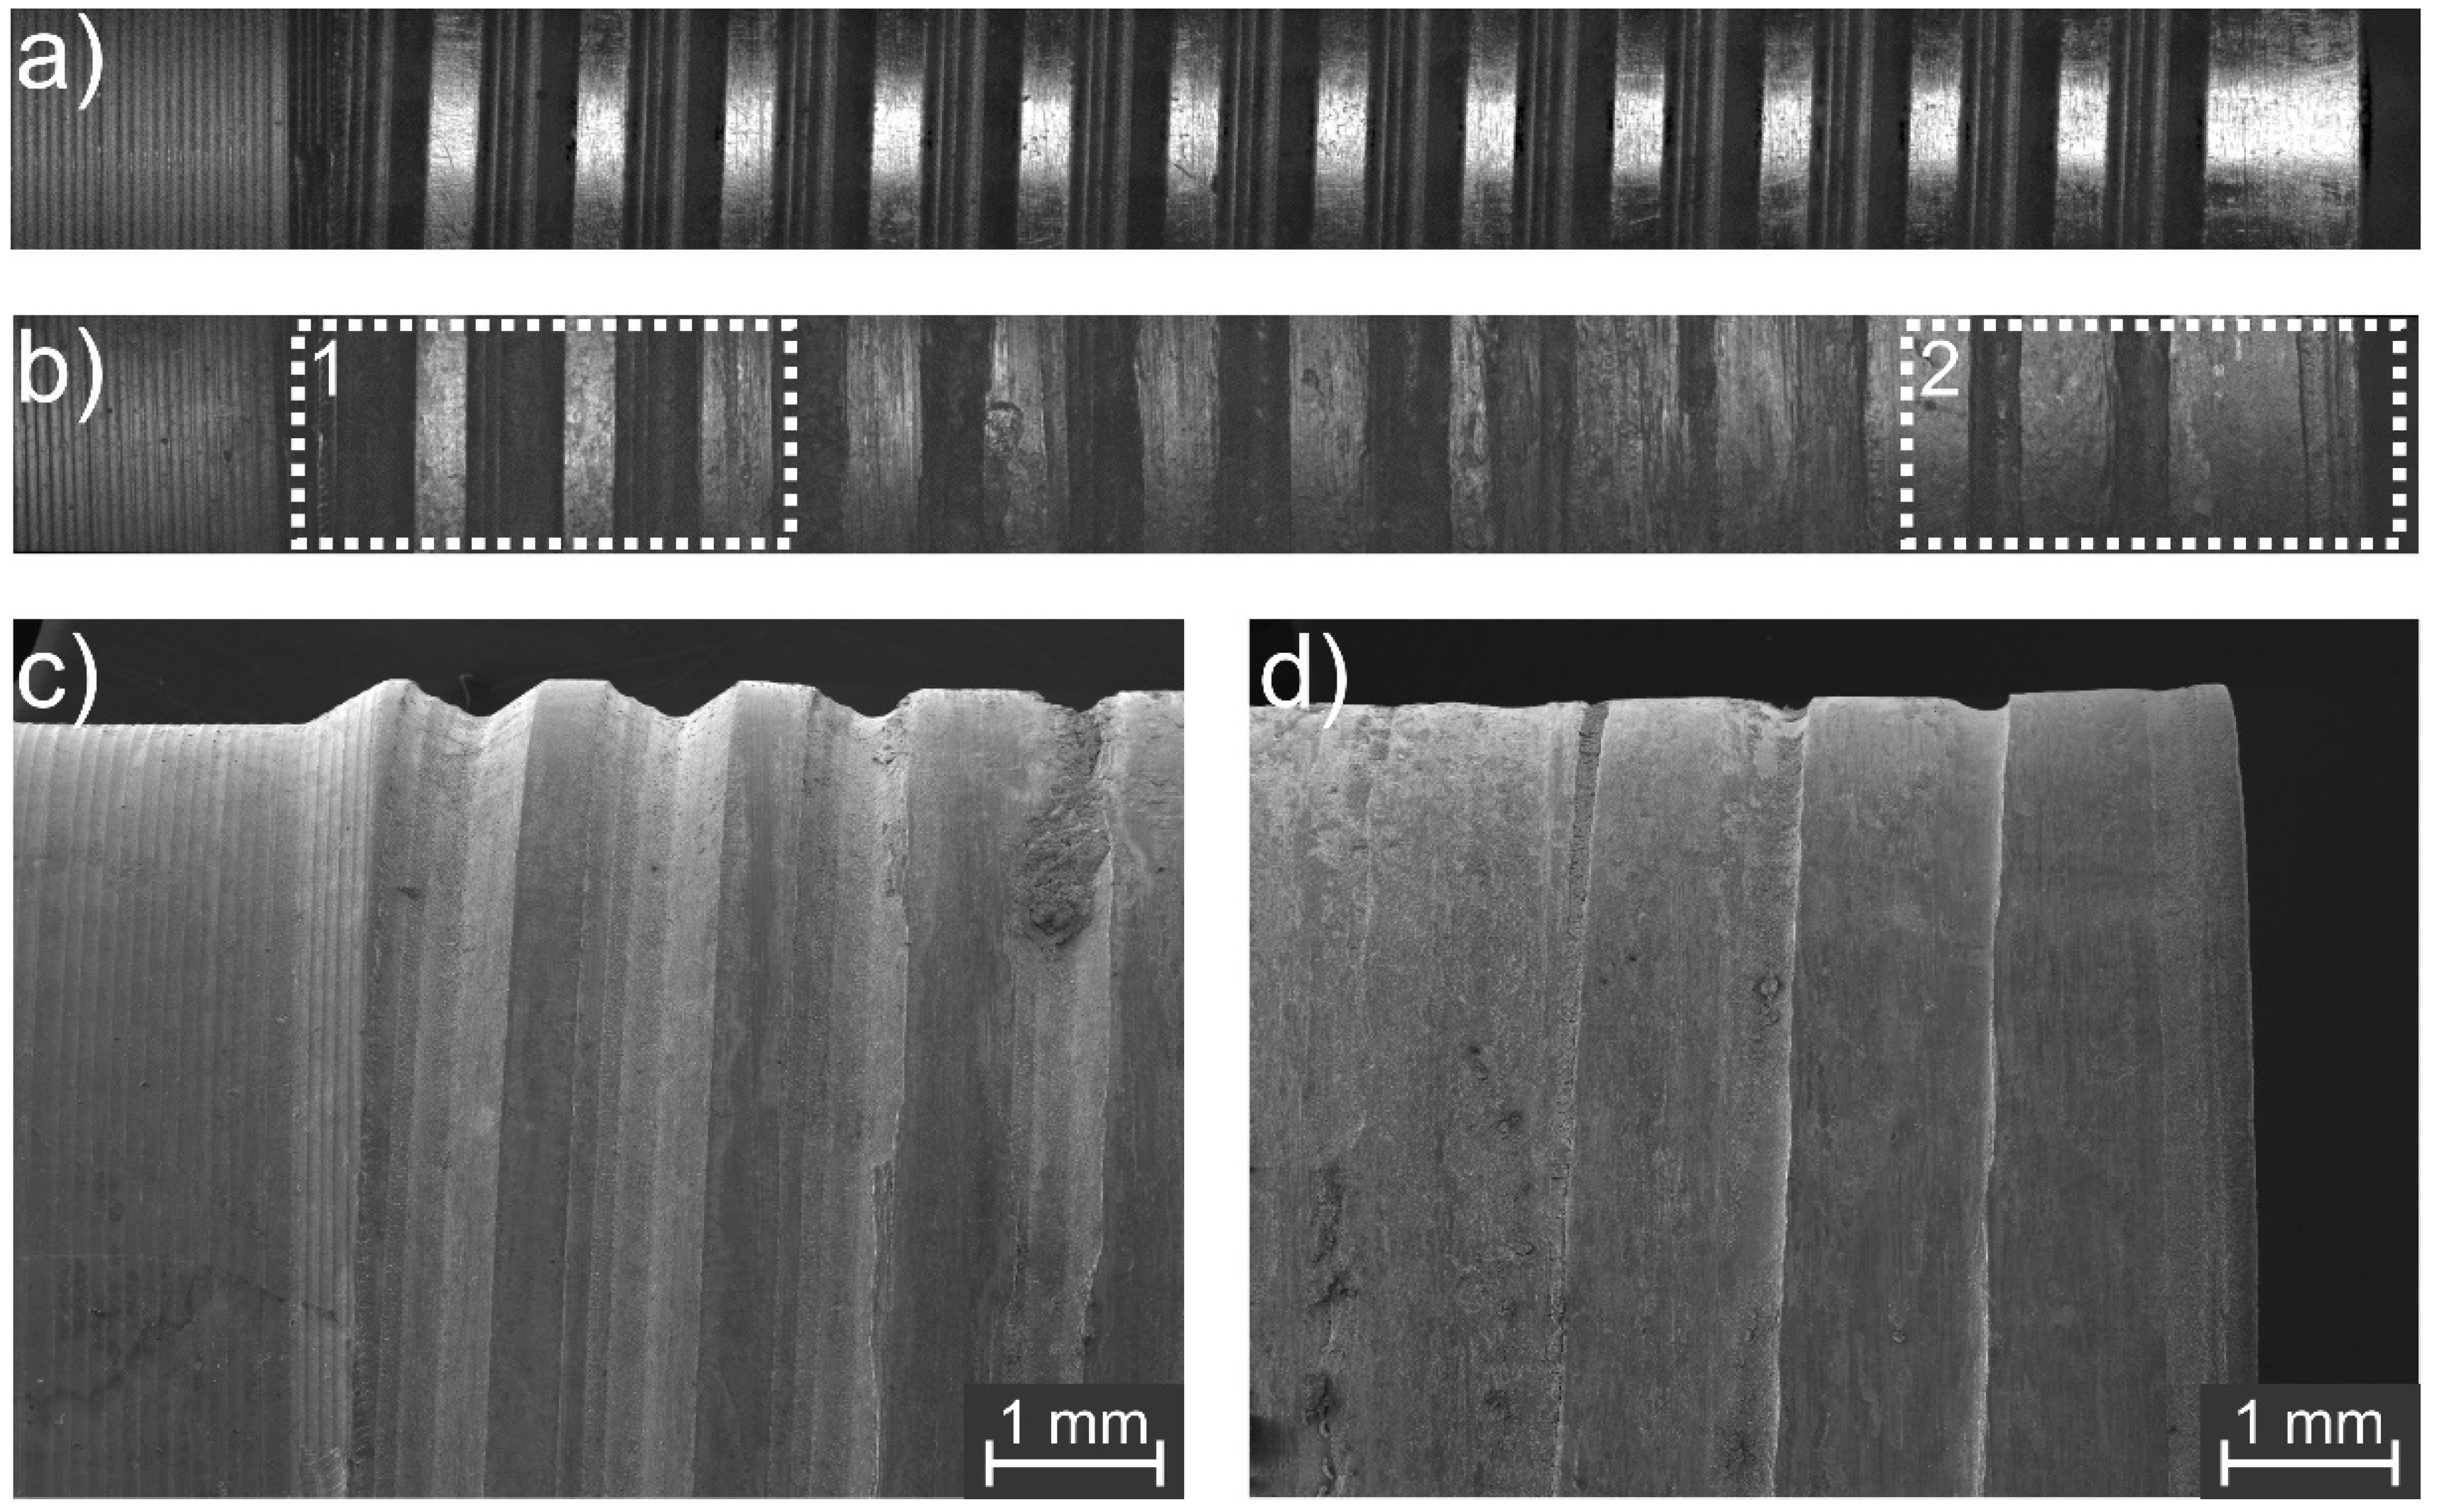
- Considerable tool wear was observed along the thread groove profile of the shoulder component, due to the series of the welds produced. Consequently, an accentuated decline of the measured yielded ULSF was observed. In addition, the wear increased the gaps between the components of the tool, which led to an accumulation of material between the shoulder and the clamping ring. This aggregation hampered the tool rotation and, therefore, the maximum torque of the machine was often reached, and the process had to be interrupted. Consequently, it is possible to confirm that the maximum number of spots capable of being produced by the tool, using the set of variables here specified is, currently, at least 2500 welds, without severely compromising the quality of such spot welds.
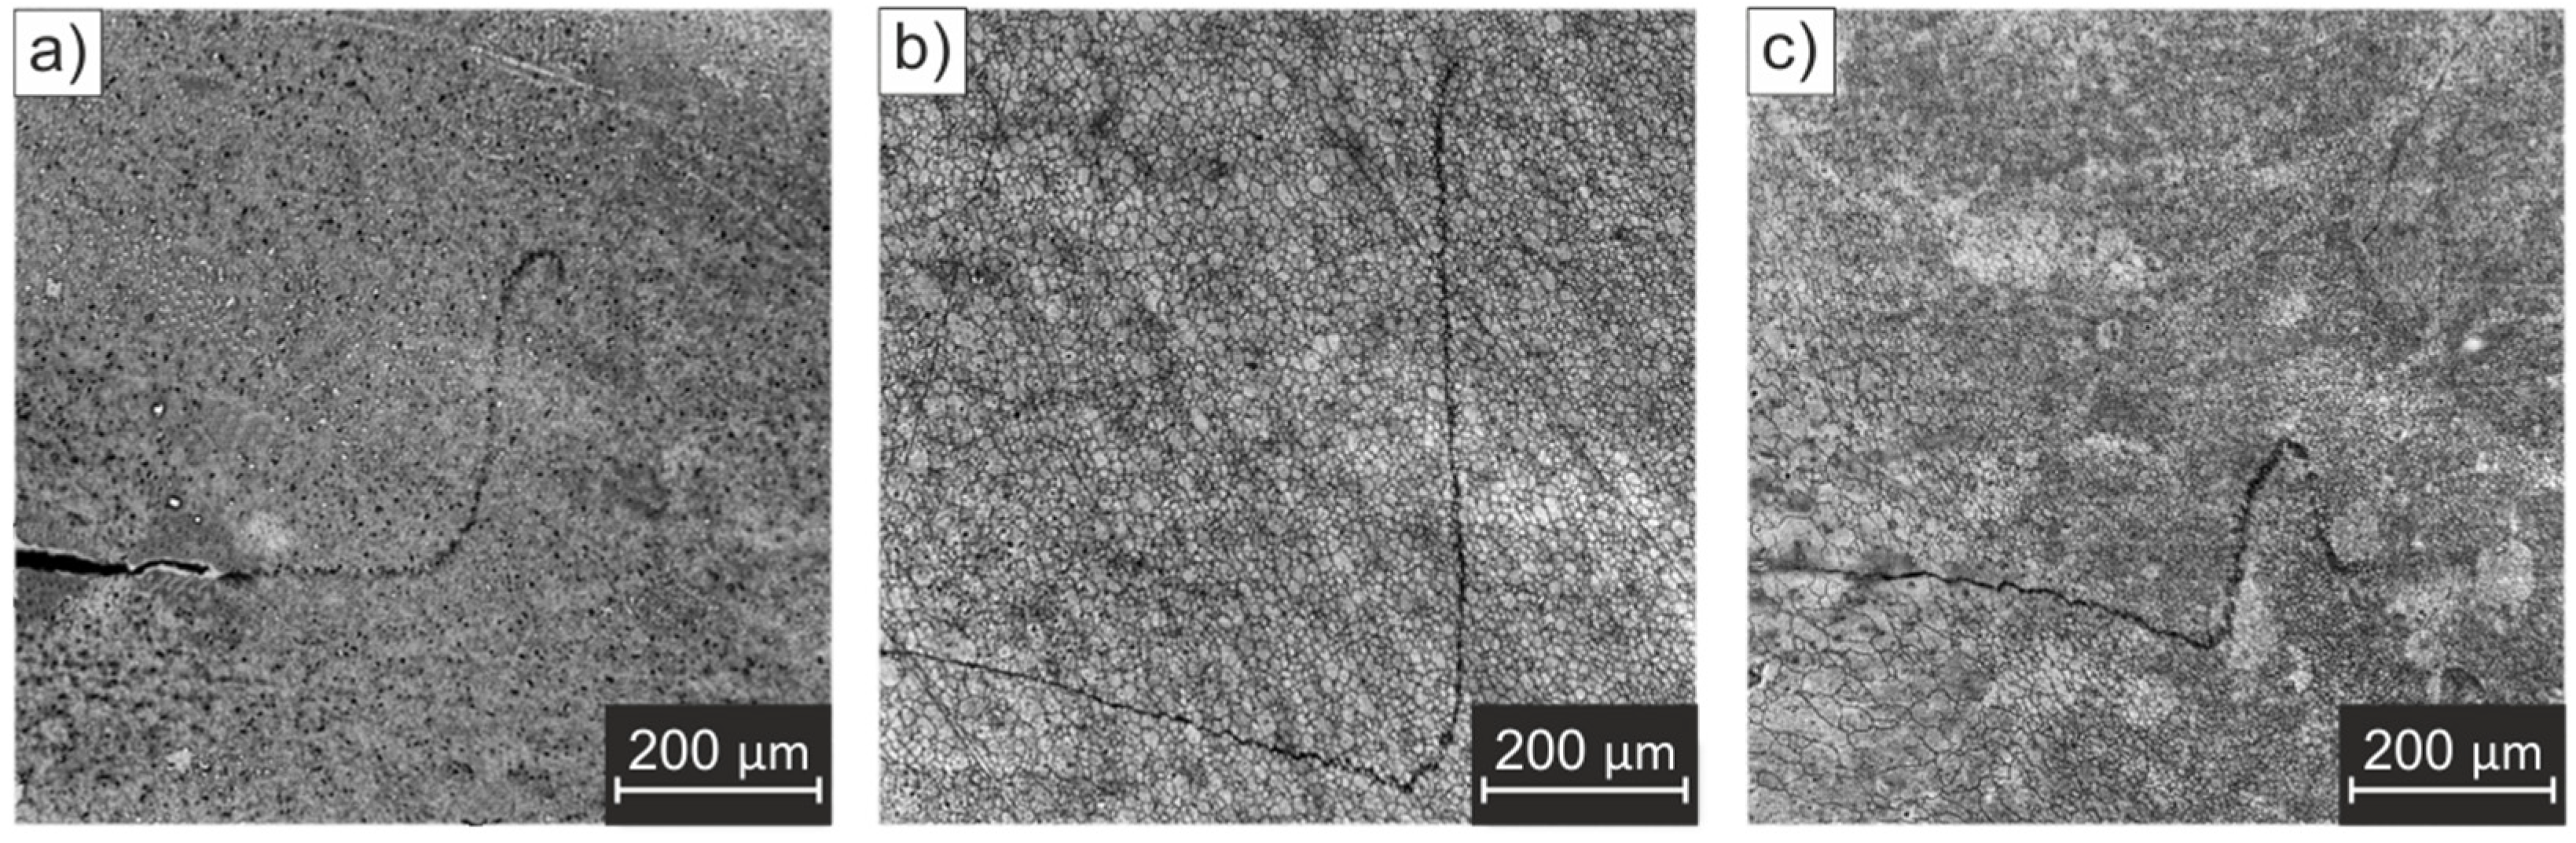
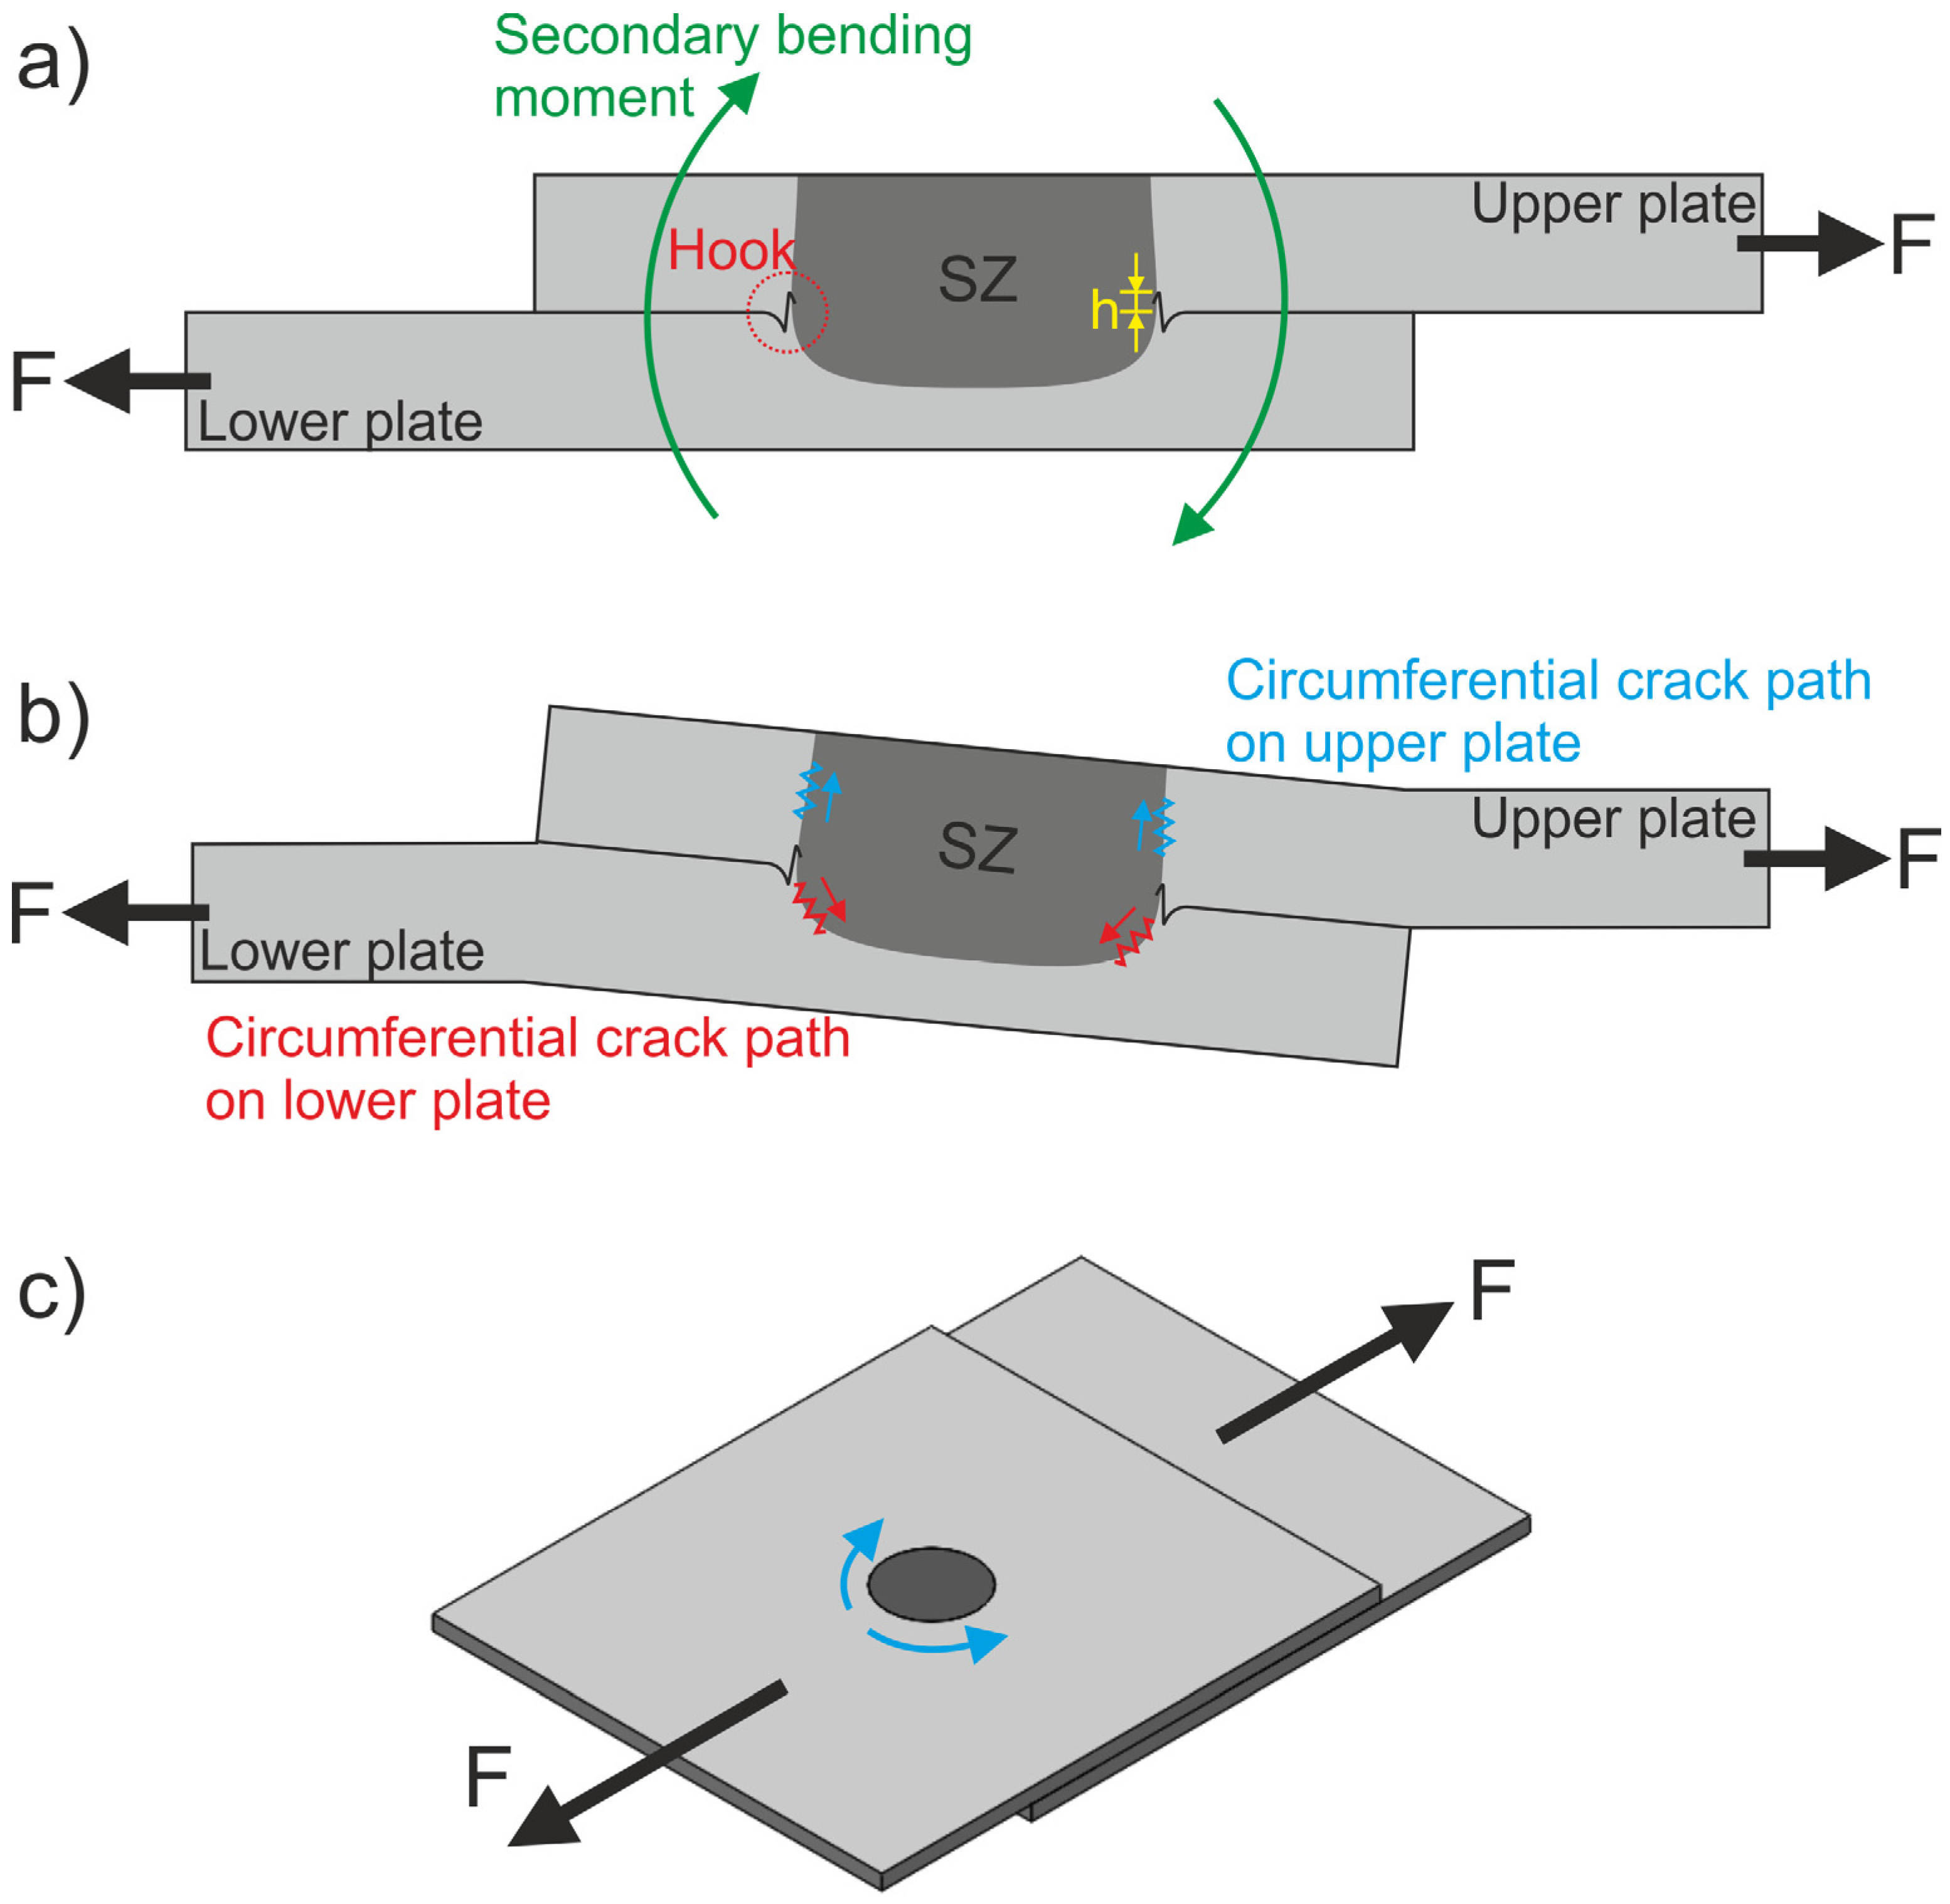
- A change in the fracture mode was identified. Initially, only shear-plug fracture was observed in the tested samples. However, after 2500 spots, a transition from complete shear-plug to a mixture between the shear-plug and the plug pull-out failure modes was observed. This behavior was assessed as the main cause of the ULSF marked decline.
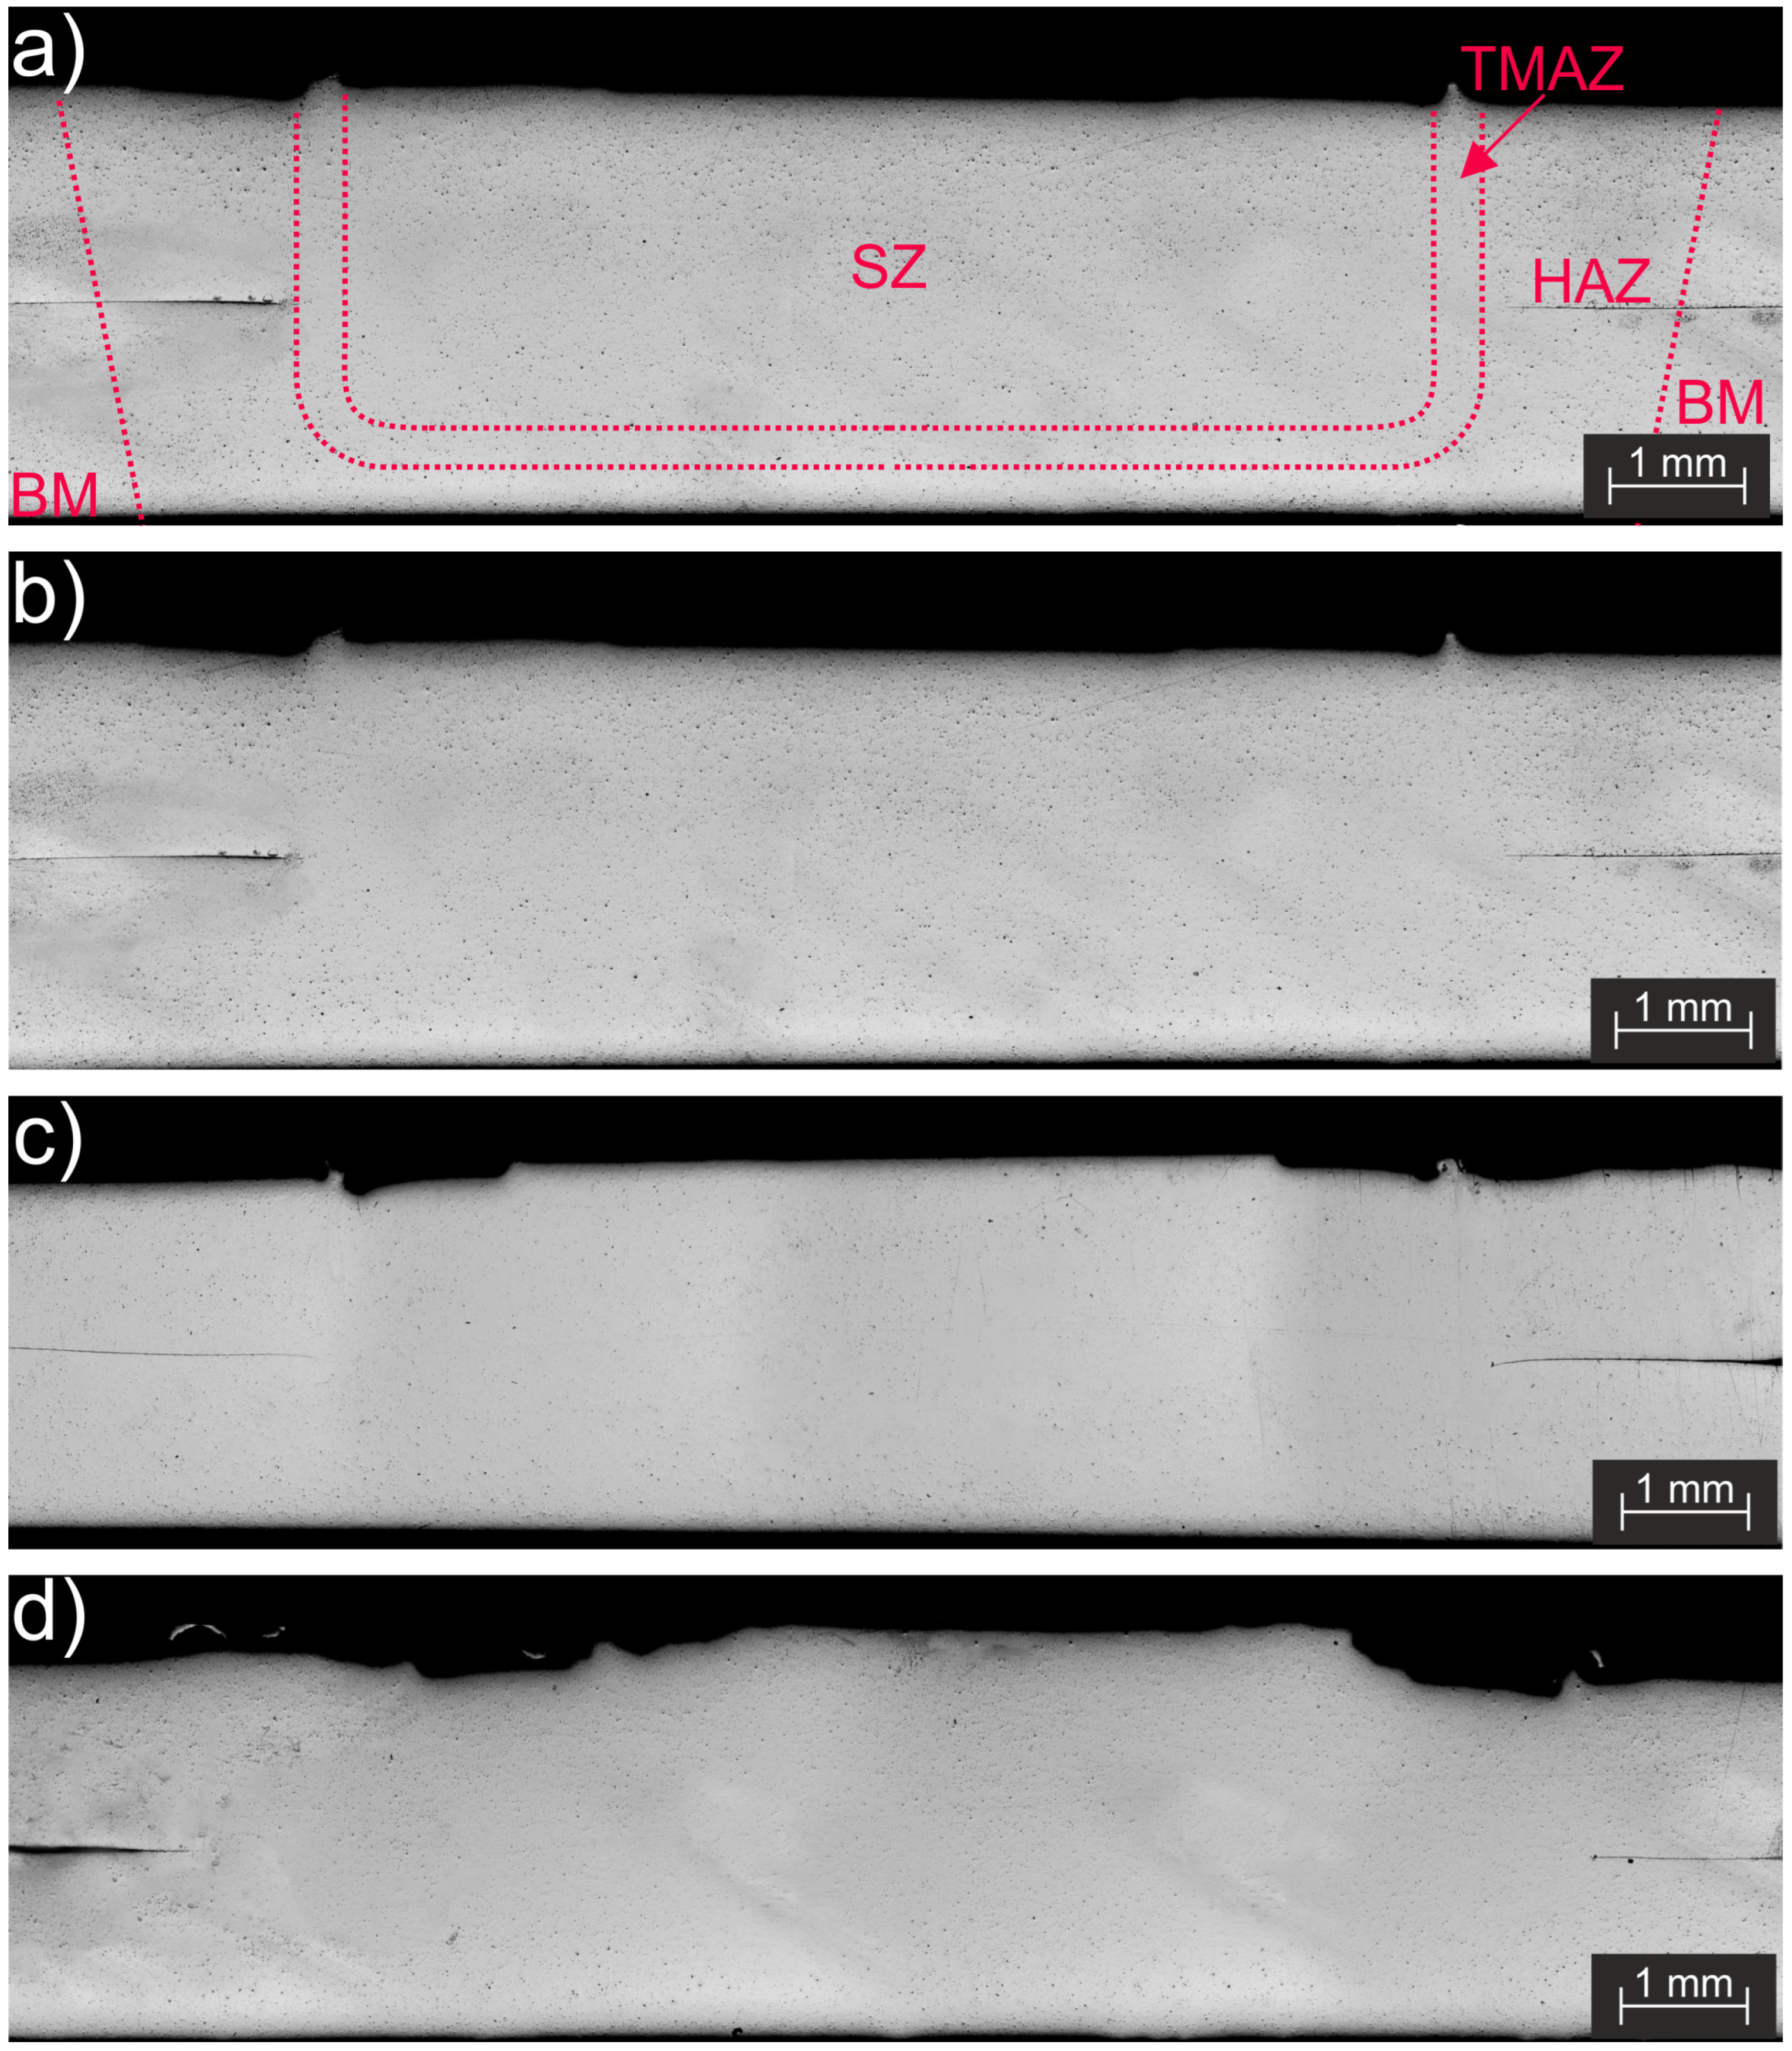
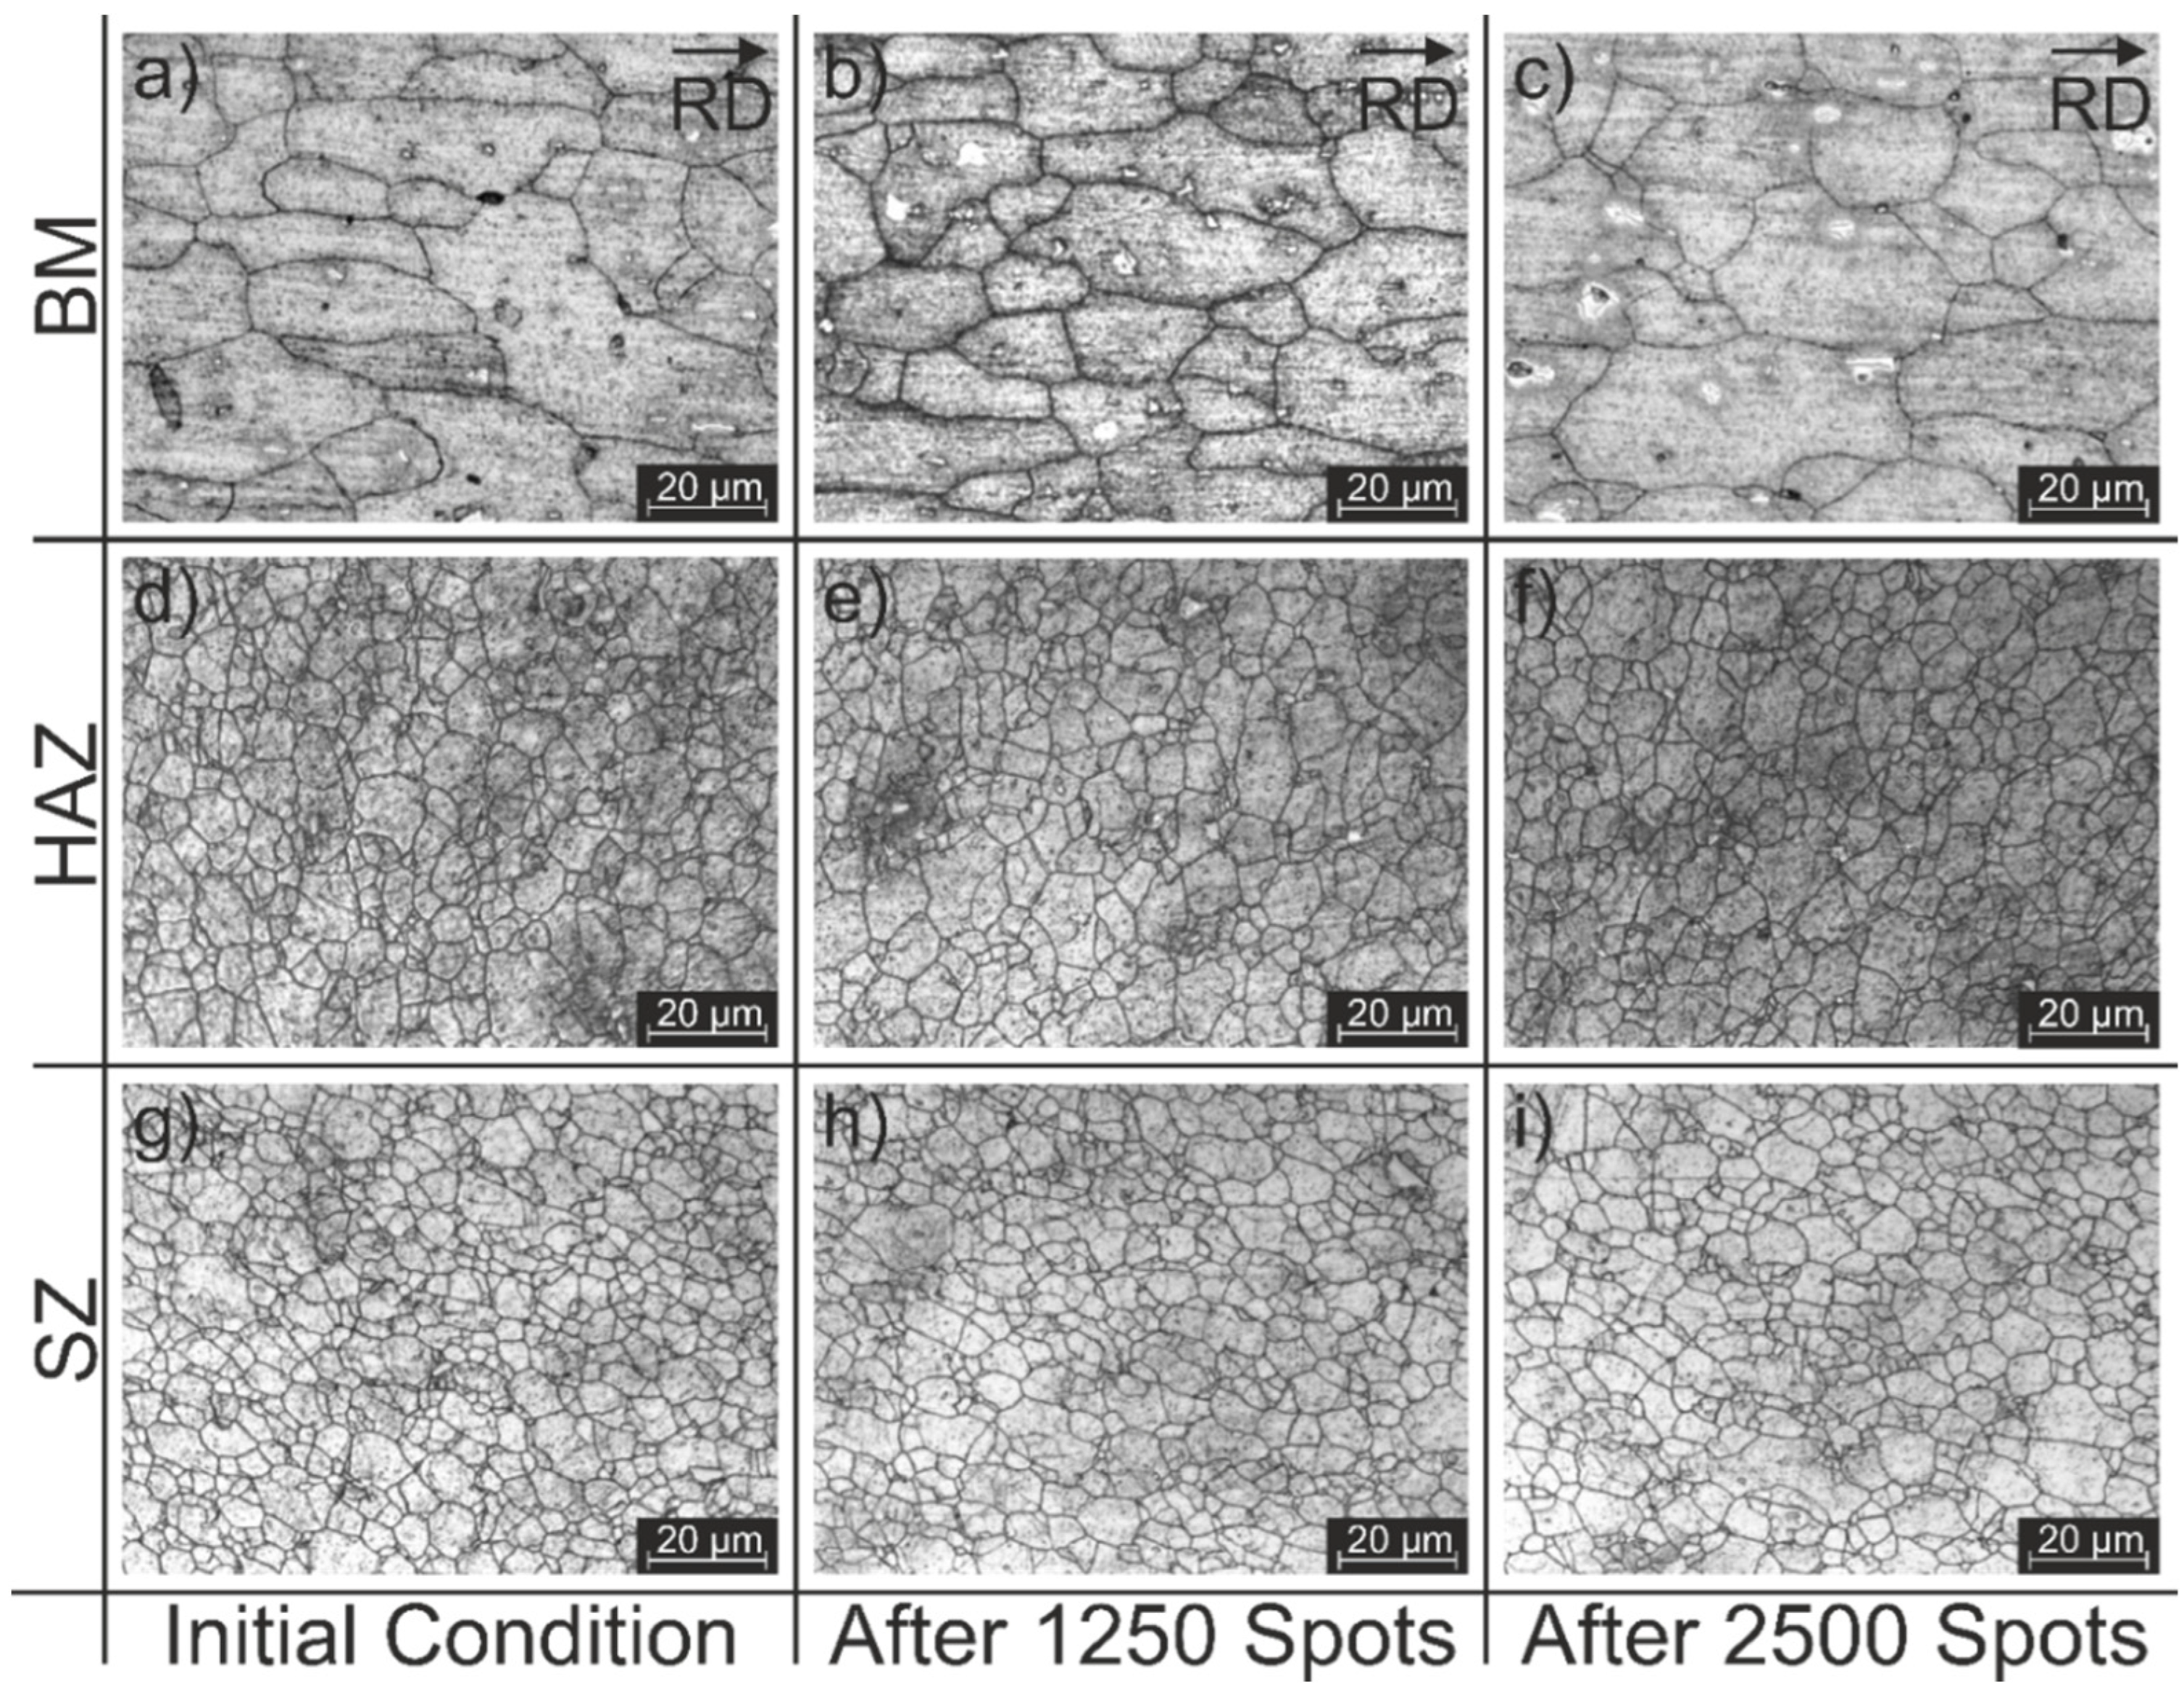
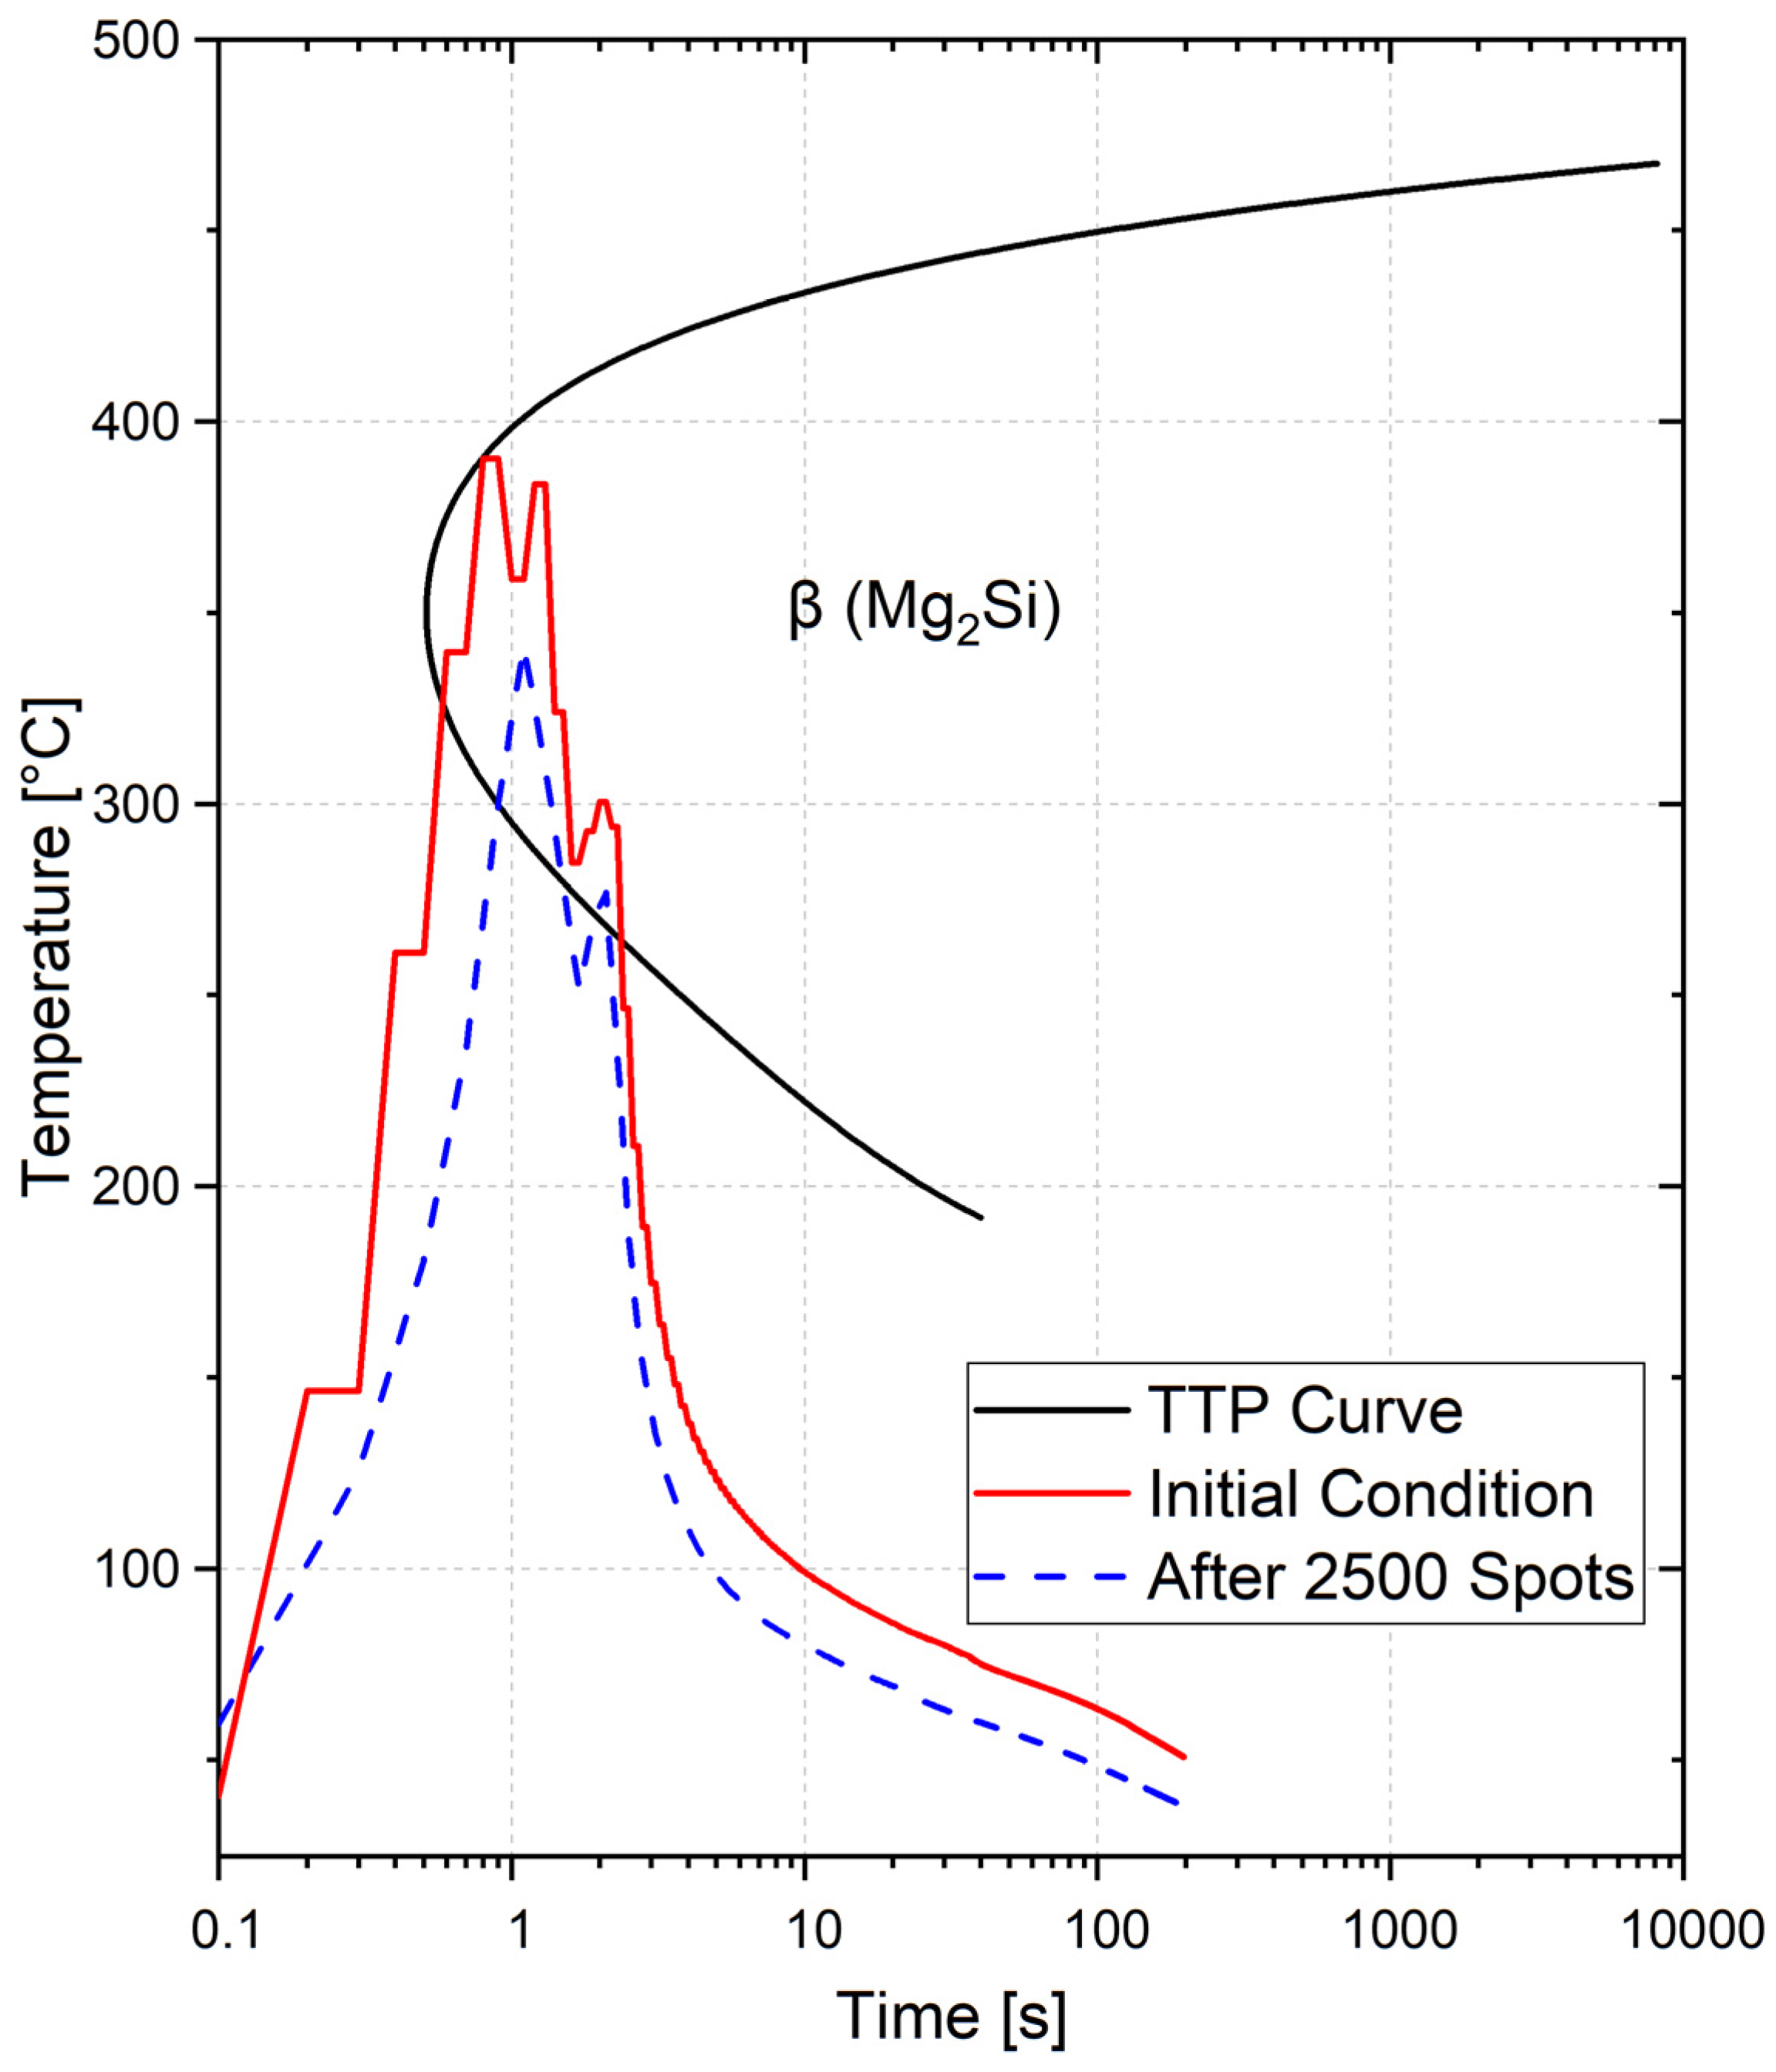
- The microstructural characterization showed a similar average grain size for all the weld zones in the analyzed conditions, while the change in hook height indicated variations in the process heat input. Temperature and microhardness measurements were conducted to confirm this, and these showed that the tool wear affects the energy input that is delivered by the RFSSW process to the materials.
- The achieved results show that, although RFSSW is an interesting alternative for the welding of lightweight alloys, premature tool wear can highly influence the mechanical performance of the produced joints. In order to overcome this challenge, and decrease the associated process costs, a frictional heat input monitoring system must be applied which aims to keep the energy and the ULSF stable and, consequently, improves the tool lifespan. Further investigations in this direction could lead to great opportunities to improve the RFSSW process, since a constant heat input is expected to be possible if the wear is compensated by a continuous increment of either the PD or RS.
Author Contributions
Funding
Institutional Review Board Statement
Informed Consent Statement
Data Availability Statement
Acknowledgments
Conflicts of Interest
References
- Schilling, C.; Dos Santos, J. Method and Device for Joining at Least Two Adjoining Work Pieces by Friction Welding. U.S. Patent 6722556B2, 20 April 2004. [Google Scholar]
- Oliveira, P.H.F.; Amancio-Filho, S.T.; Dos Santos, J.F.; Hage, E. Preliminary study on the feasibility of friction spot welding in PMMA. Mater. Lett. 2010, 64, 2098–2101. [Google Scholar] [CrossRef] [Green Version]
- Gonçalves, J.; Dos Santos, J.F.; Canto, L.B.; Amancio-Filho, S.T. Friction spot welding of carbon fiber-reinforced polyamide 66 laminate. Mater. Lett. 2015, 159, 506–509. [Google Scholar] [CrossRef] [Green Version]
- Suryanarayanan, R.; Sridhar, V.G. Effect of Process Parameters in Pinless Friction Stir Spot Welding of Al 5754-Al 6061 Alloys. Metallogr. Microstruct. Anal. 2020, 9, 261–272. [Google Scholar] [CrossRef]
- Rosendo, T.; Parra, B.; Tier, M.A.D.; da Silva, A.A.M.; dos Santos, J.F.; Strohaecker, T.R.; Alcântara, N.G. Mechanical and microstructural investigation of friction spot welded AA6181-T4 aluminium alloy. Mater. Des. 2011, 32, 1094–1100. [Google Scholar] [CrossRef]
- Plaine, A.H.; Gonzalez, A.R.; Suhuddin, U.F.H.; dos Santos, J.F.; Alcântara, N.G. The optimization of friction spot welding process parameters in AA6181-T4 and Ti6Al4V dissimilar joints. Mater. Des. 2015, 83, 36–41. [Google Scholar] [CrossRef] [Green Version]
- Shen, Z.; Chen, Y.; Hou, J.S.C.; Yang, X.; Gerlich, A.P. Influence of processing parameters on microstructure and mechanical performance of refill friction stir spot welded 7075-T6 aluminium alloy. Sci. Technol. Weld. Join. 2015, 20, 48–57. [Google Scholar] [CrossRef]
- Shen, Z.; Ding, Y.; Gopkalo, O.; Diak, B.; Gerlich, A.P. Effects of tool design on the microstructure and mechanical properties of refill friction stir spot welding of dissimilar Al alloys. J. Mater. Process. Technol. 2018, 252, 751–759. [Google Scholar] [CrossRef]
- Amancio-Filho, S.T.; Camillo, A.P.C.; Bergmann, L.; Dos Santos, J.F.; Kury, S.E.; Machado, N.G.A. Preliminary investigation of the microstructure and mechanical behaviour of 2024 aluminium alloy friction spot welds. Mater. Trans. 2011, 52, 985–991. [Google Scholar] [CrossRef] [Green Version]
- Shen, Z.; Yang, X.; Yang, S.; Zhang, Z.; Yin, Y. Microstructure and mechanical properties of friction spot welded 6061-T4 aluminum alloy. Mater. Des. 2014, 54, 766–778. [Google Scholar] [CrossRef]
- Shen, Z.; Yang, X.; Zhang, Z.; Cui, L.; Li, T. Microstructure and failure mechanisms of refill friction stir spot welded 7075-T6 aluminum alloy joints. Mater. Des. 2013, 44, 476–486. [Google Scholar] [CrossRef]
- Shen, Z.; Ding, Y.; Chen, J.; Gerlich, A.P. Comparison of fatigue behavior in Mg/Mg similar and Mg/steel dissimilar refill friction stir spot welds. Int. J. Fatigue 2016, 92, 78–86. [Google Scholar] [CrossRef]
- Suhuddin, U.; Fischer, V.; Kroeff, F.; dos Santos, J.F. Microstructure and mechanical properties of friction spot welds of dissimilar AA5754 Al and AZ31 Mg alloys. Mater. Sci. Eng. A 2014, 590, 384–389. [Google Scholar] [CrossRef] [Green Version]
- Dong, Z.; Song, Q.; Ai, X.; Lv, Z. Effect of joining time on intermetallic compound thickness and mechanical properties of refill friction stir spot welded dissimilar Al/Mg alloys. J. Manuf. Process. 2019, 42, 106–112. [Google Scholar] [CrossRef]
- Dong, H.; Chen, S.; Song, Y.; Guo, X.; Zhang, X.; Sun, Z. Refilled friction stir spot welding of aluminum alloy to galvanized steel sheets. Mater. Des. 2016, 94, 457–466. [Google Scholar] [CrossRef]
- Ding, Y.; Shen, Z.; Gerlich, A.P. Refill friction stir spot welding of dissimilar aluminum alloy and AlSi coated steel. J. Manuf. Process. 2017, 30, 353–360. [Google Scholar] [CrossRef]
- Li, P.; Chen, S.; Dong, H.; Ji, H.; Li, Y.; Guo, X.; Yang, G.; Zhang, X.; Han, X. Interfacial microstructure and mechanical properties of dissimilar aluminum/steel joint fabricated via refilled friction stir spot welding. J. Manuf. Process. 2020, 49, 385–396. [Google Scholar] [CrossRef]
- Chen, Y.; Chen, J.; Shalchi Amirkhiz, B.; Worswick, M.J.; Gerlich, A.P. Microstructures and properties of Mg alloy/DP600 steel dissimilar refill friction stir spot welds. Sci. Technol. Weld. Join. 2015, 20, 494–501. [Google Scholar] [CrossRef]
- Gonçalves, J.; dos Santos, J.F.; Canto, L.B.; Filho, S.T.A. Improvement of friction spot welding (FSpW) to join polyamide 6 and polyamide 66/carbon fibre laminate. Weld. Int. 2016, 30, 247–254. [Google Scholar] [CrossRef]
- Junior, W.S.; Handge, U.A.; dos Santos, J.F.; Abetz, V.; Amancio-Filho, S.T. Feasibility study of friction spot welding of dissimilar single-lap joint between poly(methyl methacrylate) and poly(methyl methacrylate)-SiO2 nanocomposite. Mater. Des. 2014, 64, 246–250. [Google Scholar] [CrossRef]
- Yang, X.W.; Fu, T.; Li, W.Y. Friction stir spot welding: A review on joint macro- and microstructure, property, and process modelling. Adv. Mater. Sci. Eng. 2014, 2014, 697170. [Google Scholar] [CrossRef] [Green Version]
- Montag, T.; Wulfsberg, J.P.; Hameister, H.; Marschner, R. Influence of tool wear on quality criteria for refill friction stir spot welding (RFSSW) process. Procedia CIRP 2014, 24, 108–113. [Google Scholar] [CrossRef] [Green Version]
- De Castro, C.C. Refill Friction Stir Spot Welding: Evaluation of the welding of AA2198-T8 sheets and preliminary tool wear investigation. Master’s Thesis, Federal University of São Carlos, São Carlos, Brazil, 2019. [Google Scholar]
- Larsen, B.; Hunt, J.; Hovanski, Y. Investigating steel tool life in the RFSSW process. J. Manuf. Process. 2020, 58, 637–645. [Google Scholar] [CrossRef]
- Lauterbach, D.; Keil, D.; Harms, A.; Leupold, C.; Dilger, K. Tool wear behaviour and the influence of wear-resistant coatings during refill friction stir spot welding of aluminium alloys. Weld. World 2021, 65, 243–250. [Google Scholar] [CrossRef]
- ASM Handbook Volume 2: Properties and Selection: Nonferrous Alloys and Special-Purpose Materials, 10th ed.; ASM International: Materials Park, OH, USA, 1990.
- Nasiri, A.M.; Shen, Z.; Hou, J.S.C.; Gerlich, A.P. Failure analysis of tool used in refill friction stir spot welding of Al 2099 alloy. Eng. Fail. Anal. 2018, 84, 25–33. [Google Scholar] [CrossRef]
- ISO 14273:2016—Resistance Welding—Destructive Testing of Welds—Specimen Dimensions and Procedure for Tensile Shear Testing Resistance Spot and Embossed Projection Welds; International Organization for Standardization: Geneva, Switzerland, 2016.
- Zhou, L.; Luo, L.Y.; Wang, R.; Zhang, J.B.; Huang, Y.X.; Song, X.G. Process Parameter Optimization in Refill Friction Spot Welding of 6061 Aluminum Alloys Using Response Surface Methodology. J. Mater. Eng. Perform. 2018, 27, 4050–4058. [Google Scholar] [CrossRef]
- de Castro, C.C.; Plaine, A.H.; de Alcântara, N.G.; dos Santos, J.F. Taguchi approach for the optimization of refill friction stir spot welding parameters for AA2198-T8 aluminum alloy. Int. J. Adv. Manuf. Technol. 2018, 99, 1927–1936. [Google Scholar] [CrossRef]
- Boldsaikhan, E.; Fukada, S.; Fujimoto, M.; Kamimuki, K.; Okada, H. Refill friction stir spot welding of surface-treated aerospace aluminum alloys with faying-surface sealant. J. Manuf. Process. 2019, 42, 113–120. [Google Scholar] [CrossRef]
- Ferreira, A.C.; Campanelli, L.C.; Suhuddin, U.F.H.; de Alcântara, N.G.; dos Santos, J.F. Investigation of internal defects and premature fracture of dissimilar refill friction stir spot welds of AA5754 and AA6061. Int. J. Adv. Manuf. Technol. 2020, 106, 3523–3531. [Google Scholar] [CrossRef]
- Xu, Z.; Li, Z.; Ji, S.; Zhang, L. Refill friction stir spot welding of 5083-O aluminum alloy. J. Mater. Sci. Technol. 2018, 34, 878–885. [Google Scholar] [CrossRef]
- Montgomery, D.C. Design and Analysis of Experiments, 10th ed.; Wiley: Hoboken, NJ, USA, 2019; ISBN 978-1-119-49244-3. [Google Scholar]
- Johnson, R.; Miller, I.; Freund, J. Miller & Freund’s Probability and Statistics for Engineers; Johnson, R.A., Miller, I., Freund, J.E., Eds.; Pearson Education: Boston, MA, USA, 2017; ISBN 9780321986245. [Google Scholar]
- ASTM E112—13 Standard Test Methods for Determining Average Grain Size; American Society for Testing and Materials: Philadelphia, PA, USA, 2013.
- ASTM E384—11 Standard Test Method for Knoop and Vickers Hardness of Materials; American Society for Testing and Materials: Philadelphia, PA, USA, 2011.
- Myers, R.H.; Montgomery, D.C.; Anderson-Cook, C.M. Response Surface Methodology: Process and Product Optimization Using Designed Experiments, 4th ed.; Wiley: Hoboken, NJ, USA, 2016; ISBN 978-1-118-91601-8. [Google Scholar]
- Dixon, R. Introduction to Solid-State Welding. In ASM Handbook Volume 6: Welding, Brazing and Soldering; ASM International: Materials Park, OH, USA, 1993. [Google Scholar]
- Kluz, R.; Kubit, A.; Trzepiecinski, T.; Faes, K.; Bochnowski, W. A Weighting Grade-Based Optimization Method for Determining Refill Friction Stir Spot Welding Process Parameters. J. Mater. Eng. Perform. 2019, 28, 6471–6482. [Google Scholar] [CrossRef] [Green Version]
- Campanelli, L.C.; Suhuddin, U.F.H.; dos Santos, J.F.; de Alcântara, N.G. Parameters optimization for friction spot welding of AZ31 magnesium alloy by Taguchi method. Soldag. Insp. 2012, 17, 26–31. [Google Scholar] [CrossRef] [Green Version]
- Cao, J.Y.; Wang, M.; Kong, L.; Guo, L.J. Hook formation and mechanical properties of friction spot welding in alloy 6061-T6. J. Mater. Process. Technol. 2016, 230, 254–262. [Google Scholar] [CrossRef]
- Li, Z.; Ji, S.; Ma, Y.; Chai, P.; Yue, Y.; Gao, S. Fracture mechanism of refill friction stir spot-welded 2024-T4 aluminum alloy. Int. J. Adv. Manuf. Technol. 2016, 86, 1925–1932. [Google Scholar] [CrossRef]
- Li, G.; Zhou, L.; Luo, L.; Wu, X.; Guo, N. Microstructural evolution and mechanical properties of refill friction stir spot welded alclad 2A12-T4 aluminum alloy. J. Mater. Res. Technol. 2019, 8, 4115–4129. [Google Scholar] [CrossRef]
- Chen, Y. Refill Friction Stir Spot Welding of Dissimilar Alloys. Master’s Thesis, University of Waterloo, Waterloo, ON, Canada, 2015. [Google Scholar]
- Chai, P.; Wang, Y. Effect of Rotational Speed on Microstructure and Mechanical Properties of 2060 Aluminum Alloy RFSSW Joint. Met. Mater. Int. 2019, 25, 1574–1585. [Google Scholar] [CrossRef]
- Zhou, L.; Luo, L.Y.; Zhang, T.P.; He, W.X.; Huang, Y.X.; Feng, J.C. Effect of rotation speed on microstructure and mechanical properties of refill friction stir spot welded 6061-T6 aluminum alloy. Int. J. Adv. Manuf. Technol. 2017, 92, 3425–3433. [Google Scholar] [CrossRef]
- Wang, Y.; Chai, P.; Ma, H.; Cao, X.; Zhang, Y. Formation mechanism and fracture behavior in extra-filling refill friction stir spot weld for Al–Cu–Mg aluminum alloy. J. Mater. Sci. 2020, 55, 358–374. [Google Scholar] [CrossRef]
- Rosendo, T.; Tier, M.; Mazzaferro, J.; Mazzaferro, C.; Strohaecker, T.R.; Dos Santos, J.F. Mechanical performance of AA6181 refill friction spot welds under Lap shear tensile loading. Fatigue Fract. Eng. Mater. Struct. 2015, 38, 1443–1455. [Google Scholar] [CrossRef]
- Silva, B.H.; Suhuddin, U.F.H.; Zepon, G.; Bolfarini, C.; dos Santos, J.F. Refill friction stir spot welding of AA6082-T6 alloy: Hook defect formation and its influence on the mechanical properties and fracture behavior. Mater. Sci. Eng. A 2020, 773, 138724. [Google Scholar] [CrossRef]
- Sun, G.D.; Zhou, L.; Zhang, R.X.; Luo, L.Y.; Xu, H.; Zhao, H.Y.; Guo, N.; Zhang, D. Effect of Sleeve Plunge Depth on Interface/Mechanical Characteristics in Refill Friction Stir Spot Welded Joint. Acta Metall. Sin. 2020, 33, 551–560. [Google Scholar] [CrossRef]
- Yin, Y.H.; Sun, N.; North, T.H.; Hu, S.S. Influence of tool design on mechanical properties of AZ31 friction stir spot welds. Sci. Technol. Weld. Join. 2010, 15, 81–86. [Google Scholar] [CrossRef]
- Brzostek, R.C.; Suhuddin, U.; dos Santos, J.F. Fatigue assessment of refill friction stir spot weld in AA 2024-T3 similar joints. Fatigue Fract. Eng. Mater. Struct. 2018, 41, 1208–1223. [Google Scholar] [CrossRef]
- Fink, W.L.; Willey, L.A. Quenching of 75S aluminum alloy. Trans. AIME 1948, 175, 414–427. [Google Scholar]
- Dolan, G.P.; Robinson, J.S. Residual stress reduction in 7175-T73, 6061-T6 and 2017A-T4 aluminium alloys using quench factor analysis. J. Mater. Process. Technol. 2004, 153–154, 346–351. [Google Scholar] [CrossRef]
- Li, H.Y.; Zeng, C.T.; Han, M.S.; Liu, J.J.; Lu, X.C. Time-temperature-property curves for quench sensitivity of 6063 aluminum alloy. Trans. Nonferr. Met. Soc. China 2013, 23, 38–45. [Google Scholar] [CrossRef]
- Liu, H.J.; Feng, J.C.; Fujii, H.; Nogi, K. Wear characteristics of a WC–Co tool in friction stir welding of AC4A+30 vol%SiCp composite. Int. J. Mach. Tools Manuf. 2005, 45, 1635–1639. [Google Scholar] [CrossRef]


| Chemical Composition (wt.%) | Mechanical Properties * | ||||||||||
|---|---|---|---|---|---|---|---|---|---|---|---|
| Al | Mg | Si | Fe | Cu | Cr | Zn | Mn | Ti | Tensile Strength [MPa] | Elongation [%] | Hardness [HV] |
| Bal. | 0.8–1.2 | 0.4–0.8 | 0.7 | 0.15–0.4 | 0.04–0.35 | 0.25 | 0.15 | 0.15 | 310 | 12 | 110 |
| Parameter | Abbreviation | Level Low (−1) | Level Middle (0) | Level High (1) |
|---|---|---|---|---|
| Rotational speed [RPM] | RS | 1000 | 1750 | 2500 |
| Dwell time [s] | DT | 0 | 1 | 2 |
| Plunge depth [mm] | PD | 1.3 | 1.65 | 2 |
| Sample Nr. | RS [RPM] | DT [s] | PD [mm] | ULSF [kN] |
|---|---|---|---|---|
| 1 | 1000 | 0 | 1.65 | 7.3 |
| 2 | 2500 | 0 | 1.65 | 8.0 |
| 3 | 1000 | 2 | 1.65 | 7.1 |
| 4 | 2500 | 2 | 1.65 | 7.7 |
| 5 | 1000 | 1 | 1.30 | 5.5 |
| 6 | 2500 | 1 | 1.30 | 6.5 |
| 7 | 1000 | 1 | 2.00 | 8.1 |
| 8 | 2500 | 1 | 2.00 | 7.3 |
| 9 | 1750 | 0 | 1.30 | 6.0 |
| 10 | 1750 | 2 | 1.30 | 6.5 |
| 11 | 1750 | 0 | 2.00 | 8.3 |
| 12 | 1750 | 2 | 2.00 | 8.1 |
| 13 | 1750 | 1 | 1.65 | 7.8 |
| 14 | 1750 | 1 | 1.65 | 7.6 |
| 15 | 1750 | 1 | 1.65 | 7.6 |
| 16 | 1750 | 1 | 1.65 | 7.4 |
| 17 | 1750 | 1 | 1.65 | 7.8 |
| 18 | 1750 | 1 | 1.65 | 7.7 |
| Parameter | p-Value |
|---|---|
| PD | <0.001 |
| PD*PD | <0.001 |
| RS*PD | 0.002 |
| RS*RS | 0.029 |
| RS | 0.035 |
| Condition | Average Grain Diameter [µm] | |
|---|---|---|
| BM | New tool | 29 ± 14 |
| 1250 spots | 25 ± 9 | |
| 2500 spots | 30 ± 8 | |
| HAZ | New tool | 10 ± 4 |
| 1250 spots | 9 ± 4 | |
| 2500 spots | 10 ± 5 | |
| SZ | New tool | 8 ± 3 |
| 1250 spots | 7 ± 3 | |
| 2500 spots | 9 ± 3 |
Publisher’s Note: MDPI stays neutral with regard to jurisdictional claims in published maps and institutional affiliations. |
© 2021 by the authors. Licensee MDPI, Basel, Switzerland. This article is an open access article distributed under the terms and conditions of the Creative Commons Attribution (CC BY) license (https://creativecommons.org/licenses/by/4.0/).
Share and Cite
de Carvalho, W.S.; Vioreanu, M.C.; Lutz, M.R.A.; Cipriano, G.P.; Amancio-Filho, S.T. The Influence of Tool Wear on the Mechanical Performance of AA6061-T6 Refill Friction Stir Spot Welds. Materials 2021, 14, 7252. https://0-doi-org.brum.beds.ac.uk/10.3390/ma14237252
de Carvalho WS, Vioreanu MC, Lutz MRA, Cipriano GP, Amancio-Filho ST. The Influence of Tool Wear on the Mechanical Performance of AA6061-T6 Refill Friction Stir Spot Welds. Materials. 2021; 14(23):7252. https://0-doi-org.brum.beds.ac.uk/10.3390/ma14237252
Chicago/Turabian Stylede Carvalho, Willian S., Maura C. Vioreanu, Maxime R. A. Lutz, Gonçalo P. Cipriano, and Sergio T. Amancio-Filho. 2021. "The Influence of Tool Wear on the Mechanical Performance of AA6061-T6 Refill Friction Stir Spot Welds" Materials 14, no. 23: 7252. https://0-doi-org.brum.beds.ac.uk/10.3390/ma14237252