
Poloxamer 407-Based Thermosensitive Emulgel as a Novel Formulation Providing a Controlled Release of Oil-Soluble Pharmaceuticals—Ibuprofen Case Study


Abstract
:
1. Introduction
2. Materials and Methods
2.1. Chemicals
2.2. Stock Solutions Preparation
2.3. Sample Preparation
2.4. Emulsification Capacity
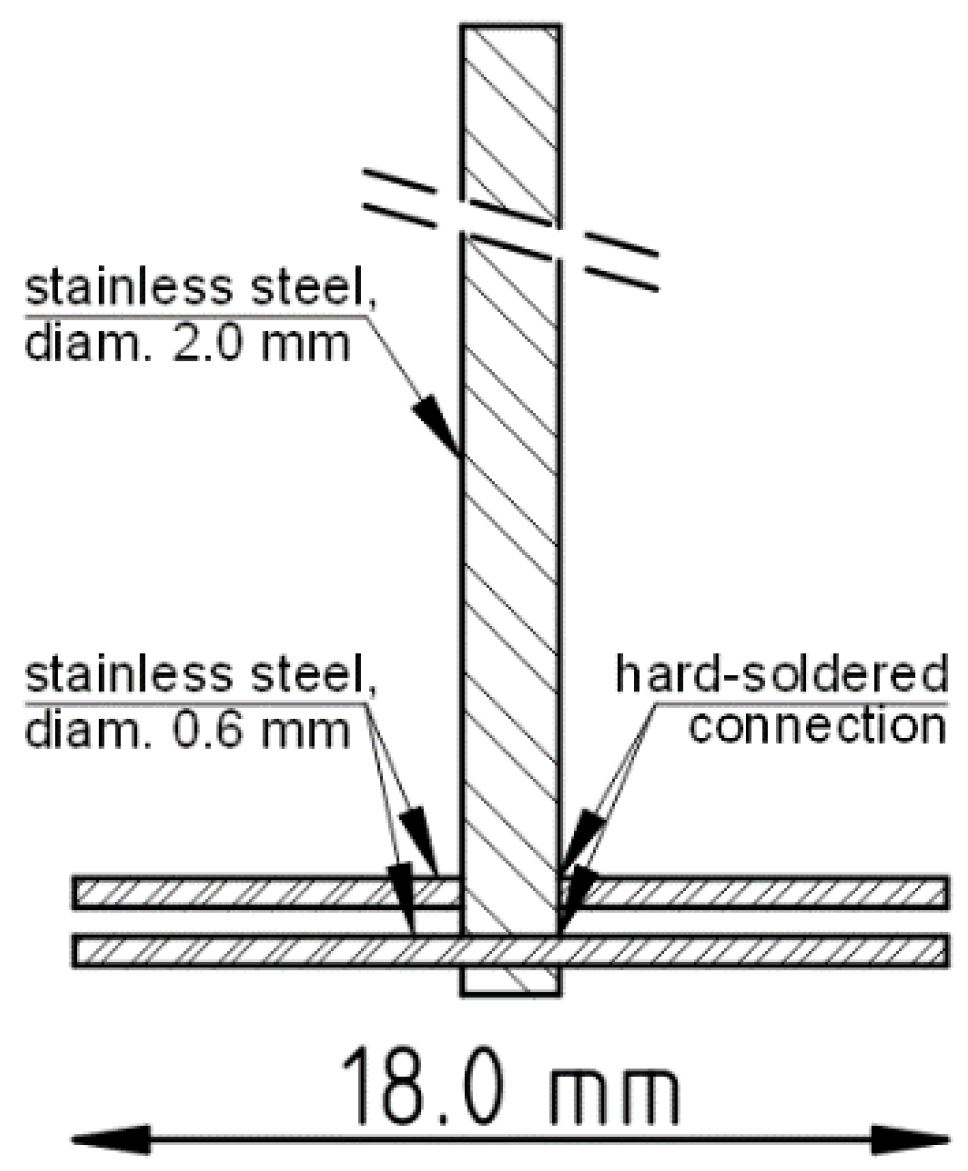
2.5. Rheometry
2.6. Tube Inversion Method (TIM)
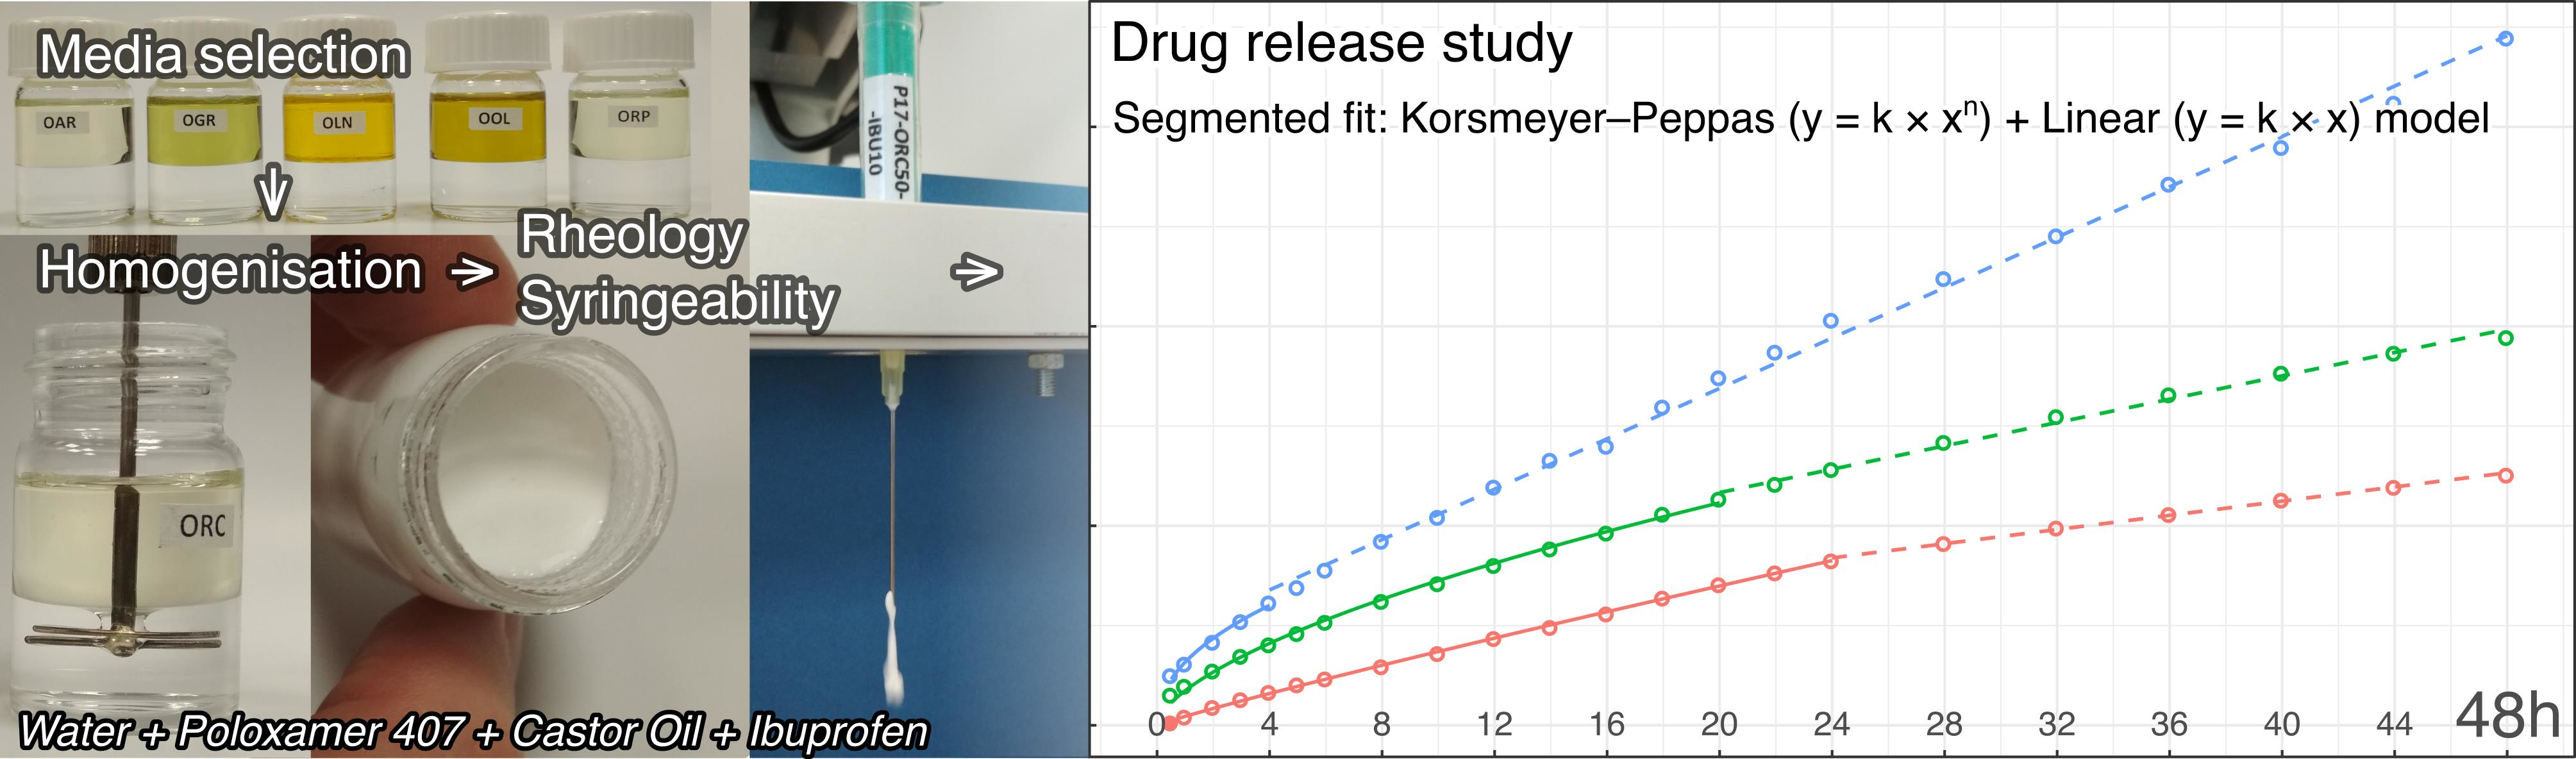
2.7. Syringeability
2.8. IBU Determination via HPLC
2.9. IBU Solubility in Chosen Vehicles
2.10. Drug Release Test
2.11. Statistics and Data Presentation
3. Results and Discussion
3.1. Emulsification Capacity/IBU Solubility

| Medium Abbreviation and Full Name | Emulsification Capacity in P17 Solution (Oil Phase Content, by Weight) | Storage Stability over 3 Months | Emulsion Structure in Studied Concentrations | IBU Solubility ± sd (mg/g) | Density (g/mL) | |
|---|---|---|---|---|---|---|
| OAR | Peanut Oil | 65% | + | o/w | 56.6 ± 1.9 | 0.915 * |
| OGR | Grapeseed Oil | 65% | + | o/w | 52.3 ± 0.4 | 0.923 * |
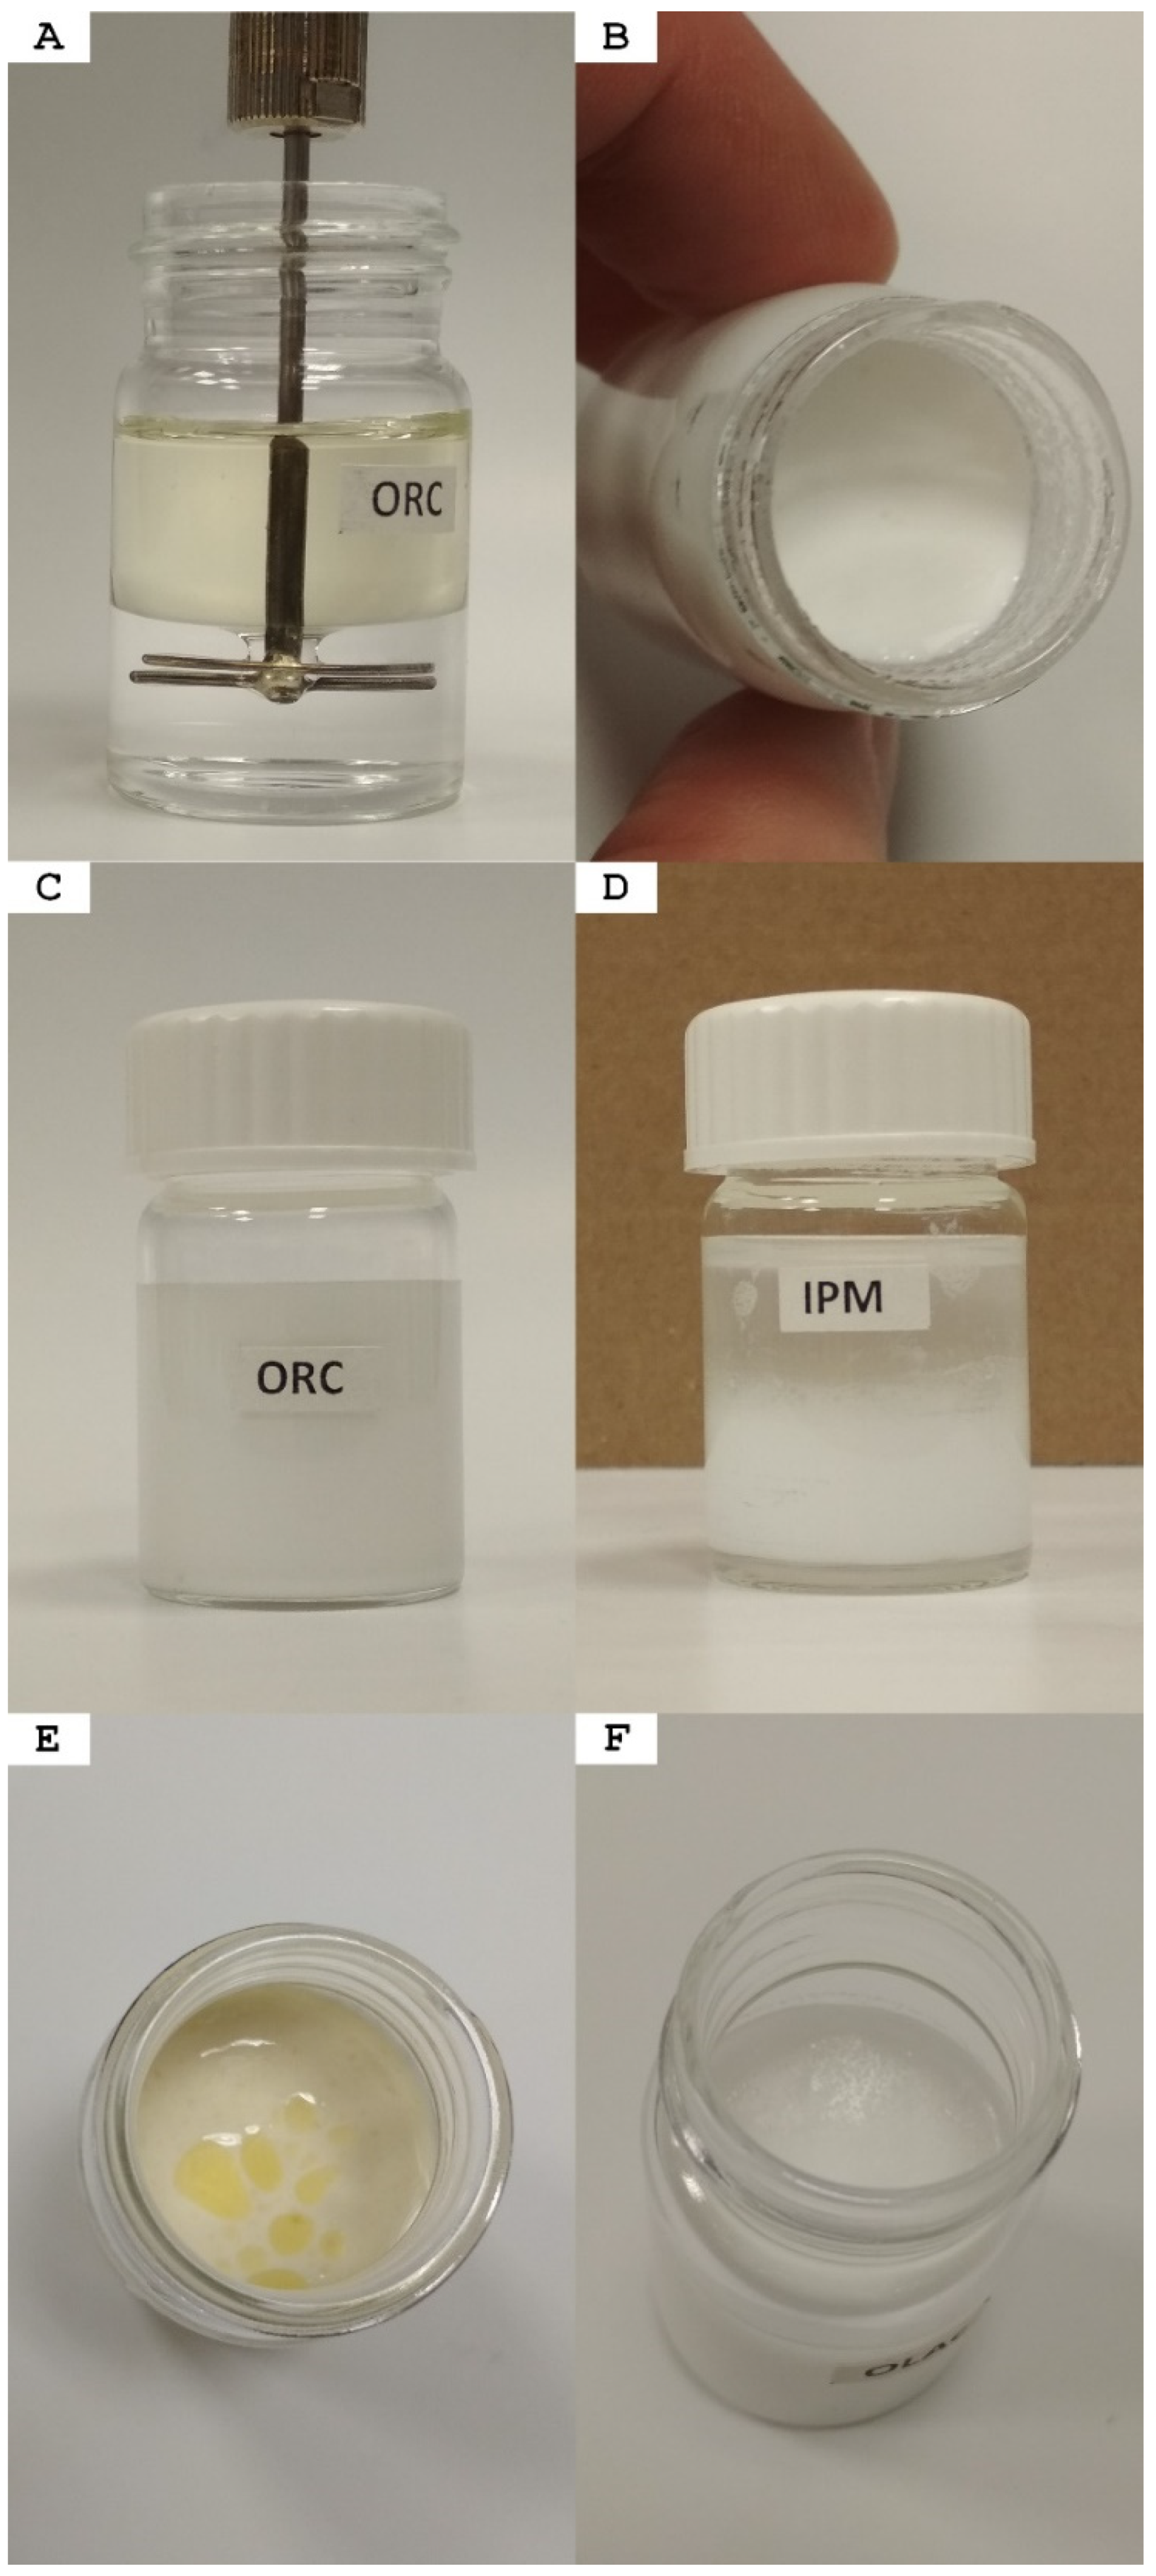
| OLN | Linseed Oil | 60% | slow breakdown after 2+ weeks (Figure 4E) | o/w | 60.3 ± 0.8 | 0.931 * |
| OOL | Olive Oil | 65% | + | o/w | 55.1 ± 0.7 | 0.913 * |
| ORC | Castor Oil | >85% | + | o/w up to 85% oil, phase inversion into w/o at 90% | 160 ± 3.6 | 0.958 * |
| ORP | Canola (rapeseed) Oil | 65% | + | o/w | 56.9 ± 0.3 | 0.917 * |
| PAR | Paraffin | 80% | + | o/w | 13.6 ± 0.4 | 0.827–0.980 *, 0.861 $ |
| IPM | Isopropyl Myristate | >75% | + | o/w, gradual inversion at higher % | 125.9 ± 0.7 | 0.853 * |
| OLAc | Oleic Acid | >75% | solidifies if refrigerated | o/w up to 20% oil, phase inversion into w/o at 25% | 171.8 ± 0.8 | 0.892 * |
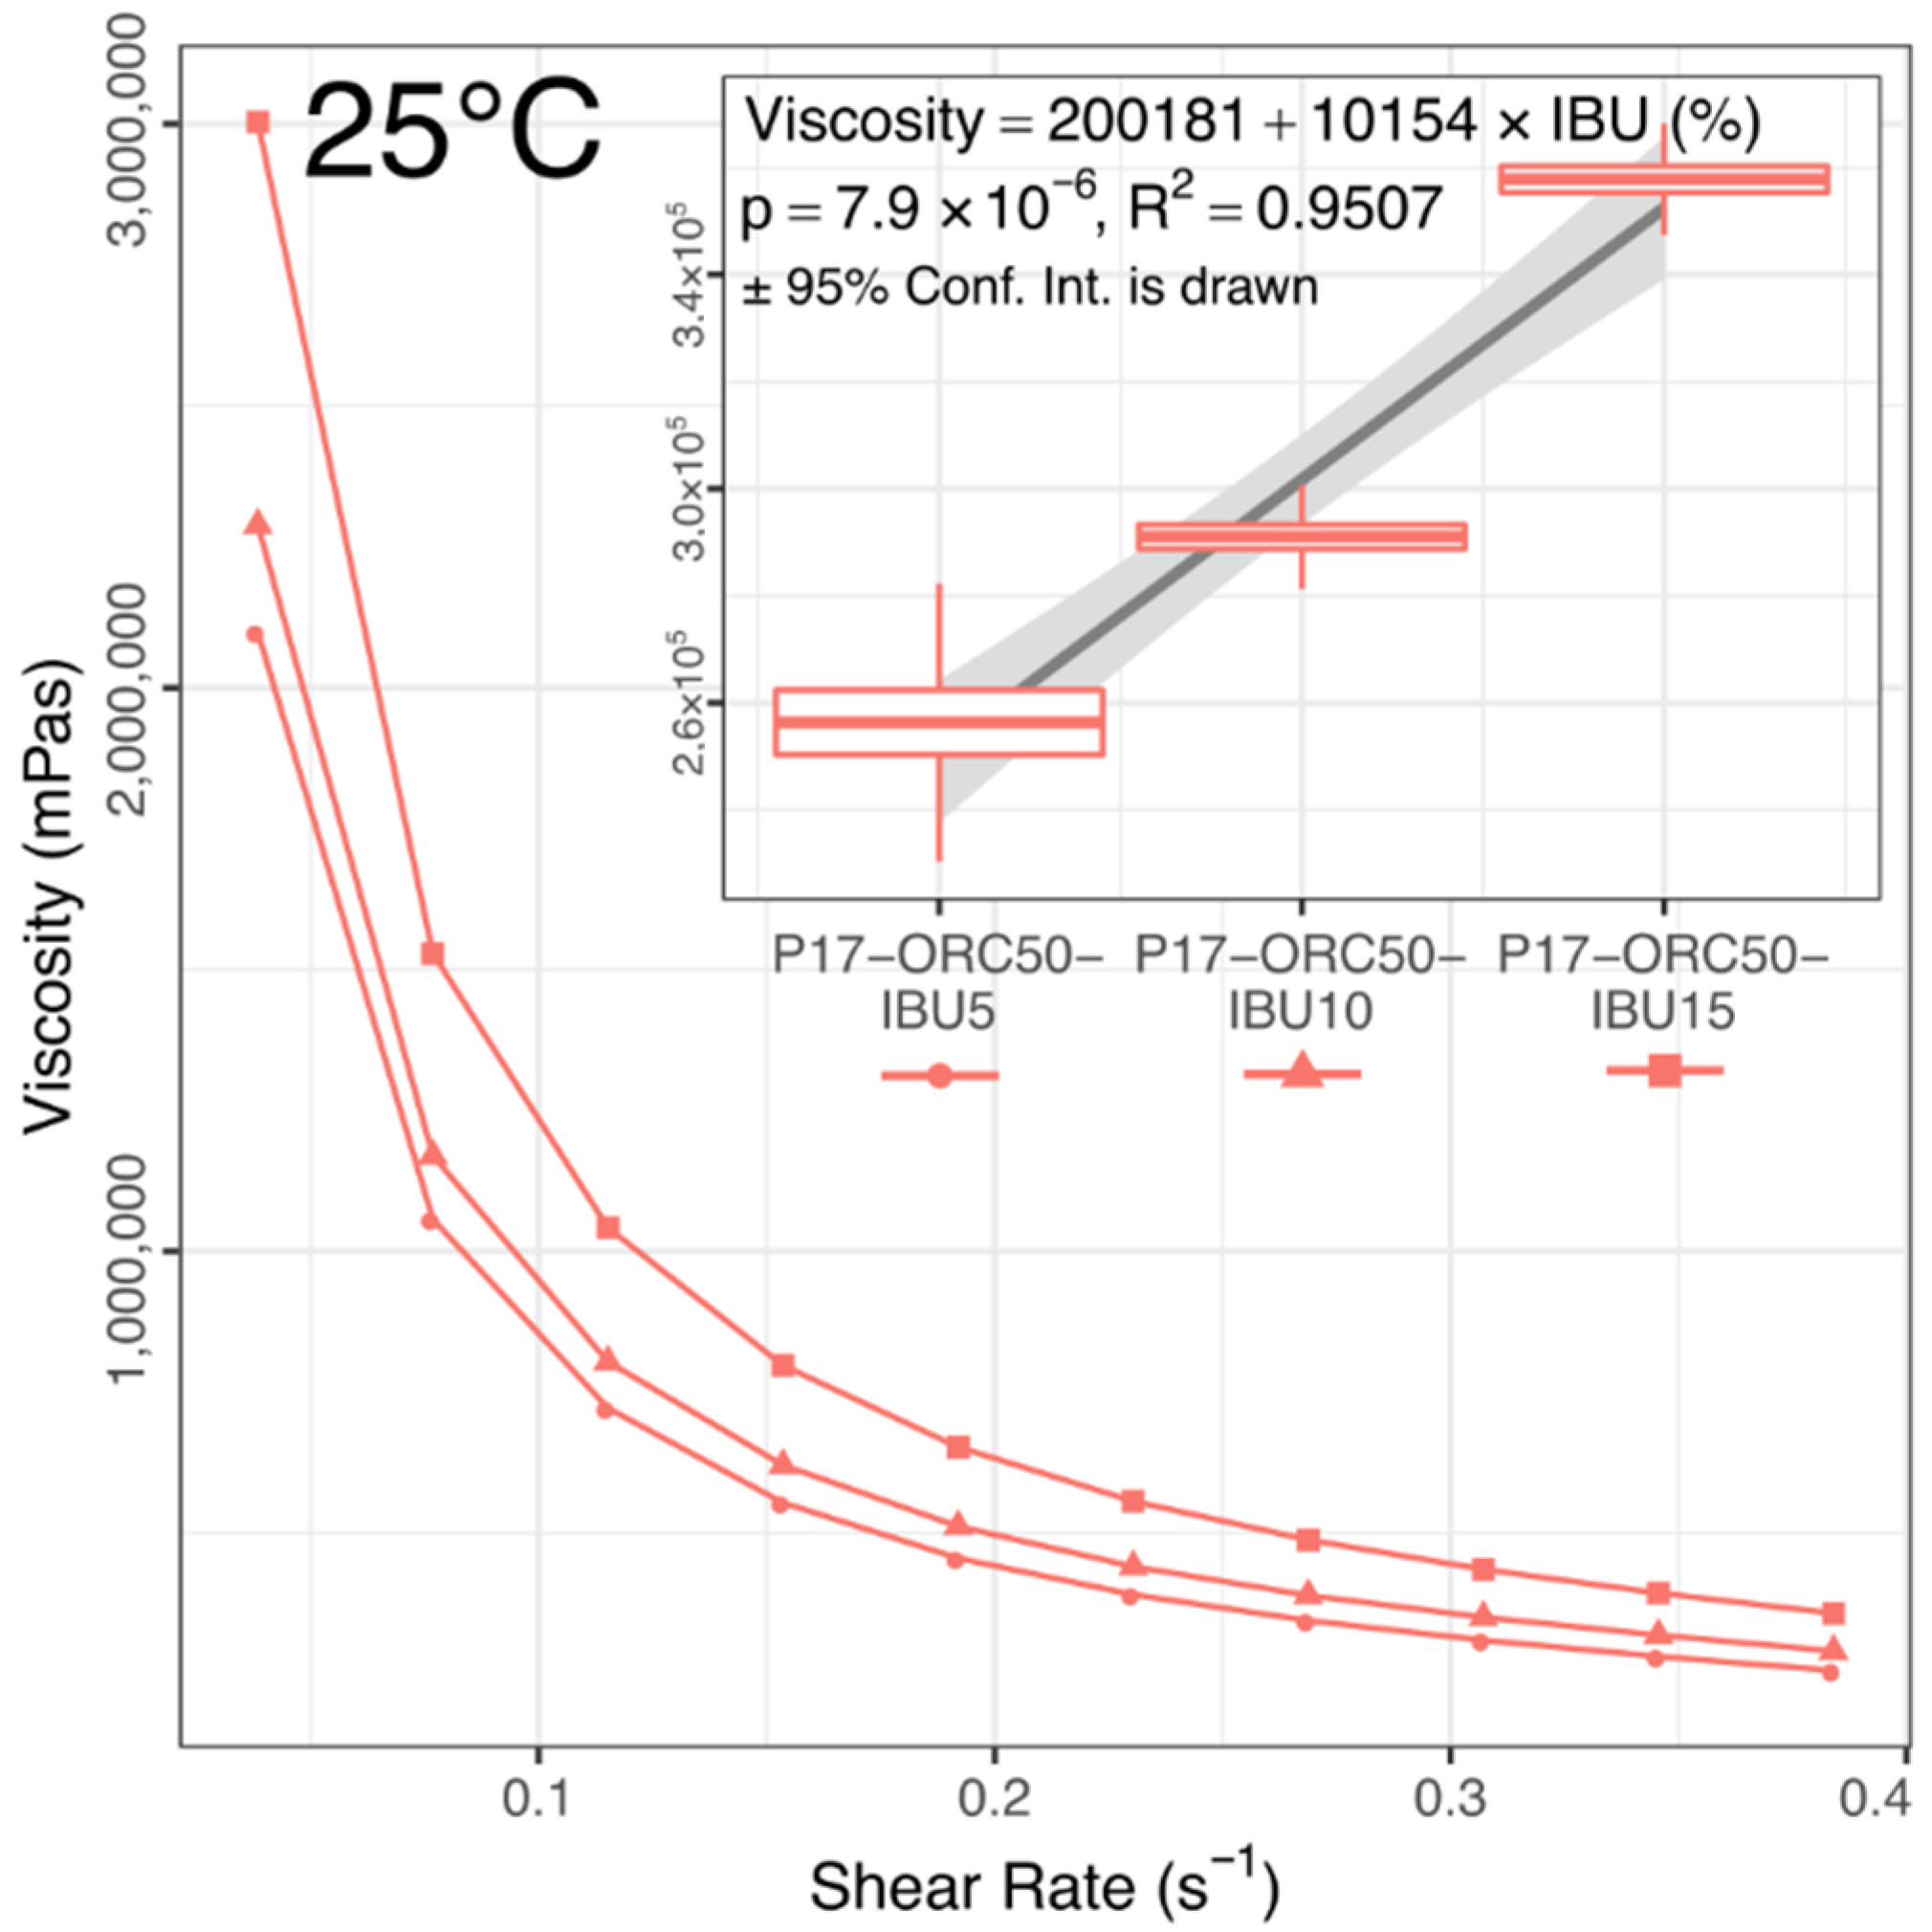
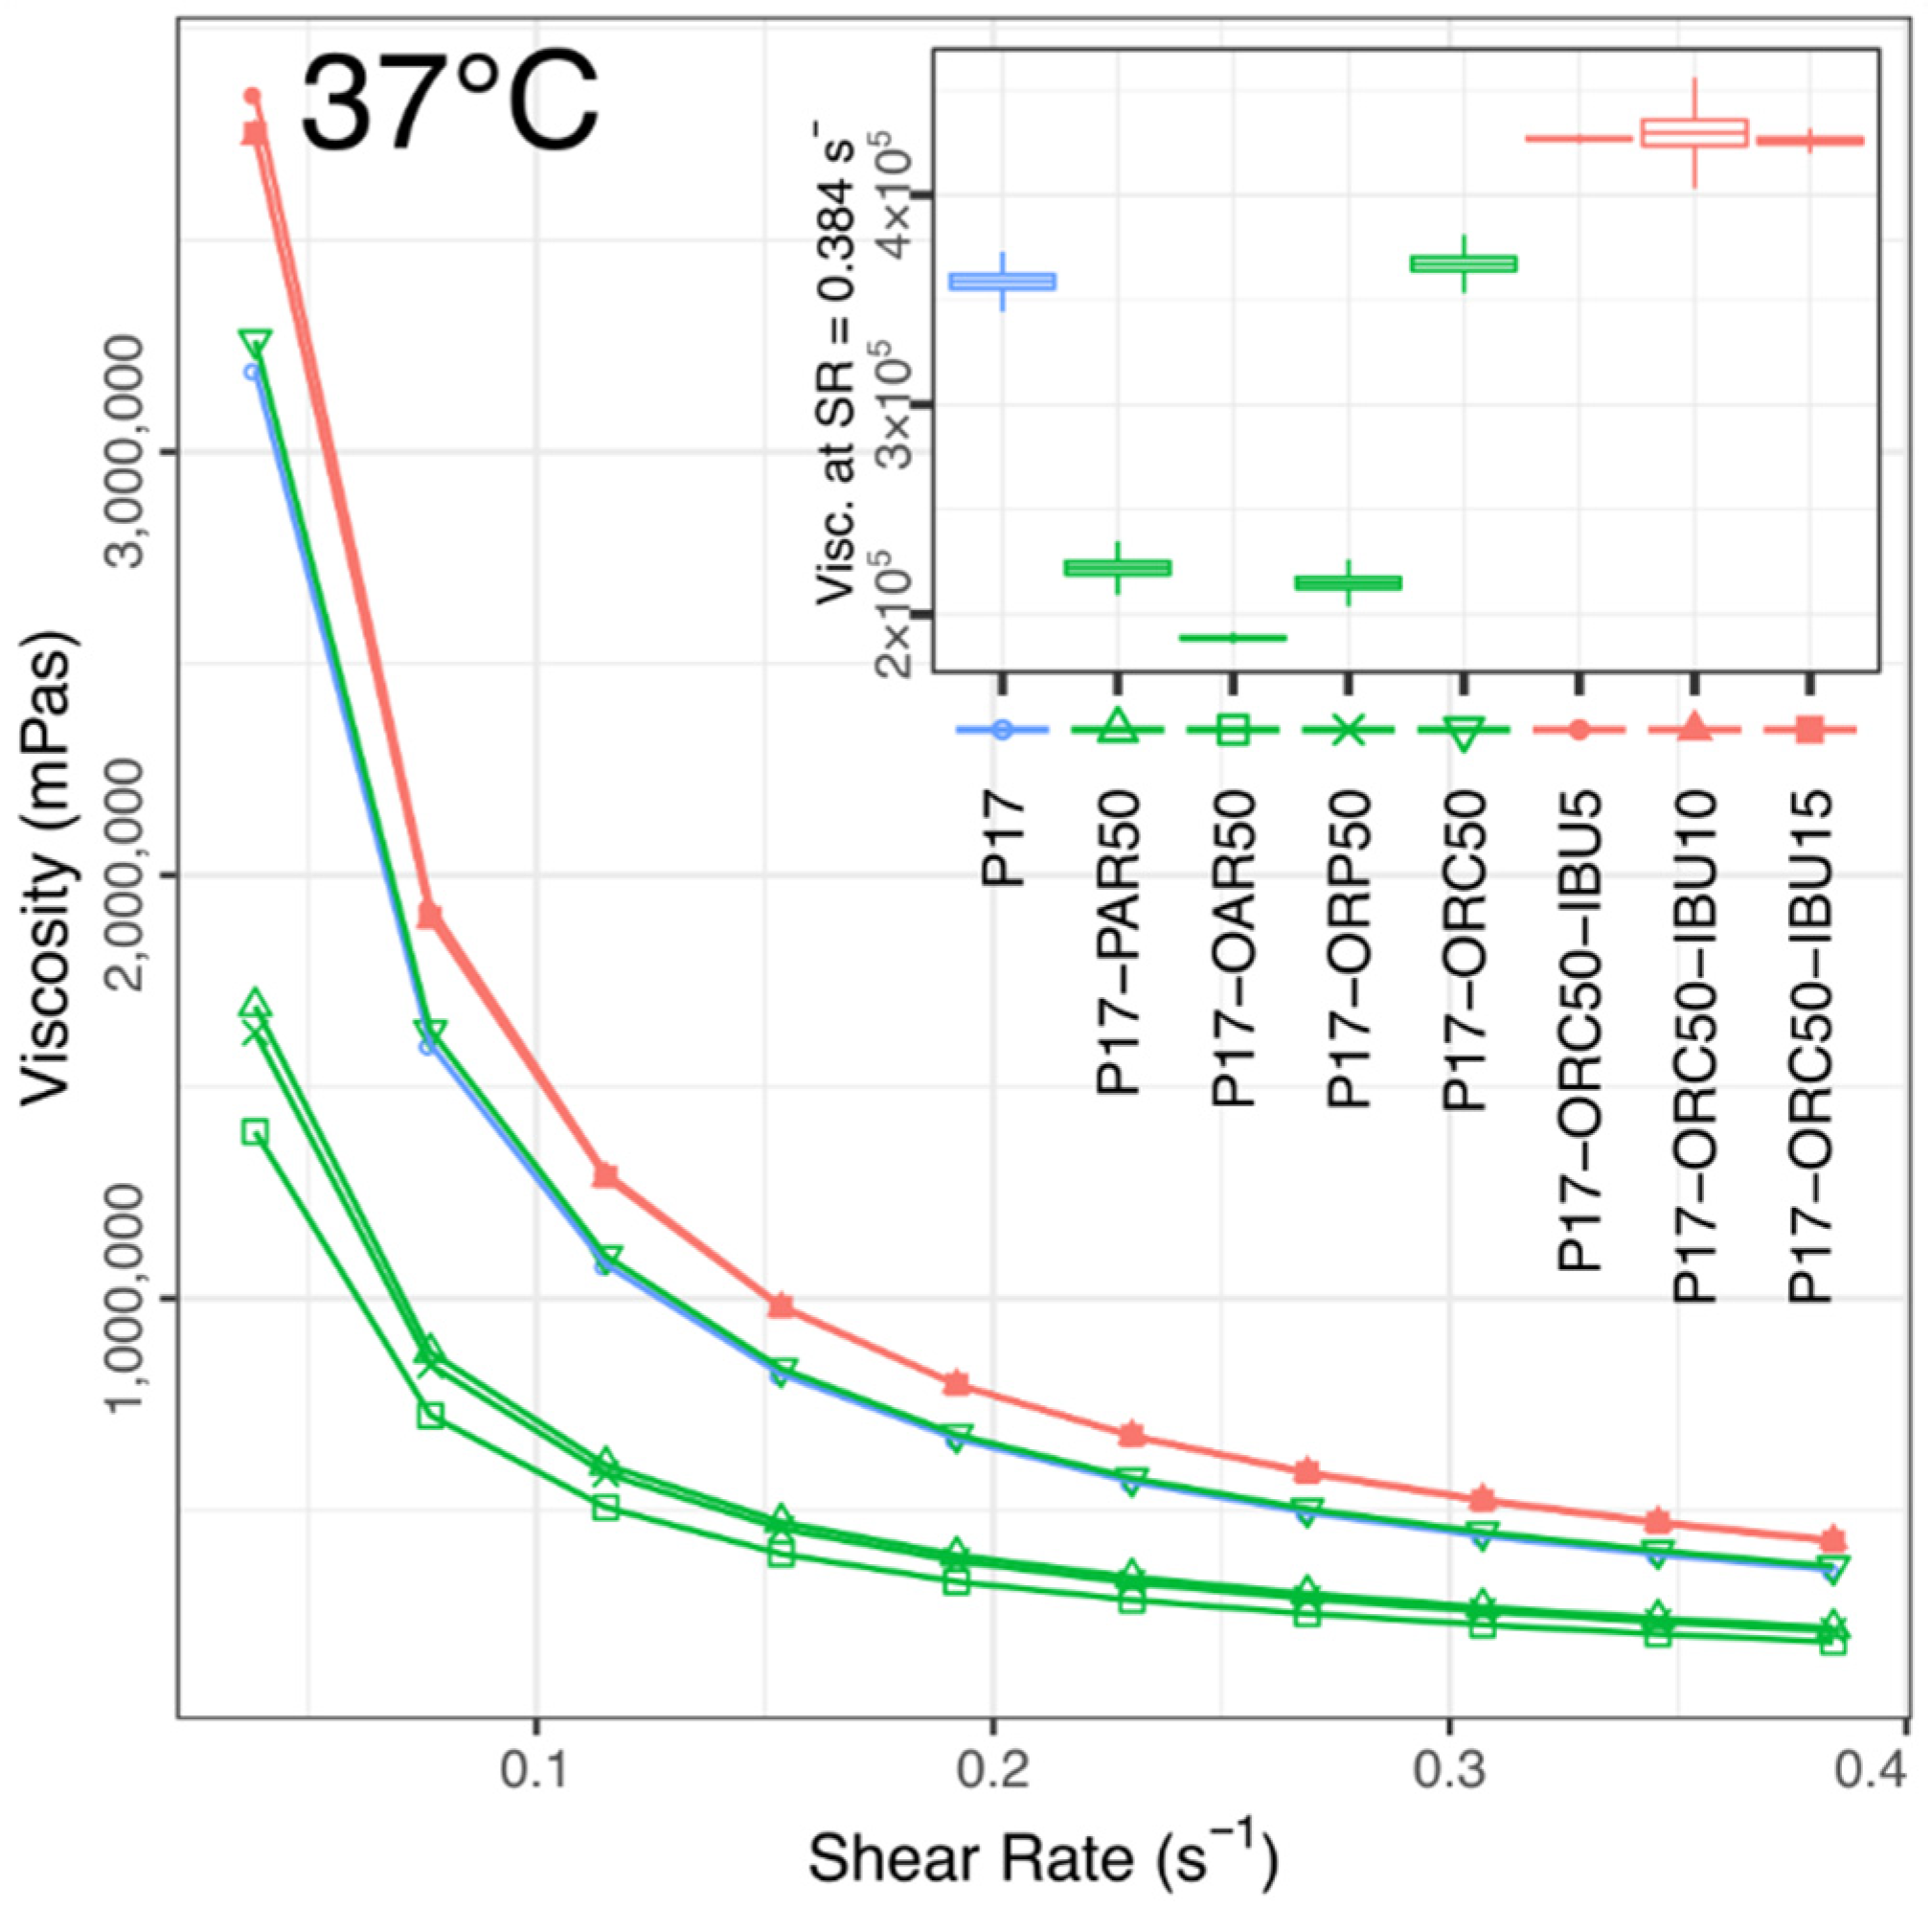
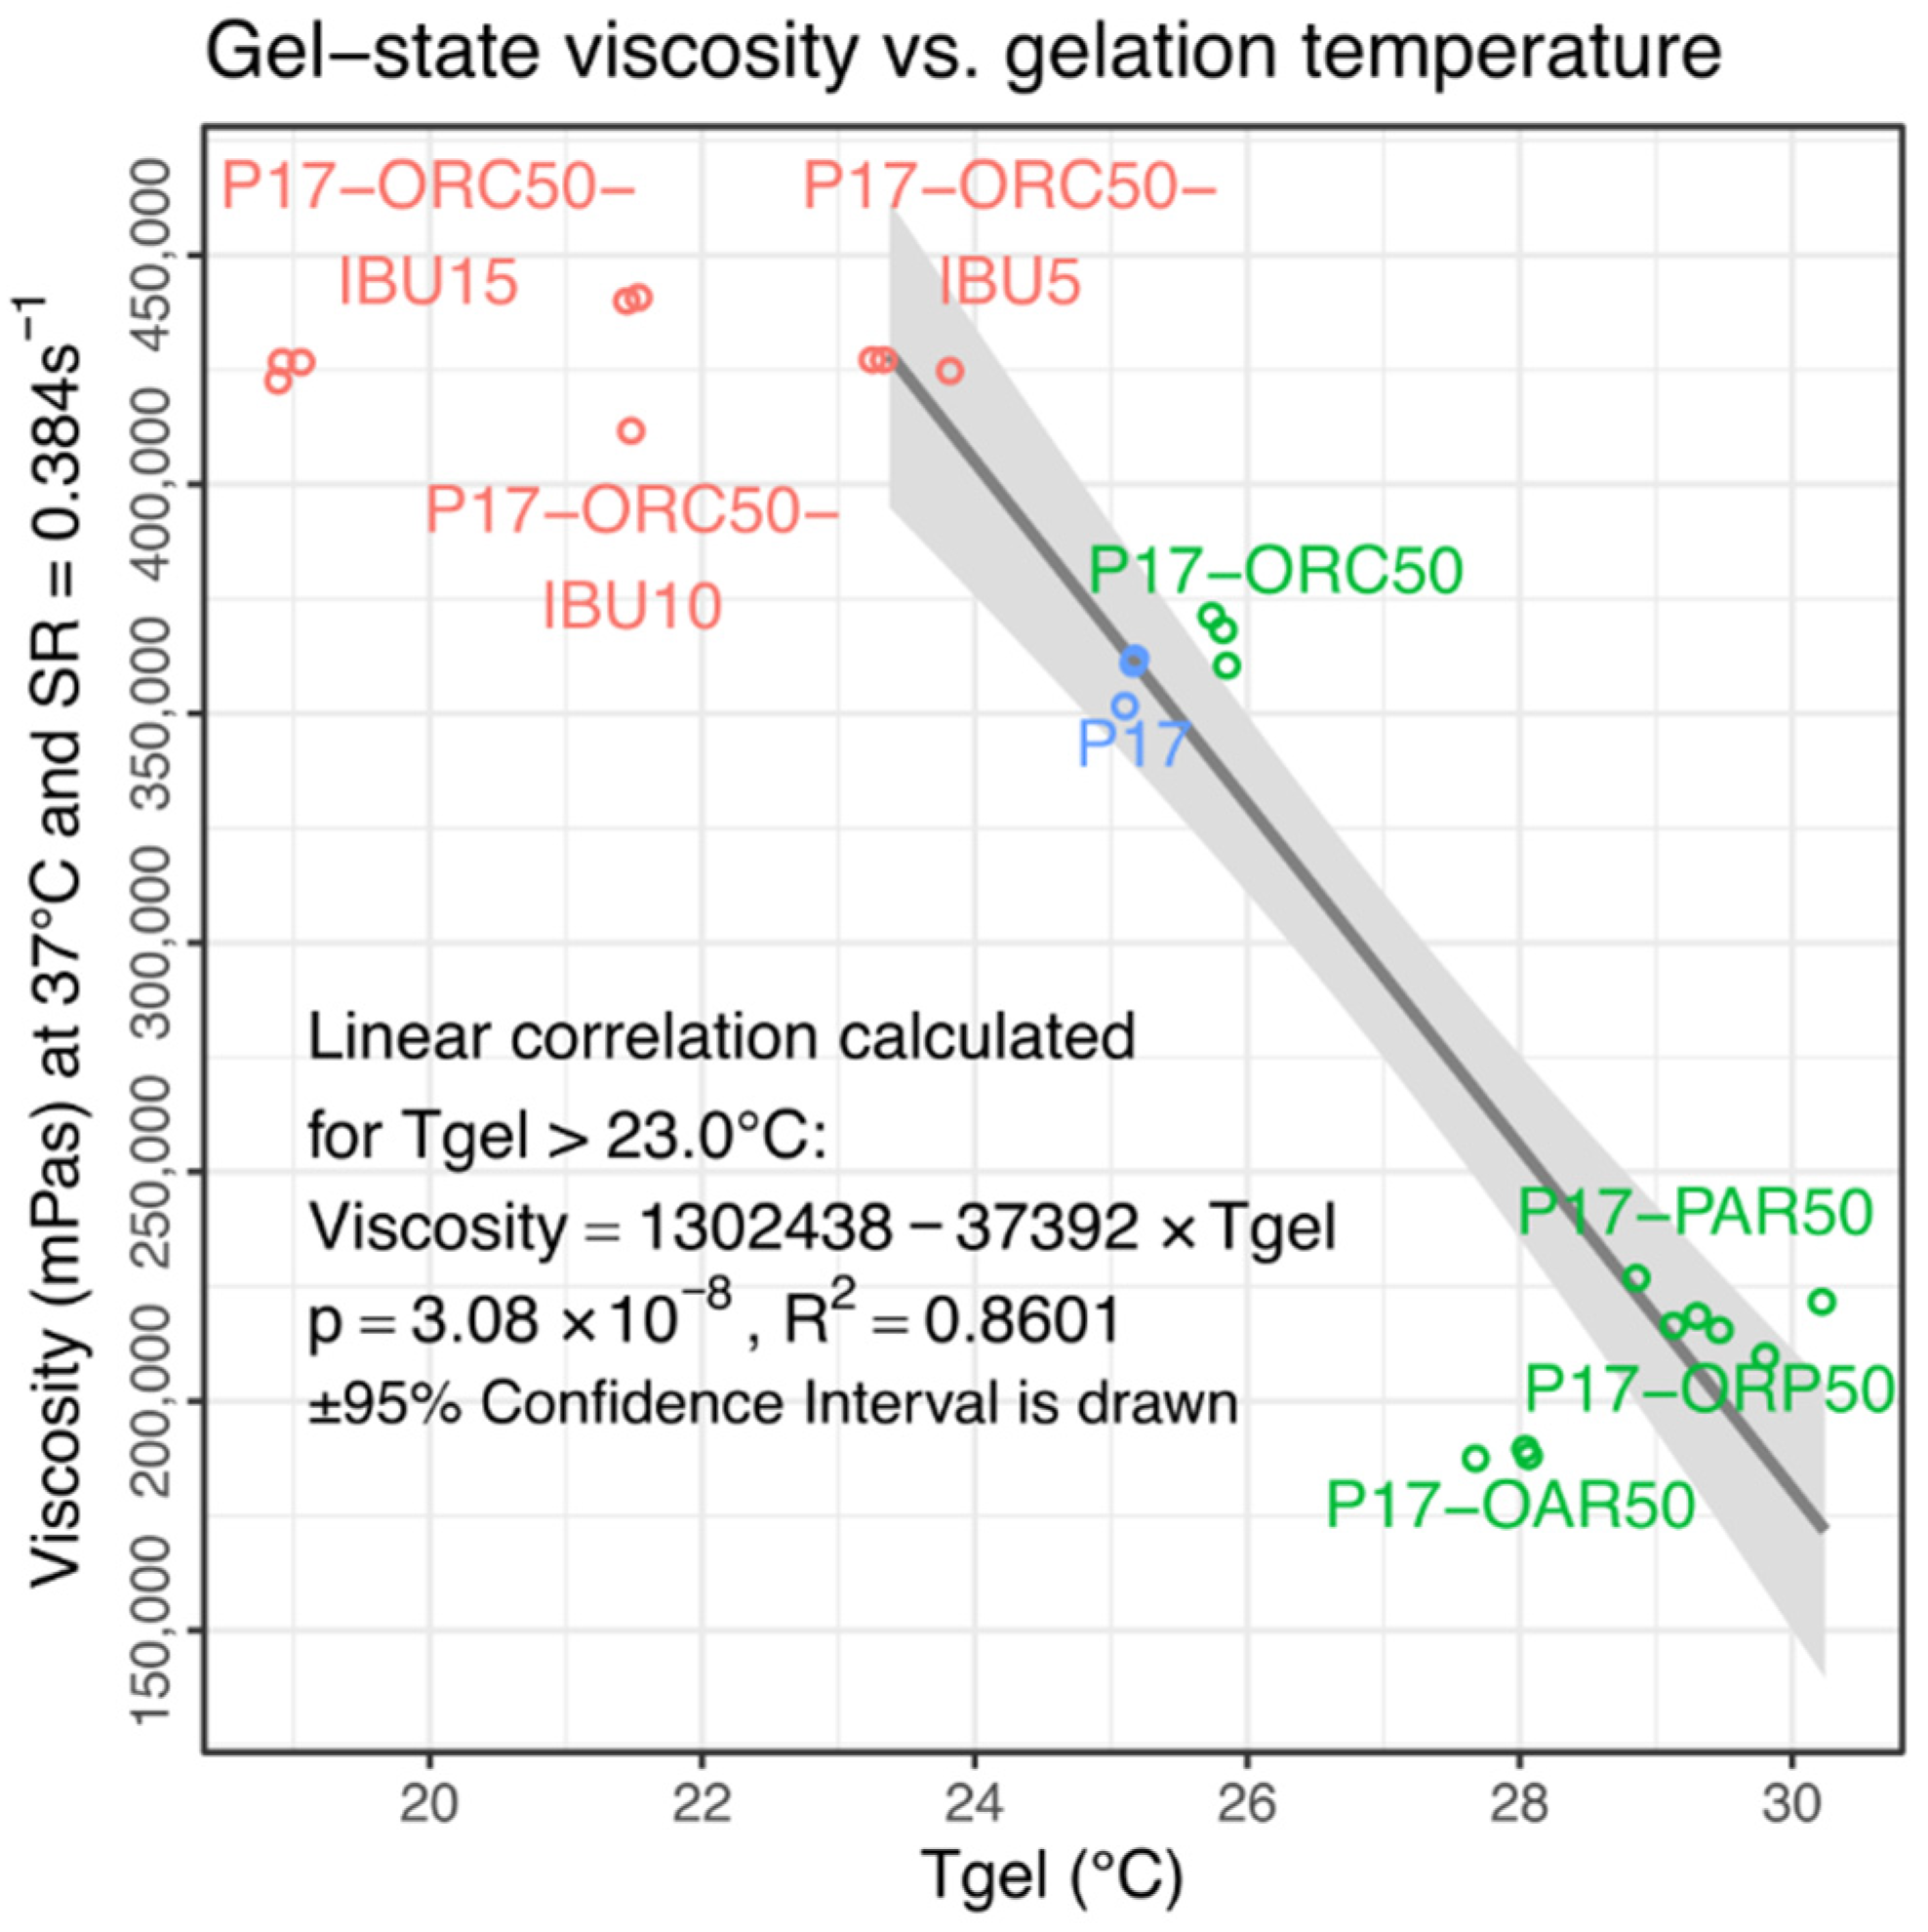
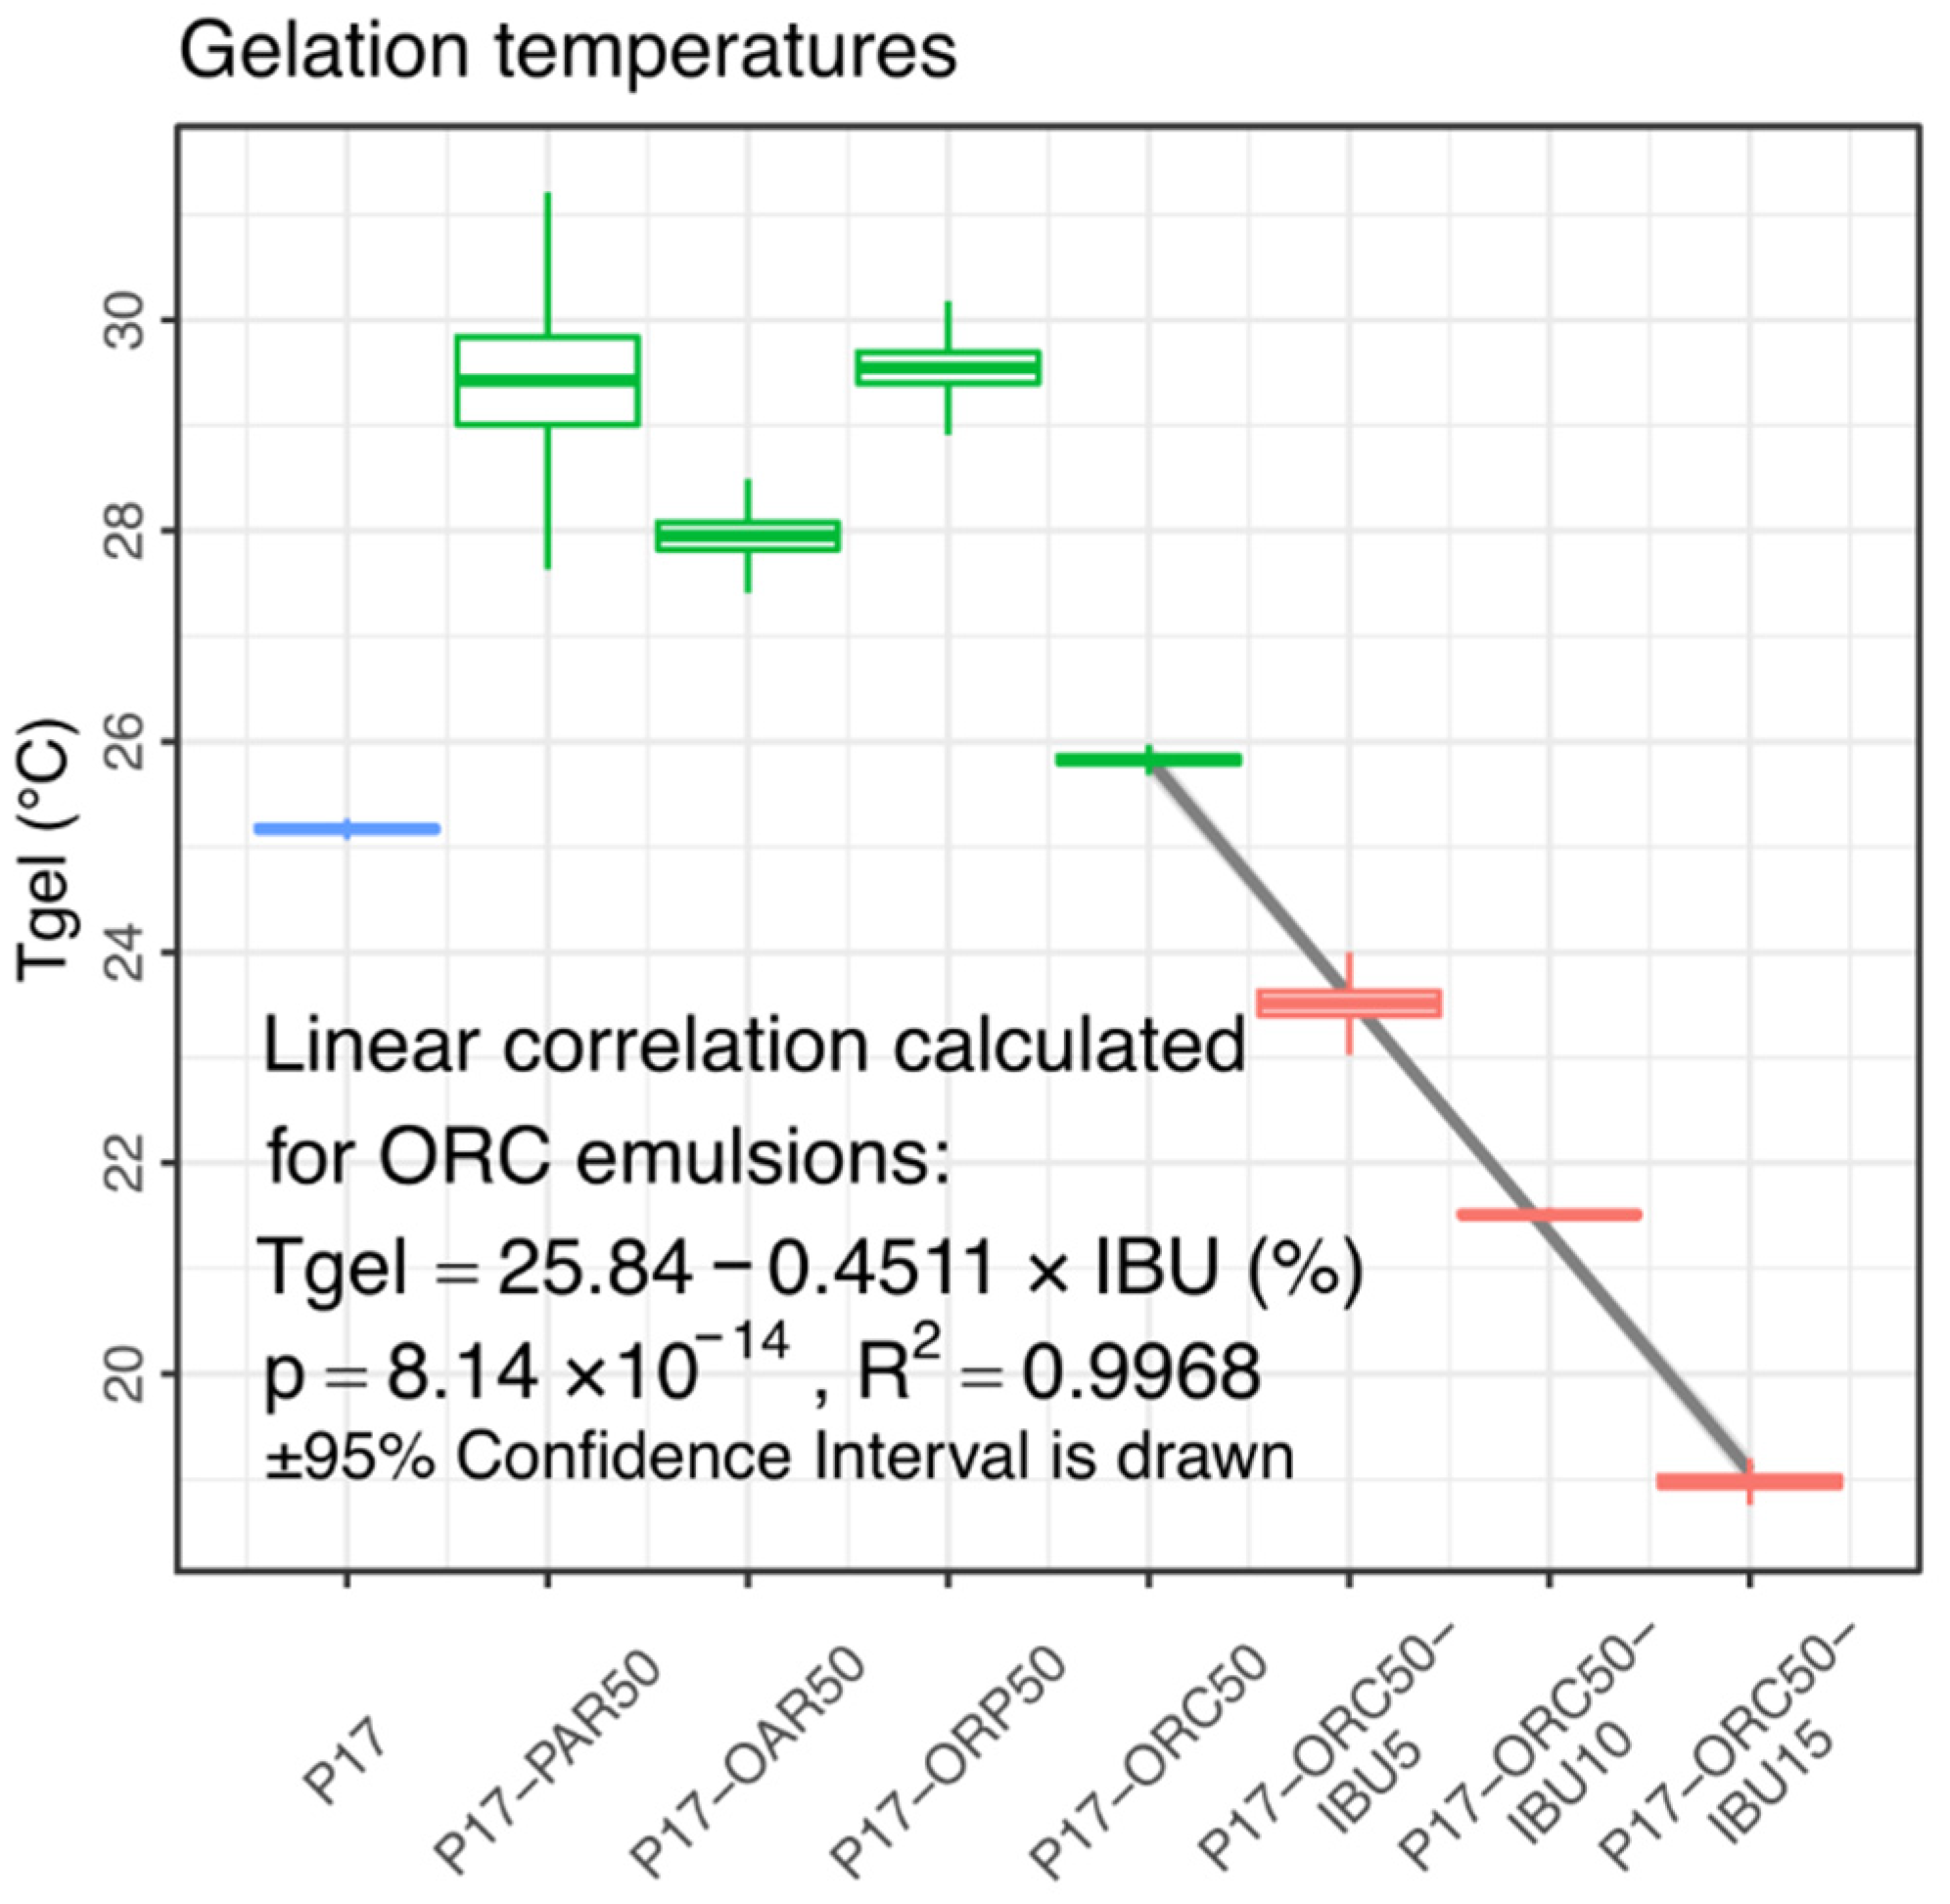
3.2. Rheology and Gelation
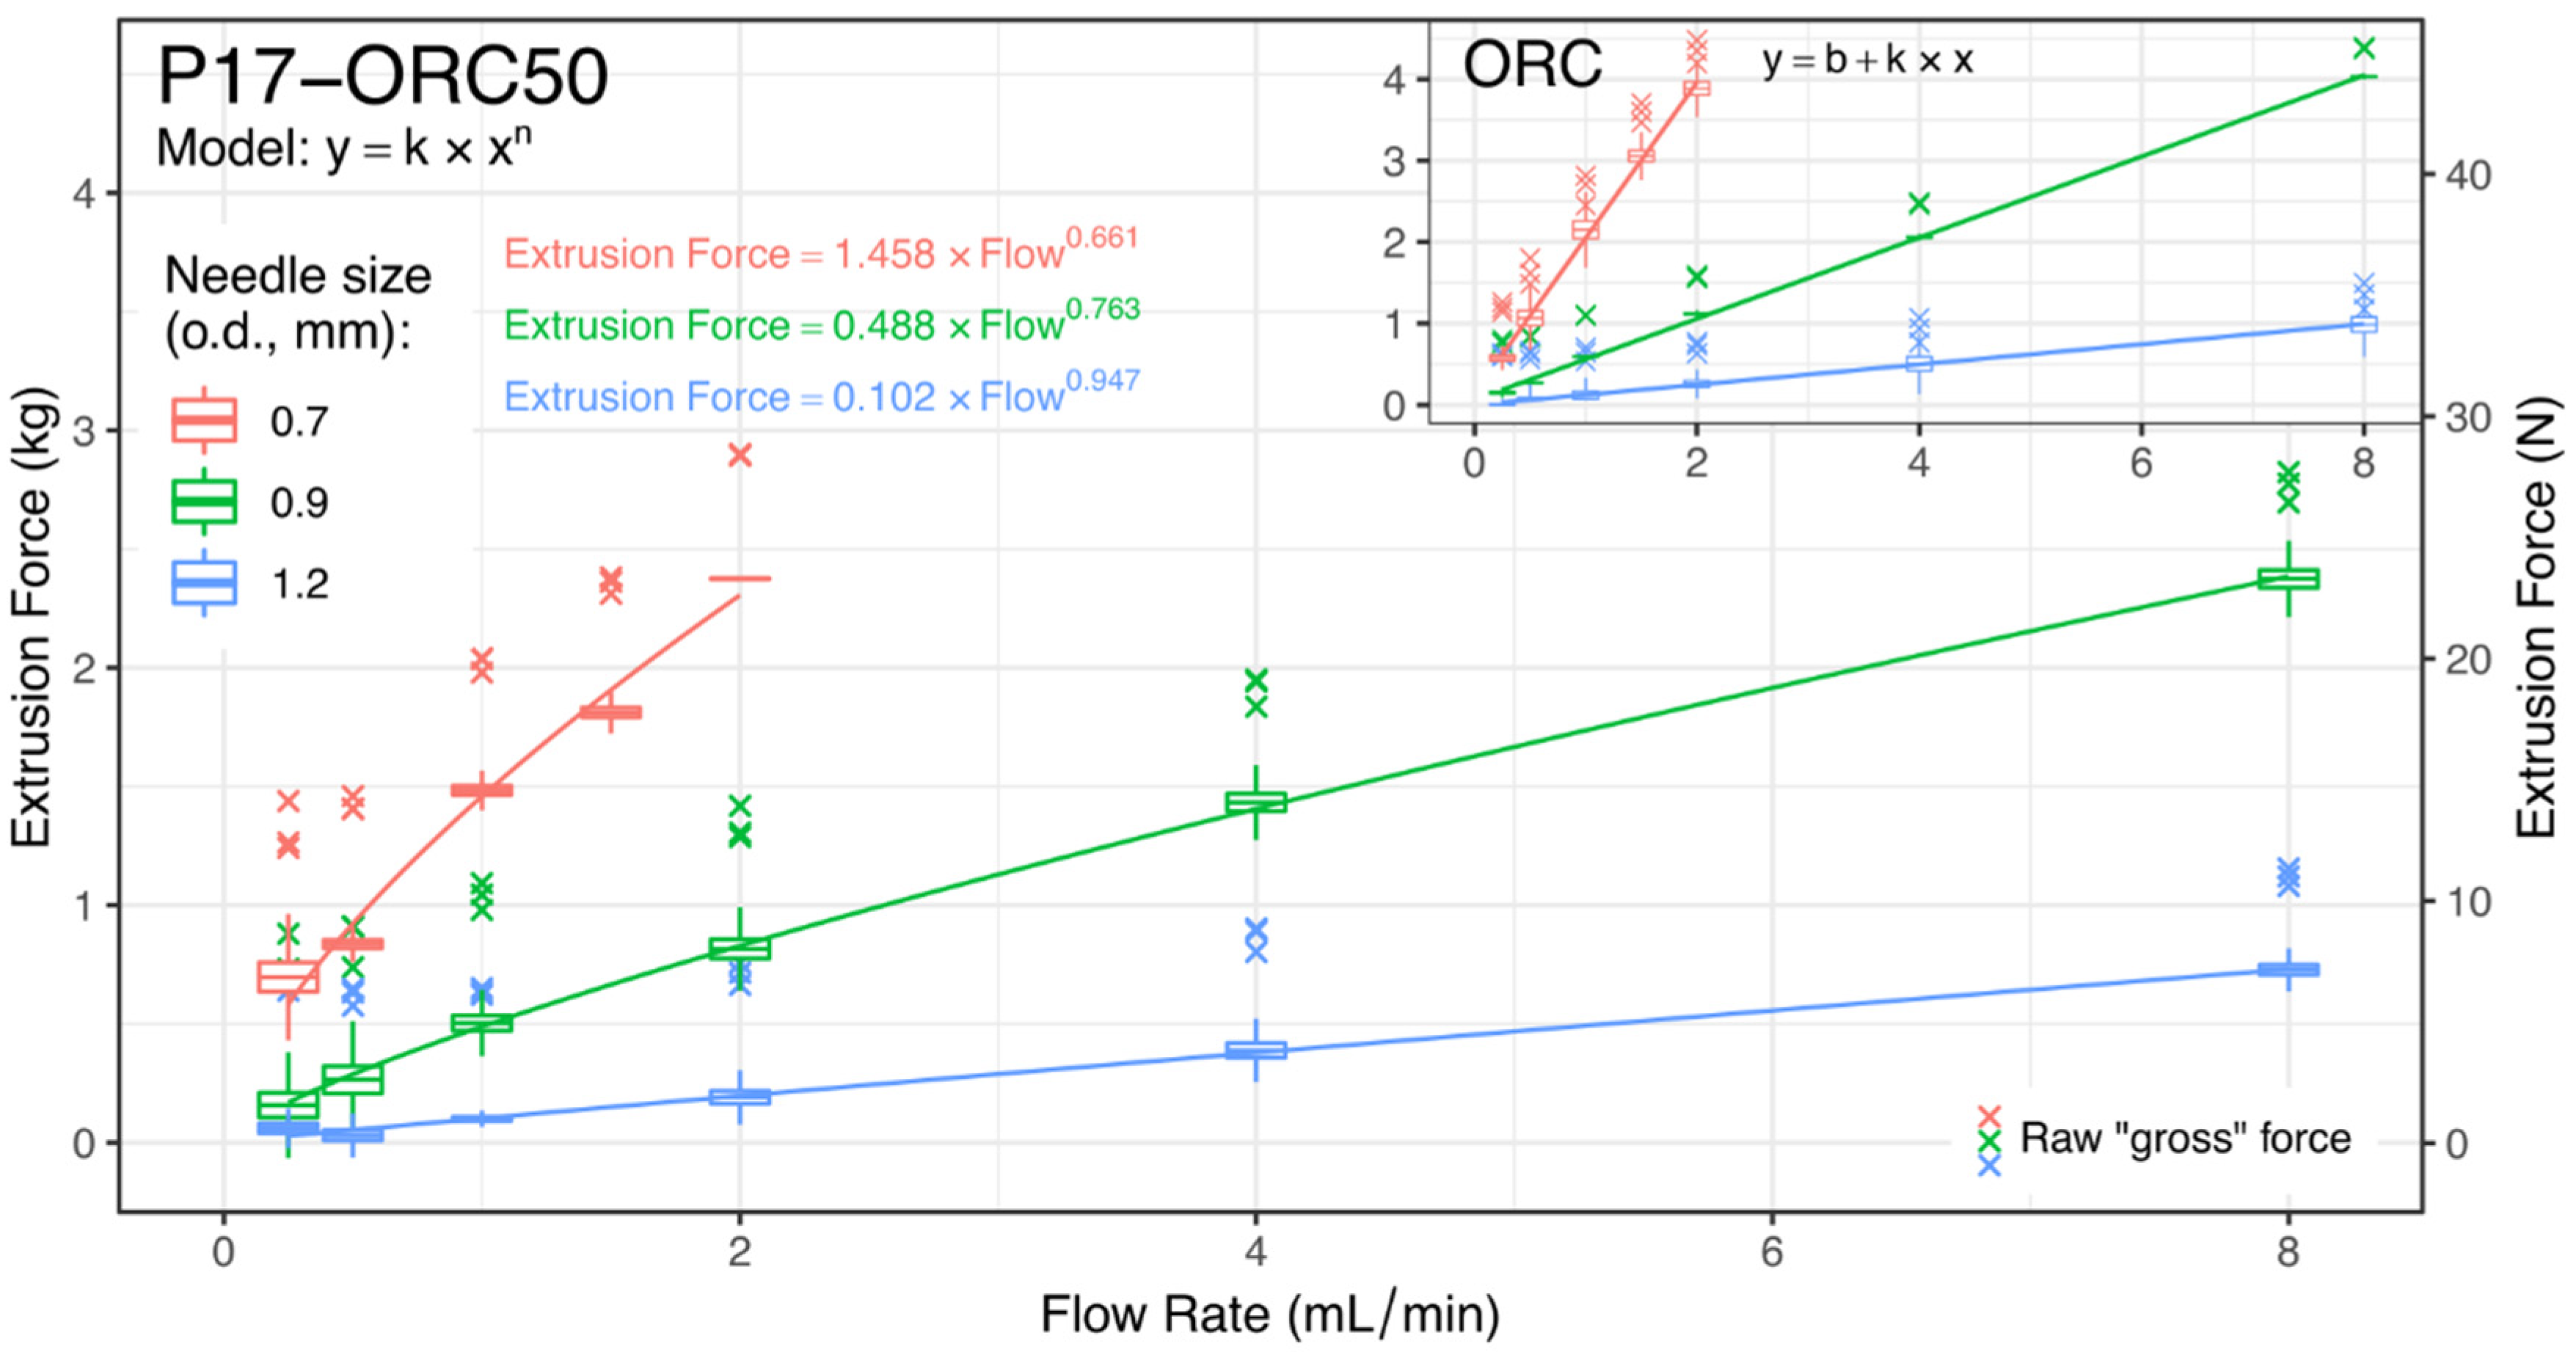
3.3. Syringeability
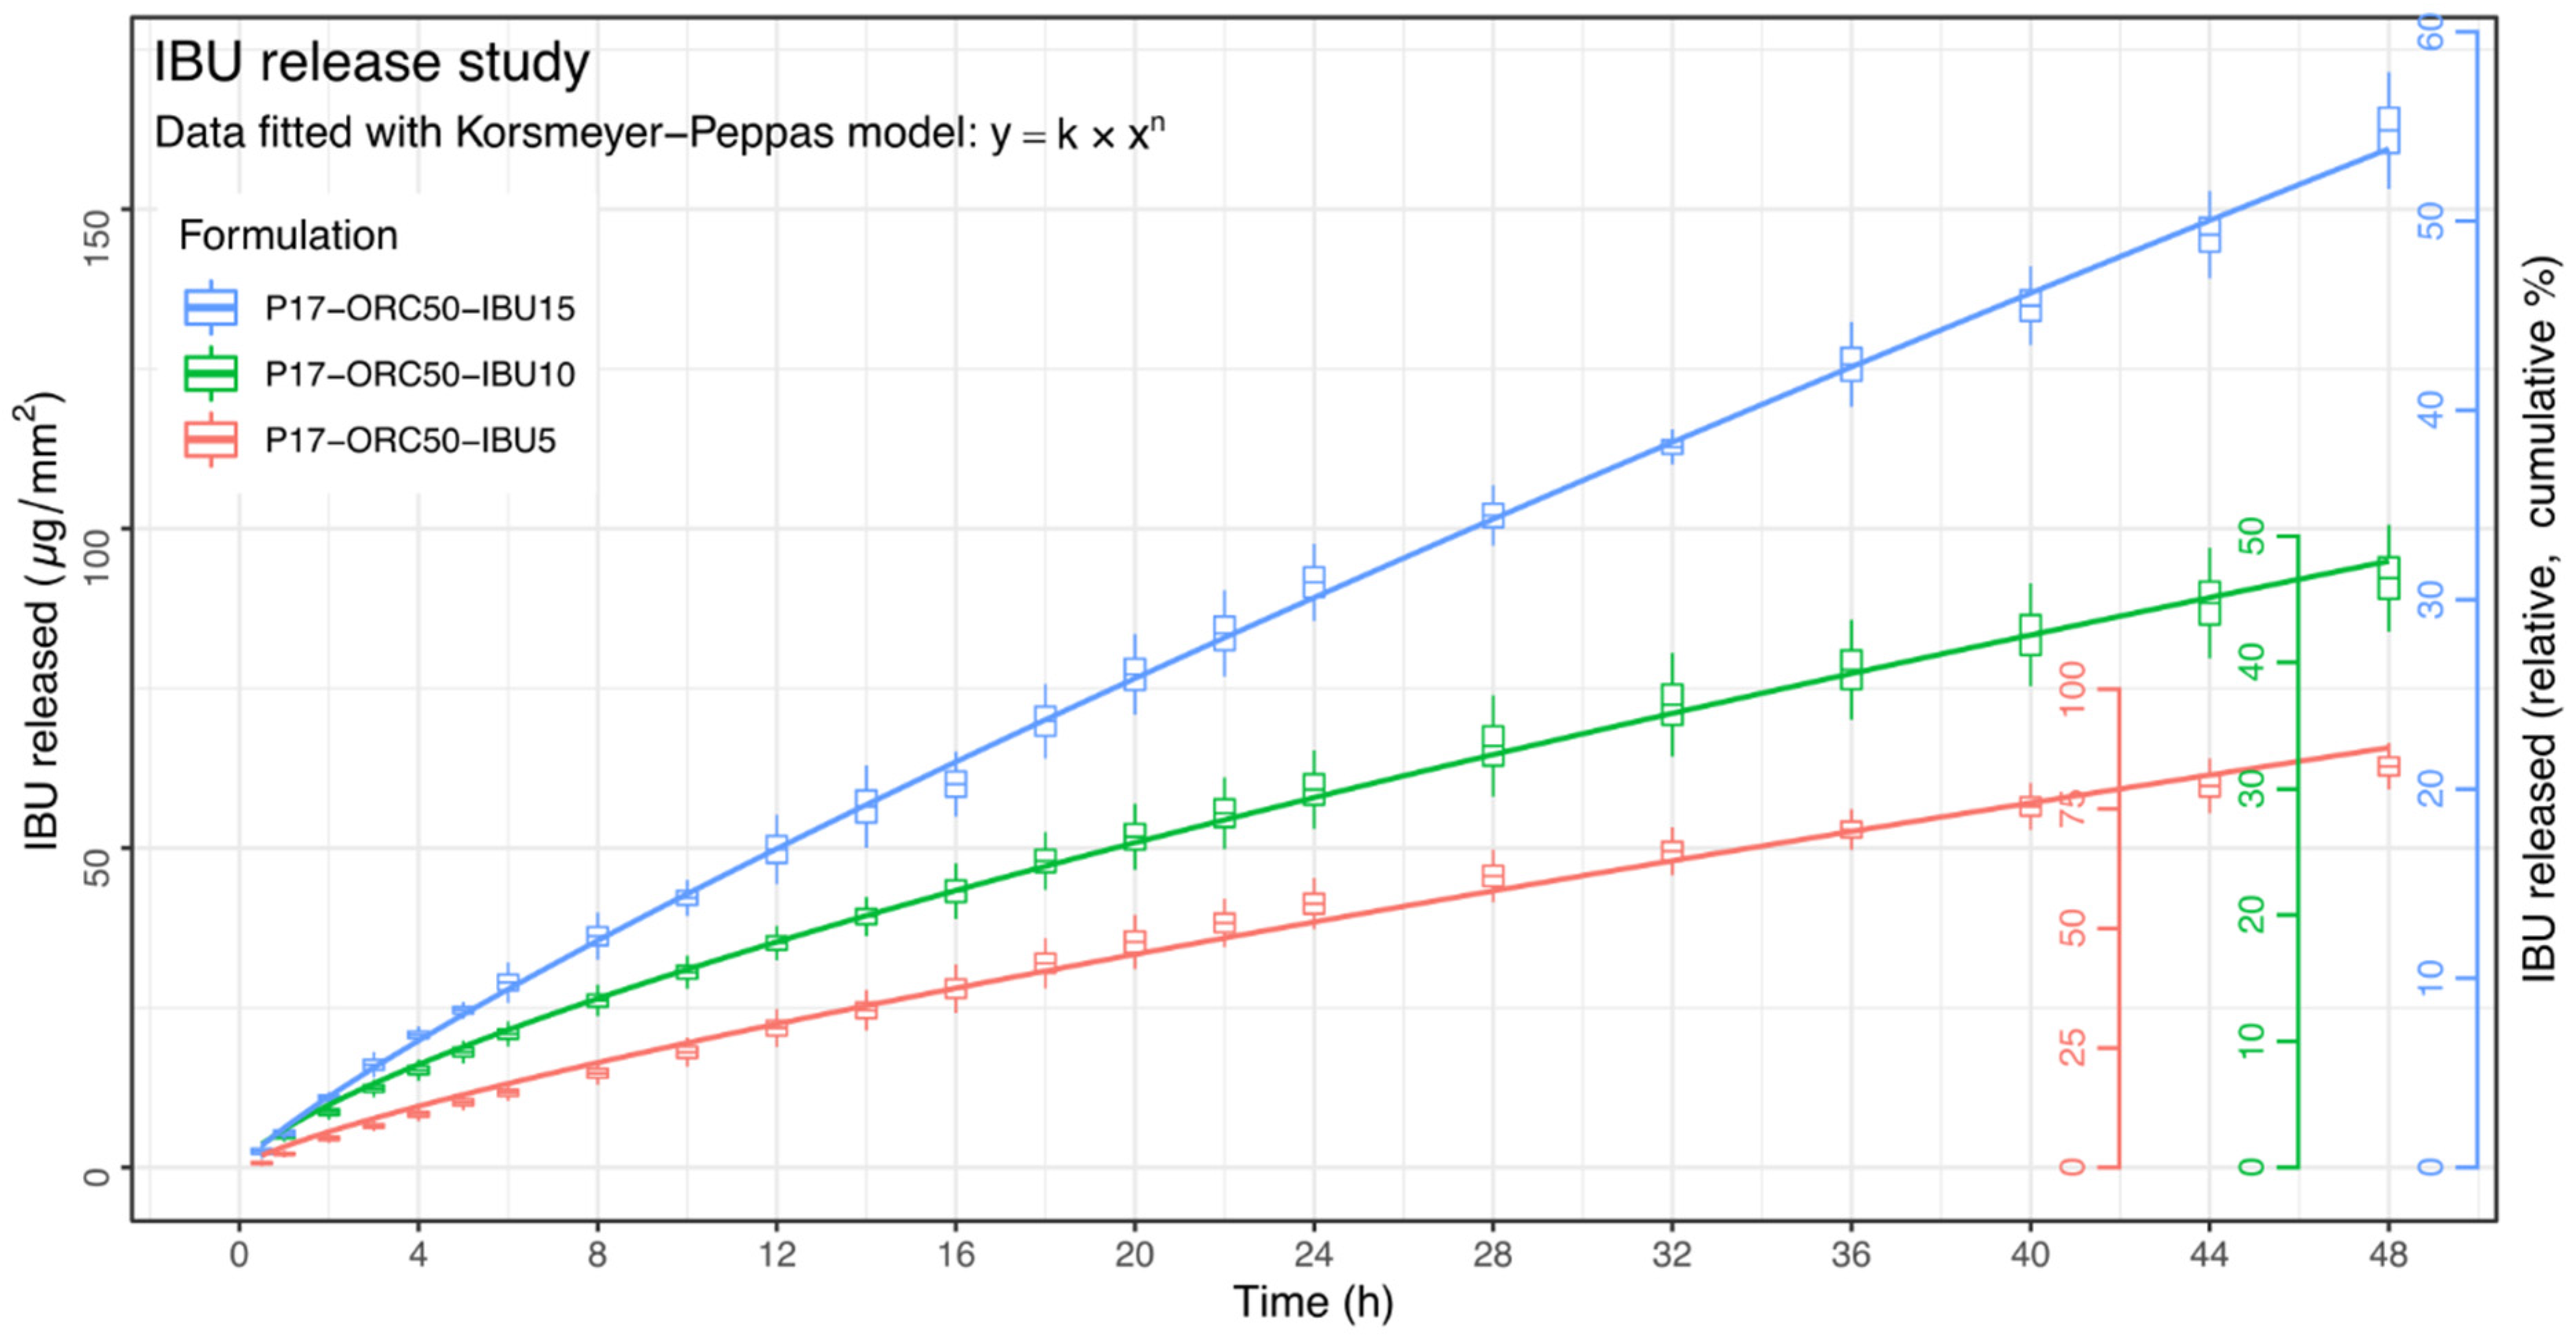
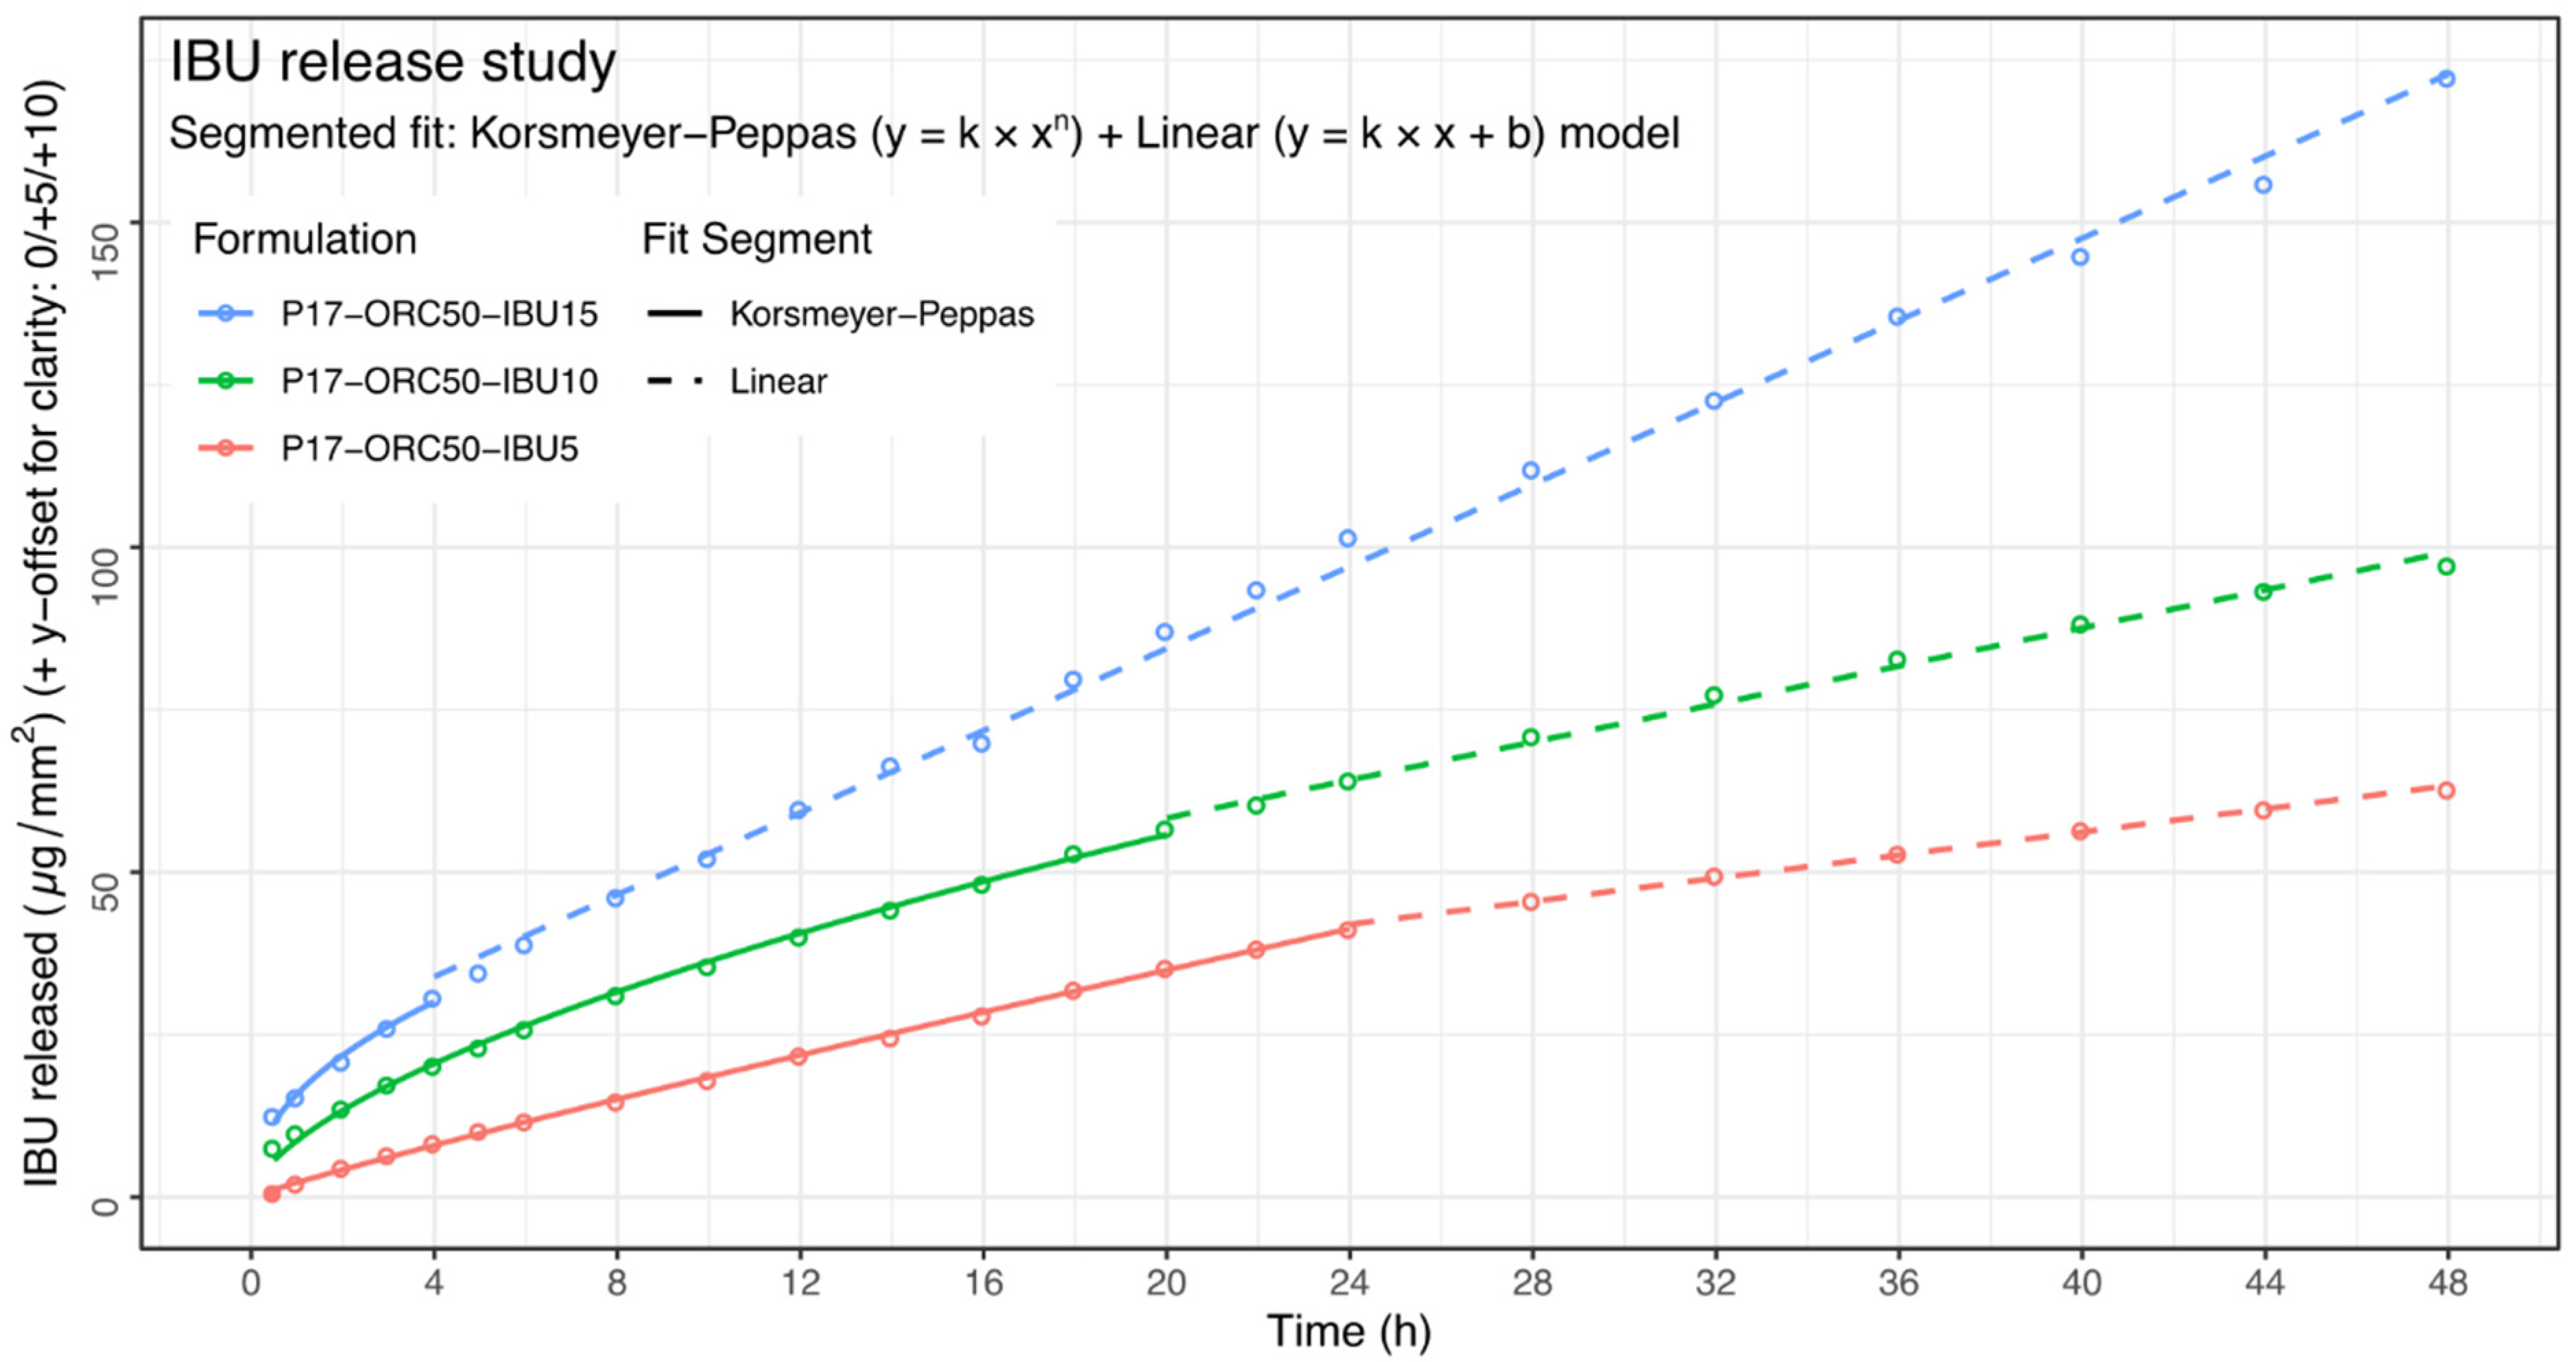
3.4. Drug Release Kinetics
4. Conclusions
Supplementary Materials
Author Contributions
Funding
Institutional Review Board Statement
Informed Consent Statement
Data Availability Statement
Conflicts of Interest
References
- Ruel-Gariépy, E.; Leroux, J.-C. In situ-forming hydrogels—Review of temperature-sensitive systems. Eur. J. Pharm. Biopharm. 2004, 58, 409–426. [Google Scholar] [CrossRef]
- Dumortier, G.; Grossiord, J.L.; Agnely, F.; Chaumeil, J.C. A Review of Poloxamer 407 Pharmaceutical and Pharmacological Characteristics. Pharm. Res. 2006, 23, 2709–2728. [Google Scholar] [CrossRef] [PubMed]
- Giuliano, E.; Paolino, D.; Fresta, M.; Cosco, D. Mucosal Applications of Poloxamer 407-Based Hydrogels: An Overview. Pharmaceutics 2018, 10, 159. [Google Scholar] [CrossRef] [PubMed] [Green Version]
- Wenzel, J.G.W.; Balaji, K.S.S.; Koushik, K.; Navarre, C.; Duran, S.H.; Rahe, C.H.; Kompella, U.B. Pluronic F127 gel formulations of deslorelin and GnRH reduce drug degradation and sustain drug release and effect in cattle. J. Control. Release 2002, 85, 51–59. [Google Scholar] [CrossRef]
- Zhang, L. Development and in-vitro evaluation of sustained release Poloxamer 407 (P407) gel formulations of ceftiofur. J. Control. Release 2002, 85, 73–81. [Google Scholar] [CrossRef]
- Jansen, M.M.P.M.; Verzijl, J.M.; Burger, D.M.; Hekster, Y.A. Controlled release of morphine from a poloxamer 407 gel. Int. J. Pharm. 2013, 452, 266–269. [Google Scholar] [CrossRef]
- Romić, M.D.; Klarić, M.Š.; Lovrić, J.; Pepić, I.; Cetina-Čižmek, B.; Filipović-Grčić, J.; Hafner, A. Melatonin-loaded chitosan/Pluronic® F127 microspheres as in situ forming hydrogel: An innovative antimicrobial wound dressing. Eur. J. Pharm. Biopharm. 2016, 107, 67–79. [Google Scholar] [CrossRef]
- Pradines, B.; Djabourov, M.; Vauthier, C.; Loiseau, P.M.; Ponchel, G.; Bouchemal, K. Gelation and micellization behaviors of pluronic® F127 hydrogel containing poly (isobutylcyanoacrylate) nanoparticles specifically designed for mucosal application. Colloids Surf. B Biointerfaces 2015, 135, 669–676. [Google Scholar] [CrossRef] [PubMed]
- Delgado, B.; Carrêlo, H.; Loureiro, M.V.; Marques, A.C.; Borges, J.P.; Cidade, M.T. Injectable hydrogels with two different rates of drug release based on pluronic/water system filled with poly(ε-caprolactone) microcapsules. J. Mater. Sci. 2021, 56, 13416–13428. [Google Scholar] [CrossRef]
- Feng, R.; Deng, P.; Zhou, F.; Feng, S.; Song, Z. Pluronic F127-cyclodextrin conjugate micelles for encapsulation of honokiol. J. Nanoparticle Res. 2018, 20, 261. [Google Scholar] [CrossRef]
- Akkari, A.C.S.; Papini, J.Z.B.; Garcia, G.K.; Franco, M.K.K.D.; Cavalcanti, L.P.; Gasperini, A.; Alkschbirs, M.I.; Yokaichyia, F.; De Paula, E.; Tófoli, G.R.; et al. Poloxamer 407/188 binary thermosensitive hydrogels as delivery systems for infiltrative local anesthesia: Physico-chemical characterization and pharmacological evaluation. Mater. Sci. Eng. C 2016, 68, 299–307. [Google Scholar] [CrossRef]
- Al Khateb, K.; Ozhmukhametova, E.K.; Mussin, M.N.; Seilkhanov, S.K.; Rakhypbekov, T.K.; Lau, W.M.; Khutoryanskiy, V.V. In situ gelling systems based on Pluronic F127/Pluronic F68 formulations for ocular drug delivery. Int. J. Pharm. 2016, 502, 70–79. [Google Scholar] [CrossRef]
- Xu, X.; Shen, Y.; Wang, W.; Sun, C.; Li, C.; Xiong, Y.; Tu, J. Preparation and in vitro characterization of thermosensitive and mucoadhesive hydrogels for nasal delivery of phenylephrine hydrochloride. Eur. J. Pharm. Biopharm. 2014, 88, 998–1004. [Google Scholar] [CrossRef]
- da Silva, J.B.; dos Santos, R.S.; da Silva, M.B.; Braga, G.; Cook, M.T.; Bruschi, M.L. Interaction between mucoadhesive cellulose derivatives and Pluronic F127: Investigation on the micelle structure and mucoadhesive performance. Mater. Sci. Eng. C 2021, 119, 111643. [Google Scholar] [CrossRef]
- Dewan, M.; Bhowmick, B.; Sarkar, G.; Rana, D.; Bain, M.K.; Bhowmik, M.; Chattopadhyay, D. Effect of methyl cellulose on gelation behavior and drug release from poloxamer based ophthalmic formulations. Int. J. Biol. Macromol. 2015, 72, 706–710. [Google Scholar] [CrossRef] [PubMed]
- Chatterjee, S.; Hui, P.C.; Kan, C.; Wang, W. Dual-responsive (pH/temperature) Pluronic F-127 hydrogel drug delivery system for textile-based transdermal therapy. Sci. Rep. 2019, 9, 11658. [Google Scholar] [CrossRef] [Green Version]
- Akash, M.S.H.; Rehman, K. Recent progress in biomedical applications of Pluronic (PF127): Pharmaceutical perspectives. J. Control. Release 2015, 209, 120–138. [Google Scholar] [CrossRef]
- Vasiljevic, D.; Djuris, J.; Jakimenko, S.; Ibric, S. Application of the fractional factorial design in multiple W/O/W emulsions. J. Dispers. Sci. Technol. 2017, 38, 1732–1737. [Google Scholar] [CrossRef]
- Marefati, A.; Pitsiladis, A.; Oscarsson, E.; Ilestam, N.; Bergenståhl, B. Encapsulation of Lactobacillus reuteri in W1/O/W2 double emulsions: Formulation, storage and in vitro gastro-intestinal digestion stability. LWT 2021, 146, 111423. [Google Scholar] [CrossRef]
- Srivastava, M.; Kohli, K.; Ali, M. Formulation development of novel in situ nanoemulgel (NEG) of ketoprofen for the treatment of periodontitis. Drug Deliv. 2016, 23, 154–166. [Google Scholar] [CrossRef]
- Rahdar, A.; Taboada, P.; Hajinezhad, M.R.; Barani, M.; Beyzaei, H. Effect of tocopherol on the properties of Pluronic F127 microemulsions: Physico-chemical characterization and in vivo toxicity. J. Mol. Liq. 2019, 277, 624–630. [Google Scholar] [CrossRef]
- Froelich, A.; Osmałek, T.; Kunstman, P.; Jadach, B.; Brzostowska, M.; Białas, W. Design and study of poloxamer-based microemulsion gels with naproxen. Colloids Surf. A Physicochem. Eng. Asp. 2019, 562, 101–112. [Google Scholar] [CrossRef]
- Zhang, M.; Yang, B.; Liu, W.; Li, S. Influence of hydroxypropyl methylcellulose, methylcellulose, gelatin, poloxamer 407 and poloxamer 188 on the formation and stability of soybean oil-in-water emulsions. Asian J. Pharm. Sci. 2017, 12, 521–531. [Google Scholar] [CrossRef] [PubMed]
- Lucia, A.; Toloza, A.C.; Fanucce, M.; Fernández-Peña, L.; Ortega, F.; Rubio, R.G.; Coviella, C.; Guzmán, E. Nanoemulsions based on thymol-eugenol mixtures: Characterization, stability and larvicidal activity against aedes aegypti. Bull. Insectol. 2020, 73, 153–160. [Google Scholar]
- Hamed, R.; Al-Adhami, Y.; Abu-Huwaij, R. Concentration of a microemulsion influences the mechanical properties of ibuprofen in situ microgels. Int. J. Pharm. 2019, 570, 118684. [Google Scholar] [CrossRef] [PubMed]
- Constantino-González, K.S.; Serrano-Castañeda, P.; Guadarrama-Escobar, O.R.; López-Cervantes, M.; Domínguez-Delgado, C.L.; Escobar-Chávez, J.J. Development and Characterization of Amikacin Loaded Emulgel for the Treatment of Mycetoma. Pharm. Chem. J. 2021, 54, 1024–1032. [Google Scholar] [CrossRef]
- Chang, W.-C.; Hu, Y.-T.; Huang, Q.; Hsieh, S.-C.; Ting, Y. Development of a topical applied functional food formulation: Adlay bran oil nanoemulgel. LWT 2020, 117, 108619. [Google Scholar] [CrossRef]
- Ivanova, N.; Stefanova, T.; Iliev, I.; Stoyanov, G.S.; Bratoeva, K. Kinetic modeling on amide hydrolysis, drug release and mucosal permeation of indomethacin in the composition of selected semisolid vehicles. J. IMAB Annu. Proc. Sci. Pap. 2018, 24, 2303–2312. [Google Scholar] [CrossRef] [Green Version]
- Khalil, E.; Schaefer, U.F.; Sallam, A. Release characteristics of diclofenac diethylamine from emulgels containing Pluronic F127. J. Drug Deliv. Sci. Technol. 2006, 16, 381–387. [Google Scholar] [CrossRef]
- Zhang, W.; Zhu, D.; Qin, Y.; Ou, W.; Bao, Y.; Song, L.; Zhang, Q. Effects of compositions on the stability of polyols-in-oil-in-water (P/O/W) multiple emulsions. J. Dispers. Sci. Technol. 2018, 39, 1344–1351. [Google Scholar] [CrossRef]
- Ge, L.; Li, J.; Zhong, S.; Sun, Y.; Friberg, S.E.; Guo, R. Single, Janus, and Cerberus emulsions from the vibrational emulsification of oils with significant mutual solubility. Soft Matter 2017, 13, 1012–1019. [Google Scholar] [CrossRef]
- Täuber, A.; Müller-Goymann, C.C. In vitro permeation and penetration of ciclopirox olamine from poloxamer 407-based formulations—Comparison of isolated human stratum corneum, bovine hoof plates and keratin films. Int. J. Pharm. 2015, 489, 73–82. [Google Scholar] [CrossRef] [PubMed]
- Slomkowski, S.; Alemán, J.V.; Gilbert, R.G.; Hess, M.; Horie, K.; Jones, R.G.; Kubisa, P.; Meisel, I.; Mormann, W.; Penczek, S.; et al. Terminology of polymers and polymerization processes in dispersed systems (IUPAC Recommendations 2011). Pure Appl. Chem. 2011, 83, 2229–2259. [Google Scholar] [CrossRef] [Green Version]
- Kracht, T.; Müller-Goymann, C.C. Antifungal efficacy of liquid poloxamer 407-based emulsions loaded with sertaconazole nitrate. Int. J. Pharm. 2020, 585, 119400. [Google Scholar] [CrossRef] [PubMed]
- De Souza Ferreira, S.B.; Bruschi, M.L. Investigation of the physicochemical stability of emulgels composed of poloxamer 407 and different oil phases using the Quality by Design approach. J. Mol. Liq. 2021, 332, 115856. [Google Scholar] [CrossRef]
- De Souza Ferreira, S.B.; Slowik, K.M.; de Castro Hoshino, L.V.; Baesso, M.L.; Murdoch, C.; Colley, H.E.; Bruschi, M.L. Mucoadhesive emulgel systems containing curcumin for oral squamous cell carcinoma treatment: From pre-formulation to cytotoxicity in tissue-engineering oral mucosa. Eur. J. Pharm. Sci. 2020, 151, 105372. [Google Scholar] [CrossRef]
- Campanholi, K.D.S.S.; da Silva, J.B.; Batistela, V.R.; Gonçalves, R.S.; Said dos Santos, R.; Balbinot, R.B.; Lazarin-Bidóia, D.; Bruschi, M.L.; Nakamura, T.U.; Nakamura, C.V.; et al. Design and optimization of stimuli-responsive emulsion-filled gel for topical delivery of copaiba oil-resin. J. Pharm. Sci. 2021, in press. [Google Scholar] [CrossRef]
- Viljoen, J.M.; Cowley, A.; du Preez, J.; Gerber, M.; du Plessis, J. Penetration enhancing effects of selected natural oils utilized in topical dosage forms. Drug Dev. Ind. Pharm. 2015, 41, 2045–2054. [Google Scholar] [CrossRef]
- Mittal, A.; Sara, U.V.S.; Ali, A.; Aqil, M. The effect of penetration enhancers on permeation kinetics of nitrendipine in two different skin models. Biol. Pharm. Bull. 2008, 31, 1766–1772. [Google Scholar] [CrossRef] [PubMed] [Green Version]
- Schmolka, I.R. Artificial skin I. Preparation and properties of pluronic F-127 gels for treatment of burns. J. Biomed. Mater. Res. 1972, 6, 571–582. [Google Scholar] [CrossRef] [PubMed]
- Bodratti, A.; Alexandridis, P. Formulation of Poloxamers for Drug Delivery. J. Funct. Biomater. 2018, 9, 11. [Google Scholar] [CrossRef] [PubMed] [Green Version]
- ASTM International. Standard Test Methods for Rheological Properties of Non-Newtonian Materials by Rotational Viscometer; ASTM D2196-15; ASTM International: West Conshohocken, PA, USA, 2015. [Google Scholar] [CrossRef]
- Guan, X.; Huang, Y.; Gao, J.; Ou, J. Research on the Evaluation Methods of Thixotropy of MR Fluid. Pac. Sci. Rev. 2009, 11, 157–163. [Google Scholar]
- Kwon, K.W.; Park, M.J.; Hwang, J.; Char, K. Effects of Alcohol Addition on Gelation in Aqueous Solution of PEO-PPO-PEO Triblock Copolymer. Polym. J. 2001, 33, 404–410. [Google Scholar] [CrossRef] [Green Version]
- Xie, Y.; Tang, J.; Lu, Z.; Sun, Z.; An, L. Effects of Poly(Propylene Oxide)–Poly(Ethylene Oxide)–Poly(Propylene Oxide) Triblock Copolymer on the Gelation of Poly(Ethylene Oxide)–Poly(Propylene Oxide)–Poly(Ethylene Oxide) Aqueous Solutions. J. Macromol. Sci. Part B 2013, 52, 1183–1197. [Google Scholar] [CrossRef]
- Chaibundit, C.; Ricardo, N.M.; Ricardo, N.M.; Muryn, C.A.; Madec, M.-B.; Yeates, S.G.; Booth, C. Effect of ethanol on the gelation of aqueous solutions of Pluronic F127. J. Colloid Interface Sci. 2010, 351, 190–196. [Google Scholar] [CrossRef]
- Cilurzo, F.; Selmin, F.; Minghetti, P.; Adami, M.; Bertoni, E.; Lauria, S.; Montanari, L. Injectability Evaluation: An Open Issue. AAPS PharmSciTech 2011, 12, 604–609. [Google Scholar] [CrossRef] [PubMed]
- Burckbuchler, V.; Mekhloufi, G.; Giteau, A.P.; Grossiord, J.L.; Huille, S.; Agnely, F. Rheological and syringeability properties of highly concentrated human polyclonal immunoglobulin solutions. Eur. J. Pharm. Biopharm. 2010, 76, 351–356. [Google Scholar] [CrossRef]
- Hanson Research Corporation. Immersion Cell User Guide; Hanson Research Corporation: Chatsworth, CA, USA, 2012. [Google Scholar]
- 〈1724〉 Semisolid Drug Products—Performance Tests. In United States Pharmacopeia and National Formulary (USP 37–NF 32); United States Pharmacopeial Convention: North Bethesda, MD, USA, 2014; pp. 1273–1284.
- European Directorate for the Quality of Medicines. Recommendations on dissolution testing. In European Pharmacopoeia 10.0; Council of Europe: Strasbourg, France, 2020; Volume 10, pp. 801–803. [Google Scholar]
- Committee for Medicinal Products for Human Use. Draft Guideline on Quality and Equivalence of Topical Products (CHMP/QWP/708282/2018); European Medicines Agency: London, UK, 2018; pp. 25–27. [Google Scholar]
- Tadros, T.F. Emulsion Formation, Stability, and Rheology. In Emulsion Formation and Stability; Tadros, T.F., Ed.; Wiley-VCH Verlag GmbH & Co. KGaA: Weinheim, Germany, 2013; pp. 35–40. [Google Scholar]
- Artzner, F.; Geiger, S.; Olivier, A.; Allais, C.; Finet, S.; Agnely, F. Interactions between Poloxamers in Aqueous Solutions: Micellization and Gelation Studied by Differential Scanning Calorimetry, Small Angle X-ray Scattering, and Rheology. Langmuir 2007, 23, 5085–5092. [Google Scholar] [CrossRef]
- Hopkins, C.C.; de Bruyn, J.R. Gelation and long-time relaxation of aqueous solutions of Pluronic F127. J. Rheol. 2019, 63, 191–201. [Google Scholar] [CrossRef]
- Barnes, H.A. Chapter 15. The flow of suspensions. In A Handbook of Elementary Rheology; Institute of Non-Newtonian Fluid Mechanics, University of Wales: Aberystwyth, UK, 2000; pp. 119–139. [Google Scholar]
- Malvern Instruments Limited. A Basic Introduction to Rheology; Malvern Instruments Limited: Worcestershire, UK, 2016. [Google Scholar]
- Ricci, E.J.; Lunardi, L.O.; Nanclares, D.M.A.; Marchetti, J.M. Sustained release of lidocaine from Poloxamer 407 gels. Int. J. Pharm. 2005, 288, 235–244. [Google Scholar] [CrossRef] [PubMed]
- Ye, F.; Yaghmur, A.; Jensen, H.; Larsen, S.W.; Larsen, C.; Østergaard, J. Real-time UV imaging of drug diffusion and release from Pluronic F127 hydrogels. Eur. J. Pharm. Sci. 2011, 43, 236–243. [Google Scholar] [CrossRef]
- Cook, W. Castor Oil. In Handbook of Pharmaceutical Excipients, 6th ed.; Sheskey, P.J., Cook, W.G., Cable, C.J., Eds.; Pharmaceutical Press: London, UK, 2017; pp. 183–184. [Google Scholar]


| Formulation | Poloxamer 407 (g) | Water (g) | Oil Type | Oil Content (g) | IBU Content (g) | Initial IBU Content in Oil Phase (%) |
|---|---|---|---|---|---|---|
| P17–PAR50 | 0.85 | 4.15 | Paraffin | 5.00 | - | - |
| P17–OAR50 | 0.85 | 4.15 | Peanut Oil | 5.00 | - | - |
| P17–ORP50 | 0.85 | 4.15 | Canola Oil | 5.00 | - | - |
| P17–ORC50–IBU5 | 0.85 | 4.15 | Castor Oil | 4.75 | 0.25 | 5.0 |
| P17–ORC50–IBU10 | 0.85 | 4.15 | Castor Oil | 4.50 | 0.50 | 10.0 |
| P17–ORC50–IBU15 | 0.85 | 4.15 | Castor Oil | 4.25 | 0.75 | 15.0 |
| Formulation | v20 °C 38.4 s−1 | v25 °C 38.4 s−1 | v25 °C 0.384 s−1 | v37 °C 0.384 s−1 | PI 20 °C | PI 25 °C | PI 37 °C | Tgel | TIM-Tgel |
|---|---|---|---|---|---|---|---|---|---|
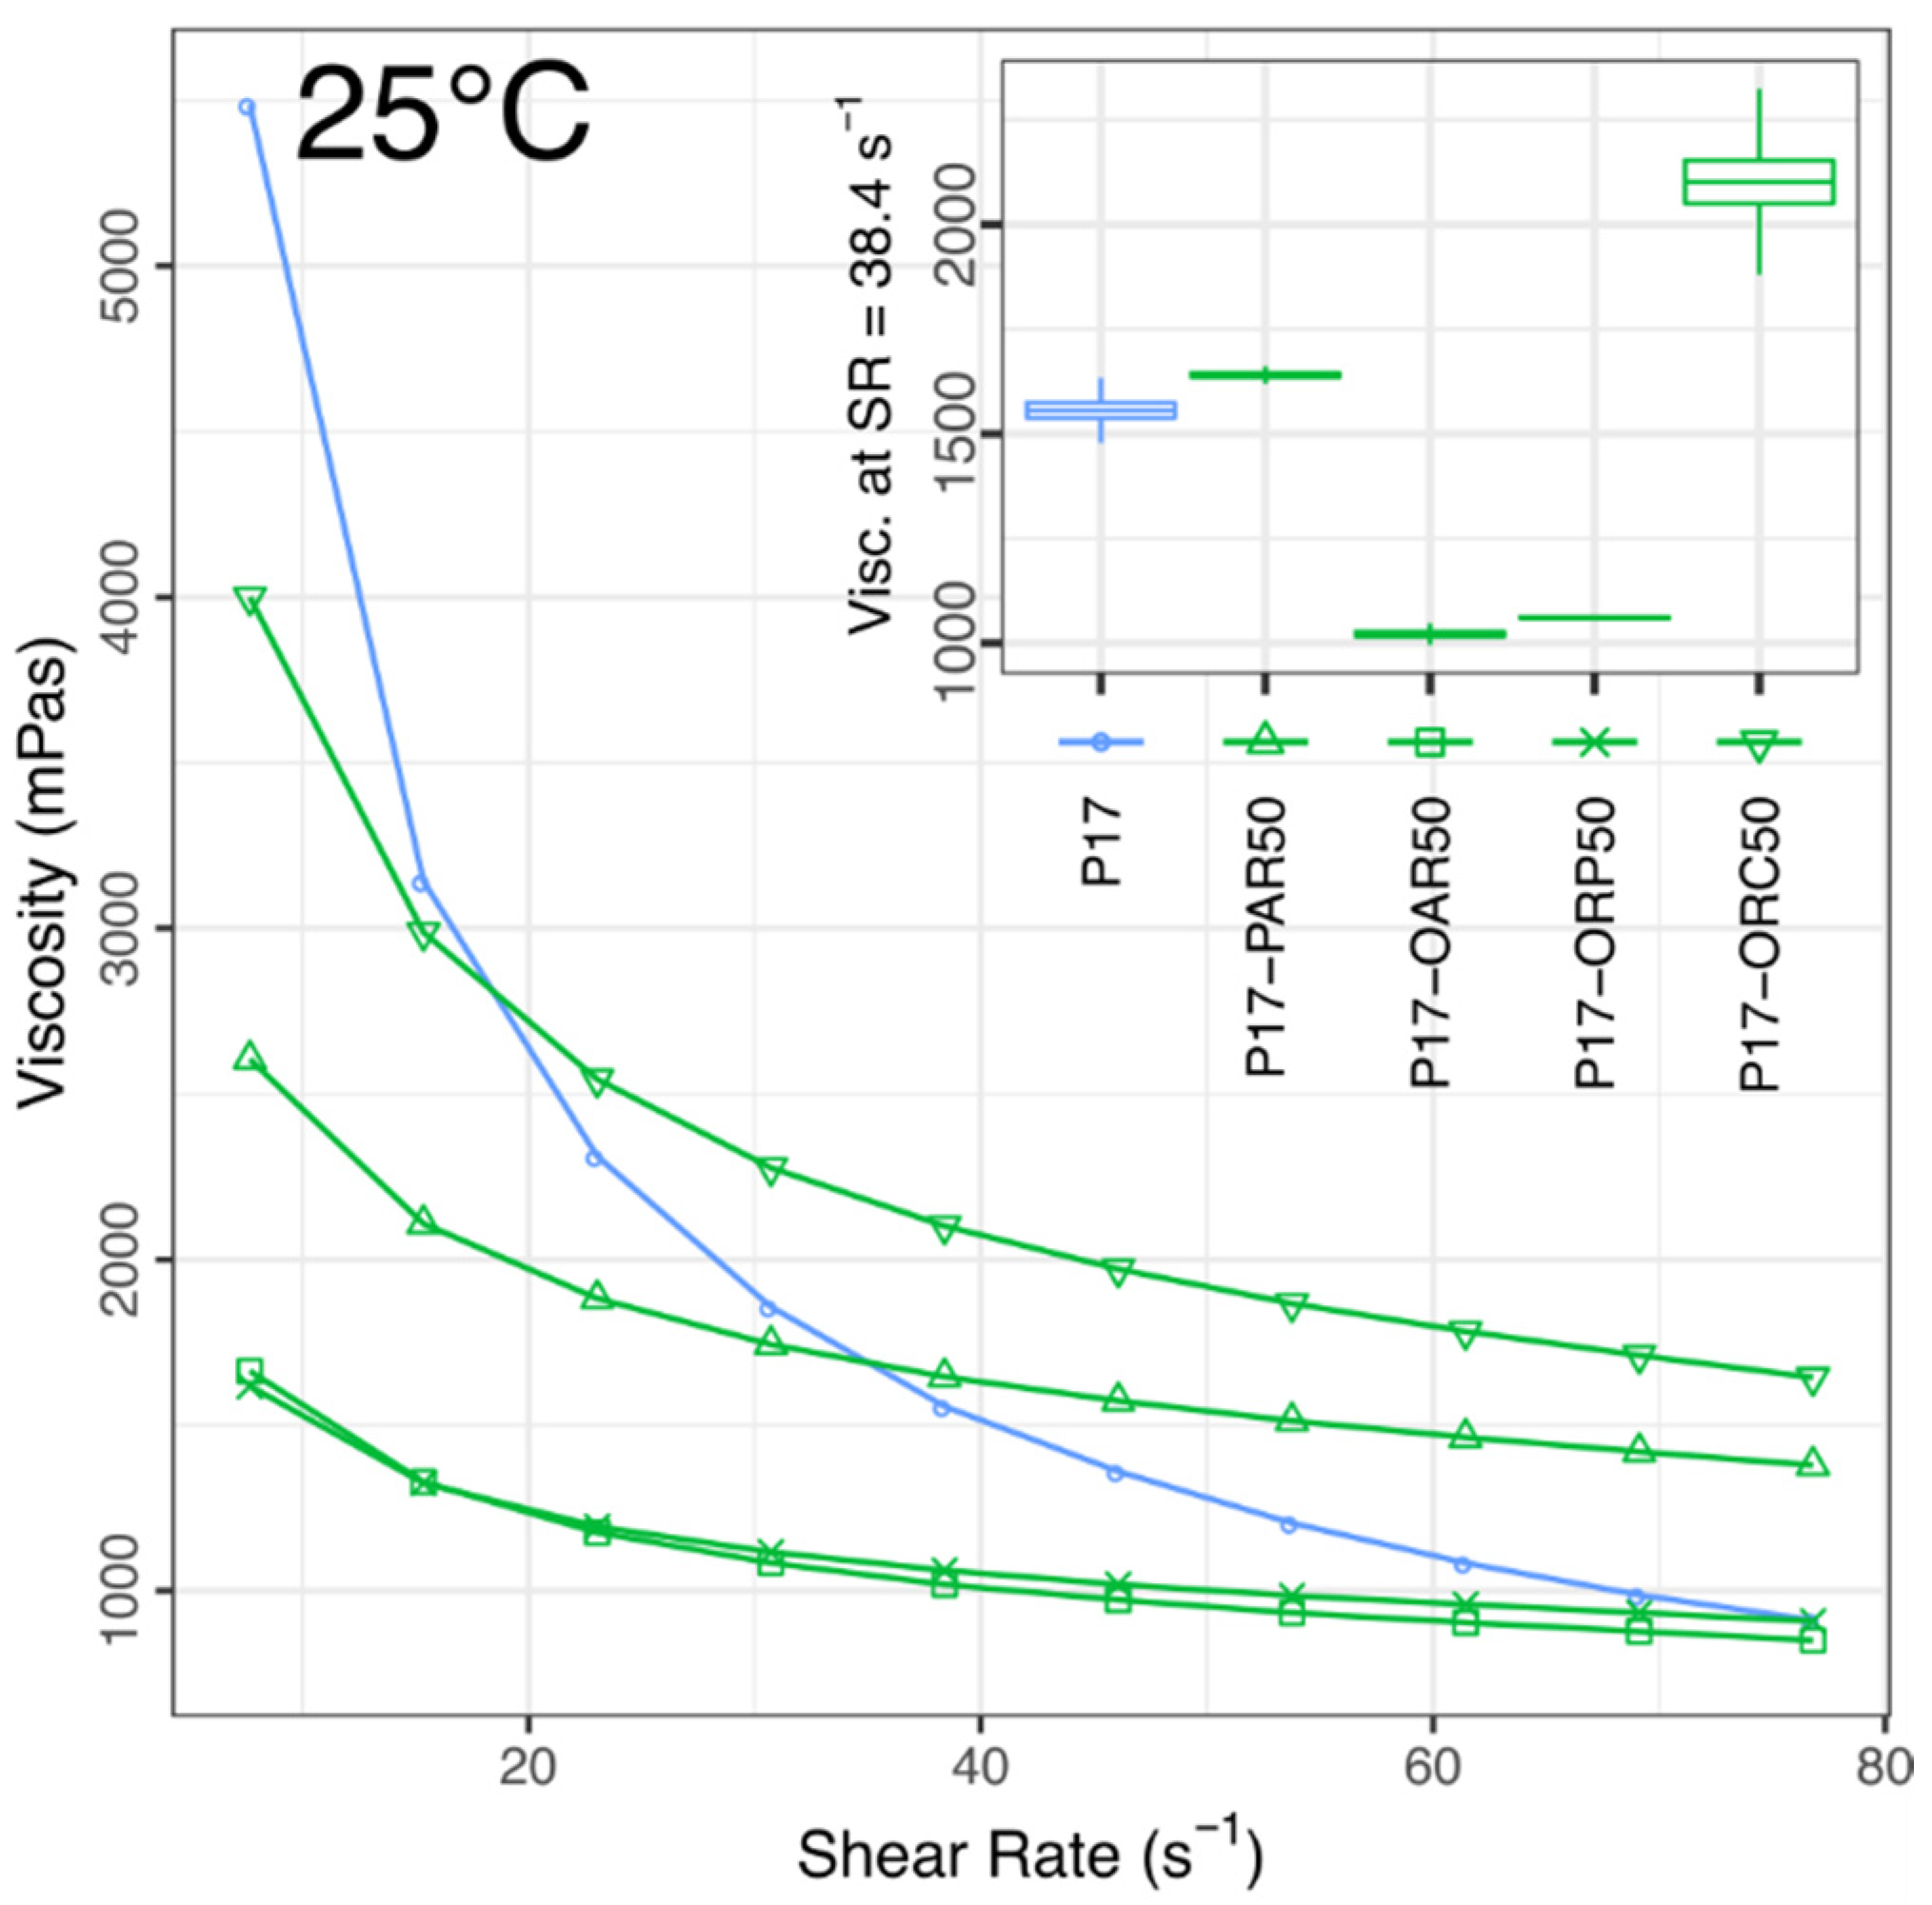
| P17 | 48.8 ± 1.3 | 1560 ± 30 | - | 359,000 ± 6000 | 0.98 ± 0.009 | 6 ± 0.3 | 8.9 ± 0.14 | 25.17 ± 0.04 | 25.5 |
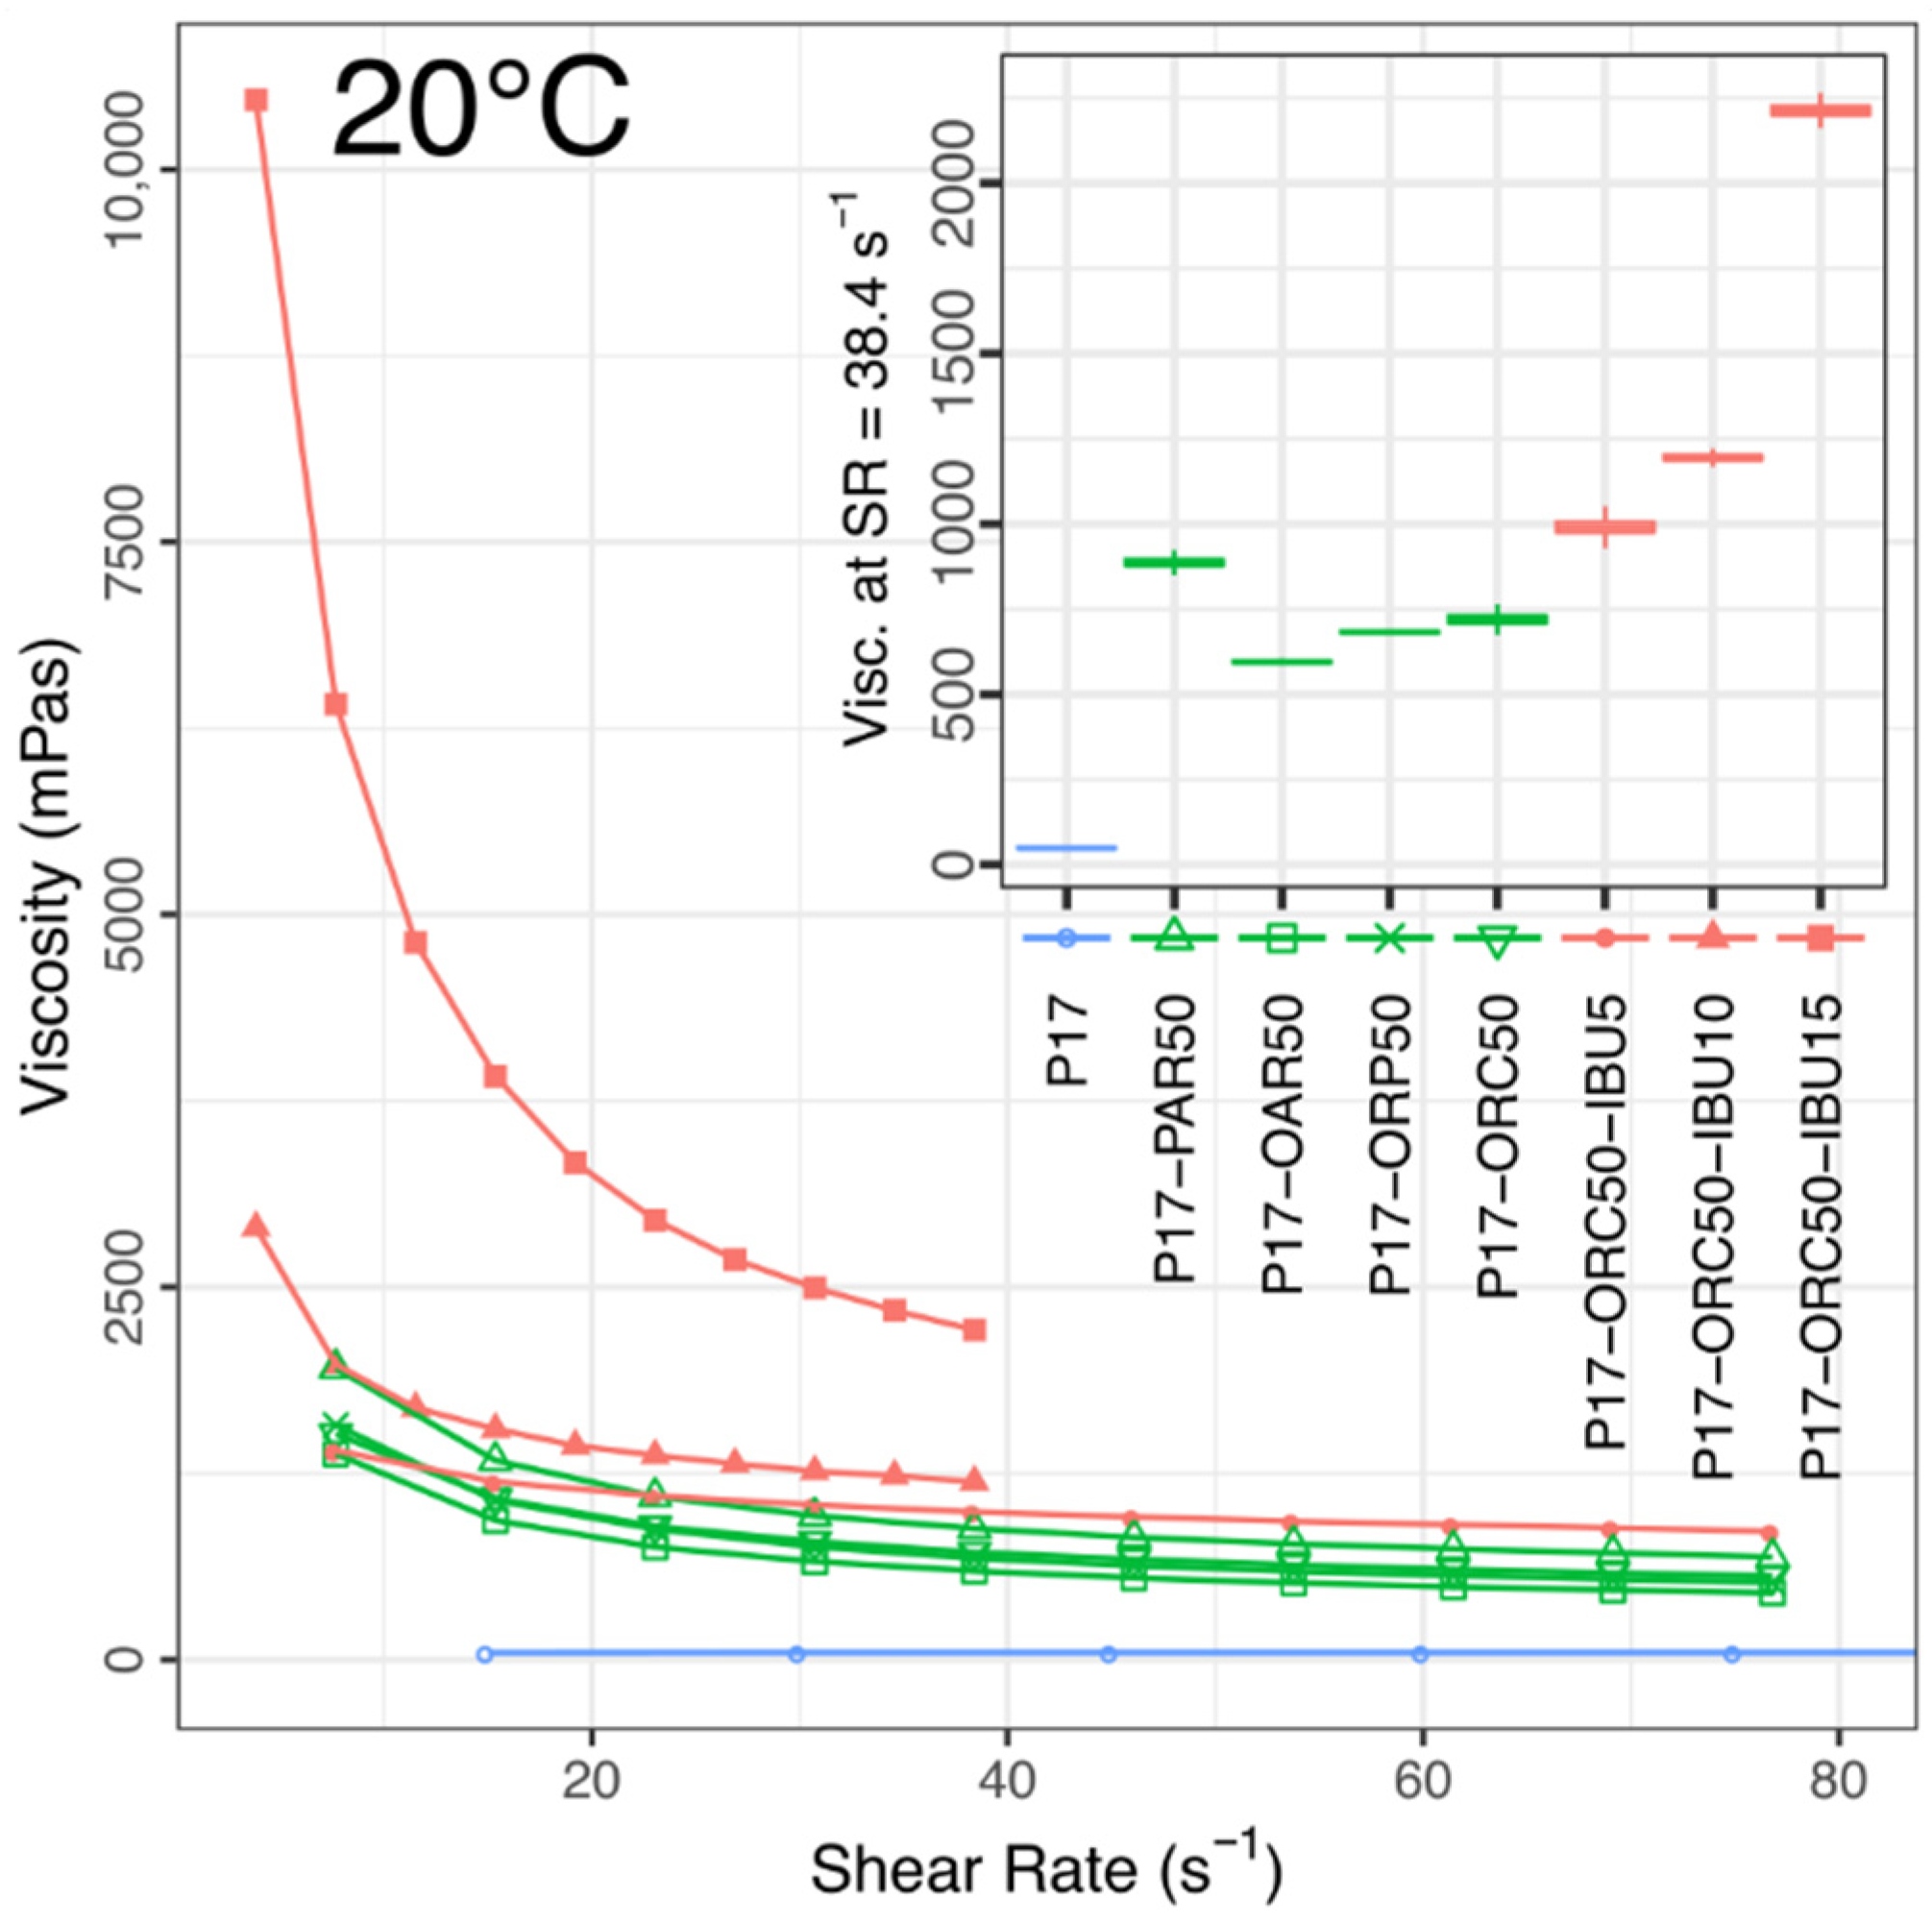
| P17–PAR50 | 886 ± 15 | 1641 ± 8 | - | 222,000 ± 5000 | 3.035 ± 0.014 | 1.879 ± 0.013 | 7.76 ± 0.06 | 29.4 ± 0.7 | 30.5 |
| P17–OAR50 | 595 ± 4 | 1022 ± 10 | - | 188,800 ± 1100 | 3.067 ± 0.013 | 1.953 ± 0.006 | 7.38 ± 0.04 | 27.9 ± 0.2 | 29.5 |
| P17–ORP50 | 679 ± 3 | 1061 ± 3 | - | 215,000 ± 4000 | 3.061 ± 0.005 | 1.794 ± 0.003 | 7.57 ± 0.08 | 29.5 ± 0.3 | 30.5 |
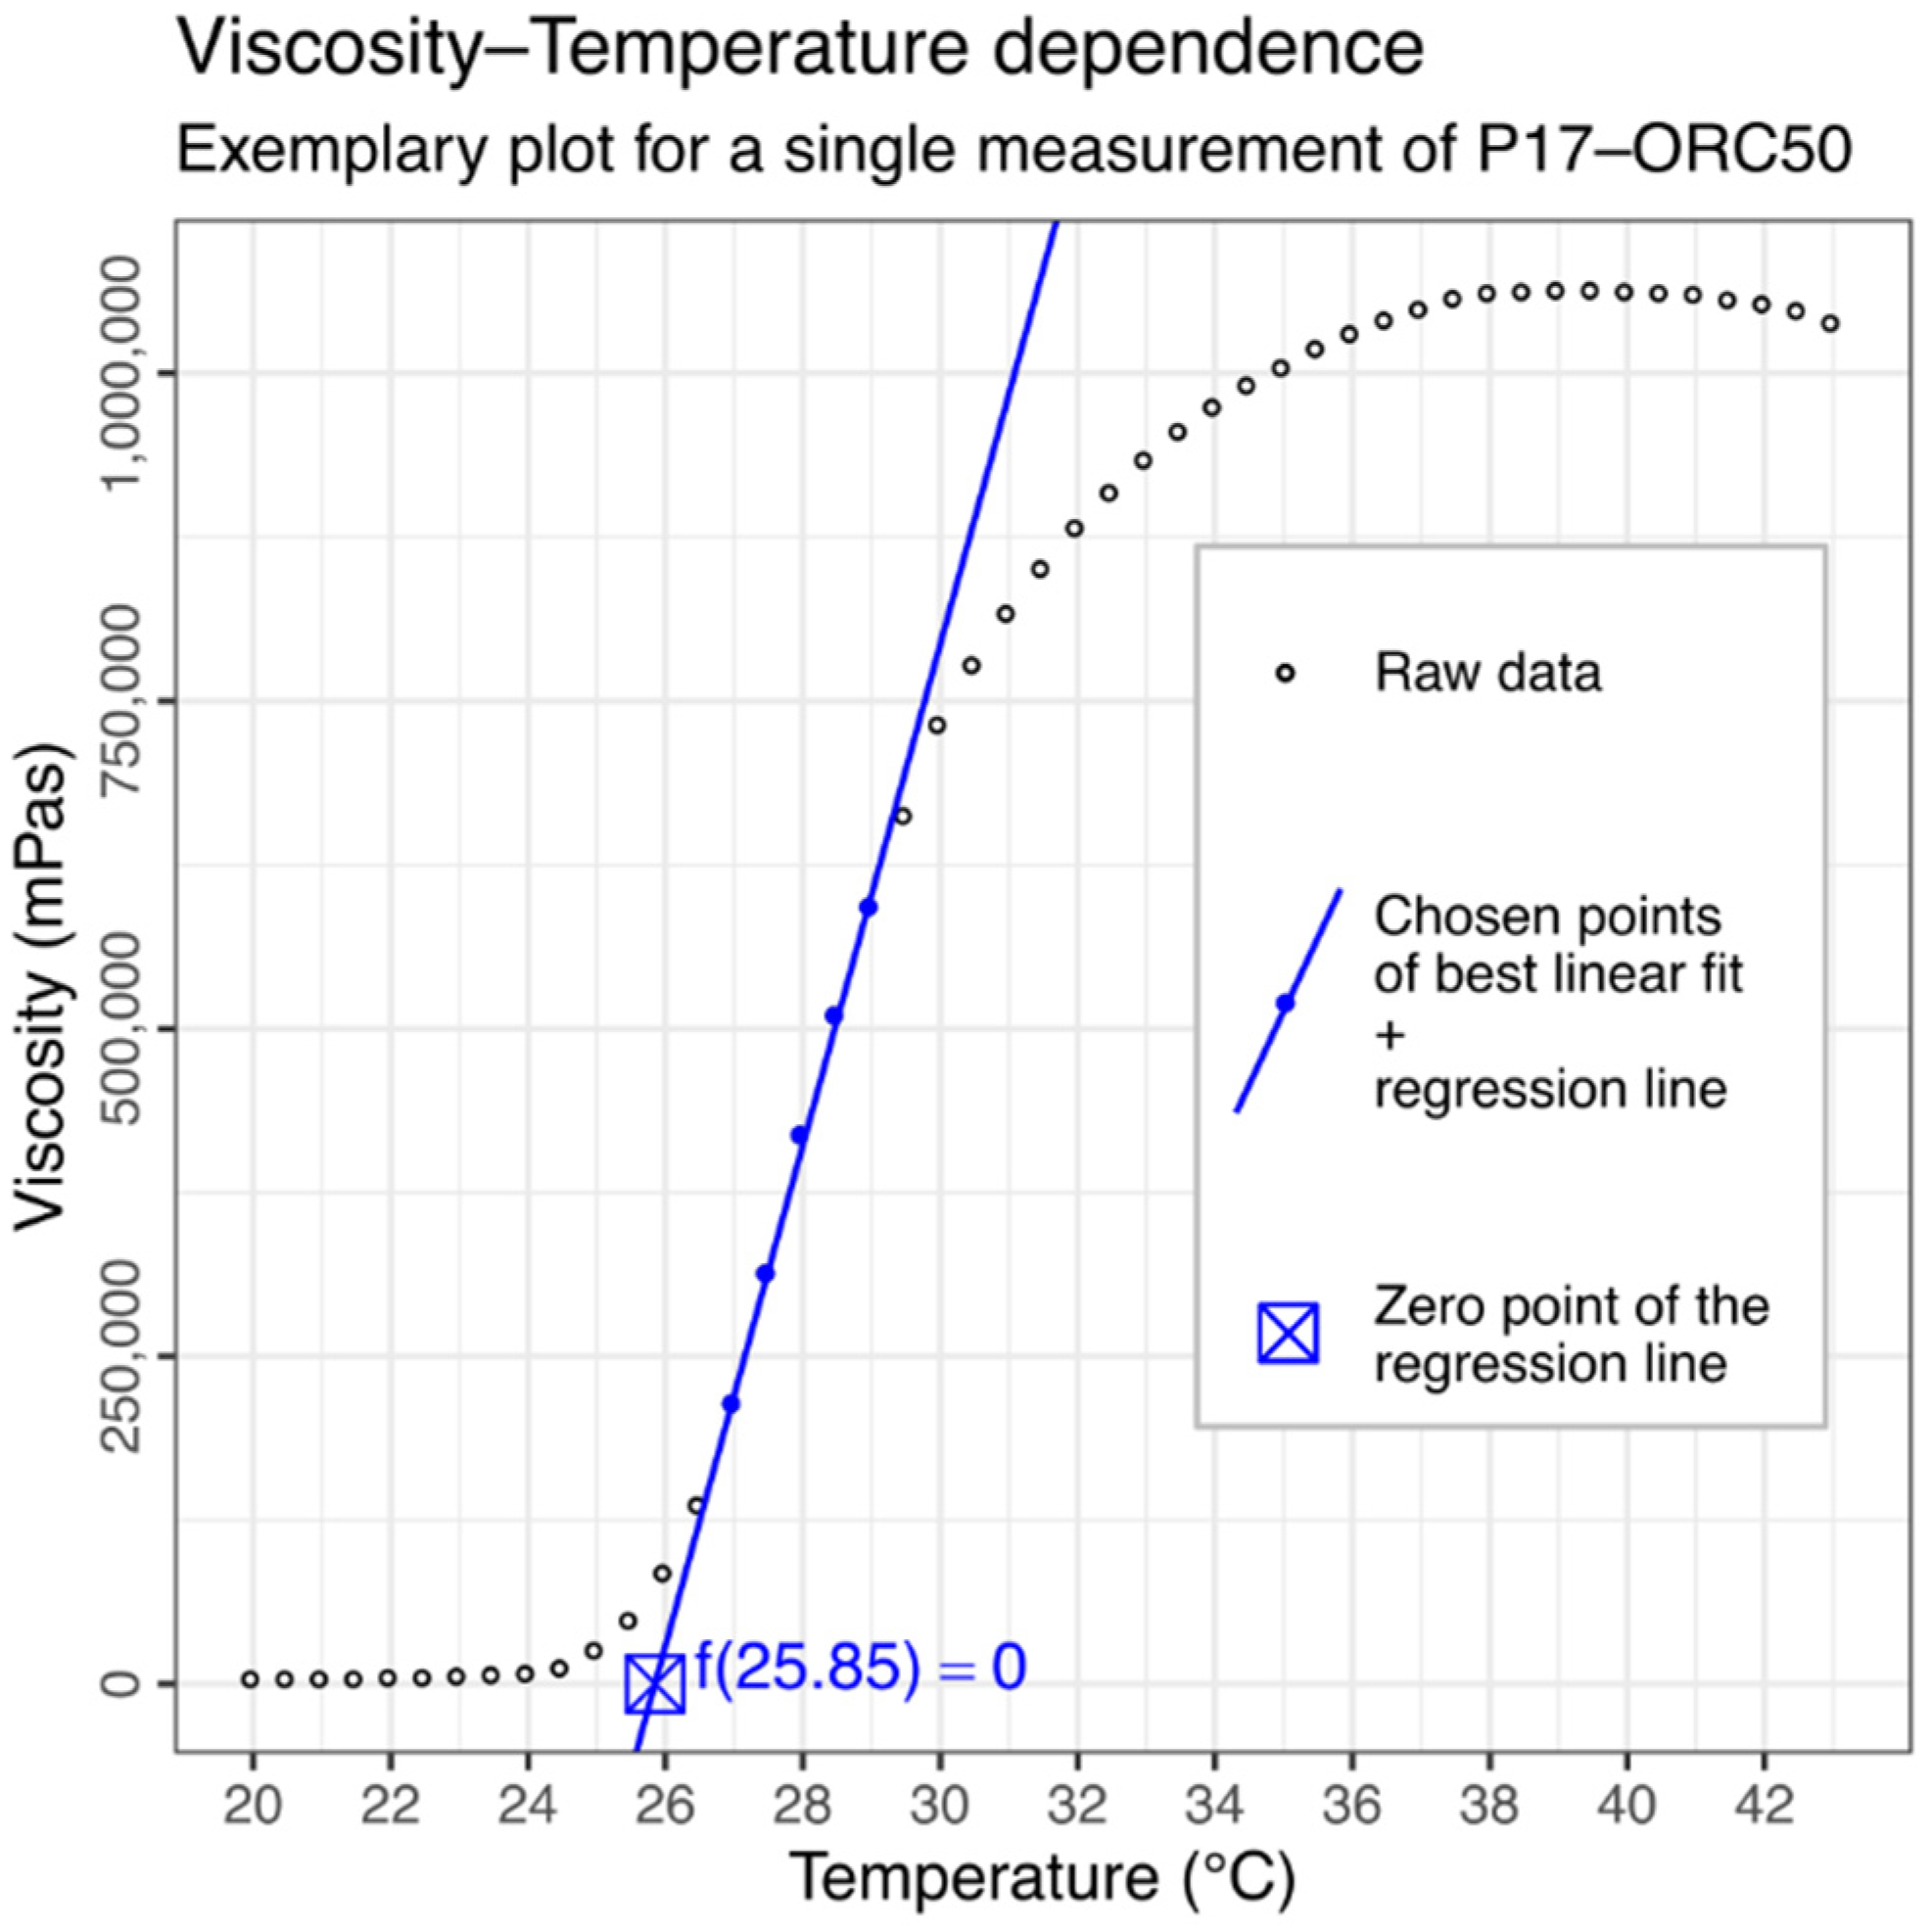
| P17–ORC50 | 720 ± 18 | 2100 ± 90 | - | 367,000 ± 6000 | 3.23 ± 0.03 | 1.923 ± 0.012 | 8.888 ± 0.006 | 25.83 ± 0.06 | 26.5 |
| P17–ORC50–IBU5 | 990 ± 20 | - | 256,000 ± 10,000 | 426,700 ± 900 | 1.941 ± 0.007 | 8.29 ± 0.05 | 9.01 ± 0.06 | 23.5 ± 0.2 | 24.0 |
| P17–ORC50–IBU10 | 1194 ± 11 | - | 291,000 ± 4000 | 430,000 ± 11,000 | 3.052 ± 0.012 | 8.61 ± 0.14 | 8.803 ± 0.019 | 21.51 ± 0.03 | 21.5 |
| P17–ORC50–IBU15 | 2210 ± 20 | - | 358,000 ± 4000 | 426,000 ± 2000 | 5.94 ± 0.03 | 7.99 ± 0.02 | 8.818 ± 0.002 | 18.98 ± 0.09 | 20.5 |
| Formulation | v20 °C (3.75–22.5 s−1) | v25 °C (3.75–33.75 s−1) | v37 °C (3.75–82.5 s−1) |
|---|---|---|---|
| ORC | 1044 ± 8 | 705 ± 5 | 299.9 ± 1.7 |
| ORC–IBU5 | 1034 ± 8 | 707 ± 3 | 296 ± 2 |
| ORC–IBU10 | 1054.7 ± 1.4 | 717 ± 4 | 306 ± 2 |
| ORC–IBU15 | 1072 ± 5 | 712 ± 4 | 302 ± 4 |
| Formulation | Needle Size (mm) (Gauge)/Flow (mL/min) | ||
|---|---|---|---|
| 0.7 (22 G)/2.0 | 0.9 (20 G)/8.0 | 1.2 (18 G)/8.0 | |
| P17–ORC50 | 2.375 ± 0.003 | 2.37 ± 0.06 | 0.73 ± 0.04 |
| (2.4 × 10⁻⁷) | (4.7 × 10⁻⁹) | (0.07) | |
| P17–ORC50–IBU5 | 2.55 ± 0.08 | 2.45 ± 0.09 | 0.75 ± 0.08 |
| (5.1 × 10⁻⁷) | (5.8 × 10⁻⁹) | (0.09) | |
| P17–ORC50–IBU10 | 2.78 ± 0.08 | 2.56 ± 0.06 | 0.88 ± 0.07 |
| (1.8 × 10⁻⁶) | (8.2 × 10⁻⁹) | (0.44) | |
| ORC | 3.89 ± 0.14 | 4.03 ± 0.016 | 0.99 ± 0.16 |
| ORC–IBU5 | 3.763 ± 0.019 | 4.19 ± 0.05 | 0.94 ± 0.03 |
| ORC–IBU10 | 4.54 ± 0.16 | 5.27 ± 0.11 | 1.024 ± 0.002 |
| Model Name + Abbreviation, If Used | Model Equation | Transformed Equation Used in Estimations |
|---|---|---|
| Zero-order kinetics | Q = k × t | % (or µg) released = k × t |
| First-order kinetics | Q = Q0 × e−kt | % released = 100 − 100 × e−kt |
| Higuchi’s model | Q = a × t1/2 | % (or µg) released = a × t1/2 |
| Hixson-Crowell model | Q1/3 = Q01/3 − k × t | % released = 100 − (1001/3 − k × t)3 |
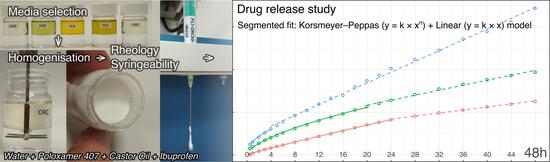
| Korsmeyer–Peppas model, K–P | Q = k × tn | % (or µg) released = k × tn |
| Simplified K–P model, t2/3 | Q = k × t2/3 | % (or µg) released = k × t2/3 |
| Formulation | RSS (Residual Sum of Squares) in Each Model | |||||
|---|---|---|---|---|---|---|
| Zero Order Kinetics | First Order Kinetics | Higuchi | Hixson–Crowell | Korsmeyer–Peppas | Simplified K–P Model | |
| P17–ORC50–IBU5 | 745.0 | 282.8 | 1549.6 | 46.7 | 117.1 | 305.4 |
| P17–ORC50–IBU10 | 944.3 | 81.4 | 826.4 | 50.5 | 19.7 | 52.2 |
| P17–ORC50–IBU15 | 258.1 | 419.5 | 1659.2 | 162.3 | 13.8 | 376.4 |
| Formulation | k Estimate | P vs. IBU10 | P vs. IBU15 | n Estimate | P vs. IBU10 | P vs. IBU15 |
|---|---|---|---|---|---|---|
| P17–ORC50–IBU5 | 3.3 ± 0.9 | 0.0012 | 0.0010 | 0.78 ± 0.06 | 0.0988 | 0.0988 |
| P17–ORC50–IBU10 | 6.1 ± 1.1 | - | 0.7742 | 0.71 ± 0.05 | - | 0.0024 |
| P17–ORC50–IBU15 | 6.3 ± 1.3 | 0.7742 | - | 0.84 ± 0.05 | 0.0024 | - |
| Formulation | Breakpoint Time (h) | Adjusted RSS | Model Equations | |||
|---|---|---|---|---|---|---|
| K–P | Linear | Sum | K–P | Linear | ||
| P17–ORC50–IBU5 | 24 | 0.53190 | 0.00047 | 0.5324 | y = 6.18 × x0.60 | y = 0.90 × x + 20.6 |
| P17–ORC50–IBU10 | 20 | 0.04065 | 0.00257 | 0.0432 | y = 7.34 × x0.66 | y = 1.46 × x + 24.1 |
| P17–ORC50–IBU15 | 4 | 0.01308 | 0.04428 | 0.0574 | y = 6.23 × x0.84 | y = 3.16 × x + 11.3 |
Publisher’s Note: MDPI stays neutral with regard to jurisdictional claims in published maps and institutional affiliations. |
© 2021 by the authors. Licensee MDPI, Basel, Switzerland. This article is an open access article distributed under the terms and conditions of the Creative Commons Attribution (CC BY) license (https://creativecommons.org/licenses/by/4.0/).
Share and Cite
Grela, K.P.; Marciniak, D.M.; Karolewicz, B. Poloxamer 407-Based Thermosensitive Emulgel as a Novel Formulation Providing a Controlled Release of Oil-Soluble Pharmaceuticals—Ibuprofen Case Study. Materials 2021, 14, 7266. https://0-doi-org.brum.beds.ac.uk/10.3390/ma14237266
Grela KP, Marciniak DM, Karolewicz B. Poloxamer 407-Based Thermosensitive Emulgel as a Novel Formulation Providing a Controlled Release of Oil-Soluble Pharmaceuticals—Ibuprofen Case Study. Materials. 2021; 14(23):7266. https://0-doi-org.brum.beds.ac.uk/10.3390/ma14237266
Chicago/Turabian StyleGrela, Kamil P., Dominik M. Marciniak, and Bożena Karolewicz. 2021. "Poloxamer 407-Based Thermosensitive Emulgel as a Novel Formulation Providing a Controlled Release of Oil-Soluble Pharmaceuticals—Ibuprofen Case Study" Materials 14, no. 23: 7266. https://0-doi-org.brum.beds.ac.uk/10.3390/ma14237266