
Relationship between Young’s Modulus and Planar Density of Unit Cell, Super Cells (2 × 2 × 2), Symmetry Cells of Perovskite (CaTiO3) Lattice

 , ,
, ,  ,
,
Abstract
:
1. Introduction
2. Experimental
2.1. Materials
2.2. Instrumentation
2.3. Methods
2.3.1. Synthesis of Nano-Powder CaTiO3
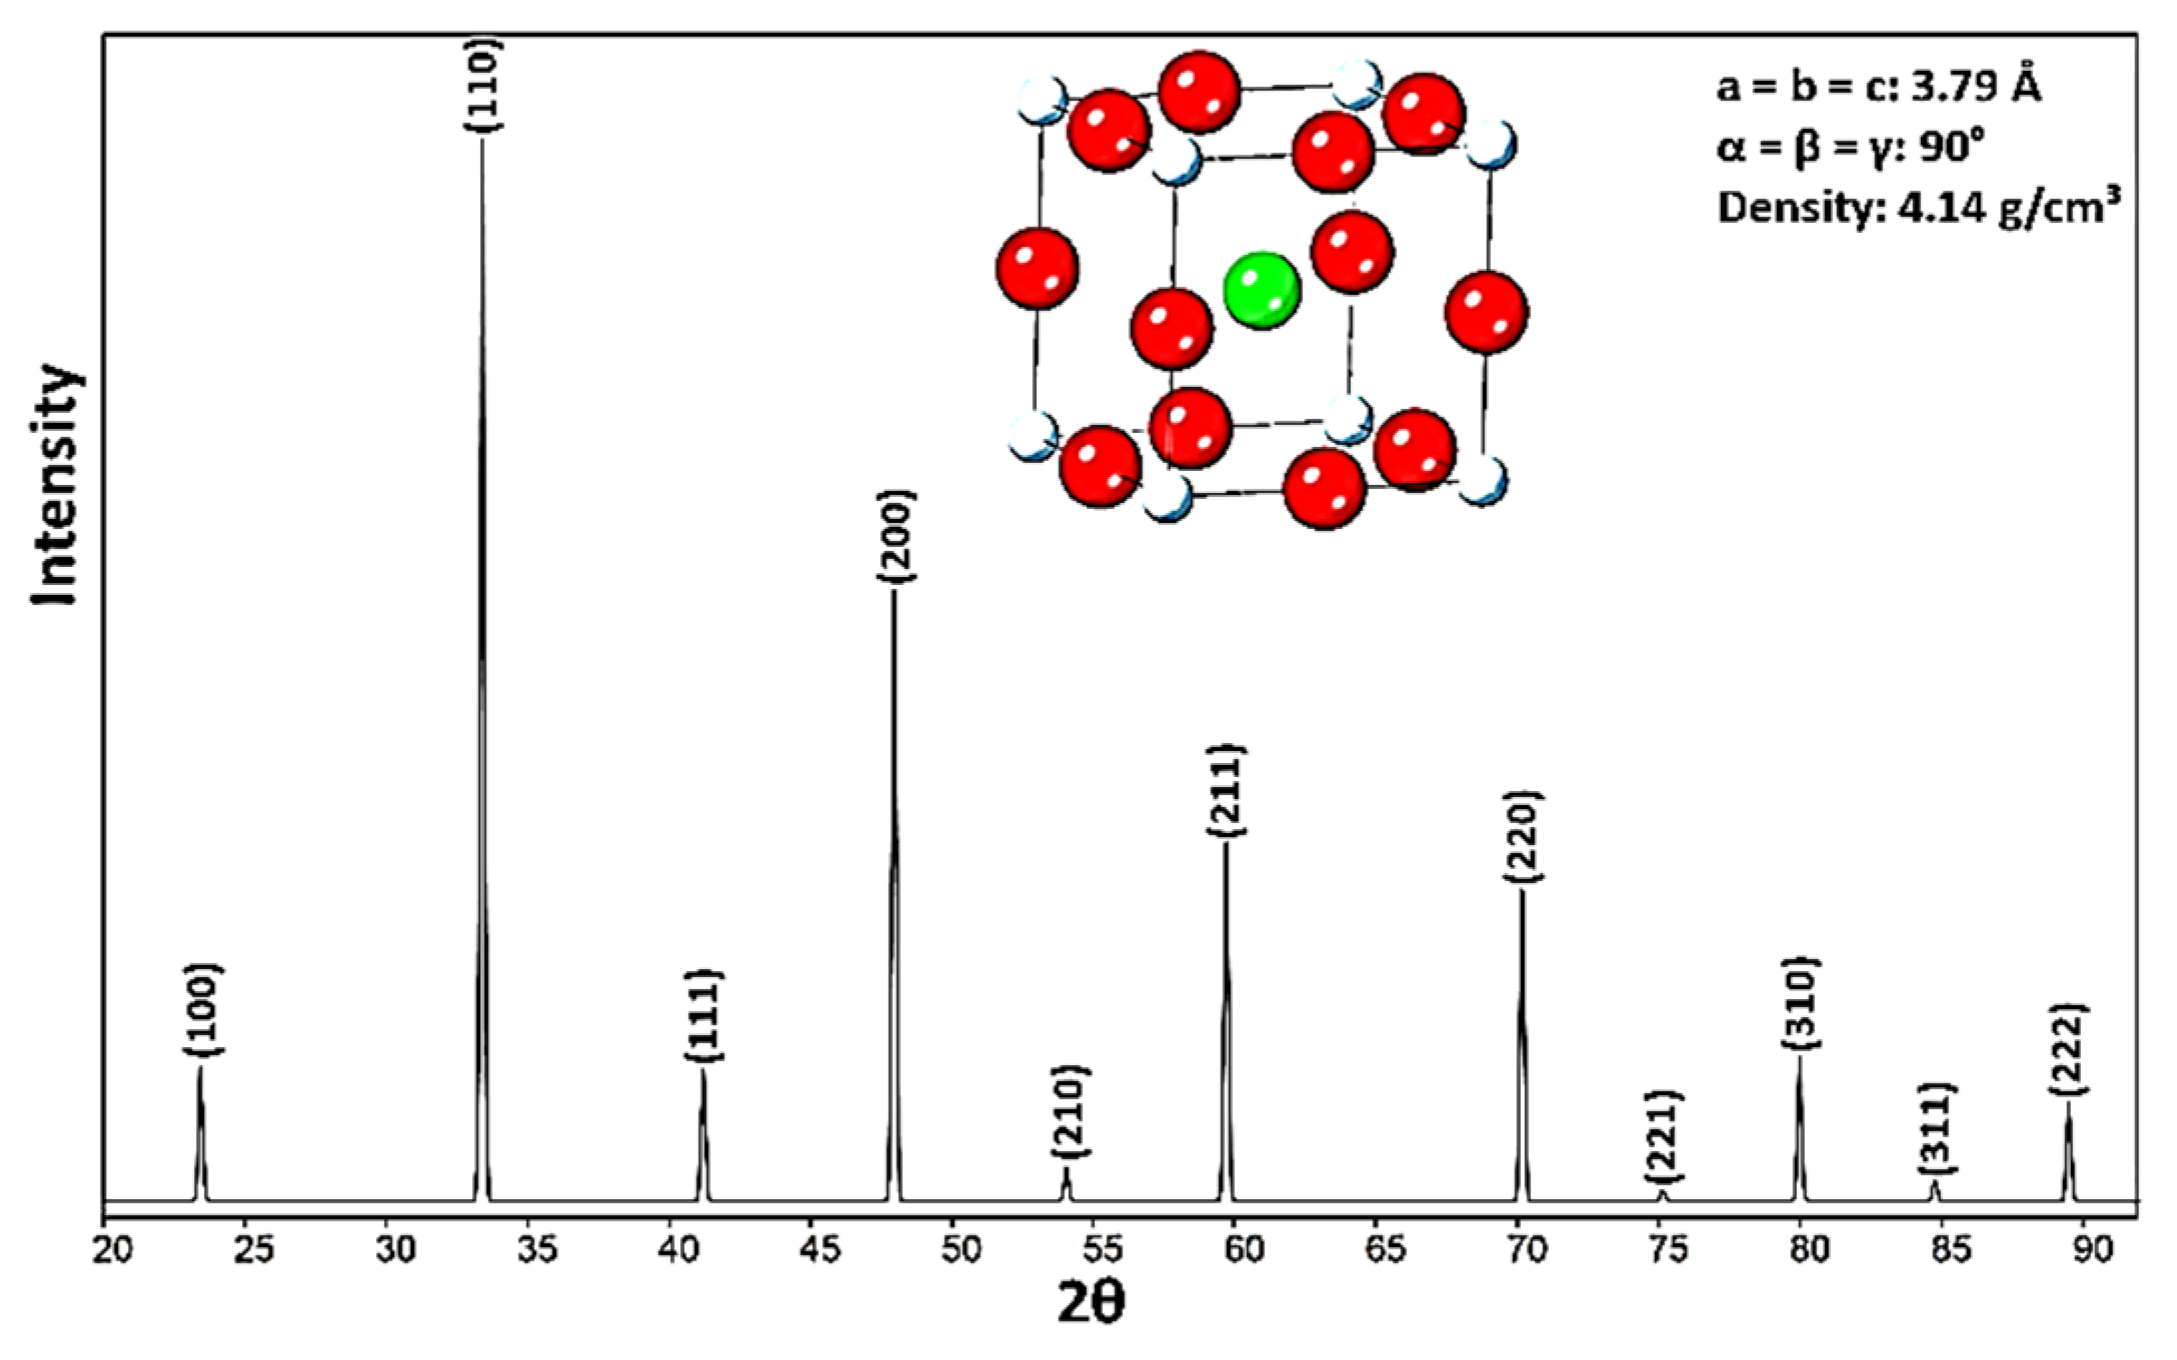
2.3.2. X-ray Diffraction of CaTiO3 and Planar Density Calculations
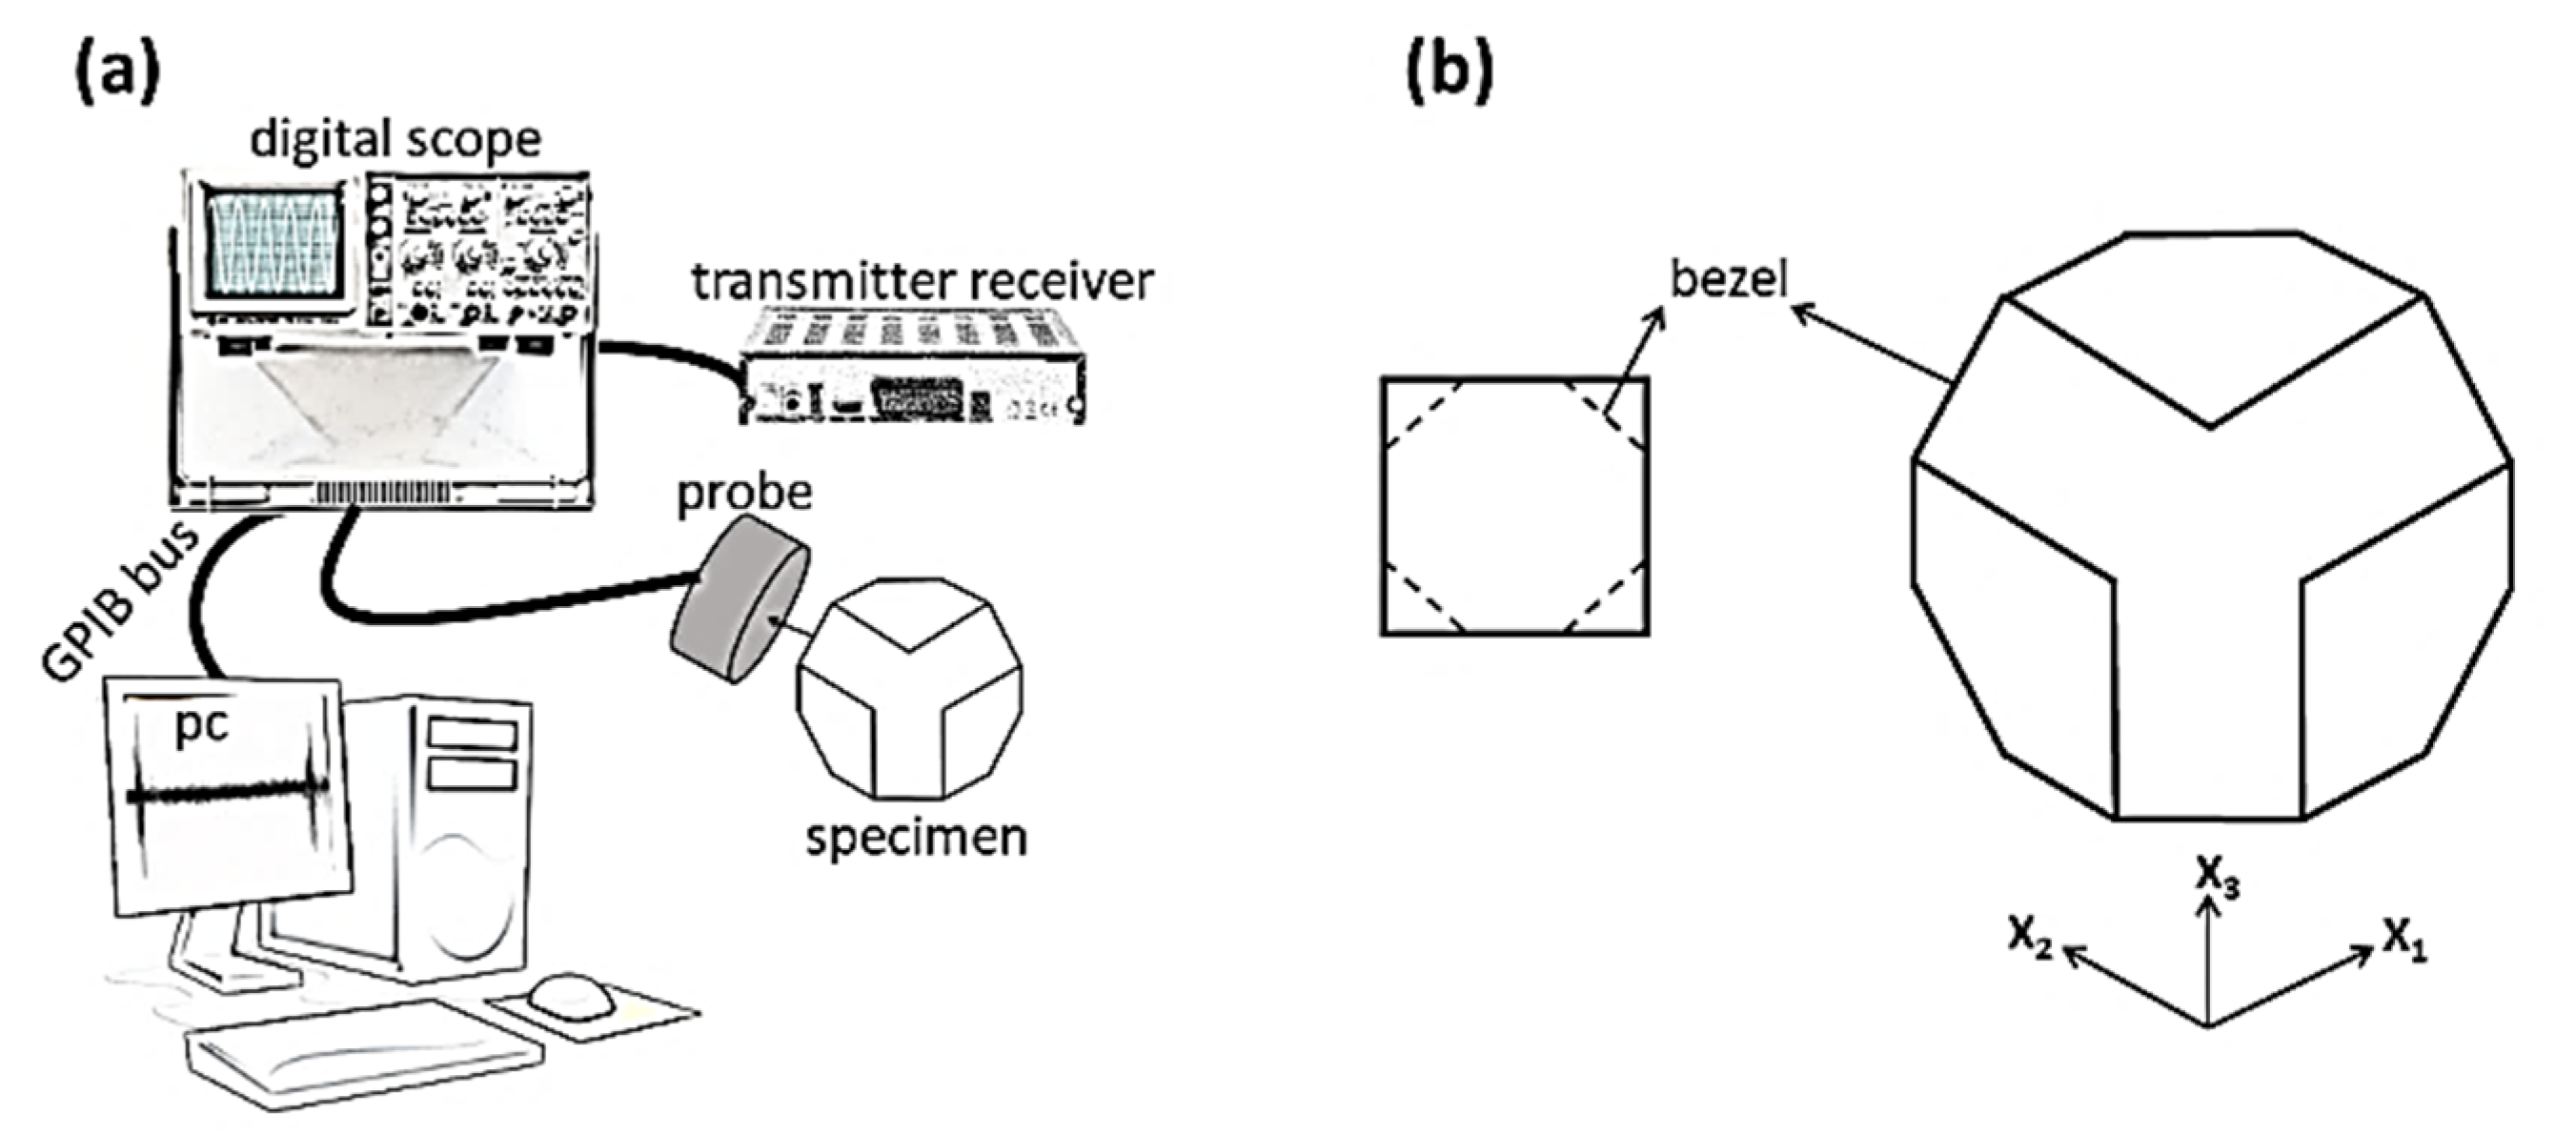
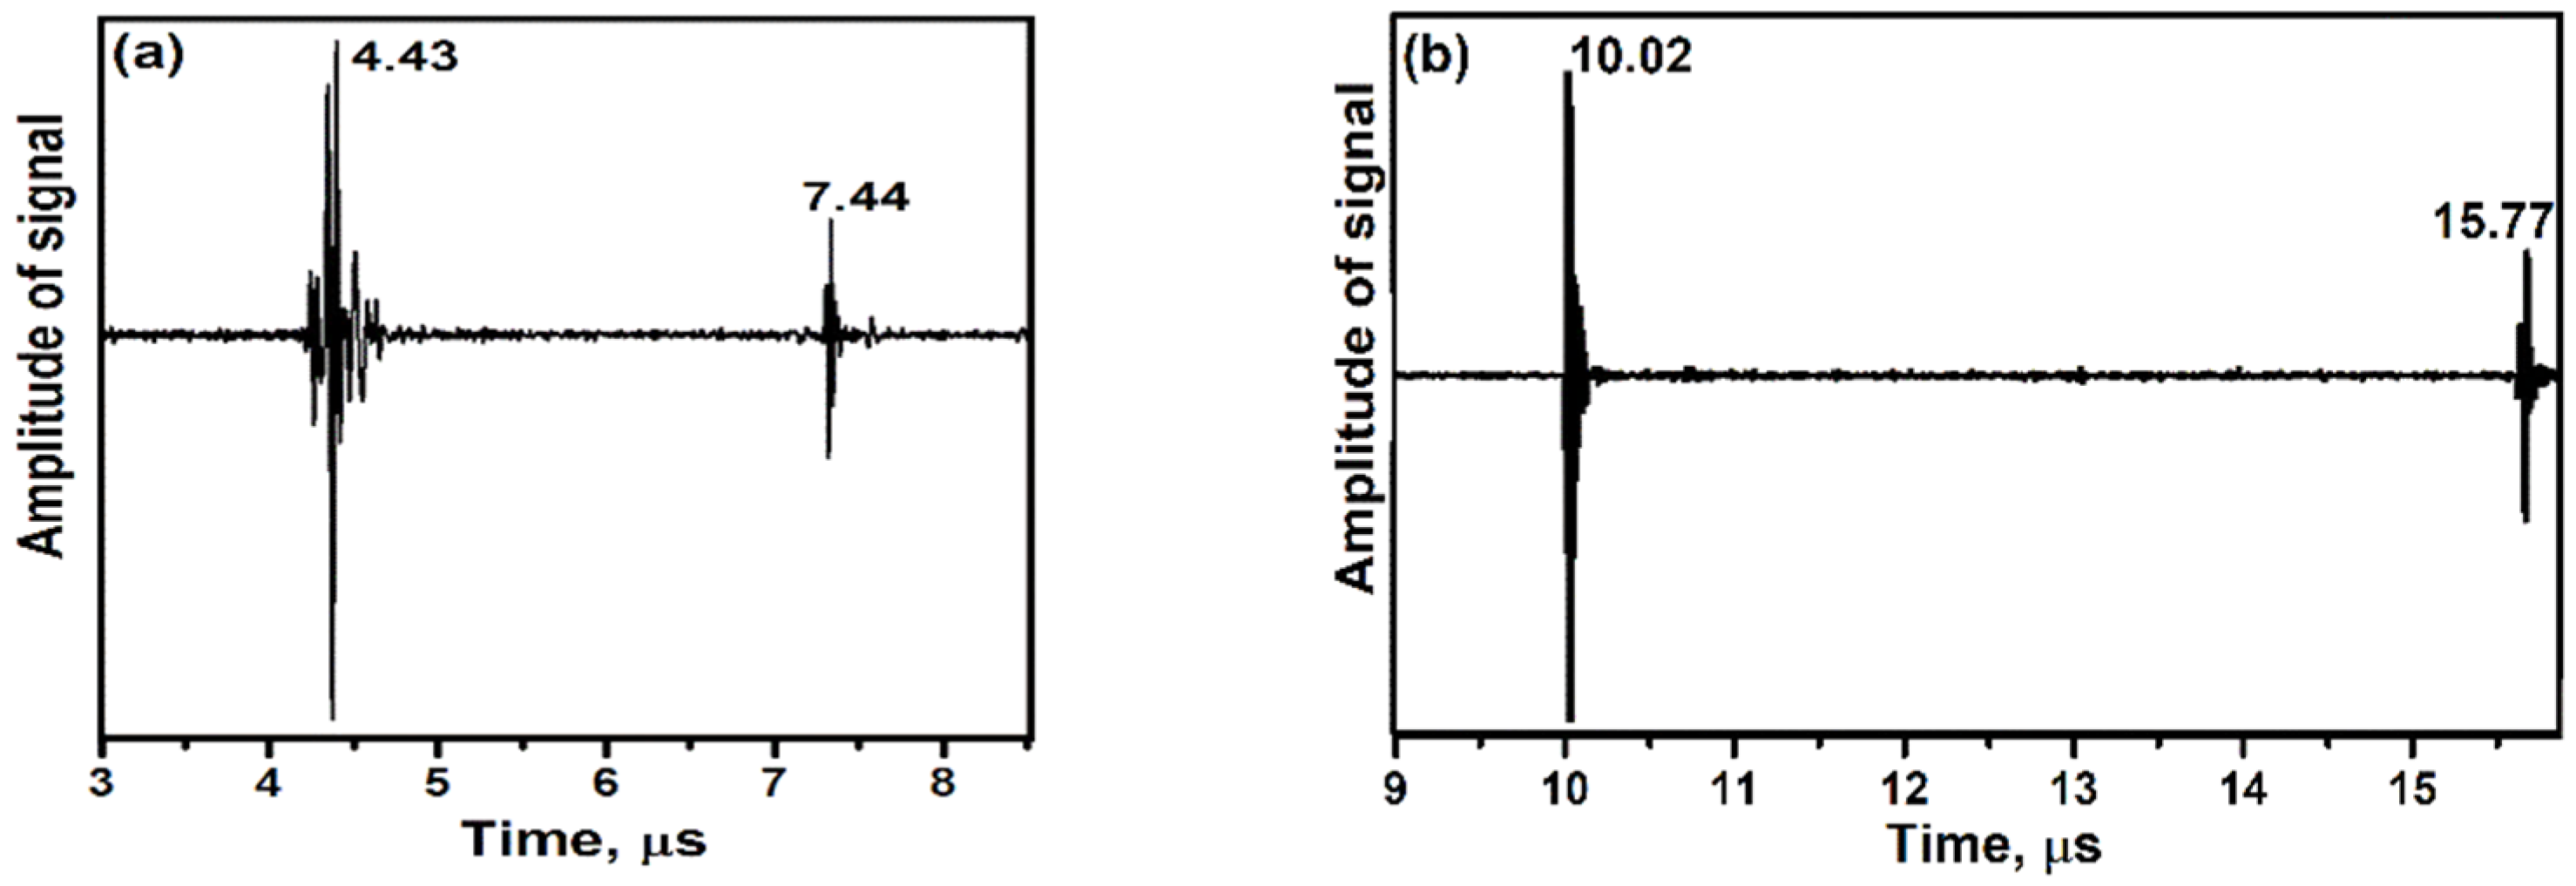
2.3.3. Ultrasonic Pulse-Echo Technique of CaTiO3
3. Results
3.1. X-ray Diffraction of CaTiO3 and Planar Density Calculations
3.2. Investigation of Results Obtained from Ultrasonic Pulse-Echo Technique of CaTiO3
3.3. Calculations: Relationship between Elastic Stiffness-Compliance Constants, Young’s Modulus and Planar Density Extracted through the Unit Cell, Super Cells (2 × 2 × 2) and Symmetry Cells of CaTiO3 Lattice
4. Discussion
5. Conclusions
- CaTiO3 as a category of perovskite is successfully synthesized via solvothermal method.
- Crystal size values of CaTiO3 are calculated as ~59.10 and 63.02 through the Monshi-Scherrer method and BET analysis, and the crystal size values were confirmed by TEM image.
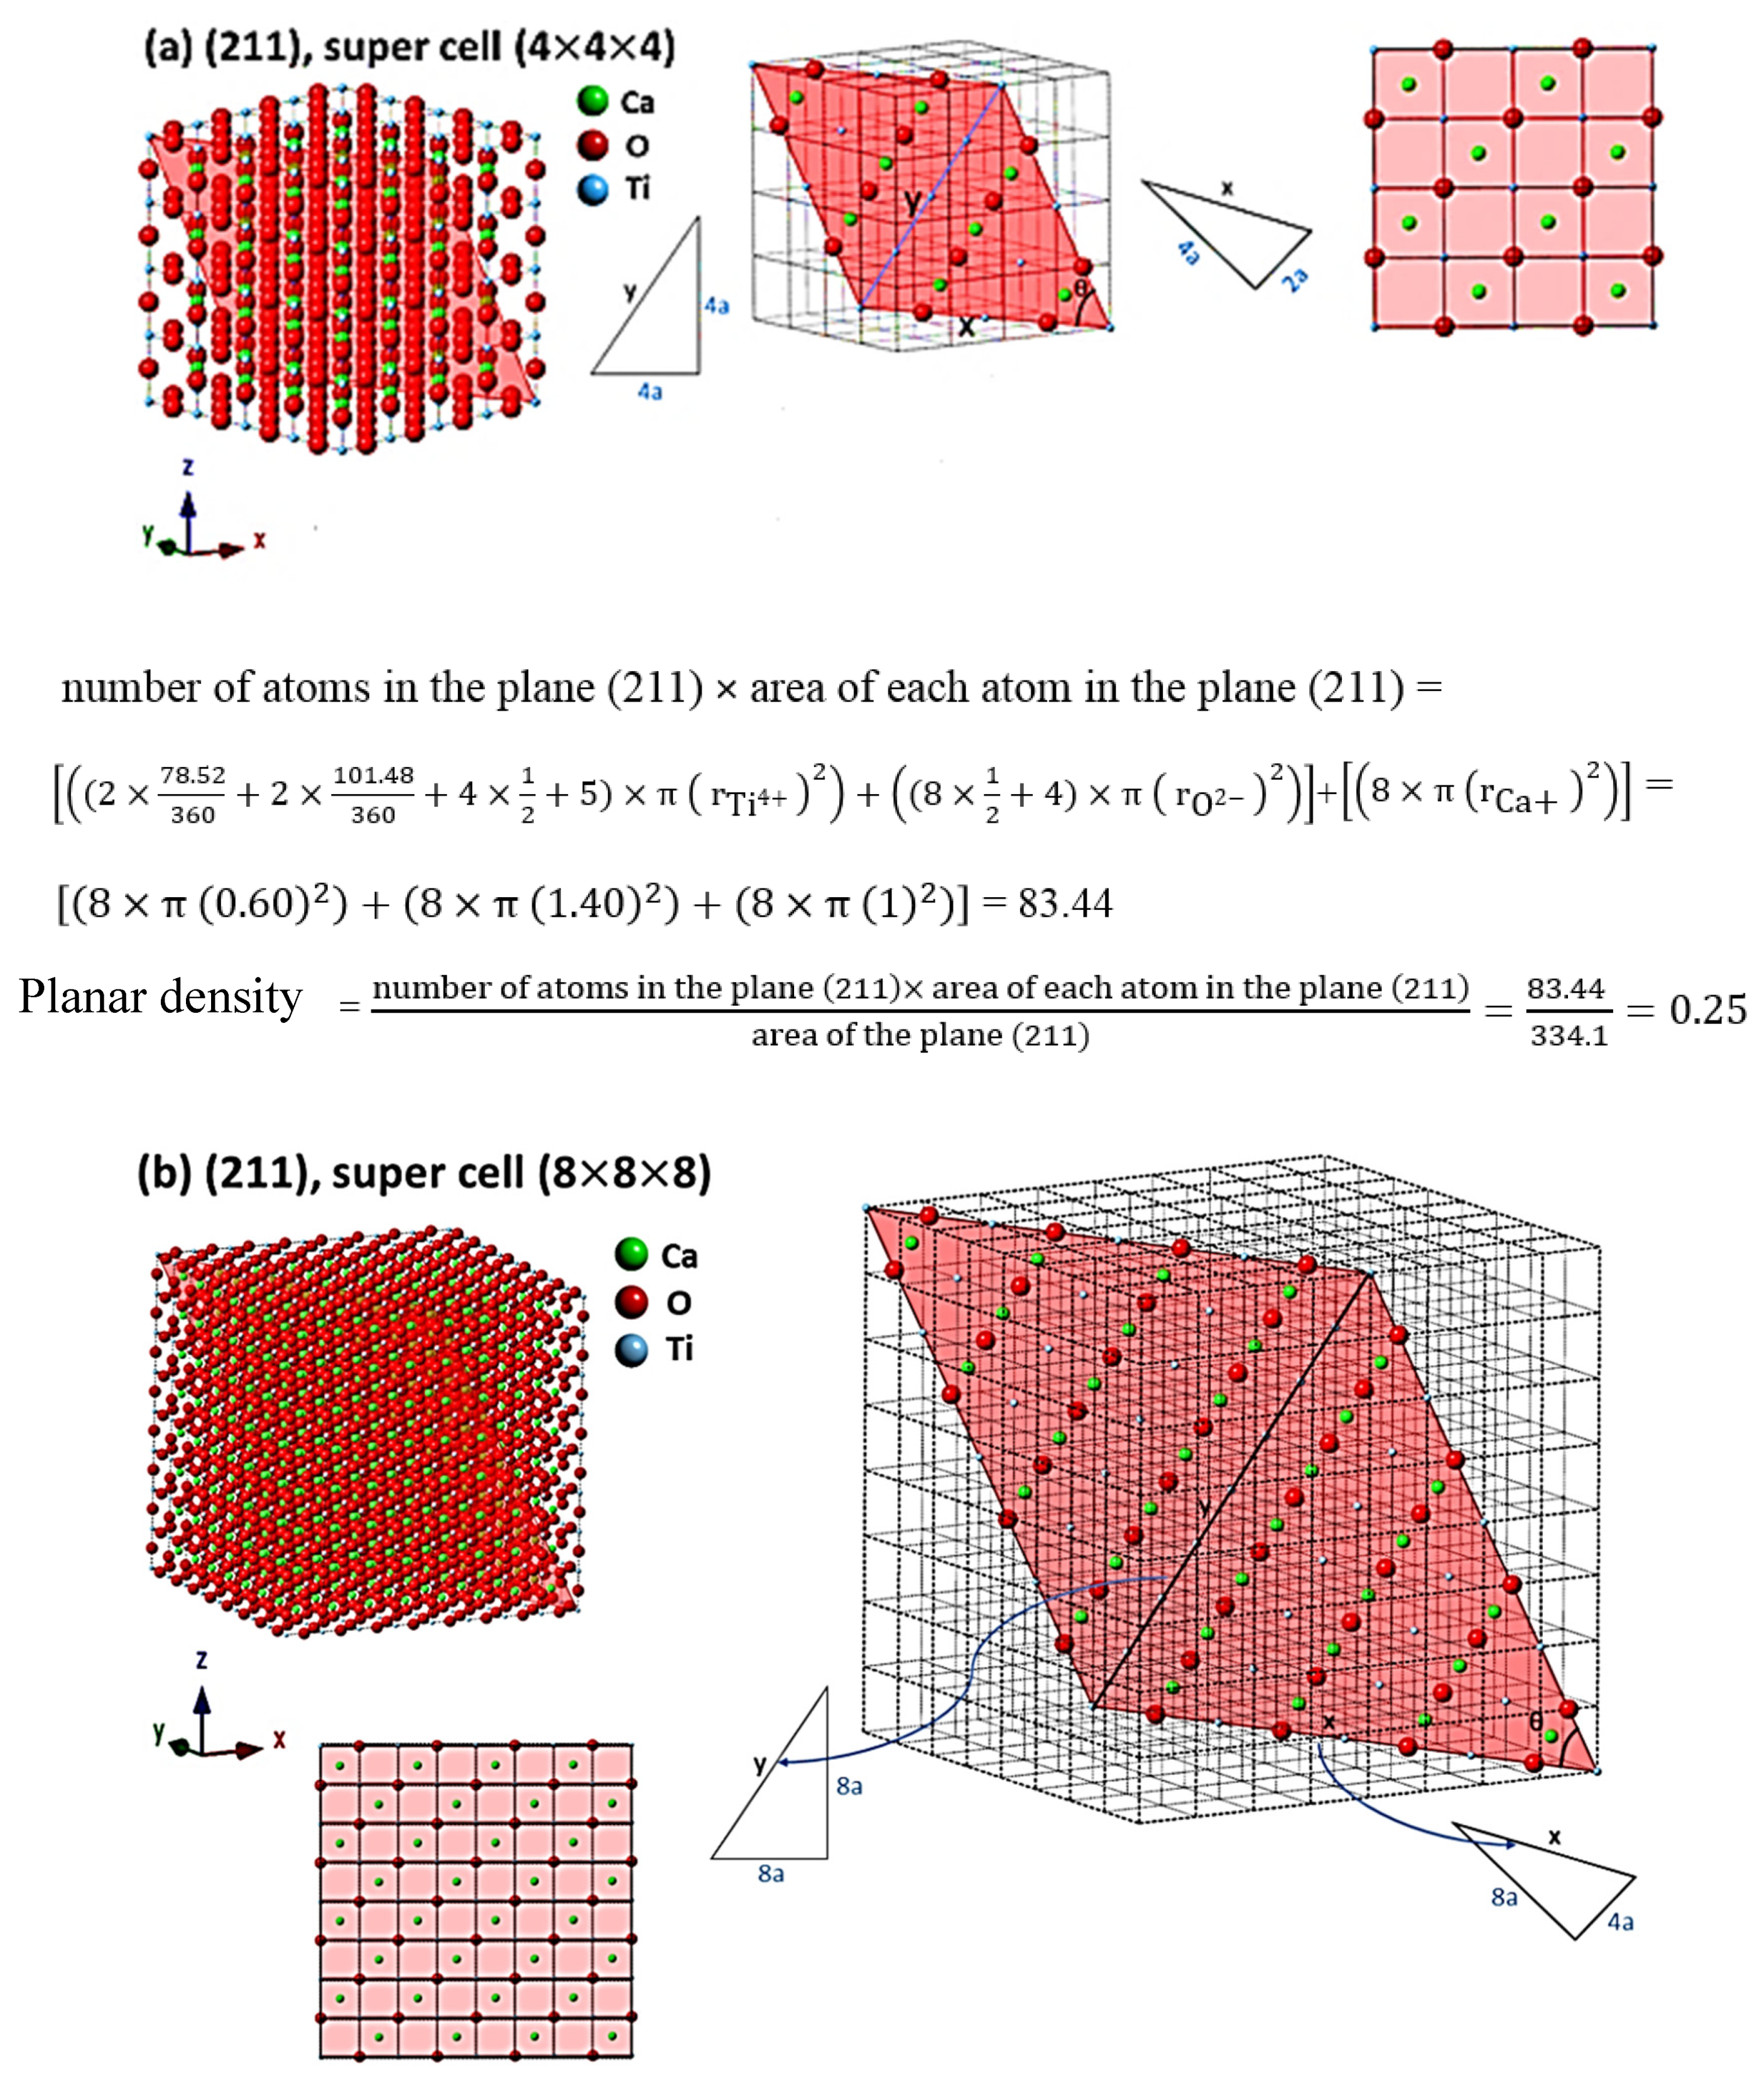
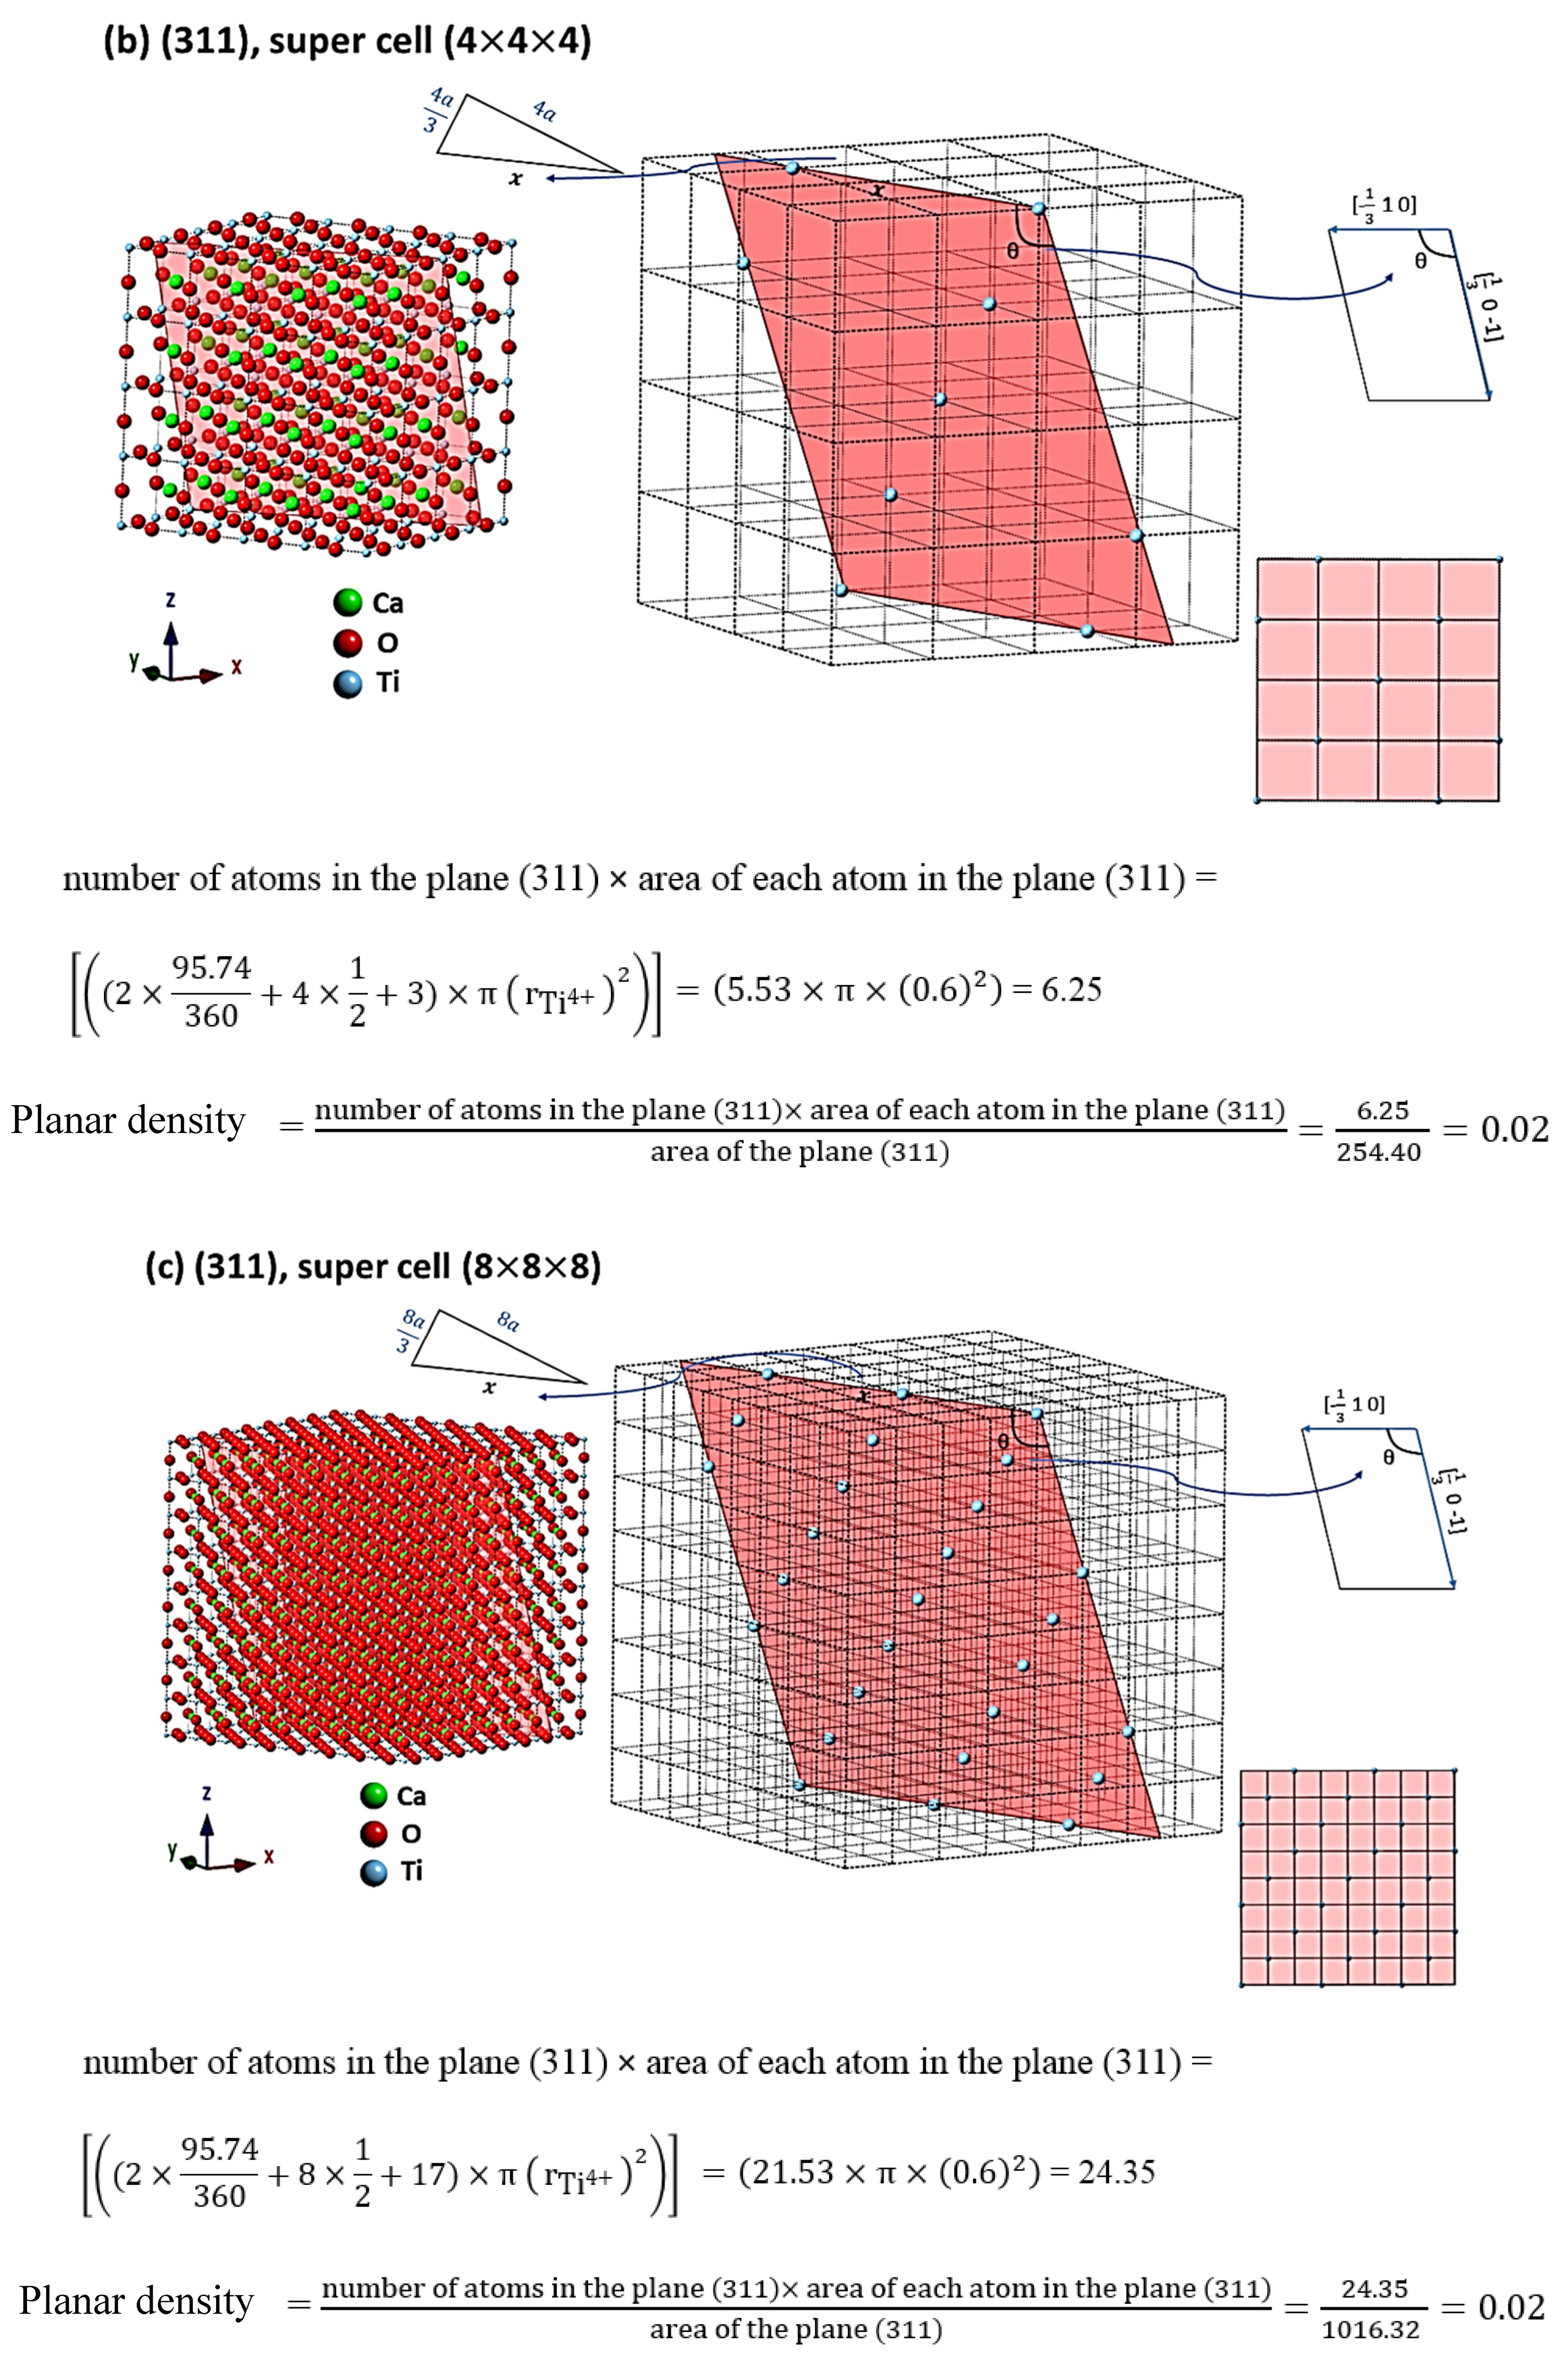
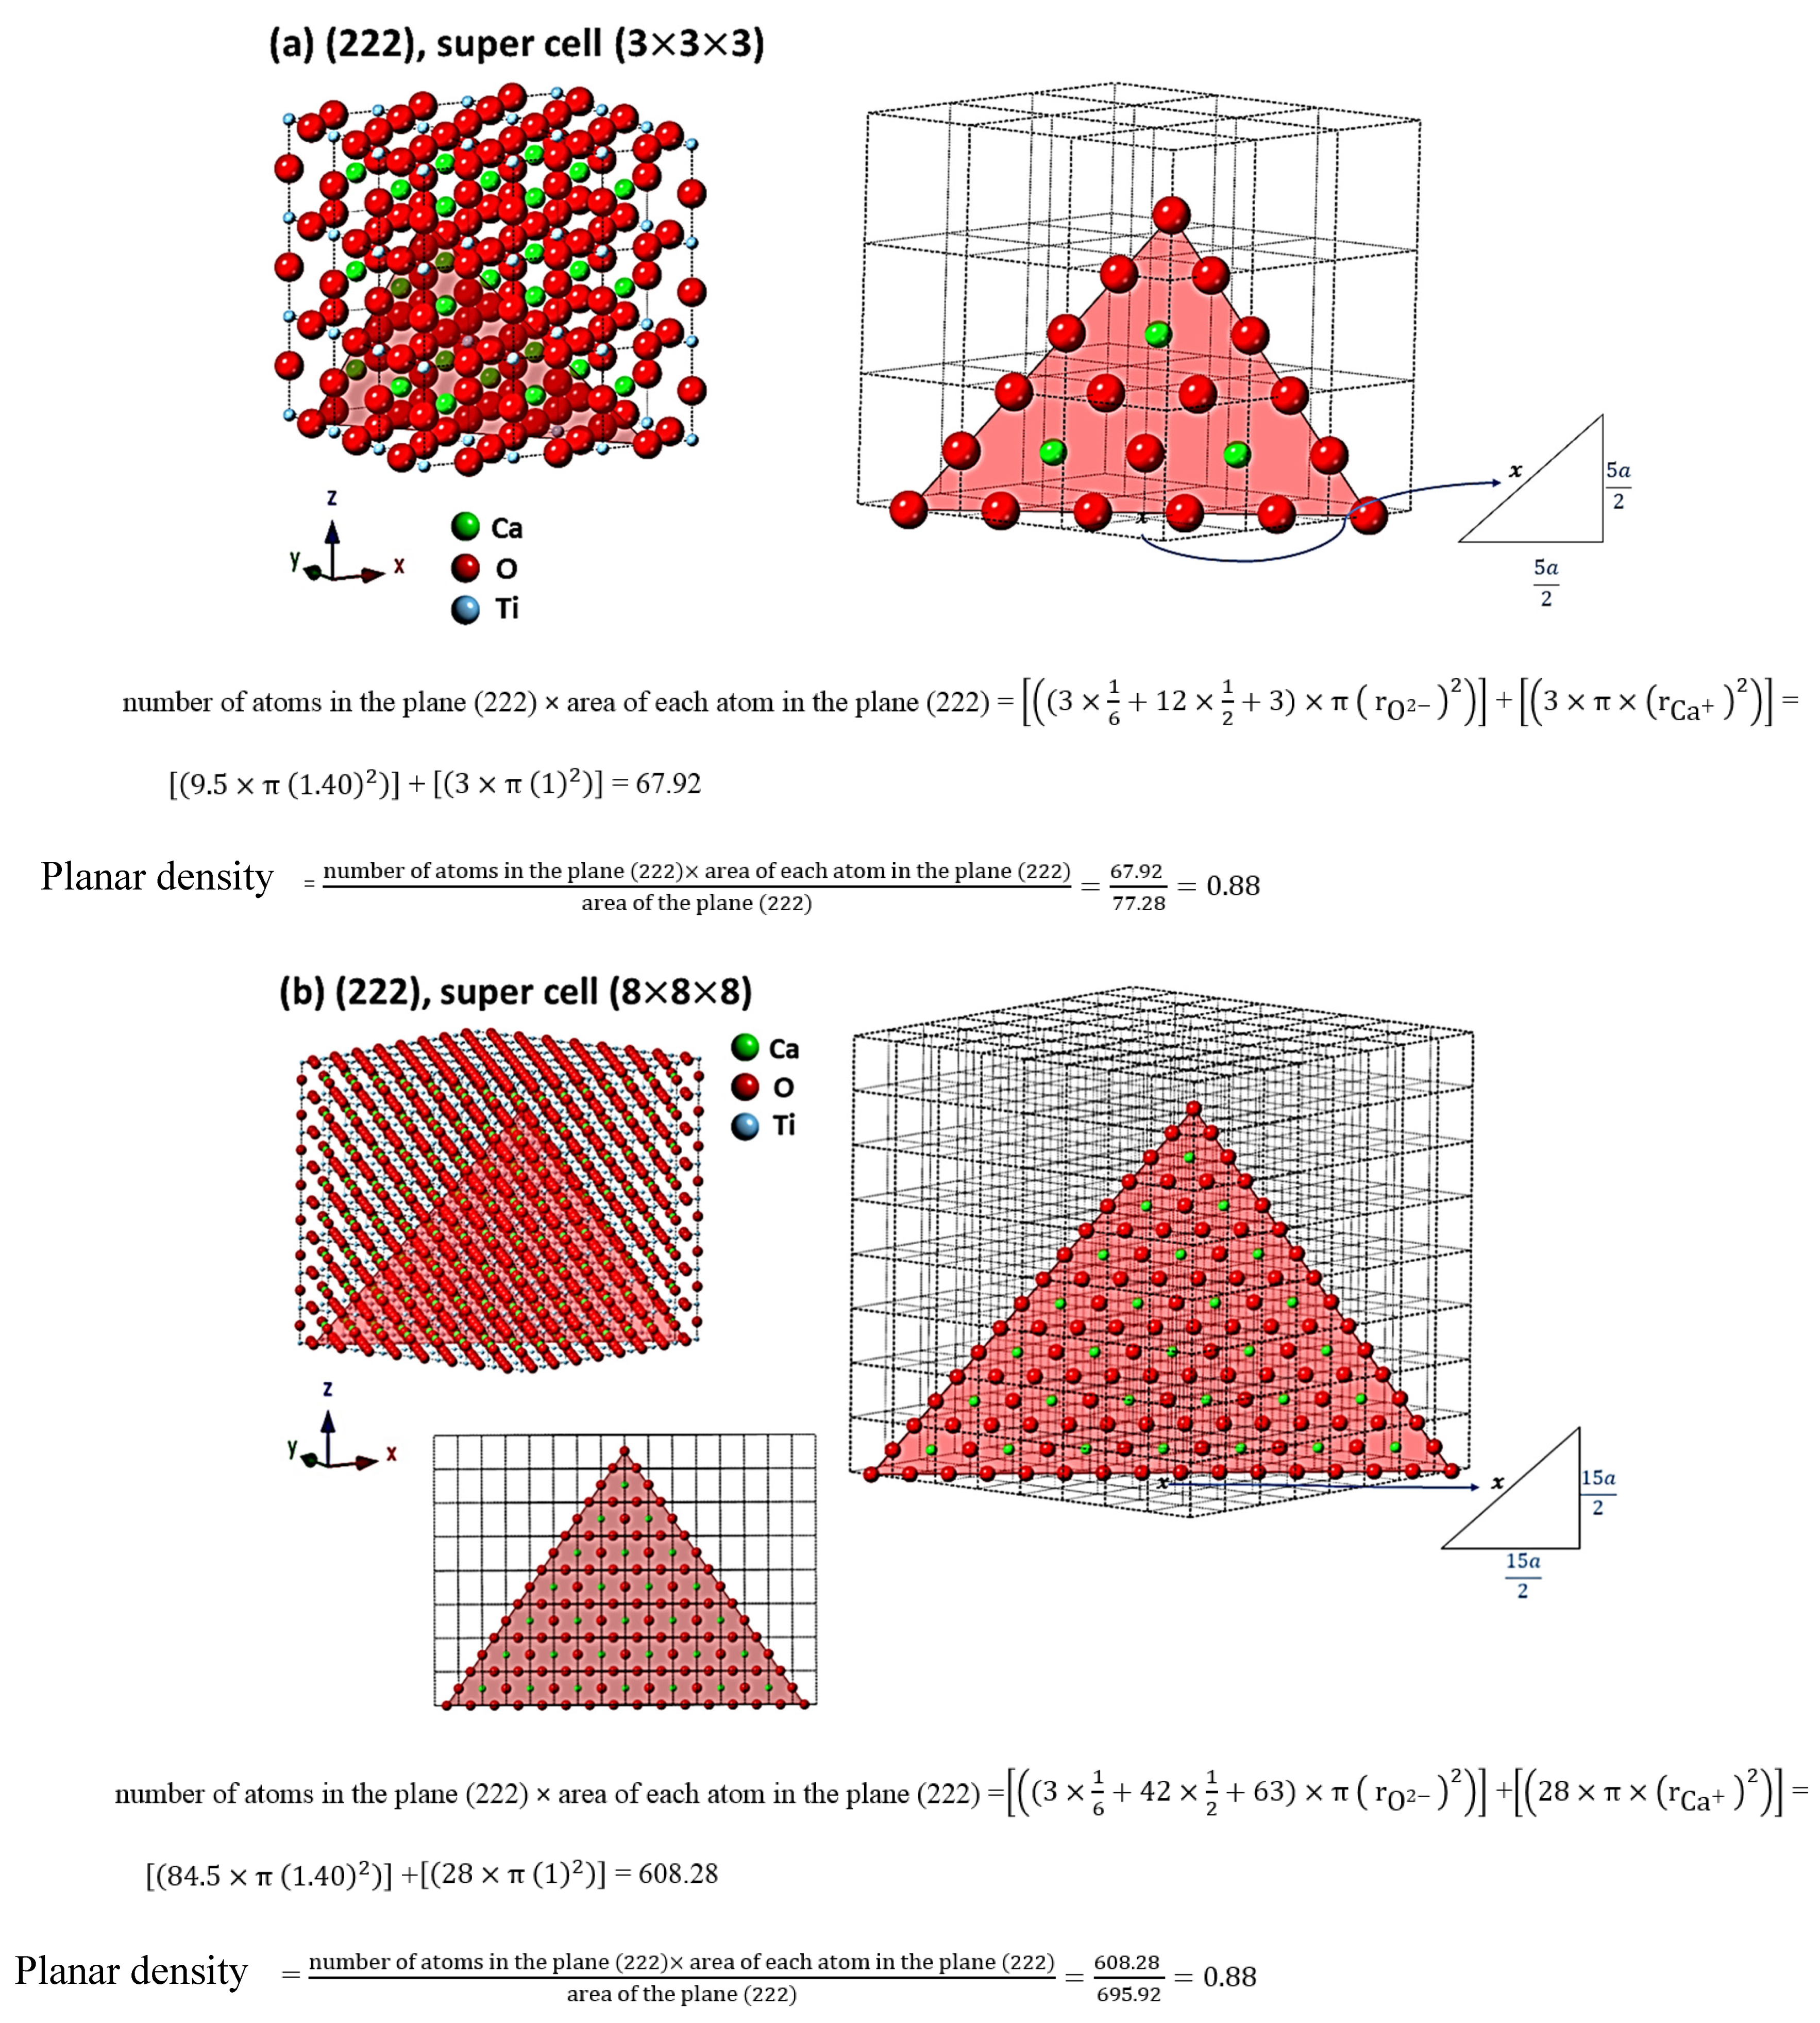
- Planar density is responsible for modulus of elasticity of that plane; therefore, for the first time, comprehensive calculations of geometry, location and planar density values of CaTiO3 were shown.
- Elastic stiffness constants and Young’s modulus values of CaTiO3 were obtained by ultrasonic-echo method (C11 = 330.89, C12 = 93.03, C44 = 94.91 GPa and E = 153.87 ± 0.2 GPa).
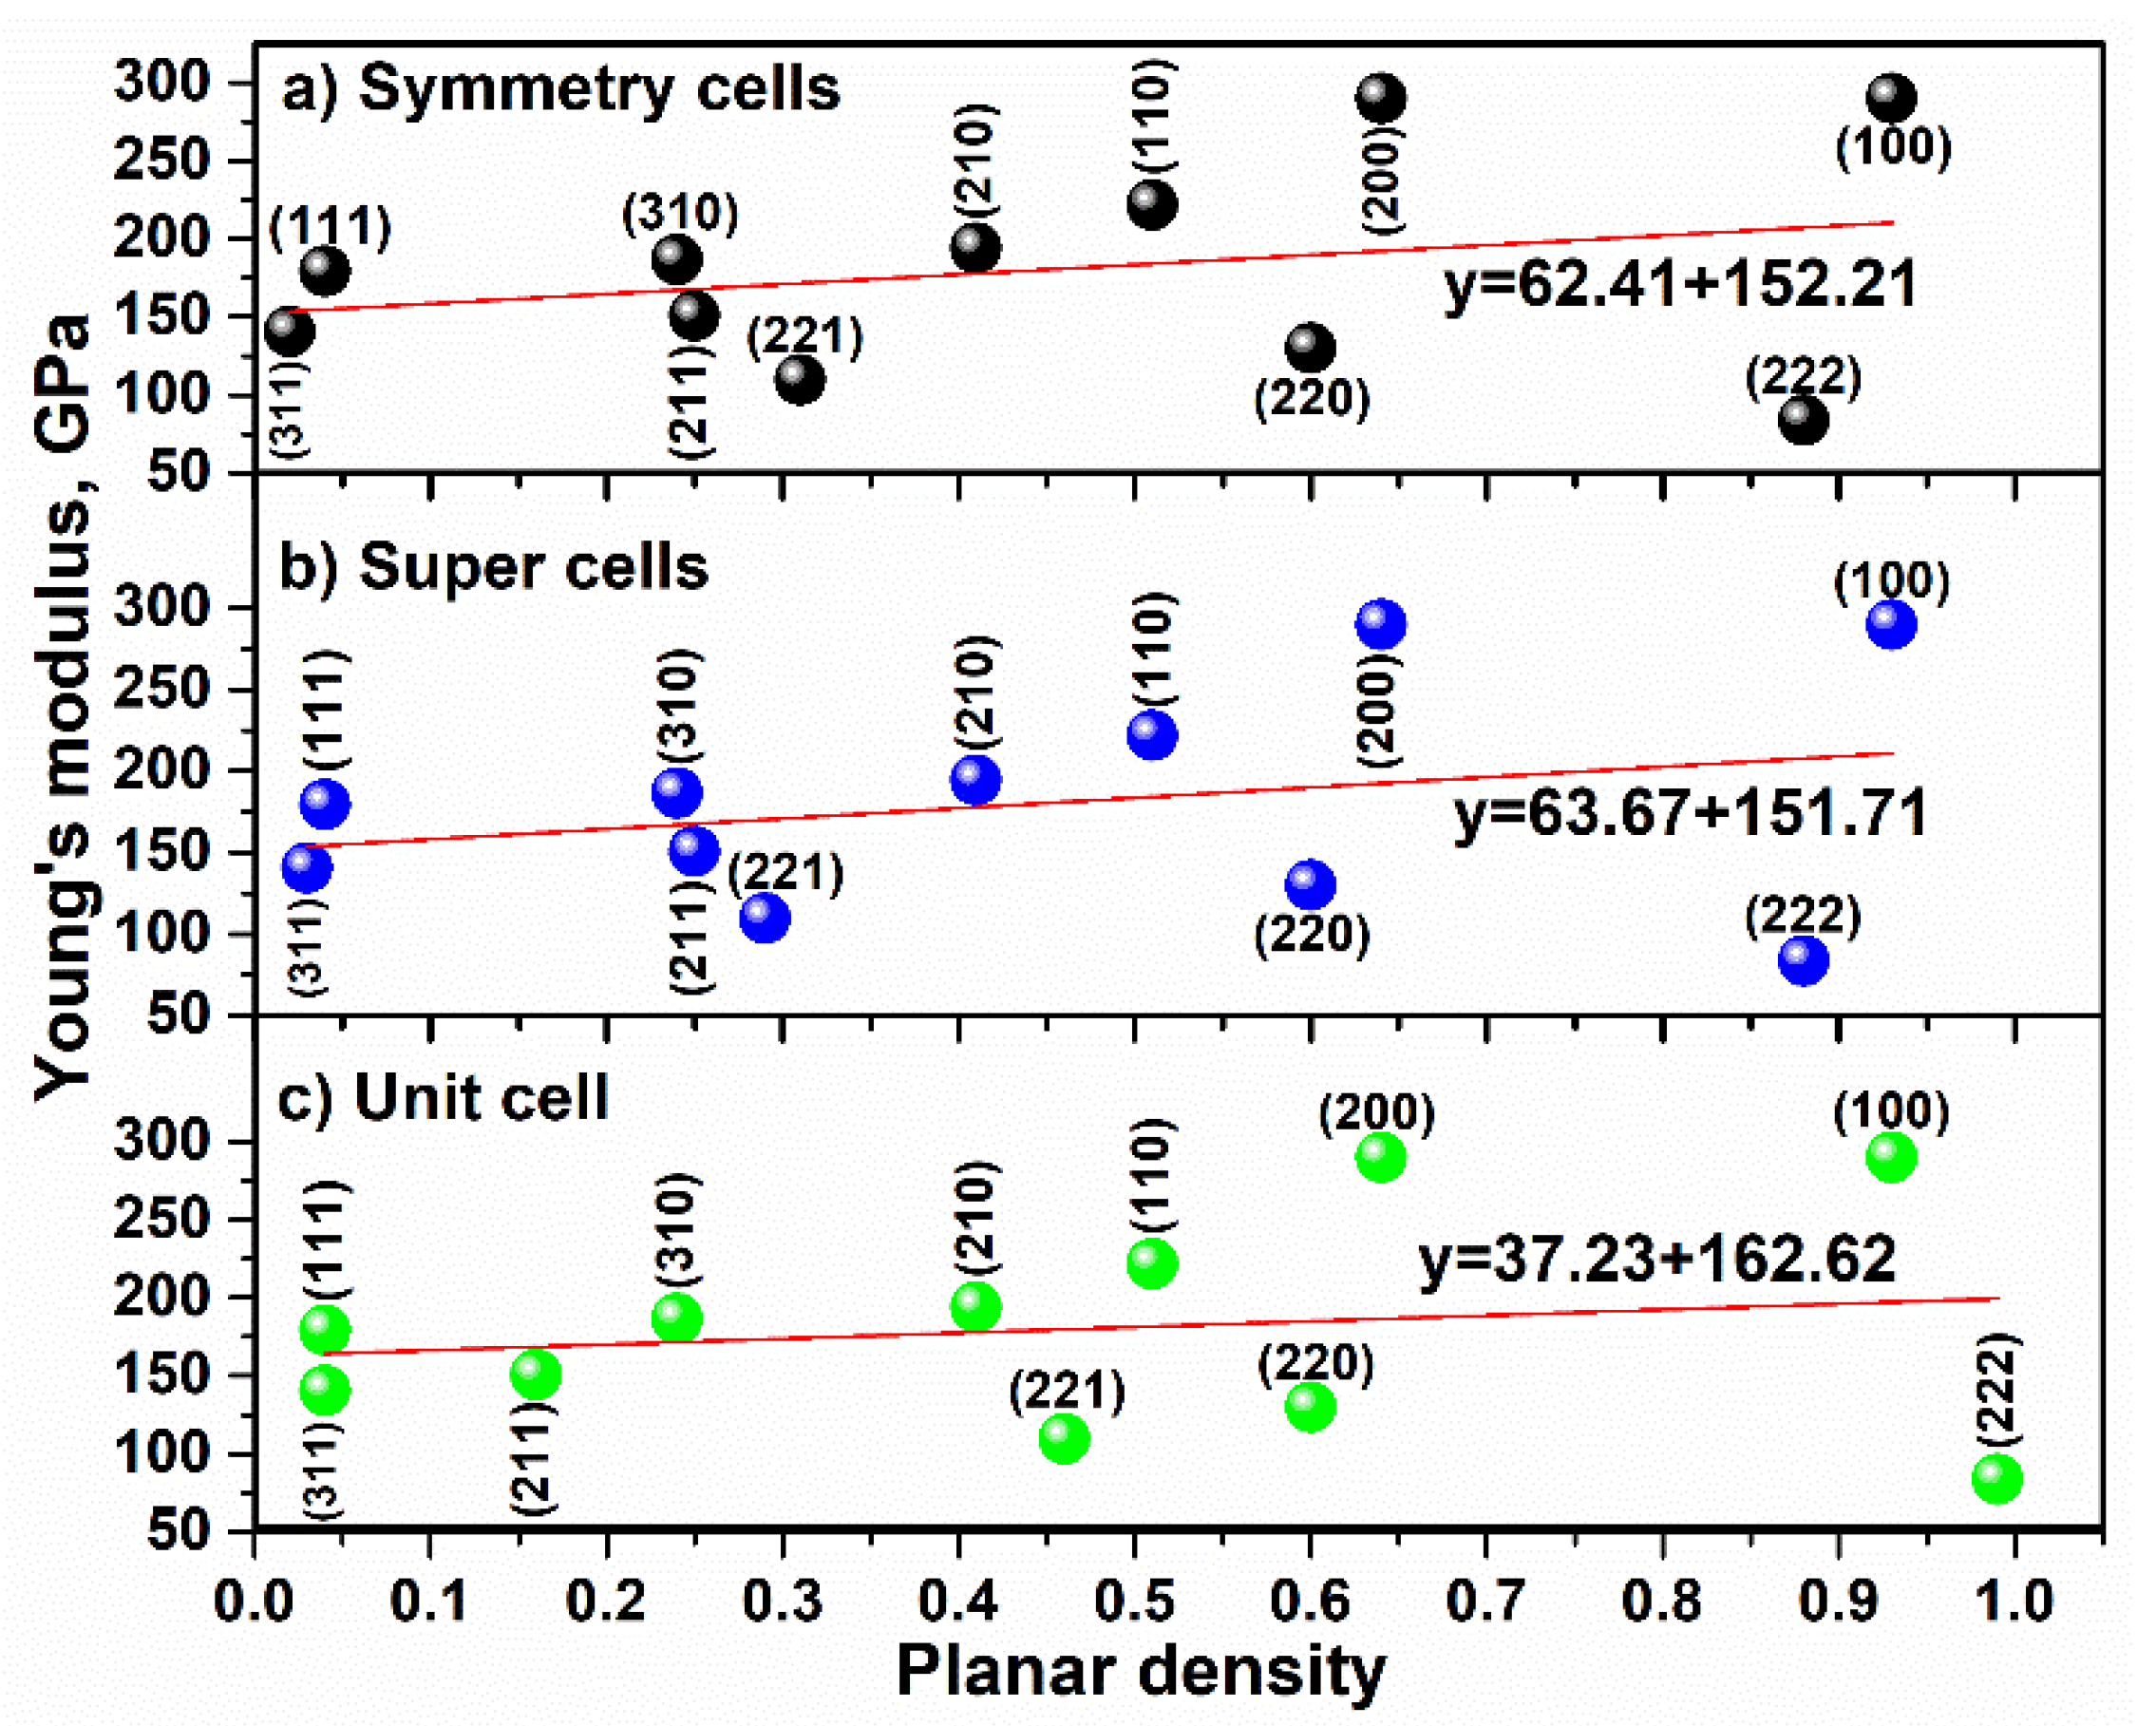
- Young’s modulus values of CaTiO3 extracted by planar density and least square method were calculated as 162.62 ± 0.4, 151.71 ± 0.4 and 152.21 ± 0.4 GPa for unit cell, super cells (2 × 2 × 2) and symmetry cells, respectively.
- The Young’s modulus value of CaTiO3 reported by symmetry cells is in good agreement with Young’s modulus value reported by ultrasonic-echo technique and the literatre.
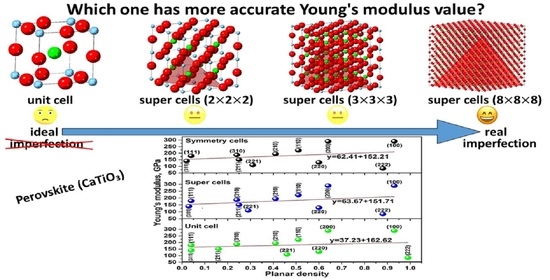
- A unit cell of CaTiO3 is not representative of the distribution of atoms on the planes; therefore, to obtain the real value of planar density and find the symmetry of distribution of atoms on the planes, expanded cells and utilizing symmetry cells are suggested.
- Obtaining the planar density values based on unit cell or each super cells except for (8 × 8 × 8) is an estimation.
- The real value of Young’s modulus of CaTiO3 should be extracted by symmetry cells or super cells (8 × 8 × 8).
- The value of Young’s modulus of CaTiO3 extracted with this method can be applied for industrial applications.
Supplementary Materials
Author Contributions
Funding
Data Availability Statement
Conflicts of Interest
References
- Atta, N.F.; Galal, A.; El-Ads, E.H. Perovskite Nanomaterials-Synthesis, Characterization, and Applications; Intechopen: London, UK, 2016. [Google Scholar]
- Reshmi Varma, P.C. Low-dimensional perovskites. In Perovskite Photovoltaics: Basic to Advanced Concepts and Implementation; Elsevier: Amsterdam, The Netherlands, 2018; pp. 197–229. ISBN 9780128129159. [Google Scholar]
- Nakamura, T.; Sun, P.H.; Shan, Y.J.; Inaguma, Y.; Itoh, M.; Kim, I.N.S.; Sohn, J.H.O.; Ikeda, M.; Kitamura, T.; Konagaya, H. On the perovskite-related materials of high dielectric permittivity with small temperature dependence and low dielectric loss. Ferroelectrics 1997, 196, 205–209. [Google Scholar] [CrossRef]
- Wang, X.; Xu, C.N.; Yamada, H.; Nishikubo, K.; Zheng, X.G. Electro-mechano-optical conversions in Pr3+-doped BaTiO3-CaTiO3 ceramics. Adv. Mater. 2005, 17, 1254–1258. [Google Scholar] [CrossRef]
- Ma, Y.Z.; Sobernheim, D.; Garzon, J.R. Glossary for Unconventional Oil and Gas Resource Evaluation and Development. In Unconventional Oil and Gas Resources Handbook: Evaluation and Development; Elsevier Inc.: Amsterdam, The Netherlands, 2016; pp. 513–526. ISBN 9780128025369. [Google Scholar]
- Slaughter, W.S. The Linearized Theory of Elasticity; Birkhäuser Boston: New York, NY, USA, 2002. [Google Scholar]
- Kuma, S.; Woldemariam, M.M. Structural, Electronic, Lattice Dynamic, and Elastic Properties of SnTiO3 and PbTiO3 Using Density Functional Theory. Adv. Condens. Matter Phys. 2019, 2019. [Google Scholar] [CrossRef] [Green Version]
- Nakamura, M. Elastic constants of some transition- metal- disilicide single crystals. Metall. Mater. Trans. A 1994, 25, 331–340. [Google Scholar] [CrossRef]
- Paszkiewicz, T.; Wolski, S. Elastic properties of cubic crystals: Every’s versus Blackman’s diagram. J. Phys. Conf. Ser. 2008, 104, 012038. [Google Scholar] [CrossRef]
- Ching, W.Y.; Rulis, P.; Misra, A. Ab initio elastic properties and tensile strength of crystalline hydroxyapatite. Acta Biomater. 2009, 5, 3067–3075. [Google Scholar] [CrossRef] [Green Version]
- Holec, D.; Friák, M.; Neugebauer, J.; Mayrhofer, P.H. Trends in the elastic response of binary early transition metal nitrides. Phys. Rev. B-Condens. Matter Mater. Phys. 2012, 85, 64101. [Google Scholar] [CrossRef] [Green Version]
- Knowles, K.M.; Howie, P.R. The Directional Dependence of Elastic Stiffness and Compliance Shear Coefficients and Shear Moduli in Cubic Materials. J. Elast. 2015, 120, 87–108. [Google Scholar] [CrossRef] [Green Version]
- Stair, K.; Liu, J.; Asta, M. Undefined Ultra-sonic measurement and computation of elastic constants. In Proceedings of the ASEE Annual Conference and Exposition, Kansas City, MO, USA, 13–15 September 2006. [Google Scholar]
- Kelly, A.; Knowles, K.M. Crystallography and Crystal Defects; John Wiley & Sons, Ltd.: Chichester, UK, 2012; ISBN 9781119961468. [Google Scholar]
- Epp, J. X-ray Diffraction (XRD) Techniques for Materials Characterization. In Materials Characterization Using Nondestructive Evaluation (NDE) Methods; Elsevier Inc.: Amsterdam, The Netherlands, 2016; pp. 81–124. ISBN 9780081000571. [Google Scholar]
- Badawi, F.; Villain, P. Stress and elastic-constant analysis by X-ray diffraction in thin films. J. Appl. Crystallogr. 2003, 36, 869–879. [Google Scholar] [CrossRef]
- Waseda, Y.; Matsubara, E.; Shinoda, K. X-ray Diffraction Crystallography X-ray Diffraction Crystallography Introduction, Examples and Solved Problems; Springer: Berlin/Heidelberg, Germany, 2011. [Google Scholar]
- Dong, W.; Song, B.; Meng, W.; Zhao, G.; Han, G. A simple solvothermal process to synthesize CaTiO3 microspheres and its photocatalytic properties. Appl. Surf. Sci. 2015, 349, 272–278. [Google Scholar] [CrossRef]
- Wang, Y.; Niu, C.G.; Wang, L.; Wang, Y.; Zhang, X.G.; Zeng, G.M. Synthesis of fern-like Ag/AgCl/CaTiO3 plasmonic photocatalysts and their enhanced visible-light photocatalytic properties. RSC Adv. 2016, 6, 47873–47882. [Google Scholar] [CrossRef]
- ASTM E797—95 Standard Practice for Measuring Thickness by Manual Ultrasonic Pulse-Echo Contact Method; ASTM International: West Conshohocken, PA, USA, 2001.
- ASTM E214—05 Standard Practice for Immersed Ultrasonic Testing by the Reflection Method Using Pulsed Longitudinal Waves; ASTM International: West Conshohocken, PA, USA, 2007.
- Sahoo, S.; Parashar, S.K.S.; Ali, S.M. CaTiO3 nano ceramic for NTCR thermistor based sensor application. J. Adv. Ceram. 2014, 3, 117–124. [Google Scholar] [CrossRef] [Green Version]
- Cockayne, E.; Burton, B.P. Phonons and static dielectric constant in CaTiO3 from first principles. Phys. Rev. B-Condens. Matter Mater. Phys. 2000, 62, 3735–3743. [Google Scholar] [CrossRef] [Green Version]
- Janusas, T.; Urbaite, S.; Palevicius, A.; Nasiri, S.; Janusas, G. Biologically Compatible Lead-Free Piezoelectric Composite for Acoustophoresis Based Particle Manipulation Techniques. Sensors 2021, 21, 483. [Google Scholar] [CrossRef] [PubMed]
- Rabiei, M.; Palevicius, A.; Monshi, A.; Nasiri, S.; Vilkauskas, A.; Janusas, G. Comparing Methods for Calculating Nano Crystal Size of Natural Hydroxyapatite Using X-ray Diffraction. Nanomaterials 2020, 10, 1627. [Google Scholar] [CrossRef]
- Li, Y.; Thompson, R.B. Relations between elastic constants Cij and texture parameters for hexagonal materials. J. Appl. Phys. 1990, 67, 2663–2665. [Google Scholar] [CrossRef] [Green Version]
- Huntington, H.B. The Elastic Constants of Crystals. Solid State Phys.-Adv. Res. Appl. 1958, 7, 213–351. [Google Scholar]
- De Jong, M.; Chen, W.; Angsten, T.; Jain, A.; Notestine, R.; Gamst, A.; Sluiter, M.; Ande, C.K.; Van Der Zwaag, S.; Plata, J.J.; et al. Charting the complete elastic properties of inorganic crystalline compounds. Sci. Data 2015, 2, 150009. [Google Scholar] [CrossRef] [Green Version]
- Tariq, S.; Ahmed, A.; Saad, S.; Tariq, S. Structural, electronic and elastic properties of the cubic CaTiO3 under pressure: A DFT study. AIP Adv. 2015, 5, 077111. [Google Scholar] [CrossRef]
- Sakhya, A.P.; Maibam, J.; Saha, S.; Chanda, S.; Dutta, A.; Sharma, B.I.; Thapa, R.; Sinha, T. Electronic structure and elastic properties of ATiO3 (A = Ba, Sr, Ca) perovskites: A first principles study. IJPAP 2015, 53, 102–109. [Google Scholar]
- Wang, H.; Prendiville, P.L.; McDonnell, P.J.; Chang, W.V. An ultrasonic technique for the measurement of the elastic moduli of human cornea. J. Biomech. 1996, 29, 1633–1636. [Google Scholar] [CrossRef]
- Bray, D.E.; Stanley, R.K. Nondestructive Evaluation: A Tool in Design, Manufacturing and Service; CRC press: Boca Raton, FL, USA, 1996. [Google Scholar]
- Figliola, R.S.; Beasley, D.E. Theory and Design for Mechanical Measurements, 7th ed.; John Wiley & Sons: Hoboken, NJ, USA, 2019. [Google Scholar]
- Rabiei, M.; Palevicius, A.; Dashti, A.; Nasiri, S.; Monshi, A.; Vilkauskas, A.; Janusas, G. Measurement Modulus of Elasticity Related to the Atomic Density of Planes in Unit Cell of Crystal Lattices. Materials 2020, 13, 4380. [Google Scholar] [CrossRef]
- Ramírez, M.A.; Parra, R.; Reboredo, M.M.; Varela, J.A.; Castro, M.S.; Ramajo, L. Elastic modulus and hardness of CaTiO3, CaCu3Ti4O12 and CaTiO3/CaCu3Ti4O12 mixture. Mater. Lett. 2010, 64, 1226–1228. [Google Scholar] [CrossRef]
- Papaconstantopoulos, D.A.; Mehl, M.J. Tight-Binding Method in Electronic Structure. In Encyclopedia of Condensed Matter Physics; Elsevier Inc.: Amsterdam, The Netherlands, 2005; pp. 194–206. ISBN 9780123694010. [Google Scholar]
- Zhang, J.M.; Zhang, Y.; Xu, K.W.; Ji, V. Young’s modulus surface and Poisson’s ratio curve for cubic metals. J. Phys. Chem. Solids 2007, 68, 503–510. [Google Scholar] [CrossRef]
- Mason, W.P. Effect of Dislocations on Ultrasonic Wave Attenuation in Metals. Bell Syst. Tech. J. 1955, 34, 903–942. [Google Scholar] [CrossRef]
- Reed-Hill, R.E.; Abbaschian, R. PHYSICAL METALLURGY PRINCIPLES; Boston PWS Publishing Company: Boston, MA, USA, 2009; ISBN 978-0-495-08254-5. [Google Scholar]
- Berdichevsky, V. Energy of dislocation networks. Int. J. Eng. Sci. 2016, 103, 35–44. [Google Scholar] [CrossRef]
- Hull, D.; Bacon, D.J. Introduction to Dislocations, 5th ed.; Butterworth-Heinemann: Burlington, MA, USA, 2011; ISBN 9780080966724. [Google Scholar]
- Englert, U. Symmetry Relationships between Crystal Structures. Applications of Crystallographic Group Theory in Crystal Chemistry. By Ulrich Müller. Angew. Chem. Int. Ed. 2013, 52, 11973. [Google Scholar] [CrossRef]
- Duparc, O.H.; Polytechnique, É.; Duparc, O.B.M.H. A review of some elements in the history of grain boundaries, centered on Georges Friedel, the coincident “site” lattice and the twin index Crystallography History View project ANR FluTi View project A review of some elements in the history of grain boundaries, centered on Georges Friedel, the coincident “site” lattice and the twin index. Artic. J. Mater. Sci. 2011, 46, 4116–4134. [Google Scholar]


| Longitudinal Velocity (m/s) | Transverse Velocity (m/s) | Quasi Longitudinal or Quasi Transverse (m/s) |
|---|---|---|
| V1/1 = 9261.85 | V2/3 = 4960.5 | V12/12 = 4976.63 |
| V2/2 = 8013.51 | V1/2 = 4283.65 |
| Index | Planar Density of Unit Cell | Planar Density of Super Cell (2 × 2 × 2) | Planar Density of Symmetry Cells | Planar Density of Super Cell (8 × 8 × 8) | Young’s Modulus (GPa) |
|---|---|---|---|---|---|
| (100) | 0.93 | 0.93 | 0.93 in (2 × 2 × 2) | 0.93 | 290.059 |
| (110) | 0.51 | 0.51 | 0.51 in (2 × 2 × 2) | 0.51 | 221.652 |
| (111) | 0.04 | 0.04 | 0.04 in (2 × 2 × 2) | 0.04 | 179.354 |
| (200) | 0.64 | 0.64 | 0.64 in (2 × 2 × 2) | 0.64 | 290.059 |
| (210) | 0.41 | 0.41 | 0.41 in (2 × 2 × 2) | 0.41 | 194.176 |
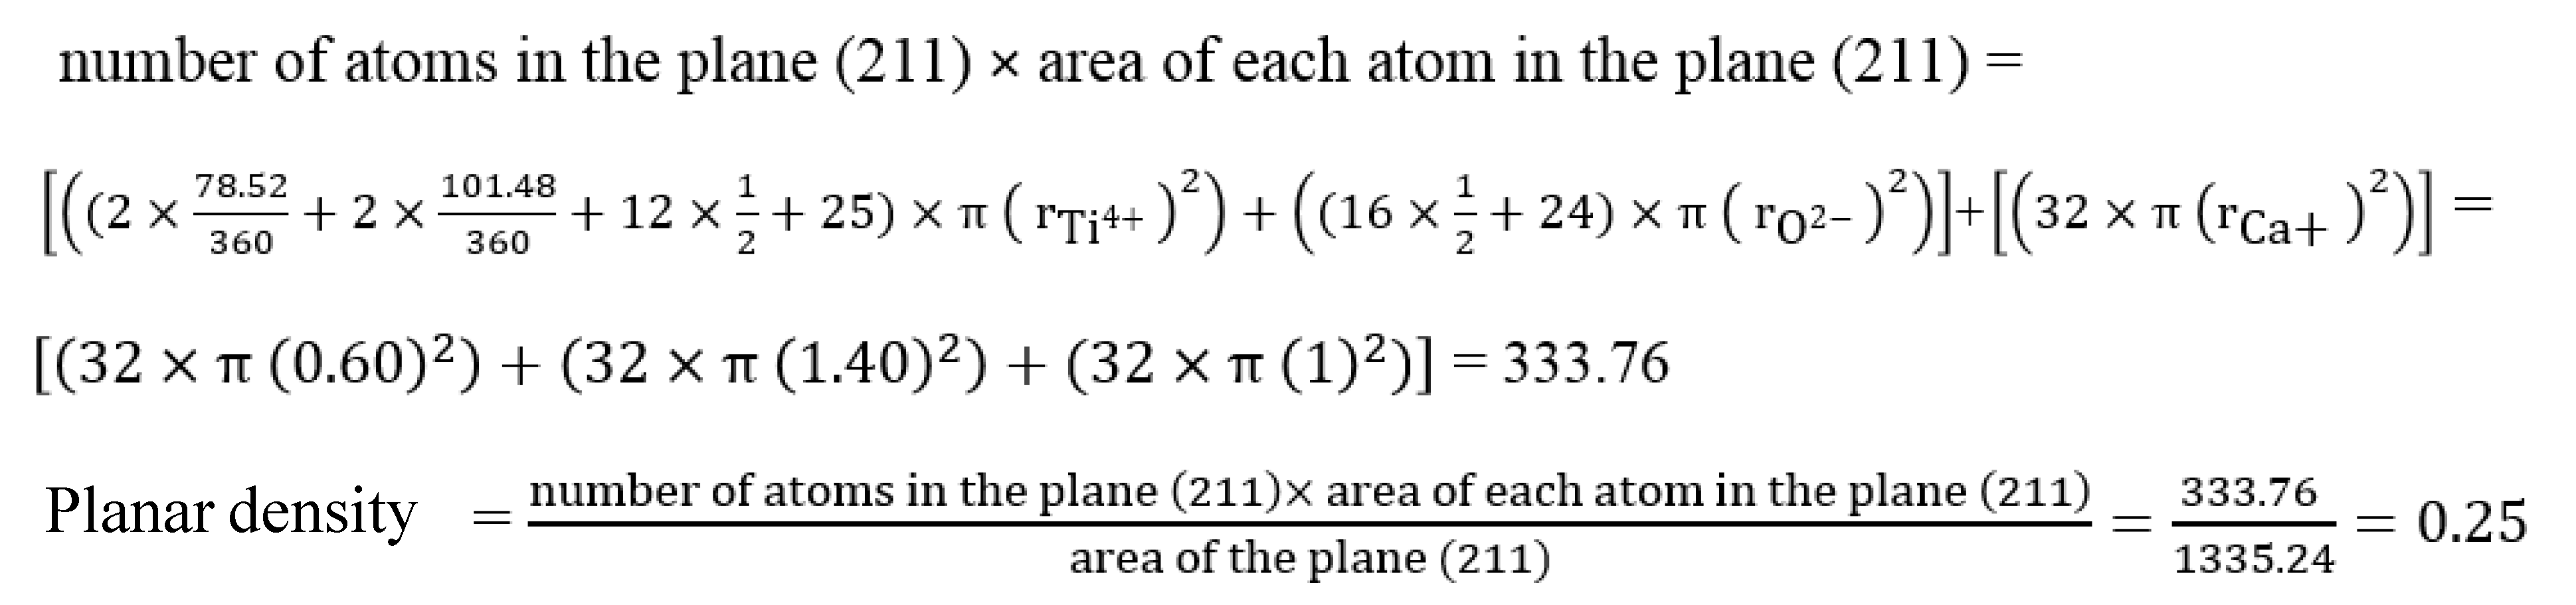
| (211) | 0.16 | 0.25 | 0.25 in (2 × 2 × 2) | 0.25 | 150.612 |
| (220) | 0.6 | 0.6 | 0.6 in (2 × 2 × 2) | 0.6 | 129.810 |
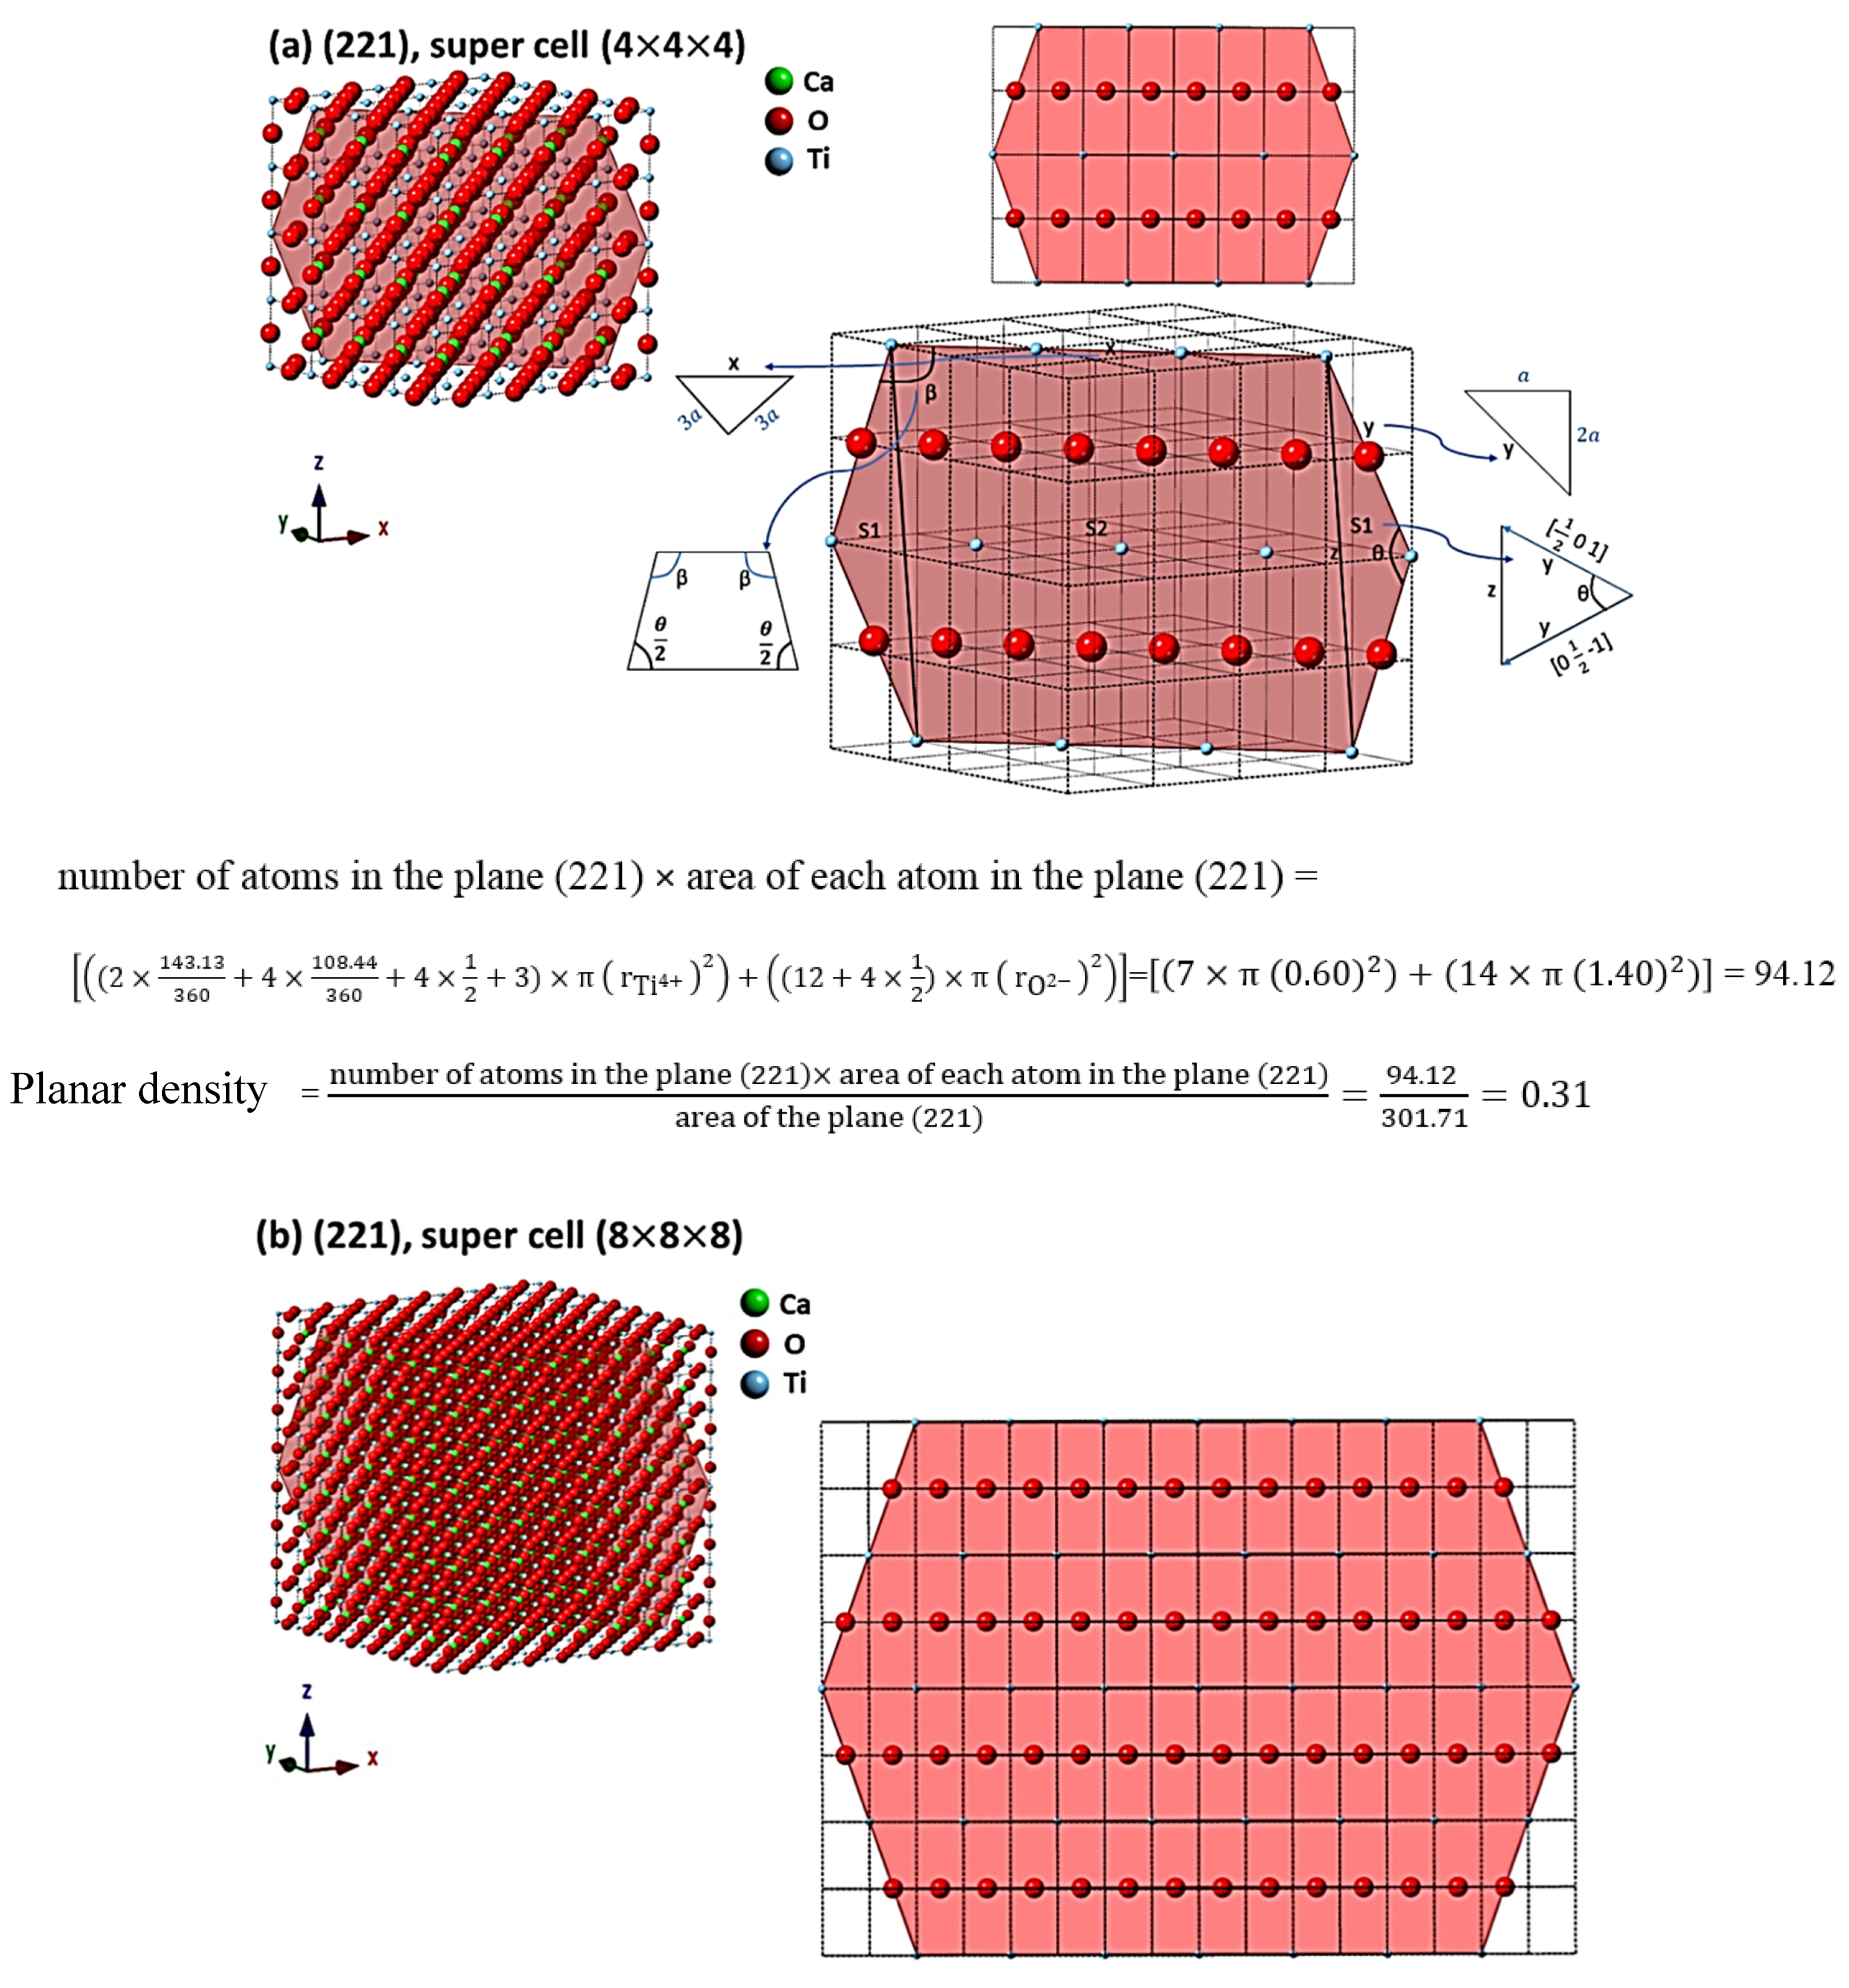
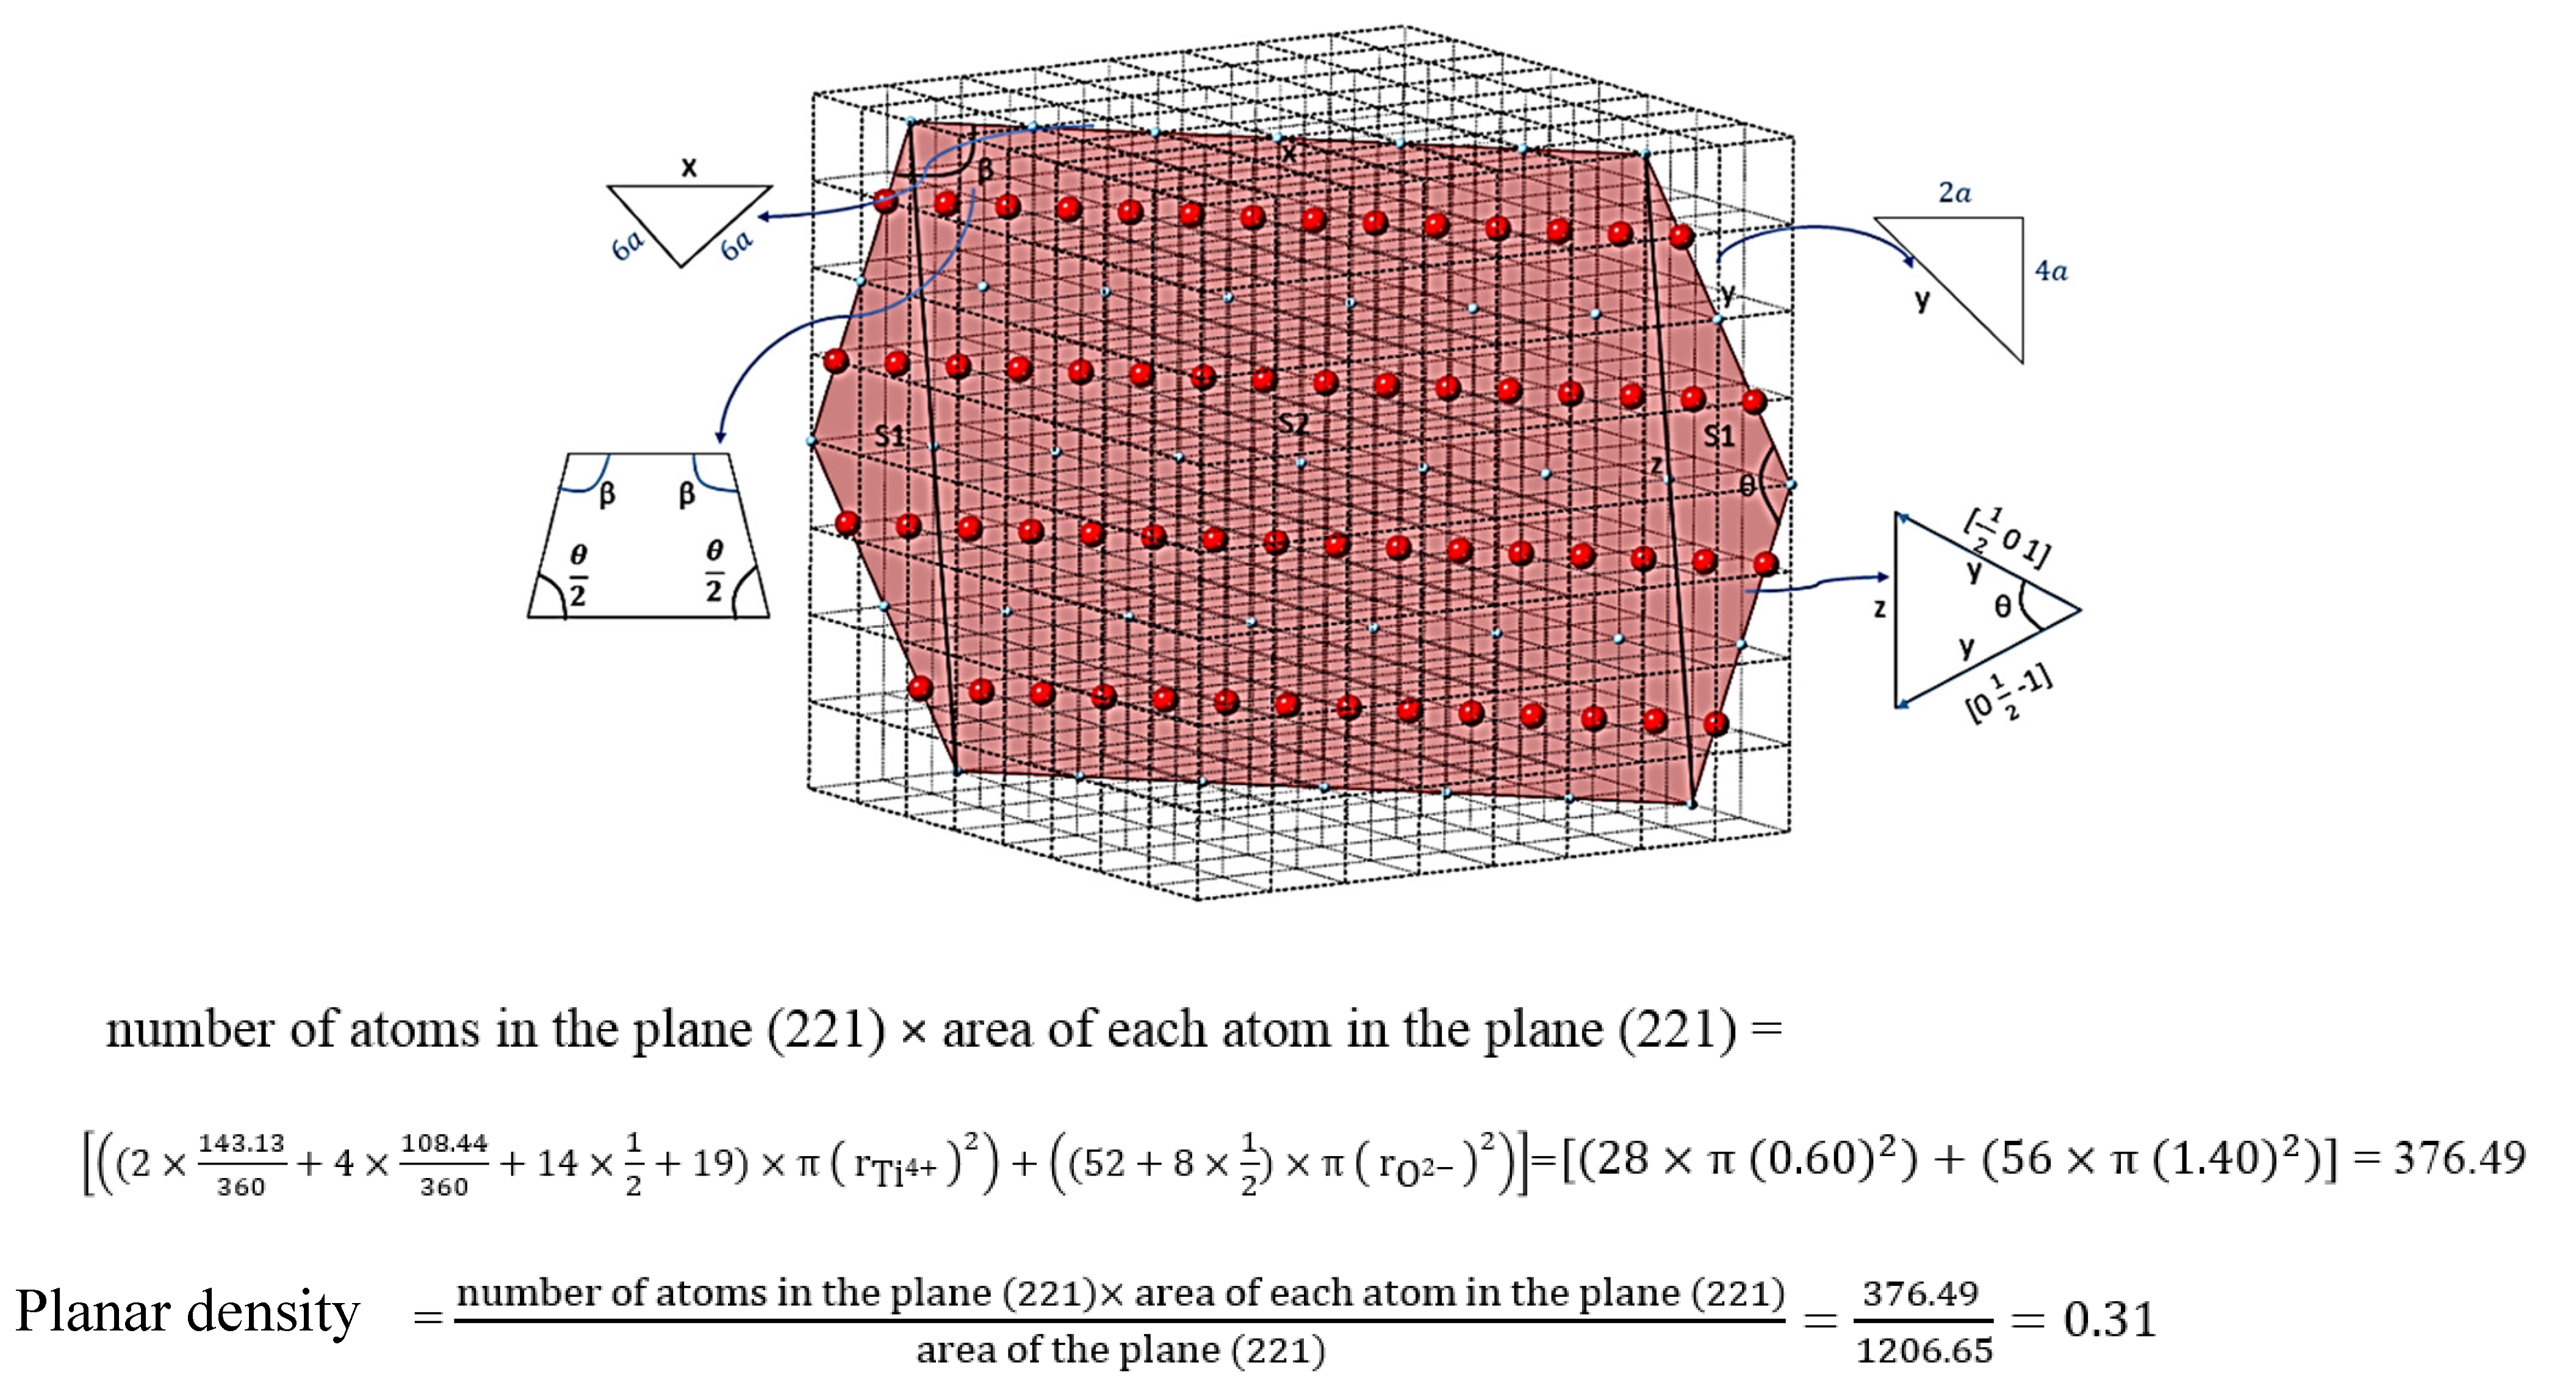
| (221) | 0.46 | 0.29 | 0.31 in (4 × 4 × 4) | 0.31 | 109.622 |
| (310) | 0.24 | 0.24 | 0.23 in (4 × 4 × 4) | 0.23 | 186.471 |
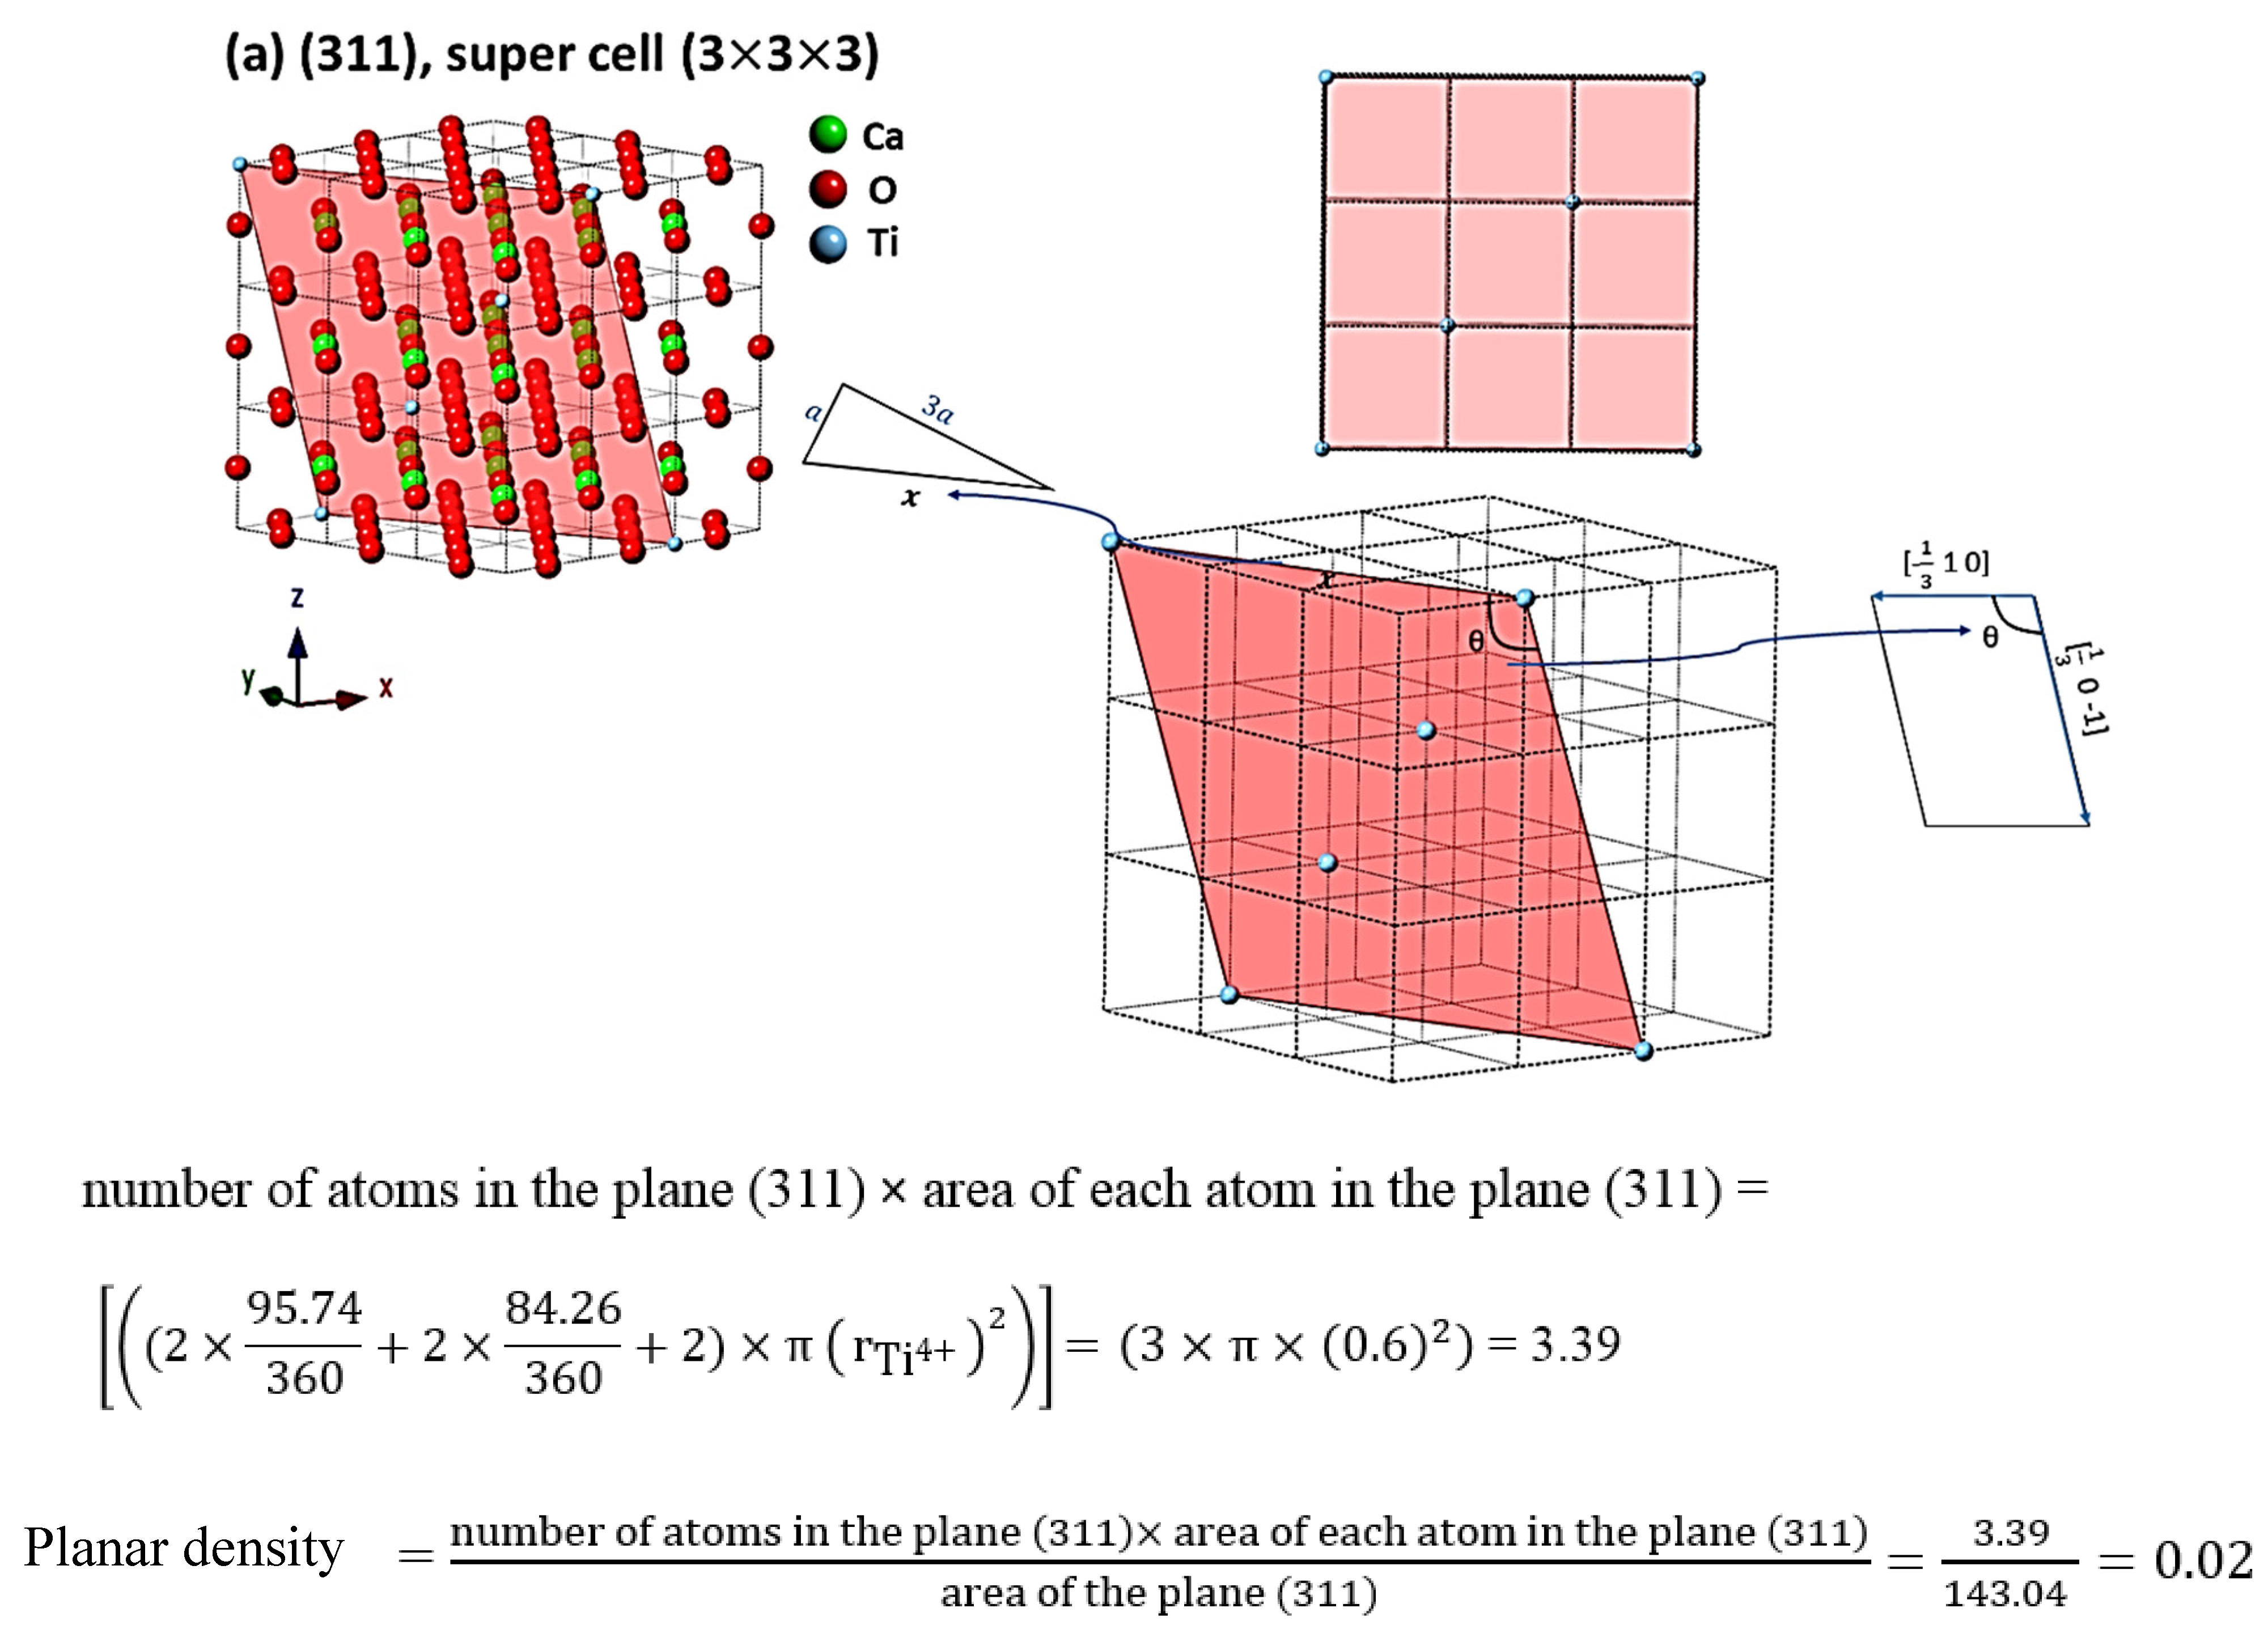
| (311) | 0.04 | 0.03 | 0.02 in (3 × 3 × 3) | 0.02 | 140.386 |
| (222) | 0.99 | 0.88 | 0.88 in (3 × 3 × 3) | 0.88 | 83.615 |
Publisher’s Note: MDPI stays neutral with regard to jurisdictional claims in published maps and institutional affiliations. |
© 2021 by the authors. Licensee MDPI, Basel, Switzerland. This article is an open access article distributed under the terms and conditions of the Creative Commons Attribution (CC BY) license (http://creativecommons.org/licenses/by/4.0/).
Share and Cite
Rabiei, M.; Palevicius, A.; Nasiri, S.; Dashti, A.; Vilkauskas, A.; Janusas, G. Relationship between Young’s Modulus and Planar Density of Unit Cell, Super Cells (2 × 2 × 2), Symmetry Cells of Perovskite (CaTiO3) Lattice. Materials 2021, 14, 1258. https://0-doi-org.brum.beds.ac.uk/10.3390/ma14051258
Rabiei M, Palevicius A, Nasiri S, Dashti A, Vilkauskas A, Janusas G. Relationship between Young’s Modulus and Planar Density of Unit Cell, Super Cells (2 × 2 × 2), Symmetry Cells of Perovskite (CaTiO3) Lattice. Materials. 2021; 14(5):1258. https://0-doi-org.brum.beds.ac.uk/10.3390/ma14051258
Chicago/Turabian StyleRabiei, Marzieh, Arvydas Palevicius, Sohrab Nasiri, Amir Dashti, Andrius Vilkauskas, and Giedrius Janusas. 2021. "Relationship between Young’s Modulus and Planar Density of Unit Cell, Super Cells (2 × 2 × 2), Symmetry Cells of Perovskite (CaTiO3) Lattice" Materials 14, no. 5: 1258. https://0-doi-org.brum.beds.ac.uk/10.3390/ma14051258