1. Introduction
The global demand for textiles is growing steadily, and looks set to continue rising [
1,
2,
3]. In 2013, the global production of textile materials was around 85.5 Mt, and by 2025 it is estimated to increase to 130 Mt [
4]. Textiles are used in a vast range of products, including clothing, bed linen, towels, and utility fabrics, which quickly become worn-out or fall out of fashion, ending up in landfills. As much as 63% of the textile fibers currently sold are derived from petrochemicals [
5] and only 37% from natural fibers—mainly cotton (24%) [
6], wool or linen. As well as direct and reactive dyes, pigments, components of printing pastes, polyacrylic coatings, and polyurethane coatings, many chemical modifiers are used to impart cotton textiles with special functions [
7,
8]. These chemicals include hydrophobic, oleophobic, and antistatic finishing agents, flame retardants, and UV radiation absorbers. Many such chemicals prevent the natural biodegradation of textiles, in part since they inhibit the growth of microorganisms (fungi, bacteria, etc.) [
9]. Therefore, textiles constitute a significant group of wastes, which are difficult to biodegrade in the natural environment. Many low-quality cotton products are unsuitable for material recycling and reuse.
A possible solution is to convert cotton textiles by chemical-biological methods into useful energy products, such as biogas or into simple sugars, such as glucose. Via chemical or biological transformations, these products can then be made into valuable chemicals such as gluconic acid [
10,
11,
12,
13] or into other products such as hydrogen, vanillin or monolayer-patched graphene [
14,
15,
16,
17]. The catalytic transformation of glucose into gluconic acid over heterogeneous catalysts is of great interest to the industry [
18,
19,
20,
21,
22,
23]. Despite considerable economic and environmental interest in the development of methods for processing waste textiles for use as fermentation media or chemical substrates, there has been little discussion of this topic in the literature [
24,
25,
26,
27]. Preliminary studies show that even fabrics based on natural fibers (cotton, wool) only but subjected to a chemical treatment are not easily biodegradable in the natural environment, due to the presence of fermentation inhibitors such as furfurals and levulinic acid [
28]. Therefore, catalytic transformation seems a better solution than biological methods to the problem of textile waste.
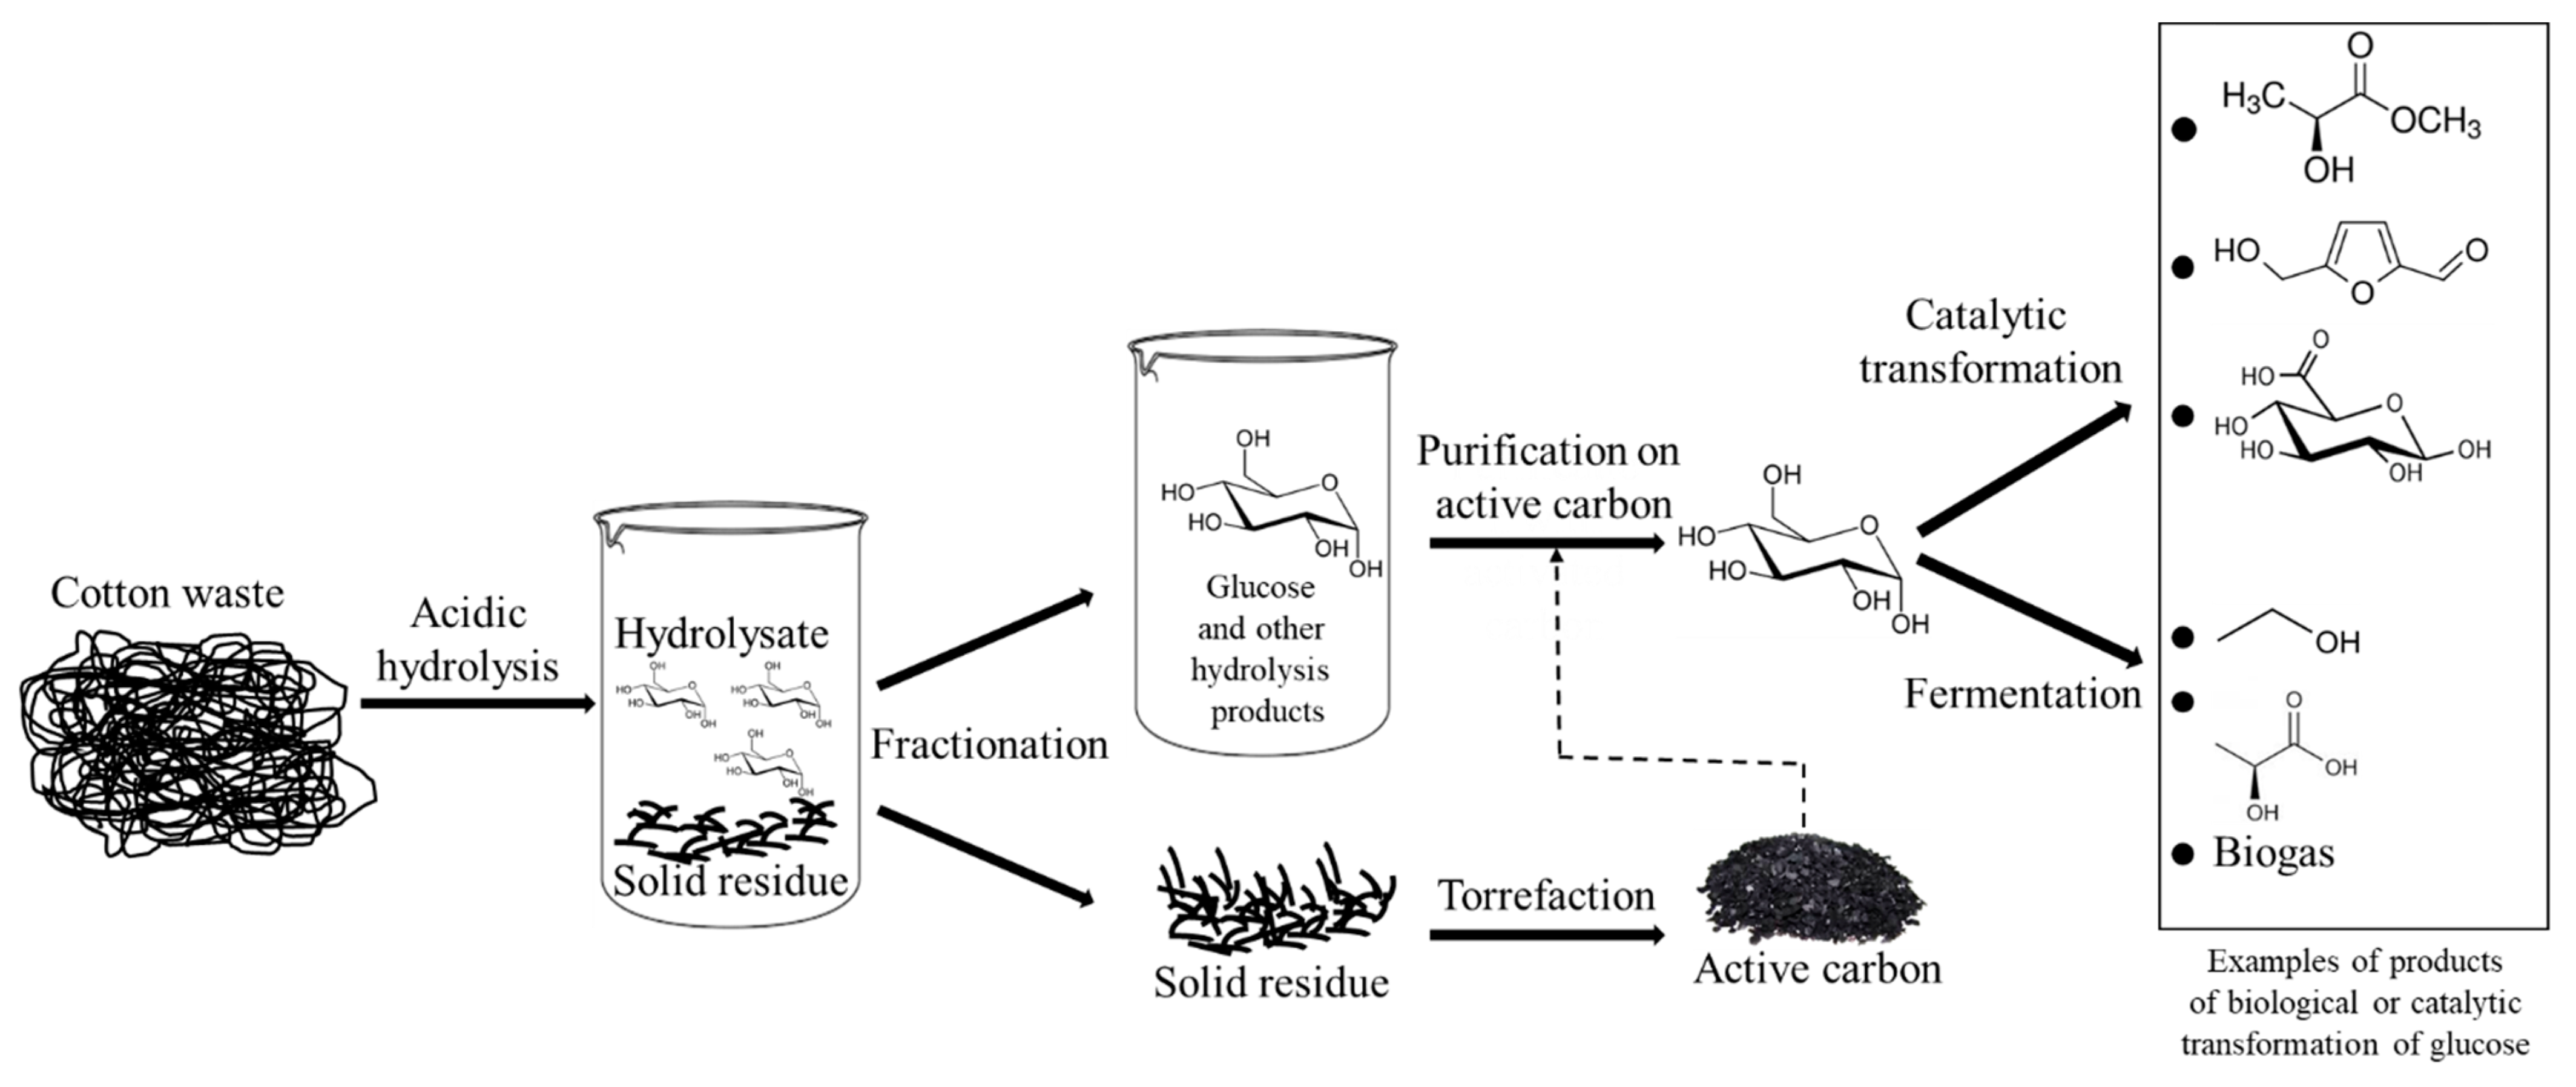
Figure 1 shows a process for treating cotton waste, including textiles with synthetic additives (polyester and polyamide). It is based on acid hydrolysis of cellulose and further biological or catalytic transformation of the glucose into useful chemical products. Only some of the products that can be obtained from glucose are indicated in the diagram. A very important product for ensuring a waste-free process is activated carbon, which can be made from the solid residues after hydrolysis of cotton waste. The activated carbon may be used in the process itself to purify the hydrolysate from fermentation inhibitors or sold as a commercial product. Research efforts at Lodz University of Technology to torrefy the solid residue of cotton fibers after hydrolysis have shown that activated carbon with a high specific surface area (>500 m
2/g) can be produced, which is capable of adsorbing the non-sugar components of hydrolysates. Lactic bacteria and yeast were successfully multiplied on hydrolysates purified on a bed of activated carbon produced from cotton waste. This research is ongoing and will be the subject of forthcoming publications.
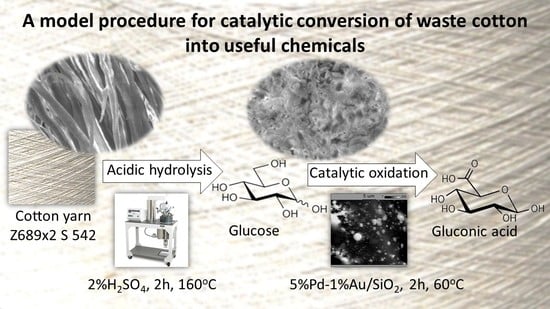
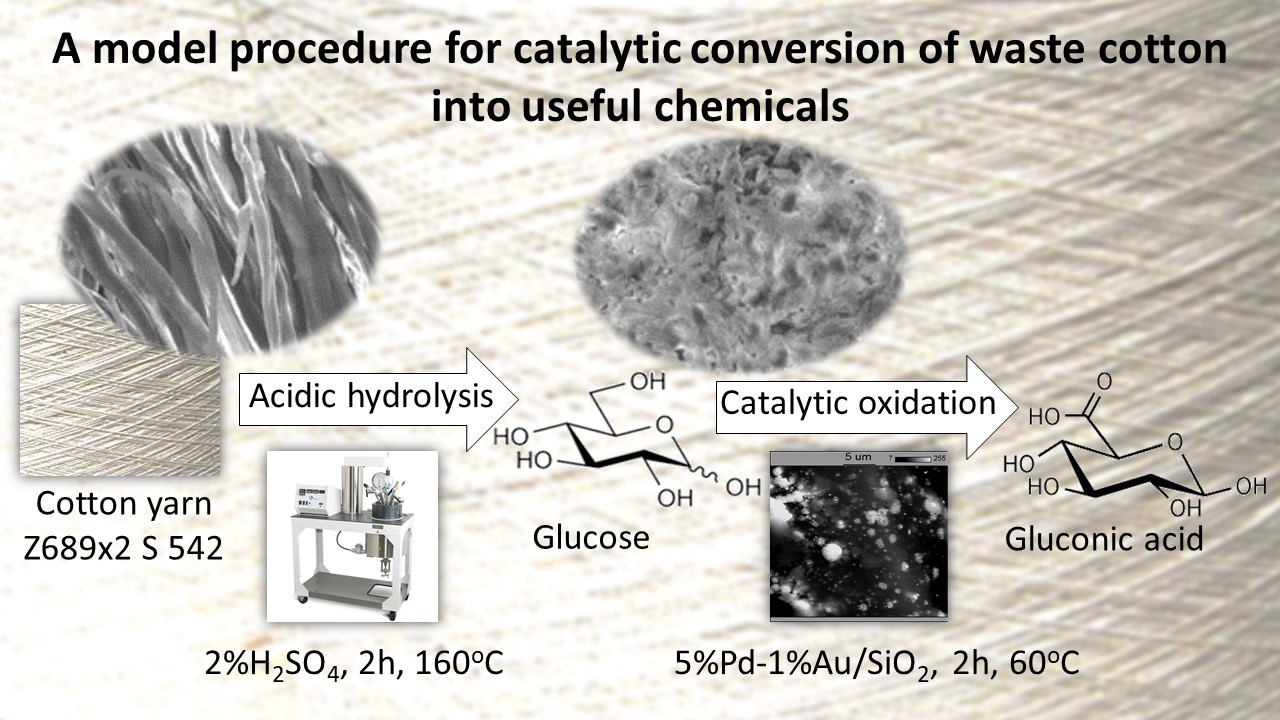
In this paper, a model procedure for thermally assisted acidic hydrolysis of cotton materials is presented and discussed. Hydrolysates obtained from raw cotton yarn were used as the substrate for the catalytic transformation of glucose into gluconic acid over Pd-Au/SiO
2 catalysts. Bimetallic palladium–gold systems were prepared at Lodz University of Technology and used initially for the hydrogenation of furfural [
29]. When it was observed that the bimetallic systems effectively catalyzed hydrogen transfer reactions, they were used for the oxidation of glucose, which occurs according to the oxidative dehydrogenation mechanism.
2. Materials and Methods
2.1. Catalyst Preparation
The PdCl2 solution (POCH S.A., Gliwice, Poland, pure for analysis) acidified to about pH 5 (HClaq, 35–38%, pure for analysis) (CHEMPUR, Piekary Slaskie, Poland) was used to prepare a 5% Pd/SiO2 catalyst by wetness impregnation of SiO2 (Sigma-Aldrich Chemie GmbH, Taufkirchen, Germany, 291 m2/g). The preparation was left in an ultrasonic bath with a frequency of 45 kHz for 24 h. The water was evaporated by heating to 60 °C under a vacuum. The catalyst was air dried at 110 °C for 6 h then reduced for 2 h at 300 °C under an H2 atmosphere (Air Products, Warsaw, Poland, Premium Plus, 99.999%, 20 cm3·min−1). A linear temperature increase of 20 °C·min−1 was set for all stages of thermal processing. The same procedure was applied to prepare a 5% Au/SiO2 (wt%) monometallic catalyst from an AuCl3 solution (POCH S.A., Gliwice, Poland, 0.21 wt% Au).
Pd-Au/SiO2 catalysts containing 5 wt% Pd and 0.2–10 wt% Au were prepared by co-impregnation of a SiO2 carrier with solutions of AuCl3 (POCH, pure, 0.21% Au) and PdCl2 (POCH, anhydrous, pure for analysis), according to the same procedure. All systems were subjected to ICP-AES (IRIS AP, Thermo Jarrel Ash, Waltham, MA, USA), XRD (PANalytical, Malvern, UK), ToF-SIMS (ToF-SIMS IV, ION-TOF GmbH, Münster, Germany), SEM-EDS (SEM S-4700, Hitachi, Tokyo, Japan; EDS, Thermo-Noran Inc., Madison, WI, USA), and XPS (VersaProbe 5000, PHI, Chanhassen, MN, USA) analysis to determine their compositions and identify metal interactions which could affect their catalytic properties in the glucose oxidation process.
2.2. Catalyst Measurements
A glucose solution (GLU, POCH S.A. Gliwice, Poland, pure for analysis; C0 GLU = 1.00 mol·dm−3; VGLU = 0.25·dm3) was oxidized in a 0.4 dm3 thermostated reactor (Parr Company, Moline, IL, USA) equipped with an O2 supply system (Air Products, Pure N 5.2 UP, 99.9992%), a stirrer, a pH electrode (Mettler-Toledo Sp. z o.o., Warsaw, Poland), and a burette containing NaOH (POCh Gliwice, Poland, pure p.a.; CNaOH 0.50 mol·dm−3). The reaction was performed at pH 9, 60 °C. In each reaction run 1 g of catalyst was used. While the mixture was being stirred at 1300 rpm, O2 was bubbled through at 0.9 dm3·min−1. Samples of the reaction medium were taken periodically for analysis. The samples were filtered and analyzed using a LaChrom liquid chromatograph (Marck-Hitachi, Tokyo, Japan) coupled to a UV–Vis detector (Marck-Hitachi, Tokyo, Japan), with an analytical wavelength of 200 nm. The reaction products were separated on a 150 × 3.3 mm ID amino-propylo-silicone column. A water solution of acetonitrile (70% ACN, 30% phosphate buffer pH 5.5) was used as a mobile phase.
A Gilson’s prepELS II detector (Gilson Company, Inc. Lewis Center, OH, USA) was used as an additional analyzer in the HPLC system (Marck-Hitachi, Tokyo, Japan). The temperature of the spray chamber was 15 °C. The temperature of the drift tube was 85 °C. With these parameters, the retention times of all the considered compounds were: tfructose = 0.988 min; tglucose = 1.425 min; tgluconic acid = 8.230 min; t2-keto-gluconic acid = 13.743 min; tguluronic acid = 15.260 min; tglucaric acid = 17.250 min, and it was possible to identify and determine the amounts of these compounds.
Catalytic results were expressed as the conversion degree (X, %) and selectivity (S, %), defined as:
where C
0 GLU is the molar concentration of glucose at the beginning of the oxidation process, C
GLU is the molar concentration of glucose over time, and C
PROD is the molar concentration of the product (fructose, gluconic acid, 2-keto-gluconic acid, guluronic acid, glucaric acid) over time.
2.3. Synthesis of Glucose from Cotton Yarn
A water solution of glucose was obtained by acidic hydrolysis (H2SO4, analytical grade, 95%, Stanlab, Lublin, Poland) of cotton yarn Z689 × 2 S 542 (linear density 58.73 ± 0.641 tex, fiber length 15–32 mm, specific strength 18.44 ± 1.089 cN/tex). Cotton yarn hydrolysis was performed in a pressure reactor (Parr Instrument Company Series Mini 4552) with a volume of 7.5 dm3 at a temperature of 120–160 °C. The start of the hydrolysis process was considered to be the moment when the reaction mixture reached the desired temperature. In each run, 100 g of comminuted cotton yarn (length > 0.5 cm) and 2.0 dm3 of a solution of H2SO4 (concentration 0.5–10%) were used. After 1–4 h, the reaction mixture was cooled in the reactor to room temperature and made alkaline by adding CaCO3 (analytical grade, POCh, Gliwice, Poland) to pH 7.5. The mixture was then filtered through a bed of activated carbon and the glucose concentration was measured by high performance liquid chromatography (HPLC) using a SYKAM HPLC system with a S1125 HPLC Pump System, S 5300 autosampler, S 4115 column thermostat, and S 3585 RI detector (Sykam GmbH, Eresing, Germany). The sugars were separated on a SETREX IEX-H+ column (300 × 8.0 mm ID) at 80 °C, using 0.008 mol·dm−3 H2SO4 + 2%(v/v%) ACN (flow 0.8 cm3 min−1) as a mobile phase. The quantitative analysis of glucose was performed based on the calibration curve for the range of glucose concentrations at 0–10 g dm−3 (the curve in the analyzed range was linear y = 0.19733 x, R2 = 0.9998803).
2.4. Analytical Techniques Used for Measurements of Bimetallic Pd-Au/SiO2 Catalysts
A PANalytical X’Pert Pro MPD diffractometer (PANalytical, Malvern, UK) equipped with a PANalytical X’Celerator detector (PANalytical) was used to acquire X-ray diffraction patterns. The operating parameters for the Cu X-ray tube source were 40 kV voltage and 30 mA current. The XRD patterns were recorded from 20 to 90° 2θ with a 0.0167° step value and a 20 s dwell time. The crystalline phase analysis was performed using the ICDD PDF−2 (version 2004) database.
The temperature programmed reduction (TPR) was performed using a flow apparatus [
30]. Prior to the analysis, 0.1 g samples of the oxidized catalyst were flushed with argon at room temperature for 0.5 h. The TPR measurements were then performed at 25–500 °C with a linear temperature increase of 20 °C·min
−1 under 5 vol% of H
2 in Ar at a flow rate of 30 cm
3·min
−1.
The secondary ion mass spectra of the bimetallic catalyst samples (formed into tablets) were recorded using a secondary ion mass spectrometer (ToF-SIMS IV, ION-TOF GmbH, Münster, Germany) coupled to a ToF-SIMS IV time of flight detector (ToF-SIMS IV, ION-TOF GmbH, Münster, Germany, liquid metal 69Ga+ ion gun). An area on the sample surface 100 × 100 µm2 in size was irradiated with 25 keV pulses of 69Ga+ ions at a 10 kHz repetition rate. The average ion current was 2.5 pA. As a result of the short analysis time (50 s), the ion dose was below the static limit of 1 × 10¹³ ions/cm2. High resolution images were recorded using either the extreme crossover mode or the burst alignment mode. The ToF-SIMS spectra of the catalyst samples were recorded with a primary ion pulse width of 650 ns, a high mass resolution (m/Δm), and 29 mass units (m.s.) normally greater than 8000.
A scanning electron microscope (SEM S-4700, Hitachi, Tokyo, Japan) equipped with an energy dispersive spectrometer (EDS, Thermo-Noran Inc., Madison, WI, USA) was used for the SEM analysis of the catalysts. Samples were embedded in conductive carbon pads and the excess loose powder was removed. To reduce electric charging, the samples were sputter coated with carbon (Cressington 208 HR system). Images were acquired in a back-scattered electron (BSE) mode. An accelerating voltage of 25 kV was used. For the purposes of comparison, the same samples were analyzed using an FEI Quanta 650 SEM (FEI Company, Hillsboro, OR, USA) equipped with a Bruker Energy Dispersive Spectroscopy (EDS) system (Bruker Corporation, Billerica, MA, USA). A 15 kV accelerating voltage, 3.5 µA electron beam current, and 10 mm working distance were used. The compositions of each sample were measured at least three times at different locations approximately 0.25 mm2 in size.
Samples were prepared by pressing the catalytic powders into high-purity carbon filled conductive tabs (PELCO Tabs™). An X-ray photoelectron spectroscope (XPS, PHI VersaProbe 5000, PHI, Chanhassen, MN, USA) was used to analyze the chemical bonding on the surface of the Pd-Au/SiO
2 catalysts. A focused monochromatic Al K-α source (E = 1486.6 eV; 100 µm spot diameter) was used to record survey and high-resolution spectra. Induced electric charge compensation was measured using a cold cathode electron flood gun and a low-energy Ar
+ ion-beam source. To avoid ion-induced surface damage, ion sputtering was not used. The recorded XPS spectra were fitted using a Multipak software package. The spectra were compared both to the NIST database (NIST Standard Reference Database 20, version 3.5) and to previously published data [
29].
2.5. Studies of Catalyst Stability in the Reaction Mixture
Gold and palladium losses from the catalysts in the reaction mixture were determined by analyzing the filtered solution by inductively coupled plasma-atomic emission spectroscopy (ICP-AES), using an IRIS AP optical emission spectrometer (IRIS AP, Thermo Jarrel Ash, Waltham, MA, USA) with horizontal observation of the plasma. A MLS–1200 Mega Microwave Digestion System (Mile-stone) was used for complete digestion of the samples prior to the ICP-AES analysis.
3. Results
In the previous research, we examined the catalytic properties of monometallic Pd/SiO2 catalysts (0.5–10% by weight of Pd). It was observed that the amount of gluconic acid produced in the reaction increased with the percentage content of palladium. The highest selectivity was shown by the samples containing 5–10 wt% Pd/SiO2. These catalysts had practically the same selectivity. Therefore, adding more than 5 wt% of palladium into catalytic systems appears to be of no advantage from either an economic or practical point of view. Commercial catalysts recommended by manufacturers for use in liquid phase oxidation processes (e.g., Degussa catalyst) also contain about 5 wt% active metal, which means that the catalytic properties of the catalysts obtained in this study are comparable with commercial catalysts.
Figure 2 shows the dependence of conversion and selectivity towards gluconic ions on the time of glucose oxidation over palladium-gold (Pd-Au) catalysts on silica. A 1 mol·dm
−3 solution of pure commercial glucose in water was used as a substrate. Monometallic catalysts (5% Pd/SiO
2 and 5% Au/SiO
2) showed rather poor activity. In general, the addition of gold to the 5% Pd/SiO
2 systems caused an increase in the conversion degree of glucose. The addition of only a small amount of gold to the palladium catalysts (0.2–1 wt%) had a significant effect on the activity of the catalyst. However, in the case of 5% Pd-2% Au/SiO
2 and 5% Pd-5% Au/SiO
2 compared to monometallic catalysts, the increase in activity was lower than that in the bimetallic systems with lower amounts of gold. Therefore, amounts of gold higher than 1 wt% are counterproductive in Pd-Au/SiO
2 catalysts.
All the studied bimetallic catalysts were characterized by high selectivity towards gluconic ions. In all cases, the selectivity of the Pd-Au/SiO2 systems was comparable or even higher than in the case of the commercial Degussa catalyst (1% Pt-4% Pd-5% Bi/C).
To understand the role of the Pd-Au/SiO
2 systems in the oxidation of glucose into gluconic acid in aqueous phase, the catalysts were analyzed using scanning electron microscopy (SEM), time-of-flight secondary ion mass spectroscopy (ToF-SIMS), X-ray diffraction (XRD), energy-dispersive x-ray spectroscopy (SEM-EDS), x-ray photoelectron spectroscopy (XPS), and temperature programmed reduction (TPR). Detailed results of these physicochemical tests are given in [
29].
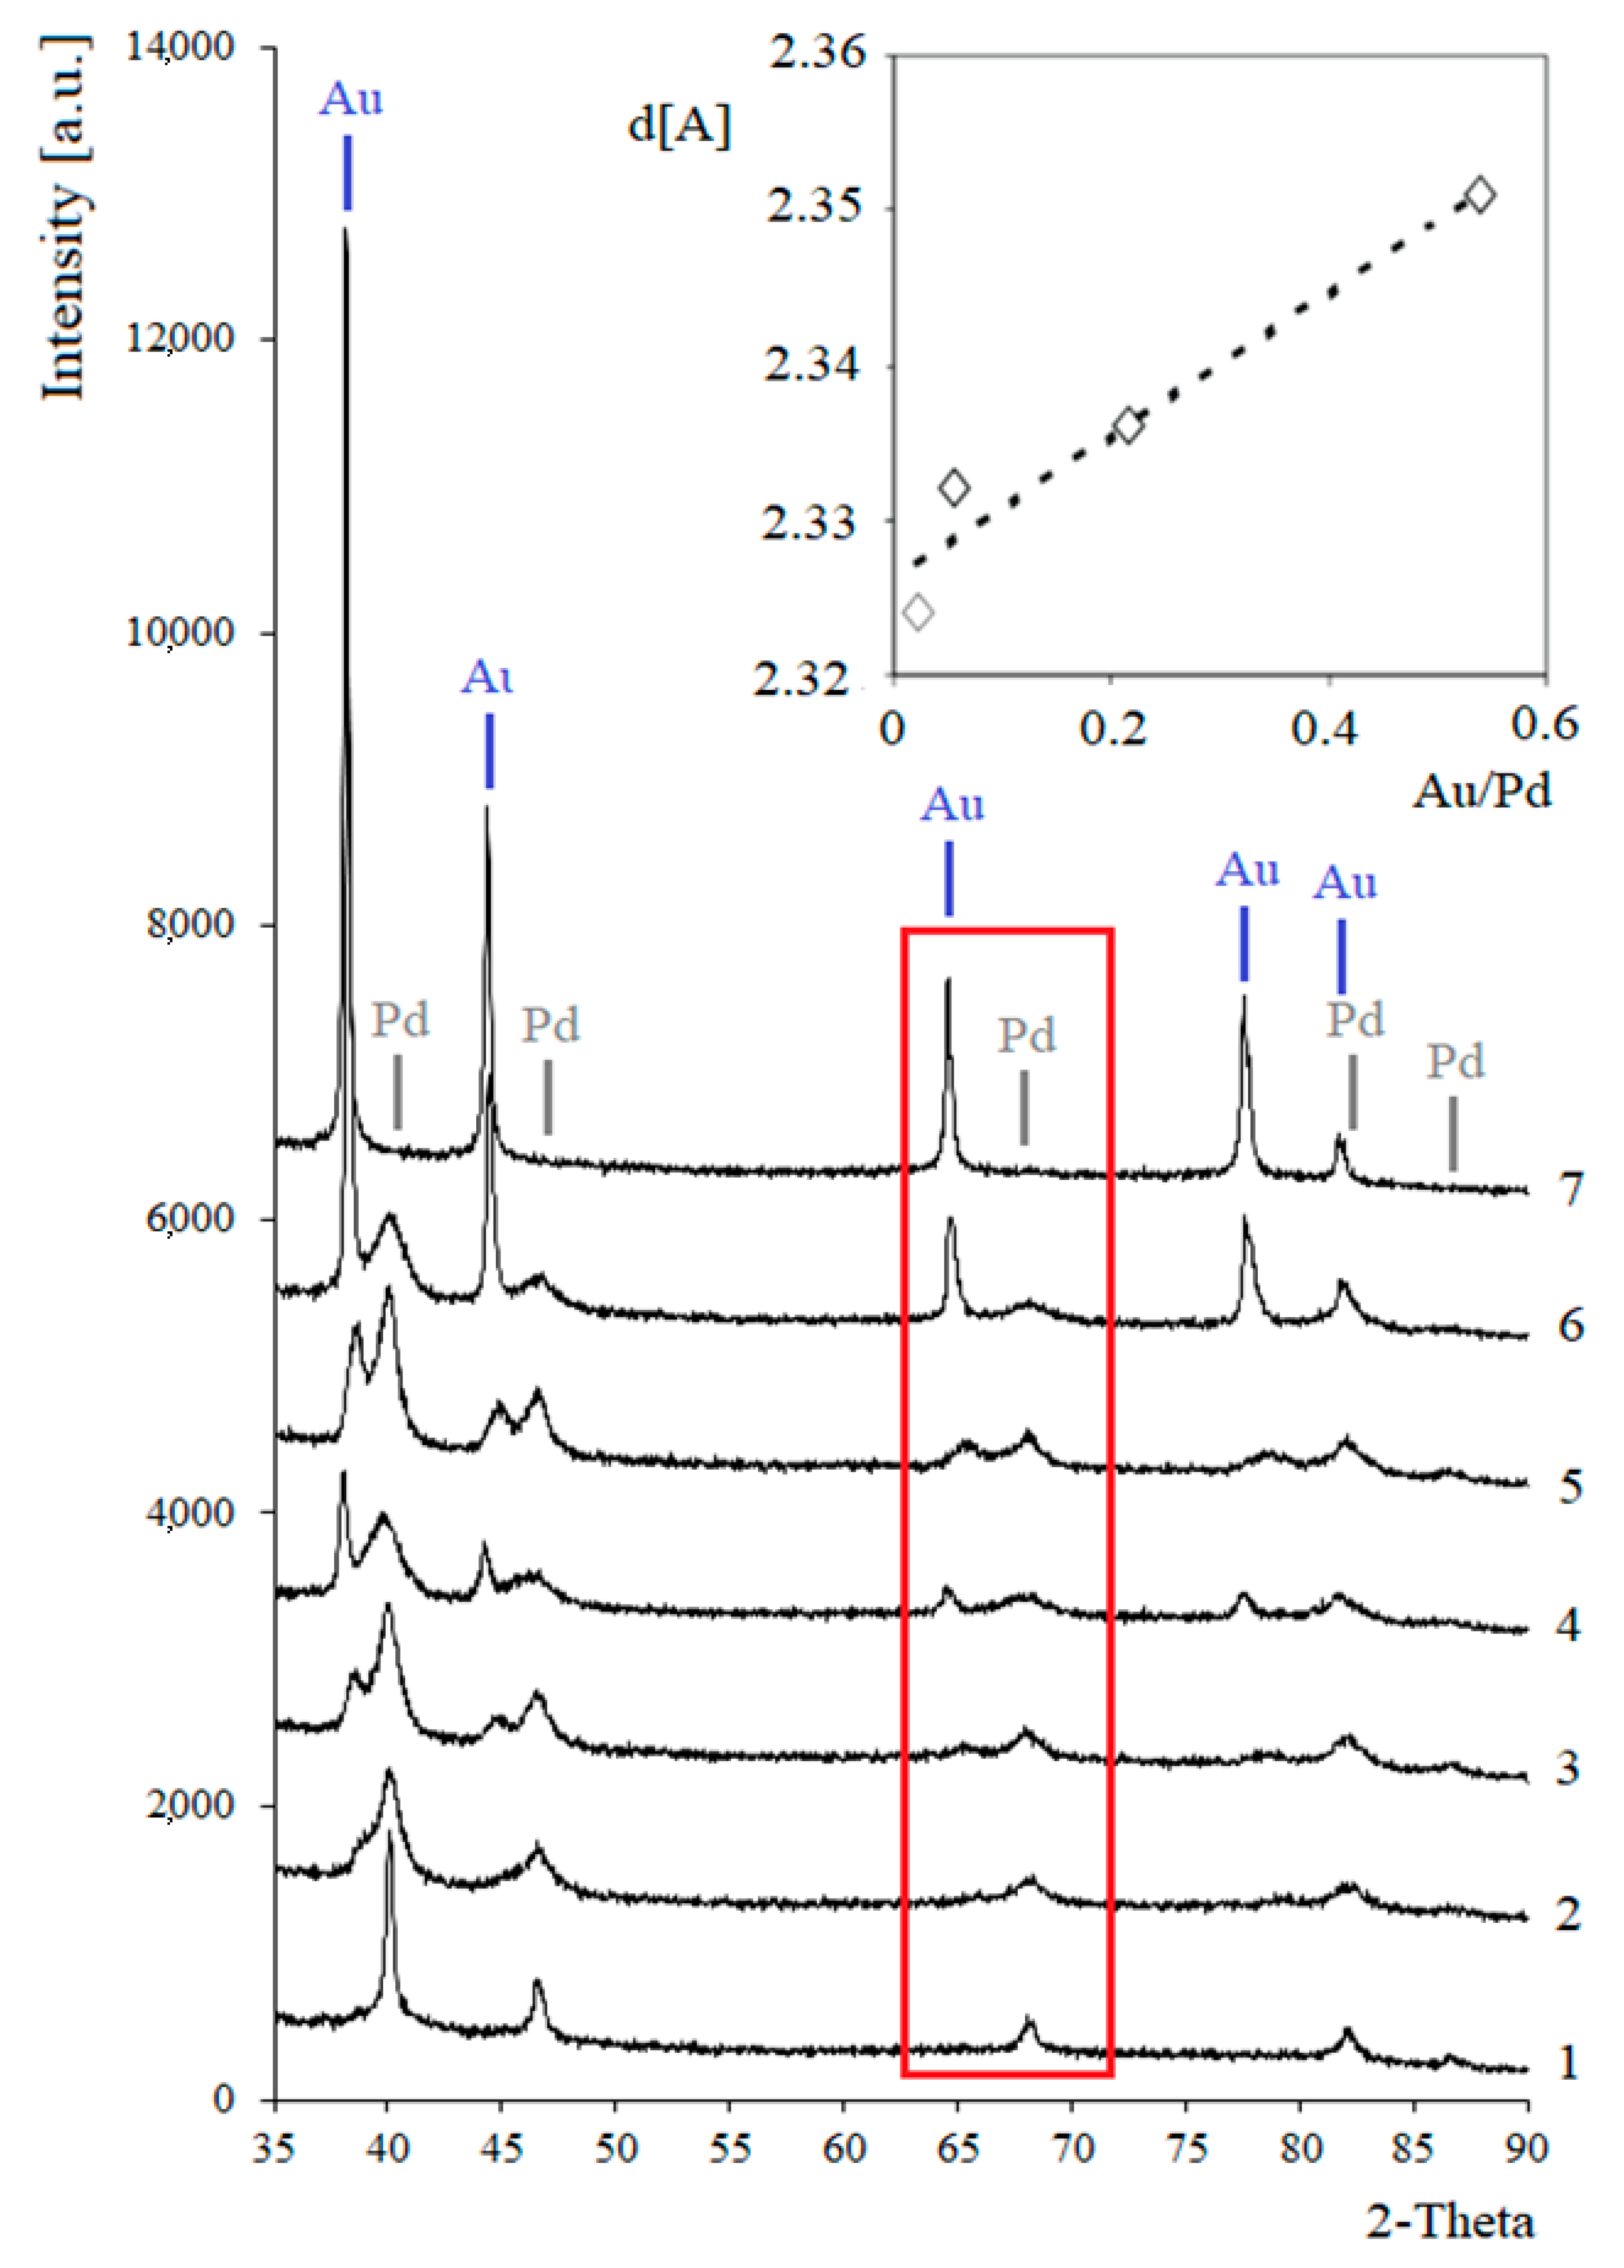
The XRD patterns show the maxima assigned to the metallic Pd phase (
Figure 3). The introduction of gold into the monometallic system was associated with the appearance of additional maxima on the diffraction patterns. The positions of the maxima shifted towards smaller values of the angle 2θ. The positions of the maxima in the diffractogram of the 5% Pd-5% Au/SiO
2 catalyst are close to the maxima corresponding to the gold phase. These results indicate the possible formation of solid solutions. In the case of the Pd-Au/SiO
2 systems activated in a hydrogen atmosphere at 300 °C, confirmation of the formation of solid solutions is given by the linear relationship between the interplanar distances as a function of the alloy composition, according to Vegard’s rule. No additional diffraction maxima were found in the diffraction patterns of the bimetallic systems, but only the maxima for the metallic Pd and Au phases. This indicates a lack of strong interactions between these metals, which would be manifested by the formation of intermetallic compounds. The results of the XRD tests were confirmed by XPS and TRR tests [
29].
The addition of a larger amount of gold (>2 wt%) led to an increase in the intensity of the sharper diffraction peaks attributed to gold metal, which is evidence of the existence of larger Au crystallites on the surface of the bimetallic catalysts. Using the Scherrer equation, the average sizes of the palladium and gold crystallites were estimated. The results shown in
Table 1 reveal that the palladium dispersion was greater in the case of bimetallic systems than for the monometallic 5% Pd/SiO
2 catalyst. Better Pd dispersion in the bimetallic systems may explain their higher activity and selectivity for gluconic acid. Moreover, the smallest Au crystallites formed on the 5% Pd-1% Au/SiO
2 catalyst. It is well known that the catalytic properties of gold strongly depend on the size of the gold particles [
31]. Data in the literature show that monometallic gold carrier systems are catalytically active in the process of glucose oxidation when the Au particle size is less than 10 nm [
32]. In the case of the 5% Pd-1% Au/SiO
2 catalyst, the estimated Au particle size was 8 nm. This catalyst also showed good catalytic properties for the oxidation of glucose to gluconic acid. Therefore, it cannot be ruled out that gold contributed to the increase in catalytic activity.
Images obtained by ToF-SIMS of the Pd-Au/SiO
2 catalysts showed a nonhomogeneous distribution of Au on the silica surface [
29]. The bimetallic catalysts tended to form Au-enriched regions, which increased in size as more gold was introduced into the system. The distribution of the Pd fraction was better in the case of the bimetallic systems than in that of the monometallic catalyst 5% Pd/SiO
2. Moreover, the calculated relative intensities of the Au
3/Pd peaks revealed that the number of surface gold atoms was highest in the case of the 5% Pd-1% Au/SiO
2 system, which also showed the highest activity in the glucose oxidation reaction. This result also indicates good dispersion of Pd. On the other hand, the comparable intensities of the Pd peaks obtained for the bimetallic Pd-Au catalysts suggest that these systems had similar numbers of surface palladium atoms (
Table 2). It can be concluded that in the case of all the tested Pd-Au/SiO
2 catalysts the Pd atoms were similarly distributed on the support surfaces. These results of ToF-SIMS tests are in good agreement with those obtained with the XRD technique.
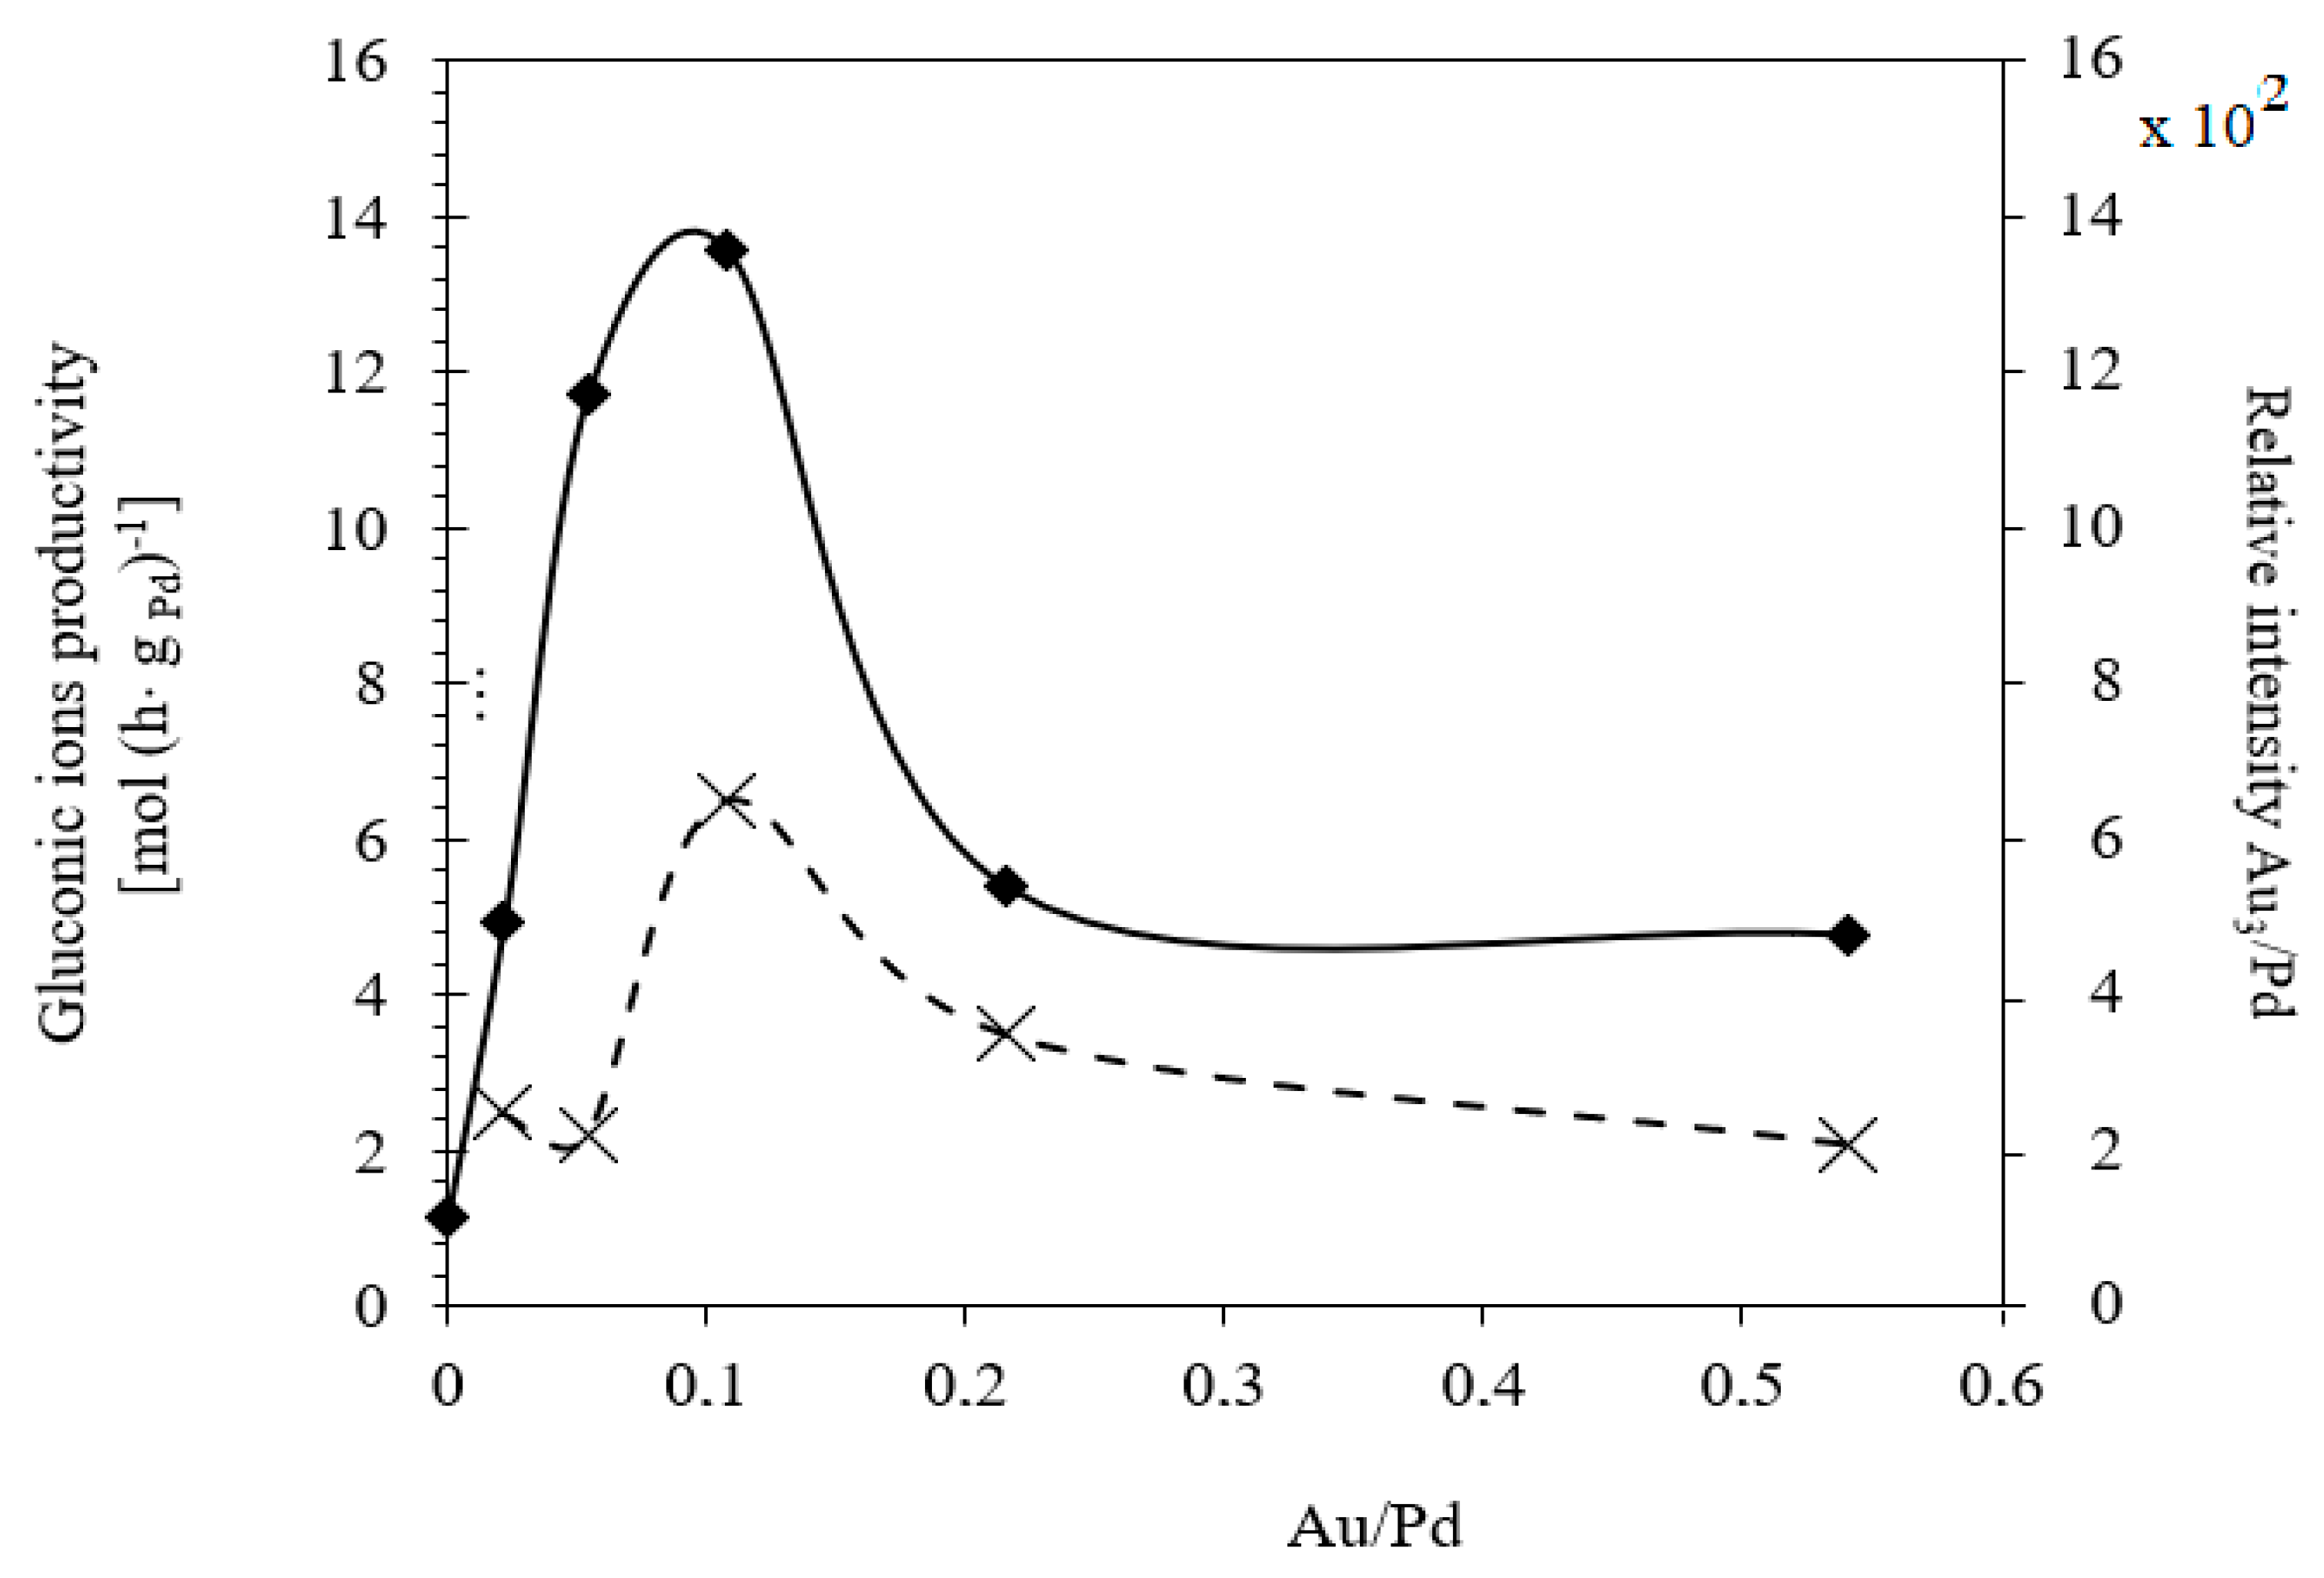
Figure 4 shows the dependence of the relative intensities of Au
3/Pd as a function of the Au/Pd atomic ratio in bimetallic catalysts. As can be seen, the largest number of Au atoms was measured on the catalyst surface of the 5% Pd-1% Au/SiO
2 system. This catalyst also showed the highest rate of gluconic acid formation. Thus, it can be assumed that the presence of both metals on the support may be responsible for the activity of the bimetallic system. Confirmation of good gold dispersion on the 5% Pd-1% Au/SiO
2 bimetallic system was also provided by previously conducted microscopic examinations (SEM-EDX) and CO chemisorption measurements [
29].
Gluconate ions are good chelates for metal ions. Therefore, we studied the degree of leaching of Pd and Au ions from the catalysts during the glucose oxidation process. The results of inductively coupled plasma-atomic emission spectroscopy (ICP-AES) test performed on real solutions after glucose oxidation processes are presented in
Table 3. In the case of the Pd-Au/SiO
2 catalysts, leaching of Pd only was observed. The amount of Pd lost was comparable for all bimetallic catalysts. Gold was not detected in the reaction mixture when the process was conducted over bimetallic Pd-Au/SiO
2 catalysts. However, in the case of monometallic 5% Au/SiO
2 catalysts the presence of a trace amount of gold was confirmed by ICP-AES measurements.
The application of catalysts in technological processes is economically feasible and justifiable only when they show long-term stability. For this reason, the stability of the 5% Pd-1% Au/SiO
2 catalyst, which provided the best gluconic acid productivity during the reaction of glucose oxidation in liquid phase, was investigated (
Table 4). The stability of the catalyst was estimated based on activity changes during 10 measurement cycles lasting 2 h each. The process of oxidation was conducted for a steady amount of catalyst (m
cat = 1 g), which was not removed from the reaction mixture in the subsequent cycles. After each measurement cycle, the reaction mixture was decanted and examined by HPLC and ICP-AES. A fresh charge of glucose solution (V = 0.25 dm
3, C
0 = 1 mol·dm
−3) was then introduced into the reactor. The bimetallic 5% Pd-1% Au/SiO
2 system was characterized by high stability in the reaction. After 10 reaction cycles, the activity and selectivity of this catalyst were practically the same as their original values. Additionally, ICP-AES measurements of the reaction mixture executed after each cycle proved the good stability of the bimetallic systems under the reaction conditions. Only a trace amount of palladium was detected in the reaction mixture after each cycle (
Table 3). This high stability of the 5% Pd-1% Au/SiO
2 system in the oxidation of glucose is an advantage for industrial applications.
Cotton fibers consist almost entirely of cellulose (94–100%) and cotton hydrolysis therefore leads to glucose as a main product. Acidic hydrolysis of the cotton yarn was performed in a pressure reactor. Prior to HPLC analysis, samples of the hydrolysates were neutralized with milk of lime to pH 7.5, filtered through a bed of activated carbon (ERCARBON GE, 100 g), and deposited on a vacuum filter. Based on the data collected in
Table 5, it can be seen that an increase in the hydrolysis temperature from 80 to 160 °C, together with an increase in the process time from 1 to 4 h, favors the depolymerization of cellulose and the formation of larger amounts of glucose. However, analysis of the mass spectra using GC-MS techniques revealed the presence of (4.970) furfural and (8.558) 2-furanocarboxaldehyde, 5-methyl- in the sample of the hydrolysate obtained at 120 °C. Increasing the temperature up to 160 °C led to the creation of products in addition to furfural and 2-furanocarboxaldehyde, 5-methyl-: (7.885) 2(5H)-furanone, 5-methyl- and (12.438) levulinic acid. On the other hand, raising the concentration of sulfuric acid (VI), which catalyzes the hydrolysis of polysaccharides, to more than 5% did not cause further increases in the concentration of sugar in the hydrolysates. The SEM images of the solid residue after hydrolysis of the cotton fibers clearly show that the most significant change in the morphology of the fibers occurred when the process was carried out at a high temperature (160 °C). The highest concentration of glucose was also noted in this sample (0.02 mol/dm
3). For this reason, the hydrolyzate obtained by the reaction of 100 g of cotton fiber with 2 dm
3 of 2% H
2SO
4 at a temperature of 160 °C for 2 h was selected for further catalytic tests.
The degree of crystallinity of cellulose was analyzed for cotton fibers and for the solid cotton residues after hydrolysis. A simplified method (Segal peak height method) was used to estimate the crystallinity of cellulose. The results tended to overestimate the degree of crystallinity, although the relative changes in the values for crystallinity enabled a comparative analysis of the results, which are summarized in
Table 5. Increases in the degree of crystallinity of cellulose indicate more effective depolymerization of amorphous cellulose in the samples.
The hydrolysate obtained from the reaction of 100 g of cotton fiber with 2 dm
3 of 2% H
2SO
4 at 160 °C for 2 h was used as a substrate in catalytic tests. The results of glucose oxidation are presented in
Table 6. Catalytic reactions were performed over 5% Pd-1% Au/SiO
2 catalyst with three concentrations of glucose (the hydrolysate was concentrated two and four times by evaporating the solvent at 60 °C). The catalyst was used in amounts corresponding to the catalyst loading in glucose solutions of 1 mol·dm
−3 (
Table 1, m
cat = 1 g, C
0 GLU = 1 mol·dm
−3, V
GLU = 0.25 dm
3).
The results confirmed the possibility of chemically processing cotton waste into sodium gluconate.
4. Discussion
The addition of a second metal (Bi, Tl, Sn, Pb, Ag) to supported palladium systems is a recognized way of modifying their catalytic properties, especially selectivity, for the oxidation of aldoses (glucose, lactose) to aldonic acids (gluconic acid, lactobionic acid) [
19,
20,
21,
22,
23]. However, the principles behind such modifications are still a matter of discussion in the literature [
19,
20,
21,
22,
23]. Some authors have tried to define the mechanism by which gold acts as a metallic promoter of palladium-based supported catalysts [
33,
34,
35,
36]. Enache et al. [
33] suggested that Au acts as an electronic promoter for Pd in the oxidation of primary alcohols to aldehydes, so the electronic effect is dominant. On the other hand, Roudgar et al. [
34] argued that geometric effects were more important than electronic effects, when they used Pd-Au film to promote the synthesis of vinyl acetate. In turn, Baddeley et al. [
35] and Gleich et al. [
36] suggested that the formation of surface ensembles of Pd
xAu
y plays an essential role in improving reactivity.
Previous studies have indicated that glucose oxidation is sensitive to the structure of the bi-metallic catalyst [
18,
19,
20,
21,
22,
23]. For this reason, the ratio of Pd atoms to Au atoms in the Pd-Au/SiO
2 bimetallic catalyst can significantly impact its catalytic properties. Among the studied catalysts with Au/Pd atomic ratios in the range of 0.0–0.55 [
29], the system with an Au/Pd atomic ratio of about 0.1 (determined for the 5% Pd-1% Au/SiO2 catalyst) showed the best activity and the highest selectivity to gluconic acid. On the basis of XRD, ToF-SIMS, and previous SEM-EDS and XPS [
29] studies, it was concluded that in this system these metals had the highest dispersion on the support and were also in direct contact, which explains the high selectivity of this catalyst. The addition of gold to Pd/SiO
2 catalysts led to the stabilization of small Pd particles, and to the formation a Pd-Au alloy (the composition of which strongly depended on the Au/Pd atomic ratio). Despite the fact that gluconic acid has been shown to strongly adsorb on the surface of palladium, the bimetallic 5% Pd–1% Au/SiO
2 catalyst was stable under the reaction conditions. Even after 10 reaction cycles, we observed high activity and selectivity towards gluconic acid. Thus, the addition of gold can prevent Pd poisoning, as well as improve the activity, selectivity, and stability of supported palladium systems.
The research presented in this publication is a part of a larger project, which includes the development of a procedure for temperature-assisted acid hydrolysis of cotton waste and further conversion of the obtained sugars into chemical and biotechnological products. In future work, we will present a concept for acidic hydrolysis of cotton waste to sugars, which can be converted via biological processes into fuels, especially biogas rich in hydrogen. Other studies in the literature have demonstrated that cotton waste can be used for the production of ethanol, but most often the first stage is enzymatic hydrolysis of the raw material [
37,
38,
39]. This type of hydrolysis may be effective, but it is expensive due to the high cost of enzymes. For this reason, attempts have been made to employ the cheaper method of acidic hydrolysis. Various hydrolysis strategies are available, but some of the most widely used involve treatment with either concentrated or diluted acids. Diluted acids require high temperatures [
40,
41,
42,
43]. Since methods for acid hydrolysis of textile waste have not been implemented commercially and the results published in the literature most often concern only acidic hydrolysis of pure cellulose, rather than cotton or textile wastes, it is necessary to perform basic laboratory tests to establish the conditions for acidic hydrolysis of well-defined textile samples and the compositions of the hydrolysates. The biological investigations currently underway will enable a precise characterization of the fermentation inhibitors present in the fabric hydrolysates. This will enable the composition and finishing of fabrics to be correlated to the composition of the hydrolysates. A model will then be elaborated for treating textile waste so it can be used as a medium in biogas installations.
5. Conclusions
The transformation of organic waste into valuable chemical substances has attracted much interest, due to its great practical and commercial potential. One such transformation is the oxidation of sugars to sugar acids. Currently, the process of glucose oxidation is carried out biotechnologically with the use of Aspargilus Niger and Gluconobacter suboxydans. However, it is difficult to separate the product and remove the resulting wastewater. In order to reduce production costs, minimize the amount of waste, and simplify the technologies used, the whole process could be carried out using heterogeneous catalytic systems with the highest possible selectivities. The catalysts should be easily separable from the product, nontoxic, and resistant to deactivation. Monometallic systems have been tested in which the active phase is Pt, Pd or Au. Supported gold catalysts have the best properties, however, the preparation of systems with a high dispersion of gold requires the use of special preparative techniques. Such catalysts, despite their satisfactory activity and selectivity, are still characterized by insufficient stability during the glucose oxidation process. Similarly, the industrial application of supported polymetallic catalysts, e.g., Pd-Bi, Pd-Tl, Pd-Pb, is limited by the elution of metallic components into the reaction solution and thus their low stability.
In this publication, Pd-Au/SiO2 catalysts with different metal loadings were tested for the selective oxidation of glucose. The introduction of gold into the 5% Pd/SiO2 system led to an improvement in its catalytic properties, especially its selectivity towards gluconic acid. The activity of the bimetallic catalysts strongly depended on the metal ratio. The highest activity and selectivity towards gluconic acid was obtained for the systems in which the Au/Pd atomic ratio was in the range of 0.05–0.15. We also investigated the long-term stability of the 5% Pd-1% Au/SiO2 catalyst. The examined catalyst was successfully used in 10 runs with no observable decrease in activity. The 5% Pd-1% Au/SiO2 catalyst showed very high selectivity in each of the 10 runs. The stability data for the Pd-Au/SiO2 catalysts presented in this publication are promising, but in order for these catalysts to be used in industrial applications they require even longer stability tests.
The studied Pd-Au/SiO2 bimetallic catalysts were also found to be active in the oxidation of glucose produced from cotton waste under the conditions of pressure and temperature-assisted acidic hydrolysis. Gluconic acid was the only reaction product observed in the hydrolysates. Such gluconate-containing products made of cotton waste could be used in surface cleaning fluids or after purification, as intermediates in the cosmetics industry.
Analysis of XRD, ToF-SIMS, SEM-EDS, and TPR data suggested several possible ways in which Au may influence catalytic performance. The addition of gold caused a significant increase in Pd dispersion compared to the monometallic 5% Pd/SiO2 system. At the same time, it seems to have led to the stabilization of small palladium crystallites. The bimetallic Pd-Au/SiO2 systems, in which the dispersion of both metallic components was the highest, were characterized by high activity and selectivity towards gluconic acid. The XRD study revealed changes in the crystalline structure of the gold in the bimetallic catalysts, caused by the incorporation of palladium atoms into the crystalline structure of gold. The composition of the formed solid solution depended on the Au/Pd ratio in the bimetallic systems. Analysis of the surfaces of the bimetallic Pd-Au/SiO2 catalysts using ToF-SIMS and SEM-EDS techniques, revealed the presence of regions in which both palladium and gold atoms were present. The modification of the electronic and geometric properties of Pd nanocrystals due to their alloying with gold may be an alternative explanation for the better activity and selectivity towards gluconic acid of the Pd-Au/SiO2 catalysts.
To the best knowledge of the authors, who have been following the literature on the catalytic oxidation of aldoses to aldonic acids since the 1990s, there have been no reports of such a process being used commercially, including for the transformation of cotton waste into valuable chemicals. This appears a promising research avenue, with potential industrial applications.


 ,
, 

 ); 5% Au/SiO2 (
  ); 5% Pd-0.2% Au/SiO2 (
  ); 5% Pd-0.5% Au/SiO2 (
  ); 5% Pd-1% Au/SiO2 (
  ); 5% Pd-2% Au/SiO2 (
  ); 5% Pd-5% Au/SiO2 (
  ), and 1% Pt-4% Pd-5% Bi/C (Degussa) (×) as a function of time. Reaction conditions: T = 60 °C, mcat = 1g, C0 = 1 mol·dm−3, pH = 9, VO2 = 1 dm3·min−1.


