
Experiment on the Properties of Soda Residue-Activated Ground Granulated Blast Furnace Slag Mortars with Different Activators


Abstract
:1. Introduction
2. Materials and Methods
2.1. Materials
2.2. Preparation of Specimens
2.3. Testing and Characterization
3. Results and Discussion
3.1. Orthogonal Experiment
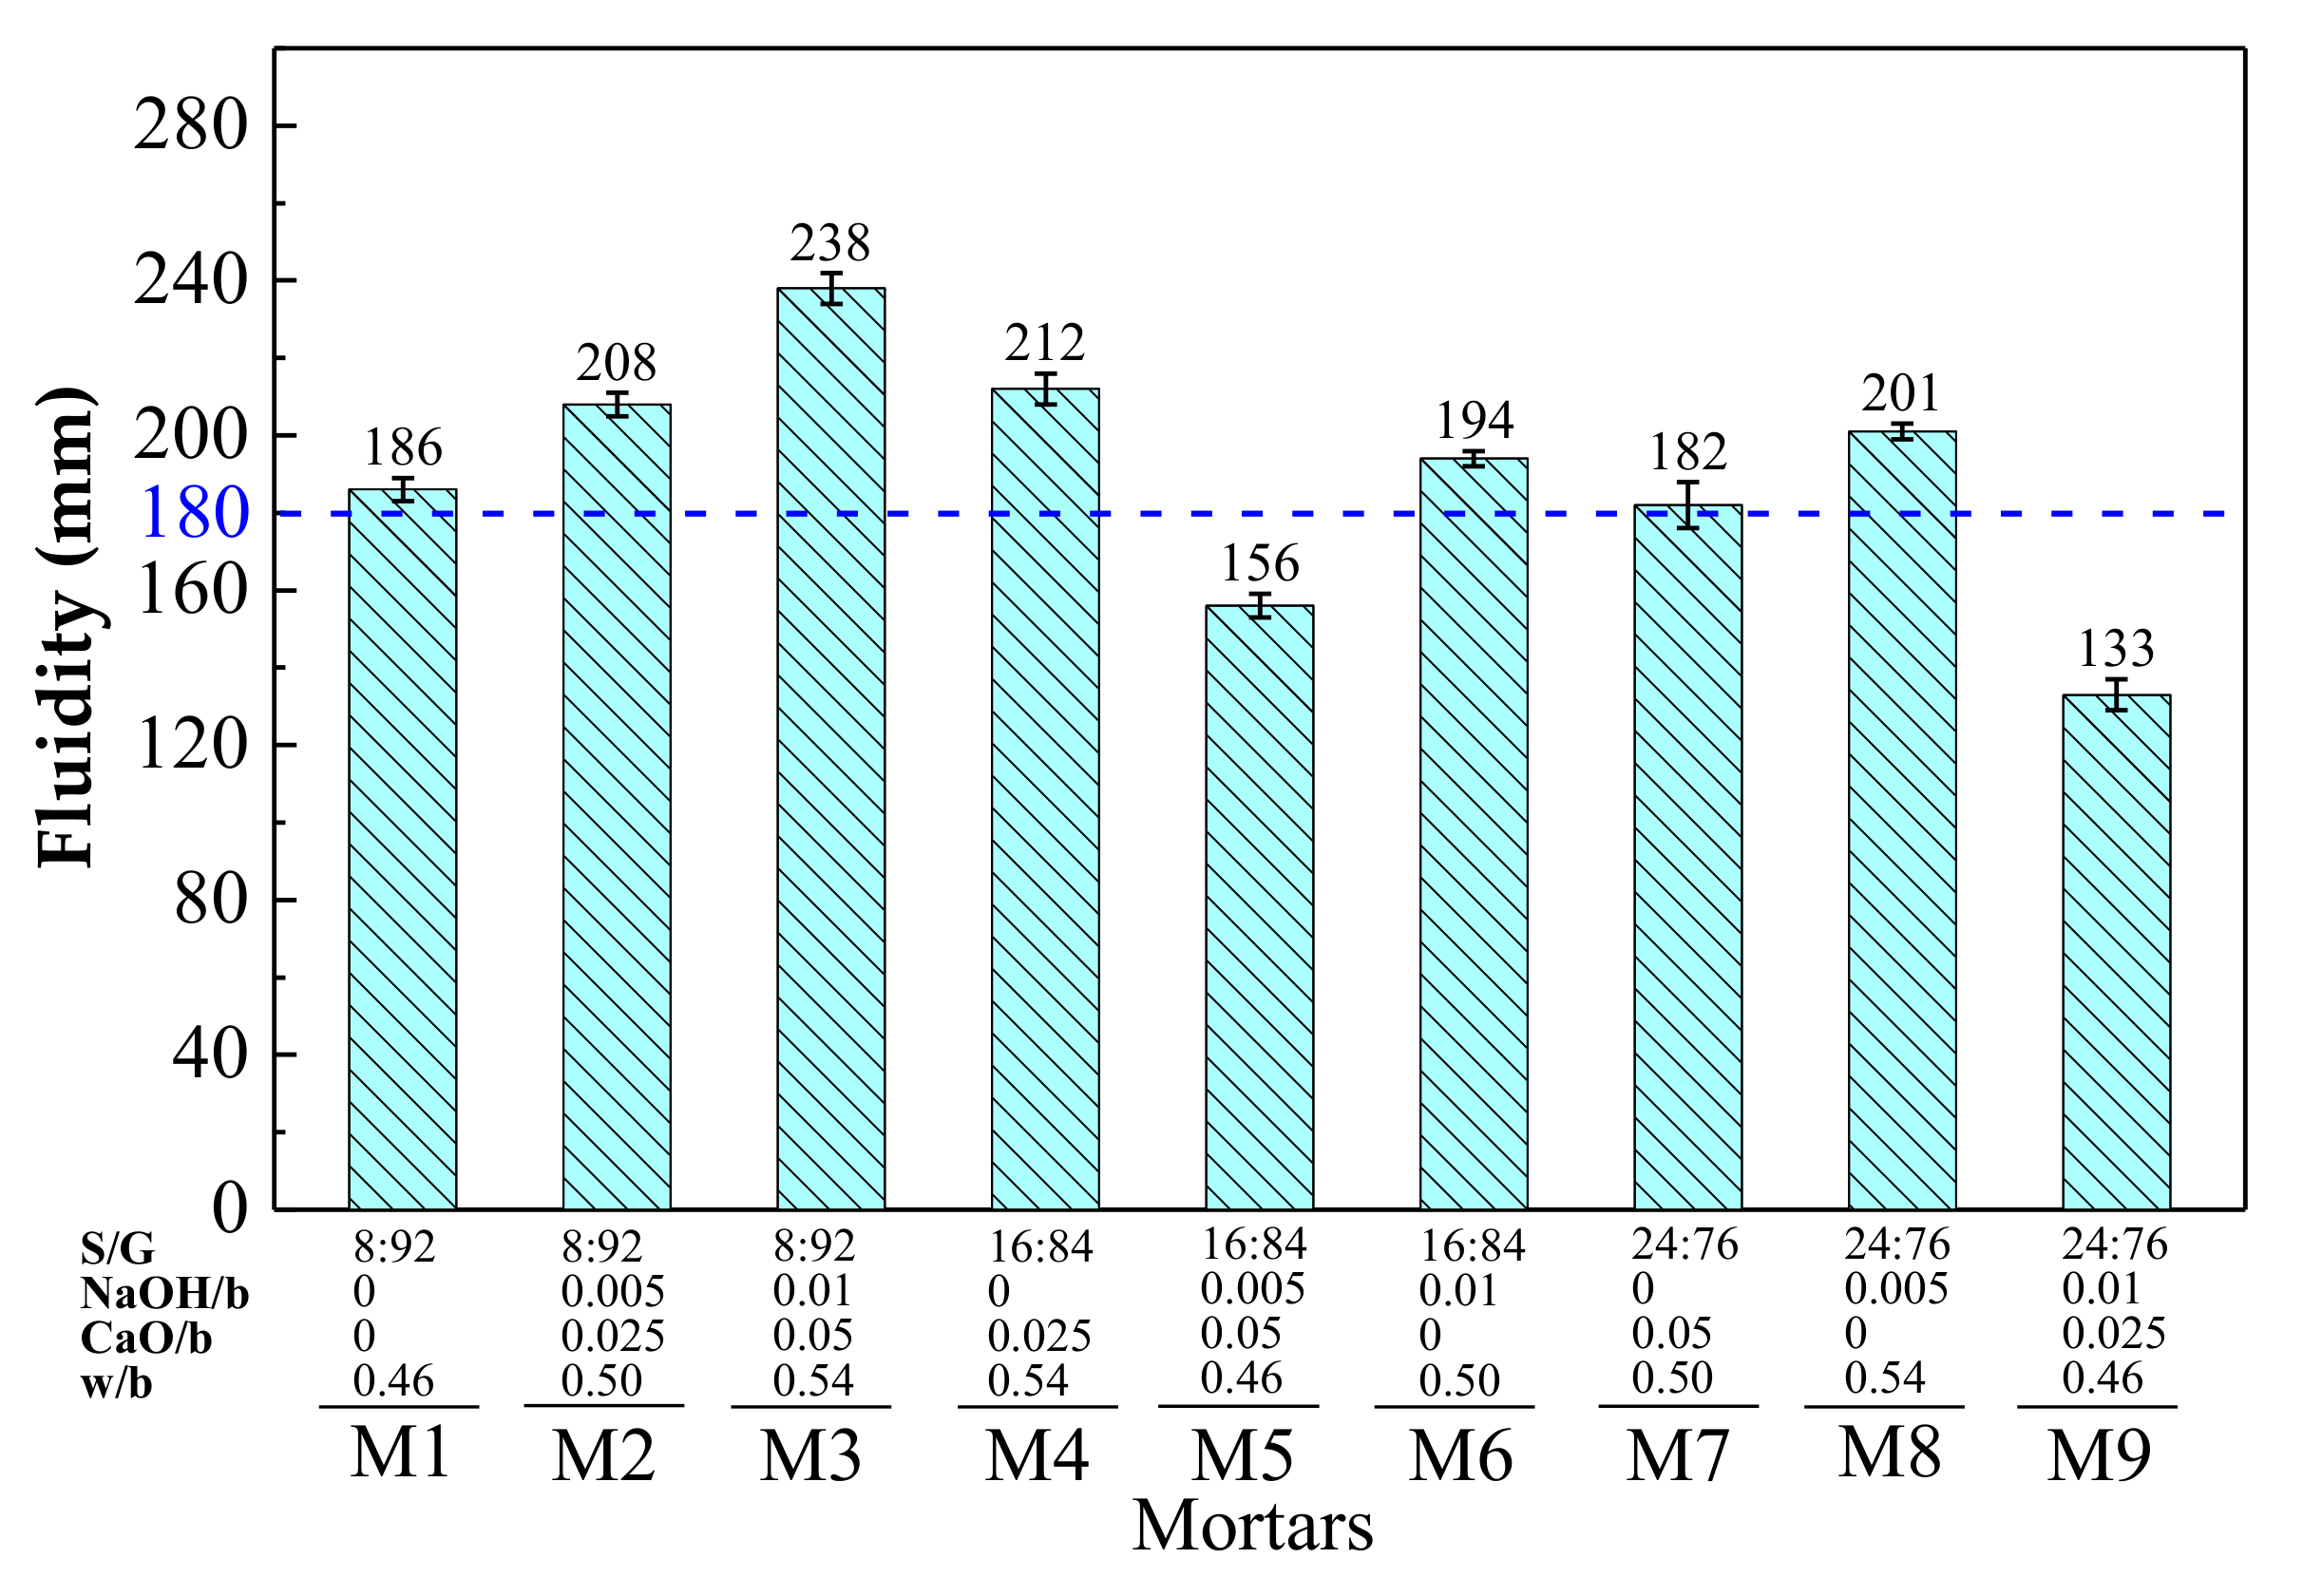
3.1.1. Fluidity
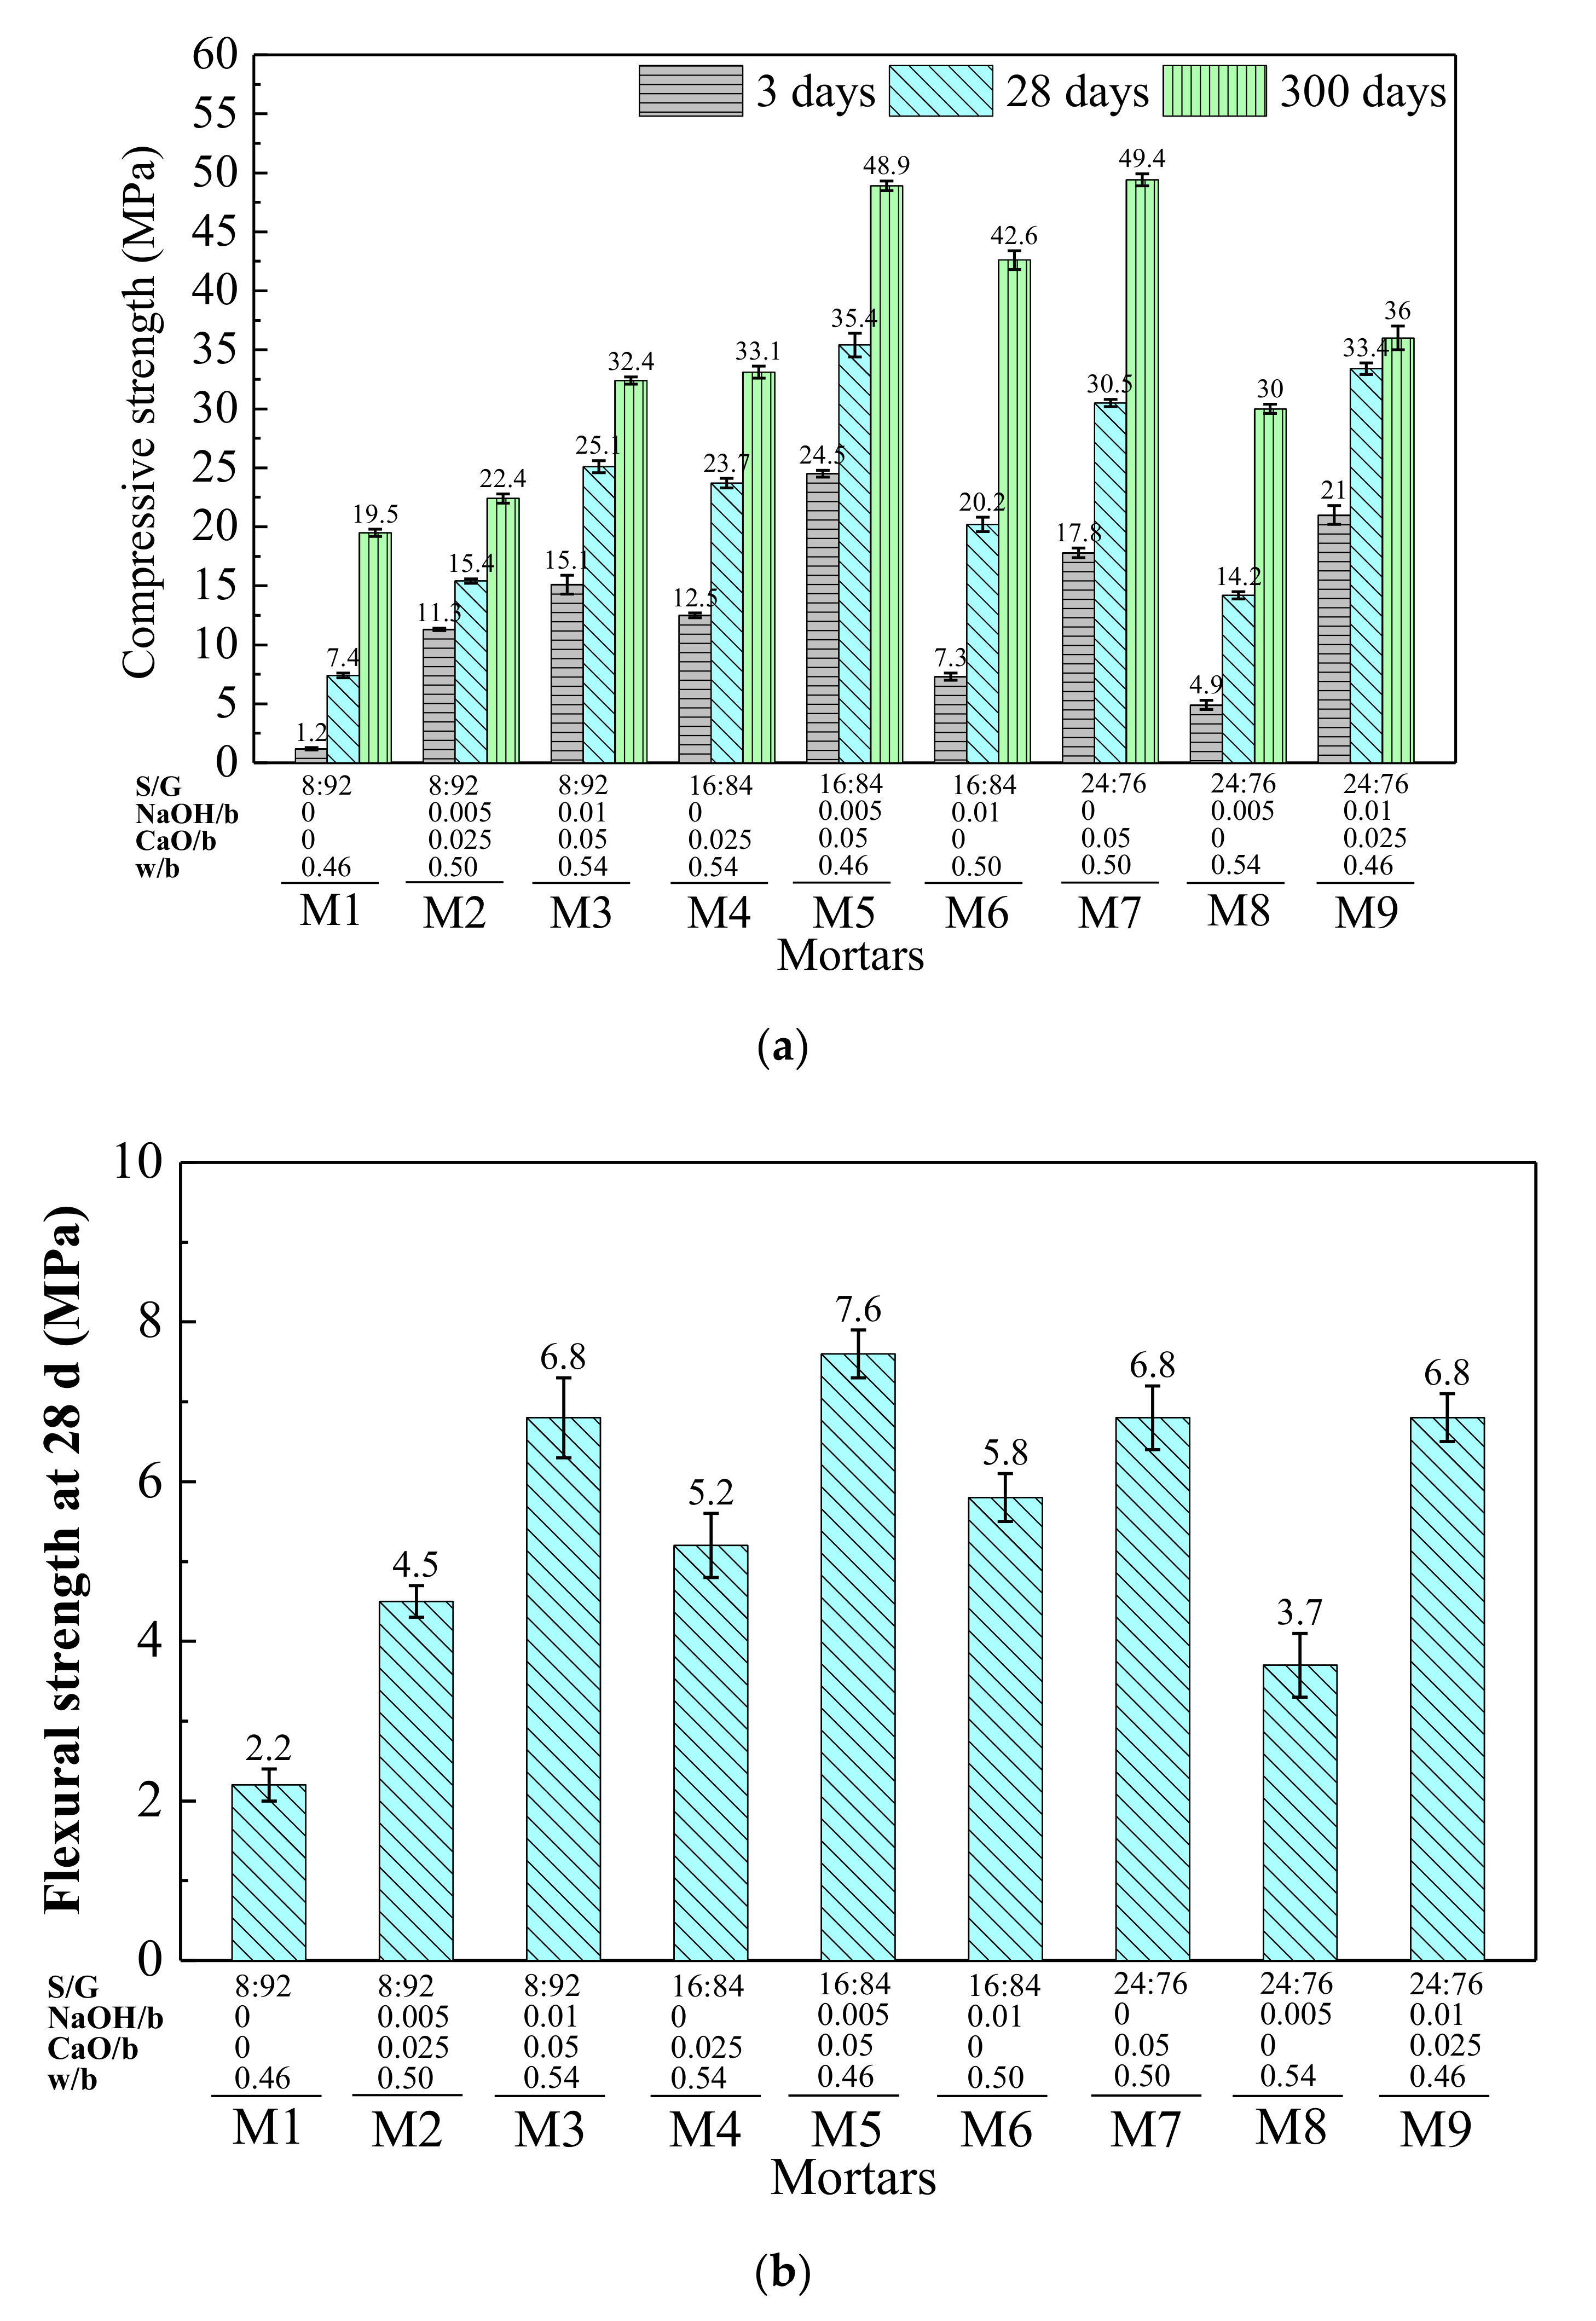
3.1.2. Mechanical Strength
3.2. Optimized Experiment of Mortars
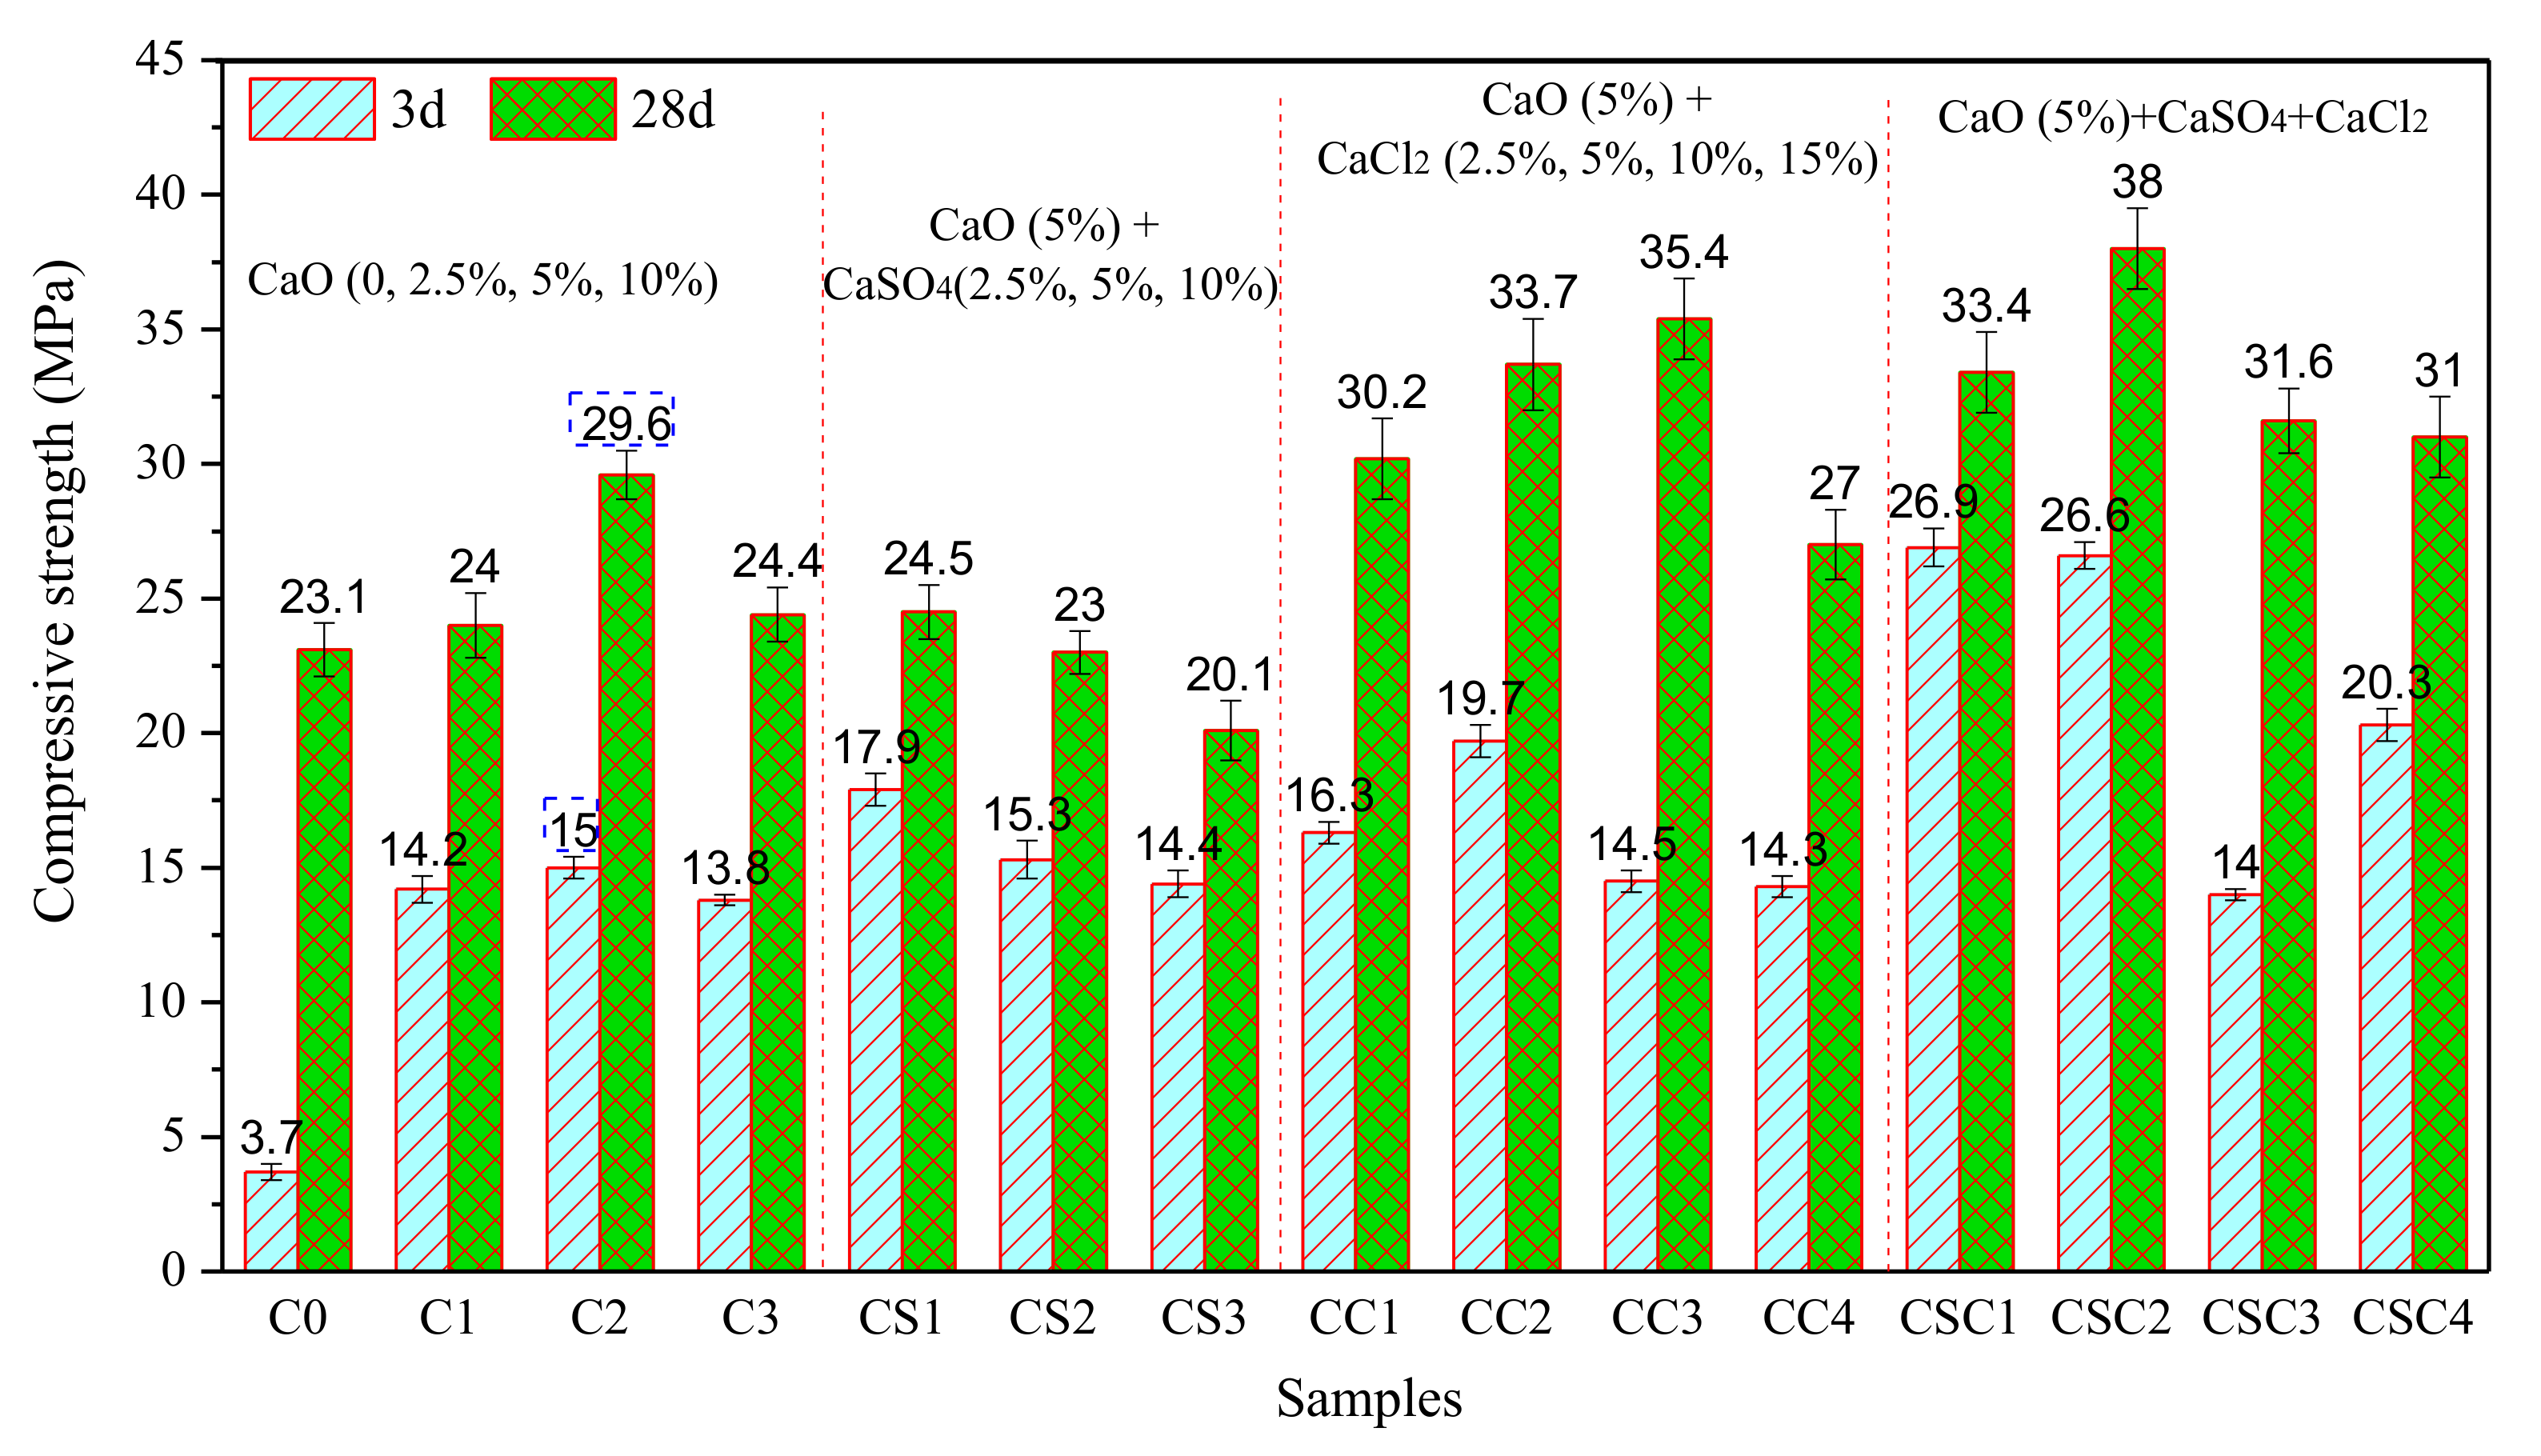
3.3. Effects of Anionic Calcium Compounds on Compressive Strength
3.3.1. Influence of CaO on Compressive Strength
3.3.2. Influence of CaSO4 on Compressive Strength
3.3.3. Influence of CaCl2 on Compressive Strength
3.3.4. Influence of CaSO4 and CaCl2 on Compressive Strength
3.4. Hydration Products
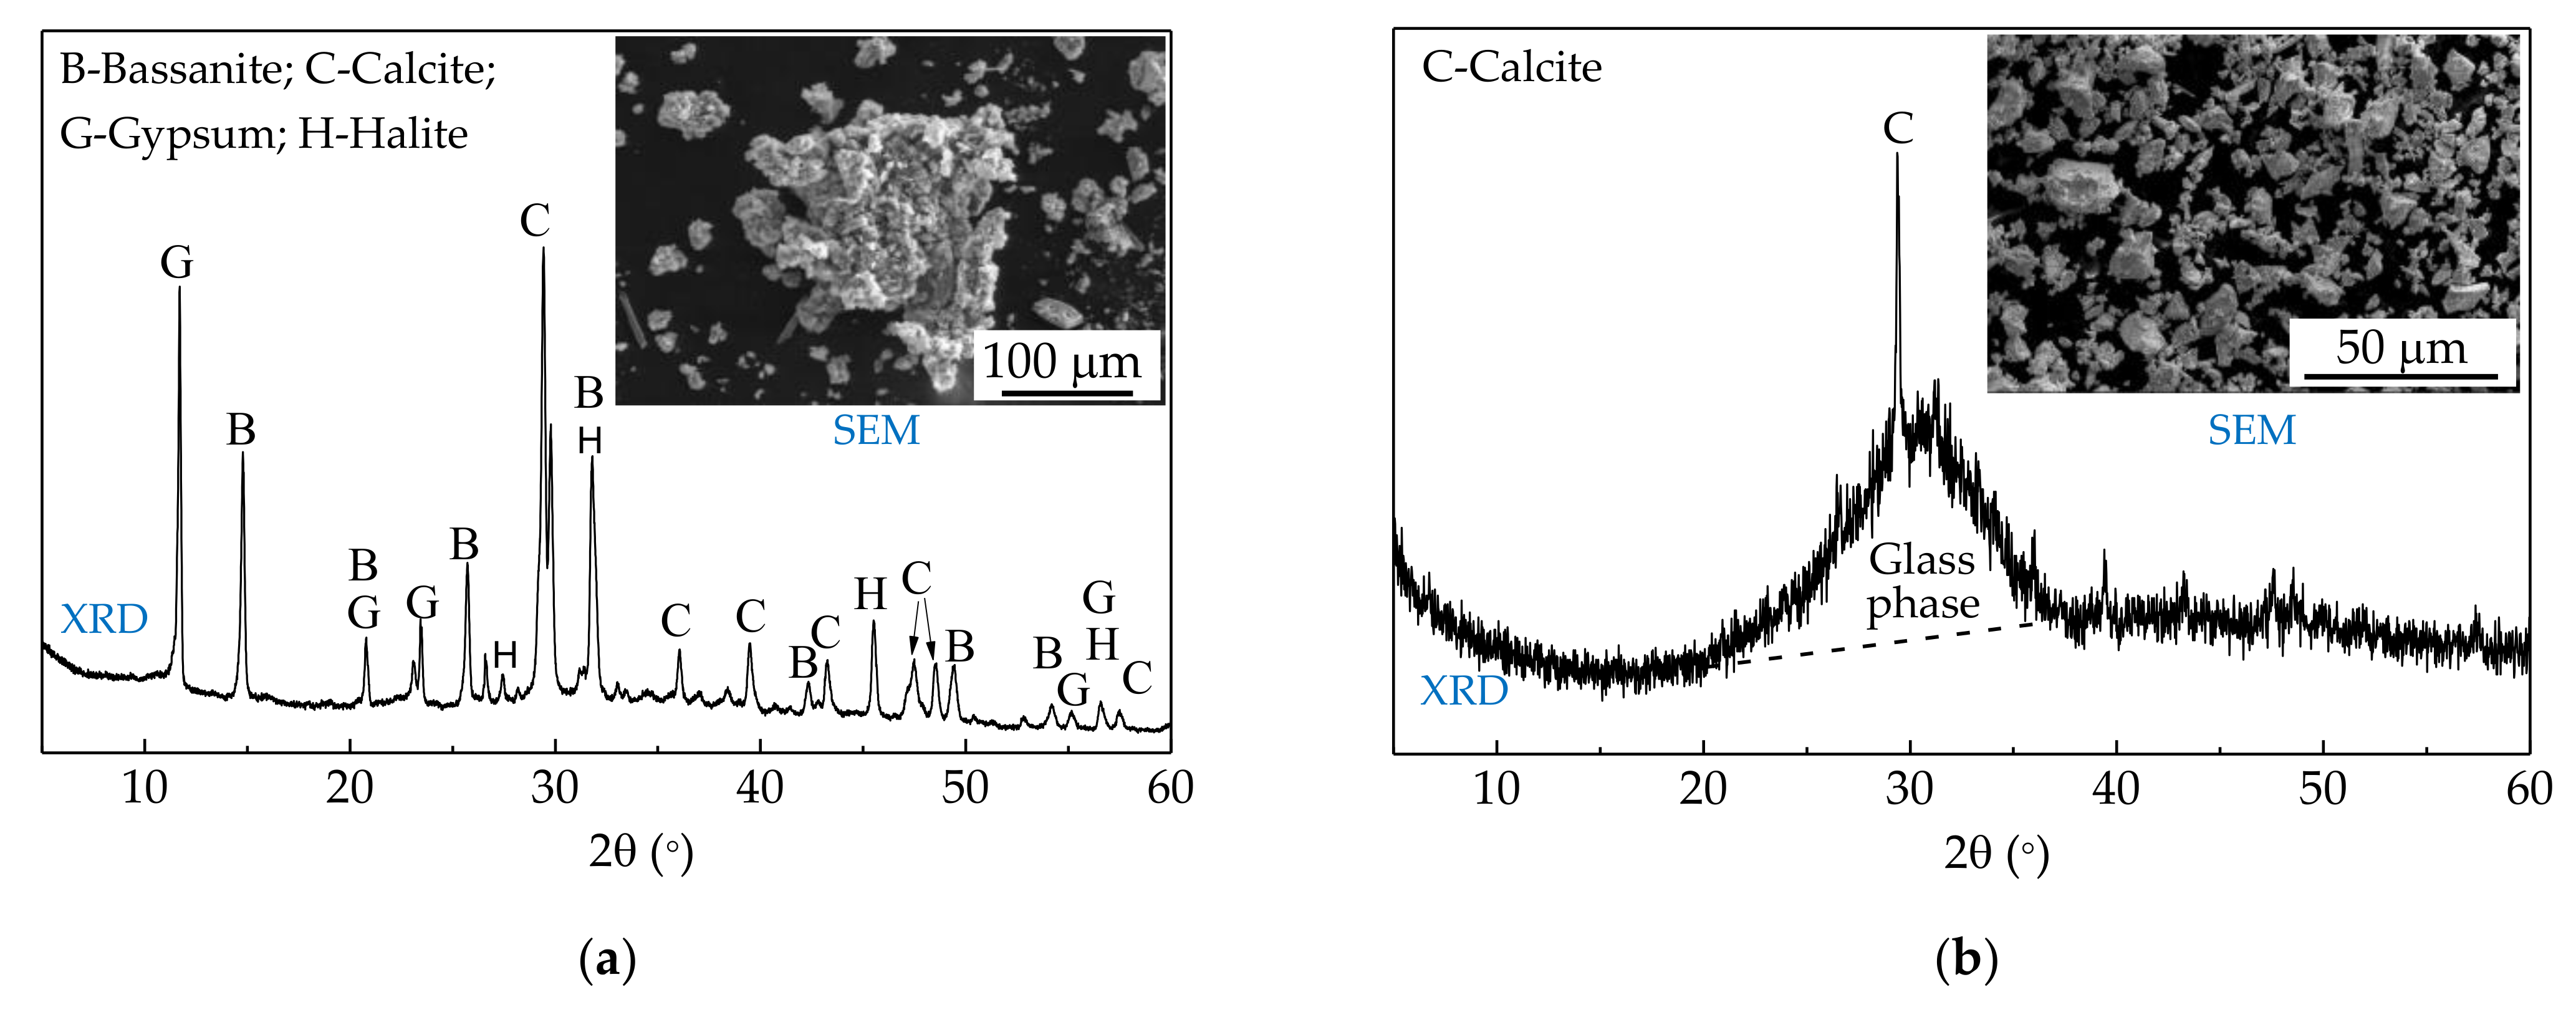
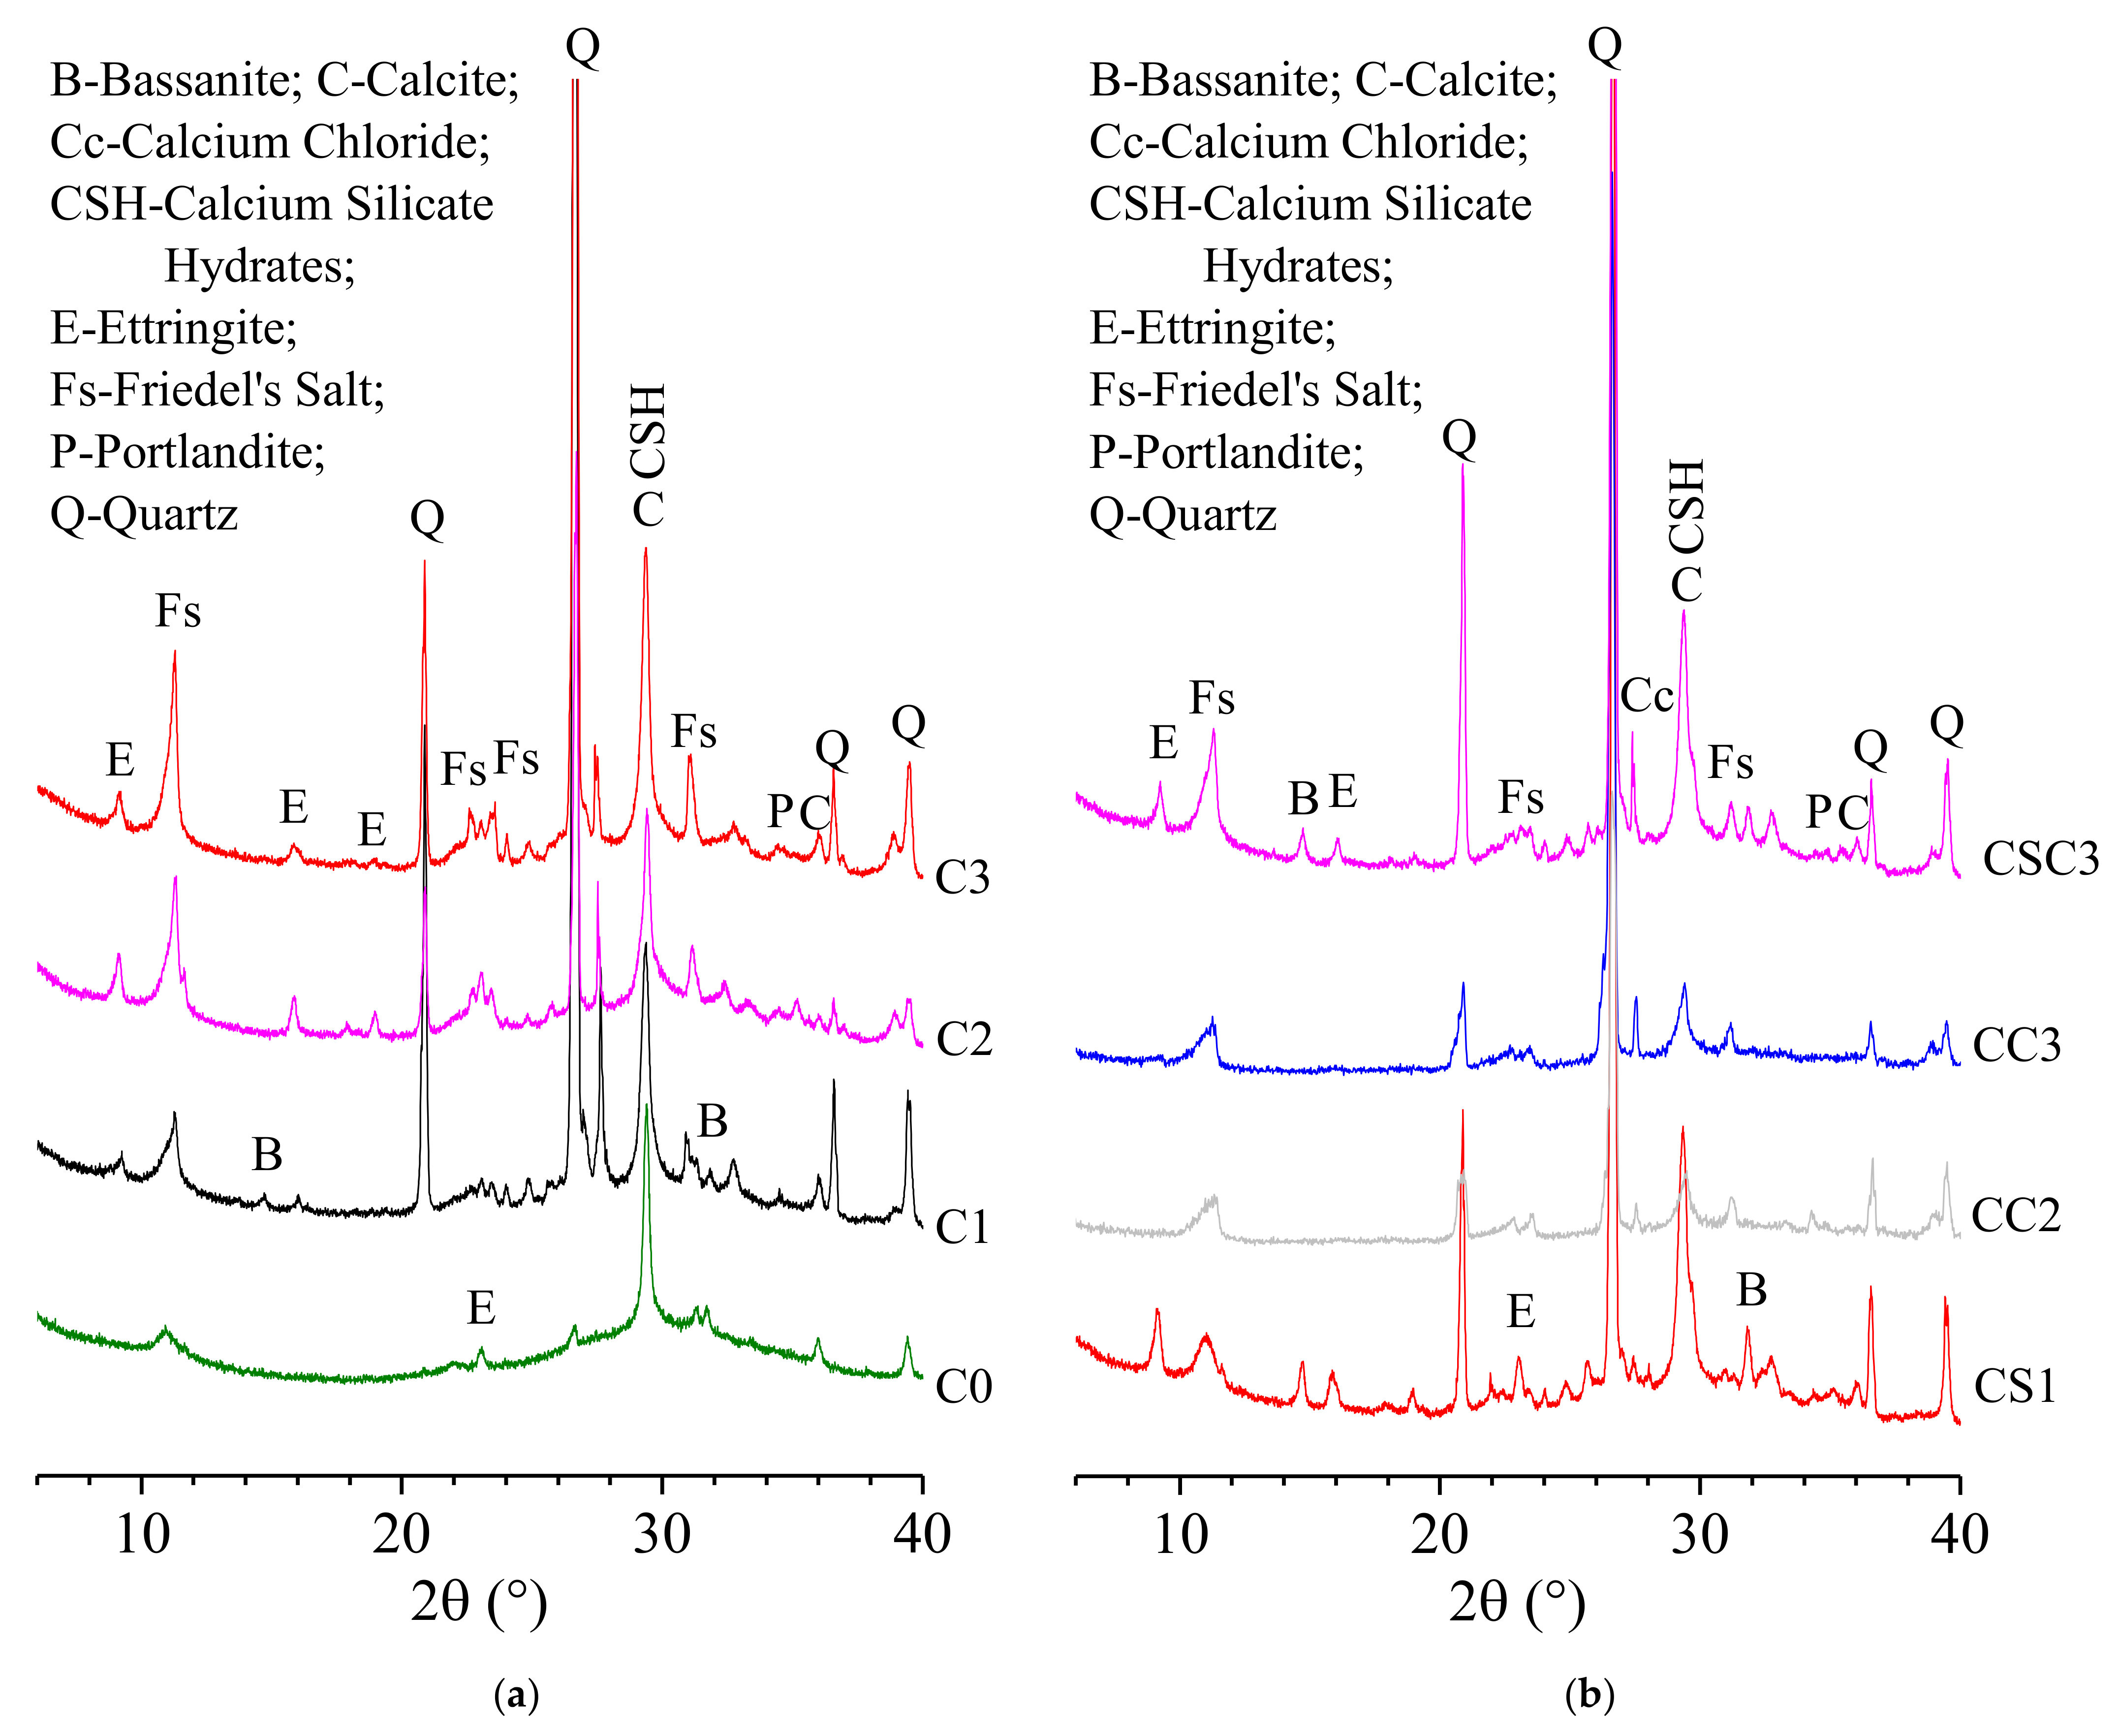
3.4.1. XRD Analysis
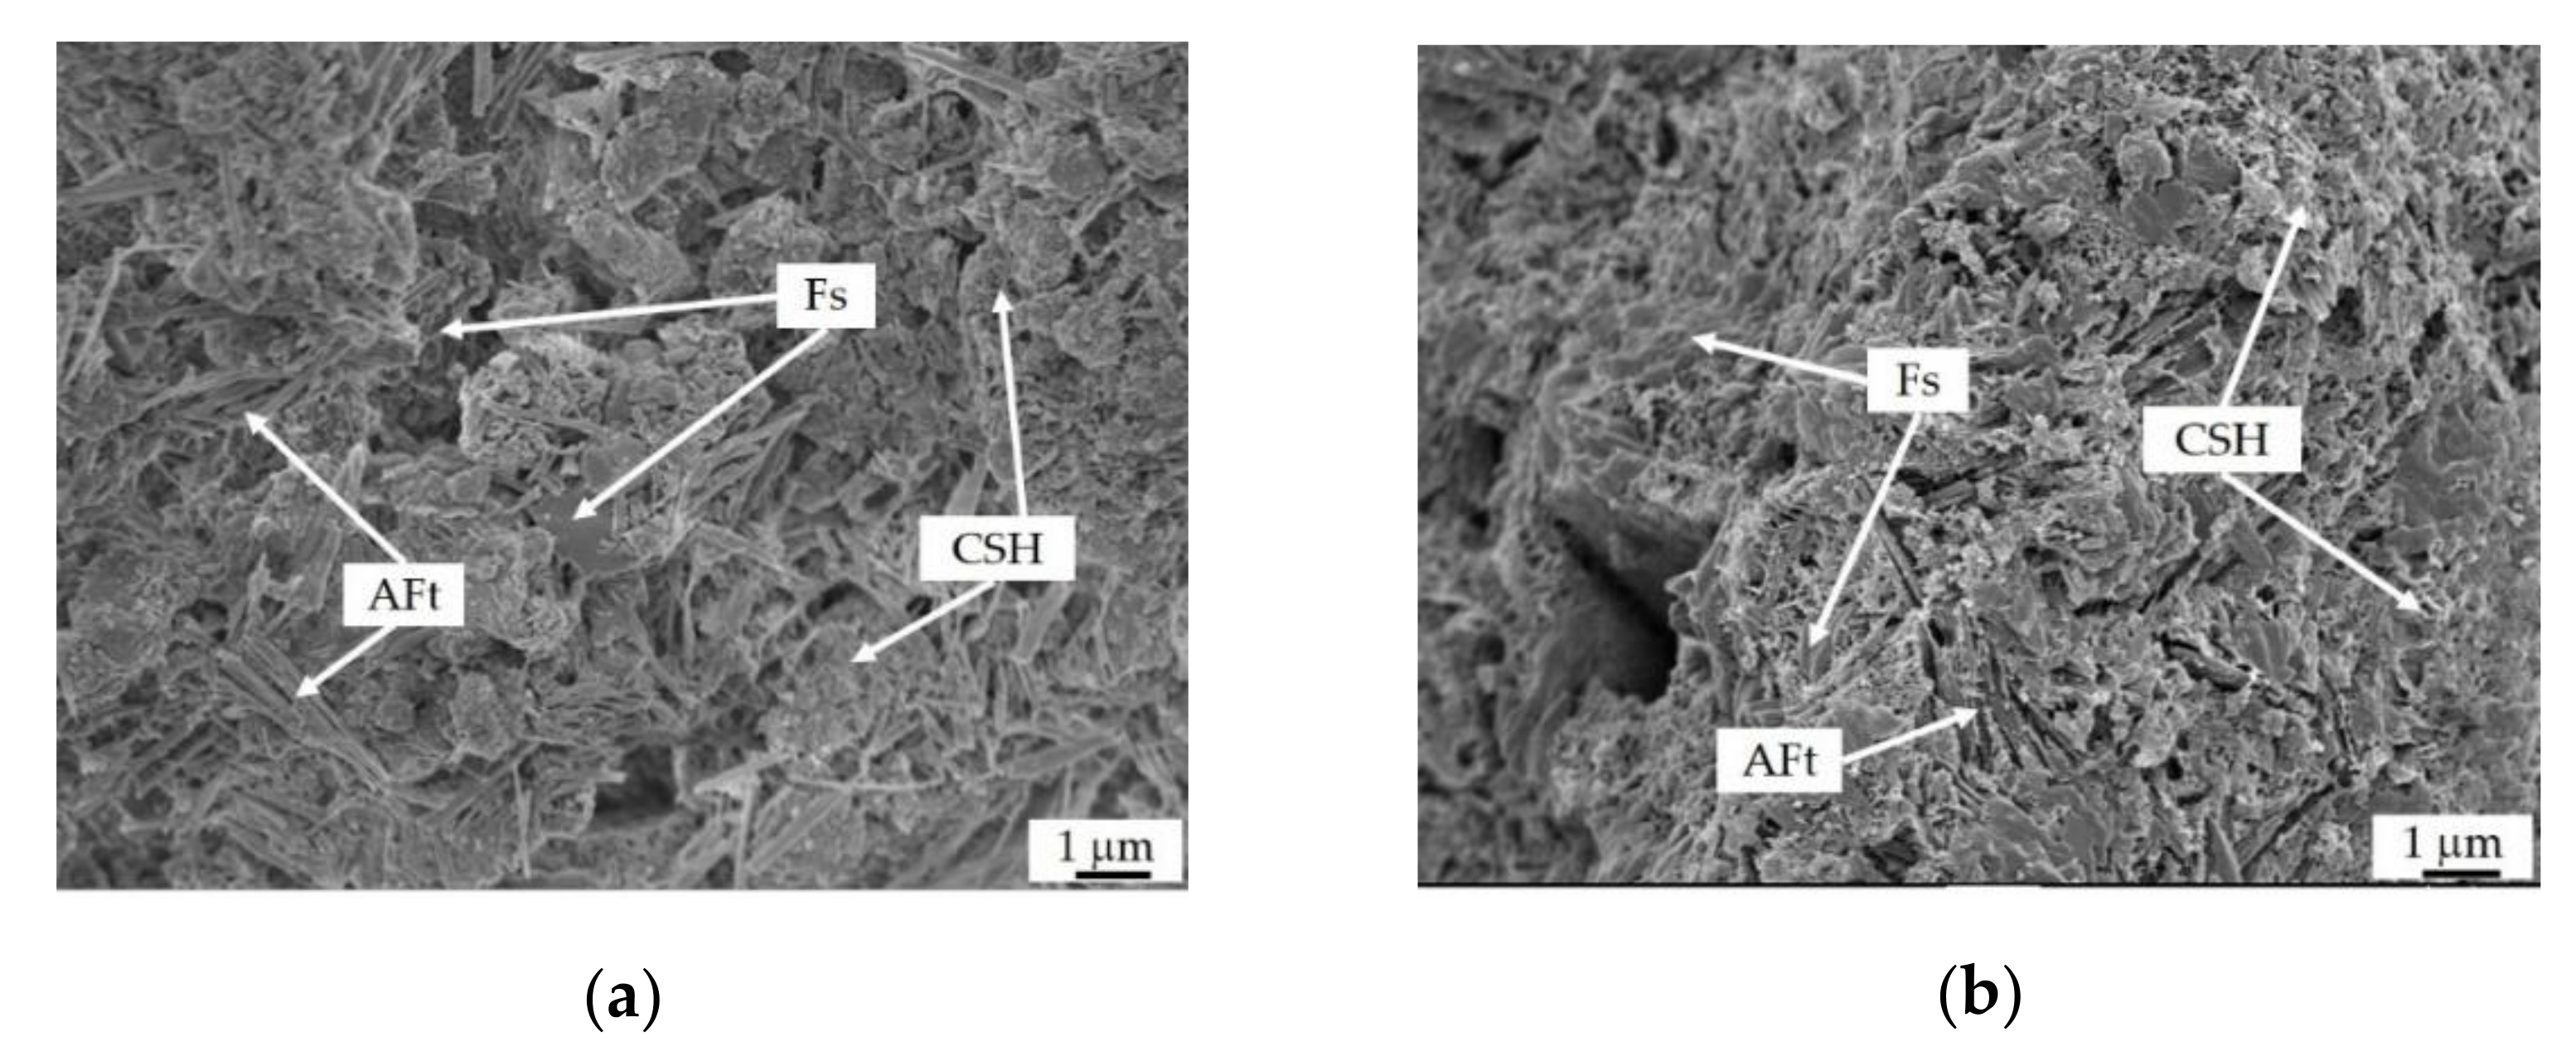
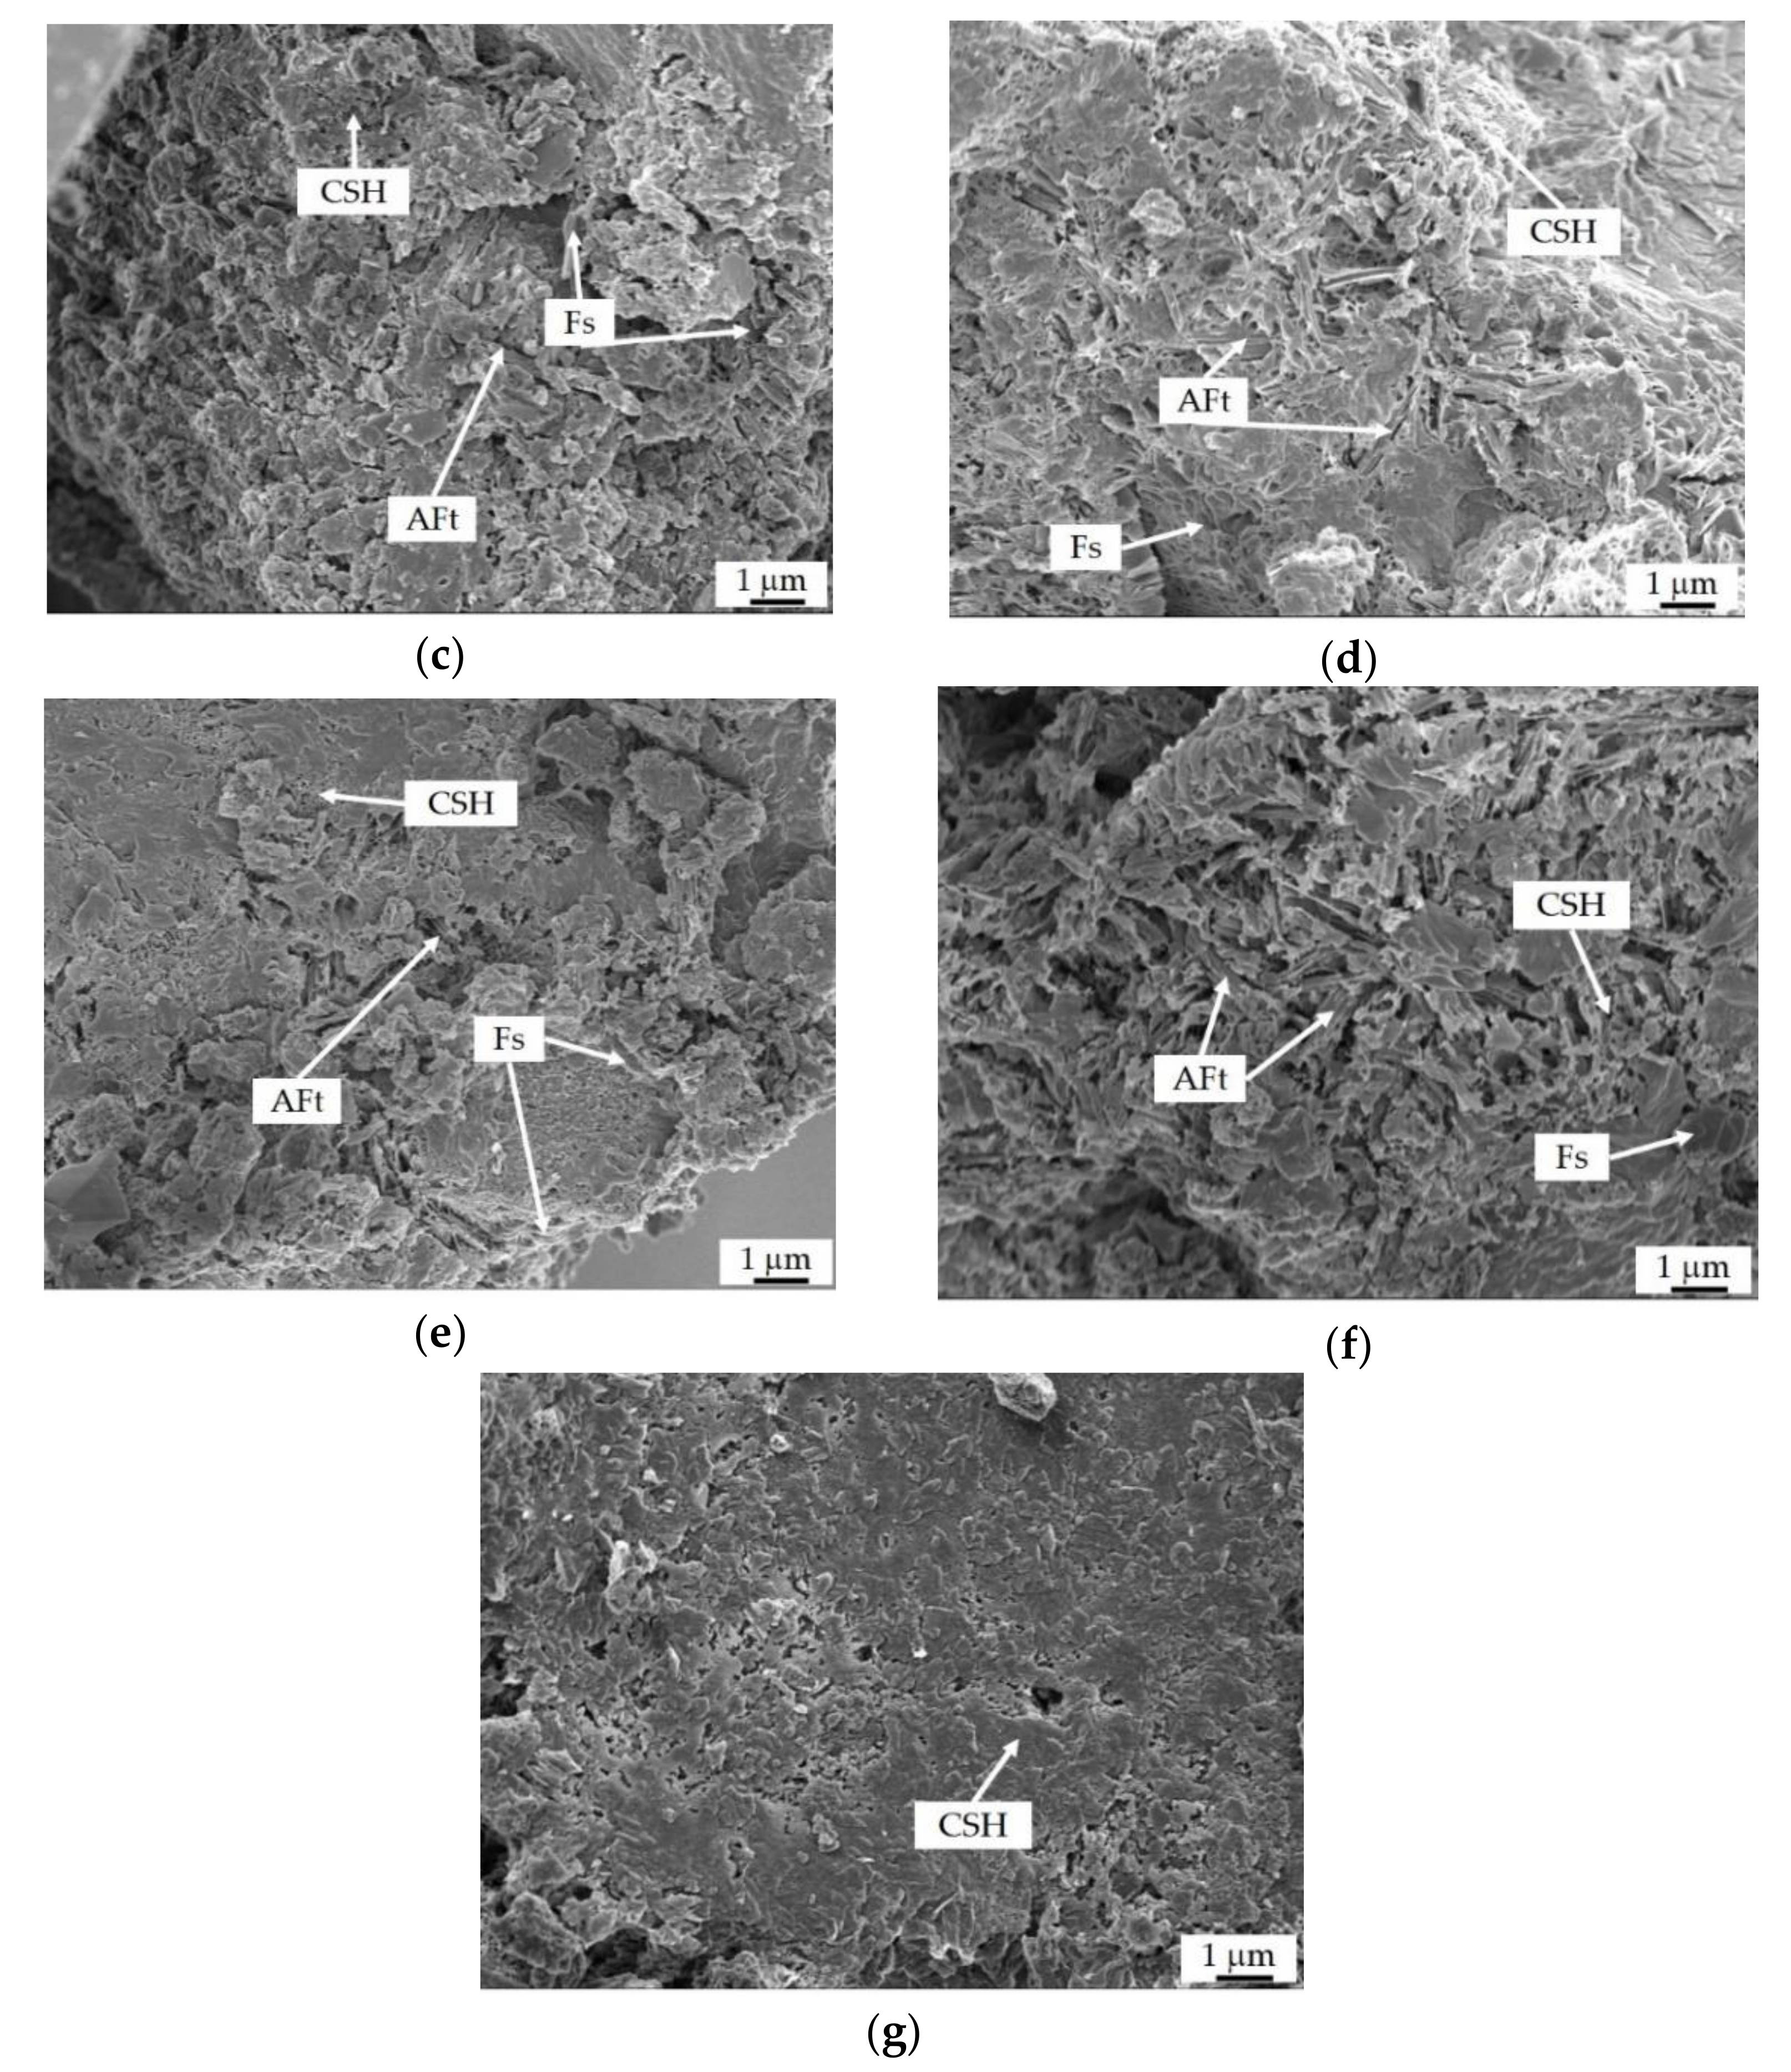
3.4.2. SEM Analysis
4. Conclusions
- The ranking sequences of factors influencing compressive strength of the mortars at 3, 28, and 300 d are CaO/b > S/G > w/b > NaOH/b, CaO/b > S/G > NaOH/b > w/b, and S/G > CaO/b > w/b > NaOH/b, respectively;
- S/G and CaO/b have a greater influence on compressive strength during the whole curing time. When CaO/b is 0.05 and S/G is 16:84–24:76, the mortars activated by SR can obtain high compressive strength;
- For mechanical properties and fluidity, the optimal scheme of SR-activated GGBFS mortars is 16:84–24:76 S/G, 0.01 NaOH/b, 0.05 CaO/b, and 0.50 w/b. Compressive strength at 28 d and fluidity of the mortars are 32.3–35.4 MPa, and 181–195 mm, respectively;
- Compressive strength of CaO (5%)-SR (24%)-activated GGBFS mortars (C2) at 3 d and 28 d can reach 15.0 MPa and 29.6 MPa, respectively. Between 2.5–10% CaCl2 addition is beneficial to the improvement of compressive strength, whereas CaSO4 is harmful;
- The main hydration products of mortars are AFt, Fs, and CSH gels. High concentration of CaCl2 can reduce the amount of ettringite in mortars.
Author Contributions
Funding
Institutional Review Board Statement
Informed Consent Statement
Data Availability Statement
Conflicts of Interest
References
- Wang, Z.; Lyu, X. Preparation of Ca–Si–Al–Mg Porous Ceramics by Co-Operation of Ca&Mg-Contained Soda Residue and Altered Rock Gold Tailings. J. Clean. Prod. 2020, 262, 121345. [Google Scholar]
- National Bureau of Statistics of China. Available online: http://www.stats.gov.cn/tjsj/ndsj/ (accessed on 17 April 2022).
- Li, X. Tian Jin Jian Chang Jian Zha Tu De Gong Cheng Li Yong Yan Jiu; China Ocean Press: Beijing, China, 2013; pp. 1–5. (In Chinese) [Google Scholar]
- Zhao, X.; Liu, C. Synthesis and Characterization of Fy ash Geopolymer Paste for Goaf Backfill: Reuse of Soda Residue. J. Clean. Prod. 2020, 260, 121045. [Google Scholar] [CrossRef]
- Bellmann, F.; Stark, J. Activation of Blast Furnace Slag by a New Method. Cem. Concr. Res. 2009, 39, 644–650. [Google Scholar] [CrossRef]
- Lothenbach, B.; Scrivener, K. Supplementary Cementitious Materials. Cem. Concr. Res. 2011, 41, 217–229. [Google Scholar] [CrossRef]
- Junior, J.A.L.; Azevedo, A.R.G. Influence of Processing Parameters Variation on the Development of Geopolymeric Ceramic Blocks with Calcined Kaolinite Clay. Case Stud. Constr. Mater. 2022, 12, e00897. [Google Scholar] [CrossRef]
- Bilginer, A.; Canbek, O. Activation of Blast Furnace Slag with Soda Production Waste. J. Mater. Civ. Eng. 2020, 32, 04019316. [Google Scholar] [CrossRef]
- Yang, K.; Cho, A. Hydration Products and Strength Development of Calcium Hydroxide-based Alkali-Activated Slag Mortars. Constr. Build. Mater. 2012, 29, 410–419. [Google Scholar] [CrossRef]
- Kim, M.S.; Jun, Y. Use of CaO as an Activator for Producing a Price-Competitive non-Cement Structural Binder Using Ground Granulated Blast Furnace Slag. Cem. Concr. Res. 2013, 54, 208–214. [Google Scholar] [CrossRef]
- Burciaga-Díaz, O. Parameters Affecting the Properties and Microstructure of Quicklime (CaO)-Activated Slag Cement Pastes. Cem. Concr. Compos. 2019, 103, 104–111. [Google Scholar] [CrossRef]
- Lin, Y.; Xu, D. Effect of Soda Residue Addition and Its Chemical Composition on Physical Properties and Hydration Products of Soda Residue-Activated Slag Cementitious Materials. Materials 2020, 13, 1789. [Google Scholar] [CrossRef] [Green Version]
- Lin, Y.; Xu, D. Properties and Hydration Mechanism of Soda Residue-Activated Ground Granulated Blast Furnace Slag Cementitious Materials. Materials 2021, 14, 2883. [Google Scholar] [CrossRef]
- Pan, Q. Discussion on Hydration Mechanism of Ground Granulated Blast Furnace Slag. Cement 2014, 9, 6–10. (In Chinese) [Google Scholar]
- Ma, Y.; Liu, Z. Remediating Potentially Toxic Metal and Organic Co-Contamination of Soil by Combining in Situ Solidification/Stabilization and Chemical Oxidation: Efficacy, Mechanism, and Evaluation. Int. J. Environ. Res. Public Health 2018, 15, 2595. [Google Scholar] [CrossRef] [Green Version]
- Song, S.; Jennings, H.M. Pore Solution Chemistry of Alkali-Activated Ground Granulated Blast Furnace Slag. Cem. Concr. Res. 1999, 29, 159–170. [Google Scholar] [CrossRef]
- Kesim, A.G.; Tokyay, M. Properties of Alinite Cement Produced by Using Soda Sludge. Adv. Cem. Res. 2013, 25, 104–111. [Google Scholar] [CrossRef]
- Gur, N.; Aktas, Y. Utilization of Soda Ash Plant Solid Wastes in Manufacture of Cement. Elixir Cem. Concr. Compos. 2012, 47, 8866–8873. [Google Scholar]
- Uçal, G.O.; Mahyar, M. Hydration of Alinite Cement Produced from Soda Waste Sludge. Constr. Build. Mater. 2018, 164, 178–184. [Google Scholar] [CrossRef]
- Potgieter, J.H.; Delport, D.J. Chloride-Binding Effect of Blast Furnace Slag in Cement Pastes Containing Added Chlorides. S. Afr. J. Chem. 2011, 63, 108–114. [Google Scholar]
- Runci, A.; Serdar, A. Effect of Curing Time on the Chloride Diffusion of Alkali-Activated Slag. Case Stud. Constr. Mater. 2022, 16, e00927. [Google Scholar] [CrossRef]
- Li, H.; Farzadnia, N. The Role of Seawater in Interaction of Slag and Silica Fume with Cement in Low Water-to-Binder Ratio Pastes at the Early Age of Hydration. Constr. Build. Mater. 2018, 185, 508–518. [Google Scholar] [CrossRef]
- Yuan, Q.; Shi, C. Chloride Binding of Cement-Based Materials Subjected to External Chloride Environment—A Review. Constr. Build. Mater. 2009, 23, 1–13. [Google Scholar] [CrossRef]
- He, J.; Shi, X.K. Strength Properties of Dredged Soil at High Water Content Treated with Soda Residue, Carbide Slag, and Ground Granulated Blast Furnace Slag. Constr. Build. Mater. 2020, 242, 118126. [Google Scholar] [CrossRef]
- He, J.; Wang, X. Shear Strength of Stabilized Clay Treated with Soda Residue and Ground Granulated Blast Furnace Slag. J. Mater. Civ. Eng. 2019, 31, 06018029. [Google Scholar] [CrossRef]
- Song, R.; Zhao, Q. Microstructure and Composition of Hardened Paste of Soda Residue-Slag-Cement Binding Material System. Front. Mater. 2019, 6, 211. [Google Scholar] [CrossRef]
- Xu, D.; Ni, W. Preparation of Clinker-Free Concrete by Using Soda Residue Composite Cementitious Material. J. Harbin Inst. Technol. 2020, 52, 151–160. (In Chinese) [Google Scholar]
- Xu, D.; Ni, W. Ammonia-Soda Residue and Metallurgical Slags from Iron and Steel Industries as Cementitious Materials for Clinker-Free Concretes. J. Clean. Prod. 2021, 307, 127262. [Google Scholar] [CrossRef]
- Sun, J.; Gu, X. Engineering Properties of the New Non-Nlinker Incorporating Soda Residue Solidified Soil. J. Build. Mater. 2014, 17, 1031–1035. (In Chinese) [Google Scholar]
- Lin, Y.; Xu, D. Experimental Research on Mechanical Property and Microstructure of Blast Furnace Slag Cementitious Materials Activated by Soda Residue. Bull. Chin. Ceram. Soc. 2019, 38, 2876–2881. (In Chinese) [Google Scholar]
- Wei, D.; Du, C. Preparation of a Composite Calcium Silicate Board with Carbide Slag and Coal-Based Solid Waste Activated by Different Alkali Activators. ACS Omega 2020, 5, 8934–8942. [Google Scholar] [CrossRef] [Green Version]
- Huang, G.; Yuan, L. Cooperative Action and Compatibility Between Portland Cement and MSWI Bottom Ash Alkali-Activated Double Gel System Materials. Constr. Build. Mater. 2019, 209, 445–453. [Google Scholar] [CrossRef]
- Scrivener, K.L.; Juilland, P. Advances in Understanding Hydration of Portland Cement. Cem. Concr. Res. 2015, 78, 38–56. [Google Scholar] [CrossRef]
- Liu, Y.; Li, Y. Orthogonal Experiment on Performance of Mortar Made with Dune Sand. Constr. Build. Mater. 2020, 264, 120254. [Google Scholar] [CrossRef]
- Wang, Y.; Qiu, J. Factors Affecting Brittleness Behavior of Coal-Gangue Ceramsite Lightweight Aggregate Concrete. Front. Mater. 2020, 7, 554718. [Google Scholar] [CrossRef]
- Ye, J.; Zhang, W. Setting Acceleration and Strength Enhancement Derived from Calcium Species for Alkali-activated Cementitious Materials. J. Chin. Ceram. Soc. 2017, 45, 1101–1112. (In Chinese) [Google Scholar]
- Temuujin, J.; Van Riessen, A. Influence of Calcium Compounds on the Mechanical Properties of Fly Ash Geopolymer Pastes. J. Hazard. Mater. 2009, 167, 82–88. [Google Scholar] [CrossRef]
- Qu, X.; Zhao, Z. Heat Release Characteristics of Lime and Time-Dependent Rheological Behaviors of Lime-Activated Fly Ash Pastes. Case Stud. Constr. Mater. 2022, 16, e01043. [Google Scholar] [CrossRef]
- Zhang, L.; Song, S. Effect of Gypsum Content on Properties of Alkali-Activated Slag Cement Mortar. Appl. Chem. Ind. 2020, 49, 2168–2172+2177. (In Chinese) [Google Scholar]
- Yum, W.S.; Jeong, Y. Effects of CaCl2 on Hydration and Properties of Lime (CaO)-Activated Slag/Fly Ash Binder. Cem. Concr. Compos. 2017, 84, 111–123. [Google Scholar] [CrossRef]
- GB/T 17671-1999; Method of Testing Cements–Determination of Strength. General Administration of Quality Supervision, Inspection and Quarantine of the People’s Republic of China: Beijing, China, 1999. (In Chinese)
- Zhao, X.; Wang, H. Resistance of Soda Residue–Fly Ash Based Geopolymer Mortar to Acid and Sulfate Environments. Materials 2021, 14, 785. [Google Scholar] [CrossRef]
- GB/T 2419-2005; Test Method for Fluidity of Cement Mortar. General Administration of Quality Supervision, Inspection and Quarantine of the People’s Republic of China: Beijing, China, 2005. (In Chinese)
- ASTM C20-2000(2005); ASTM International. Standard Test Methods for Apparent Porosity, Water Absorption, Apparent Specific Gravity, and Bulk Density of Burned Refractory Brick and Shapes by Boiling Water. ASTM International: West Conshohocken, PA, USA, 2010.
- GB 175-2007; Common Portland Cement. General Administration of Quality Supervision, Inspection and Quarantine of the People’s Republic of China: Beijing, China, 2007. (In Chinese)
- Huang, G.; Ji, Y. Improving Strength of Calcinated Coal Gangue Geopolymer Mortars via Increasing Calcium Content. Constr. Build. Mater. 2018, 166, 760–768. [Google Scholar] [CrossRef]
- Qiao, C.; Suraneni, P. Chloride binding of cement pastes with fly ash exposed to CaCl2 solutions at 5 and 23 °C. Cem. Concr. Compos. 2019, 97, 43–53. [Google Scholar] [CrossRef]
- Ipavec, A.; Vuk, T. Chloride Binding into Hydrated Blended Cements: The Influence of Limestone and Alkalinity. Cem. Concr. Res. 2013, 48, 74–85. [Google Scholar] [CrossRef]
- Zhu, Q.; Jiang, L. Effect of Chloride Salt Type on Chloride Binding Behavior of Concrete. Constr. Build. Mater. 2012, 37, 512–517. [Google Scholar] [CrossRef]


| Reagents | Purity (%) | Solubility | Production Place |
|---|---|---|---|
| NaOH | 96.0 | soluble | Tianjin, China |
| CaO | 98.0 | slightly soluble | Tianjin, China |
| CaCl2 | 96.0 | soluble | Tianjin, China |
| CaSO4 | 97.0 | slightly soluble | Tianjin, China |
| Factor | Level l | Level 2 | Level 3 |
|---|---|---|---|
| S/G | 8:92 | 16:84 | 24:76 |
| NaOH/b | 0 | 0.005 | 0.01 |
| CaO/b | 0 | 0.025 | 0.05 |
| w/b | 0.46 | 0.50 | 0.54 |
| No. | SR | GGBFS | NaOH | CaO | Water | Sand |
|---|---|---|---|---|---|---|
| M1 | 36 | 414 | 0 | 0 | 207 | 1350 |
| M2 | 36 | 414 | 2.25 | 11.25 | 225 | 1350 |
| M3 | 36 | 414 | 4.50 | 22.50 | 243 | 1350 |
| M4 | 72 | 378 | 0 | 11.25 | 243 | 1350 |
| M5 | 72 | 378 | 2.25 | 22.50 | 207 | 1350 |
| M6 | 72 | 378 | 4.50 | 0 | 225 | 1350 |
| M7 | 108 | 342 | 0 | 22.50 | 225 | 1350 |
| M8 | 108 | 342 | 2.25 | 0 | 243 | 1350 |
| M9 | 108 | 342 | 4.50 | 11.25 | 207 | 1350 |
| No. | SR | GGBFS | NaOH | CaO | Water | Sand |
|---|---|---|---|---|---|---|
| O1 | 72 | 378 | 4.50 | 22.50 | 225 | 1350 |
| O2 | 108 | 342 | 4.50 | 22.50 | 225 | 1350 |
| O3 | 108 | 342 | 4.50 | 11.25 | 243 | 1350 |
| No. | SR | GGBFS | CaO | CaSO4 | CaCl2 | Water | Sand |
|---|---|---|---|---|---|---|---|
| C0 | 108 | 342 | - | - | - | 225.0 | 1350 |
| C1 | 108 | 342 | 11.25 | - | - | 230.6 | 1350 |
| C2 | 108 | 342 | 22.50 | - | - | 236.3 | 1350 |
| C3 | 108 | 342 | 45.00 | - | - | 247.5 | 1350 |
| CS1 | 108 | 342 | 22.50 | 11.25 | - | 241.9 | 1350 |
| CS2 | 108 | 342 | 22.50 | 22.50 | - | 247.5 | 1350 |
| CS3 | 108 | 342 | 22.50 | 45.00 | - | 258.8 | 1350 |
| CC1 | 108 | 342 | 22.50 | - | 11.25 | 241.9 | 1350 |
| CC2 | 108 | 342 | 22.50 | - | 22.50 | 247.5 | 1350 |
| CC3 | 108 | 342 | 22.50 | - | 45.00 | 258.8 | 1350 |
| CC4 | 108 | 342 | 22.50 | - | 67.50 | 270.0 | 1350 |
| CSC1 | 108 | 342 | 22.50 | 11.25 | 11.25 | 247.5 | 1350 |
| CSC2 | 108 | 342 | 22.50 | 11.25 | 22.50 | 253.1 | 1350 |
| CSC3 | 108 | 342 | 22.50 | 22.50 | 22.50 | 258.8 | 1350 |
| CSC4 | 108 | 342 | 22.50 | 11.25 | 45.00 | 264.4 | 1350 |
| Index | Factors | Rank | |||
|---|---|---|---|---|---|
| S/G | NaOH/b | CaO/b | w/b | ||
| M1j | 211 | 193 | 194 | 158 | w/b > S/G > CaO/b > NaOH/b |
| M2j | 187 | 188 | 184 | 195 | |
| M3j | 172 | 188 | 192 | 217 | |
| Rj | 39 | 5 | 9 | 59 | |
| Trend |  |  |  | | |
’, ‘ ’, and ‘ ’ represent the increasing trend, the decreasing trend, unchanged, respectively.| Index | Index | Factors | Rank | |||
|---|---|---|---|---|---|---|
| S/G | NaOH/b | CaO/b | w/b | |||
| 3 d Compressive Strength | M1j | 9.200 | 10.500 | 4.467 | 15.567 | CaO/b > S/G > w/b > NaOH/b |
| M2j | 14.767 | 13.567 | 14.933 | 12.133 | ||
| M3j | 14.567 | 14.467 | 19.133 | 10.833 | ||
| Rj | 5.567 | 3.967 | 14.666 | 4.734 | ||
| Trend | | | | | ||
| 28 d Compressive Strength | M1j | 15.967 | 20.533 | 13.933 | 25.400 | CaO/b > S/G > NaOH/b > w/b |
| M2j | 26.433 | 21.667 | 24.167 | 22.033 | ||
| M3j | 26.033 | 26.233 | 30.333 | 21.000 | ||
| Rj | 10.466 | 5.700 | 16.400 | 4.400 | ||
| Trend | | | | | ||
| 300 d Compressive Strength | M1j | 24.767 | 34.000 | 30.700 | 34.800 | S/G > CaO/b > w/b > NaOH/b |
| M2j | 41.533 | 33.767 | 30.500 | 38.133 | ||
| M3j | 38.467 | 37.000 | 43.567 | 31.833 | ||
| Rj | 16.766 | 3.233 | 13.067 | 6.300 | ||
| Trend | | | | | ||
| 28 d Flexural Strength | M1j | 4.500 | 4.733 | 3.900 | 5.533 | CaO/b > NaOH/b > S/G > w/b |
| M2j | 6.200 | 5.267 | 5.500 | 5.700 | ||
| M3j | 5.767 | 6.467 | 7.067 | 5.233 | ||
| Rj | 1.700 | 1.734 | 3.167 | 0.467 | ||
| Trend | | | | | ||
| No. | Fluidity (mm) | Porosity (%) | Compressive Strength (MPa) | 28 d Flexural Strength (MPa) | |
|---|---|---|---|---|---|
| 3 d | 28 d | ||||
| O1 | 191 ± 4 | 20.5 ± 0.5 | 22.9 ± 0.6 | 32.3 ± 0.4 | 8.0 ± 0.2 |
| O2 | 181 ± 3 | 21.2 ± 0.4 | 24.3 ± 1.1 | 35.4 ± 0.9 | 7.1 ± 0.3 |
| O3 | 195 ± 4 | 22.7 ± 0.6 | 21.9 ± 0.8 | 33.0 ± 0.7 | 7.1 ± 0.4 |
| M7 | 182 ± 6 | 21.9 ± 0.5 | 17.8 ± 0.4 | 30.5 ± 0.3 | 6.8 ± 0.4 |
Publisher’s Note: MDPI stays neutral with regard to jurisdictional claims in published maps and institutional affiliations. |
© 2022 by the authors. Licensee MDPI, Basel, Switzerland. This article is an open access article distributed under the terms and conditions of the Creative Commons Attribution (CC BY) license (https://creativecommons.org/licenses/by/4.0/).
Share and Cite
Lin, Y.; Xu, D.; Ji, W.; Zhao, X. Experiment on the Properties of Soda Residue-Activated Ground Granulated Blast Furnace Slag Mortars with Different Activators. Materials 2022, 15, 3578. https://0-doi-org.brum.beds.ac.uk/10.3390/ma15103578
Lin Y, Xu D, Ji W, Zhao X. Experiment on the Properties of Soda Residue-Activated Ground Granulated Blast Furnace Slag Mortars with Different Activators. Materials. 2022; 15(10):3578. https://0-doi-org.brum.beds.ac.uk/10.3390/ma15103578
Chicago/Turabian StyleLin, Yonghui, Dongqiang Xu, Wenguang Ji, and Xianhui Zhao. 2022. "Experiment on the Properties of Soda Residue-Activated Ground Granulated Blast Furnace Slag Mortars with Different Activators" Materials 15, no. 10: 3578. https://0-doi-org.brum.beds.ac.uk/10.3390/ma15103578