
Graphene Oxide@Heavy Metal Ions (GO@M) Complex Simulated Waste as an Efficient Adsorbent for Removal of Cationic Methylene Blue Dye from Contaminated Water

 , , and
Abstract
:
1. Introduction
2. Materials and Methods
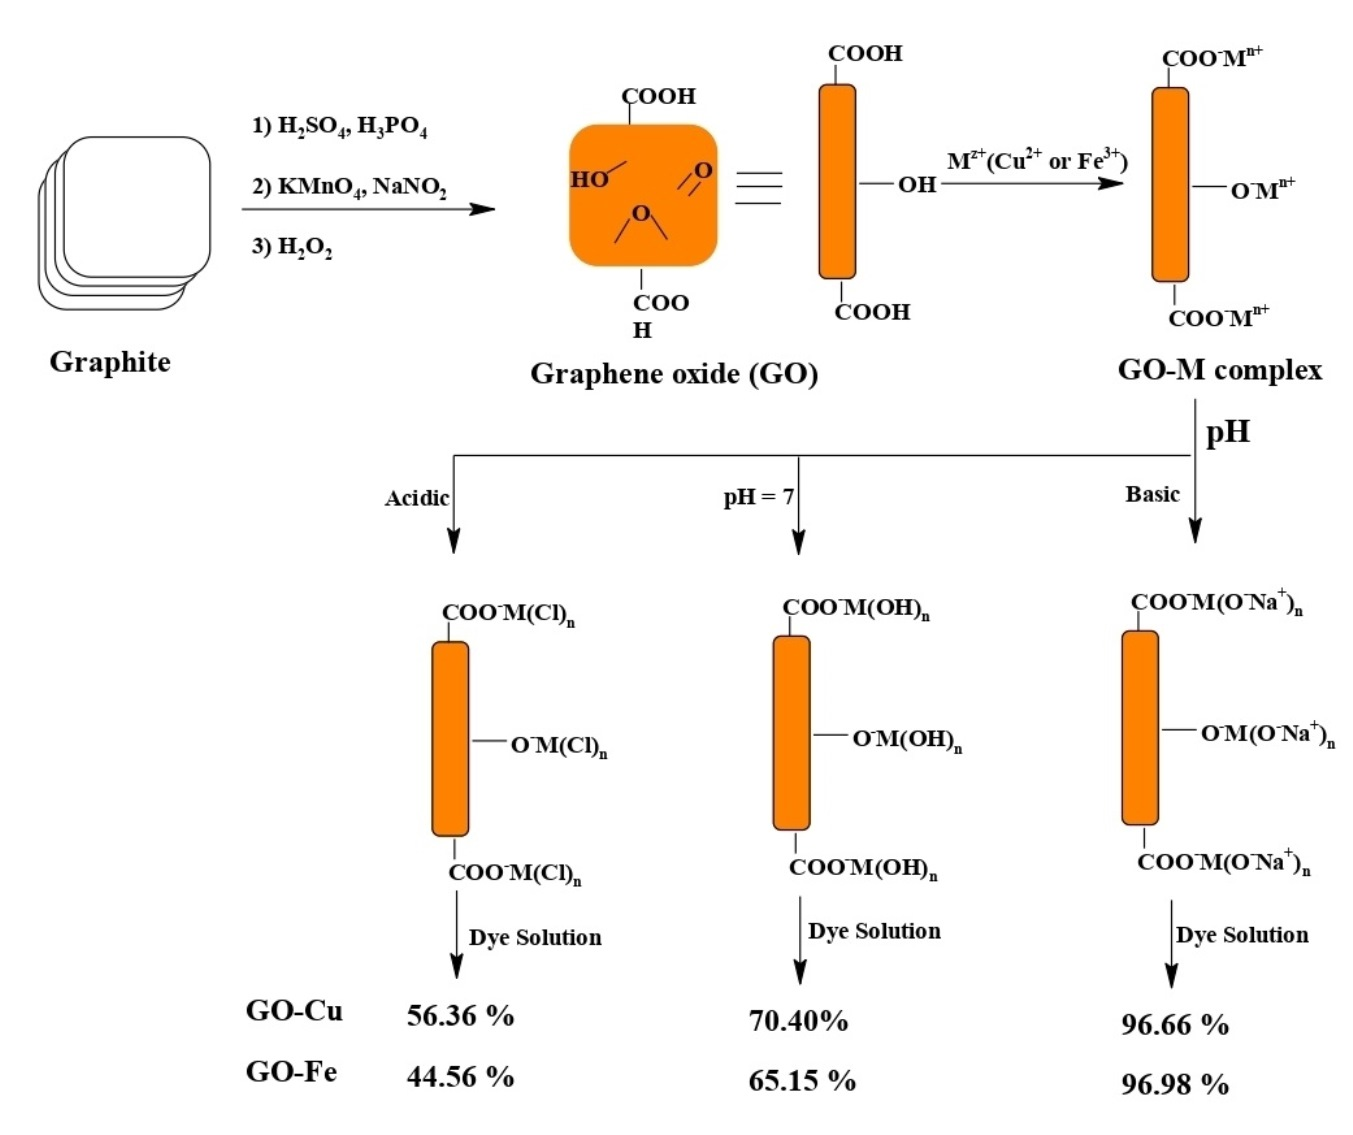
2.1. Preparation of GO
2.2. Preparation of GO@Cu or GO@Fe Composites
2.3. Batch Adsorption of MB-Dye
3. Results and Discussion
3.1. Physical and Chemical Characterizations
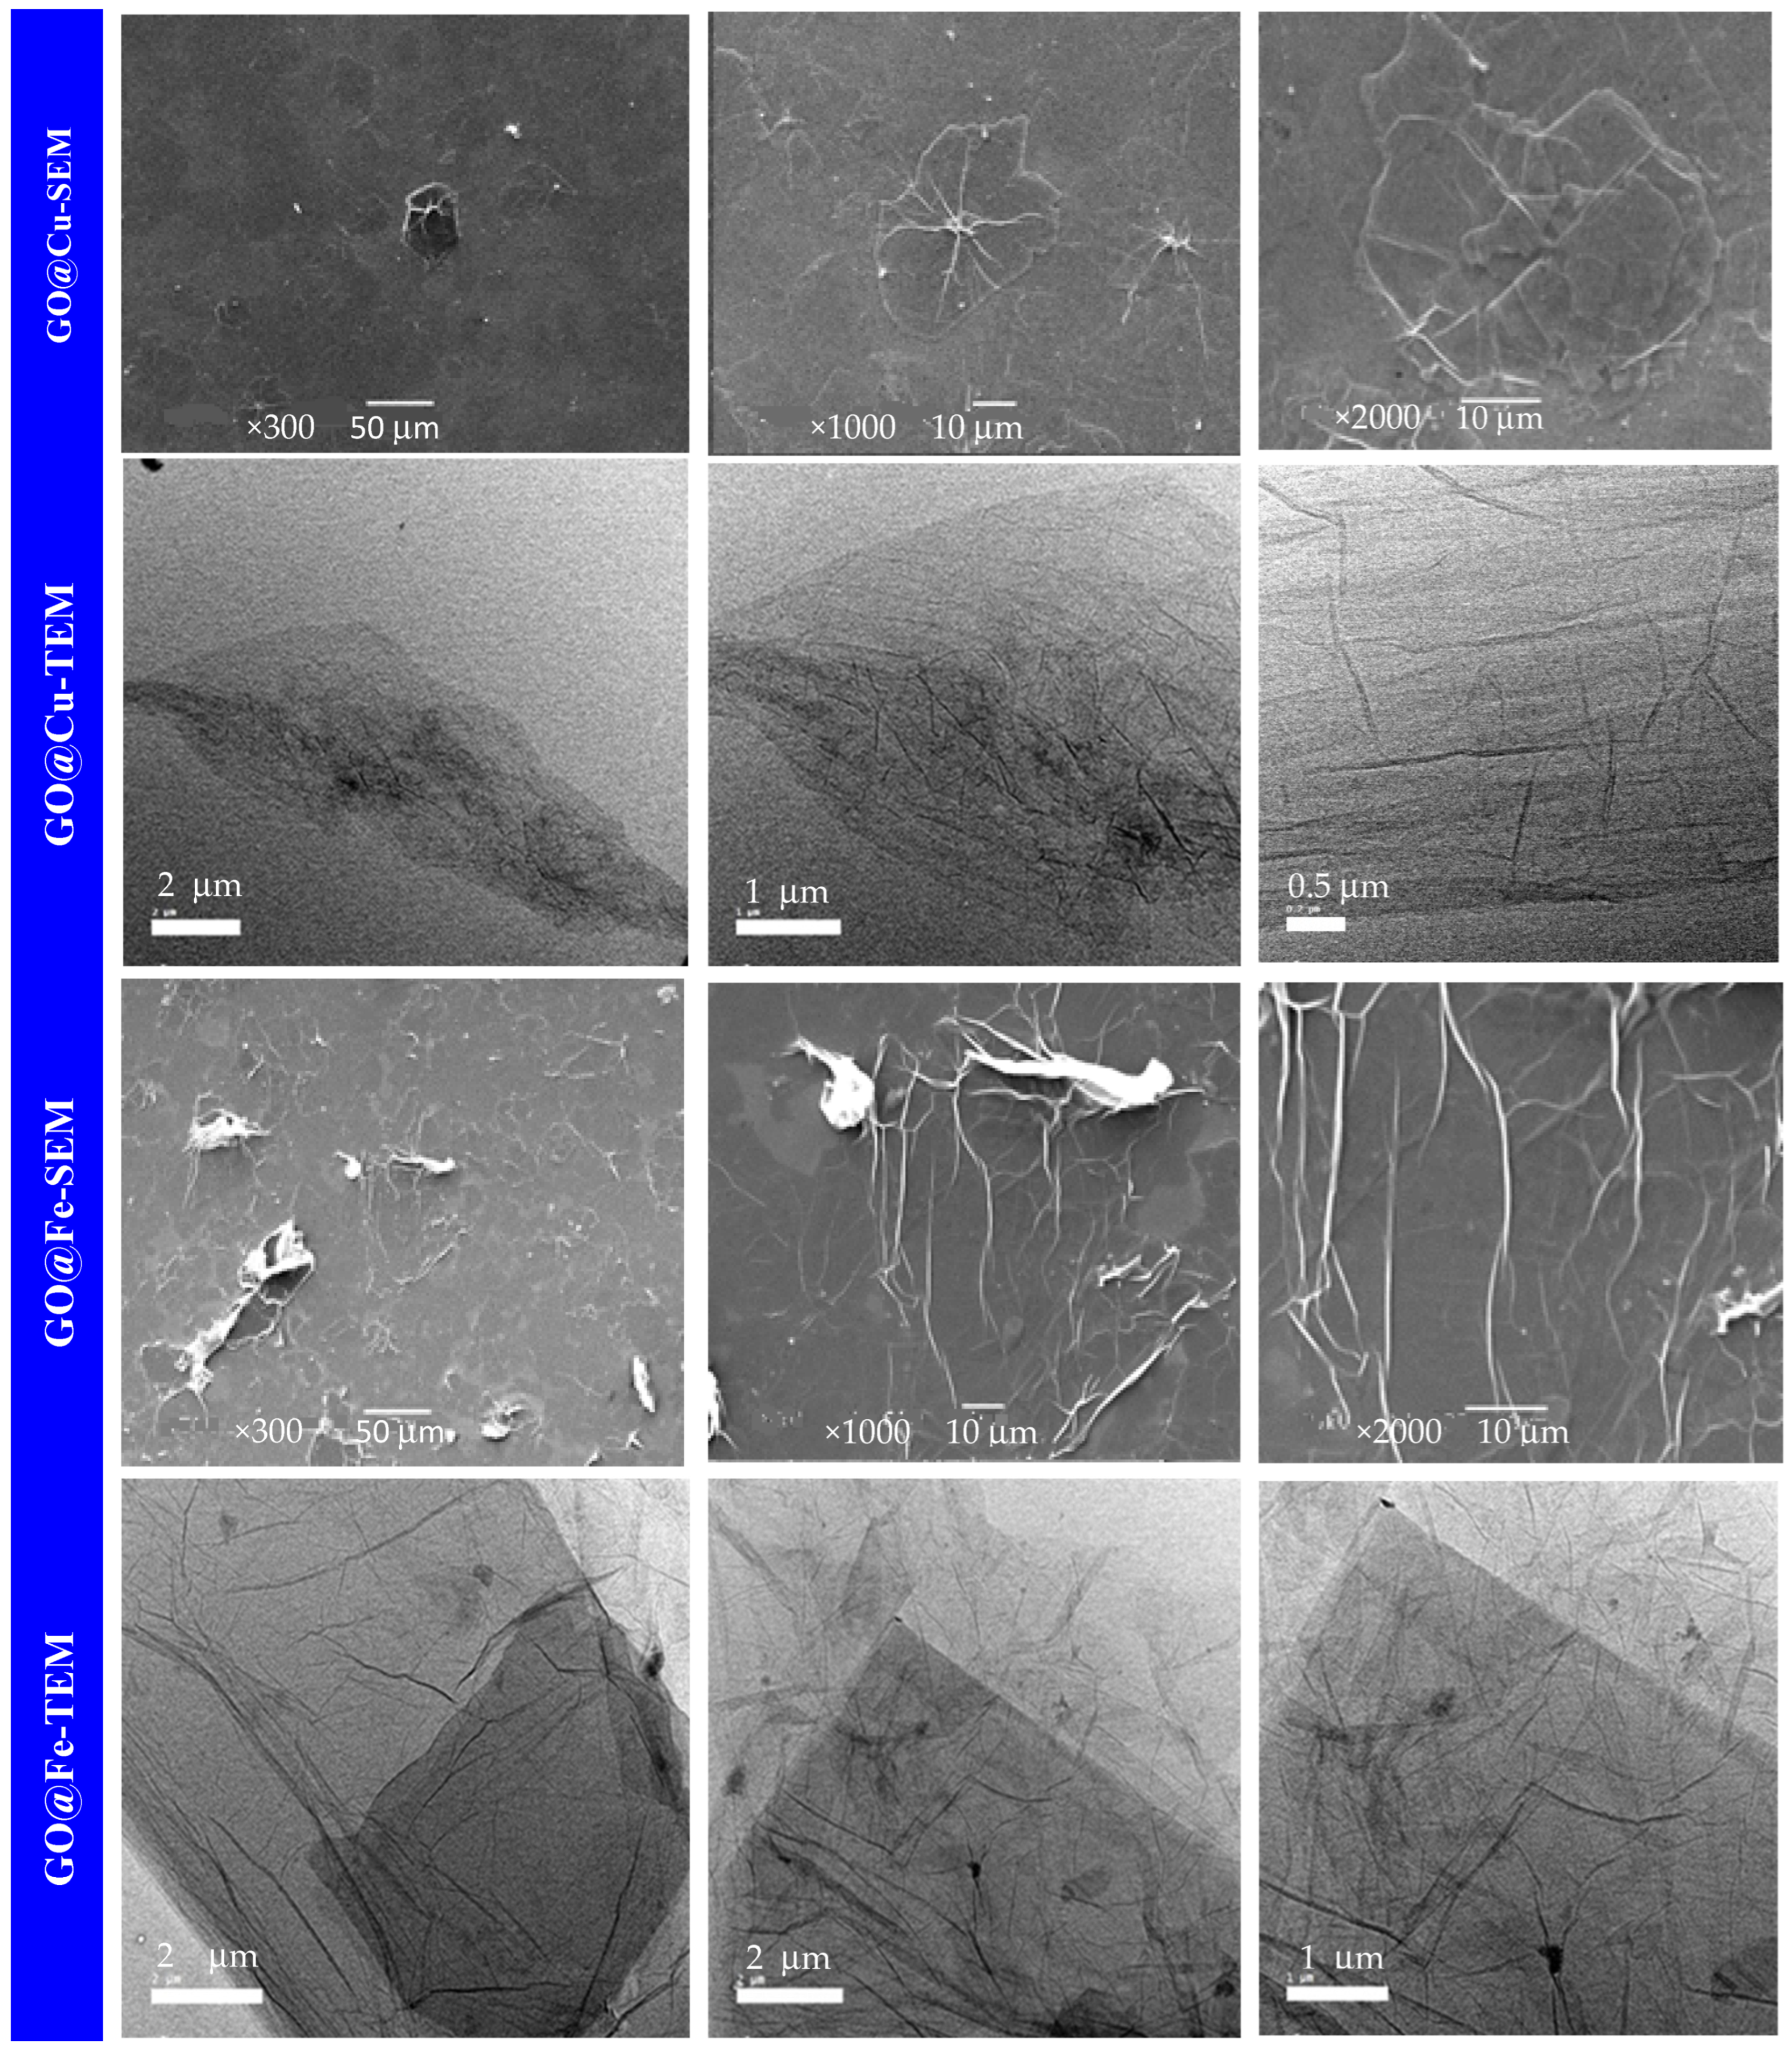
3.1.1. SEM and TEM
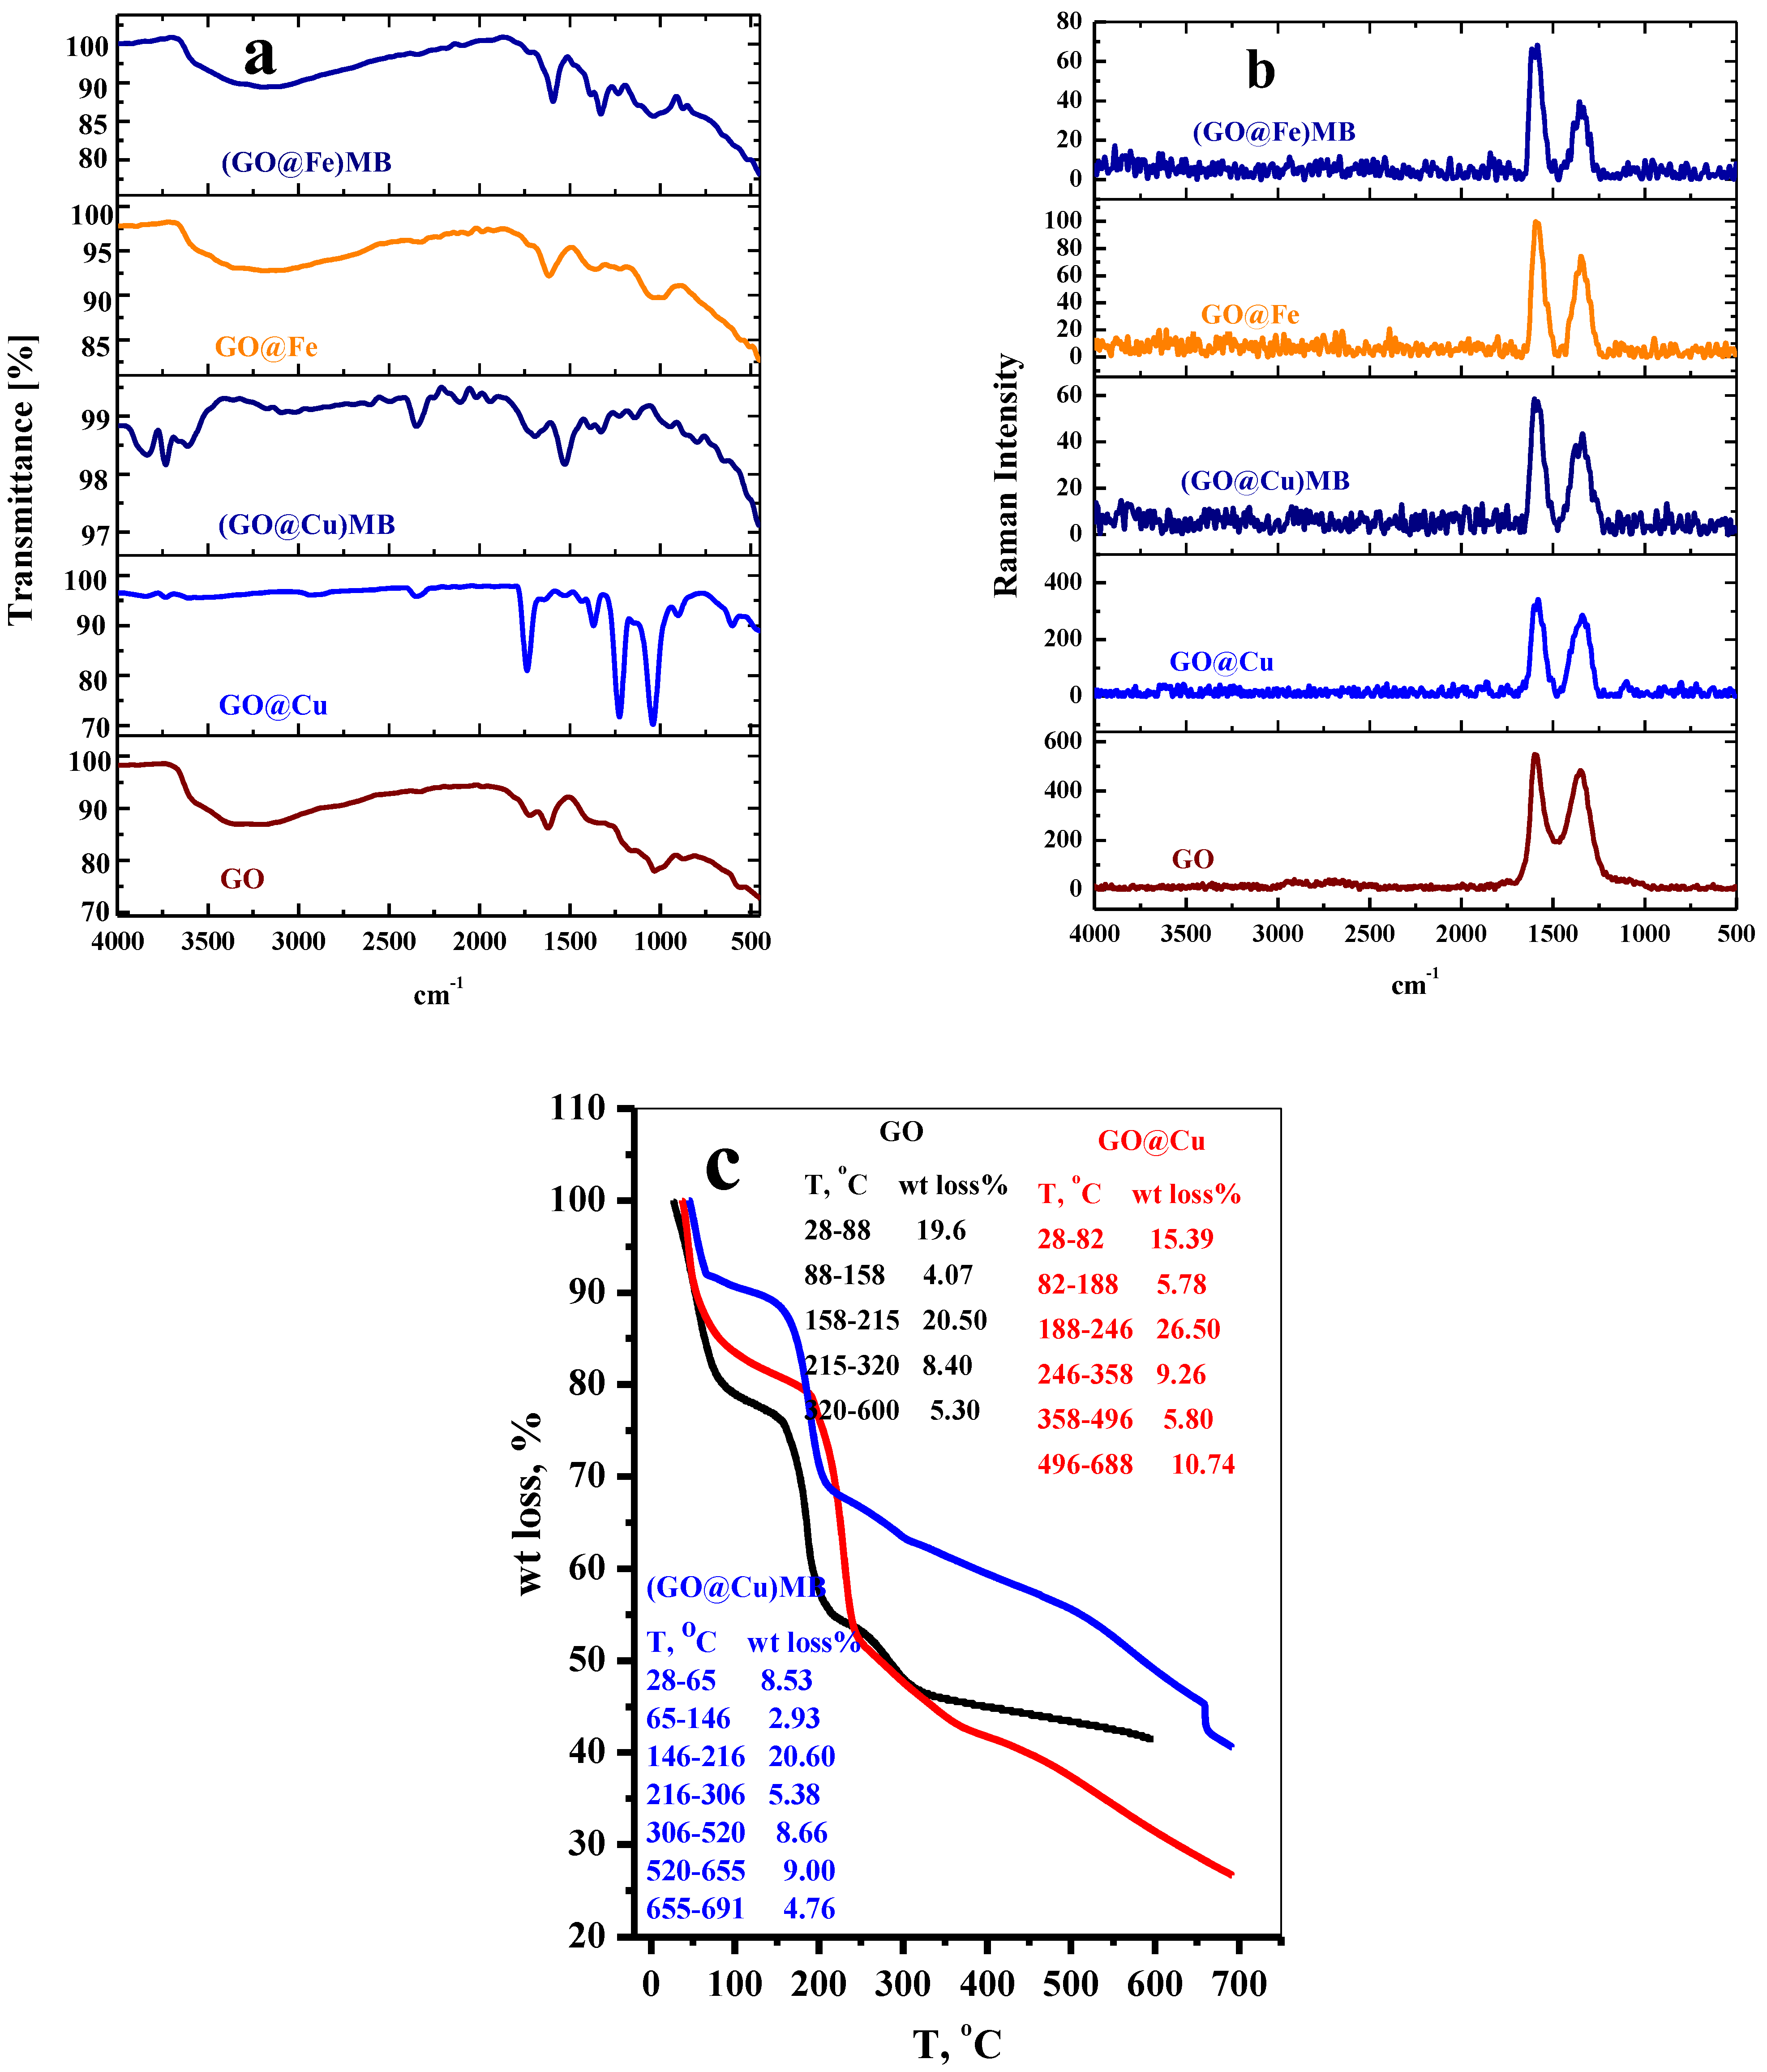
3.1.2. FTIR
3.1.3. Raman Analysis
3.1.4. TGA Analysis
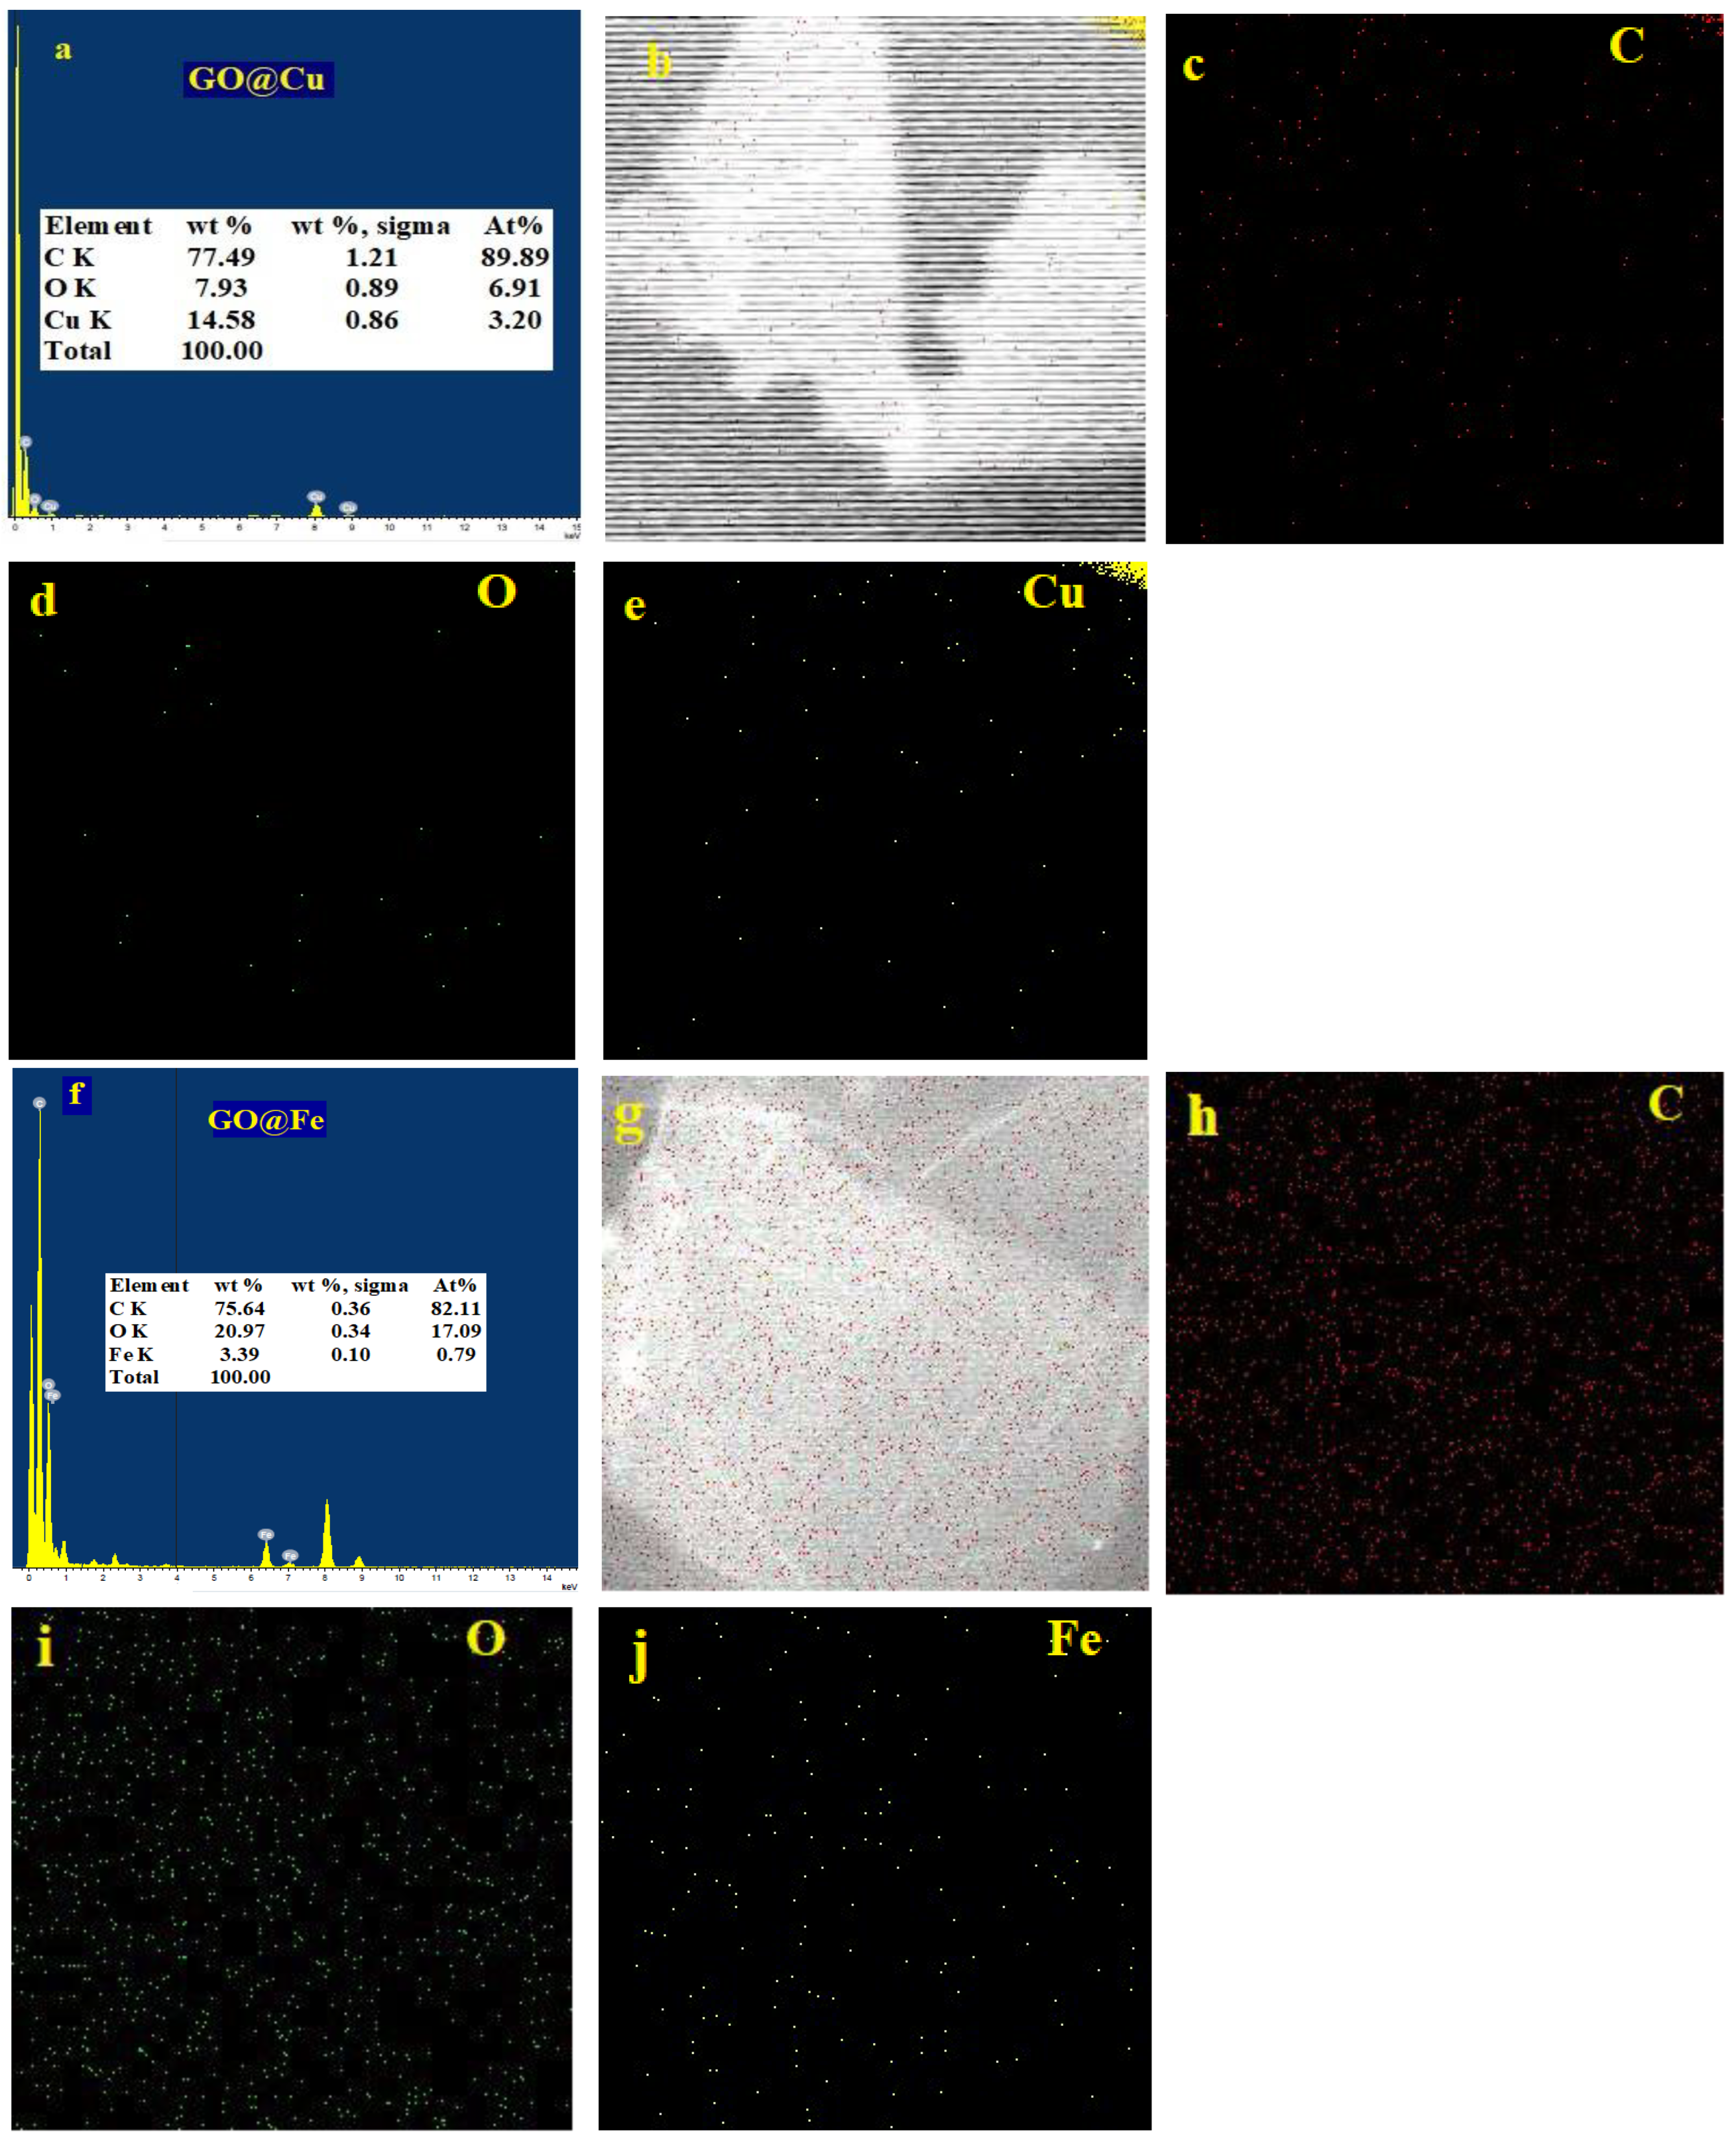
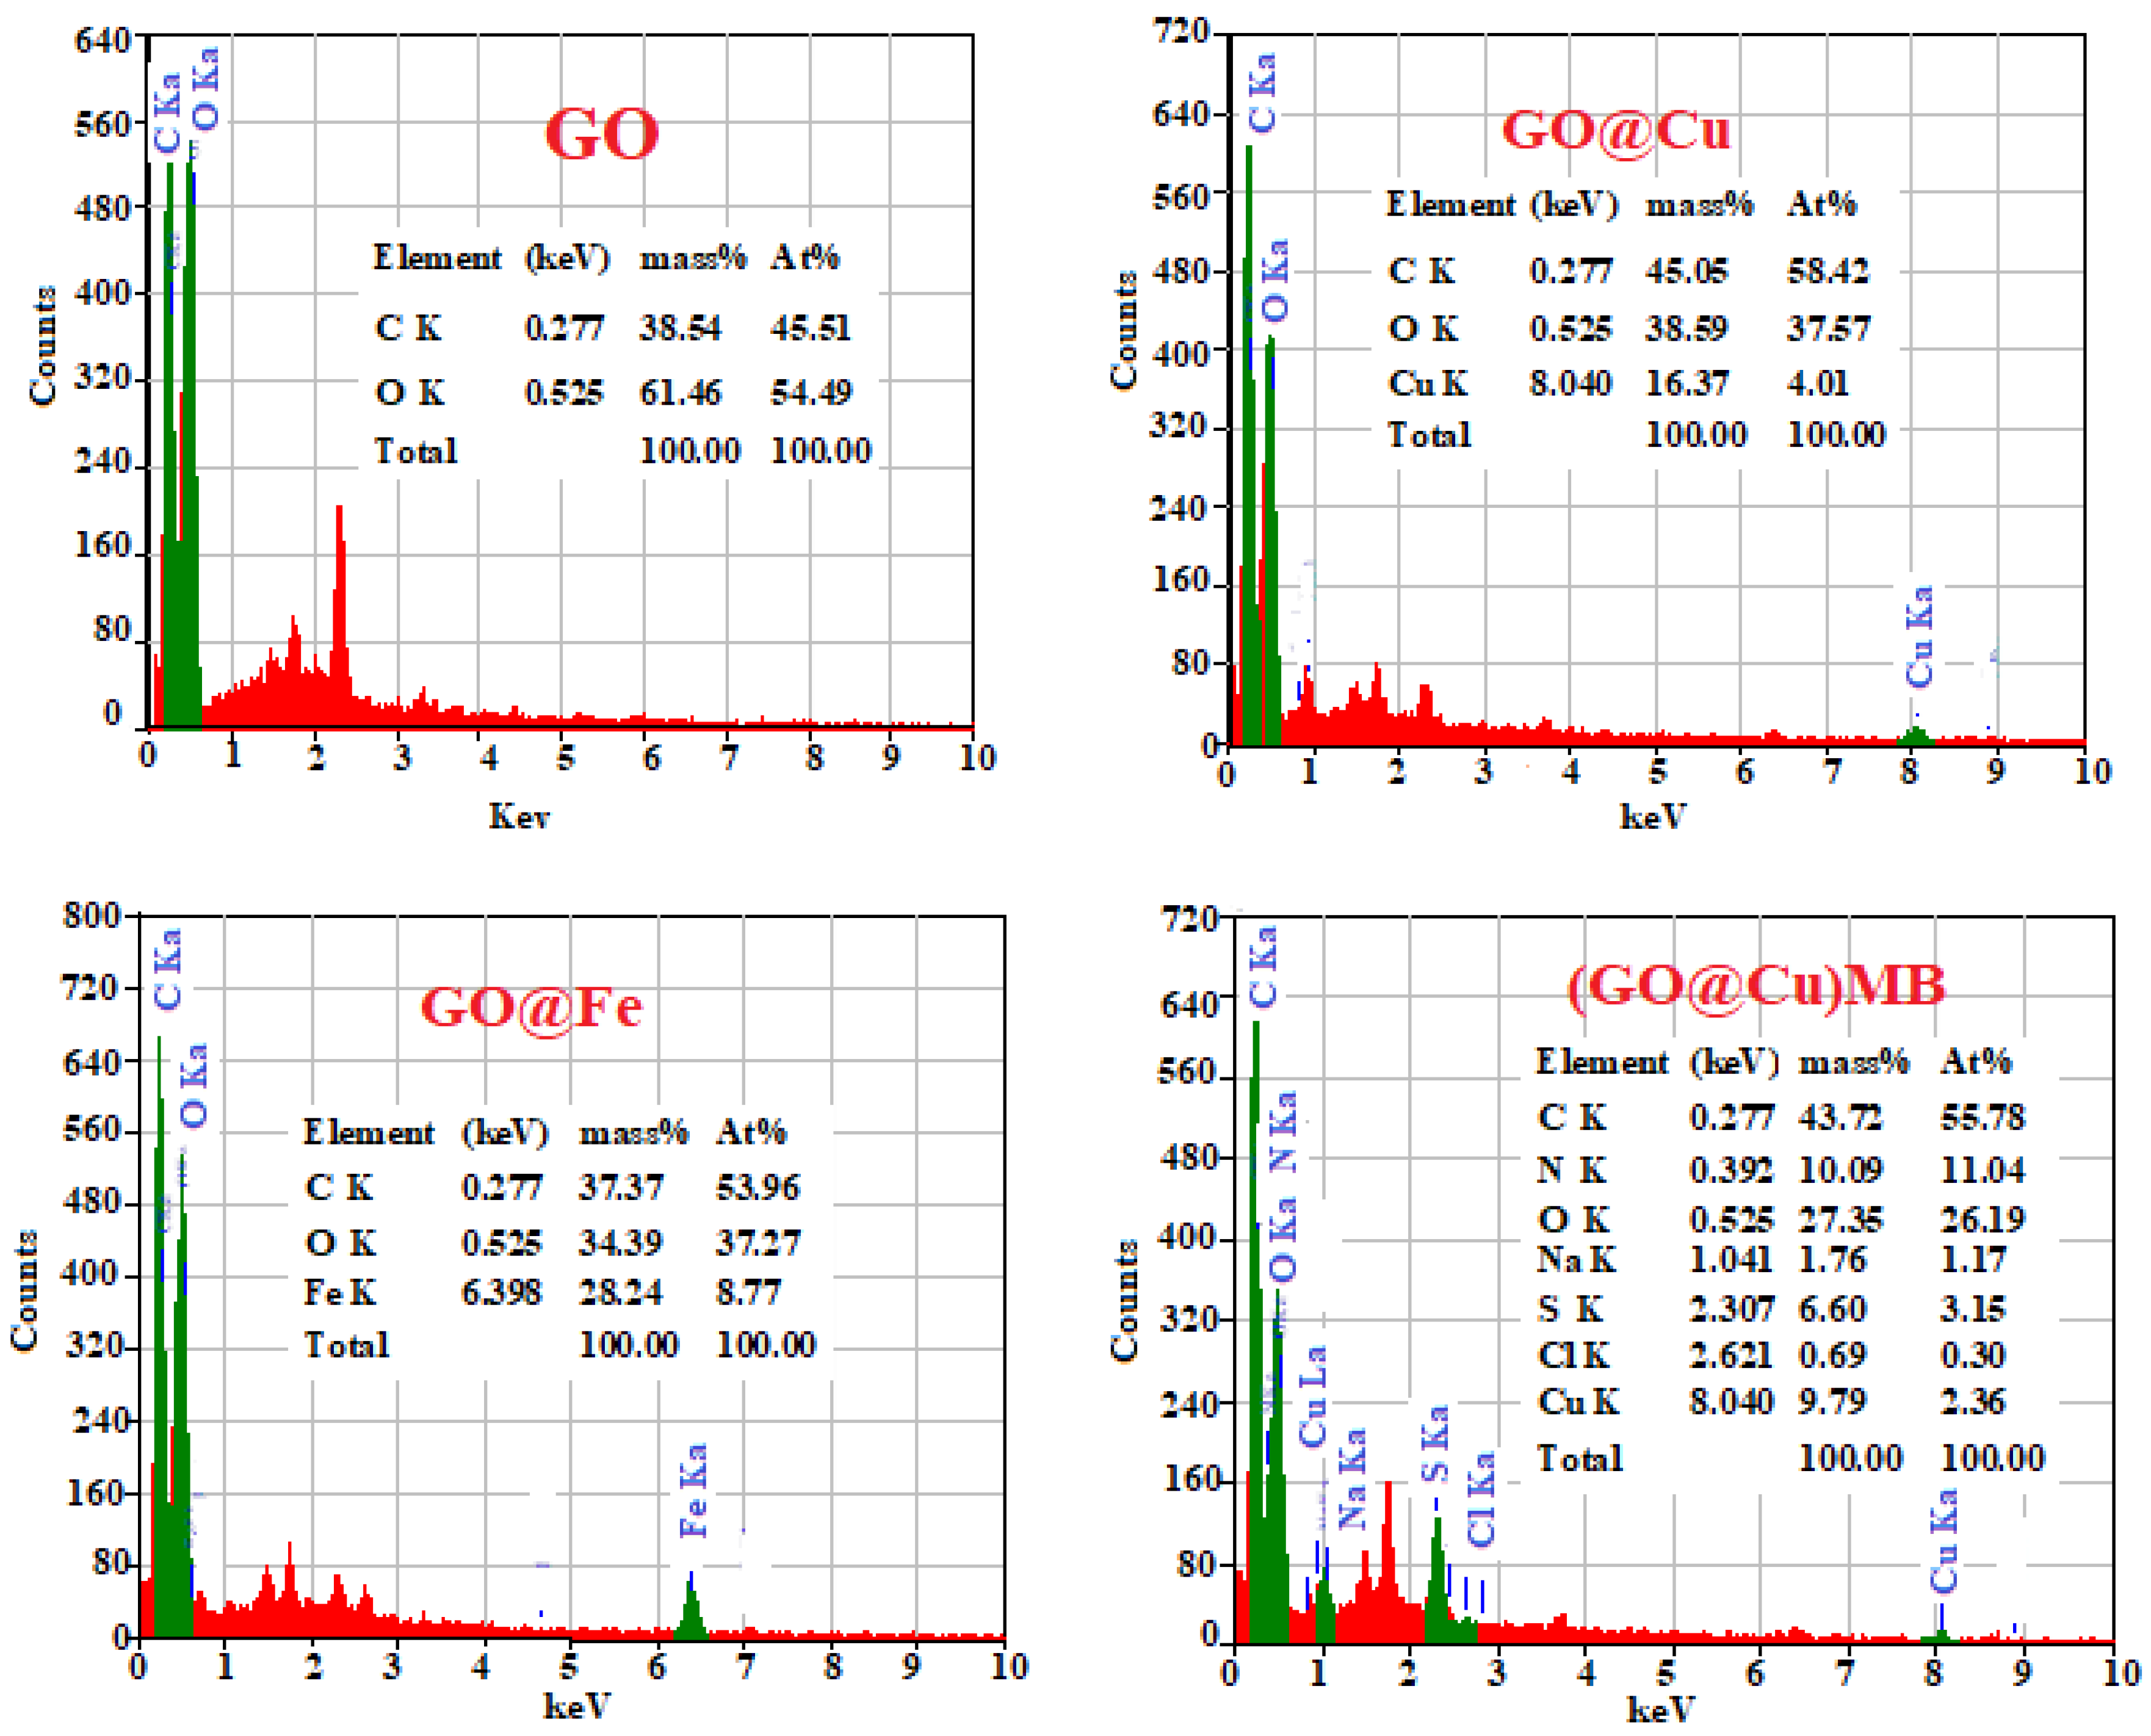
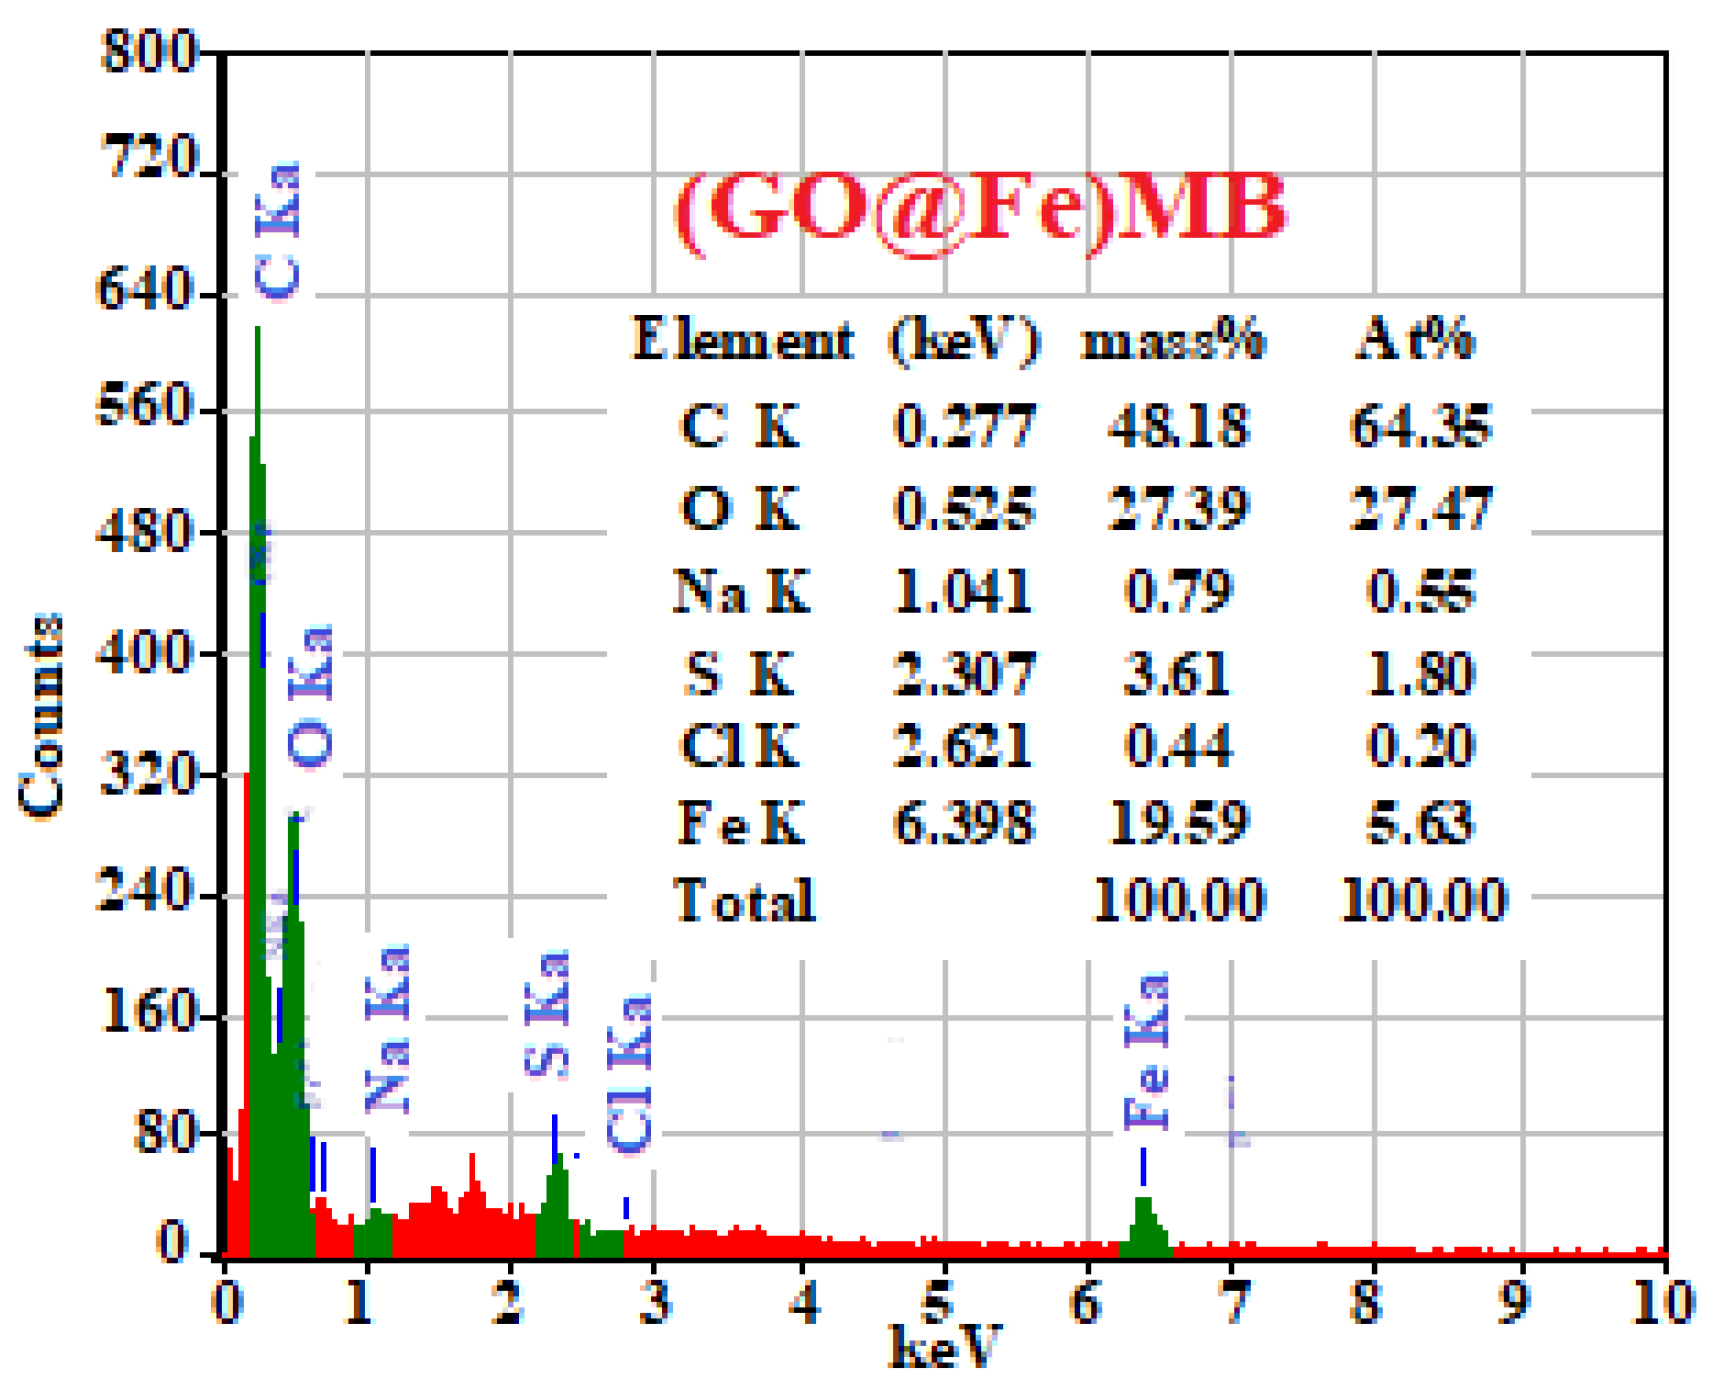
3.1.5. EDS Analysis
3.2. Adsorption Parameters
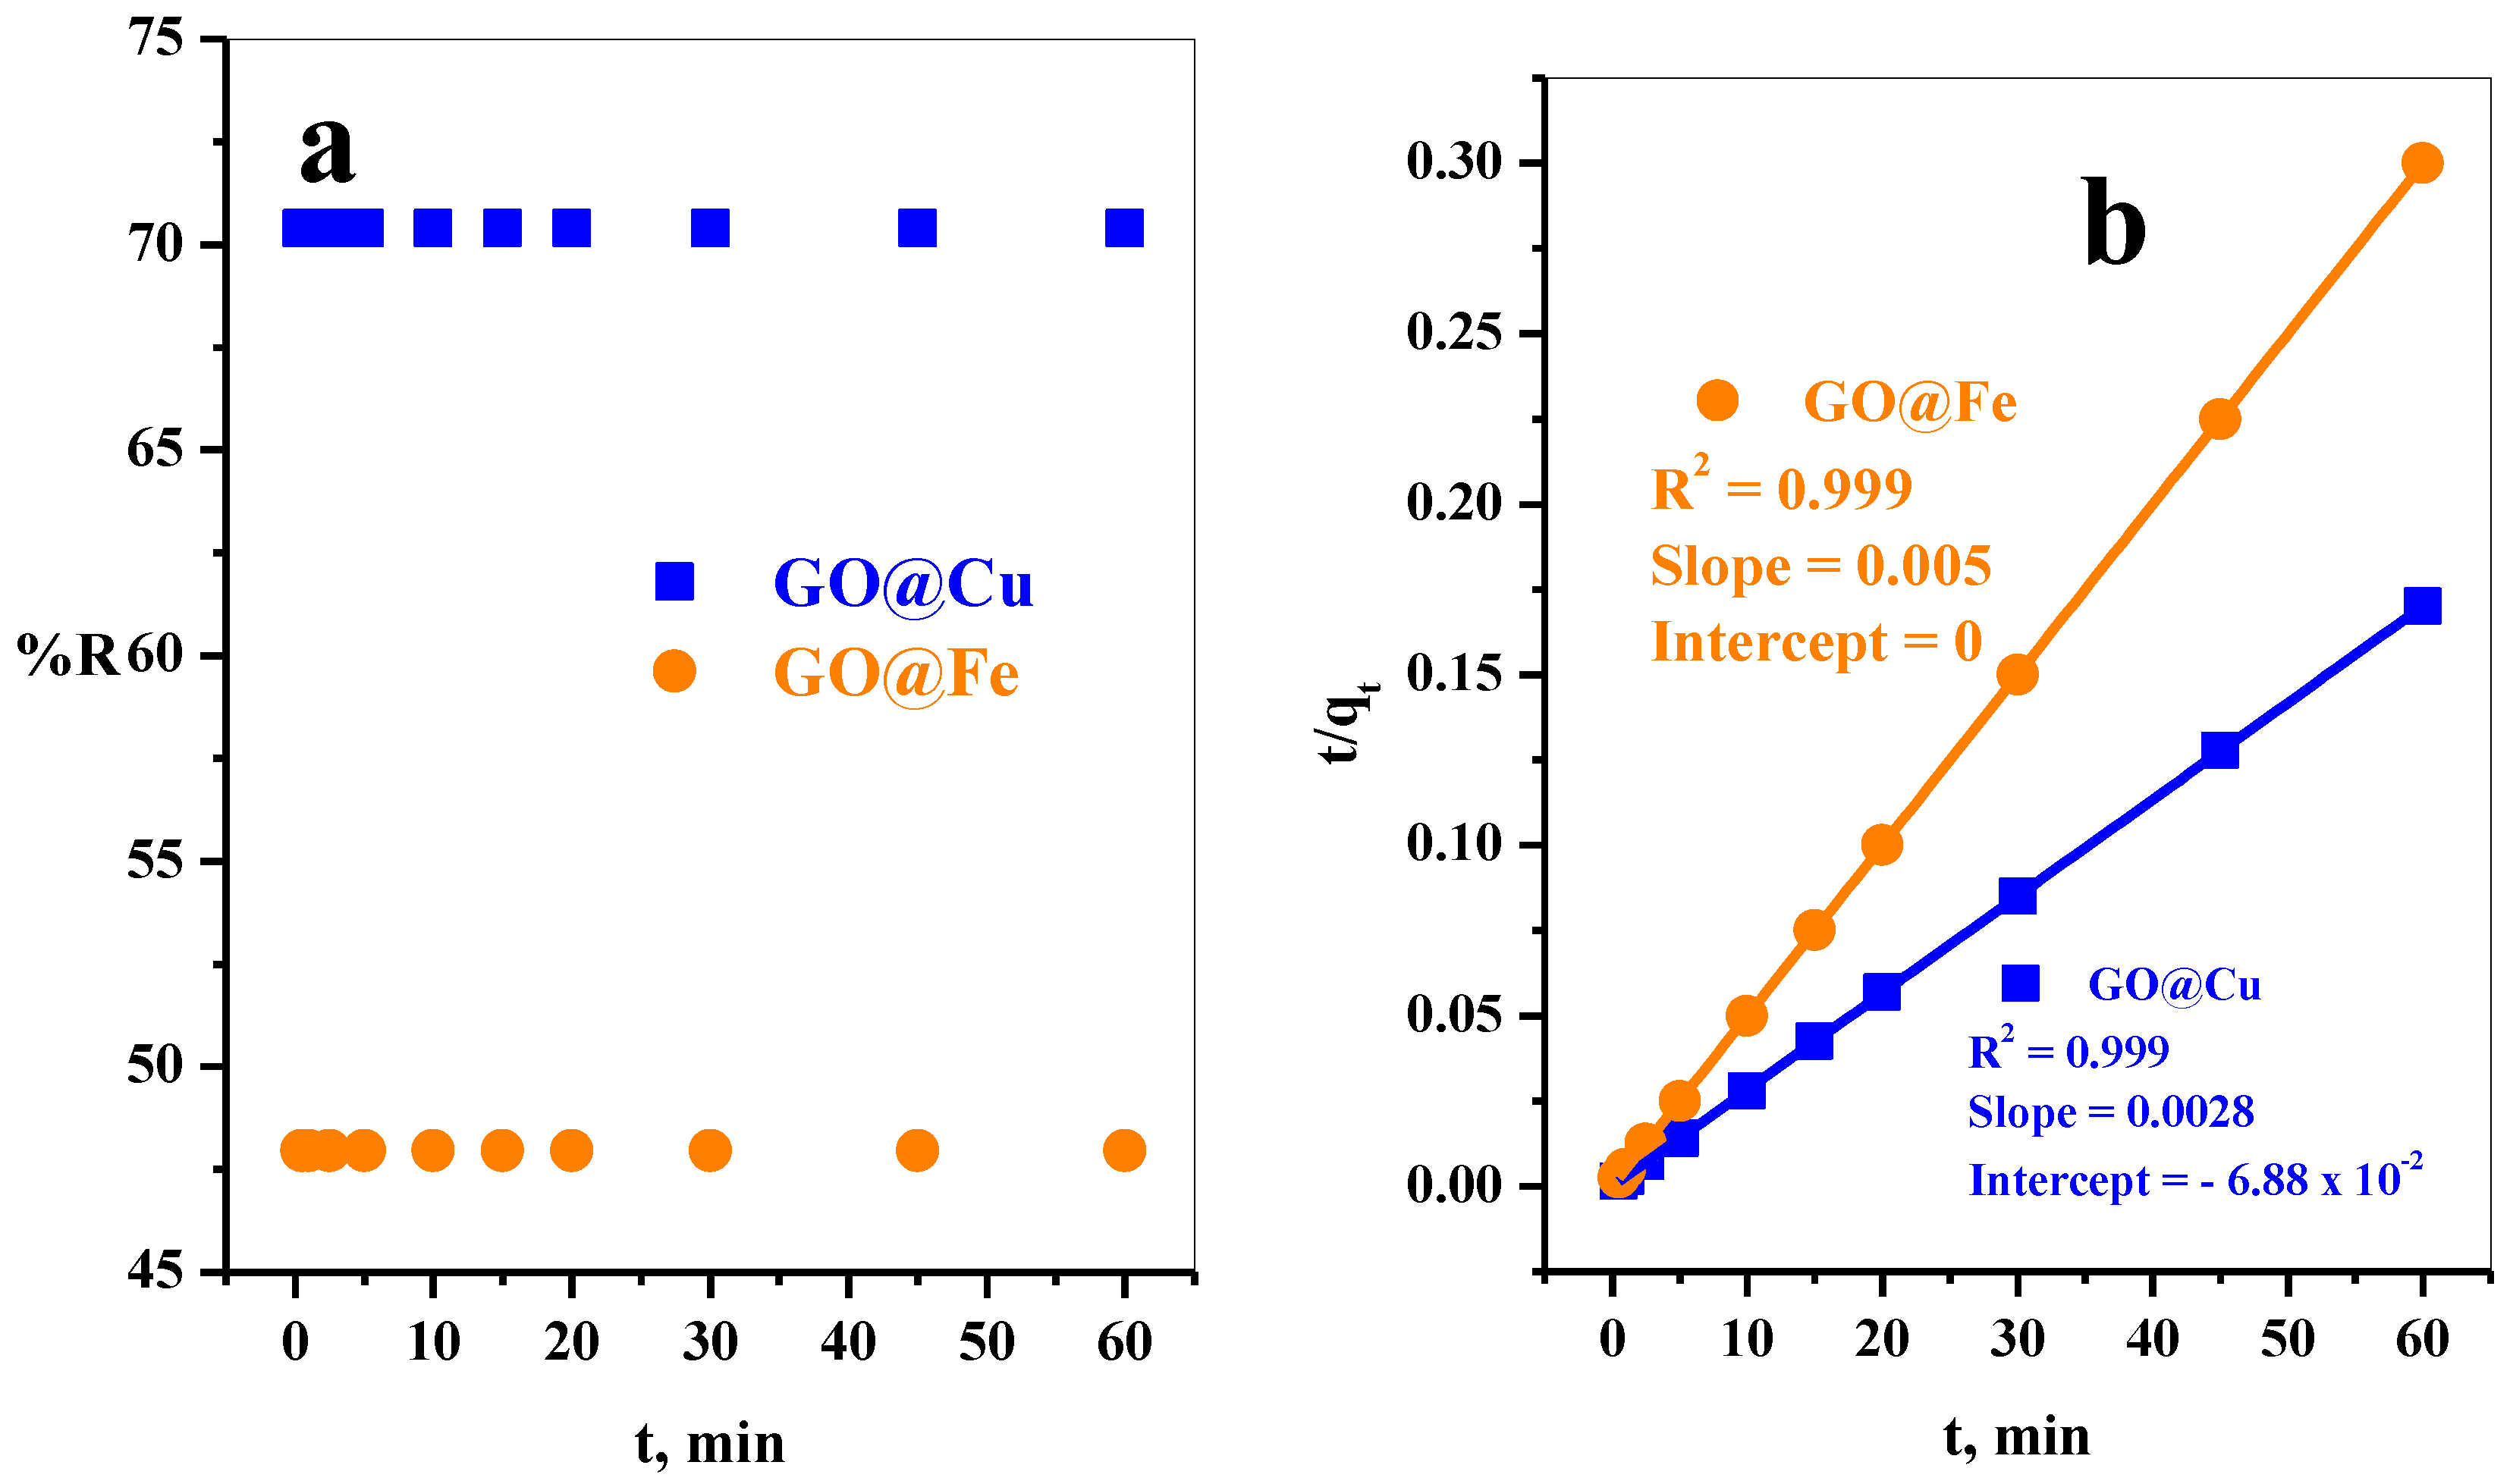
3.2.1. Effect of Contact Time
Adsorption Kinetics Evaluation
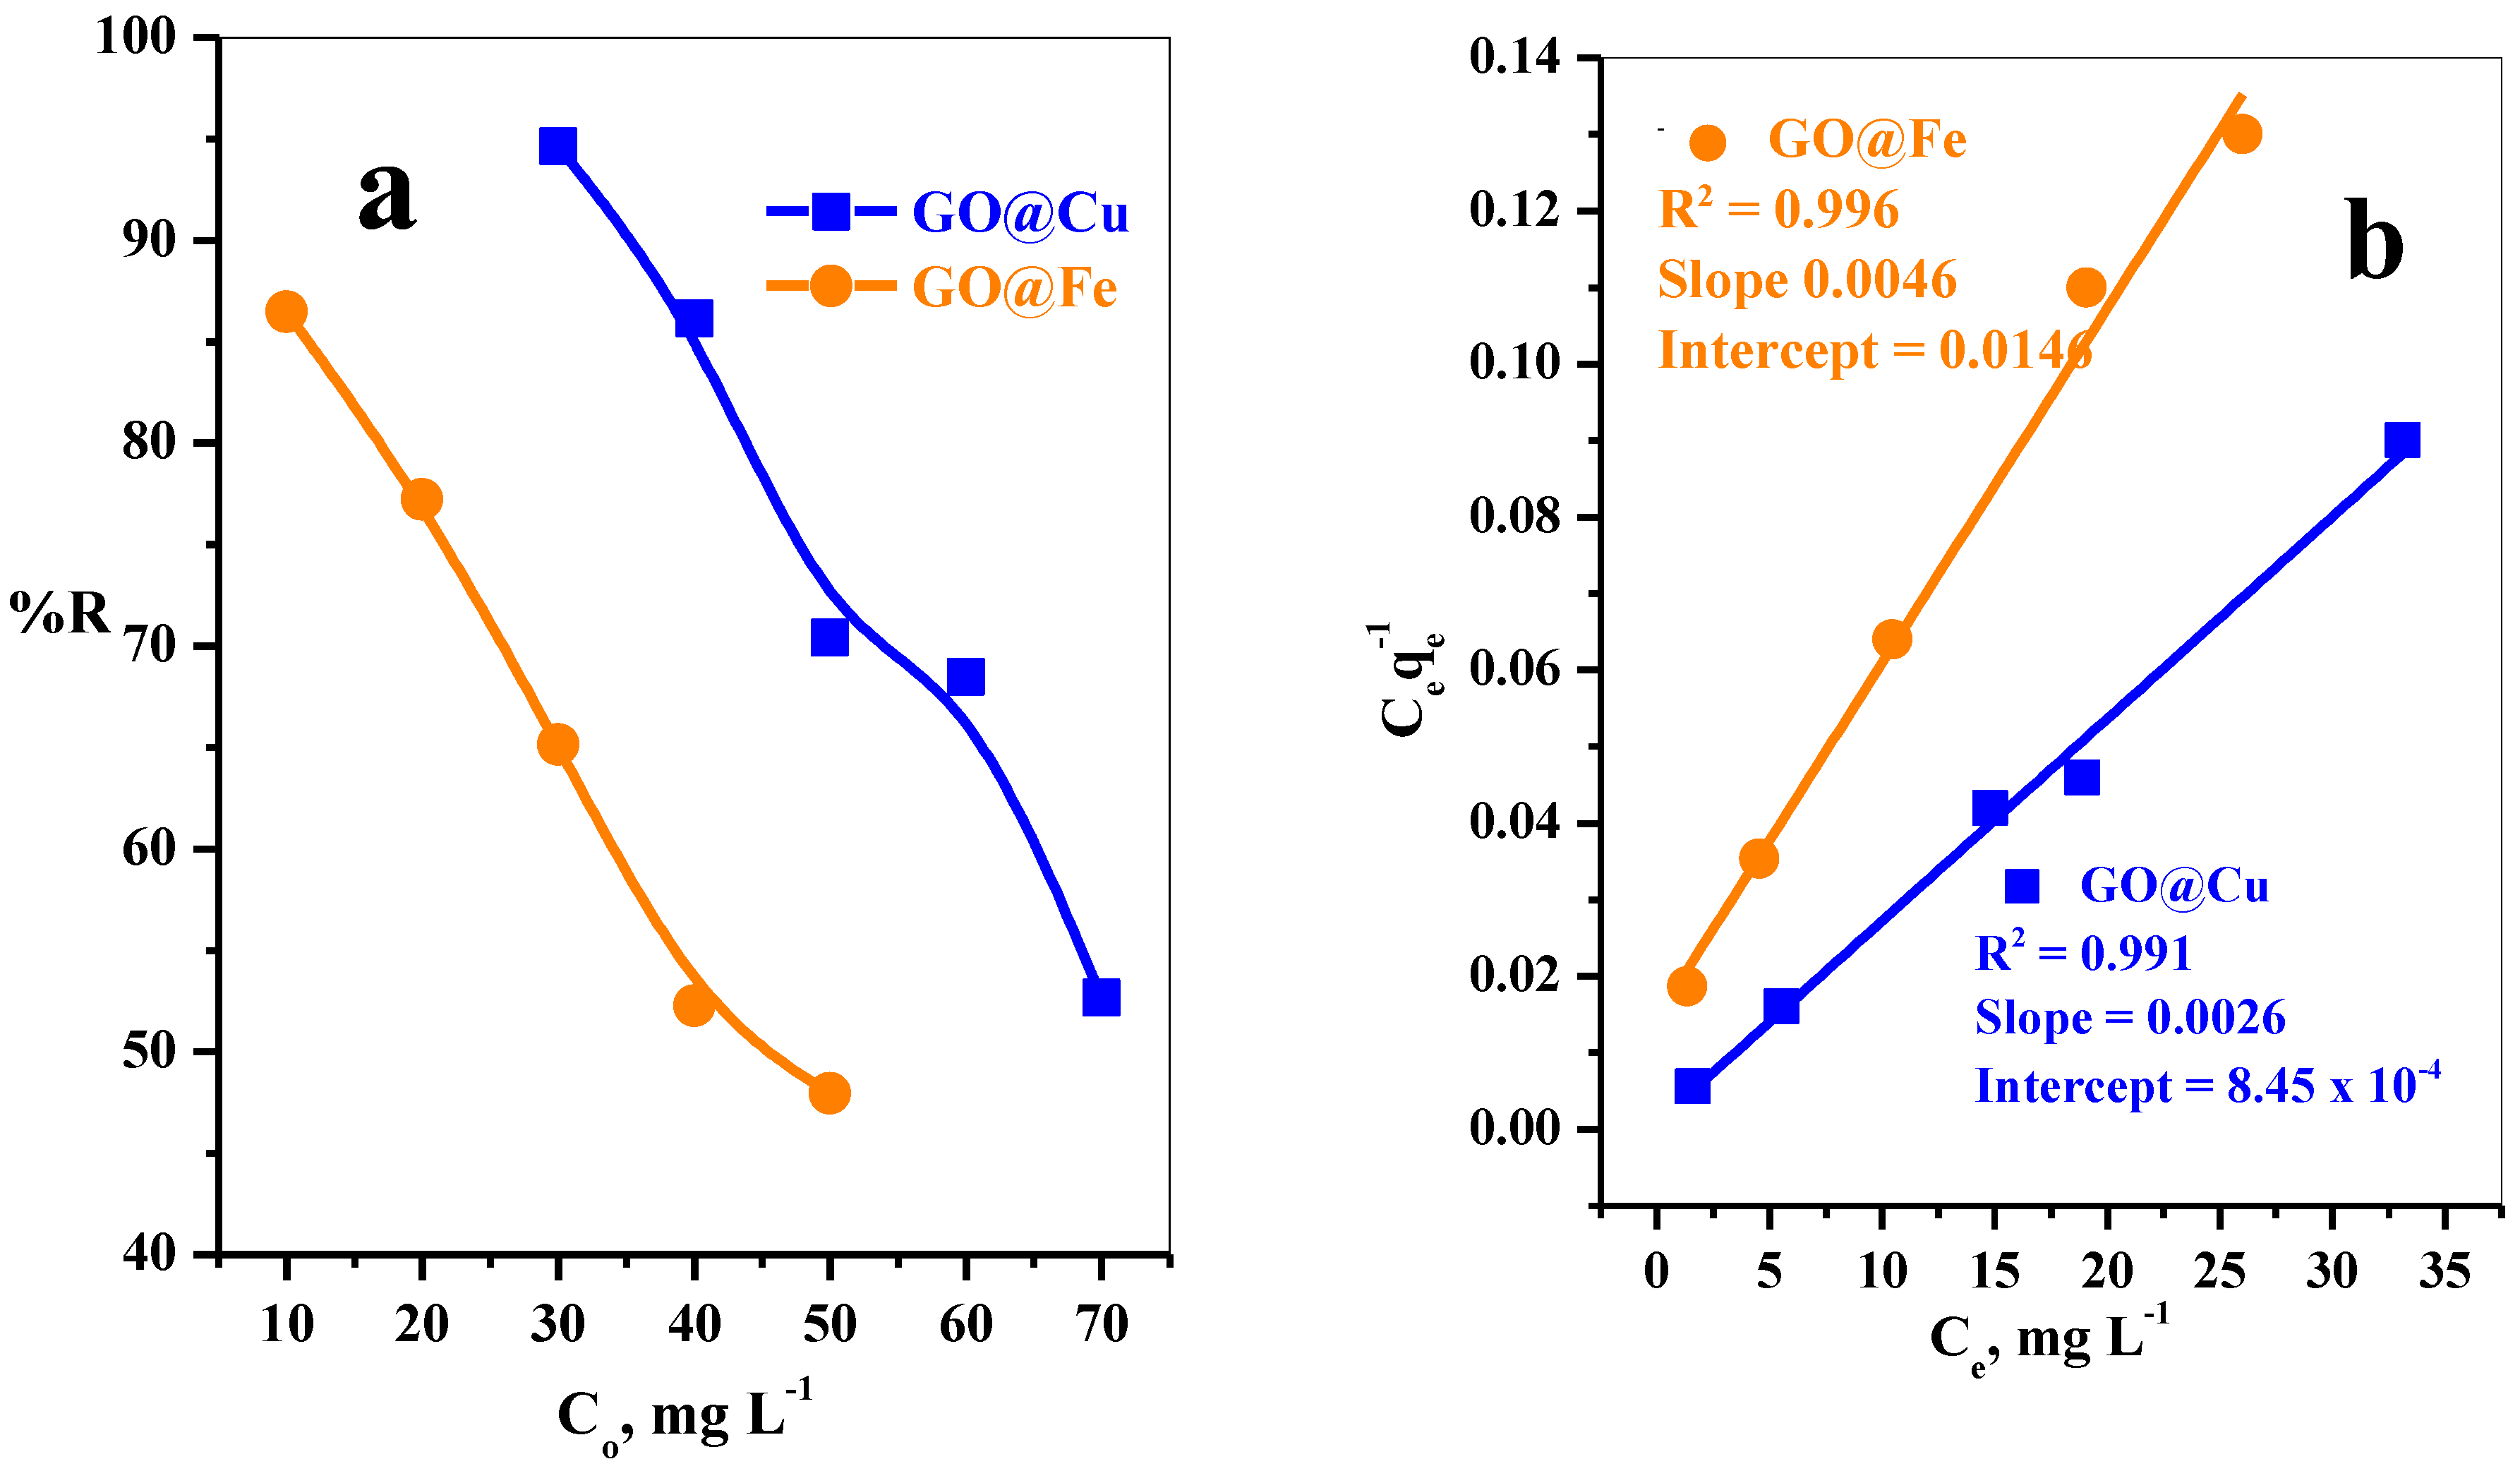
3.2.2. Effect of Initial Dye Concentration
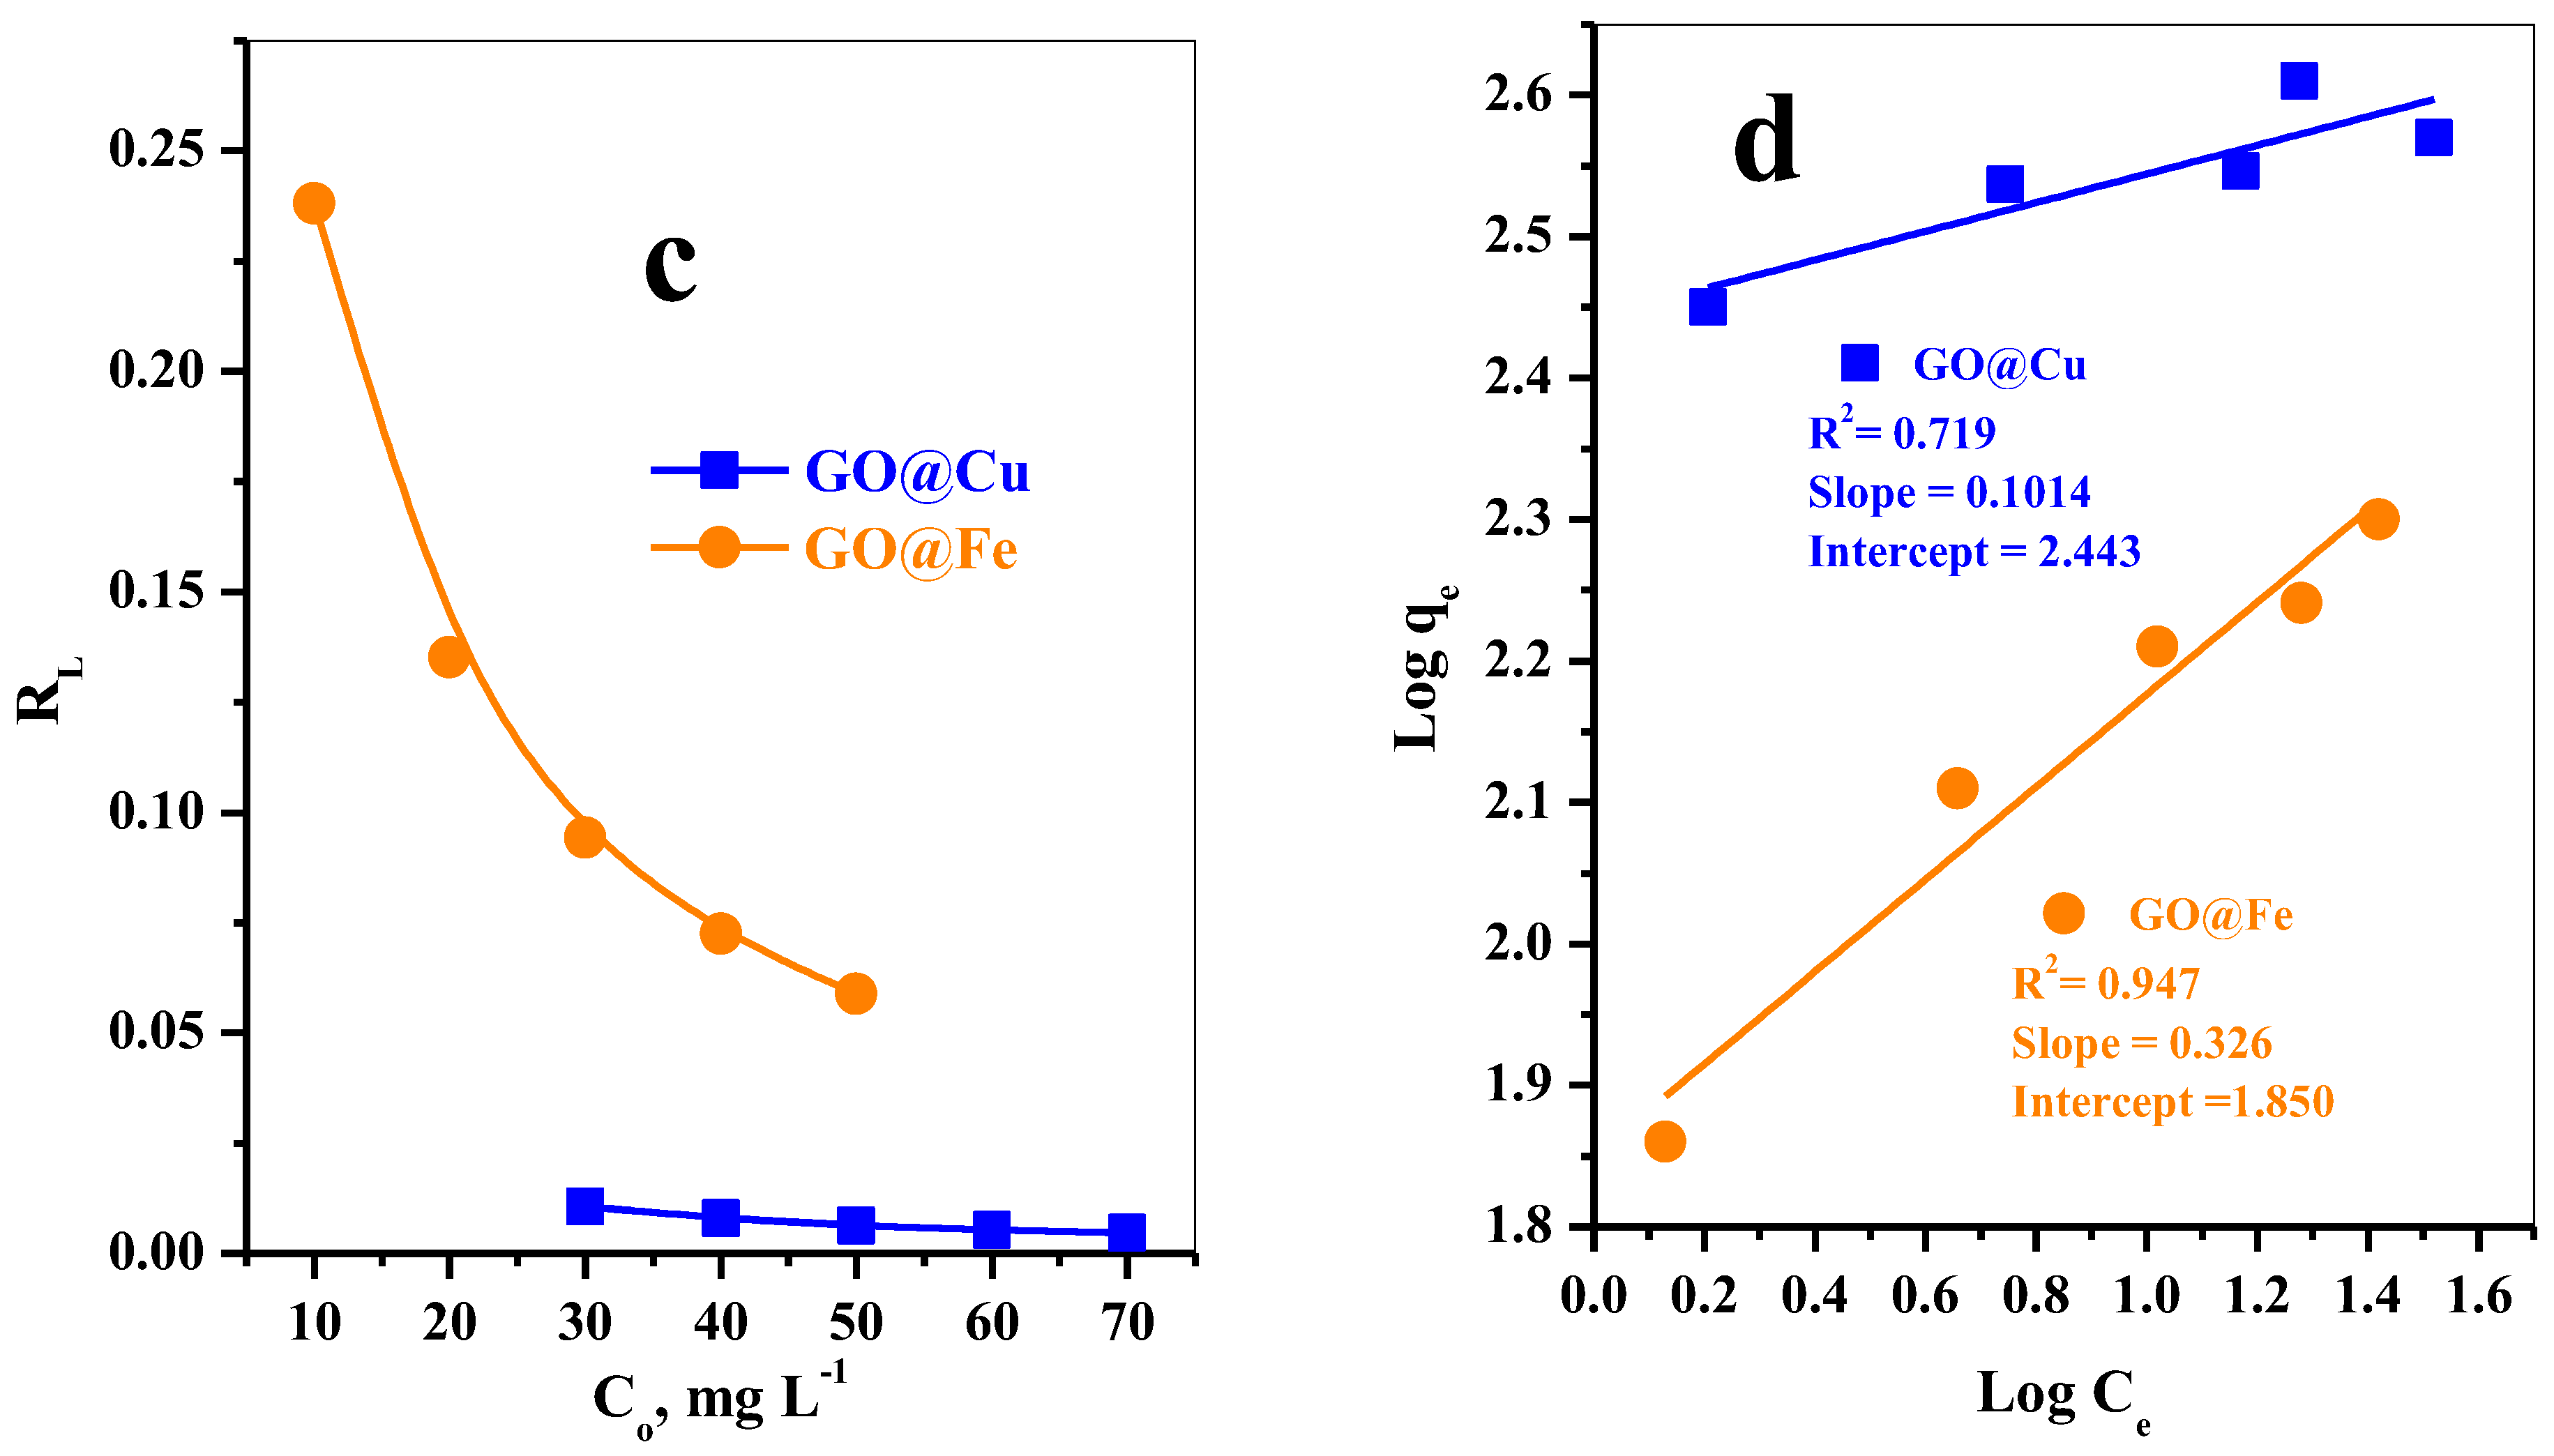
Adsorption Isotherm Study
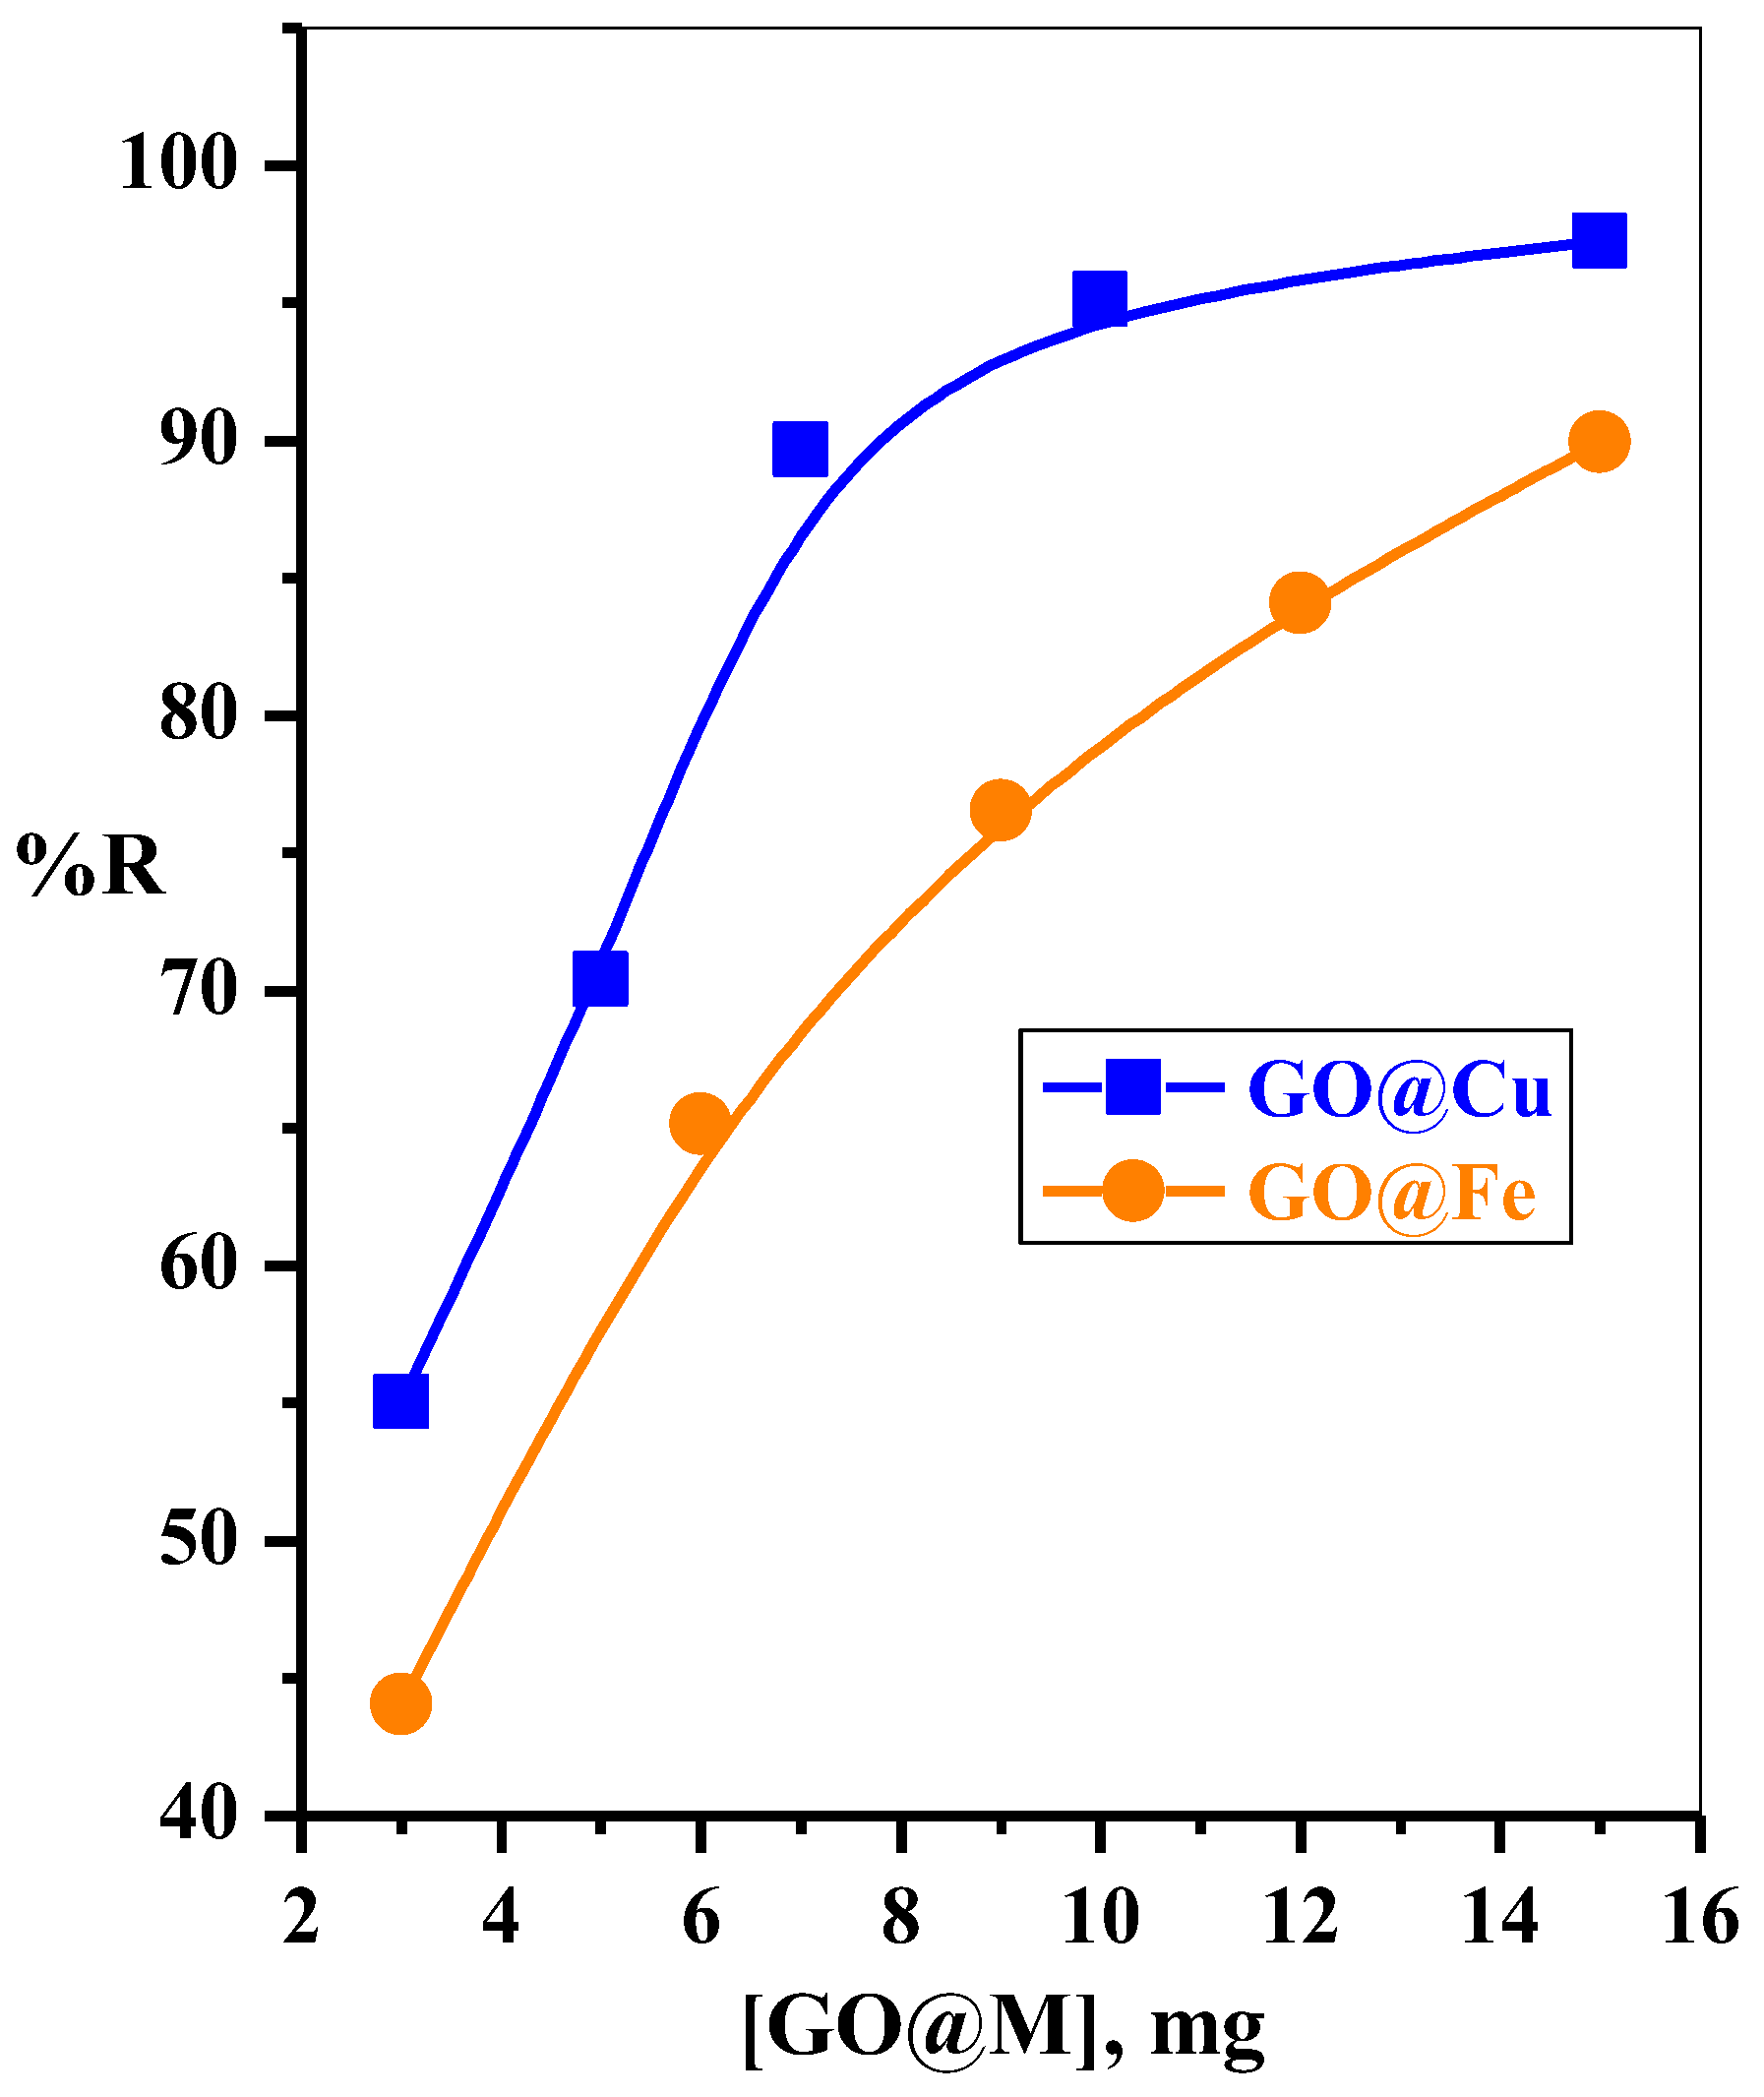
3.2.3. Effect of Adsorbent Dose
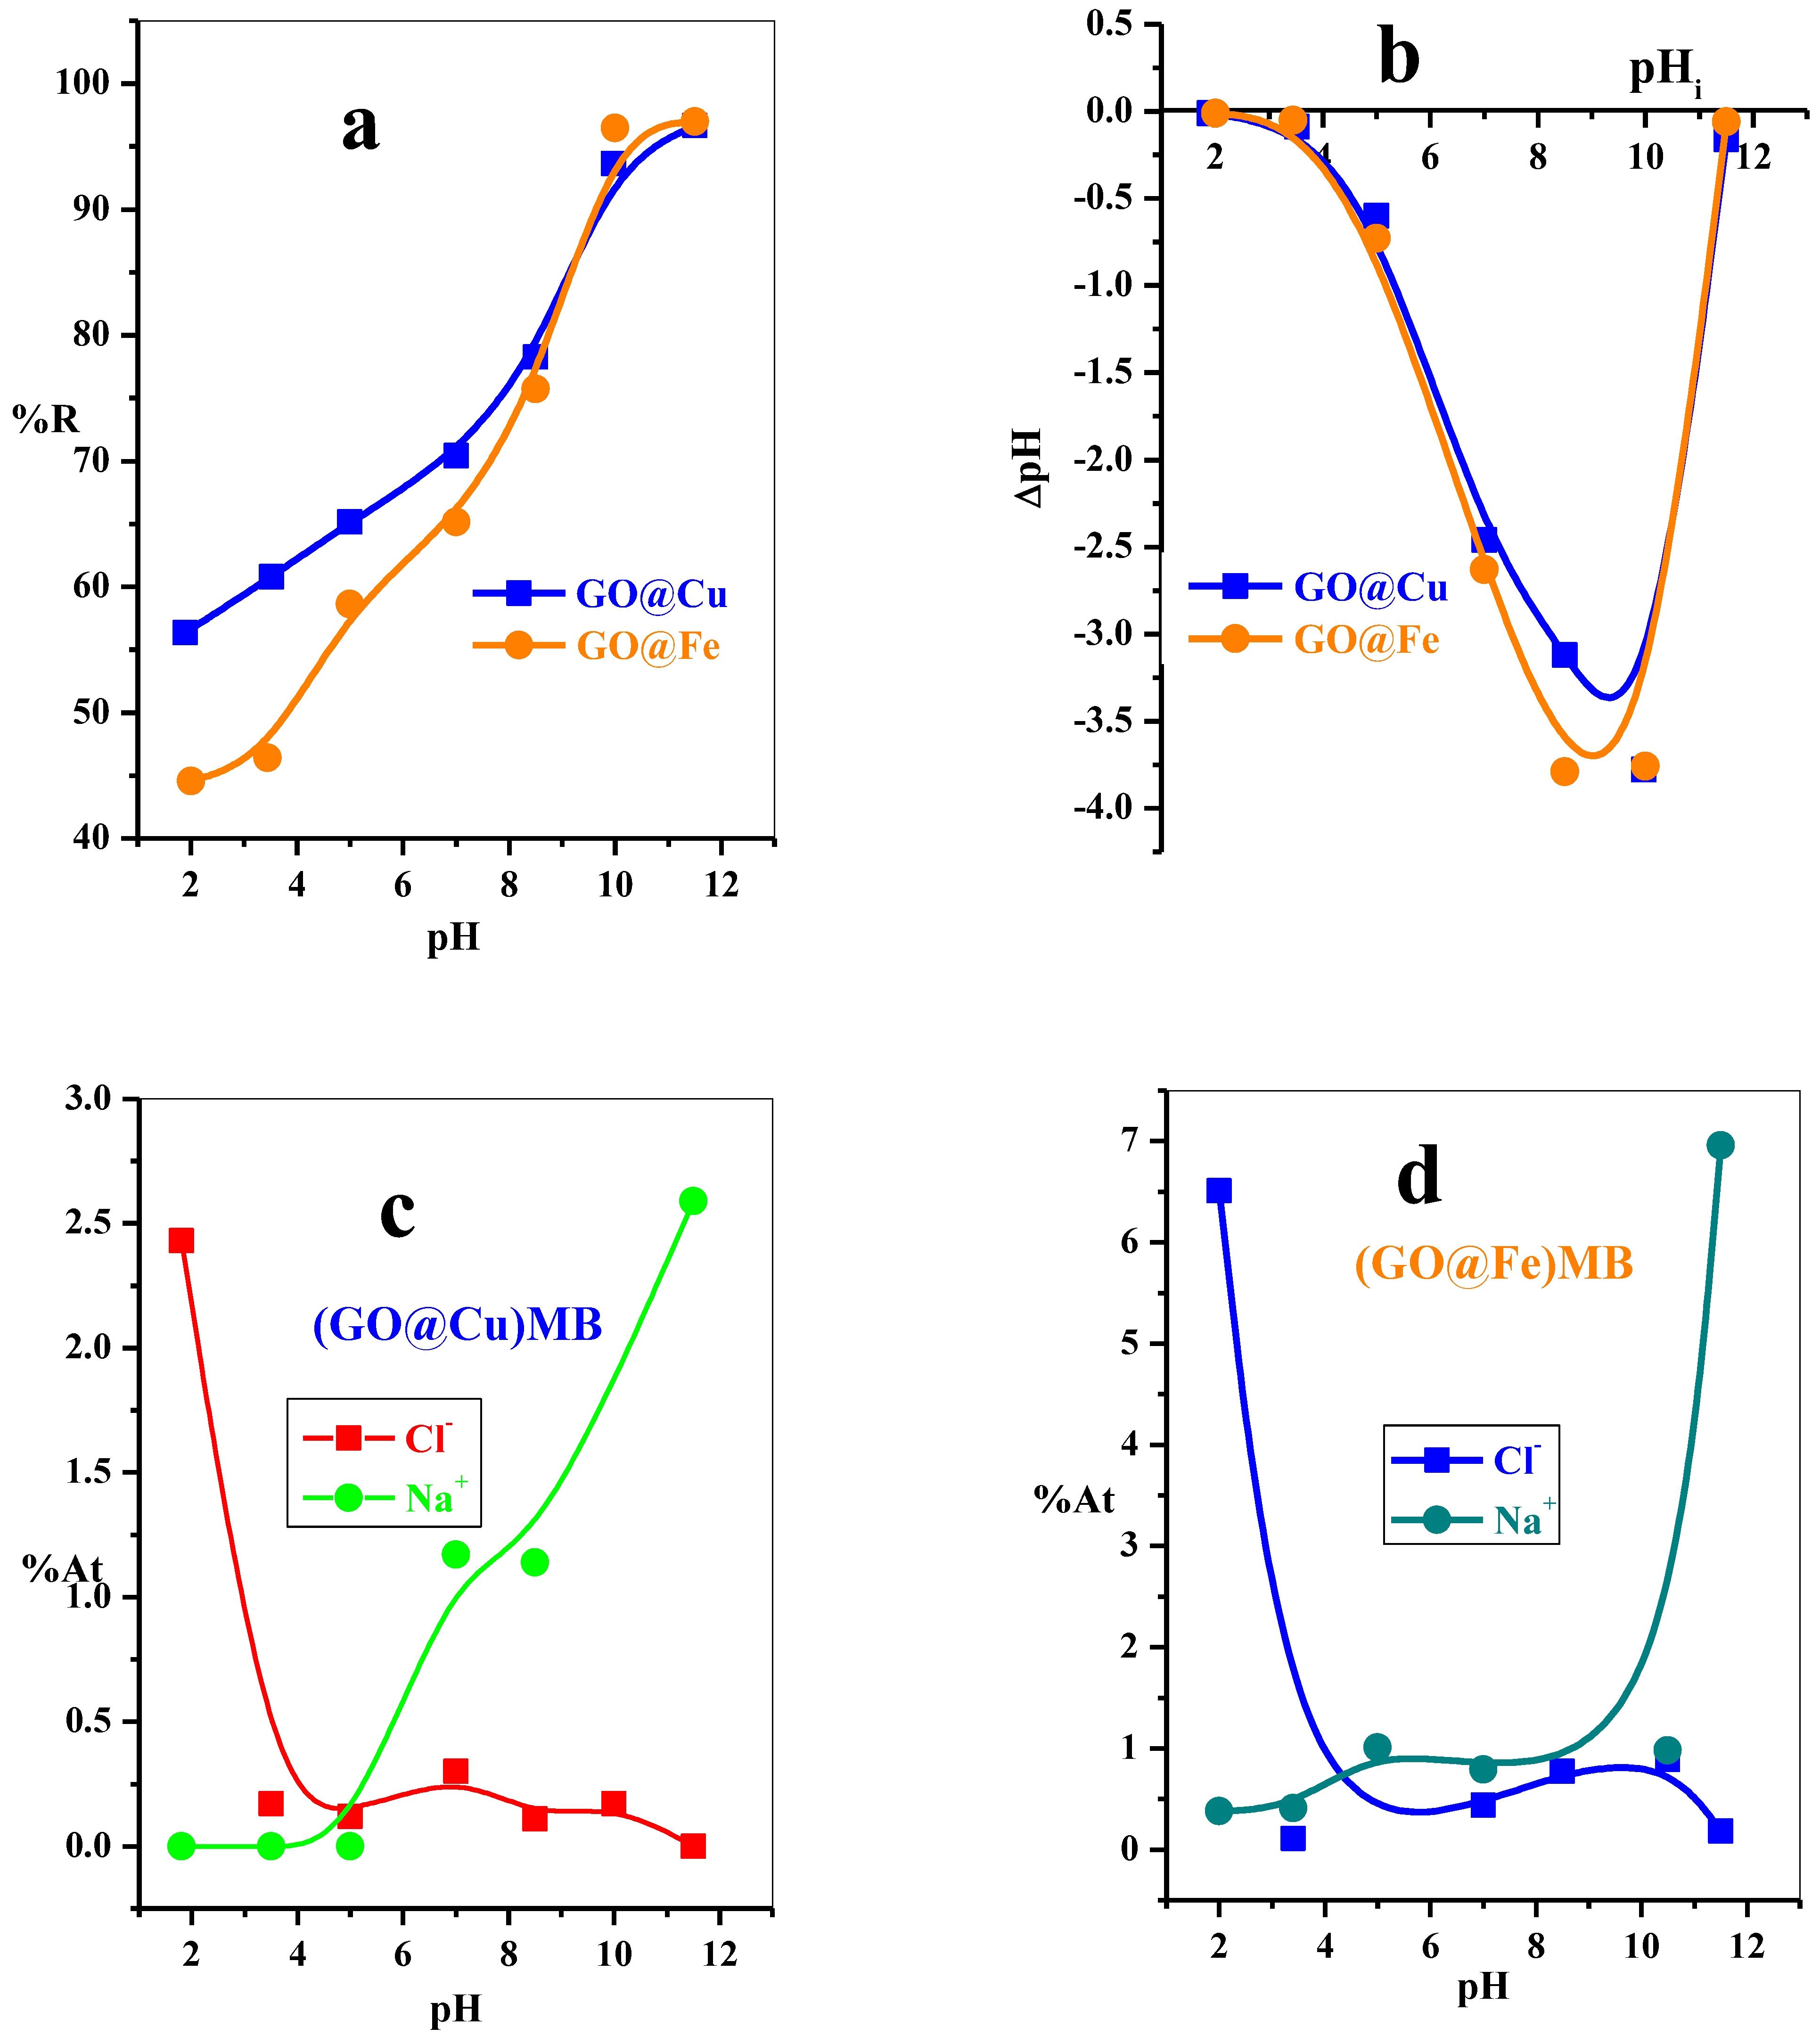
3.2.4. The Induce of pH and Adsorption Mechanism
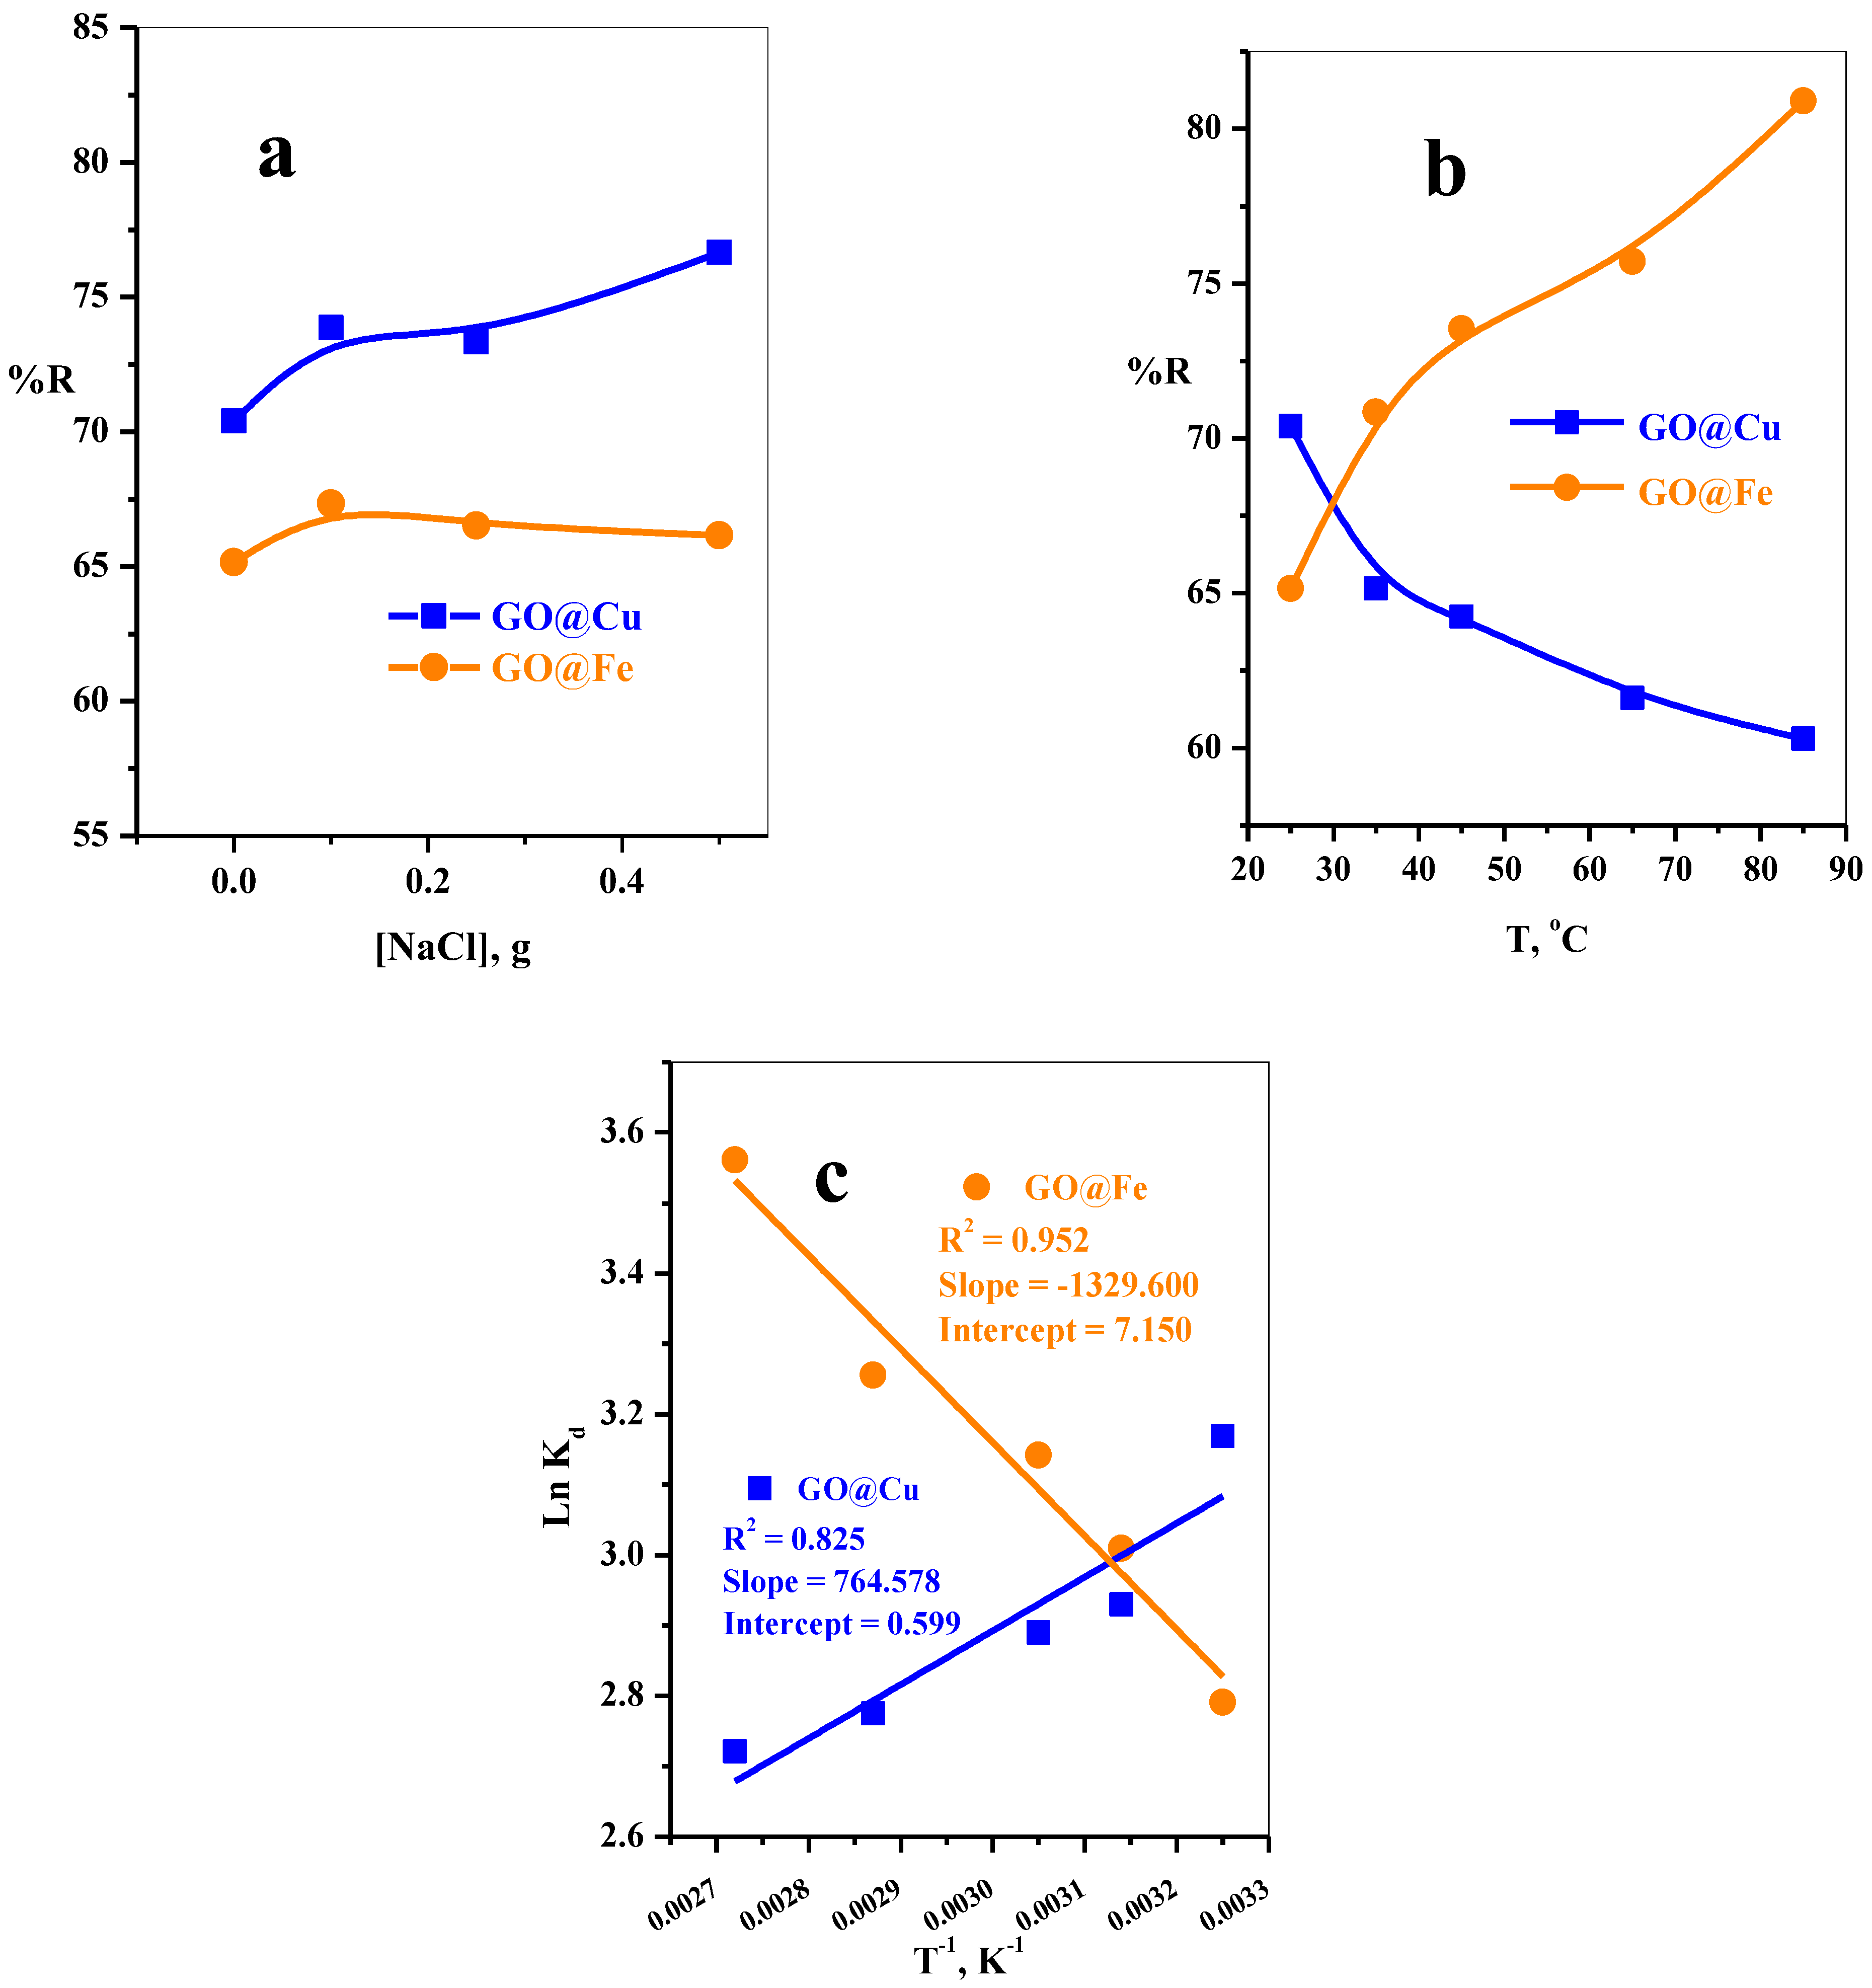
3.2.5. The Effect of Sodium Chloride Dose
3.2.6. The Effect of Aqueous Solution Temperature
3.2.7. Thermodynamic Analysis
3.2.8. Selective Adsorption of Cationic Dyes
3.3. Comparison of MB-Maximum Adsorption Capacity with Various Adsorbents
4. Conclusions
Supplementary Materials
Author Contributions
Funding
Institutional Review Board Statement
Informed Consent Statement
Data Availability Statement
Acknowledgments
Conflicts of Interest
References
- Nayl, A.A.; Abd-Elhamid, A.I.; Awwad, N.S.; Abdelgawad, M.A.; Wu, J.; Mo, X.; Gomha, S.M.; Aly, A.A.; Bräse, S. Review of the Recent Advances in Electrospun Nanofibers Applications in Water Purification. Polymers 2022, 14, 1594. [Google Scholar] [CrossRef] [PubMed]
- Mittal, H.; Al Alili, A.; Alhassan, S.M. High efficiency removal of methylene blue dye using κ-carrageenan-poly(acrylamide-co-methacrylic acid)/AQSOA-Z05 zeolite hydrogel composites. Cellulose 2020, 27, 8269–8285. [Google Scholar] [CrossRef]
- Chaudhary, D.; Singh, S.; Vankar, V.D.; Khare, N. ZnO nanoparticles decorated multi-walled carbon nanotubes for enhanced photocatalytic and photoelectrochemical water splitting. J. Photochem. Photobiol. A Chem. 2018, 351, 154–161. [Google Scholar] [CrossRef]
- Benhadria, N.; Hachemaoui, M.; Zaoui, F.; Mokhtar, A.; Boukreris, S.; Attar, T.; Belarbi, L.; Boukoussa, B. Catalytic Reduction of Methylene Blue Dye by Copper Oxide Nanoparticles. J. Clust. Sci. 2021, 33, 249–260. [Google Scholar] [CrossRef]
- Li, X.; Li, J.; Shi, W.; Bao, J.; Yang, X. A Fenton-Like Nanocatalyst Based on Easily Separated Magnetic Nanorings for Oxidation and Degradation of Dye Pollutant. Materials 2020, 13, 332. [Google Scholar] [CrossRef] [Green Version]
- Turhan, K.; Durukan, I.; Ard Ozturkcan, S.; Turgut, Z. Decolorization of textile basic dye in aqueous solution by ozone. Dye. Pigment. 2012, 92, 897–901. [Google Scholar] [CrossRef]
- Contreras, M.; Grande-Tovar, C.D.; Vallejo, W.; Chaves-López, C. Bio-Removal of Methylene Blue from Aqueous Solution by Galactomyces geotrichum KL20A. Water 2019, 11, 282. [Google Scholar] [CrossRef] [Green Version]
- Mahmoud, M.S.; Farah, J.Y.; Farrag, T.E. Enhanced removal of Methylene Blue by electrocoagulation using iron electrodes. Egypt. J. Pet. 2013, 22, 211–216. [Google Scholar] [CrossRef] [Green Version]
- Abd-Elhamid, A.I.; Aly, H.F.; Soliman, H.A.M.; El-Shanshory, A.A. Graphene oxide: Follow the oxidation mechanism and its application in water treatment. J. Mol. Liq. 2018, 265, 226–237. [Google Scholar] [CrossRef]
- Liu, G.; Gui, S.; Zhou, H.; Zeng, F.; Zhou, Y.; Ye, H. A strong adsorbent for Cu2+: Graphene oxide modified with triethanolamine. Dalton Trans. 2014, 43, 6977–6980. [Google Scholar] [CrossRef]
- Kuang, Y.; Zhang, Z.; Wu, D. Synthesis of graphene oxide/polyethyleneimine sponge and its performance in the sustainable removal of Cu(II) from water. Sci. Total Environ. 2022, 806, 151258. [Google Scholar] [CrossRef]
- Wang, X.; Chen, Z.; Yang, S. Application of graphene oxides for the removal of Pb (II) ions from aqueous solutions: Experimental and DFT calculation. J. Mol. Liq. 2015, 211, 957–964. [Google Scholar] [CrossRef]
- Wang, X.; Liu, Y.; Pang, H.; Yu, S.; Ai, Y.; Ma, X.; Song, G.; Hayat, T.; Alsaedi, A.; Wang, X. Effect of graphene oxide surface modification on the elimination of Co (II) from aqueous solutions. Chem. Eng. J. 2018, 344, 380–390. [Google Scholar] [CrossRef]
- Konicki, W.; Aleksandrzak, M.; Mijowska, E. Equilibrium and kinetics studies for the adsorption of Ni2+ and Fe3+ ions from aqueous solution by graphene oxide. Pol. J. Chem. Technol. 2017, 19, 120–129. [Google Scholar] [CrossRef] [Green Version]
- Pakulski, D.; Czepa, W.; Witomska, S.; Aliprandi, A.; Pawlu, P.; Patroniak, V.; Ciesielski, A.; Samorì, P. Graphene oxide-branched polyethylenimine foams for efficient removal of toxic cations from water. J. Mater. Chem. A 2018, 6, 9384–9390. [Google Scholar] [CrossRef] [Green Version]
- Sitko, R.; Turek, E.; Zawisza, B.; Malicka, E.; Talik, E.; Heimann, J.; Gagor, A.; Feista, B.; Wrzalik, R. Adsorption of divalent metal ions from aqueous solutions using graphene oxide. Dalton Trans. 2013, 42, 5682–5689. [Google Scholar] [CrossRef] [PubMed]
- Wu, W.; Yang, Y.; Zhou, H.; Ye, T.; Huang, Z.; Liu, R.; Kuang, Y. Highly Efficient Removal of Cu (II) from Aqueous Solution by Using Graphene Oxide. Water Air Soil Pollut. 2013, 224, 1372. [Google Scholar] [CrossRef]
- Lin, H.; Long, J.; Gu, Q.; Zhang, W.; Ruan, R.; Li, Z.; Wang, X. In situ IR study of surface hydroxyl species of dehydrated TiO2: Towards understanding pivotal surface processes of TiO2 photocatalytic oxidation of toluene. Phys. Chem. Chem. Phys. 2012, 14, 9468–9474. [Google Scholar] [CrossRef]
- Mondal, N.K.; Das, K.; Das, B.; Sadhukhan, B. Effective utilization of calcareous soil towards the removal of methylene blue from aqueous solution. Clean Technol. Environ. Policy 2016, 18, 867–881. [Google Scholar] [CrossRef]
- Labena, A.; Abdelhamid, A.E.; Amin, A.S.; Husien, S.; Hamid, L.; Safwat, G.; Diab, A.; Gobouri, A.A.; Azab, E. Removal of Methylene Blue and Congo Red Using Adsorptive Membrane Impregnated with Dried Ulva fasciata and Sargassum dentifolium. Plants 2021, 10, 384. [Google Scholar] [CrossRef]
- Huang, Z.; Wang, T.; Yi, H.; Li, X. Study on the Adsorption of Methylene Blue from Dye Wastewater by Humulus Japonicus Leaves. E3S Web Conf. 2021, 236, 03028. [Google Scholar] [CrossRef]
- Amin, M.T.; Alazba, A.A.; Shafiq, M. Successful Application of Eucalyptus Camdulensis Biochar in the Batch Adsorption of Crystal Violet and Methylene Blue Dyes from Aqueous Solution. Sustainability 2021, 13, 3600. [Google Scholar] [CrossRef]
- Rosly, N.Z.; Abdullah, A.H.; Ahmad, K.M.; Ashari, S.E.; Alang, A.S.A. Adsorption of Methylene Blue Dye by Calix[6]Arene-Modified Lead Sulphide (Pbs): Optimisation Using Response Surface Methodology. Int. J. Environ. Res. Public Health 2021, 18, 397. [Google Scholar] [CrossRef] [PubMed]
- Radoor, S.; Karayil, J.; Jayakumar, A.; Parameswaranpillai, J.; Siengchin, S. Removal of Methylene Blue Dye from Aqueous Solution using PDADMAC Modified ZSM-5 Zeolite as a Novel Adsorbent. J. Polym. Environ. 2021, 29, 3185–3198. [Google Scholar] [CrossRef]
- Hassan, A.A.; Sajid, M.; Tanimu, A.; Abdulazeez, I.; Alhooshan, K. Removal of methylene blue and rose bengal dyes from aqueous solutions using 1-naphthylammonium tetrachloroferrate (III). J. Mol. Liq. 2021, 322, 114966. [Google Scholar] [CrossRef]
- Ilgin, P. High removal of methylene blue dye from aqueous solution by using a novel pectin-based hydrogel. Int. J. Environ. Anal. Chem. 2020. [Google Scholar] [CrossRef]
- Tehrim, A.; Dai, M.; Wu, X.; Umair, M.M.; Ali, I.; Amjed, M.A.; Rong, R.; Javaid, S.F.; Peng, C. Citric acid-modified waste cigarette filters for adsorptive removal of methylene blue dye from aqueous solution. J. Appl. Polym. Sci. 2021, 138, 50655. [Google Scholar] [CrossRef]
- Nielsen, B.V.; Maneein, S.; Anghan, J.D.; Anghan, R.M.; Al Farid, M.M.; Milledge, J.J. Biosorption Potential of Sargassum for Removal of Aqueous Dye Solutions. Appl. Sci. 2022, 12, 4173. [Google Scholar] [CrossRef]
- Essa, W.K.; Yasin, S.A.; Abdullah, A.H.; Thalji, M.R.; Saeed, I.A.; Assiri, M.A.; Chong, K.F.; Ali, G.A.M. Taguchi L25 (54) Approach for Methylene Blue Removal by Polyethylene Terephthalate Nanofiber-Multi-Walled Carbon Nanotube Composite. Water 2022, 14, 1242. [Google Scholar] [CrossRef]
- ALSamman, M.T.; Sánchez, J. Chitosan- and Alginate-Based Hydrogels for the Adsorption of Anionic and Cationic Dyes from Water. Polymers 2022, 14, 1498. [Google Scholar] [CrossRef]
- Almethen, A.A.; Alotaibi, K.M.; Alhumud, H.S.; Alswieleh, A.M. Highly Efficient and Rapid Removal of Methylene Blue from Aqueous Solution Using Folic Acid-Conjugated Dendritic Mesoporous Silica Nanoparticles. Processes 2022, 10, 705. [Google Scholar] [CrossRef]
- Mansour, A.T.; Alprol, A.E.; Abualnaja, K.M.; El-Beltagi, H.S.; Ramadan, K.M.A.; Ashour, M. Dried Brown Seaweed’s Phytoremediation Potential for Methylene Blue Dye Removal from Aquatic Environments. Polymers 2022, 14, 1375. [Google Scholar] [CrossRef] [PubMed]
- Mosoarca, G.; Vancea, C.; Popa, S.; Dan, M.; Boran, S. The Use of Bilberry Leaves (Vaccinium myrtillus L.) as an Efficient Adsorbent for Cationic Dye Removal from Aqueous Solutions. Polymers 2022, 14, 978. [Google Scholar] [CrossRef] [PubMed]
- Joshi, S.; Shrestha, R.G.; Pradhananga, R.R.; Ariga, K.; Shrestha, L.K. High Surface Area Nanoporous Activated Carbons Materials from Areca catechu Nut with Excellent Iodine and Methylene Blue Adsorption. C 2022, 8, 2. [Google Scholar] [CrossRef]
- Ahmed, I.A.; Seliem, M.K.; Lima, E.C.; Badawi, M.; Li, Z.; Bonilla-Petriciolet, A.; Anastopoulos, I. Outstanding Performance of a New Exfoliated Clay Impregnated with Rutile TiO2 Nanoparticles Composite for Dyes Adsorption: Experimental and Theoretical Studies. Coatings 2022, 12, 22. [Google Scholar] [CrossRef]


| Sample | D-Band Peak | G-Band Peak | ID/IG | ||
|---|---|---|---|---|---|
| Raman Shift (cm−1) | FWHM (cm−1) | Raman Shift (cm−1) | FWHM (cm−1) | ||
| GO | 1352 | 150 | 1598 | 112 | 1.34 |
| GO-Cu | 1339 | 119 | 1583 | 83 | 1.43 |
| GO-Cu-MB | 1339 | 119 | 1594 | 83 | 1.43 |
| GO-Fe | 1339 | 107 | 1582 | 72 | 1.49 |
| GO-Fe-MB | 1350 | 95 | 1605 | 83 | 1.14 |
| Dye | qe exp (mg/g) | First-Order Kinetic Parameter | Second-Order Kinetic Parameter | ||||
|---|---|---|---|---|---|---|---|
| K1 (min−1) | qecal (mg g−1) | R2 | K2 (g mg−1 min−1) | qecal (mg g−1) | R2 | ||
| GO-Cu | 352.00 | 0.041 | 357.14 | 0.999 | |||
| GO-Fe | 199.83 | 0.00 | 200.00 | 0.999 | |||
| Adsorbent | Langmuir Isotherm Model | Freundlich Isotherm Model | |||||
|---|---|---|---|---|---|---|---|
| Qo (mg g−1) | b (mg−1) | RL | R2 | 1/n | Kf (mg g−1) | R2 | |
| GO-Cu | 384.62 | 3.10 | 0.011 | 0.991 | 0.1014 | 277.33 | 0.719 |
| GO-Fe | 217.39 | 0.32 | 0.238 | 0. 996 | 0.3260 | 70.80 | 0.947 |
| T (K) | ΔG (kJmol−1) | ΔH (kJmol−1) | ΔS (Jmol−1 K−1) | |||
|---|---|---|---|---|---|---|
| GO@Cu | GO@Fe | GO@Cu | GO@Fe | GO@Cu | GO@Fe | |
| 308 | −8.11 | −7.15 | −6.36 | 11.05 | 4.98 | 59.45 |
| 318 | −7.75 | −7.96 | ||||
| 328 | −7.88 | −8.57 | ||||
| 348 | −8.03 | −9.42 | ||||
| 368 | −8.33 | −10.90 | ||||
| Adsorbent | Adsorption Conditions | Qo, mg g−1 | Ref. | |||
|---|---|---|---|---|---|---|
| Adsorbent Dose (mg mL−1) | pH | Contact Time, Min | Dye Conc. (ppm) | |||
| AF-U membrane | 5 | 5 | 240 | 100 | 45.871 | [20] |
| AF-S membrane | 5 | 5 | 240 | 100 | 65.789 | [20] |
| Humulus Japonicus Leaves (HJ) | 15 | 7 | 20 | 100 | 145.77 | [21] |
| Eucalyptus Camdulensis Biochar (Ec-bio) | 5 | 6 | 60 | 50 | 123.30 | [22] |
| calix[6]arene-modified PbS | 44 | 6 | 60 | 20 | 5.495 | [23] |
| Modified ZSM-5 zeolite | 2 | 10 | 300 | 10 | 4.31 | [24] |
| 1-naphthyl ammonium tetrachloroferrate (III) | 60 mg | 3 | 120 | 40 | 9.52 | [25] |
| pec/poly(MA-co-AMPS) hydrogel | 0.5 | 7 | 60 | 200 | 448.40 | [26] |
| CF | 150 | 6.5 | 250 | 120 | 88.02 | [27] |
| CF-CA | 150 | 6.5 | 250 | 120 | 163.93 | [27] |
| S. muticum | 0.625 | ∗ | 120 | 10 | 157 | [28] |
| mixed Sargassum | 0.625 | ∗ | 120 | 10 | 115 | [28] |
| PET-NFMWCNT | 0.008 g | 8 | 120 | 20 | 7.047 | [29] |
| Alginate/PAA | 0.05 g | 8.5 | 90 | 10 | 120 | [30] |
| FA-DMSN | 10 mg | >7 | 3 | 50–125 | 90.7 | [31] |
| Sargassum latifolium | 0.1 | 10 | 15 | 40 | 0.819 | [32] |
| Vaccinium myrtillus L. leaves powder | 5 | 10 | 50 | 200 | 200.4 | [33] |
| Modified Areca catechu Nut | 2.8 | ≈12 | 180 | 300 | 333.3 | [34] |
| Rt/BC | 25 mg | 8 | ∗ | 25–250 | 214.52 | [35] |
| GO@Cu | 0.1 | 7 | 2.5 | 50 | 384.62 | This work |
| GO@Fe | 0.12 | 7 | 2.5 | 30 | 217.39 | This work |
Publisher’s Note: MDPI stays neutral with regard to jurisdictional claims in published maps and institutional affiliations. |
© 2022 by the authors. Licensee MDPI, Basel, Switzerland. This article is an open access article distributed under the terms and conditions of the Creative Commons Attribution (CC BY) license (https://creativecommons.org/licenses/by/4.0/).
Share and Cite
Ding, Y.; Chen, Z.; Wu, J.; Abd-Elhamid, A.I.; Aly, H.F.; Nayl, A.A.; Bräse, S. Graphene Oxide@Heavy Metal Ions (GO@M) Complex Simulated Waste as an Efficient Adsorbent for Removal of Cationic Methylene Blue Dye from Contaminated Water. Materials 2022, 15, 3657. https://0-doi-org.brum.beds.ac.uk/10.3390/ma15103657
Ding Y, Chen Z, Wu J, Abd-Elhamid AI, Aly HF, Nayl AA, Bräse S. Graphene Oxide@Heavy Metal Ions (GO@M) Complex Simulated Waste as an Efficient Adsorbent for Removal of Cationic Methylene Blue Dye from Contaminated Water. Materials. 2022; 15(10):3657. https://0-doi-org.brum.beds.ac.uk/10.3390/ma15103657
Chicago/Turabian StyleDing, Yangfan, Zhe Chen, Jinglei Wu, Ahmed I. Abd-Elhamid, Hisham F. Aly, AbdElAziz A. Nayl, and Stefan Bräse. 2022. "Graphene Oxide@Heavy Metal Ions (GO@M) Complex Simulated Waste as an Efficient Adsorbent for Removal of Cationic Methylene Blue Dye from Contaminated Water" Materials 15, no. 10: 3657. https://0-doi-org.brum.beds.ac.uk/10.3390/ma15103657