
Experimental Study on the Mechanical Properties, Water Absorption, and Fiber Degradation of Naturally Aged Glass Fiber and Polypropylene Fiber-Reinforced Concrete

Abstract
:1. Introduction
2. Materials and Methods
2.1. Raw Materials
2.1.1. Ordinary Portland Cement
2.1.2. Fly Ash
2.1.3. Silica Fume
2.1.4. Slag
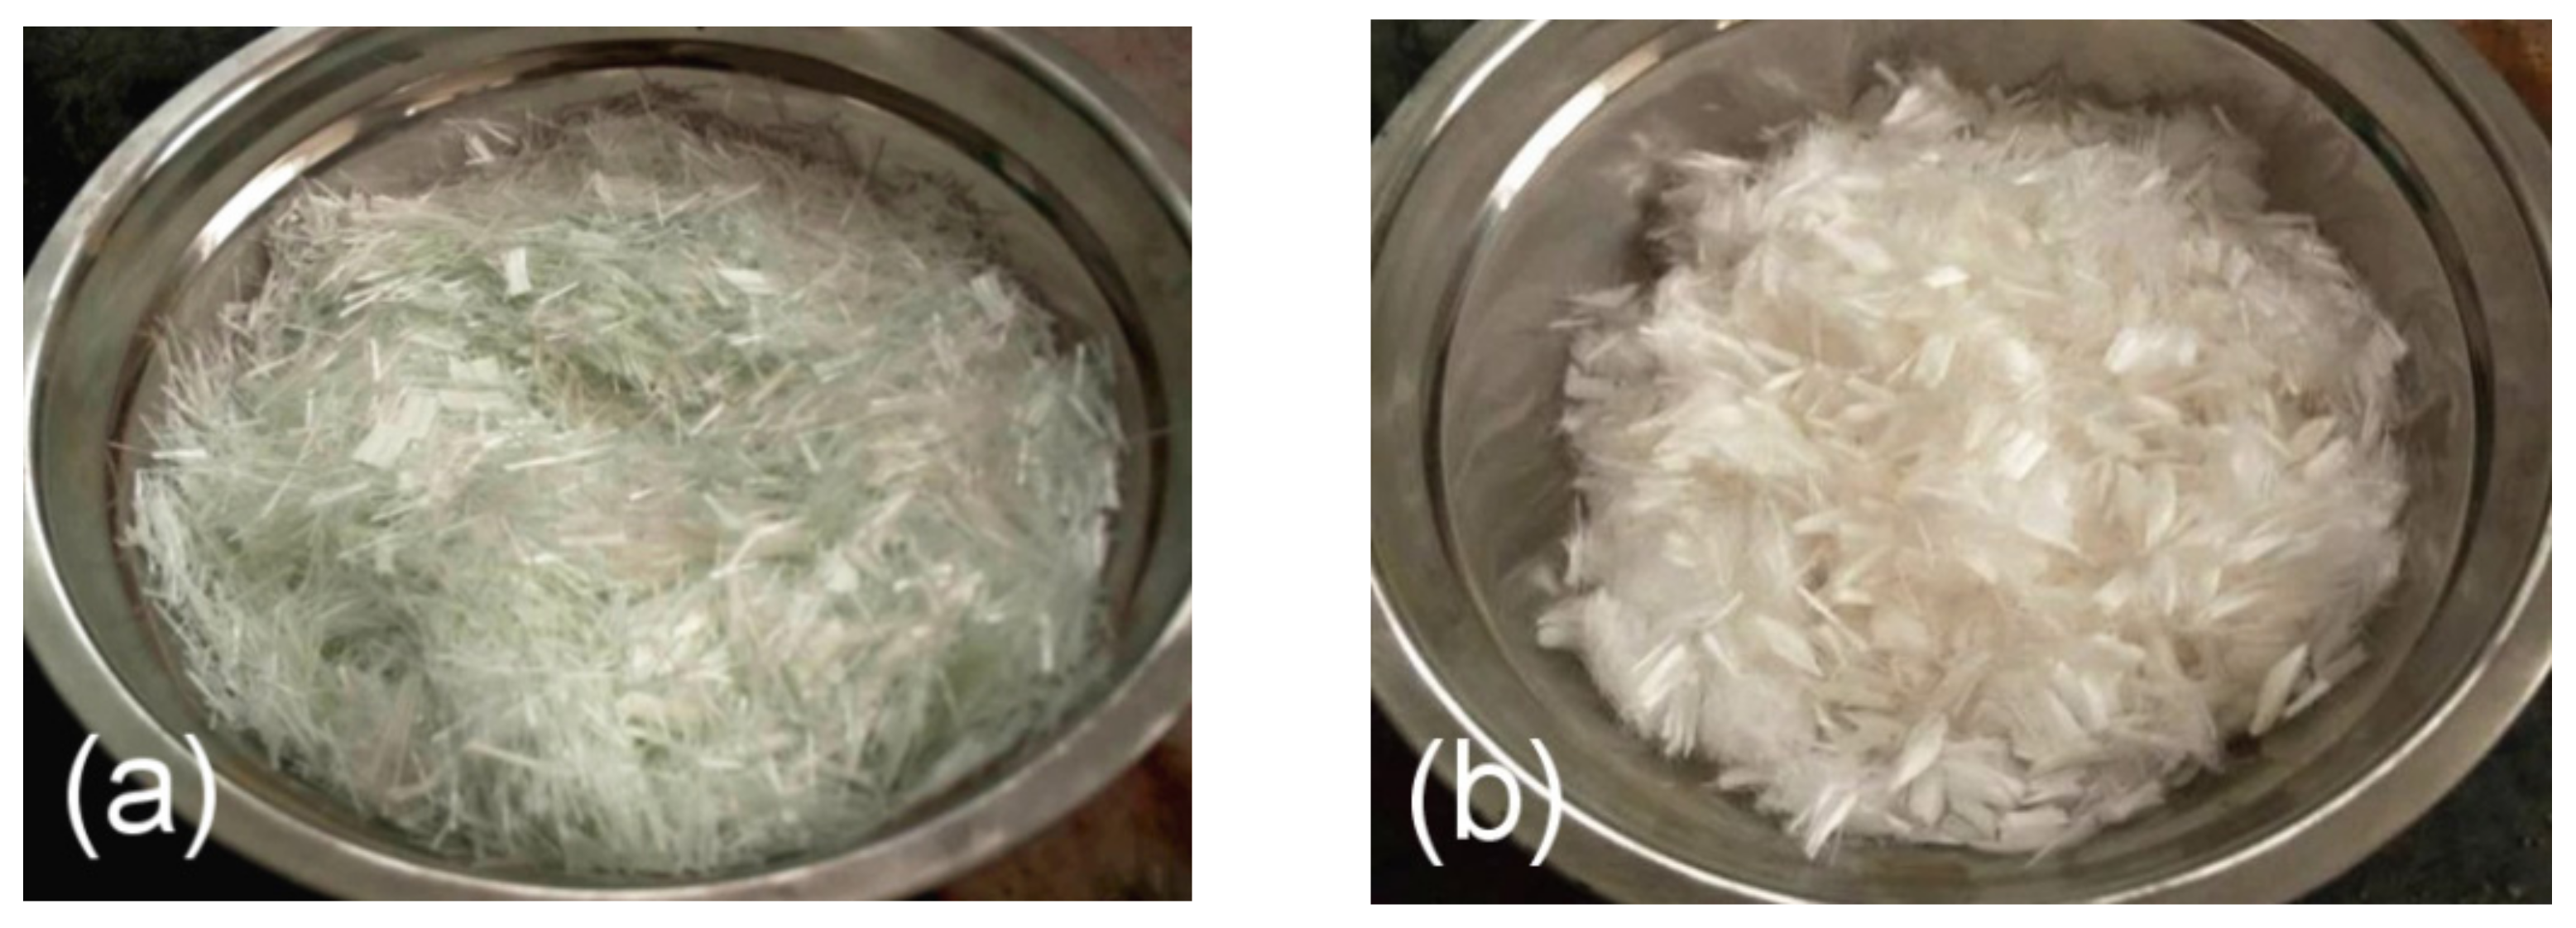
2.1.5. Fibers
2.1.6. Aggregate
2.1.7. Water
2.1.8. Superplasticizer
2.2. Mix Proportions
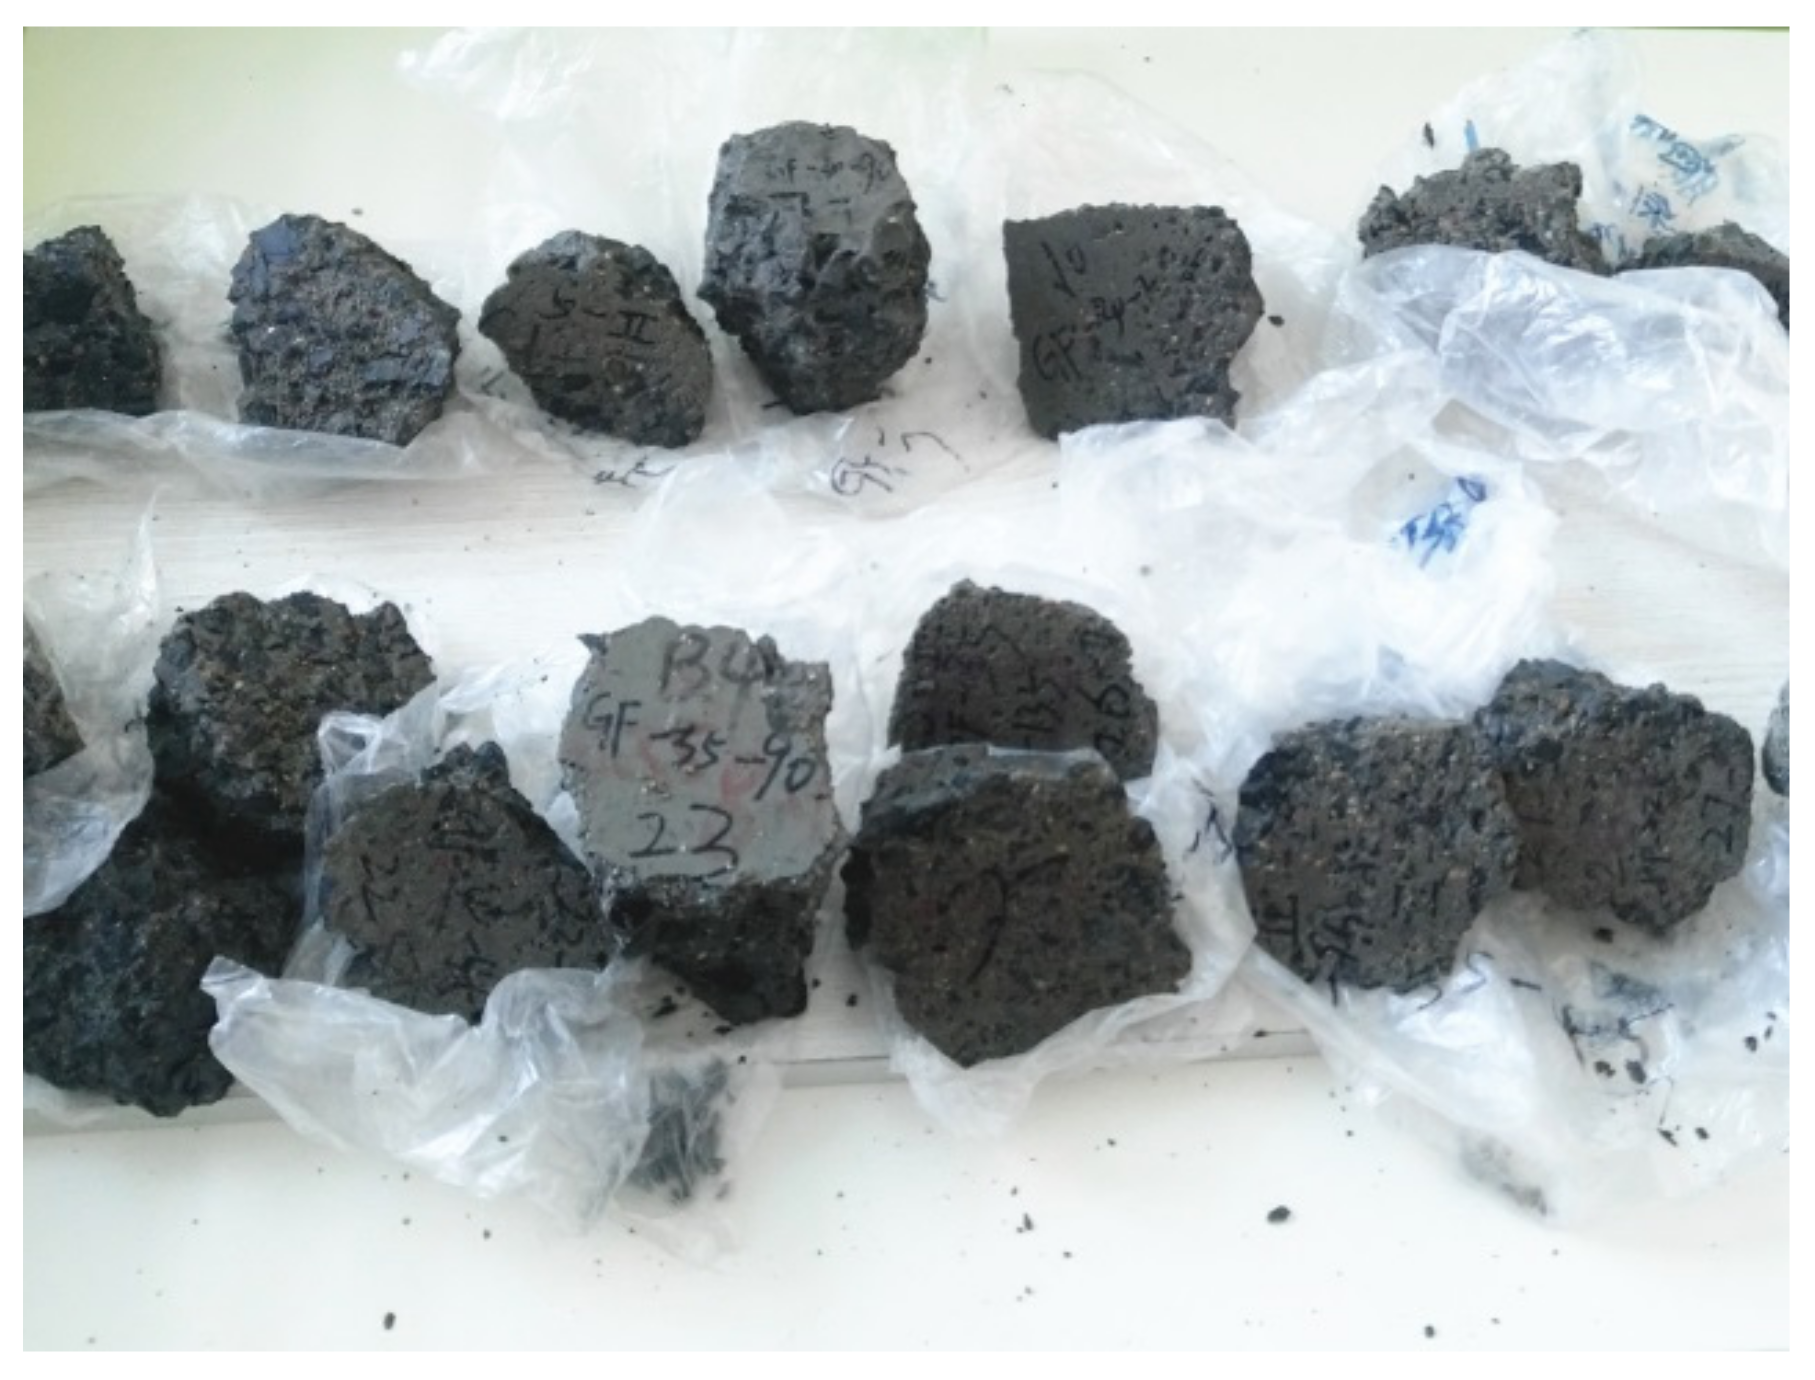
2.3. Sample Preparation
2.4. Test Procedures
2.4.1. Measurement of Compressive Strength
2.4.2. Freeze-Thaw Cycle Test
2.4.3. Water Absorption Test
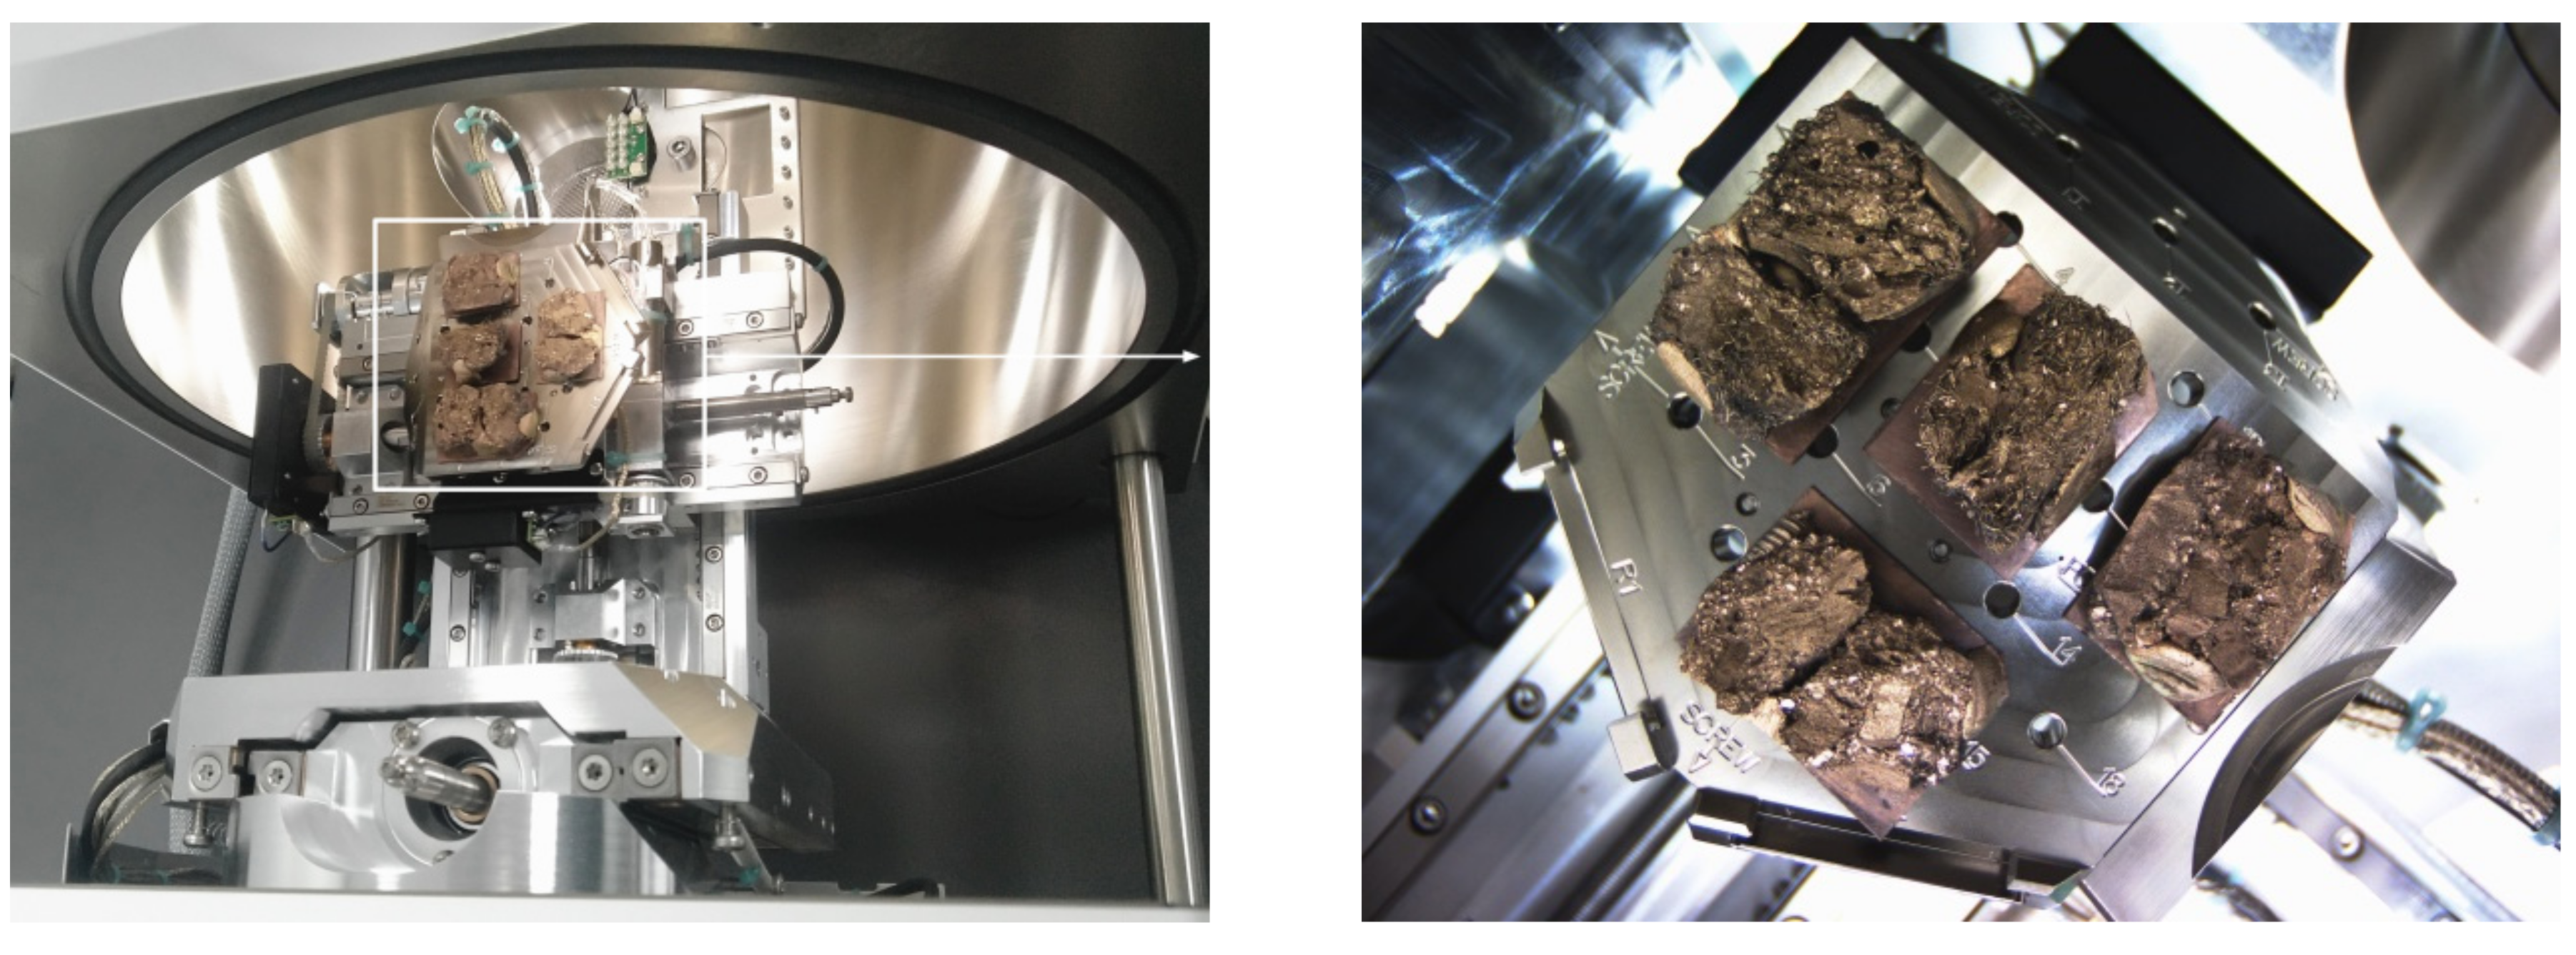
2.4.4. SEM Observation
3. Results and Discussion
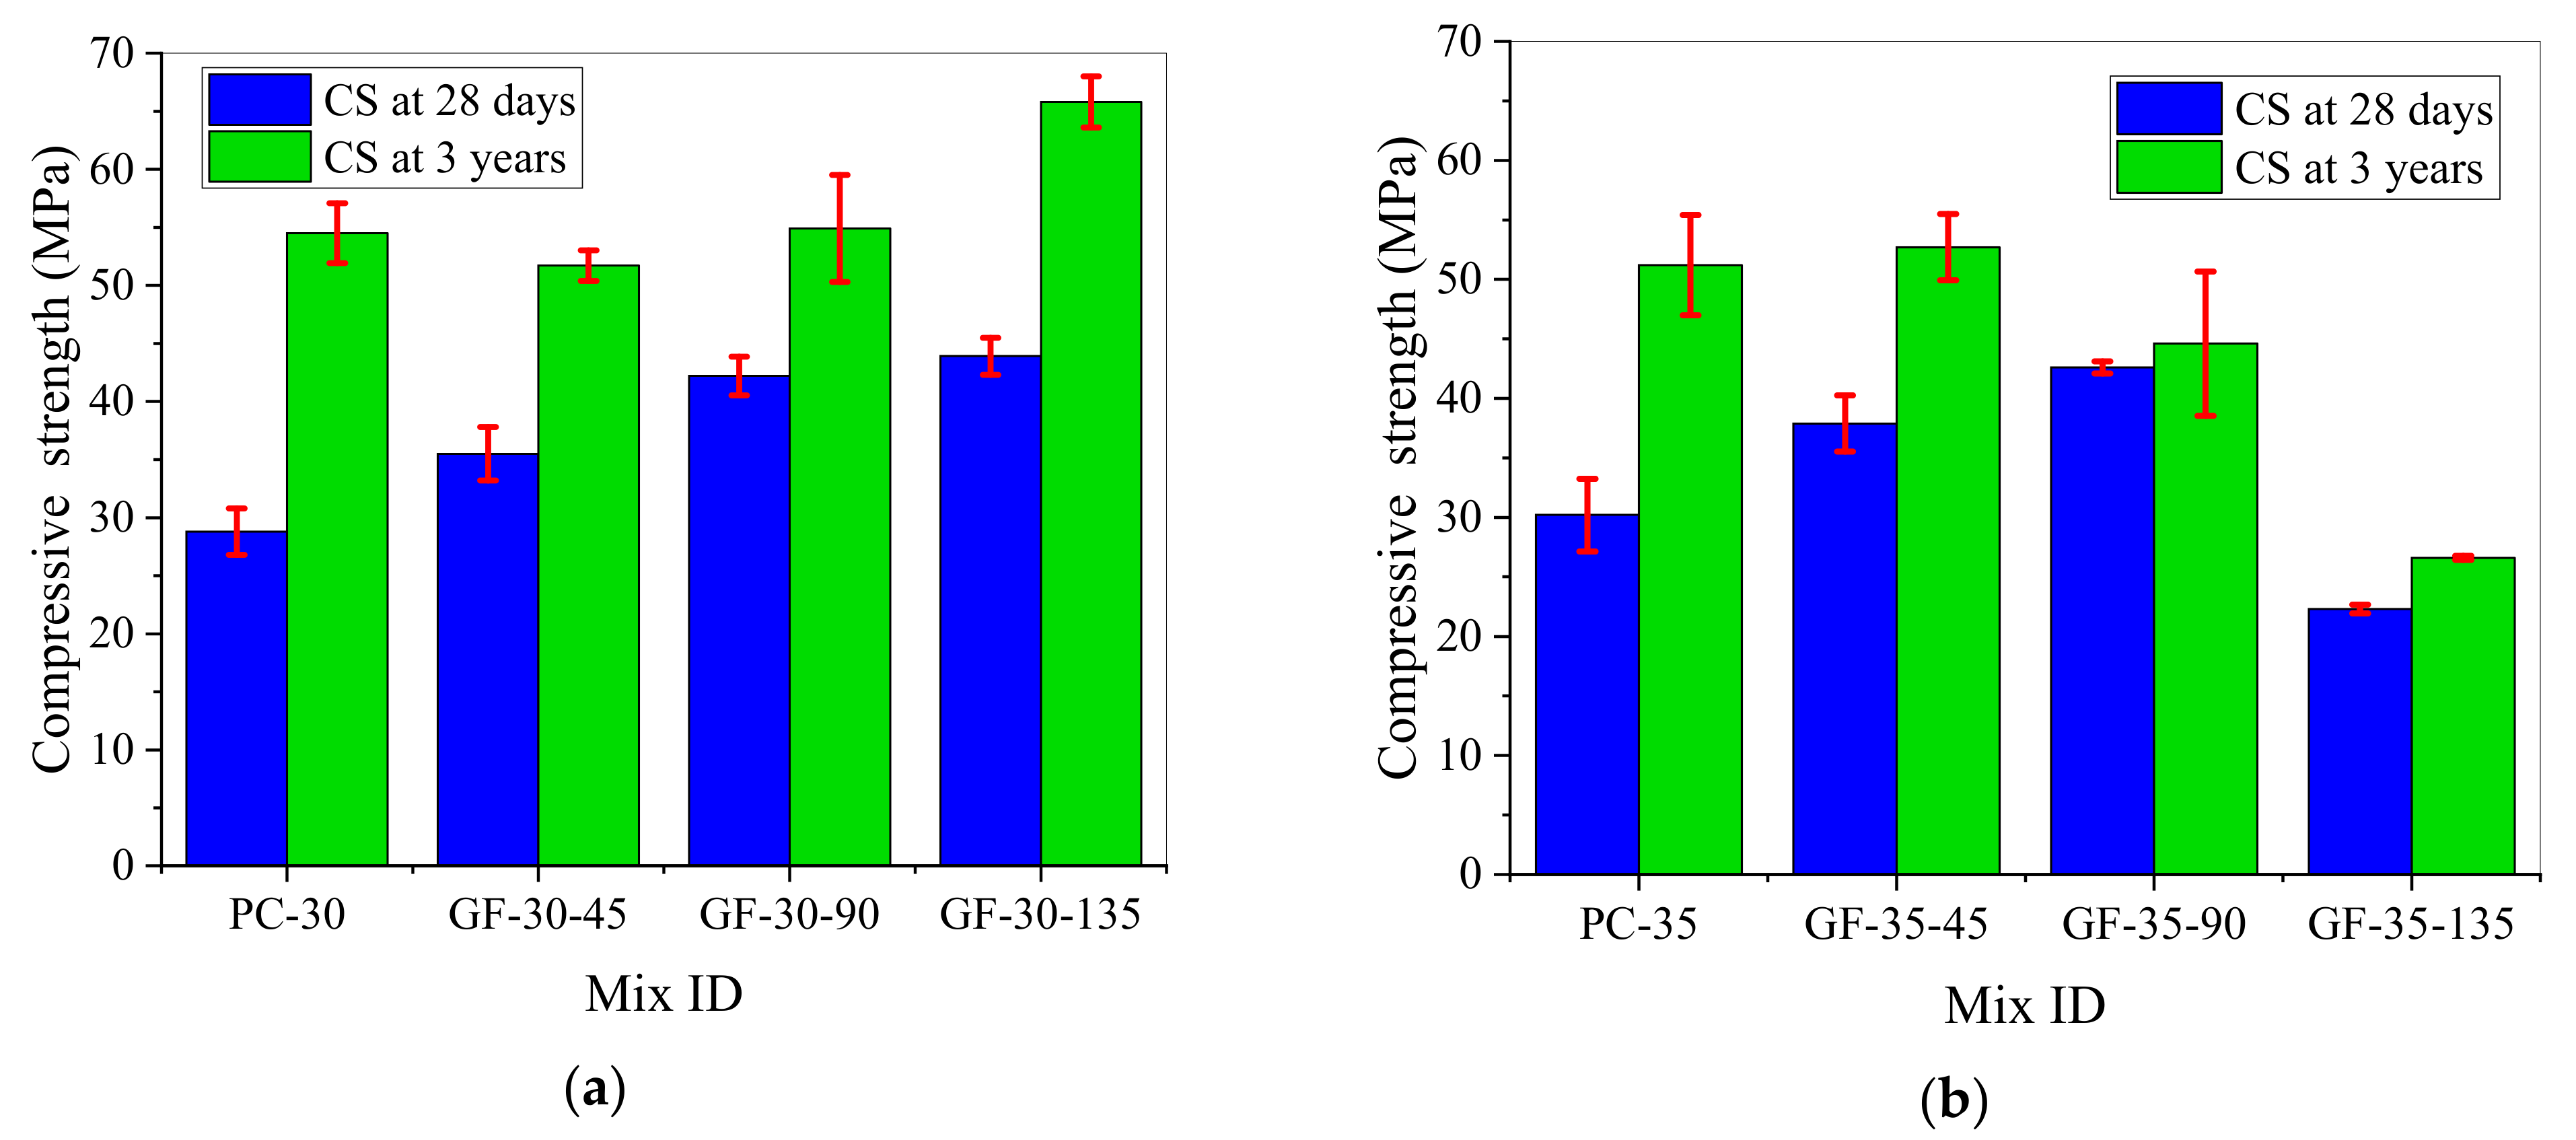
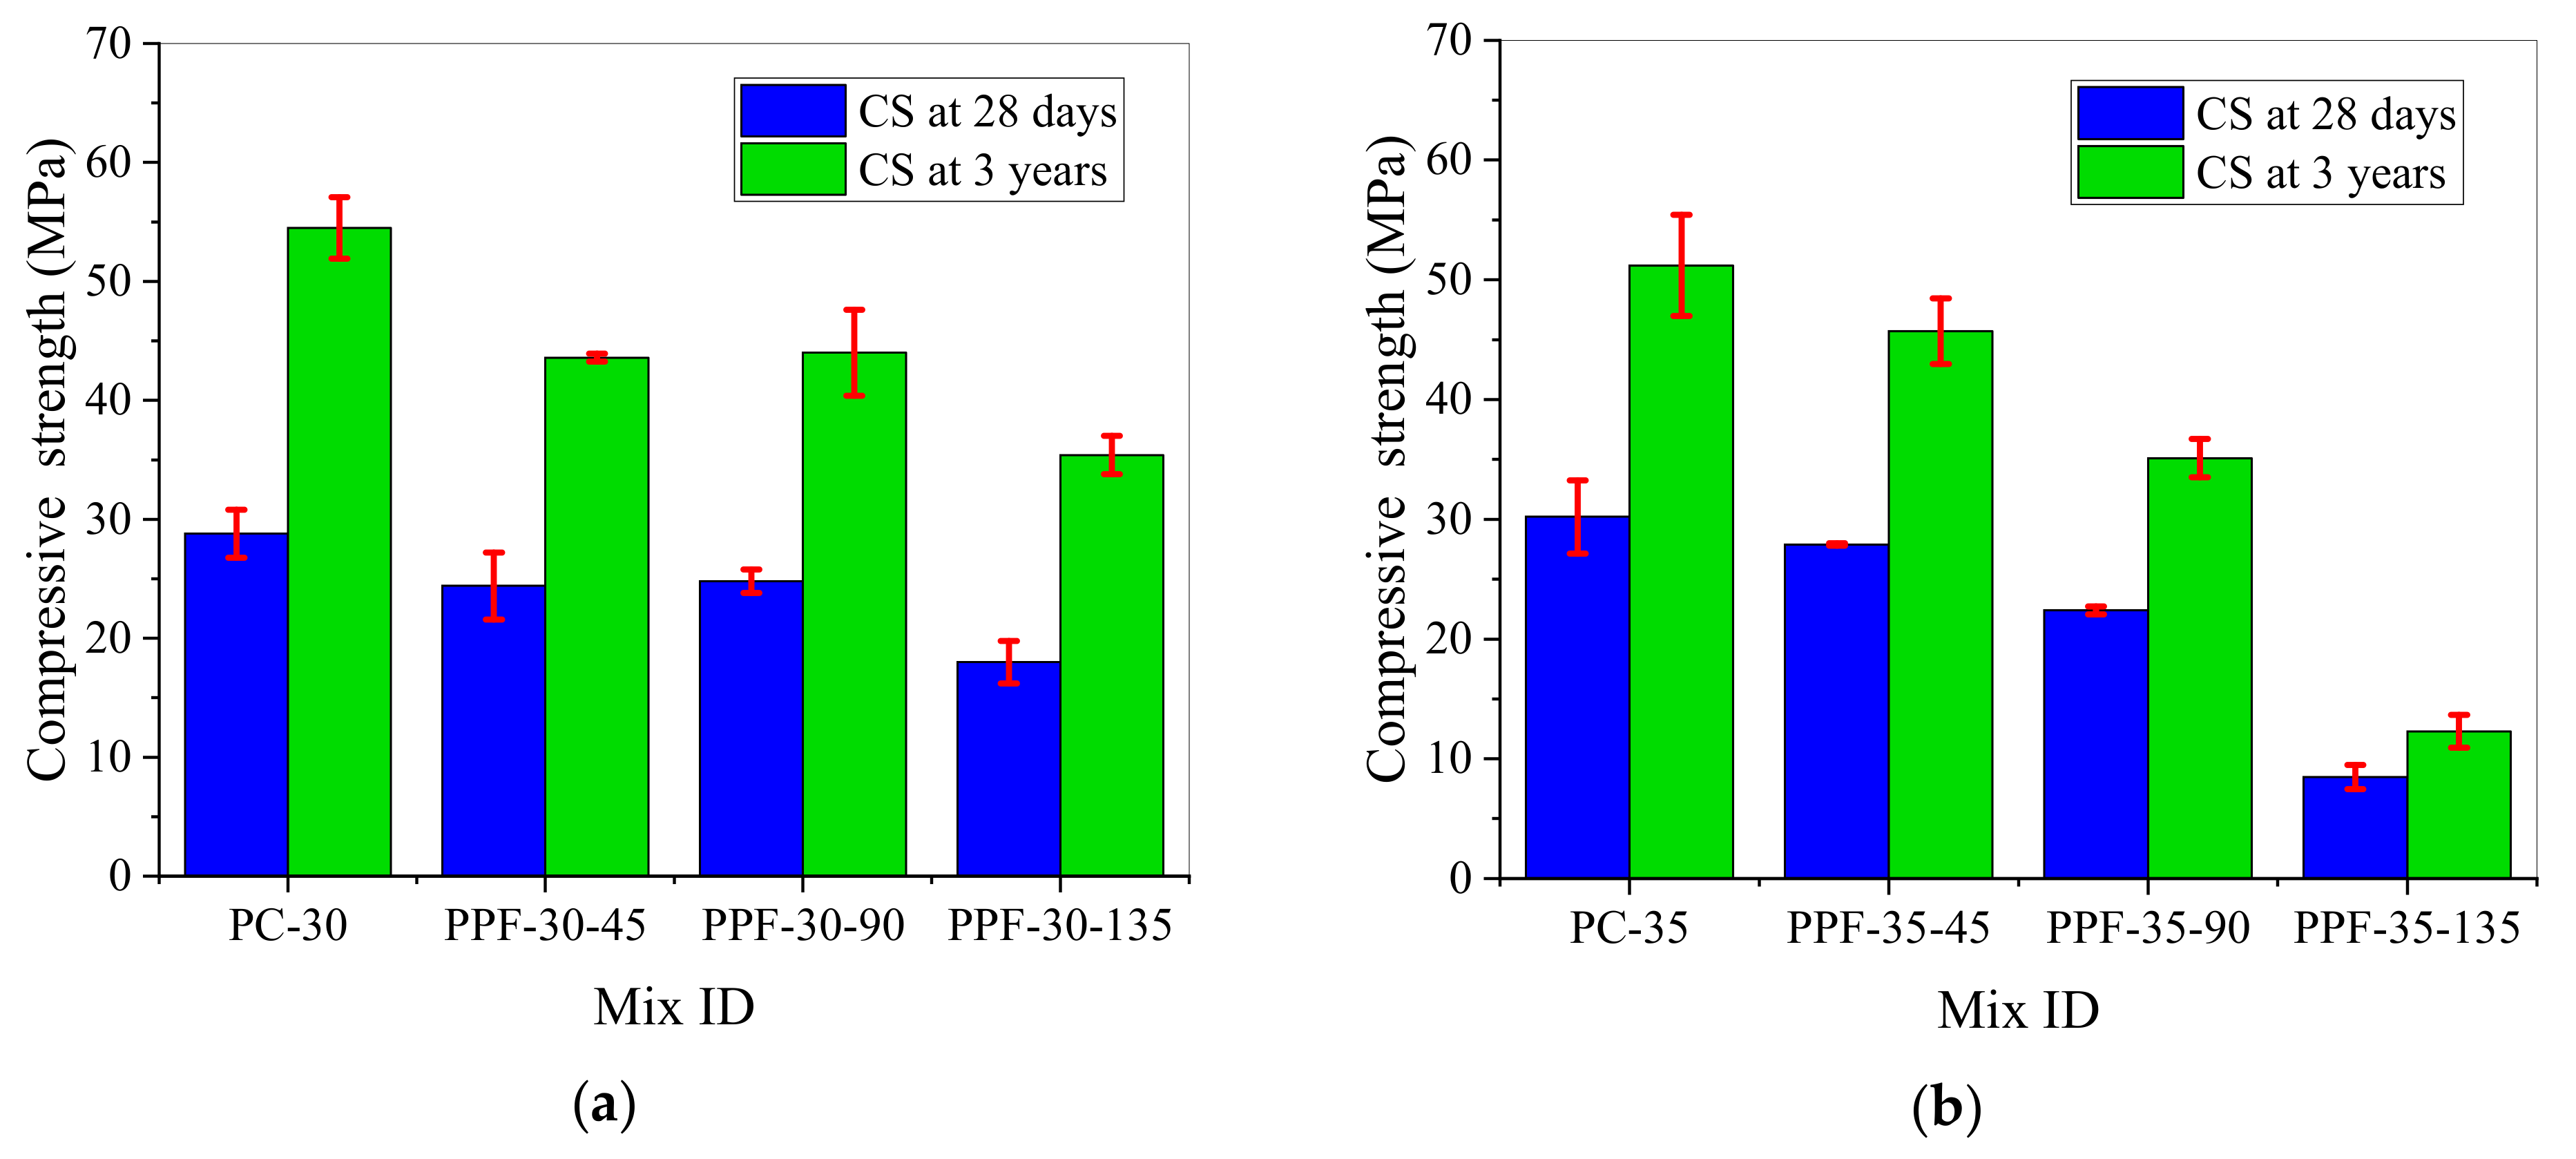
3.1. Compressive Strength
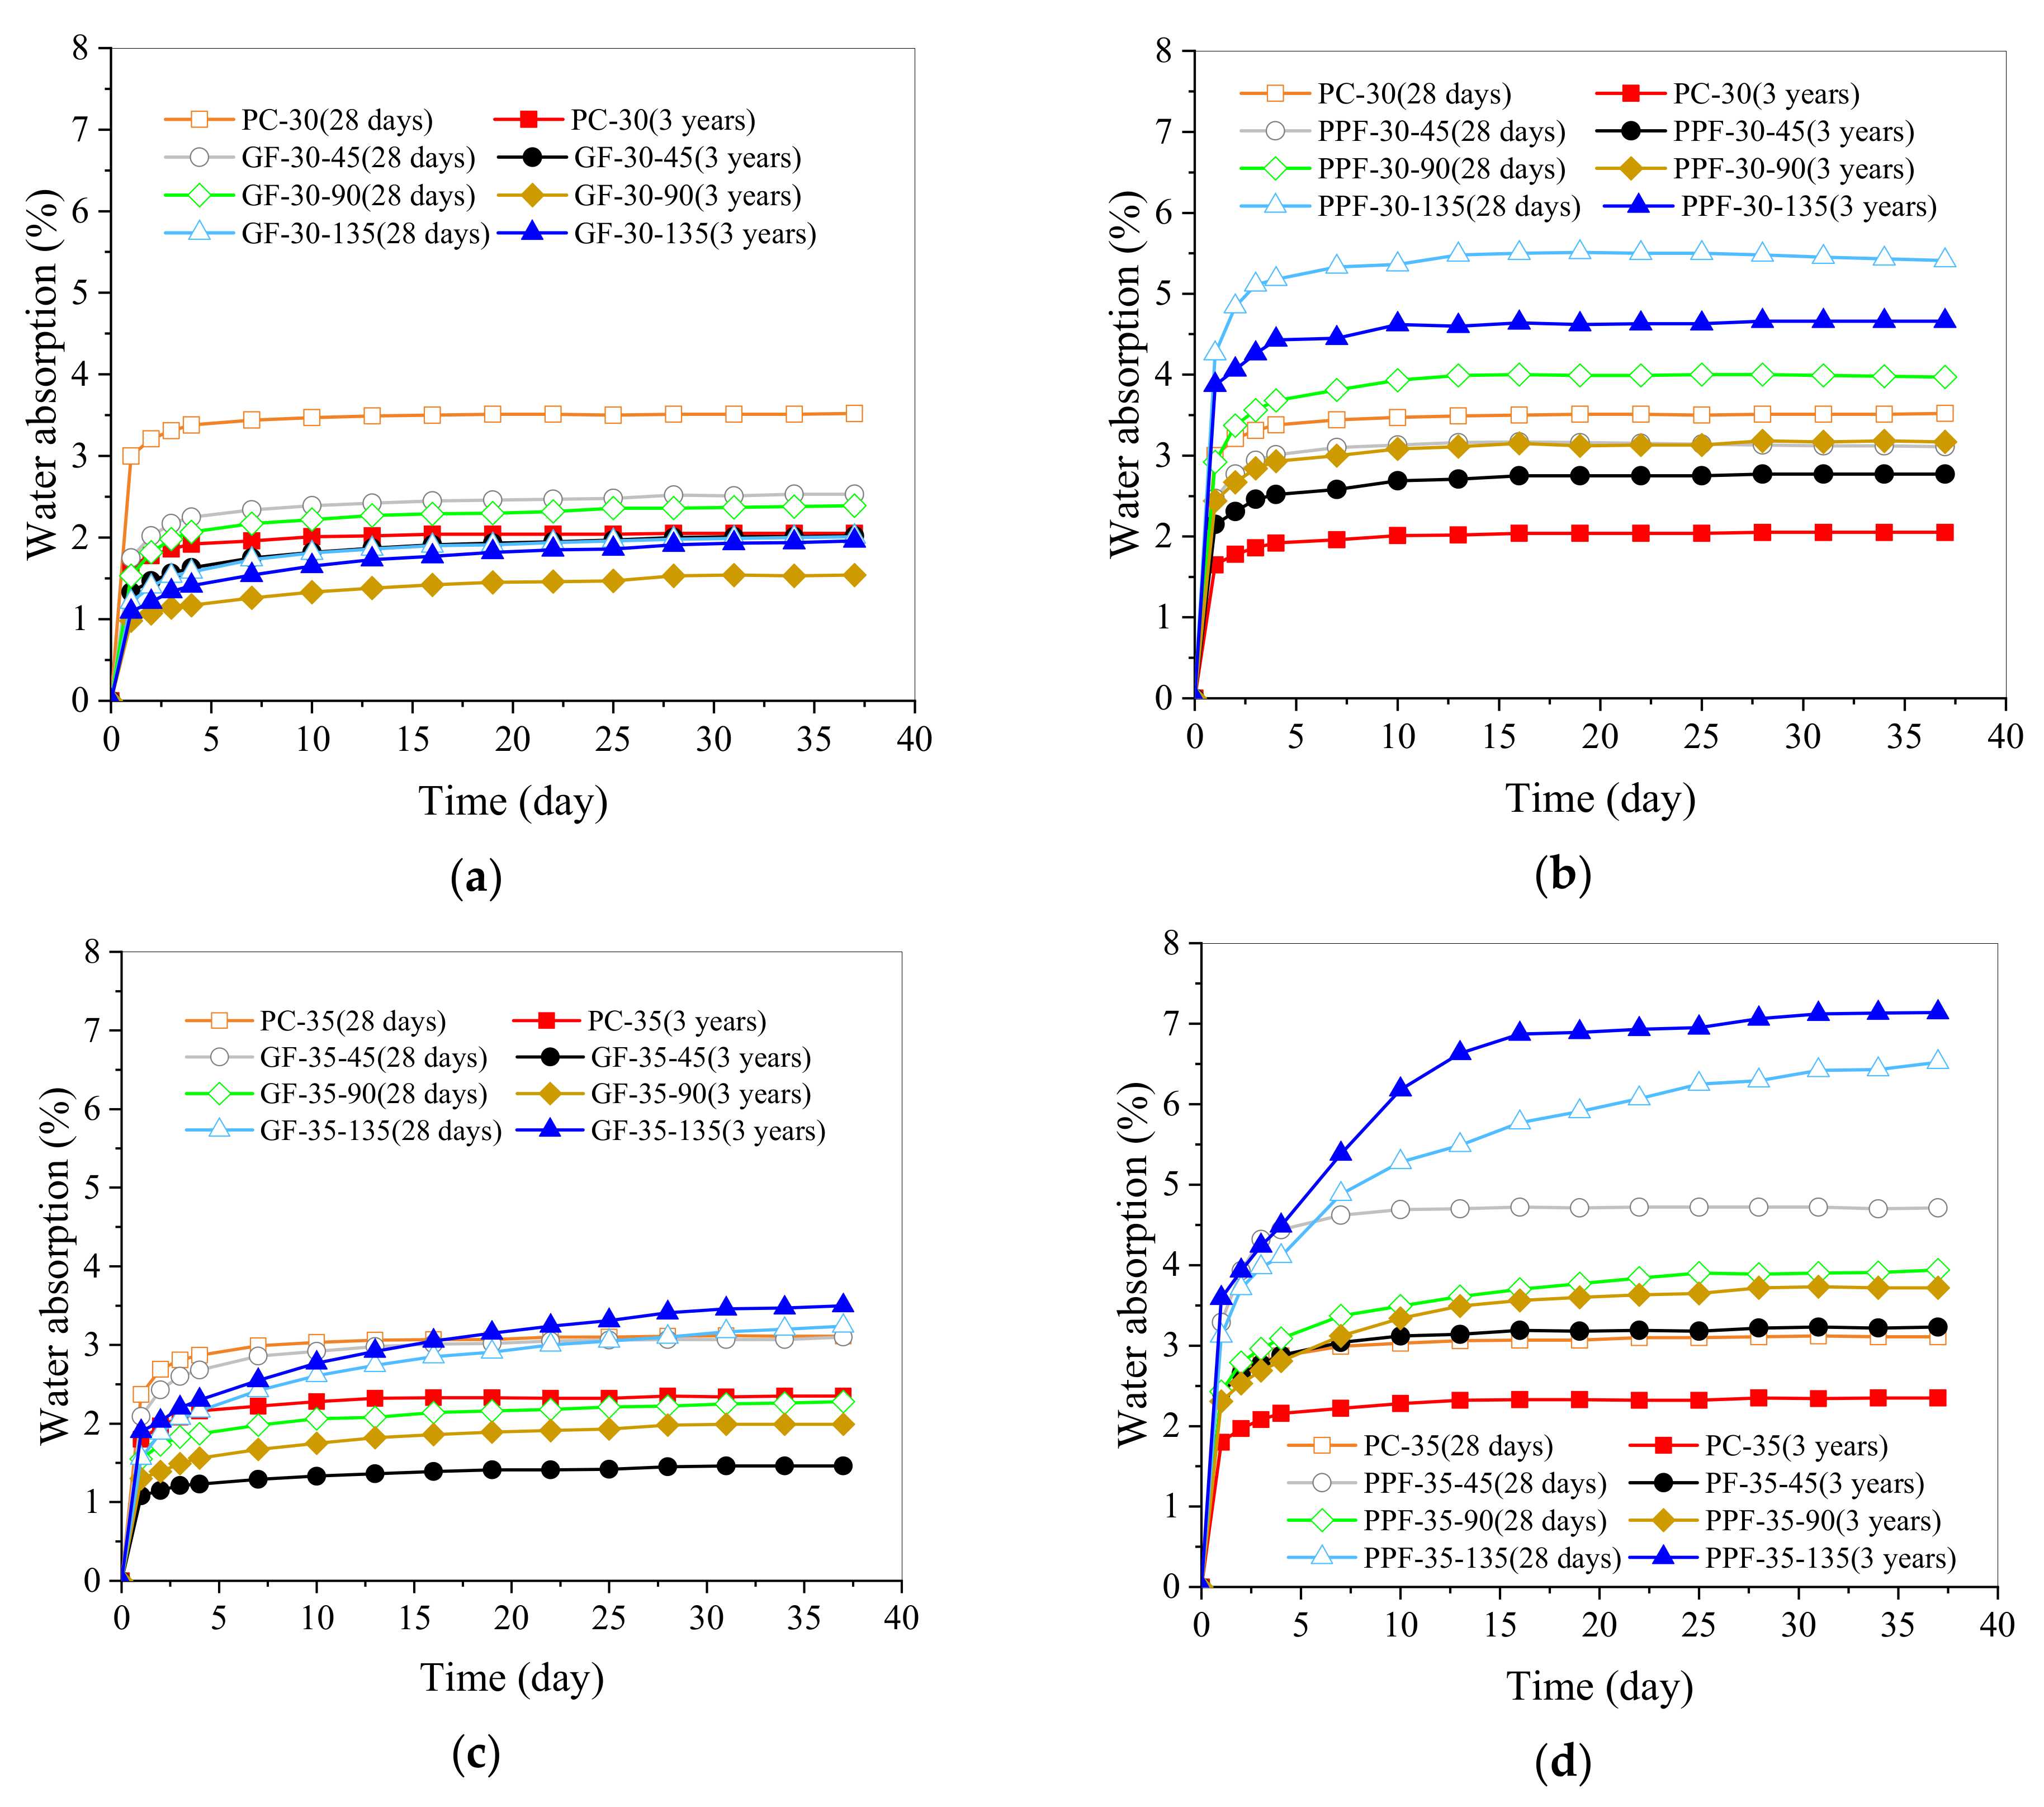
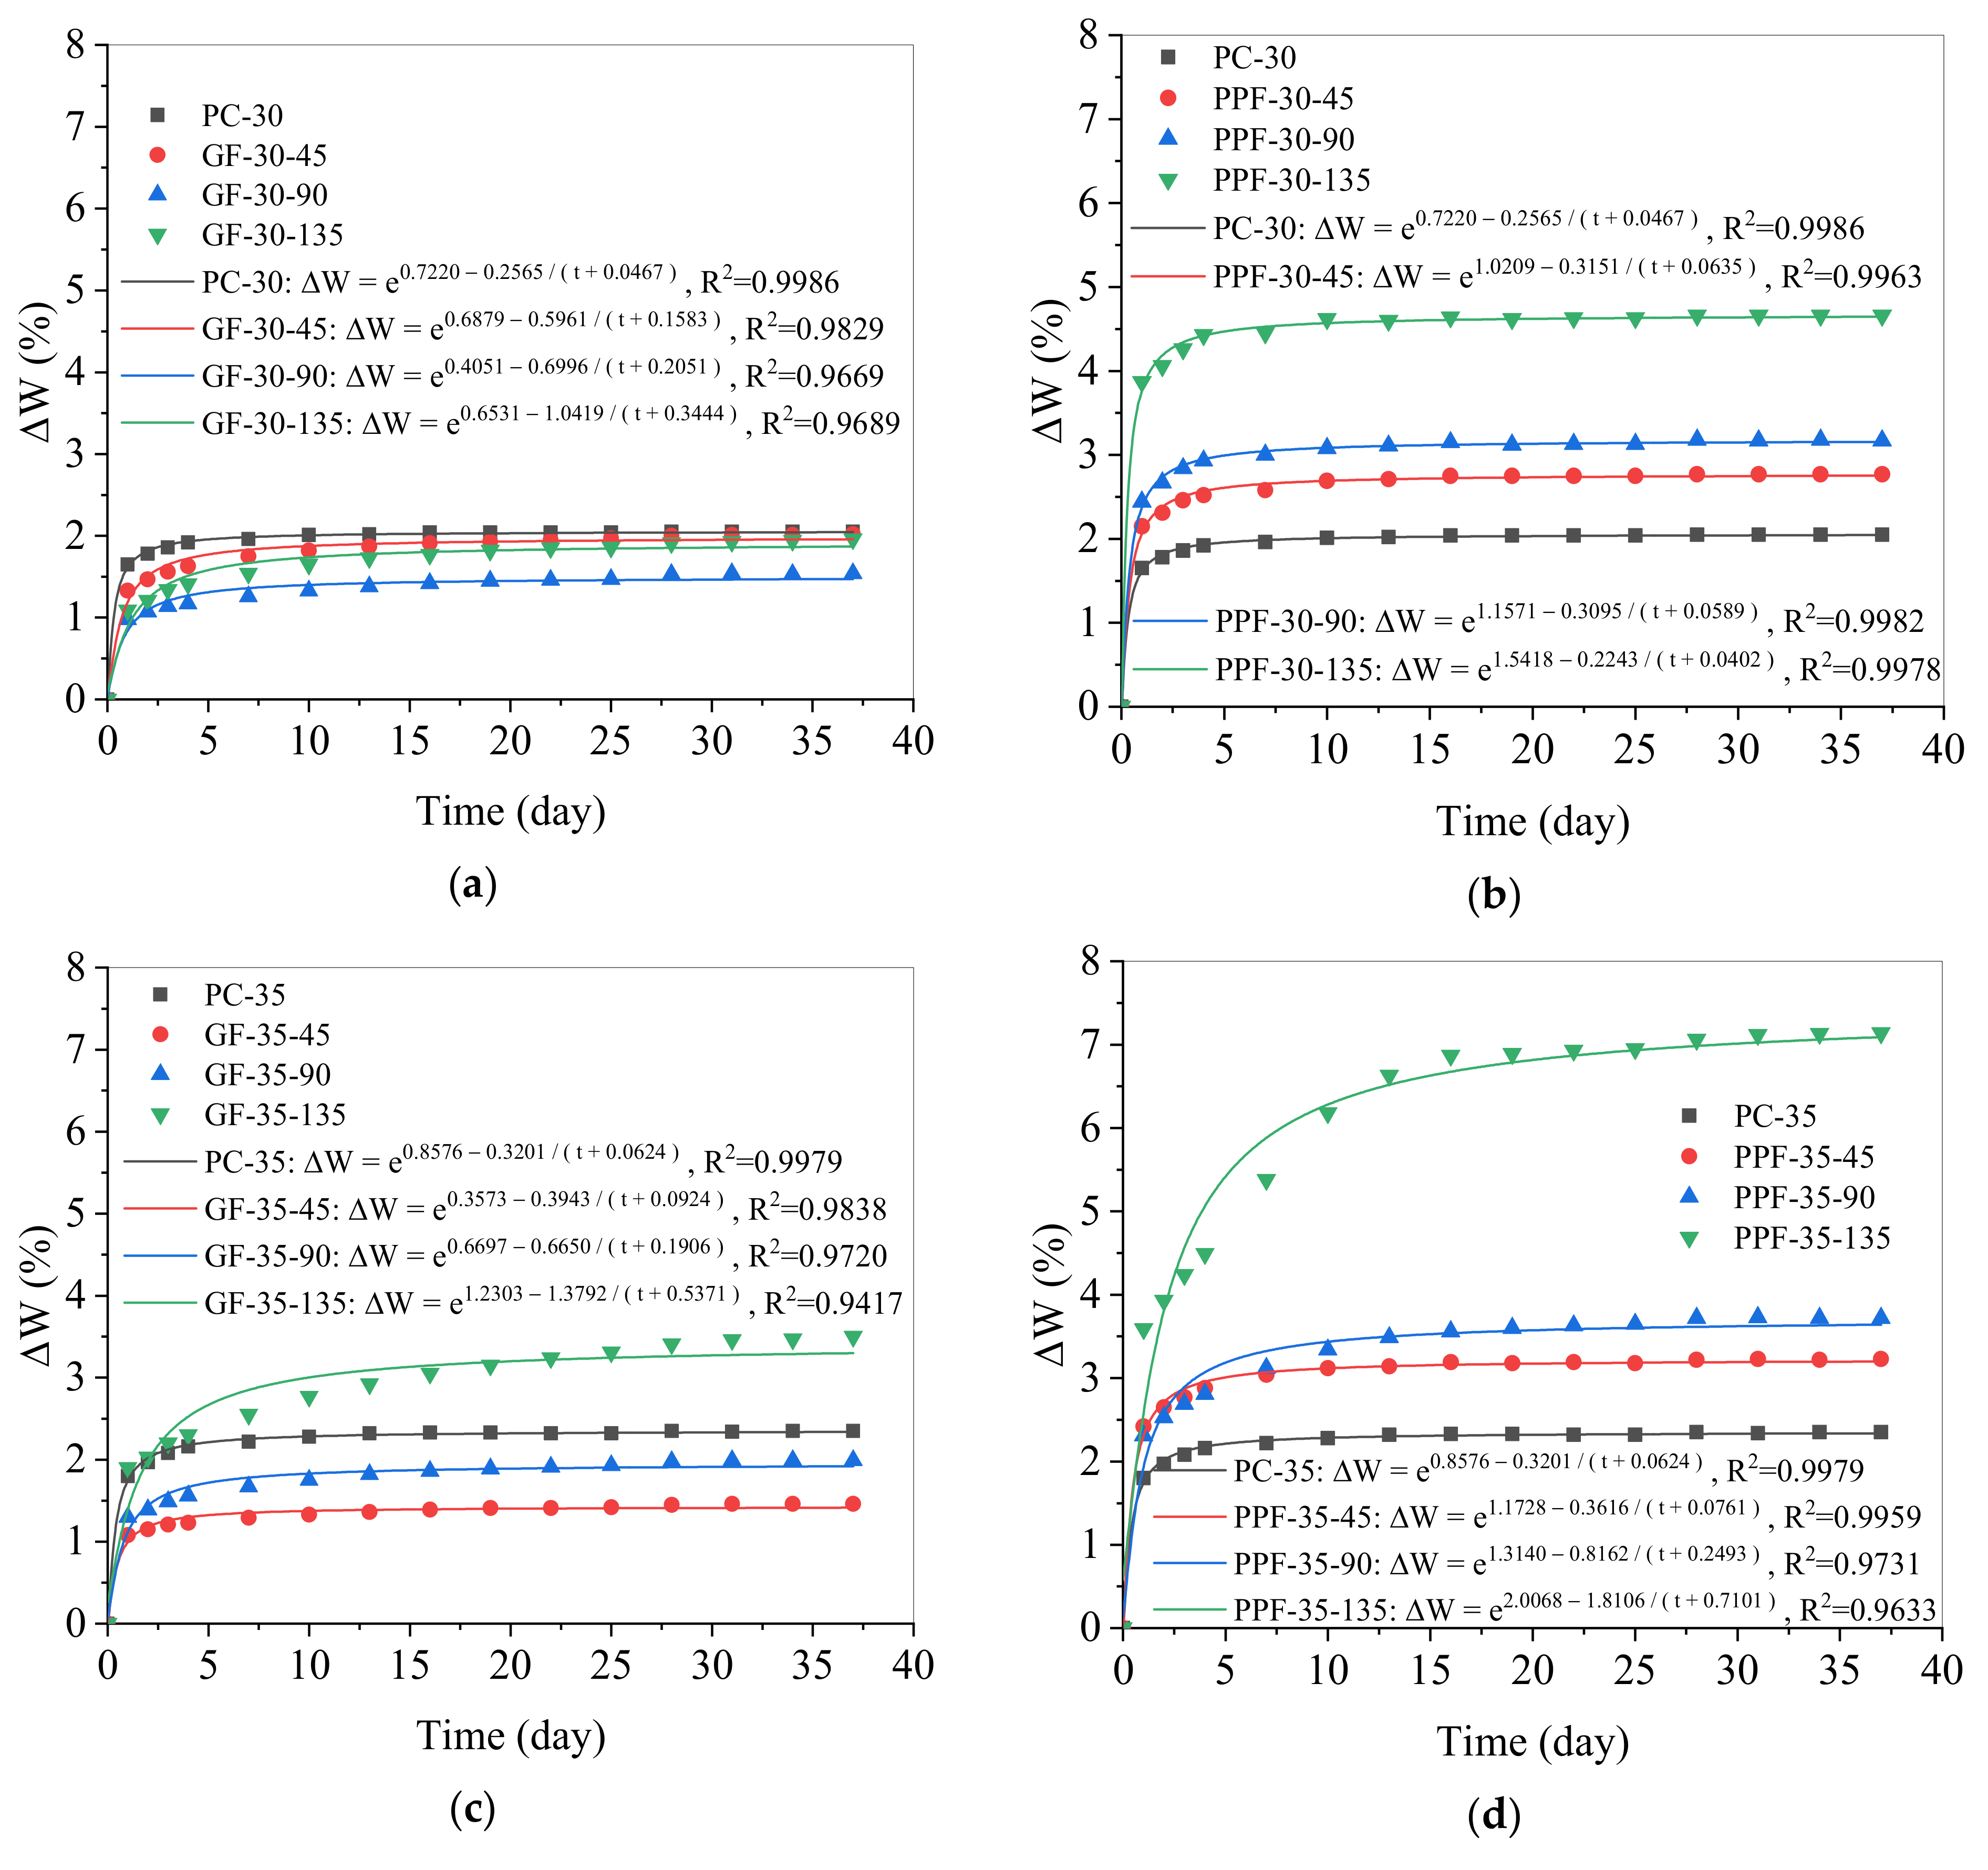
3.2. Water Absorption
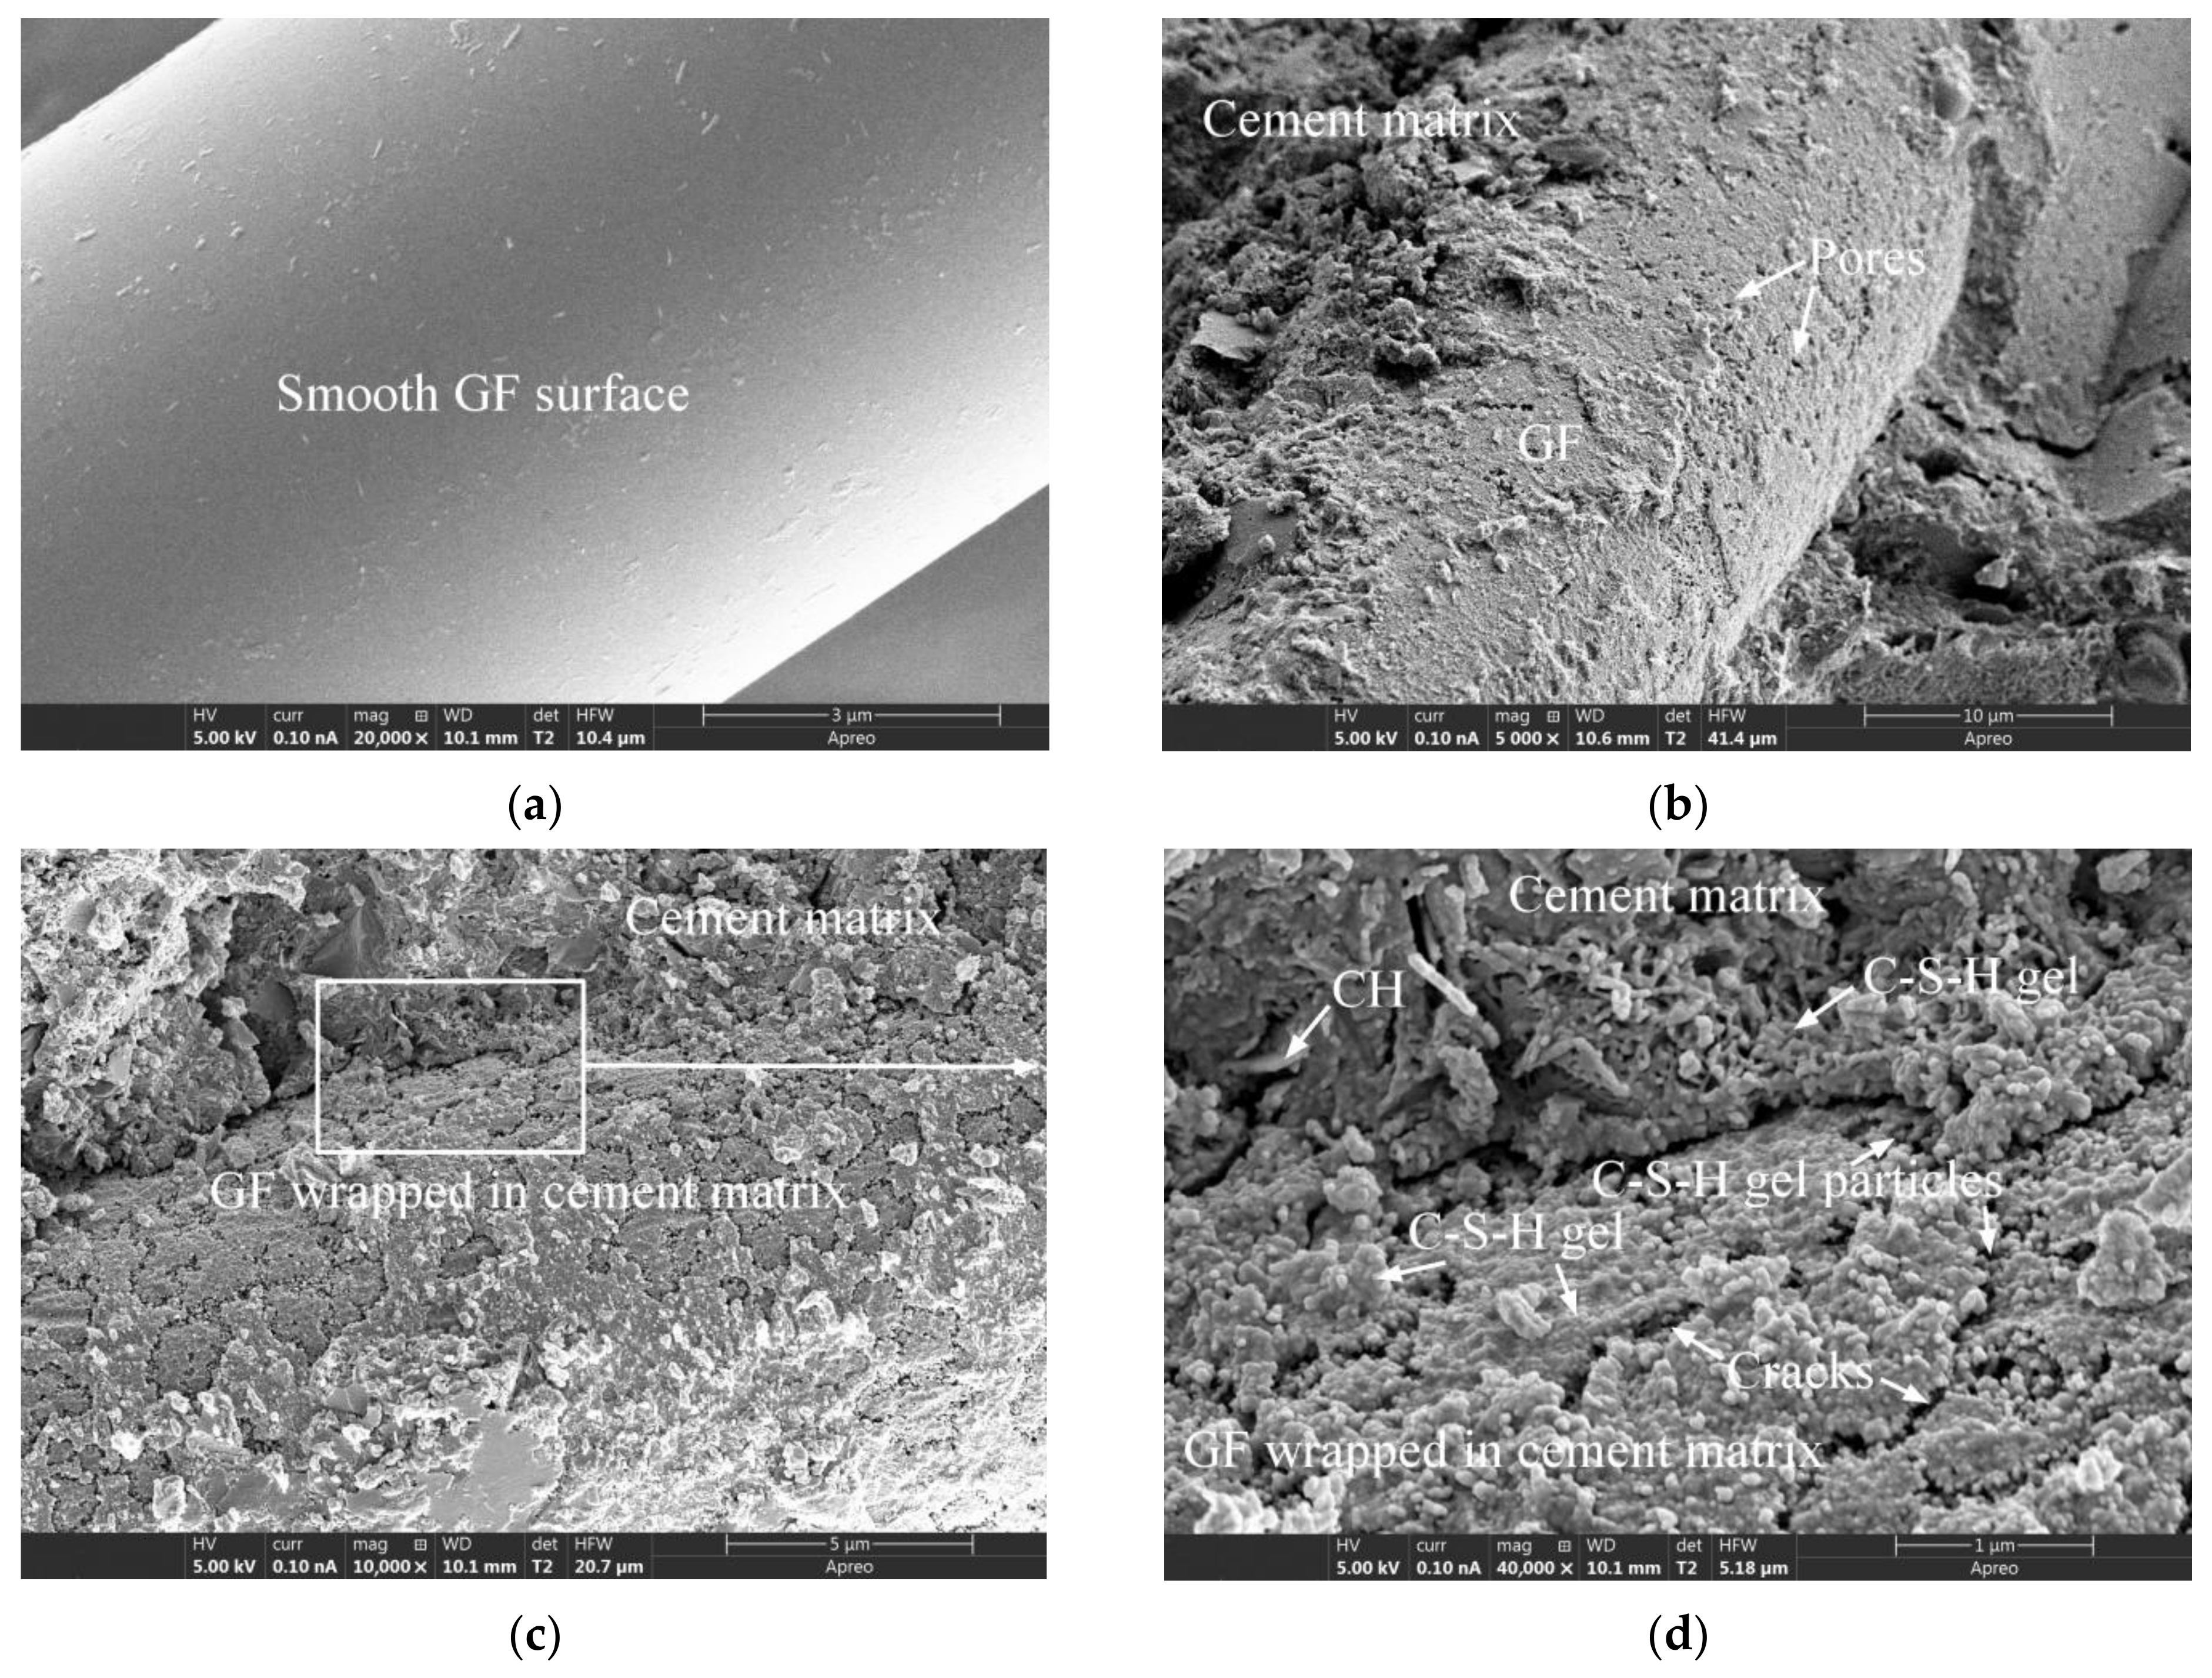
3.3. Microstructure
4. Conclusions
- The water/binder ratio (w/b) was found to affect the rate of increase of the long-term compressive strength of naturally aged concrete. With the increase of w/b from 0.30 to 0.35, the I3y-28d values of plain concrete, GFRC, and PPFRC with different fiber contents all decreased, and the range of decrease was between 6.58% and 51.96%. In other words, after the increase of w/b, as the contents of GF and PPF increased, the compressive strength of concrete increased more slowly.
- The type and content of fiber were found to affect the rate of increase of the long-term compressive strength of naturally aged concrete, and the I3y-28d value of the FRC was generally lower than that of plain concrete. The I3y-28d value of the GFRC was lower than that of the PPFRC with the same fiber content. Excluding that of specimen PPF-30-135, the I3y-28d values of the GFRC and PPFRC were lower than those of plain concrete.
- Compared with the water absorption of the specimens cured for 28 days, that of the FRC specimens cured for three years was significantly reduced, with a range of decrease between 3% and 52.4%. This is due to the subsequent hydration reaction that compacted the internal structure of the concrete. However, with the increases of w/b and the fiber content, the water absorption of specimens GF-35-135 and PPF-35-135 cured for three years increased by 9.1% and 10.9%, respectively, as compared to those of the specimens cured for 28 days. This was due to the large internal pore size and numbers of pores in these two groups of concrete at the initial stage (28 days), and the products produced by the hydration reaction in the later stage (after 28 days) were not sufficient to effectively improve the internal pore structure.
- With the increase of the curing age, the optimal GF content to reduce the water absorption of concrete was found to decrease. Considering the effect of GF on the water absorption of concrete, 1.35% (w/b = 0.30) and 0.90% (w/b = 0.35) were found to be the optimal GF contents if the water absorption of the specimens cured for 28 days is used to measure the GF effect; however, if the water absorption of the specimens cured for three years is considered, the optimum GF contents were found to be reduced to 0.90% (w/b = 0.30) and 0.45% (w/b = 0.35), respectively.
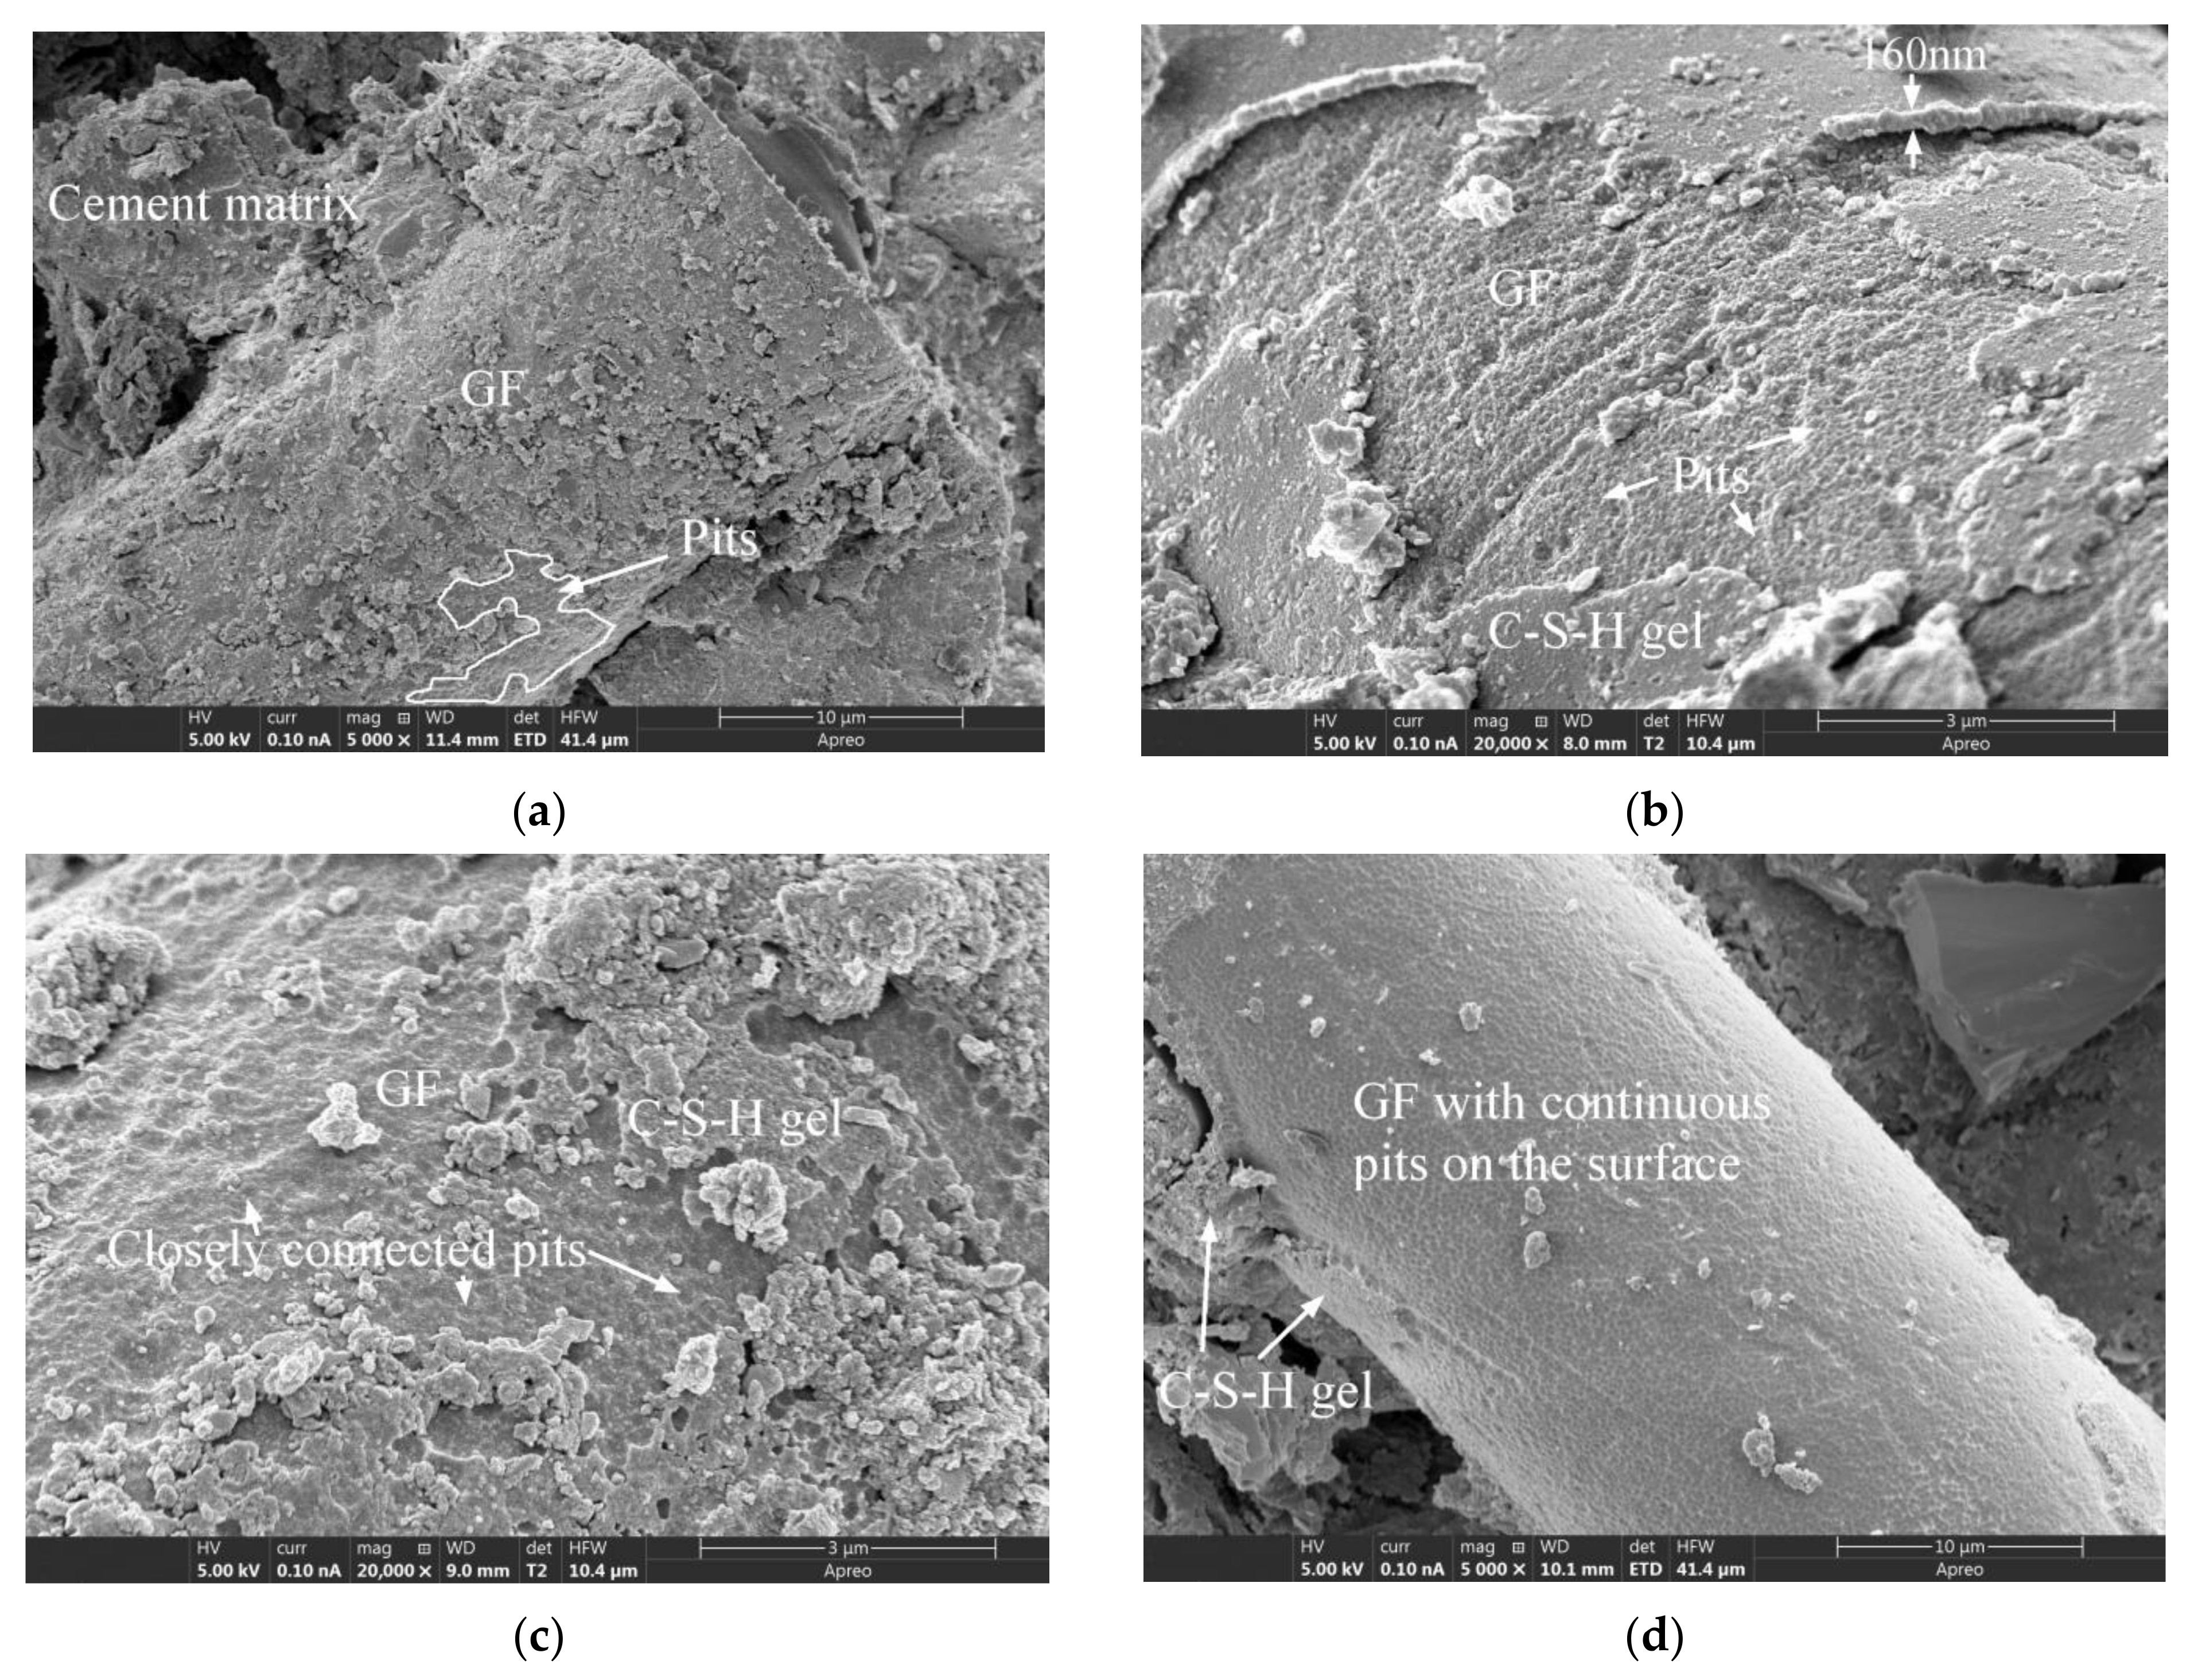
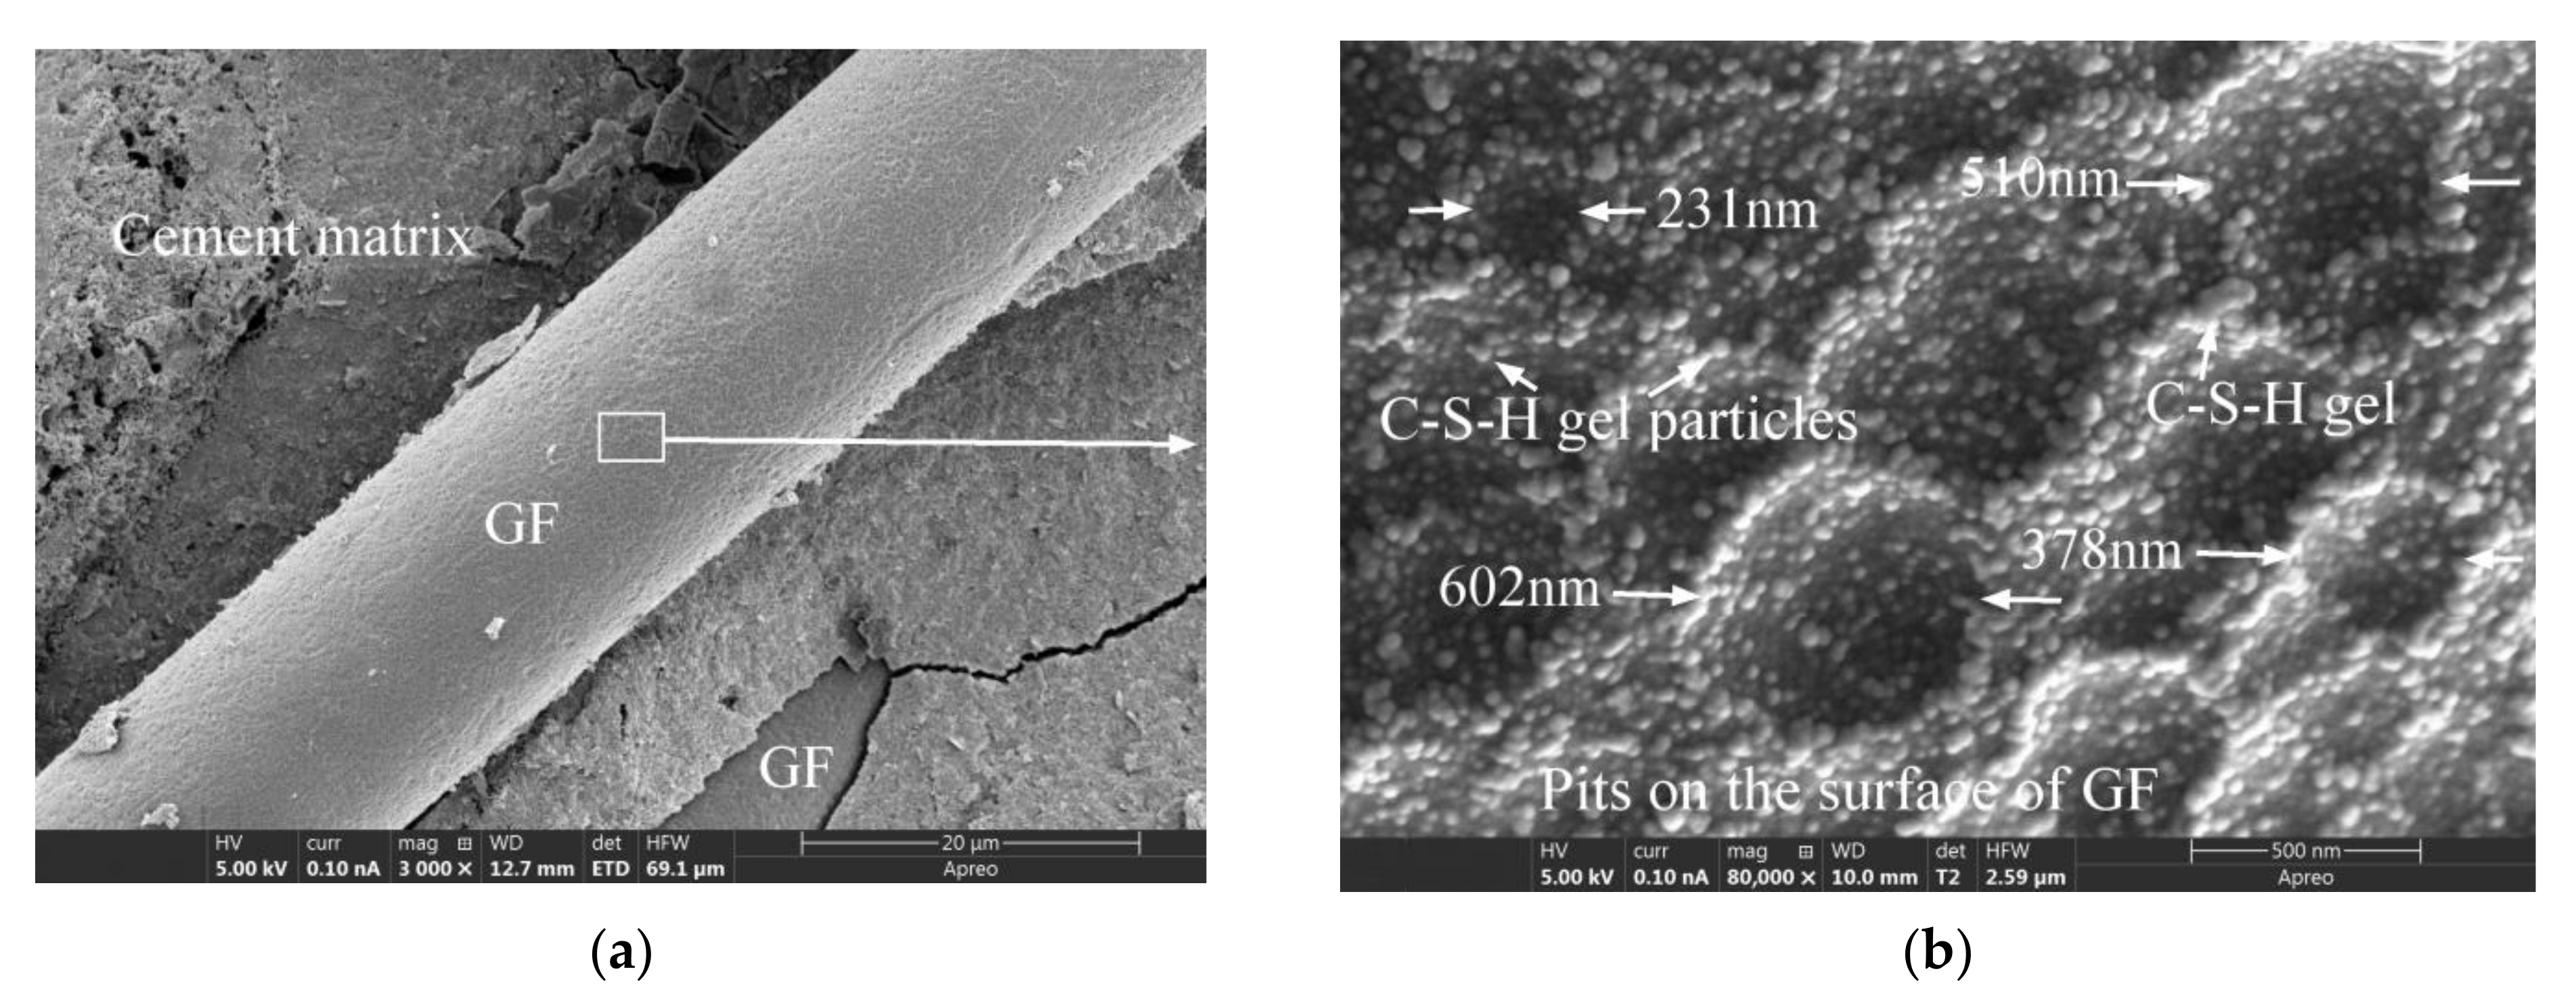
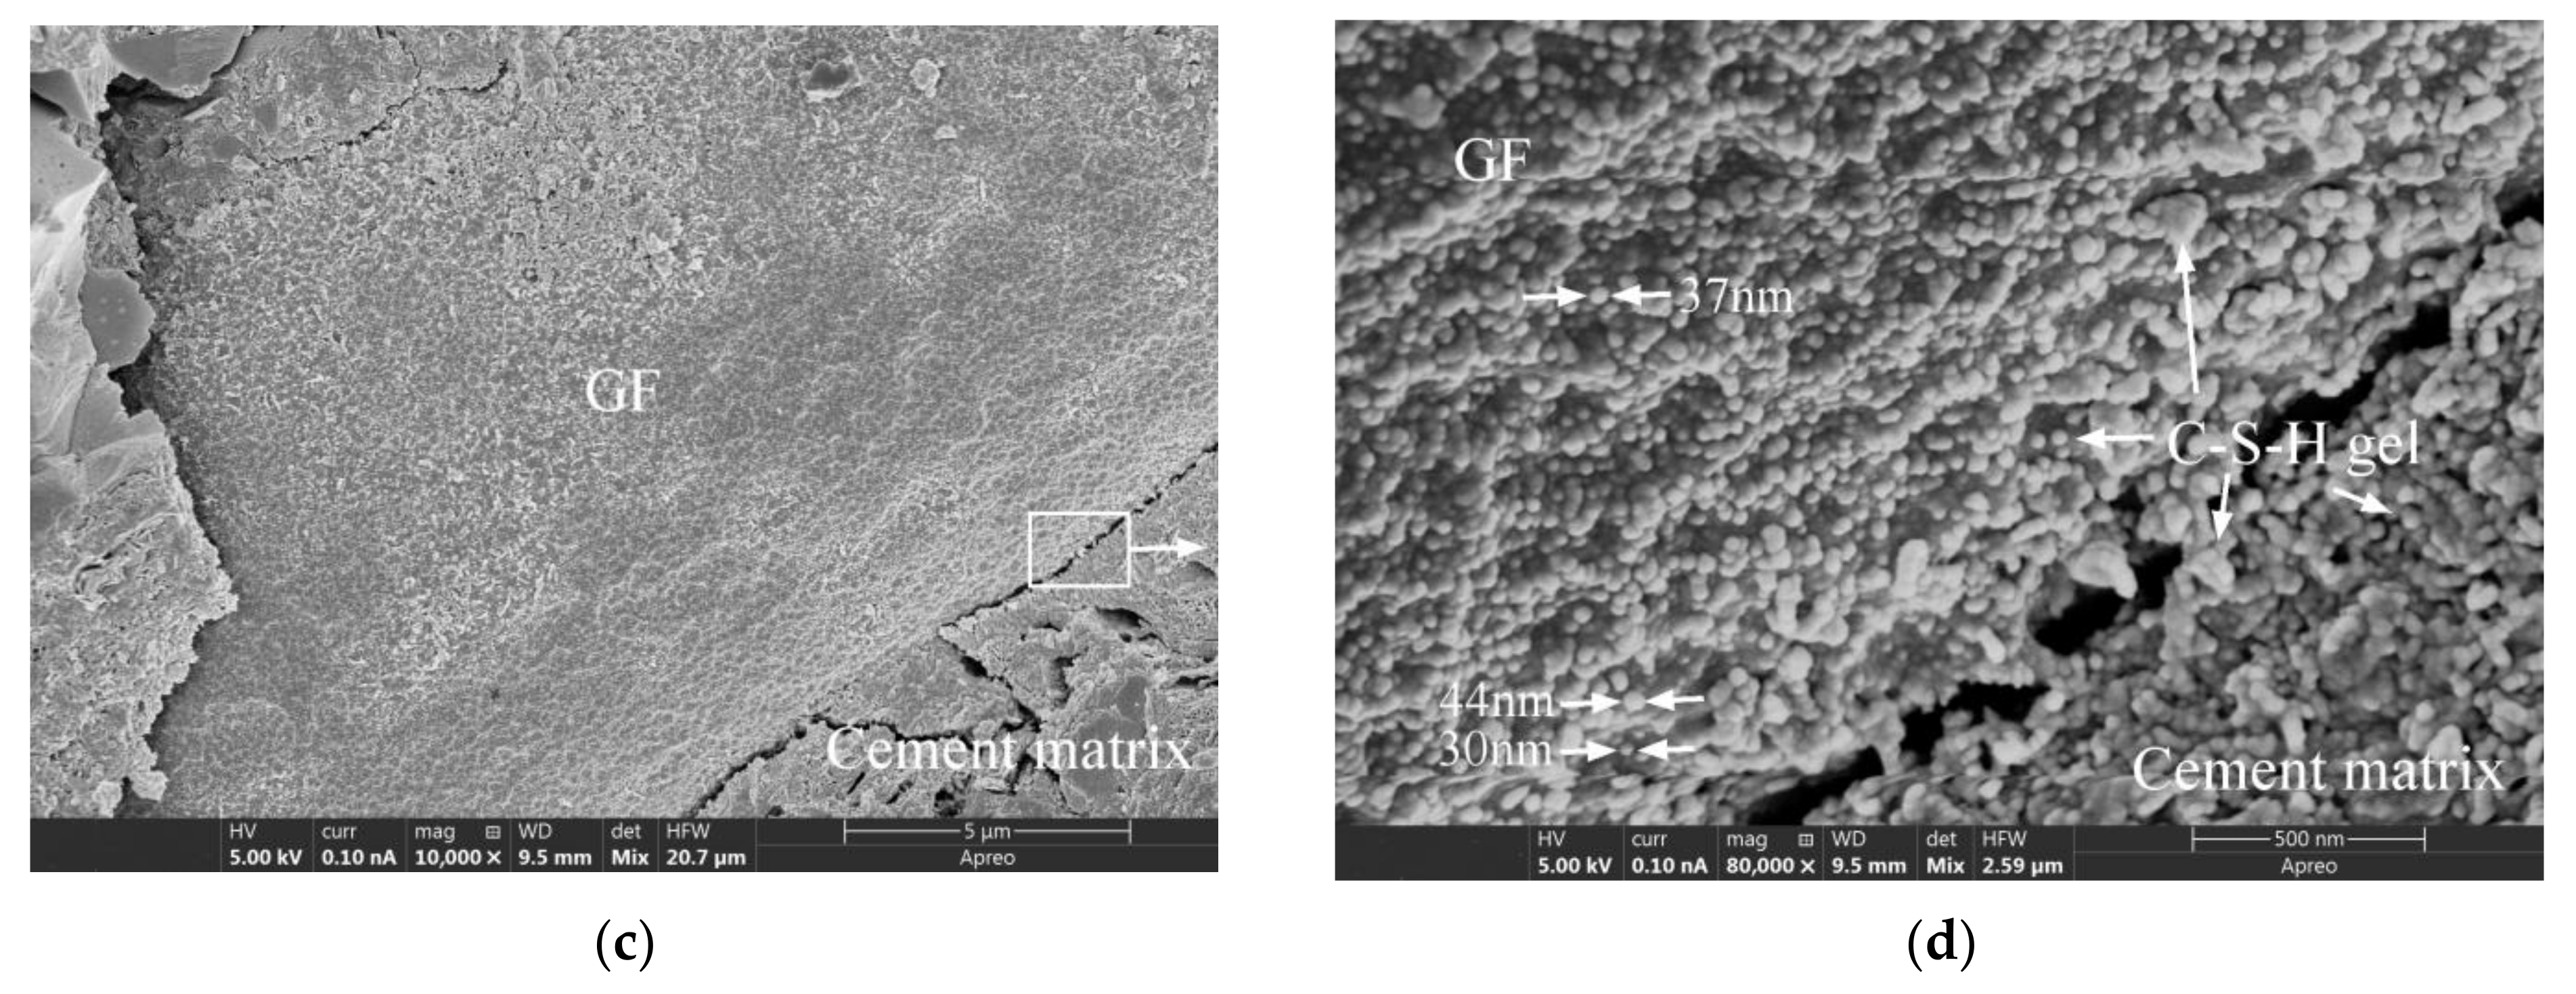
- When the natural curing age was three years, the interfacial transition zone between the GF and cement matrix consisted of a small amount of Ca(OH)2 and a large amount of flocculent or granular C-S-H gel. The GF surface was degraded into continuous pits with diameters of about 200 to 600 nm, and the surfaces of the pits were attached with spherical granular C-S-H gel products with diameters of about 30 to 44 nm. The cement hydration products in the interfacial transition zone and the products attached to the GF surface were highly consistent in both morphology and size.
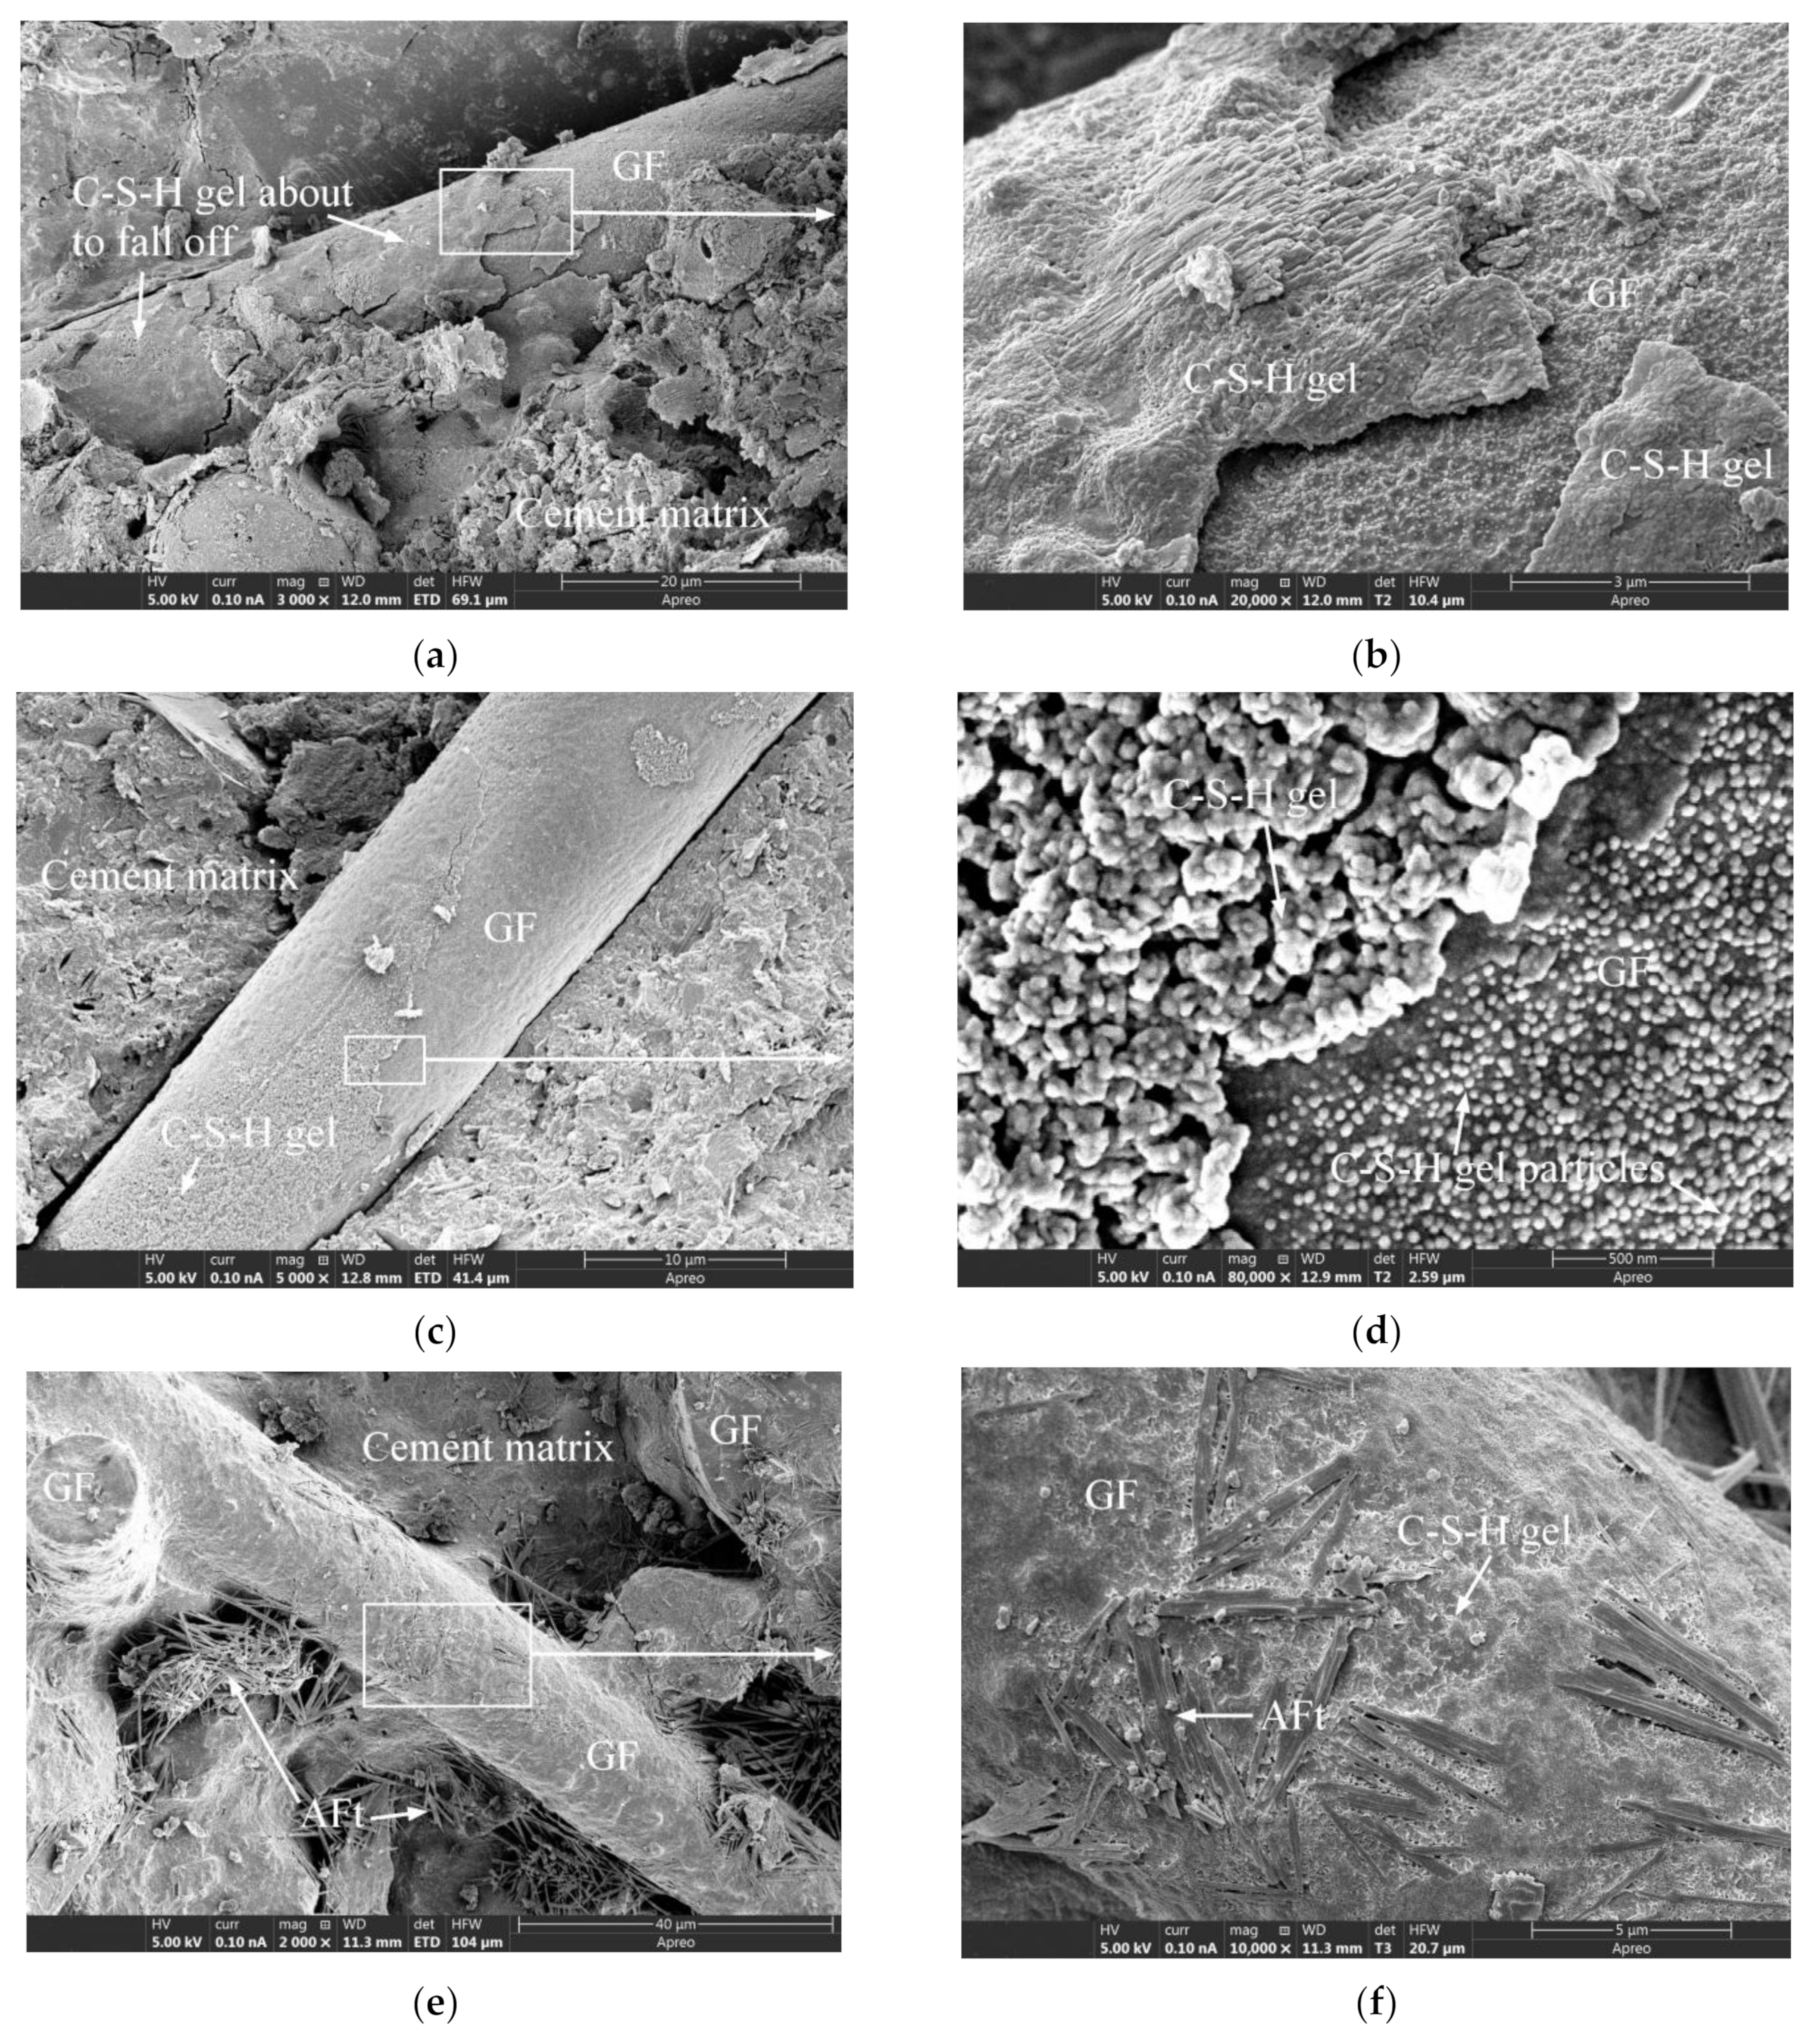
- The freeze-thaw cycles were found to have no significant effect on the pits on the GF surface and the granular C-S-H gel products attached to the pits, but caused a portion of the cement matrix covering the GF to fall off. The factors affecting the shedding area and form of the coating mainly included the compactness and thickness of the coating.
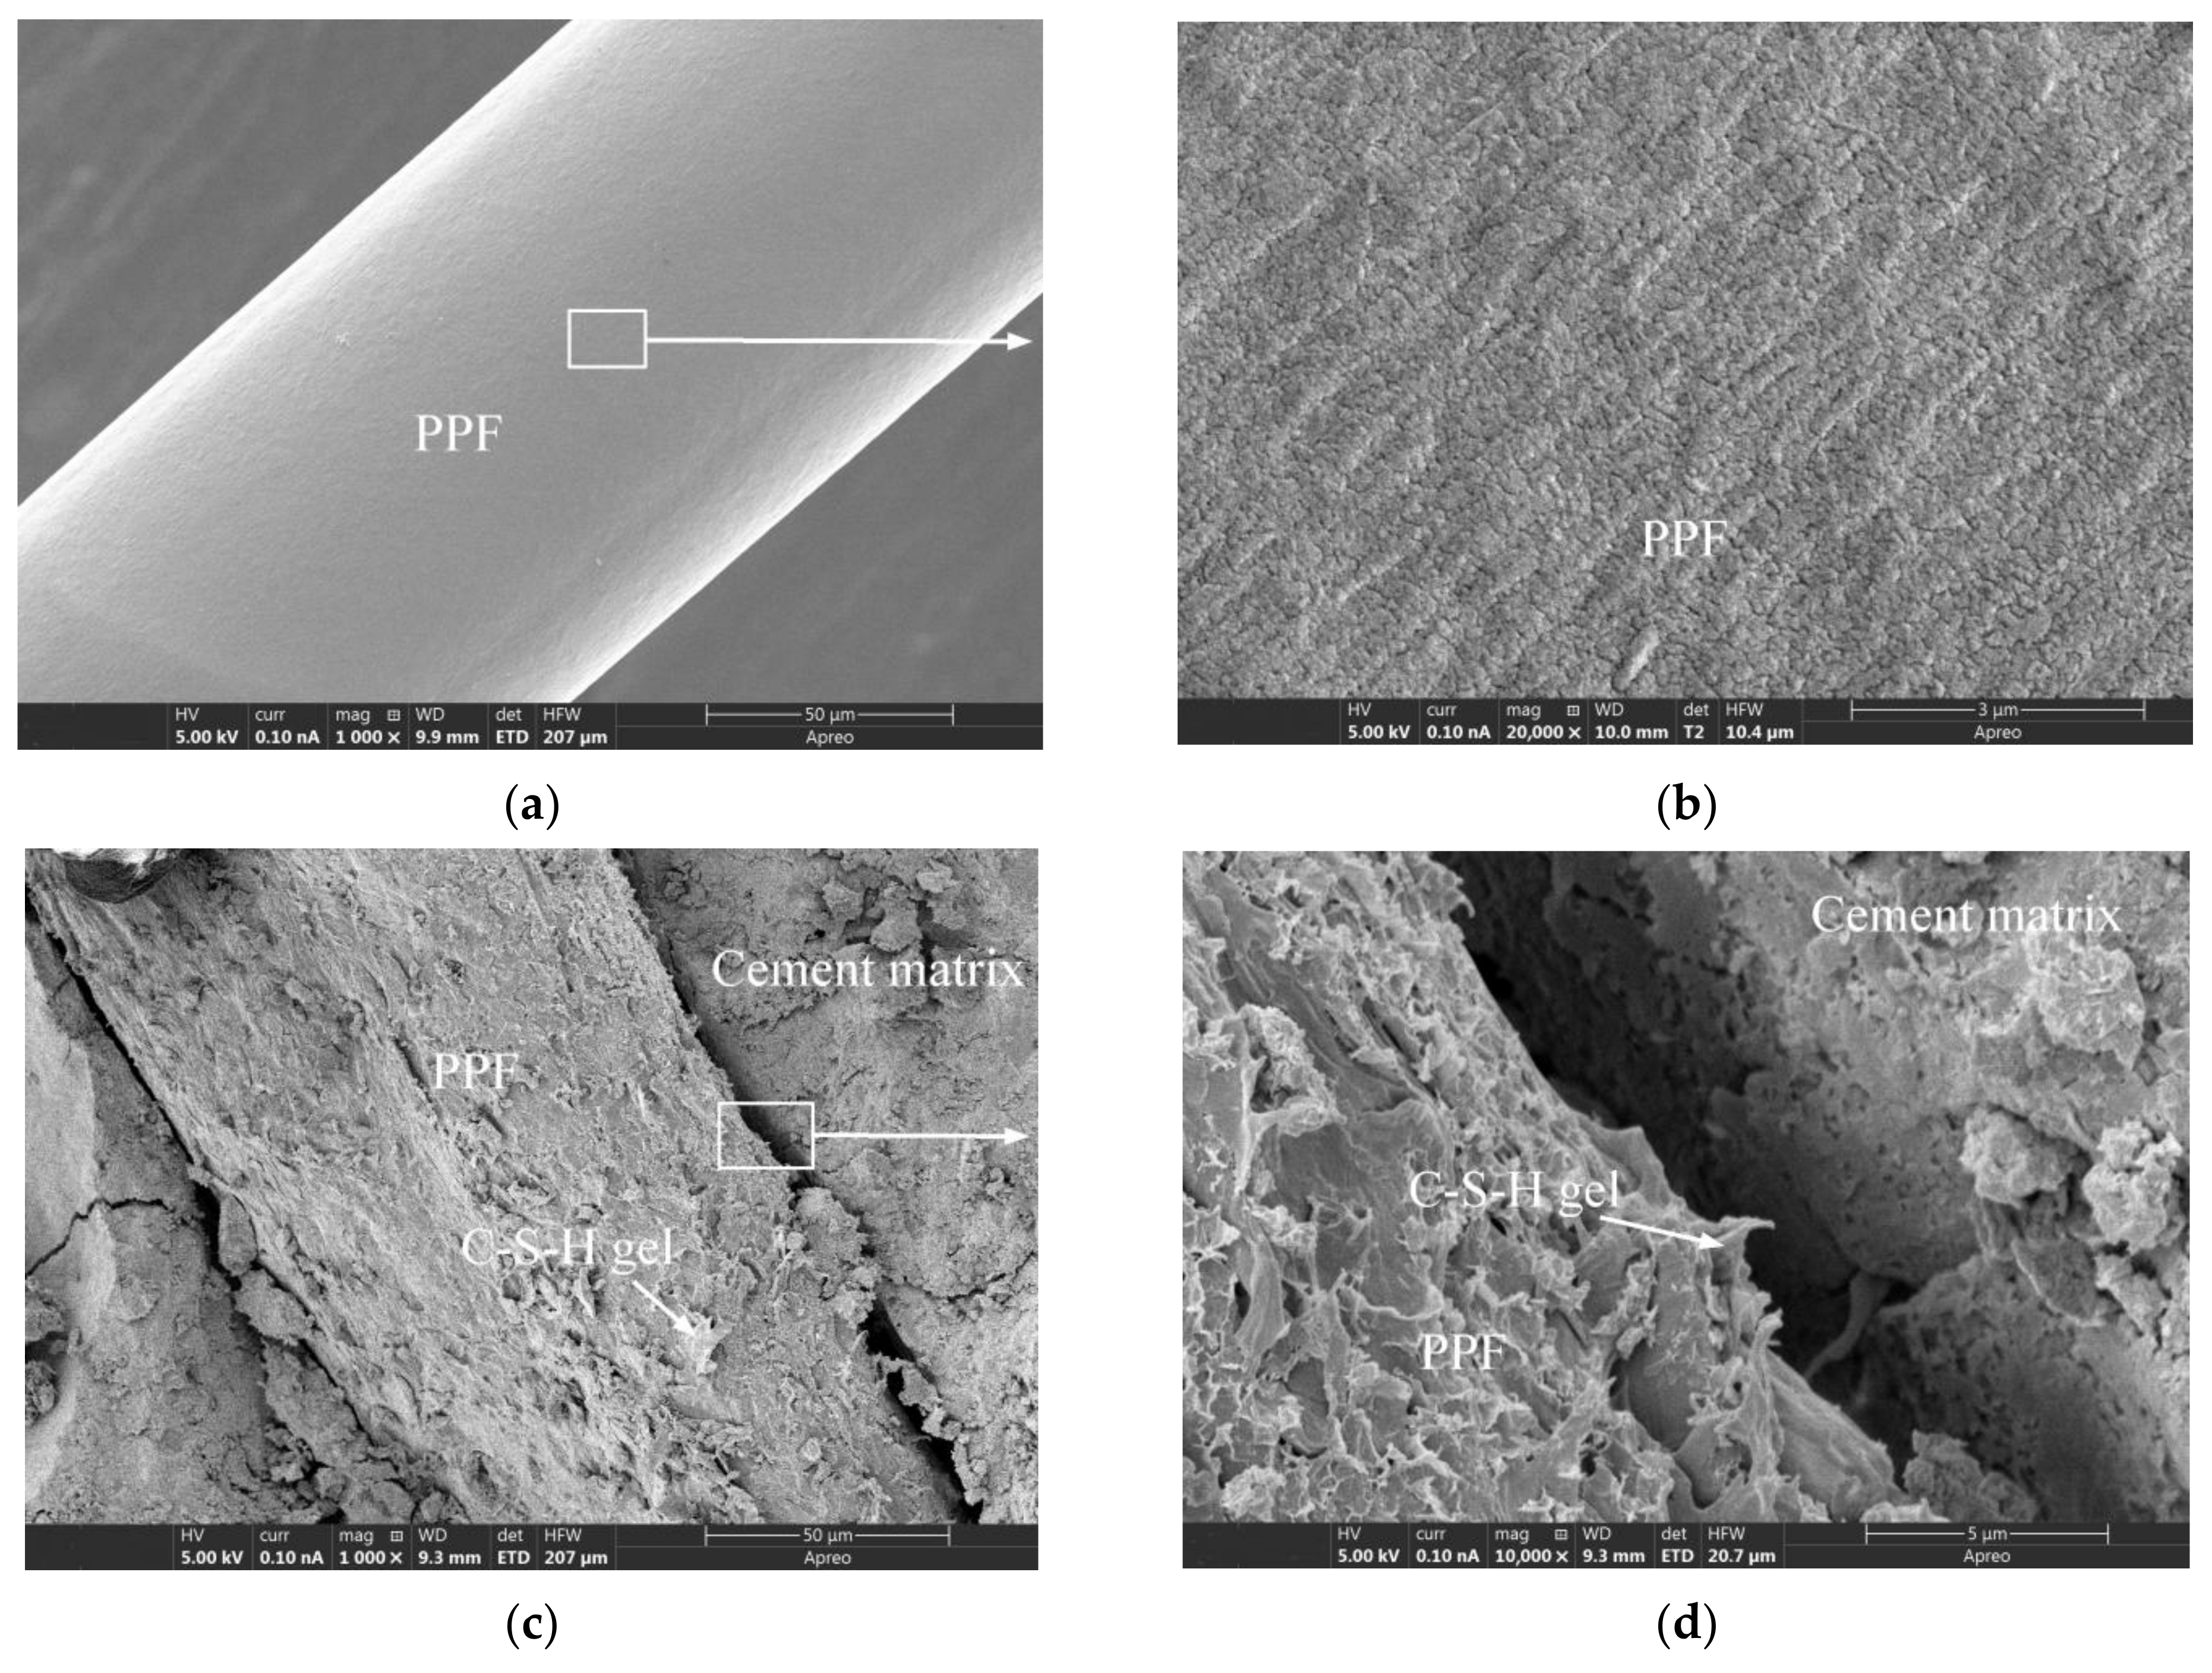
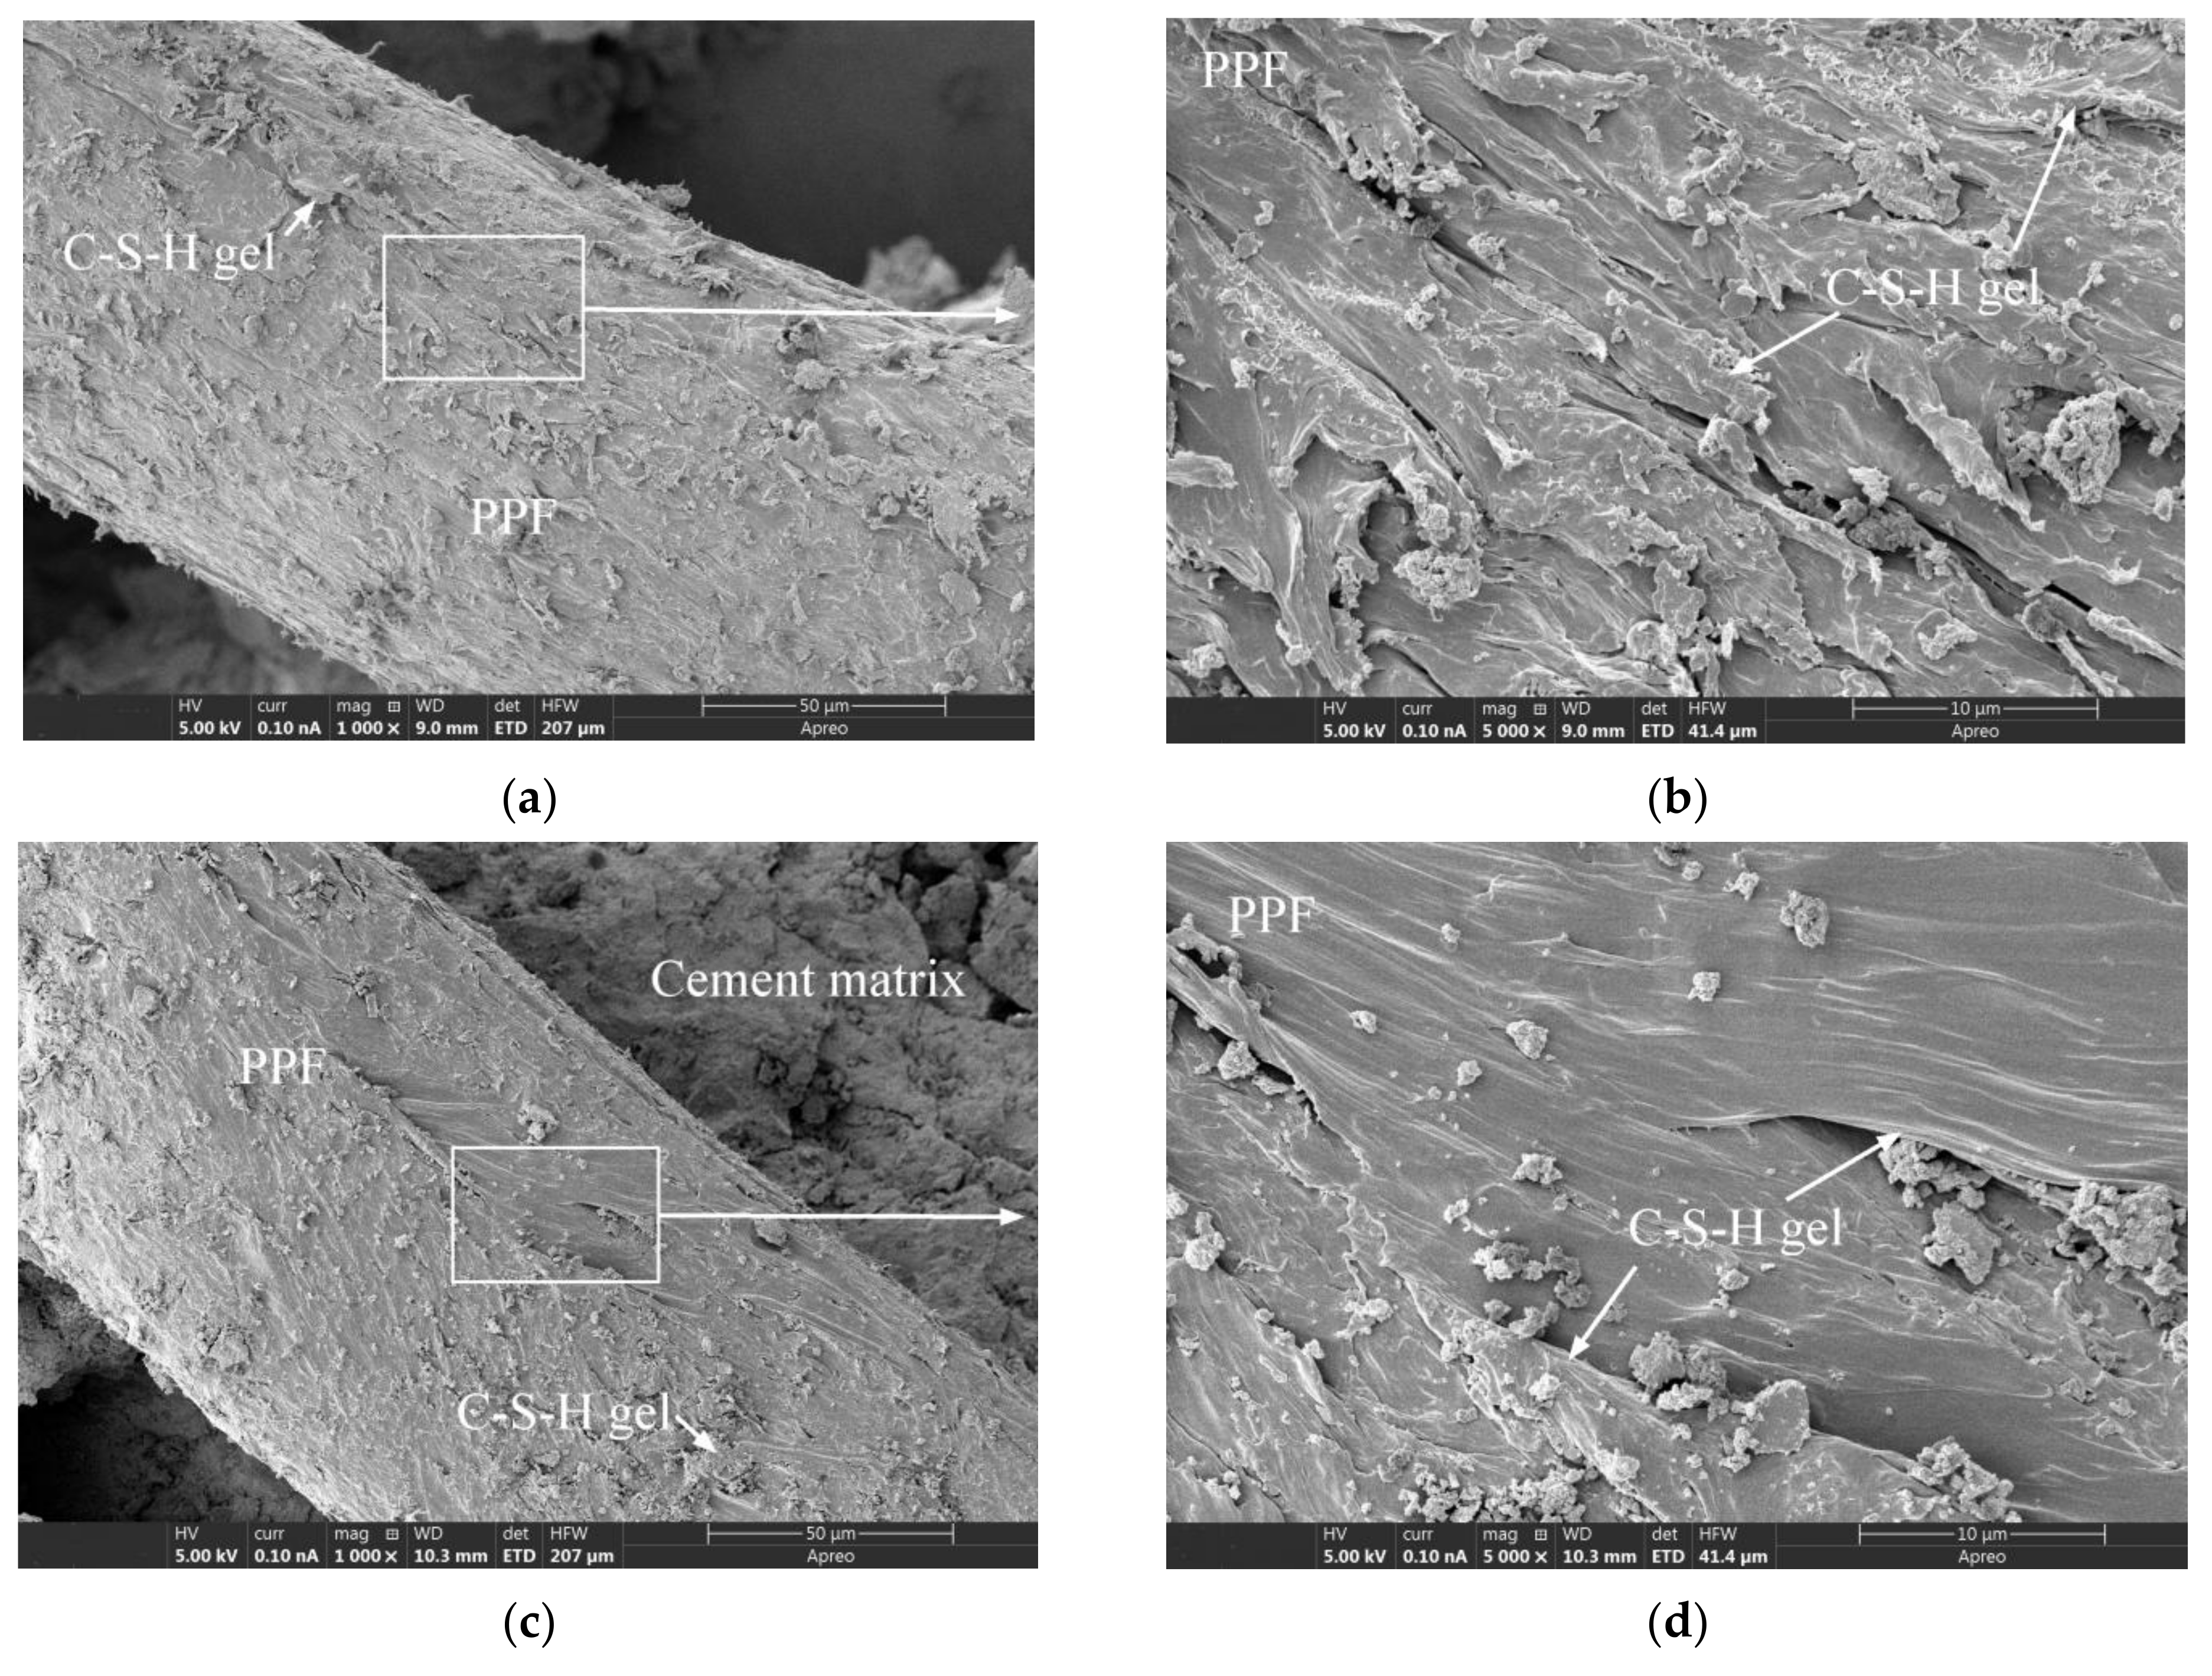
- SEM observation revealed that the interfacial bonding between the PPF and the cement matrix in the PPFRC exhibited almost no change after curing for three years as compared with that after curing for 28 days. Moreover, the cement hydration products on the PPF surface were not significantly damaged by 150 freeze-thaw cycles.
Author Contributions
Funding
Institutional Review Board Statement
Informed Consent Statement
Data Availability Statement
Conflicts of Interest
References
- Liu, F.; Ding, W.; Qiao, Y. An experimental investigation on the integral waterproofing capacity of polypropylene fiber concrete with fly ash and slag powder. Constr. Build. Mater. 2019, 212, 675–686. [Google Scholar] [CrossRef]
- Yang, L.; Liu, G.; Gao, D.; Zhang, C. Experimental study on water absorption of unsaturated concrete: w/c ratio, coarse aggregate and saturation degree. Constr. Build. Mater. 2020, 272, 121945. [Google Scholar] [CrossRef]
- Shekarchizadeh, M.; Bonakdar, A.; Bakhshi, M.; Mirdamadi, A.; Mobasher, B. Transport properties in metakaolin blended concrete. Constr. Build. Mater. 2010, 24, 2217–2223. [Google Scholar] [CrossRef]
- Huang, Q.; Zhu, X.; Liu, D.; Zhao, L.; Zhao, M. Modification of water absorption and pore structure of high-volume fly ash cement pastes by incorporating nanosilica. J. Build. Eng. 2020, 33, 101638. [Google Scholar] [CrossRef]
- Castro, J.; Bentz, D.; Weiss, J. Effect of sample conditioning on the water absorption of concrete. Cem. Concr. Compos. 2011, 33, 805–813. [Google Scholar] [CrossRef]
- Hong, S.; Yao, W.; Guo, B.; Lin, C.; Dong, B.; Li, W.; Hou, D.; Xing, F. Water distribution characteristics in cement paste with capillary absorption. Constr. Build. Mater. 2020, 240, 117767. [Google Scholar] [CrossRef]
- Mermerdaş, K.; Ipek, S.; Algın, Z.; Ekmen, Ş.; Güneş, I. Combined effects of microsilica, steel fibre and artificial lightweight aggregate on the shrinkage and mechanical performance of high strength cementitious composite. Constr. Build. Mater. 2020, 262, 120048. [Google Scholar] [CrossRef]
- Wu, H.; Yang, D.; Xu, J.; Liang, C.; Ma, Z. Water transport and resistance improvement for the cementitious composites with eco-friendly powder from various concrete wastes. Constr. Build. Mater. 2021, 290, 123247. [Google Scholar] [CrossRef]
- Jalal, M.; Pouladkhan, A.; Harandi, O.F.; Jafari, D. RETRACTED: Comparative study on effects of Class F fly ash, nano silica and silica fume on properties of high performance self compacting concrete. Constr. Build. Mater. 2015, 94, 90–104. [Google Scholar] [CrossRef]
- Khatib, J.M.; Clay, R.M. Absorption characteristics of metakaolin concrete. Cem. Concr. Res. 2004, 34, 19–29. [Google Scholar] [CrossRef]
- Mora, E.; González, G.; Romero, P.; Castellón, E. Control of water absorption in concrete materials by modification with hybrid hydrophobic silica particles. Constr. Build. Mater. 2019, 221, 210–218. [Google Scholar] [CrossRef]
- Mohammadyan-Yasouj, S.E.; Ghaderi, A. Experimental investigation of waste glass powder, basalt fibre, and carbon nanotube on the mechanical properties of concrete. Constr. Build. Mater. 2020, 252, 119115. [Google Scholar] [CrossRef]
- Liu, J.; Jia, Y.; Wang, J. Experimental Study on Mechanical and Durability Properties of Glass and Polypropylene Fiber Reinforced Concrete. Fibers Polym. 2019, 20, 1900–1908. [Google Scholar] [CrossRef]
- Yuan, Z.; Jia, Y. Mechanical properties and microstructure of glass fiber and polypropylene fiber reinforced concrete: An experimental study. Constr. Build. Mater. 2021, 266, 121048. [Google Scholar] [CrossRef]
- Afroughsabet, V.; Ozbakkaloglu, T. Mechanical and durability properties of high-strength concrete containing steel and polypropylene fibers. Constr. Build. Mater. 2015, 94, 73–82. [Google Scholar] [CrossRef]
- Behfarnia, K.; Behravan, A. Application of high performance polypropylene fibers in concrete lining of water tunnels. Mater. Des. 2014, 55, 274–279. [Google Scholar] [CrossRef]
- Fallah, S.; Nematzadeh, M. Mechanical properties and durability of high-strength concrete containing macro-polymeric and polypropylene fibers with nano-silica and silica fume. Constr. Build. Mater. 2017, 132, 170–187. [Google Scholar] [CrossRef]
- Beigi, M.H.; Berenjian, J.; Omran, O.L.; Nik, A.S.; Nikbin, I.M. An experimental survey on combined effects of fibers and nanosilica on the mechanical, rheological, and durability properties of self-compacting concrete. Mater. Des. 2013, 50, 1019–1029. [Google Scholar] [CrossRef]
- Ali, B.; Qureshi, L.A.; Shah, S.H.A.; Rehman, S.U.; Hussain, I.; Iqbal, M. A step towards durable, ductile and sustainable concrete: Simultaneous incorporation of recycled aggregates, glass fiber and fly ash. Constr. Build. Mater. 2020, 251, 118980. [Google Scholar] [CrossRef]
- Rashid, M.U. Experimental investigation on durability characteristics of steel and polypropylene fiber reinforced concrete exposed to natural weathering action. Constr. Build. Mater. 2020, 250, 118910. [Google Scholar] [CrossRef]
- Abbasi, B.A.; Raza, S.S.; Hussain, I.; Iqbal, M. Influence of different fibers on mechanical and durability performance of concrete with silica fume. Struct. Concr. 2020, 22, 318–333. [Google Scholar]
- Arabi, N.; Molez, L.; Rangeard, D. Durability of Alkali-Resistant Glass Fibers Reinforced Cement Composite: Microstructural Observations of Degradation. Period. Polytech. Civ. Eng. 2018, 10631. [Google Scholar] [CrossRef] [Green Version]
- Eiras, J.N.; Kundu, T.; Bonilla, M.; Payá, J. Nondestructive Monitoring of Ageing of Alkali Resistant Glass Fiber Reinforced Cement (GRC). J. Nondestruct. Eval. 2013, 32, 300–314. [Google Scholar] [CrossRef]
- Madhkhan, M.; Katirai, R. Effect of pozzolanic materials on mechanical properties and aging of glass fiber reinforced concrete. Constr. Build. Mater. 2019, 225, 146–158. [Google Scholar] [CrossRef]
- Diaz, A.E.; Paradela, L.S.; Sanchez-Galvez, V. The effect of silica fume and metakaolin on glass-fibre reinforced concrete (GRC) ageing. Mater. De Constr. 2010, 60, 67–82. [Google Scholar]
- Nourredine, A. Influence of curing conditions on durability of alkali-resistant glass fibres in cement matrix. Bull. Mater. Sci. 2011, 34, 775–783. [Google Scholar] [CrossRef]
- Song, M.; Purnell, P.; Richardson, I. Microstructure of interface between fibre and matrix in 10-year aged GRC modified by calcium sulfoaluminate cement. Cem. Concr. Res. 2015, 76, 20–26. [Google Scholar] [CrossRef]
- Enfedaque, A.; Paradela, L.S.; Sánchez-Gálvez, V. An alternative methodology to predict aging effects on the mechanical properties of glass fiber reinforced cements (GRC). Constr. Build. Mater. 2012, 27, 425–431. [Google Scholar] [CrossRef] [Green Version]
- Enfedaque, A.; Cendón, D.; Gálvez, F.; Sánchez-Gálvez, V. Analysis of glass fiber reinforced cement (GRC) fracture surfaces. Constr. Build. Mater. 2010, 24, 1302–1308. [Google Scholar] [CrossRef] [Green Version]
- Zhu, W.; Bartos, P. Assessment of interfacial microstructure and bond properties in aged GRC using a novel microindentation method. Cem. Concr. Res. 1997, 27, 1701–1711. [Google Scholar] [CrossRef]
- Butler, M.; Mechtcherine, V.; Hempel, S. Experimental investigations on the durability of fibre–matrix interfaces in textile-reinforced concrete. Cem. Concr. Compos. 2009, 31, 221–231. [Google Scholar] [CrossRef]
- Qian, X.; Shen, B.; Mu, B.; Li, Z. Enhancement of aging resistance of glass fiber reinforced cement. Mater. Struct. 2003, 36, 323–329. [Google Scholar] [CrossRef]
- Cheng, C.; He, J.; Zhang, J.; Yang, Y. Study on the time-dependent mechanical properties of glass fiber reinforced cement (GRC) with fly ash or slag. Constr. Build. Mater. 2019, 217, 128–136. [Google Scholar] [CrossRef]
- Purnell, P.; Beddows, J. Durability and simulated ageing of new matrix glass fibre reinforced concrete. Cem. Concr. Compos. 2005, 27, 875–884. [Google Scholar] [CrossRef]
- CS (Chinese Standard) GB/T 1346-2011; Test Methods for Water Requirement of Normal Consistency, Setting Time and Soundness of the Portland Cement. Standards Press of China: Beijing, China, 2011. (In Chinese)
- CS (Chinese Standard) GB/T 8074-2008; Test Methods for Specific Surface of Cement-Blaine Method. Standards Press of China: Beijing, China, 2008. (In Chinese)
- CS (Chinese Standard) GB/T 17671-2021; Test Method of Cement Mortar Strength (ISO Method). Standards Press of China: Beijing, China, 2021. (In Chinese)
- CS (Chinese Standard) JGJ 55-2011; Specification for Mix Proportion Design of Ordinary Concrete. China Building Industry Press: Beijing, China, 2011. (In Chinese)
- CS (Chinese Standard) CECS 13-2009; Standard Test Methods for Fiber Reinforced Concrete. China Planning Press: Beijing, China, 2009. (In Chinese)
- CS (Chinese Standard) GB/T 50081-2002; Standard for Test Method of Mechanical Properties on Ordinary Concrete. China Building Industry Press: Beijing, China, 2002. (In Chinese)
- CS (Chinese Standard) GB/T 50082-2009; Standard for Test Methods of Long-Performance and Durability of Ordinary Concrete. China Building Industry Press: Beijing, China, 2009. (In Chinese)
- ASTM C642; Standard Test Method for Density, Absorption, and Voids in Hardened Concrete. Annual Book of ASTM Standard. ASTM International (ASTM): West Conshohocken, PA, USA, 2013.
- ASTM C1723; Standard Guide for Examination of Hardened Concrete Using Scanning Electron Microscopy. Annual Book of ASTM Standard. ASTM International (ASTM): West Conshohocken, PA, USA, 2010.
- Simões, T.; Costa, H.; Dias-Da-Costa, D.; Julio, E. Influence of fibres on the mechanical behaviour of fibre reinforced concrete matrixes. Constr. Build. Mater. 2017, 137, 548–556. [Google Scholar] [CrossRef] [Green Version]
- Sivakumar, A.; Santhanam, M. Mechanical properties of high strength concrete reinforced with metallic and non-metallic fibres. Cem. Concr. Compos. 2007, 29, 603–608. [Google Scholar] [CrossRef]
- Pehlivanlı, Z.O.; Uzun, I.; Demir, I. Mechanical and microstructural features of autoclaved aerated concrete reinforced with autoclaved polypropylene, carbon, basalt and glass fiber. Constr. Build. Mater. 2015, 96, 428–433. [Google Scholar] [CrossRef]
- Sun, Z.; Xu, Q. Microscopic, physical and mechanical analysis of polypropylene fiber reinforced concrete. Mater. Sci. Eng. A 2009, 527, 198–204. [Google Scholar] [CrossRef]
- Xue, G.; Yilmaz, E.; Song, W.; Cao, S. Mechanical, flexural and microstructural properties of cement-tailings matrix composites: Effects of fiber type and dosage. Compos. Part B Eng. 2019, 172, 131–142. [Google Scholar] [CrossRef]
- Ramezanianpour, A.; Esmaeili, M.; Ghahari, S.; Najafi, M. Laboratory study on the effect of polypropylene fiber on durability, and physical and mechanical characteristic of concrete for application in sleepers. Constr. Build. Mater. 2013, 44, 411–418. [Google Scholar] [CrossRef]
- Mehta, P.K.; Monteiro, P.J.M. Concrete: Microstructure, Properties and Materials, 4th ed.; McGraw-Hill Professional: New York, NY, USA, 2014. [Google Scholar]
- Santos, A.G.; Rincon, J.M.; Romero, M. Characterization of a polypropylene fibered cement composite using ESEM, FESEM and mechanical testing. Constr. Build. Mater. 2005, 19, 396–403. [Google Scholar] [CrossRef] [Green Version]
- Nam, J.; Kim, G.; Lee, B.; Hasegawa, R.; Hama, Y. Frost resistance of polyvinyl alcohol fiber and polypropylene fiber reinforced cementitious composites under freeze thaw cycling. Compos. Part B Eng. 2016, 90, 241–250. [Google Scholar] [CrossRef]


| Cement | Soundness | Specific Surface Area (m2/kg) | Setting Time (min) | Compressive Strength (MPa) | Flexural Strength (MPa) | |||
|---|---|---|---|---|---|---|---|---|
| Initial | Final | 3 Days | 28 Days | 3 Days | 28 Days | |||
| Experimental result | Qualified | 324 | 159 | 223 | 23.6 | 48.9 | 6.3 | 8.1 |
| Chemical Compositions (%) | SiO2 | CaO | Al2O3 | Fe2O3 | MgO | SO3 | Na2O | K2O | Loss on Ignition |
|---|---|---|---|---|---|---|---|---|---|
| Cement | 21.5 | 59.81 | 5.86 | 2.85 | 2.23 | 2.06 | 0.2 | 0.67 | 4.82 |
| Chemical Compositions (%) | SiO2 | CaO | Al2O3 | Fe2O3 | MgO | SO3 | Na2O | K2O | Loss on Ignition |
|---|---|---|---|---|---|---|---|---|---|
| Fly ash | 66.67 | 3.05 | 18.97 | 4.39 | 1.24 | 0.3 | - | - | 5.38 |
| Chemical Compositions (%) | SiO2 | CaO | Al2O3 | Fe2O3 | MgO | SO3 | Na2O | K2O | Loss on Ignition |
|---|---|---|---|---|---|---|---|---|---|
| Silica fume | 93.82 | 0.41 | 0.21 | 0 | 0.65 | 0.64 | 0.32 | 0.85 | 3.1 |
| Chemical Compositions (%) | SiO2 | CaO | Al2O3 | Fe2O3 | MgO | SO3 | Na2O | K2O | Loss on Ignition |
|---|---|---|---|---|---|---|---|---|---|
| Slag | 32.08 | 38.09 | 15.06 | 0.94 | 8.26 | 0.17 | - | - | 5.4 |
| Type of Fiber | Length (mm) | Diameter (μm) | Aspect Ratio | Specific Gravity | Tensile Strength (MPa) | Elastic Modulus (MPa) |
|---|---|---|---|---|---|---|
| GF | 12 | 15 | 800 | 2.36 | 1300 | 4286 |
| PPF | 12 | 60 | 200 | 0.91 | 486 | 4800 |
| Mix ID | w/b | Cement (kg/m3) | Fly Ash (kg/m3) | Silica Fume (kg/m3) | Slag Powder (kg/m3) | Fine Aggregate (kg/m3) | Coarse Aggregate (kg/m3) | Water (kg/m3) | SP (kg/m3) | Volume Fraction of Fiber (%) | |
|---|---|---|---|---|---|---|---|---|---|---|---|
| GF | PPF | ||||||||||
| PC-30 | 0.30 | 280 | 86 | 22 | 43 | 655 | 1165 | 129 | 6.45 | - | - |
| GF-30-45 | 0.30 | 280 | 86 | 22 | 43 | 655 | 1165 | 129 | 6.45 | 0.45 | - |
| GF-30-90 | 0.30 | 280 | 86 | 22 | 43 | 655 | 1165 | 129 | 6.45 | 0.90 | - |
| GF-30-135 | 0.30 | 280 | 86 | 22 | 43 | 655 | 1165 | 129 | 6.45 | 1.35 | - |
| PPF-30-45 | 0.30 | 280 | 86 | 22 | 43 | 655 | 1165 | 129 | 6.45 | - | 0.45 |
| PPF-30-90 | 0.30 | 280 | 86 | 22 | 43 | 655 | 1165 | 129 | 6.45 | - | 0.90 |
| PPF-30-135 | 0.30 | 280 | 86 | 22 | 43 | 655 | 1165 | 129 | 6.45 | - | 1.35 |
| PC-35 | 0.35 | 240 | 74 | 18 | 37 | 677 | 1204 | 129 | 5.55 | - | - |
| GF-35-45 | 0.35 | 240 | 74 | 18 | 37 | 677 | 1204 | 129 | 5.55 | 0.45 | - |
| GF-35-90 | 0.35 | 240 | 74 | 18 | 37 | 677 | 1204 | 129 | 5.55 | 0.90 | - |
| GF-35-135 | 0.35 | 240 | 74 | 18 | 37 | 677 | 1204 | 129 | 5.55 | 1.35 | - |
| PPF-35-45 | 0.35 | 240 | 74 | 18 | 37 | 677 | 1204 | 129 | 5.55 | - | 0.45 |
| PPF-35-90 | 0.35 | 240 | 74 | 18 | 37 | 677 | 1204 | 129 | 5.55 | - | 0.90 |
| PPF-35-135 | 0.35 | 240 | 74 | 18 | 37 | 677 | 1204 | 129 | 5.55 | - | 1.35 |
| Mix ID | PC-30 | GF-30-45 | GF-30-90 | GF-30-135 | PPF-30-45 | PPF-30-90 | PPF-30-135 |
|---|---|---|---|---|---|---|---|
| I3y-28d | 89.20% | 45.63% | 30.09% | 49.89% | 78.69% | 77.42% | 96.67% |
| Mix ID | PC-35 | GF-35-45 | GF-35-90 | GF-35-135 | PPF-35-45 | PPF-35-90 | PPF-35-135 |
| I3y-28d | 69.54% | 39.05% | 4.69% | 19.28% | 63.80% | 56.70% | 44.71% |
| MIX ID | Water Absorption (%) | |||||||
|---|---|---|---|---|---|---|---|---|
| 1 Day | 2 Days | 3 Days | 4 Days | 7 Days | 28 Days | 31 Days | 37 Days | |
| PC-30 | 1.65 (−45.0%) | 1.78 (−44.5%) | 1.86 (−43.8%) | 1.92 (−43.2%) | 1.96 (−43%) | 2.05 (−41.6%) | 2.05 (−41.6%) | 2.05 (−41.8%) |
| GF-30-45 | 1.33 (−24.0%) | 1.47 (−27.2%) | 1.56 (−28.1%) | 1.63 (−27.6%) | 1.75 (−25.2%) | 2.00 (−20.6%) | 2.01 (−19.9%) | 2.02 (−20.2%) |
| GF-30-90 | 0.98 (−35.9%) | 1.07 (−41.2%) | 1.14 (−42.4%) | 1.17 (−43.5%) | 1.26 (−41.9%) | 1.53 (−35.2%) | 1.54 (−35.0%) | 1.54 (−35.6%) |
| GF-30-135 | 1.09 (−9.9%) | 1.21 (−13.6%) | 1.34 (−12.4%) | 1.41 (−10.8%) | 1.54 (−11%) | 1.91 (−3.5%) | 1.93 (−3.0%) | 1.96 (−2.5%) |
| PPF-30-45 | 2.15 (−13.0%) | 2.31 (−16.6%) | 2.46 (−16.3%) | 2.52 (−16.3%) | 2.58 (−16.8%) | 2.77 (−11.5%) | 2.77 (−11.2%) | 2.77 (−10.9%) |
| PPF-30-90 | 2.44 (−16.4%) | 2.67 (−20.8%) | 2.84 (−20.2%) | 2.93 (−20.4%) | 3.00 (−21.3%) | 3.18 (−20.5%) | 3.17 (−20.6%) | 3.17 (−20.2%) |
| PPF-30-135 | 3.87 (−9.2%) | 4.06 (−16.1%) | 4.26 (−16.6%) | 4.43 (−14.5%) | 4.45 (−16.5%) | 4.66 (−15.0%) | 4.66 (−14.5%) | 4.66 (−13.9%) |
| PC-35 | 1.80 (−24.1%) | 1.97 (−26.8%) | 2.08 (−26.0%) | 2.16 (−24.7%) | 2.22 (−25.8%) | 2.35 (−24.4%) | 2.34 (−25.0%) | 2.35 (−24.4%) |
| GF-35-45 | 1.08 (−48.3%) | 1.15 (−52.7%) | 1.21 (−53.5%) | 1.23 (−54.1%) | 1.29 (−54.9%) | 1.45 (−52.8%) | 1.46 (−52.4%) | 1.46 (−52.9%) |
| GF-35-90 | 1.30 (−16.1%) | 1.39 (−19.7%) | 1.49 (−18.6%) | 1.56 (−16.6%) | 1.67 (−15.7%) | 1.98 (−10.8%) | 1.99 (−11.6%) | 1.99 (−12.7%) |
| GF-35-135 | 1.90 (21.8%) | 2.03 (8.0%) | 2.20 (6.3%) | 2.30 (6.5%) | 2.55 (5.4%) | 3.41 (10.0%) | 3.46 (9.1%) | 3.50 (8.0%) |
| PPF-35-45 | 2.42 (−26.4%) | 2.65 (−32.6%) | 2.77 (−35.9%) | 2.88 (−35.1%) | 3.04 (−34.2%) | 3.22 (−31.8%) | 3.23 (−31.6%) | 3.23 (−31.4%) |
| PPF-35-90 | 2.31 (−4.9%) | 2.53 (−9.3%) | 2.69 (−9.1%) | 2.81 (−9.1%) | 3.12 (−7.4%) | 3.72 (−4.4%) | 3.73 (−4.4%) | 3.72 (−5.6%) |
| PPF-35-135 | 3.59 (15.1%) | 3.93 (5.9%) | 4.24 (6.8%) | 4.49 (9.2%) | 5.38 (10.2%) | 7.06 (12.2%) | 7.12 (10.9%) | 7.14 (9.5%) |
Publisher’s Note: MDPI stays neutral with regard to jurisdictional claims in published maps and institutional affiliations. |
© 2022 by the authors. Licensee MDPI, Basel, Switzerland. This article is an open access article distributed under the terms and conditions of the Creative Commons Attribution (CC BY) license (https://creativecommons.org/licenses/by/4.0/).
Share and Cite
Yuan, Z.; Jia, Y. Experimental Study on the Mechanical Properties, Water Absorption, and Fiber Degradation of Naturally Aged Glass Fiber and Polypropylene Fiber-Reinforced Concrete. Materials 2022, 15, 3760. https://0-doi-org.brum.beds.ac.uk/10.3390/ma15113760
Yuan Z, Jia Y. Experimental Study on the Mechanical Properties, Water Absorption, and Fiber Degradation of Naturally Aged Glass Fiber and Polypropylene Fiber-Reinforced Concrete. Materials. 2022; 15(11):3760. https://0-doi-org.brum.beds.ac.uk/10.3390/ma15113760
Chicago/Turabian StyleYuan, Zhu, and Yanmin Jia. 2022. "Experimental Study on the Mechanical Properties, Water Absorption, and Fiber Degradation of Naturally Aged Glass Fiber and Polypropylene Fiber-Reinforced Concrete" Materials 15, no. 11: 3760. https://0-doi-org.brum.beds.ac.uk/10.3390/ma15113760