
Low-Temperature Ethanol Sensor via Defective Multiwalled Carbon Nanotubes

 ,
,  , ,
, ,  ,
,  ,
,  ,
,
Abstract
:1. Introduction
2. Materials and Methods
2.1. Materials
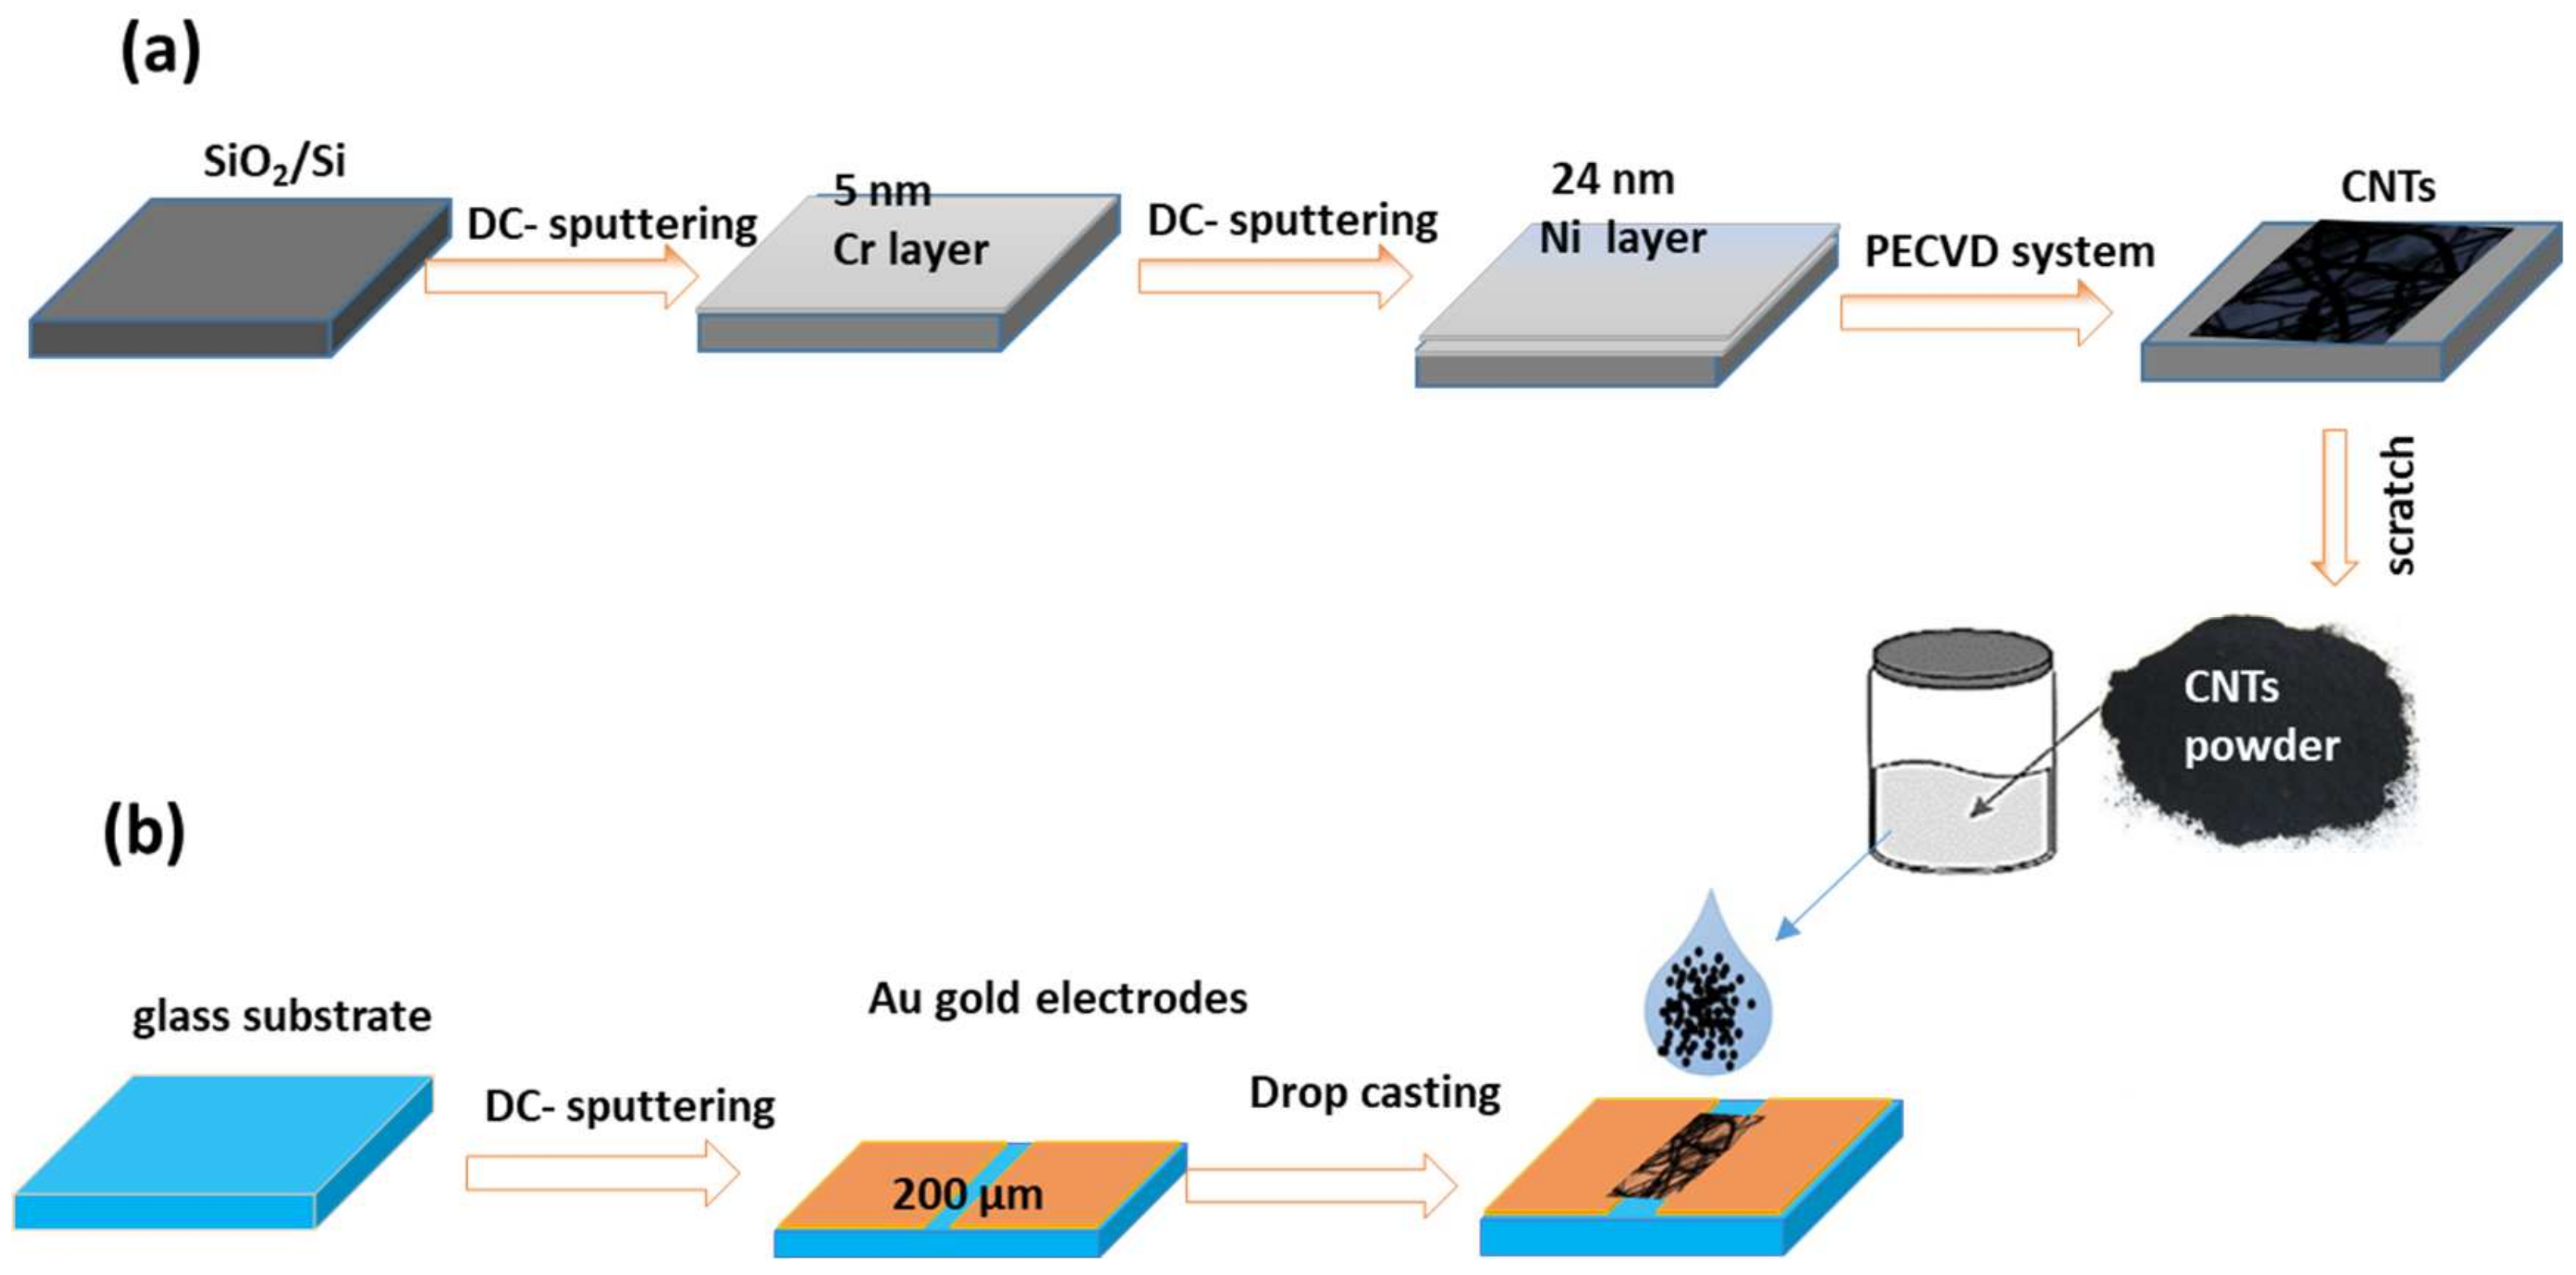
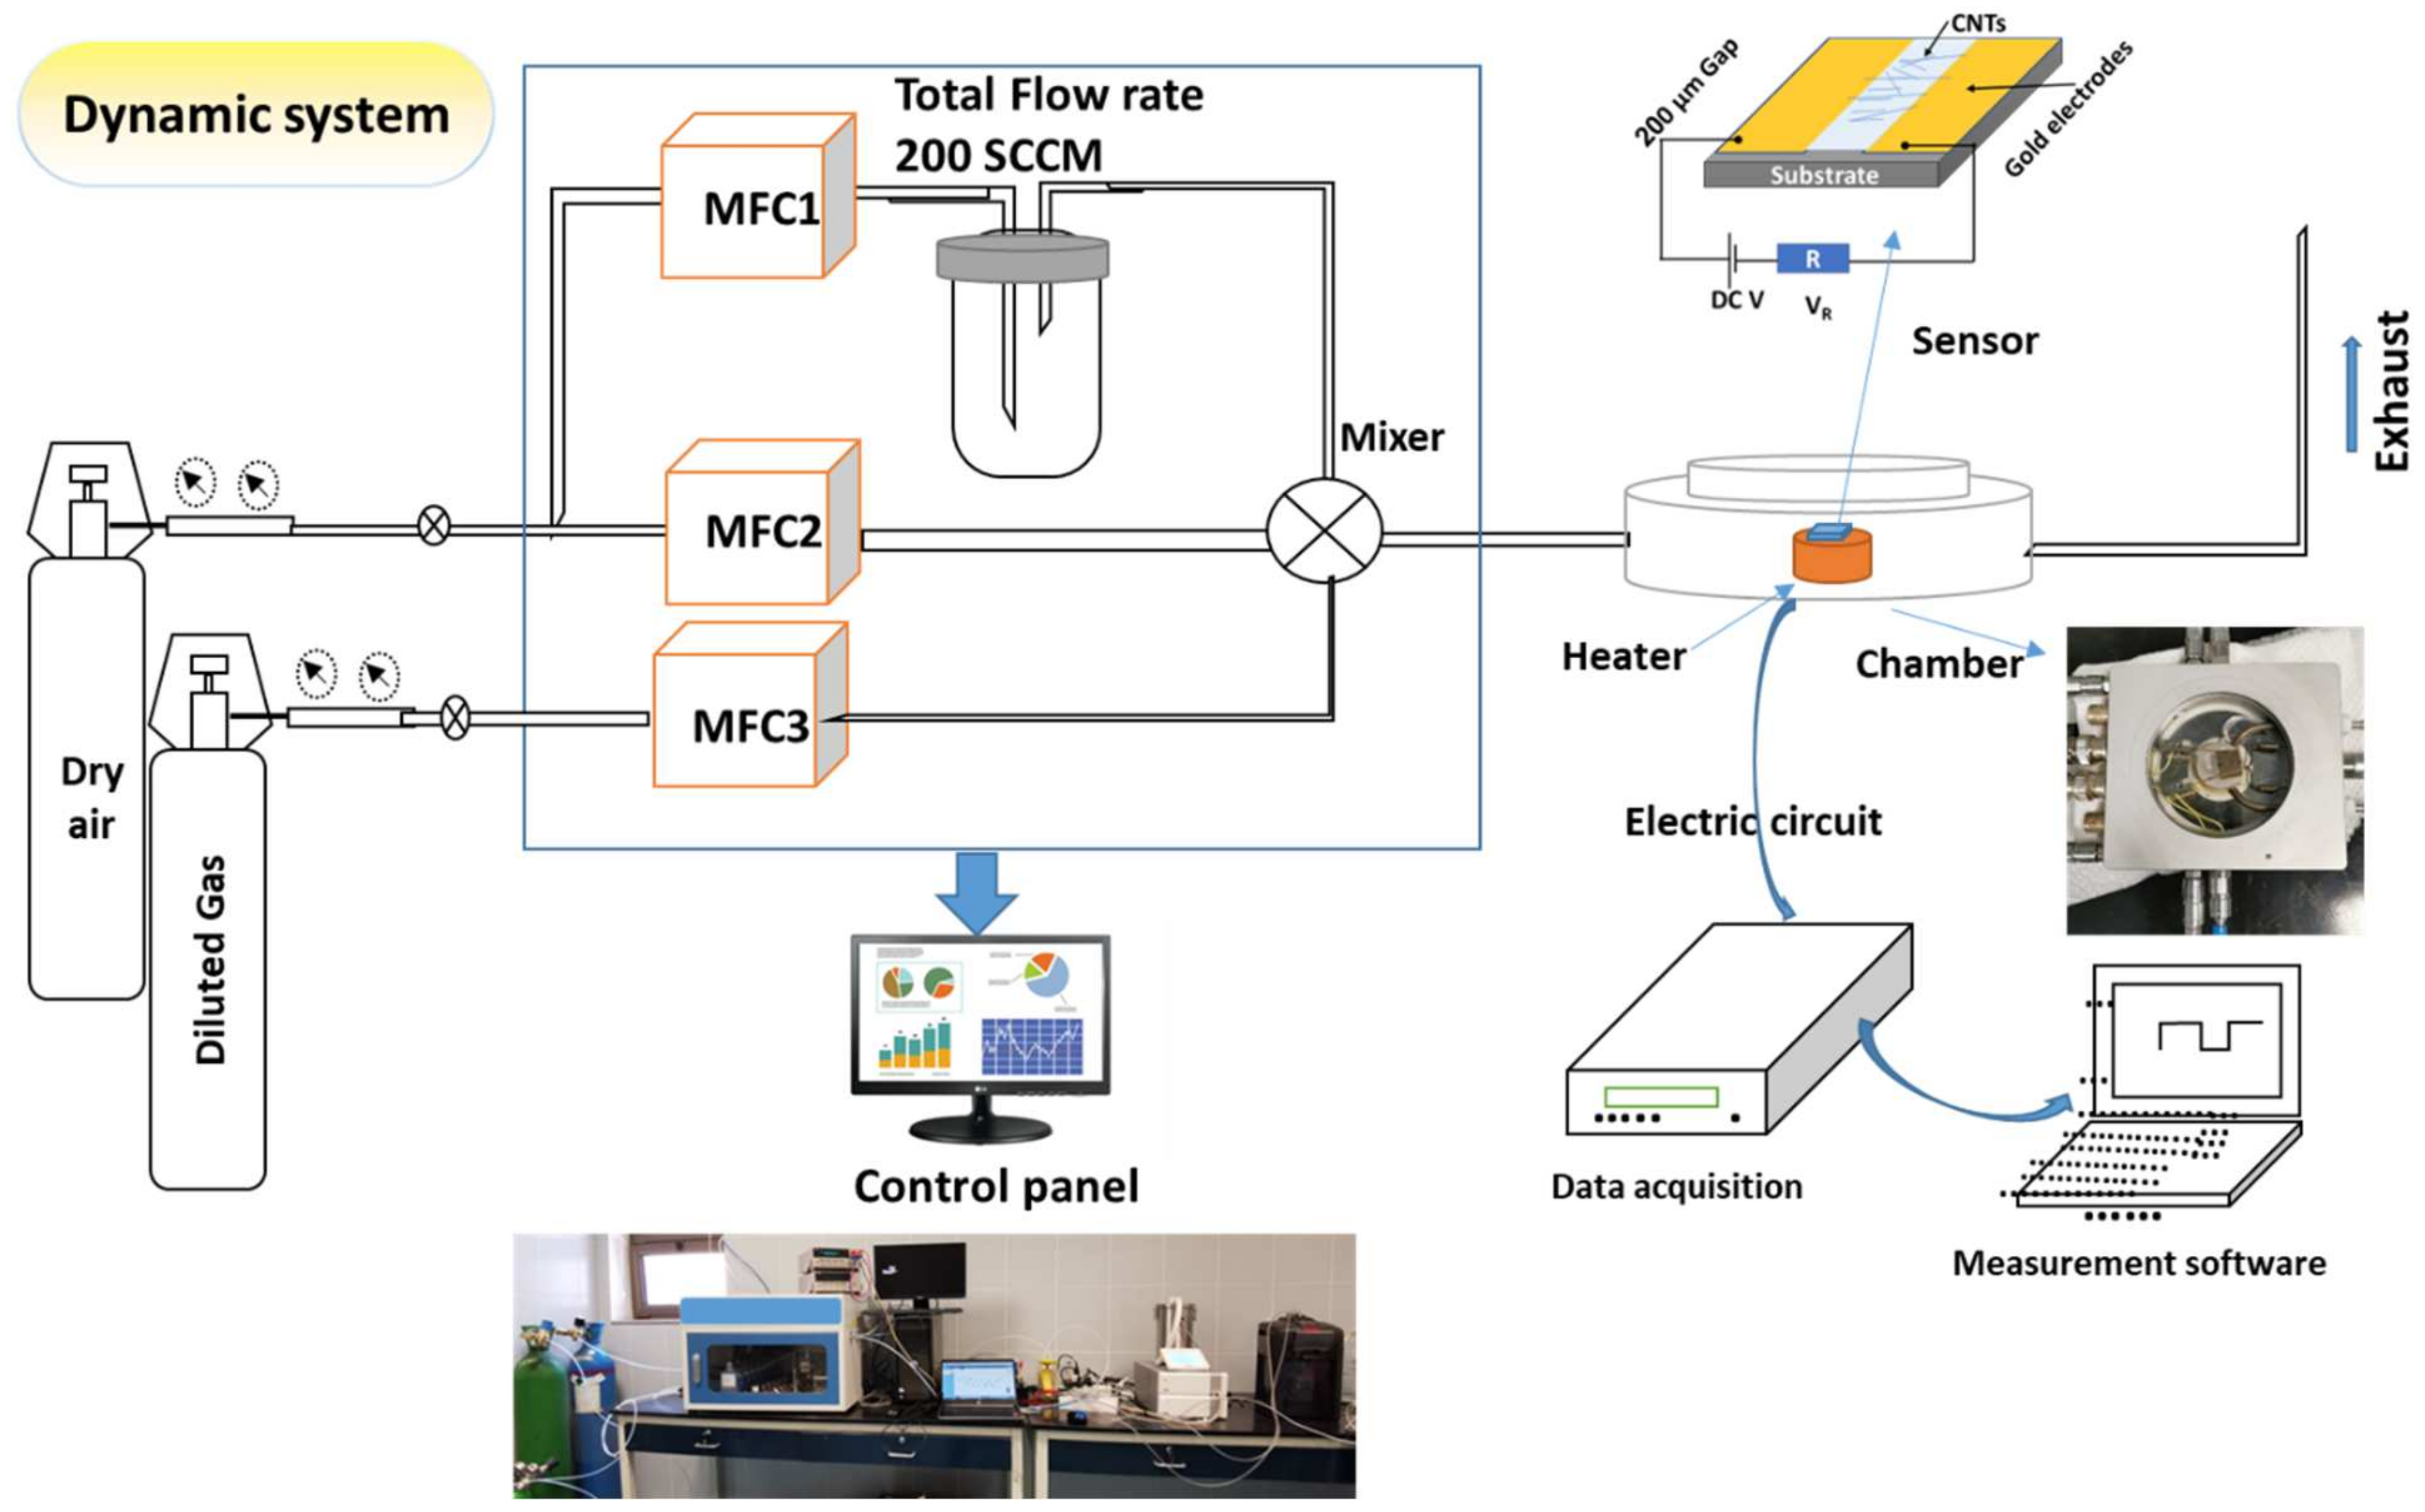
2.2. Methods
3. Results
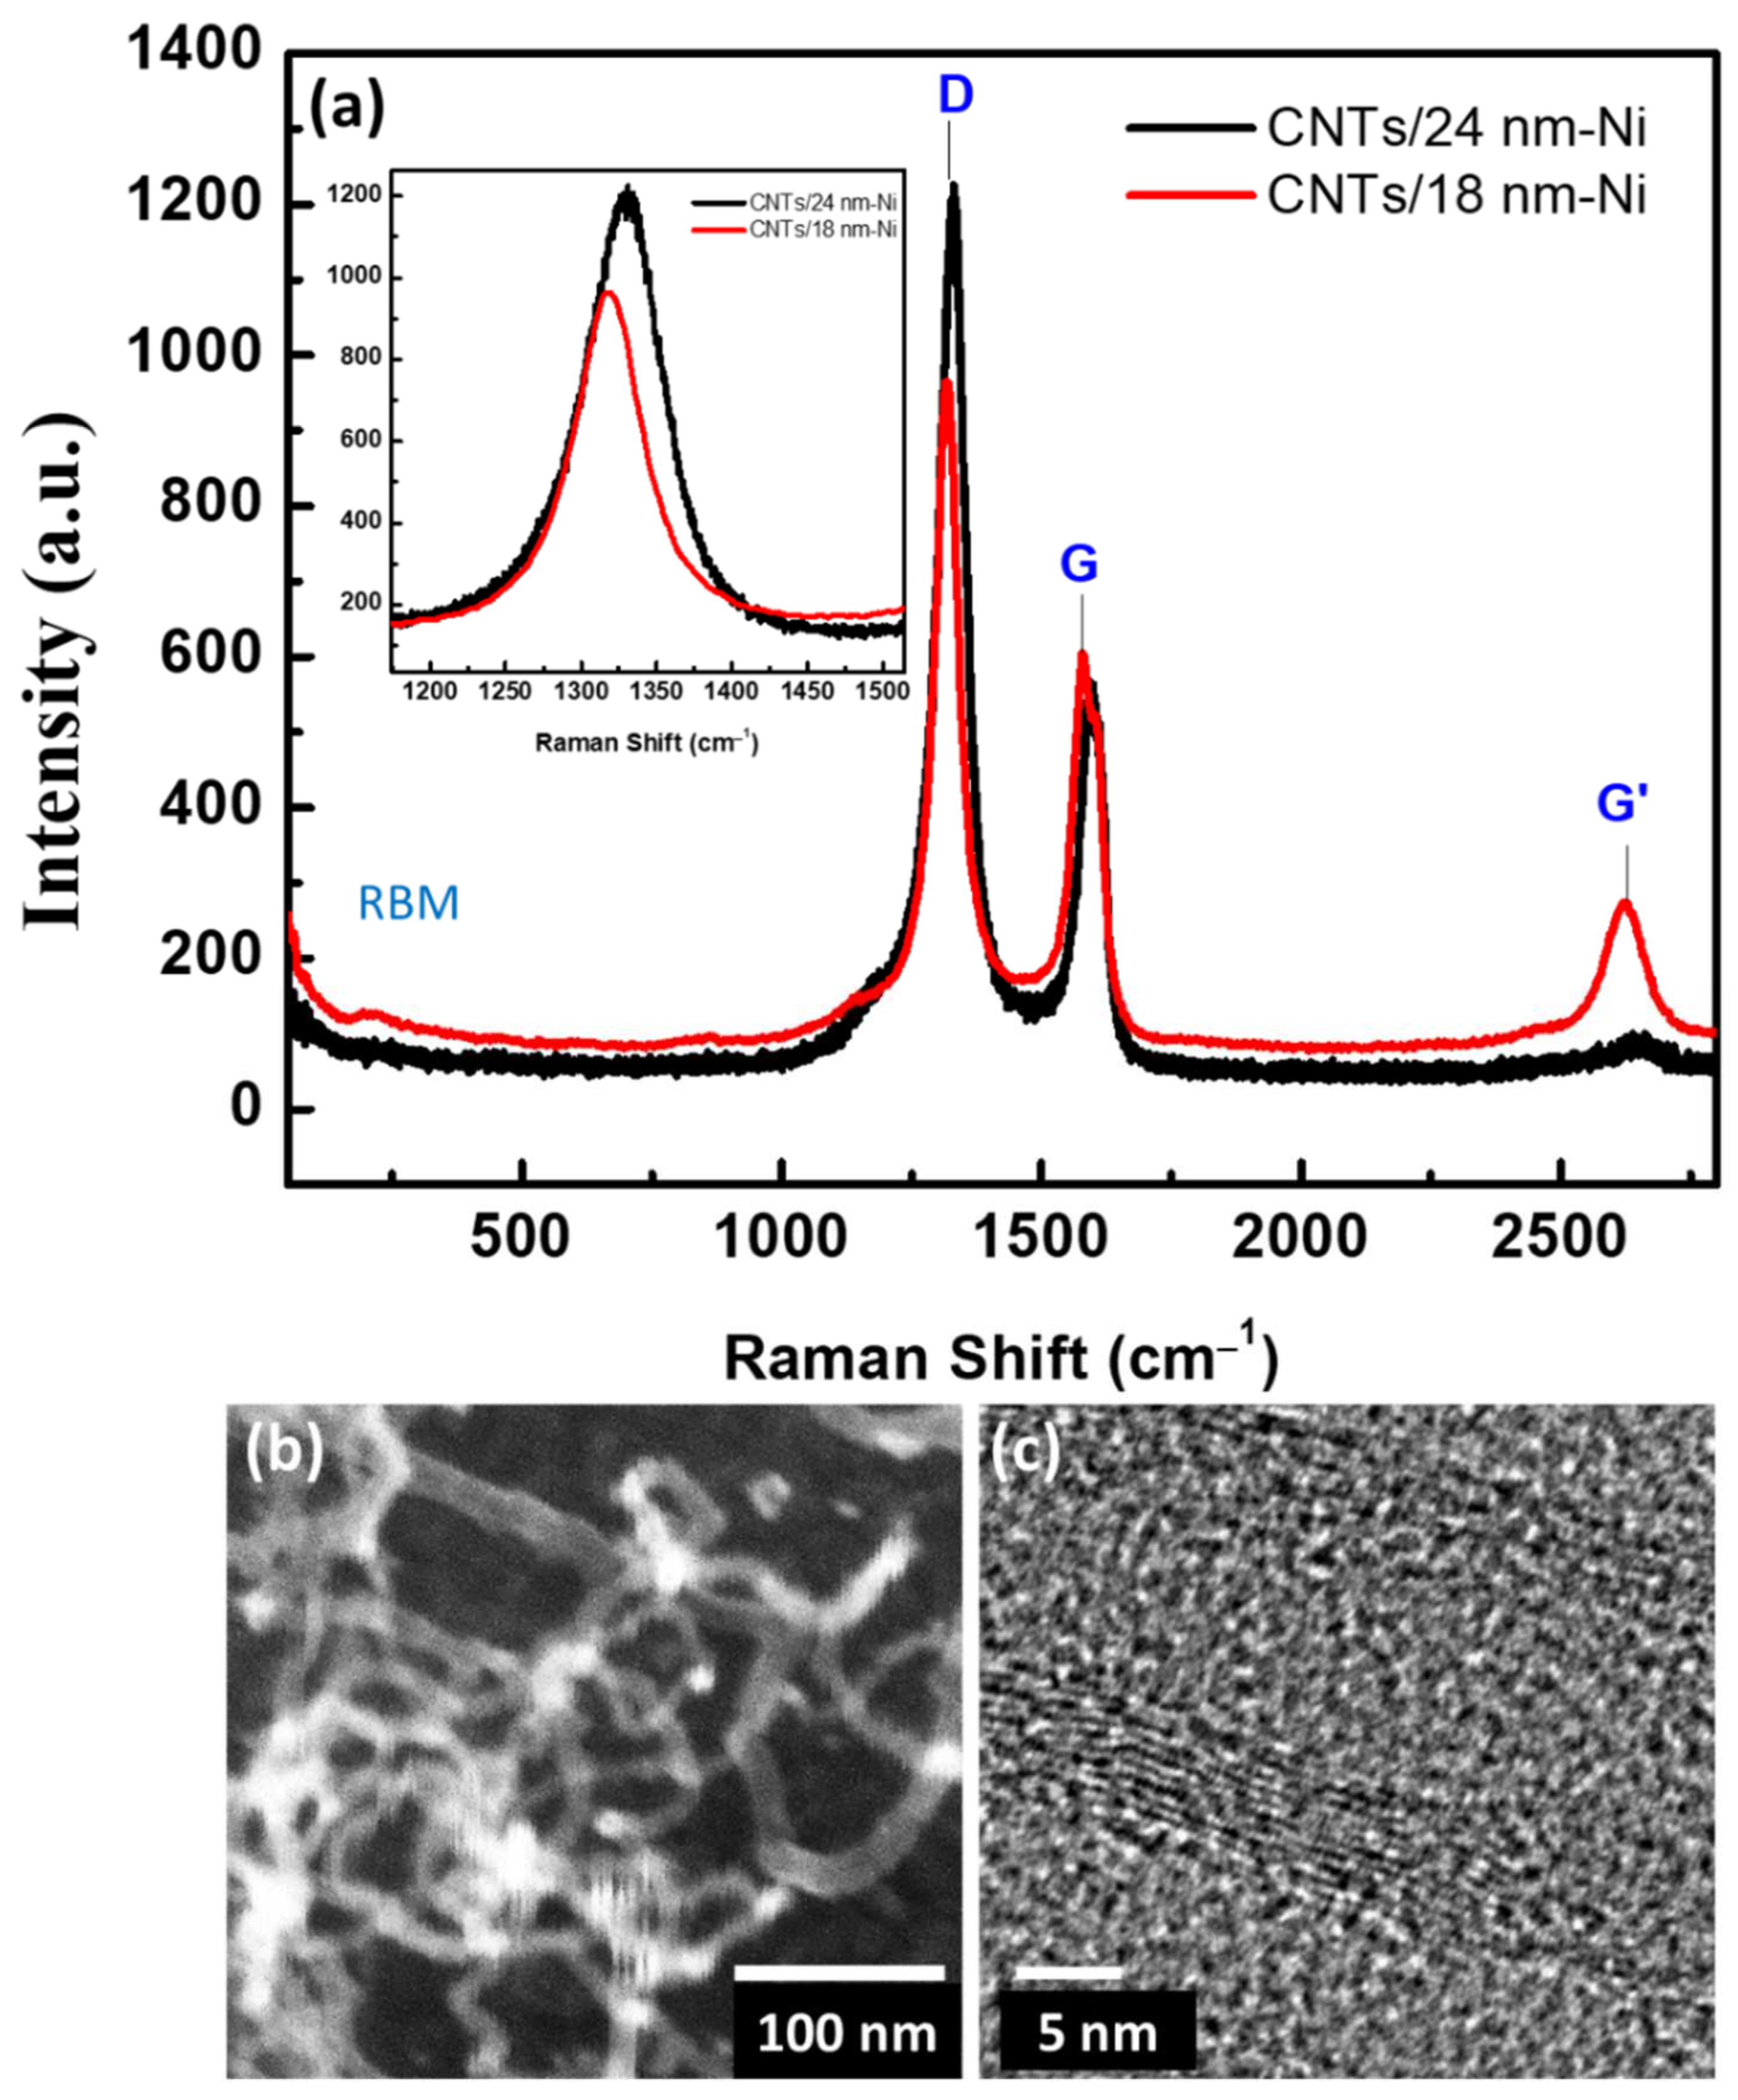
3.1. Structure Characterizations
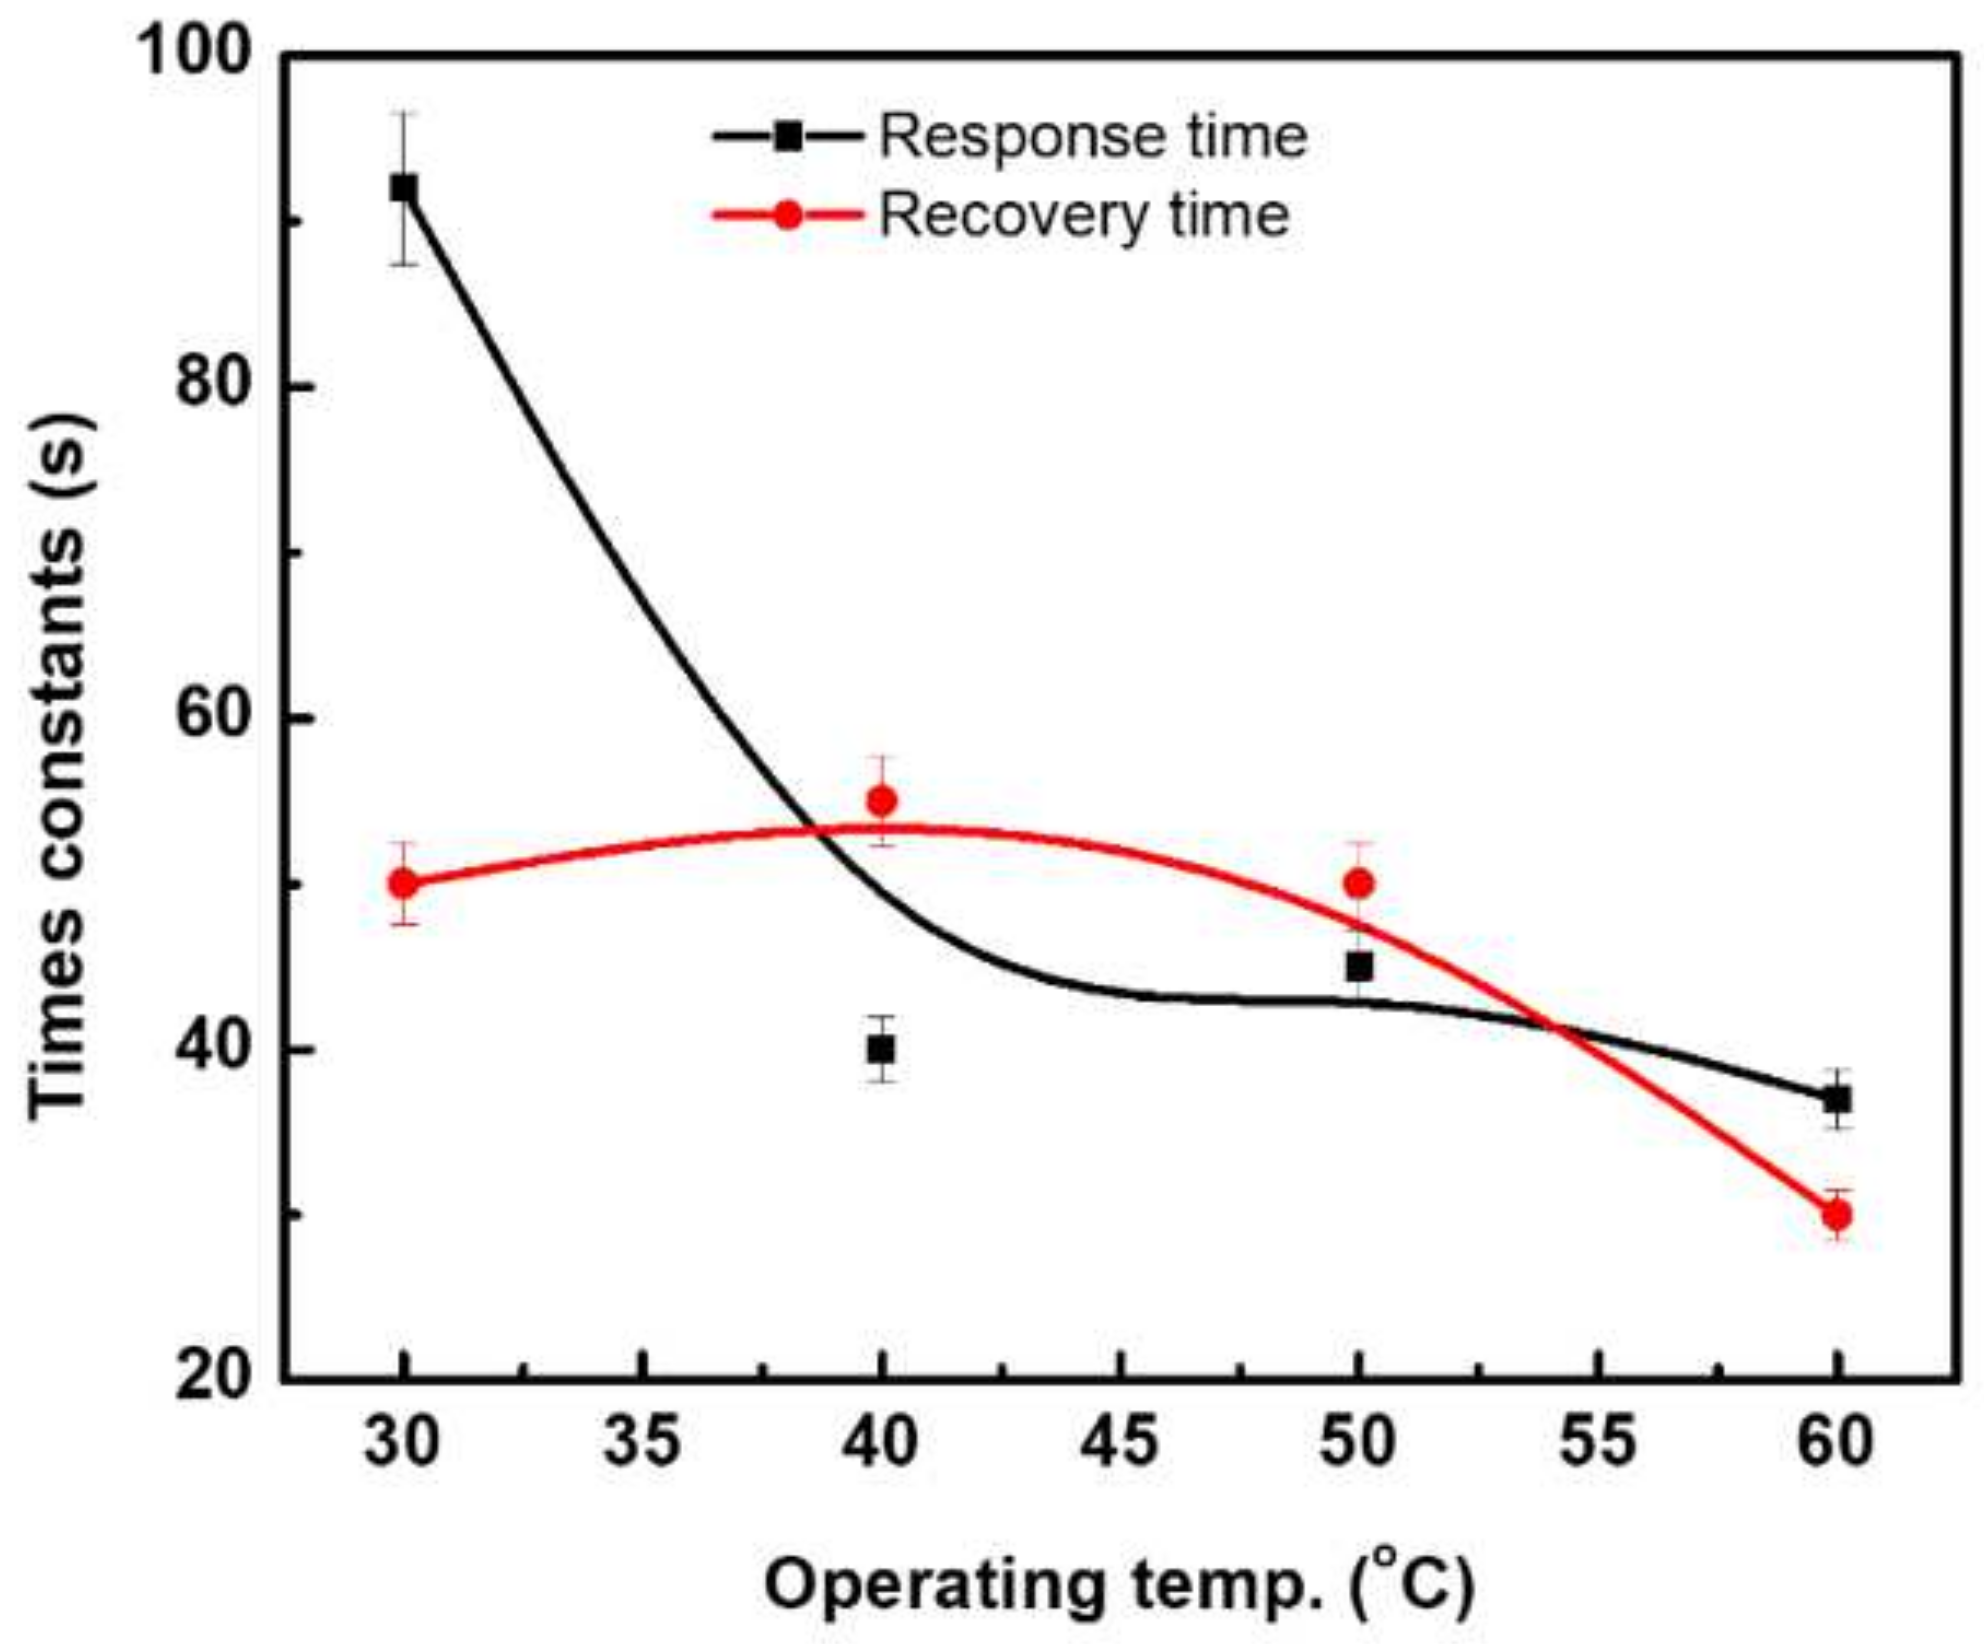
3.2. Sensing Characterizations
4. Conclusions
Author Contributions
Funding
Institutional Review Board Statement
Informed Consent Statement
Data Availability Statement
Acknowledgments
Conflicts of Interest
References
- WHO. Alcohol. 2022. Available online: https://www.who.int/news-room/fact-sheets/detail/alcohol (accessed on 10 June 2022).
- Mexis, S.F.; Kontominas, M.G. Packaging | Active Food Packaging. In Encyclopedia of Food Microbiology, 2nd ed.; Batt, C.A., Tortorello, M.L., Eds.; Academic Press: Oxford, UK, 2014; pp. 999–1005. [Google Scholar] [CrossRef]
- Neetoo, H.; Chen, H.; Hoover, D.G. Emerging Methods for Post-Packaging Microbial Decontamination of Food; Woodhead Publishing Limited: Sawston, UK, 2012. [Google Scholar] [CrossRef]
- Arvanitoyannis, I.S.; Oikonomou, G. Active and intelligent packaging. In Modified Atmosphere and Active Packaging Technologies; CRC Press: Boca Raton, FL, USA, 2012; pp. 627–662. [Google Scholar] [CrossRef]
- Niven, R.K. Ethanol in gasoline: Environmental impacts and sustainability review article. Renew. Sustain. Energy Rev. 2004, 9, 535–555. [Google Scholar] [CrossRef]
- Buckner, C.A.; Lafrenie, R.M.; Dénommée, J.A.; Caswell, J.M.; Want, D.A.; Gan, G.G.; Leong, Y.C.; Bee, P.C.; Chin, E.; Teh, A.K.H.; et al. Overview of Materials for Microfluidic Applications; IntechOpen: London, UK, 2016; Volume 11, p. 13. ISBN 0000957720. [Google Scholar]
- Tibaquirá, J.E.; Huertas, J.I.; Ospina, S.; Quirama, L.F.; Niño, J.E. The Effect of Using Ethanol-Gasoline Blends on the Mechanical, Energy and Environmental Performance of In-Use Vehicles. Energies 2018, 11, 221. [Google Scholar] [CrossRef] [Green Version]
- Bertrand, S. Ethanol Can Help Reduce Toxic Gasoline Aromatics. 2022. Available online: https://www.eesi.org/articles/view/ethanol-can-help-reduce-toxic-gasoline-aromatics (accessed on 13 May 2022).
- Toit, W.D.; Oberholster, A. Chapter 7—Antioxidants in Wine during Fermentation. In Processing and Impact on Antioxidants in Beverages; Preedy, V.B., Ed.; Academic Press: San Diego, CA, USA, 2014; pp. 59–67. [Google Scholar] [CrossRef]
- Ciani, M.; Comitini, F.; Mannazzu, I. Fermentation. In Encyclopedia of Ecology; Jørgensen, S.E., Fath, B.D., Eds.; Academic Press: Oxford, UK, 2008; pp. 1548–1557. [Google Scholar] [CrossRef]
- Malakar, S.; Paul, S.K.; Pou, K.R.J. 1—Biotechnological Interventions in Beverage Production. In Biotechnological Progress and Beverage Consumption; Grumezescu, A.M., Holban, A.M., Eds.; Academic Press: San Diego, CA, USA, 2020; pp. 1–37. [Google Scholar] [CrossRef]
- Buratti, S.; Benedetti, S. Chapter 28—Alcoholic Fermentation Using Electronic Nose and Electronic Tongue. In Electronic Noses and Tongues in Food Science; Rodríguez Méndez, M.L., Ed.; Academic Press: San Diego, CA, USA, 2016; pp. 291–299. [Google Scholar] [CrossRef]
- Kumar, M.; Borah, P.; Devi, P. Chapter 17—Methods including biomarkers used for detection of disinfection by-products. In Disinfection By-Products in Drinking Water; Prasad, M.N.V., Ed.; Butterworth-Heinemann: Oxford, UK, 2020; pp. 413–431. [Google Scholar] [CrossRef]
- Shaaban, H.; Mostafa, A.; Górecki, T. Chapter 15—Green Gas and Liquid Capillary Chromatography. In The Application of Green Solvents in Separation Processes; Pena-Pereira, F., Tobiszewski, M., Eds.; Elsevier: Amsterdam, The Netherlands, 2017; pp. 453–482. [Google Scholar] [CrossRef]
- Memon, S.F.; Wang, R.; Strunz, B.; Chowdhry, B.S.; Pembroke, J.T.; Lewis, E. A Review of Optical Fibre Ethanol Sensors: Current State and Future Prospects. Sensors 2022, 22, 950. [Google Scholar] [CrossRef] [PubMed]
- Memon, S.F.; Lewis, E.; Ali, M.M.; Pembroke, J.T.; Chowdhry, B.S. U-bend evanescent wave plastic optical fibre sensor for minute level concentration detection of ethanol corresponding to biofuel production rate. In Proceedings of the IEEE Sensors Applications Symposium, SAS, Glassboro, NJ, USA, 13–15 March 2017; pp. 1–5. [Google Scholar] [CrossRef]
- Jahanshahi, P.; Wei, Q.; Jie, Z.; Zalnezhad, E. Designing a Non-invasive Surface Acoustic Resonator for Ultra-high Sensitive Ethanol Detection for an On-the-spot Health Monitoring System. Biotechnol. Bioprocess Eng. 2018, 23, 394–404. [Google Scholar] [CrossRef]
- Tharsika, T.; Thanihaichelvan, M.; Haseeb, A.S.M.A.; Akbar, S.A. Highly Sensitive and Selective Ethanol Sensor Based on ZnO Nanorod on SnO2 Thin Film Fabricated by Spray Pyrolysis. Front. Mater. 2019, 6, 122. [Google Scholar] [CrossRef]
- Zhu, X.; Zhang, J.; Xie, Q.; Hou, Z.-L. High-Sensitivity and Ultrafast-Response Ethanol Sensors Based on Graphene Oxide. ACS Appl. Mater. Interfaces. 2020, 12, 38708–38713. [Google Scholar] [CrossRef]
- Zhang, K.; Lin, Z. Highly sensitive ethanol sensor based on zinc oxide-based nanomaterials with low power consumption. J. Mater. Sci. Mater. Electron. 2021, 32, 17395–17405. [Google Scholar] [CrossRef]
- Saito, N.; Watanabe, K.; Haneda, H.; Sakaguchi, I.; Shimanoe, K. Highly Sensitive Ethanol Gas Sensor Using Pyramid-Shaped ZnO Particles with (0001) basal plane. J. Phys. Chem. C. 2018, 122, 7353–7360. [Google Scholar] [CrossRef]
- Diao, Q.; Yin, Y.; Jia, W.; Xu, X.; Ding, Y.; Zhang, X.; Cao, J.; Yang, K.; Jiao, M. Highly sensitive ethanol sensor based on Ce-doped WO3 with raspberry-like architecture. Mater. Res. Express 2020, 7, 115012. [Google Scholar] [CrossRef]
- Shan, H.; Liu, C.; Liu, L.; Wang, L.; Zhang, X.; Chi, X.; Bo, X.; Wang, K. Excellent ethanol sensor based on multiwalled carbon nanotube-doped ZnO. Chin. Sci. Bull. 2014, 59, 374–378. [Google Scholar] [CrossRef]
- Shooshtari, M.; Sacco, L.N.; van Ginkel, J.; Vollebregt, S.; Salehi, A. Enhancement of Room Temperature Ethanol Sensing by Optimizing the Density of Vertically Aligned Carbon Nanofibers Decorated with Gold Nanoparticles. Materials 2022, 15, 1383. [Google Scholar] [CrossRef]
- Someya, T.; Small, J.; Kim, P.; Nuckolls, C.; Yardley, J.T. Alcohol Vapor Sensors Based on Single-Walled Carbon Nanotube Field Effect Transistors. Nano Lett. 2003, 3, 877–881. [Google Scholar] [CrossRef]
- Shaalan, N.M.; Hamad, D.; Saber, O. Co-Evaporated CuO-Doped In2O3 1D-nanostructure for reversible CH4 detection at low temperatures: Structural phase change and properties. Materials 2019, 12, 4073. [Google Scholar] [CrossRef] [Green Version]
- Shaalan, N.M.; Hamad, D.; Aljaafari, A.; Abdel-Latief, A.Y.; Abdel-Rahim, M.A. Preparation and Characterization of Developed CuxSn1−xO2 Nanocomposite and Its Promising Methane Gas Sensing Properties. Sensors 2019, 19, 2257. [Google Scholar] [CrossRef] [Green Version]
- Zhang, D. Multi-walled Carbon Nanotube Film Sensor for Ethanol Gas Detection. Telkomnika Indones. J. Electr. Eng. 2013, 11, 10. [Google Scholar] [CrossRef]
- Peng, N.; Zhang, Q.; Chow, C.L.; Tan, O.K.; Marzari, N. Sensing Mechanisms for Carbon Nanotube Based NH3 Gas Detection. Nano Lett. 2009, 9, 1626–1630. [Google Scholar] [CrossRef]
- Zhang, J.; Boyd, A.; Tselev, A.; Paranjape, M.; Barbara, P. Mechanism of NO2 detection in carbon nanotube field effect transistor chemical sensors. Appl. Phys. Lett. 2006, 88, 123112. [Google Scholar] [CrossRef]
- Battie, Y.; Ducloux, O.; Thobois, P.; Dorval, N.; Lauret, J.S.; Attal-Trétout, B.; Loiseau, A. Gas sensors based on thick films of semi-conducting single walled carbon nanotubes. Carbon 2011, 49, 3544–3552. [Google Scholar] [CrossRef]
- Chang, H.; Lee, J.D.; Lee, S.M.; Lee, Y.H. Adsorption of NH3 and NO2 molecules on carbon nanotubes. Appl. Phys. Lett. 2001, 79, 3863–3865. [Google Scholar] [CrossRef]
- Zhao, J.; Buldum, A.; Han, J.; Lu, J.P. Gas molecule adsorption in carbon nanotubes and nanotube bundles. Nanotechnology 2002, 13, 195–200. [Google Scholar] [CrossRef]
- Zhang, Y.-H.; Chen, Y.-B.; Zhou, K.-G.; Liu, C.-H.; Zeng, J.; Zhang, H.-L.; Peng, Y. Improving gas sensing properties of graphene by introducing dopants and defects: A first-principles study. Nanotechnology 2009, 20, 185504. [Google Scholar] [CrossRef] [PubMed] [Green Version]
- Fong, D.; Luo, S.X.; Andre, R.S.; Swager, T.M. Trace Ethylene Sensing via Wacker Oxidation. ACS Cent. Sci. 2020, 6, 507–512. [Google Scholar] [CrossRef] [PubMed] [Green Version]
- Norizan, M.N.; Moklis, M.H.; Demon, S.Z.N.; Halim, N.A.; Samsuri, A.; Mohamad, I.S.; Knight, V.F.; Abdullah, N. Carbon nanotubes: Functionalisation and their application in chemical sensors. RSC Adv. 2020, 10, 43704–43732. [Google Scholar] [CrossRef] [PubMed]
- Mittal, M.; Kumar, A. Carbon nanotube (CNT) gas sensors for emissions from fossil fuel burning. Sens. Actuators B Chem. 2014, 203, 349–362. [Google Scholar] [CrossRef]
- Azammi, A.M.N.; Ilyas, R.A.; Sapuan, S.M.; Ibrahim, R.; Atikah, M.S.N.; Asrofi, M.; Atiqah, A. 3—Characterization studies of biopolymeric matrix and cellulose fibres based composites related to functionalized fibre-matrix interface. In Interfaces in Particle and Fibre Reinforced Composites; Goh, K.L., Aswathi, M.K., De Silva, R.T., Thomas, S., Eds.; Woodhead Publishing: Sawston, UK, 2020; pp. 29–93. [Google Scholar] [CrossRef]
- Kaburagi, Y.; Yoshida, A.; Hishiyama, Y. Chapter 7—Raman Spectroscopy. In Materials Science and Engineering of Carbon; Inagaki, M., Ed.; Butterworth-Heinemann: Oxford, UK, 2016; pp. 125–152. [Google Scholar] [CrossRef]
- Lucchese, M.M.; Stavale, F.; Ferreira, E.H.M.; Vilani, C.; Moutinho, M.V.O.; Capaz, R.B.; Achete, C.A.; Jorio, A. Quantifying ion-induced defects and Raman relaxation length in graphene. Carbon 2010, 48, 1592–1597. [Google Scholar] [CrossRef]
- Ferrari, A.C.; Robertson, J. Interpretation of Raman spectra of disordered and amorphous carbon. Phys. Rev. B. 2000, 61, 14095–14107. [Google Scholar] [CrossRef] [Green Version]
- Ferrari, A.C. Raman spectroscopy of graphene and graphite: Disorder, electron–phonon coupling, doping and nonadiabatic effects. Solid State Commun. 2007, 143, 47–57. [Google Scholar] [CrossRef]
- Jorio, A.; Saito, R. Raman spectroscopy for carbon nanotube applications. J. Appl. Phys. 2021, 129, 21102. [Google Scholar] [CrossRef]
- Ferrari, A.C.; Meyer, J.C.; Scardaci, V.; Casiraghi, C.; Lazzeri, M.; Mauri, F.; Piscanec, S.; Jiang, D.; Novoselov, K.S.; Roth, S.; et al. Raman Spectrum of Graphene and Graphene Layers. Phys. Rev. Lett. 2006, 97, 187401. [Google Scholar] [CrossRef] [Green Version]
- Lehman, J.H.; Terrones, M.; Mansfield, E.; Hurst, K.E.; Meunier, V. Evaluating the characteristics of multiwall carbon nanotubes. Carbon 2011, 49, 2581–2602. [Google Scholar] [CrossRef]
- Peigney, A.; Laurent, C.; Flahaut, E.; Bacsa, R.R.; Rousset, A. Specific surface area of carbon nanotubes and bundles of carbon nanotubes. Carbon 2001, 39, 507–514. [Google Scholar] [CrossRef] [Green Version]
- Donato, N. Novel carbon nanotubes-based hybrid composites for sensing applications. In Carbon Nanotubes; Latino, M., Ed.; IntechOpen: Rijeka, Croatia, 2011; Chapter 14. [Google Scholar] [CrossRef] [Green Version]
- Kröning, K.; Krause, B.; Pötschke, P.; Fiedler, B. Nanocomposites with p- and n-Type Conductivity Controlled by Type and Content of Nanotubes in Thermosets for Thermoelectric Applications. Nanomaterials 2020, 10, 1144. [Google Scholar] [CrossRef]
- Park, C.-S.; Lee, C.J.; Kim, E.K. Stable p-type properties of single walled carbon nanotubes by electrochemical doping. Phys. Chem. Chem. Phys. 2015, 17, 16243–16245. [Google Scholar] [CrossRef]
- Albesa, A.G.; Rafti, M.; Rawat, D.S.; Vicente, J.L.; Migone, A.D. Ethane/Ethylene Adsorption on Carbon Nanotubes: Temperature and Size Effects on Separation Capacity. Langmuir 2012, 28, 1824–1832. [Google Scholar] [CrossRef]
- Schroeder, V.; Savagatrup, S.; He, M.; Lin, S.; Swager, T.M. Carbon Nanotube Chemical Sensors. Chem. Rev. 2019, 119, 599–663. [Google Scholar] [CrossRef]
- Li, Y.; Hodak, M.; Lu, W.; Bernholc, J. Selective sensing of ethylene and glucose using carbon-nanotube-based sensors: An: Ab initio investigation. Nanoscale 2017, 9, 1687–1698. [Google Scholar] [CrossRef]
- Kim, J.; Choi, S.W.; Lee, J.H.; Chung, Y.; Byun, Y.T. Gas sensing properties of defect-induced single-walled carbon nanotubes. Sens. Actuators B Chem. 2016, 228, 688–692. [Google Scholar] [CrossRef]
- Young, S.J.; Lin, Z.D. Ethanol gas sensors based on multi-wall carbon nanotubes on oxidized Si substrate. Microsyst. Technol. 2018, 24, 55–58. [Google Scholar] [CrossRef]
- Liu, Z.; Yang, T.; Dong, Y.; Wang, X. A room temperature VOCs gas sensor based on a layer by layer multi-walled carbon nanotubes/poly-ethylene glycol composite. Sensors 2018, 18, 3113. [Google Scholar] [CrossRef] [Green Version]
- Sno, M.; Ahmadnia-feyzabad, S.; Ali, A.; Vesali-naseh, M.; Mortazavi, Y. Sensors and Actuators B: Chemical Highly sensitive and selective sensors to volatile organic compounds using. Sens. Actuators B. Chem. 2012, 166–167, 150–155. [Google Scholar] [CrossRef]


| Sample | D-Band (cm−1) | G’-Band (cm−1) | ID/G | IG’/G |
|---|---|---|---|---|
| CNTs/18 nm-Ni | 1317 | 1565 | 1.58 | 0.46 |
| CNTs/24 nm-Ni | 1330 | 1595 | 2.21 | 0.16 |
| Sensor | Operation Temp. (°C) | Response | Ethanol Concen. (ppm) | References |
|---|---|---|---|---|
| High-density CNTs | RT | 0.18 b | 50 | [54] |
| MWNTs/ZnO | 250 | 45 a | 50 | [23] |
| MWNT film devices | RT | 4.1 b | 30,000 | [28] |
| MWCNT | RT | 3.0 b | 50 | [55] |
| PEG/MWCNTs | RT | 2.9 b | 50 | |
| 0.05 wt% MWCNT/SnO2 | 250 | 7000 a | 300 | [56] |
| 0.10 wt% MWCNT/SnO2 | 250 | 1900 a | 300 | |
| MWCNTs | RT | 8.8 b | 50 | This work |
Publisher’s Note: MDPI stays neutral with regard to jurisdictional claims in published maps and institutional affiliations. |
© 2022 by the authors. Licensee MDPI, Basel, Switzerland. This article is an open access article distributed under the terms and conditions of the Creative Commons Attribution (CC BY) license (https://creativecommons.org/licenses/by/4.0/).
Share and Cite
Shaalan, N.M.; Ahmed, F.; Rashad, M.; Saber, O.; Kumar, S.; Aljaafari, A.; Ashoaibi, A.; Mahmoud, A.Z.; Ezzeldien, M. Low-Temperature Ethanol Sensor via Defective Multiwalled Carbon Nanotubes. Materials 2022, 15, 4439. https://0-doi-org.brum.beds.ac.uk/10.3390/ma15134439
Shaalan NM, Ahmed F, Rashad M, Saber O, Kumar S, Aljaafari A, Ashoaibi A, Mahmoud AZ, Ezzeldien M. Low-Temperature Ethanol Sensor via Defective Multiwalled Carbon Nanotubes. Materials. 2022; 15(13):4439. https://0-doi-org.brum.beds.ac.uk/10.3390/ma15134439
Chicago/Turabian StyleShaalan, Nagih M., Faheem Ahmed, Mohamed Rashad, Osama Saber, Shalendra Kumar, Abdullah Aljaafari, Adil Ashoaibi, Amera Z. Mahmoud, and Mohammed Ezzeldien. 2022. "Low-Temperature Ethanol Sensor via Defective Multiwalled Carbon Nanotubes" Materials 15, no. 13: 4439. https://0-doi-org.brum.beds.ac.uk/10.3390/ma15134439