
Numerical Simulation Study of Mixed Particle Size Calcination Processes in the Calcination Zone of a Parallel Flow Regenerative Lime Kiln


Abstract
:1. Introduction
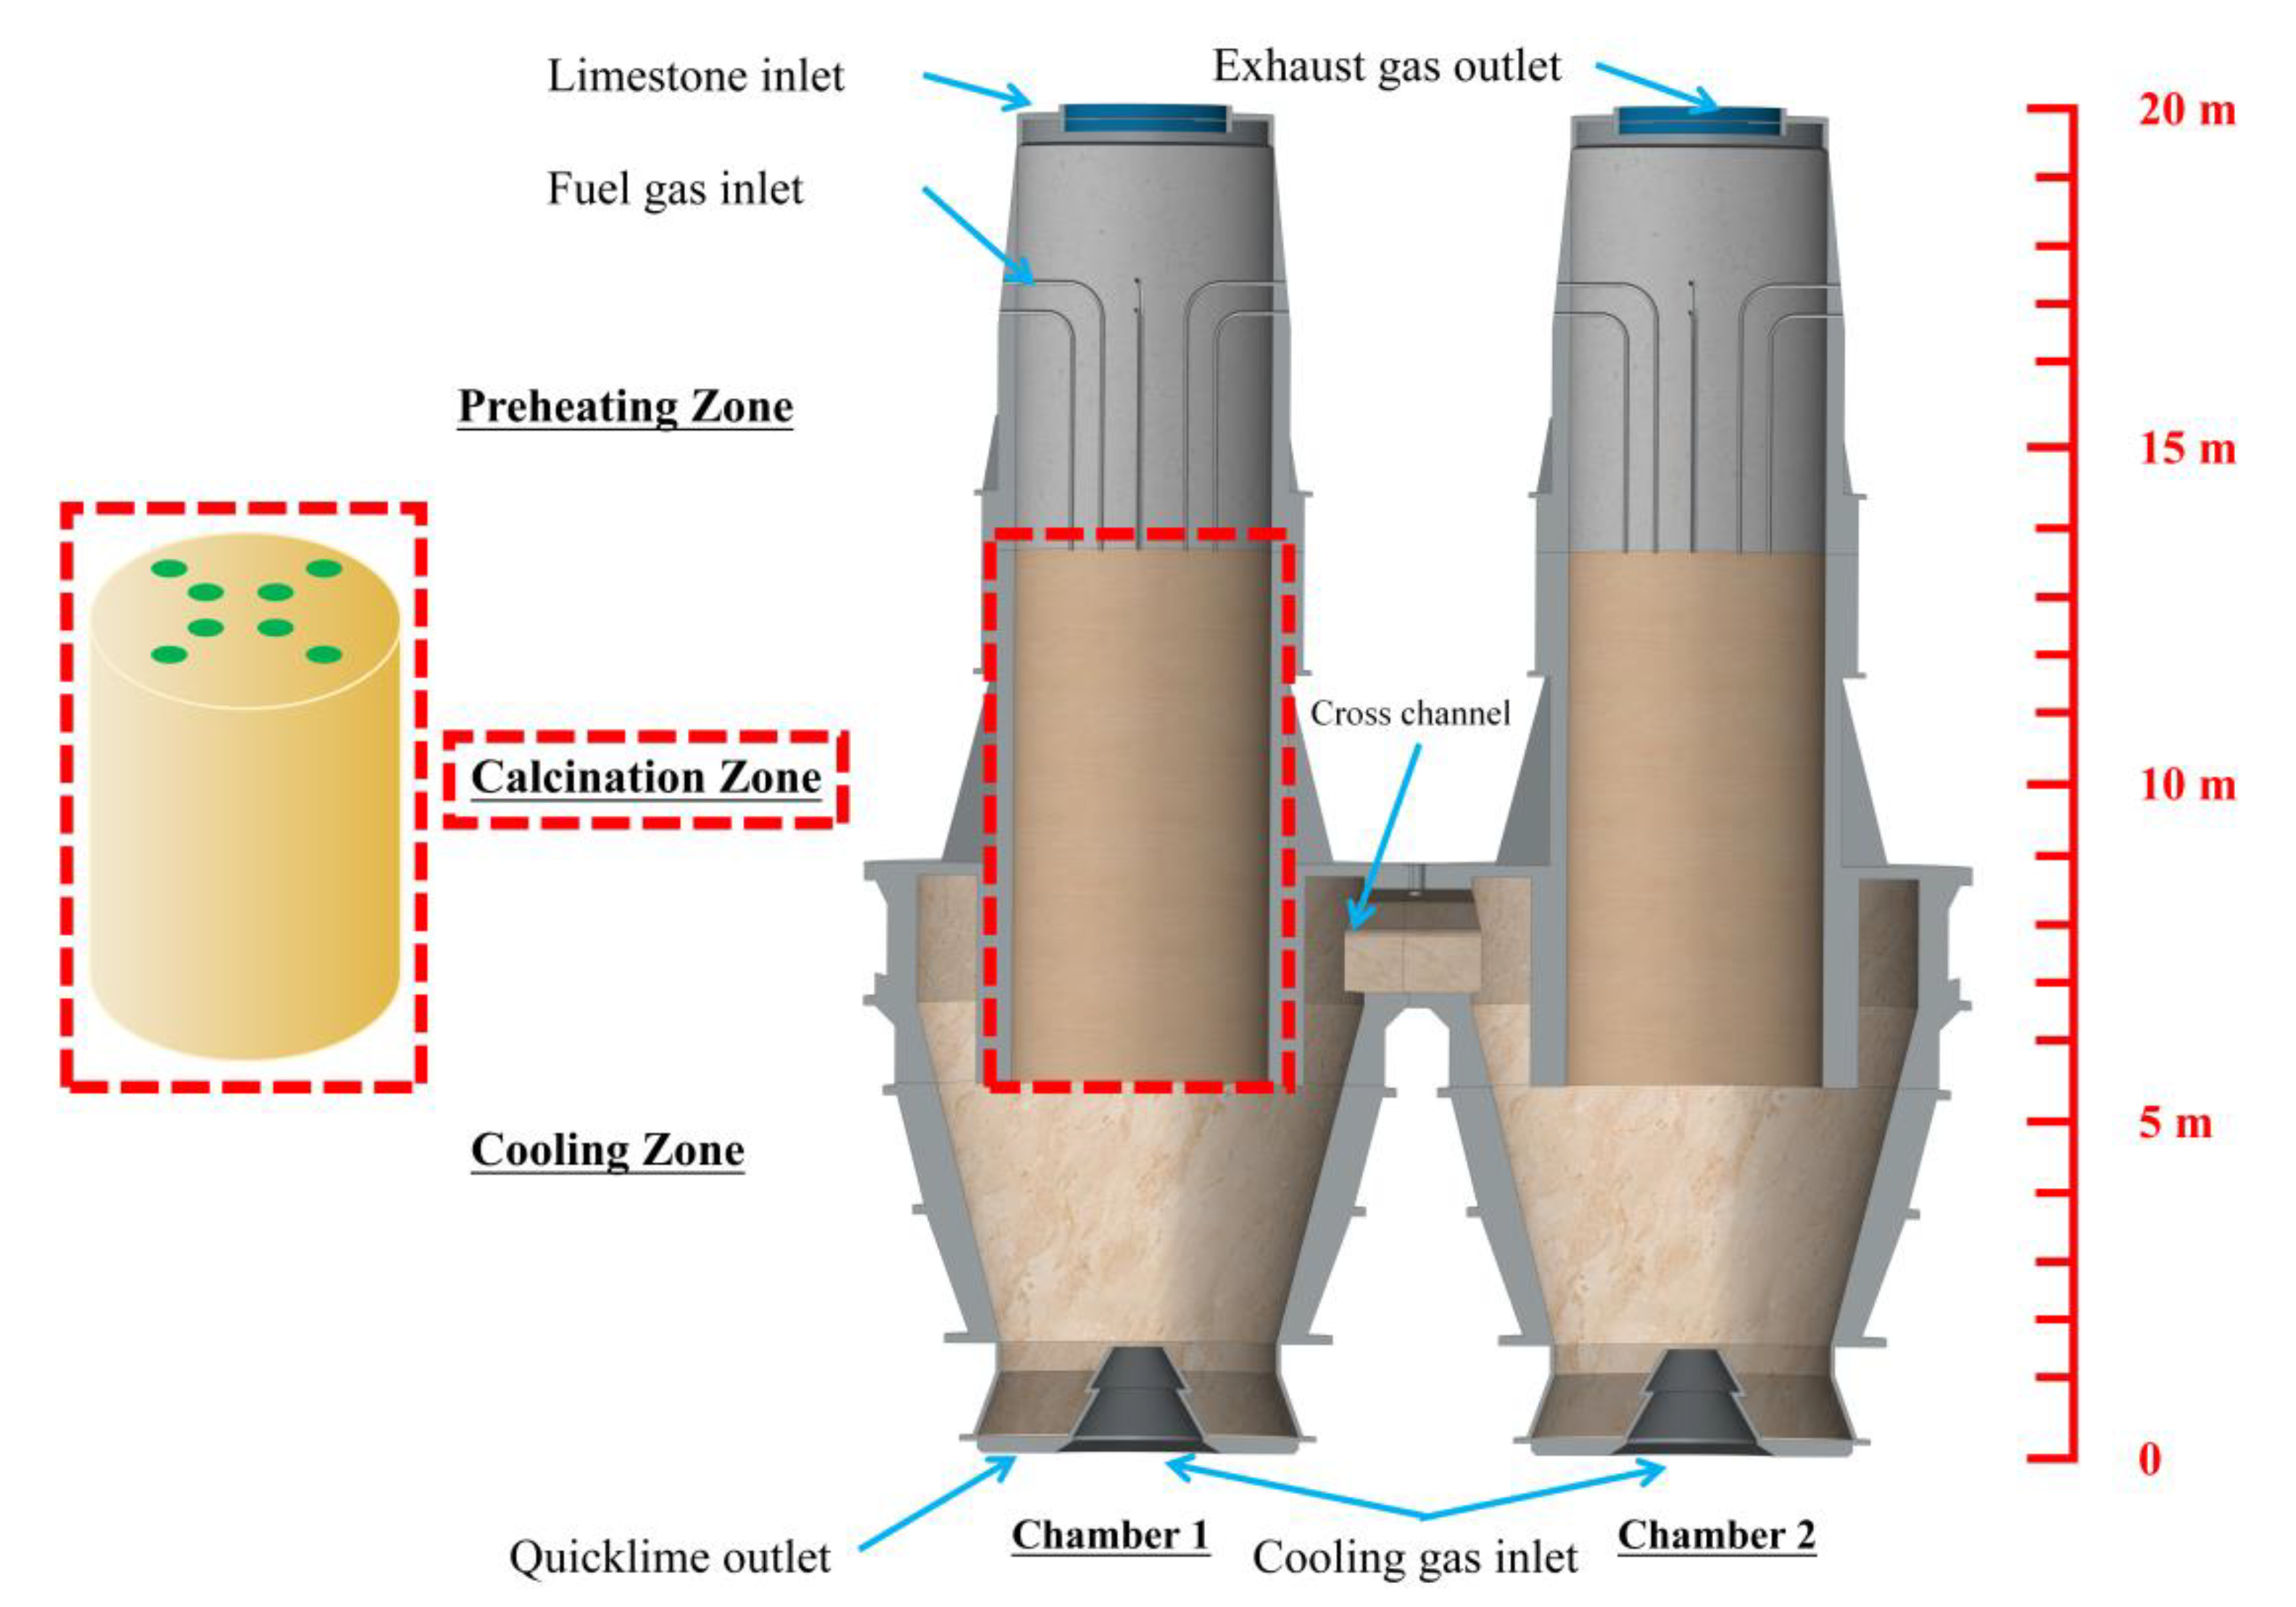
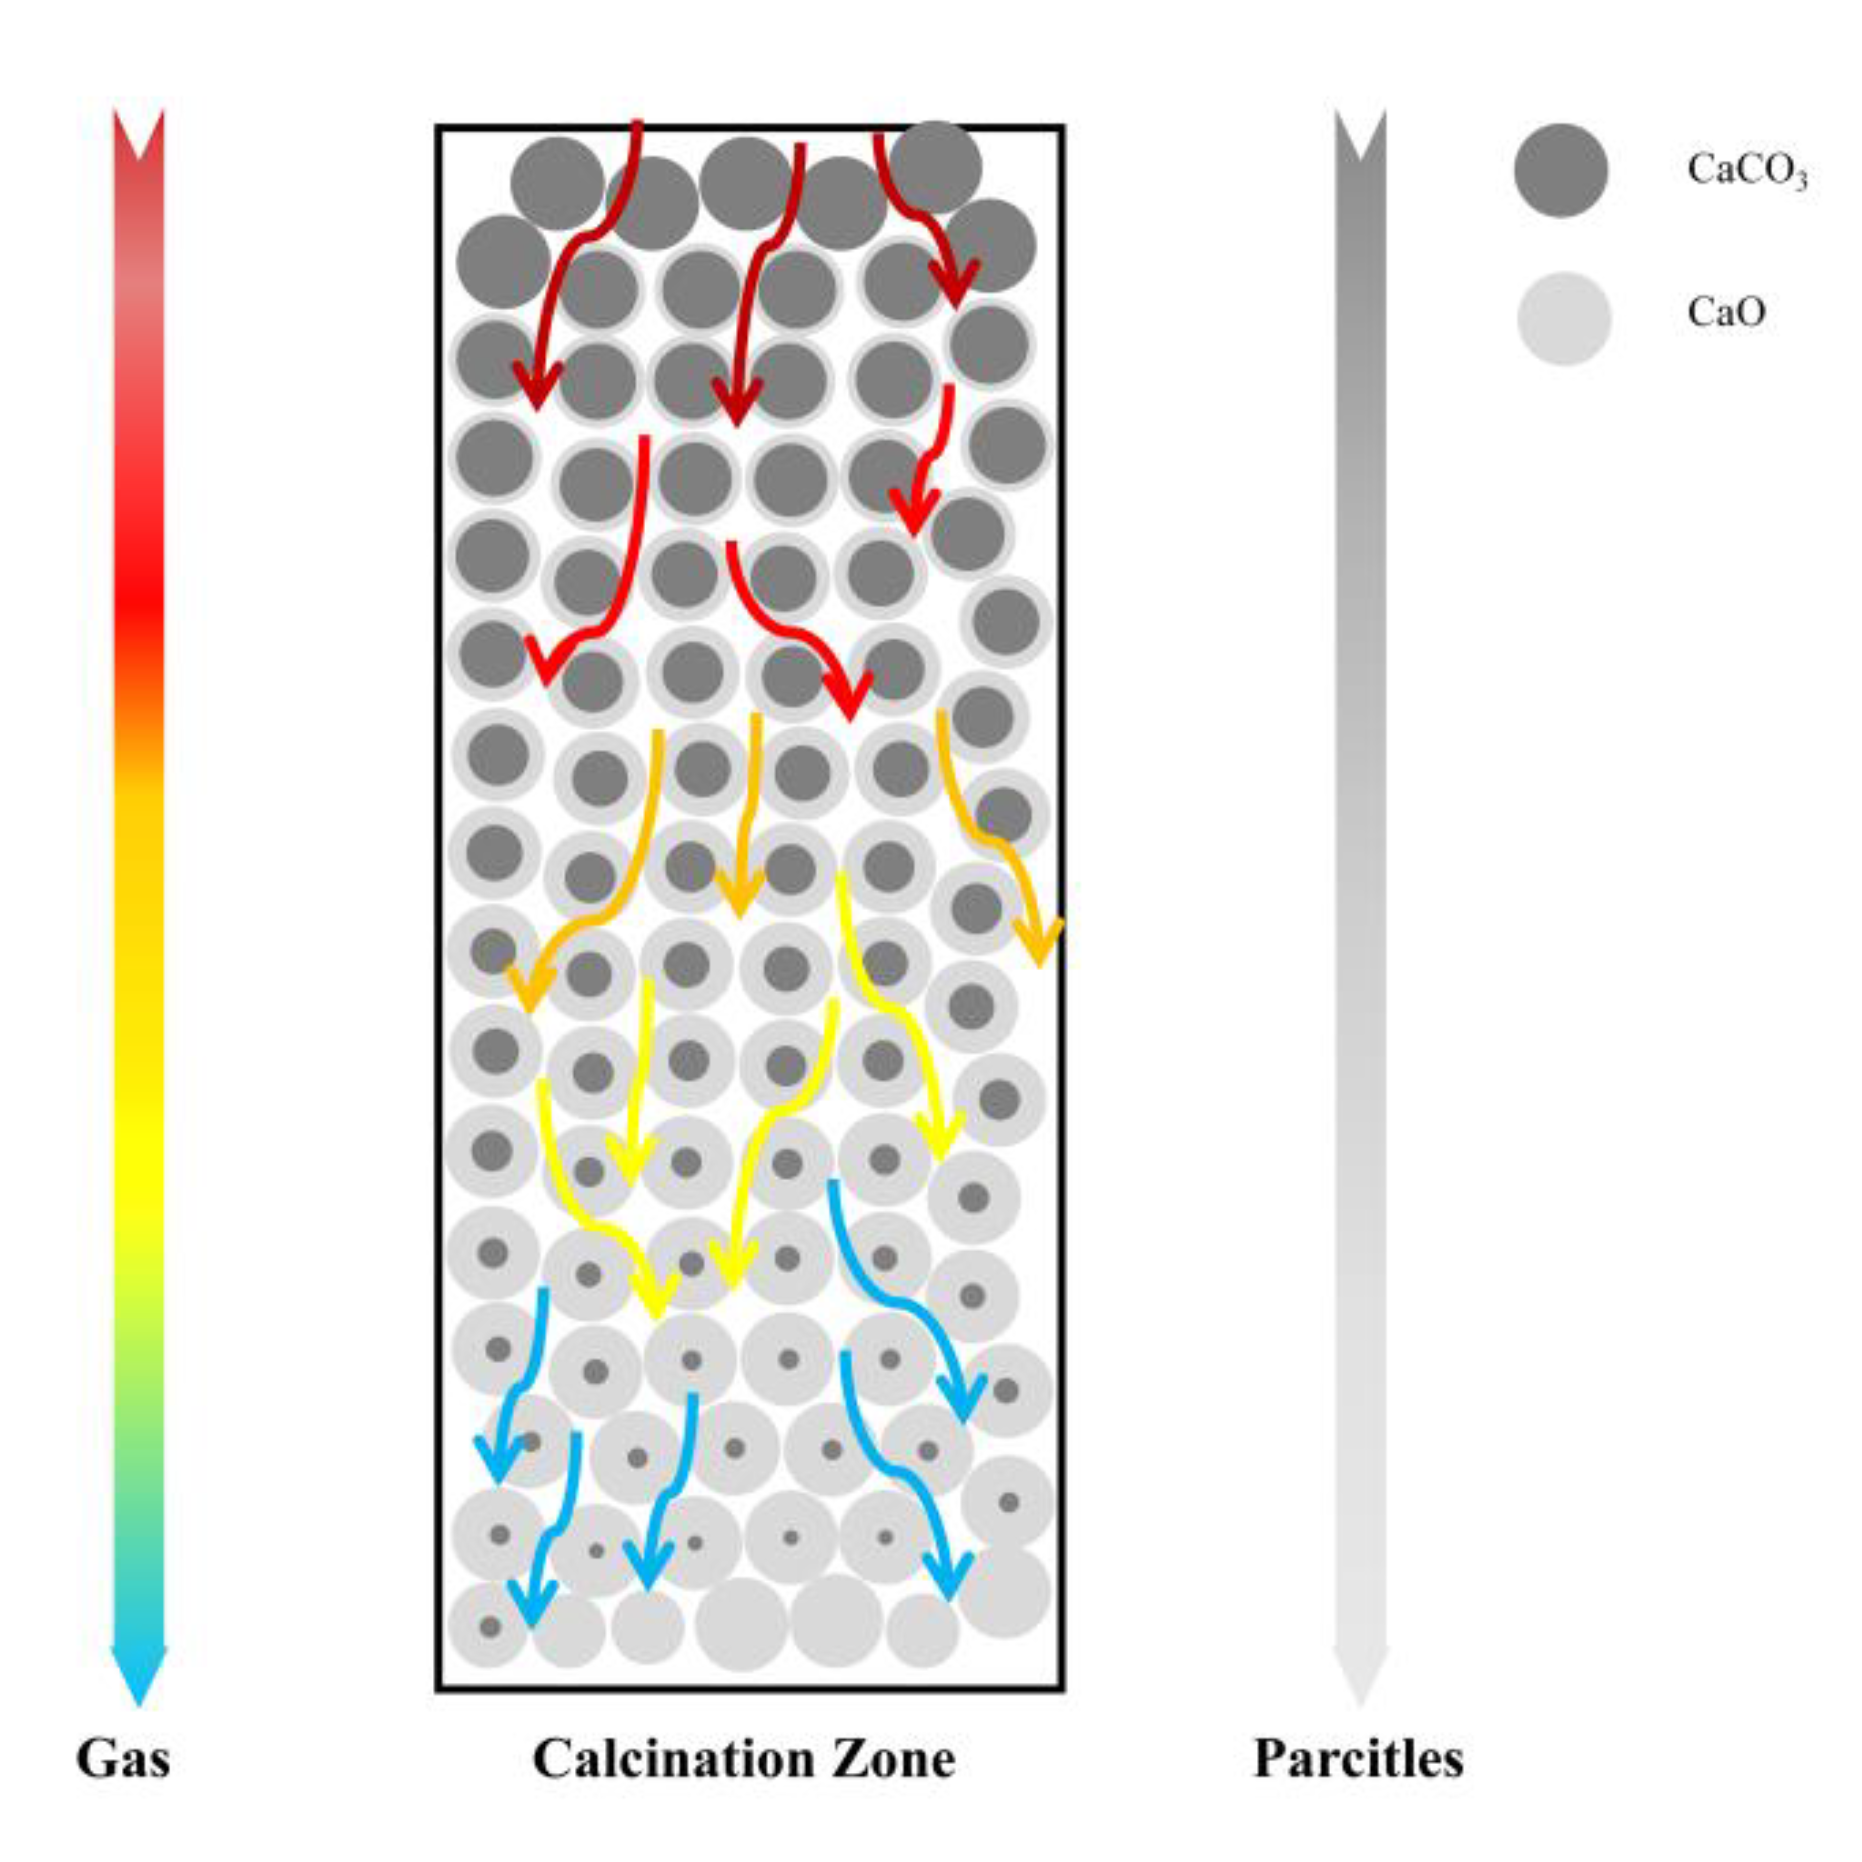
2. Physical Model
3. Mathematical Models and Boundary Conditions
- Excluding the effect of the external insulation of chambers.
- Disregard the impurities contained in the limestone particles and treat the particles as pure calcium carbonate.
- Treating limestone particles as spherical particles.
- Uniform distribution of limestone particles of different particle sizes within the calcination zone and shift without considering the deflection occurring in the moving process.
- Gases do not affect the movement of solids.
3.1. Mathematical Models
3.2. Boundary Conditions
4. Results and Analysis
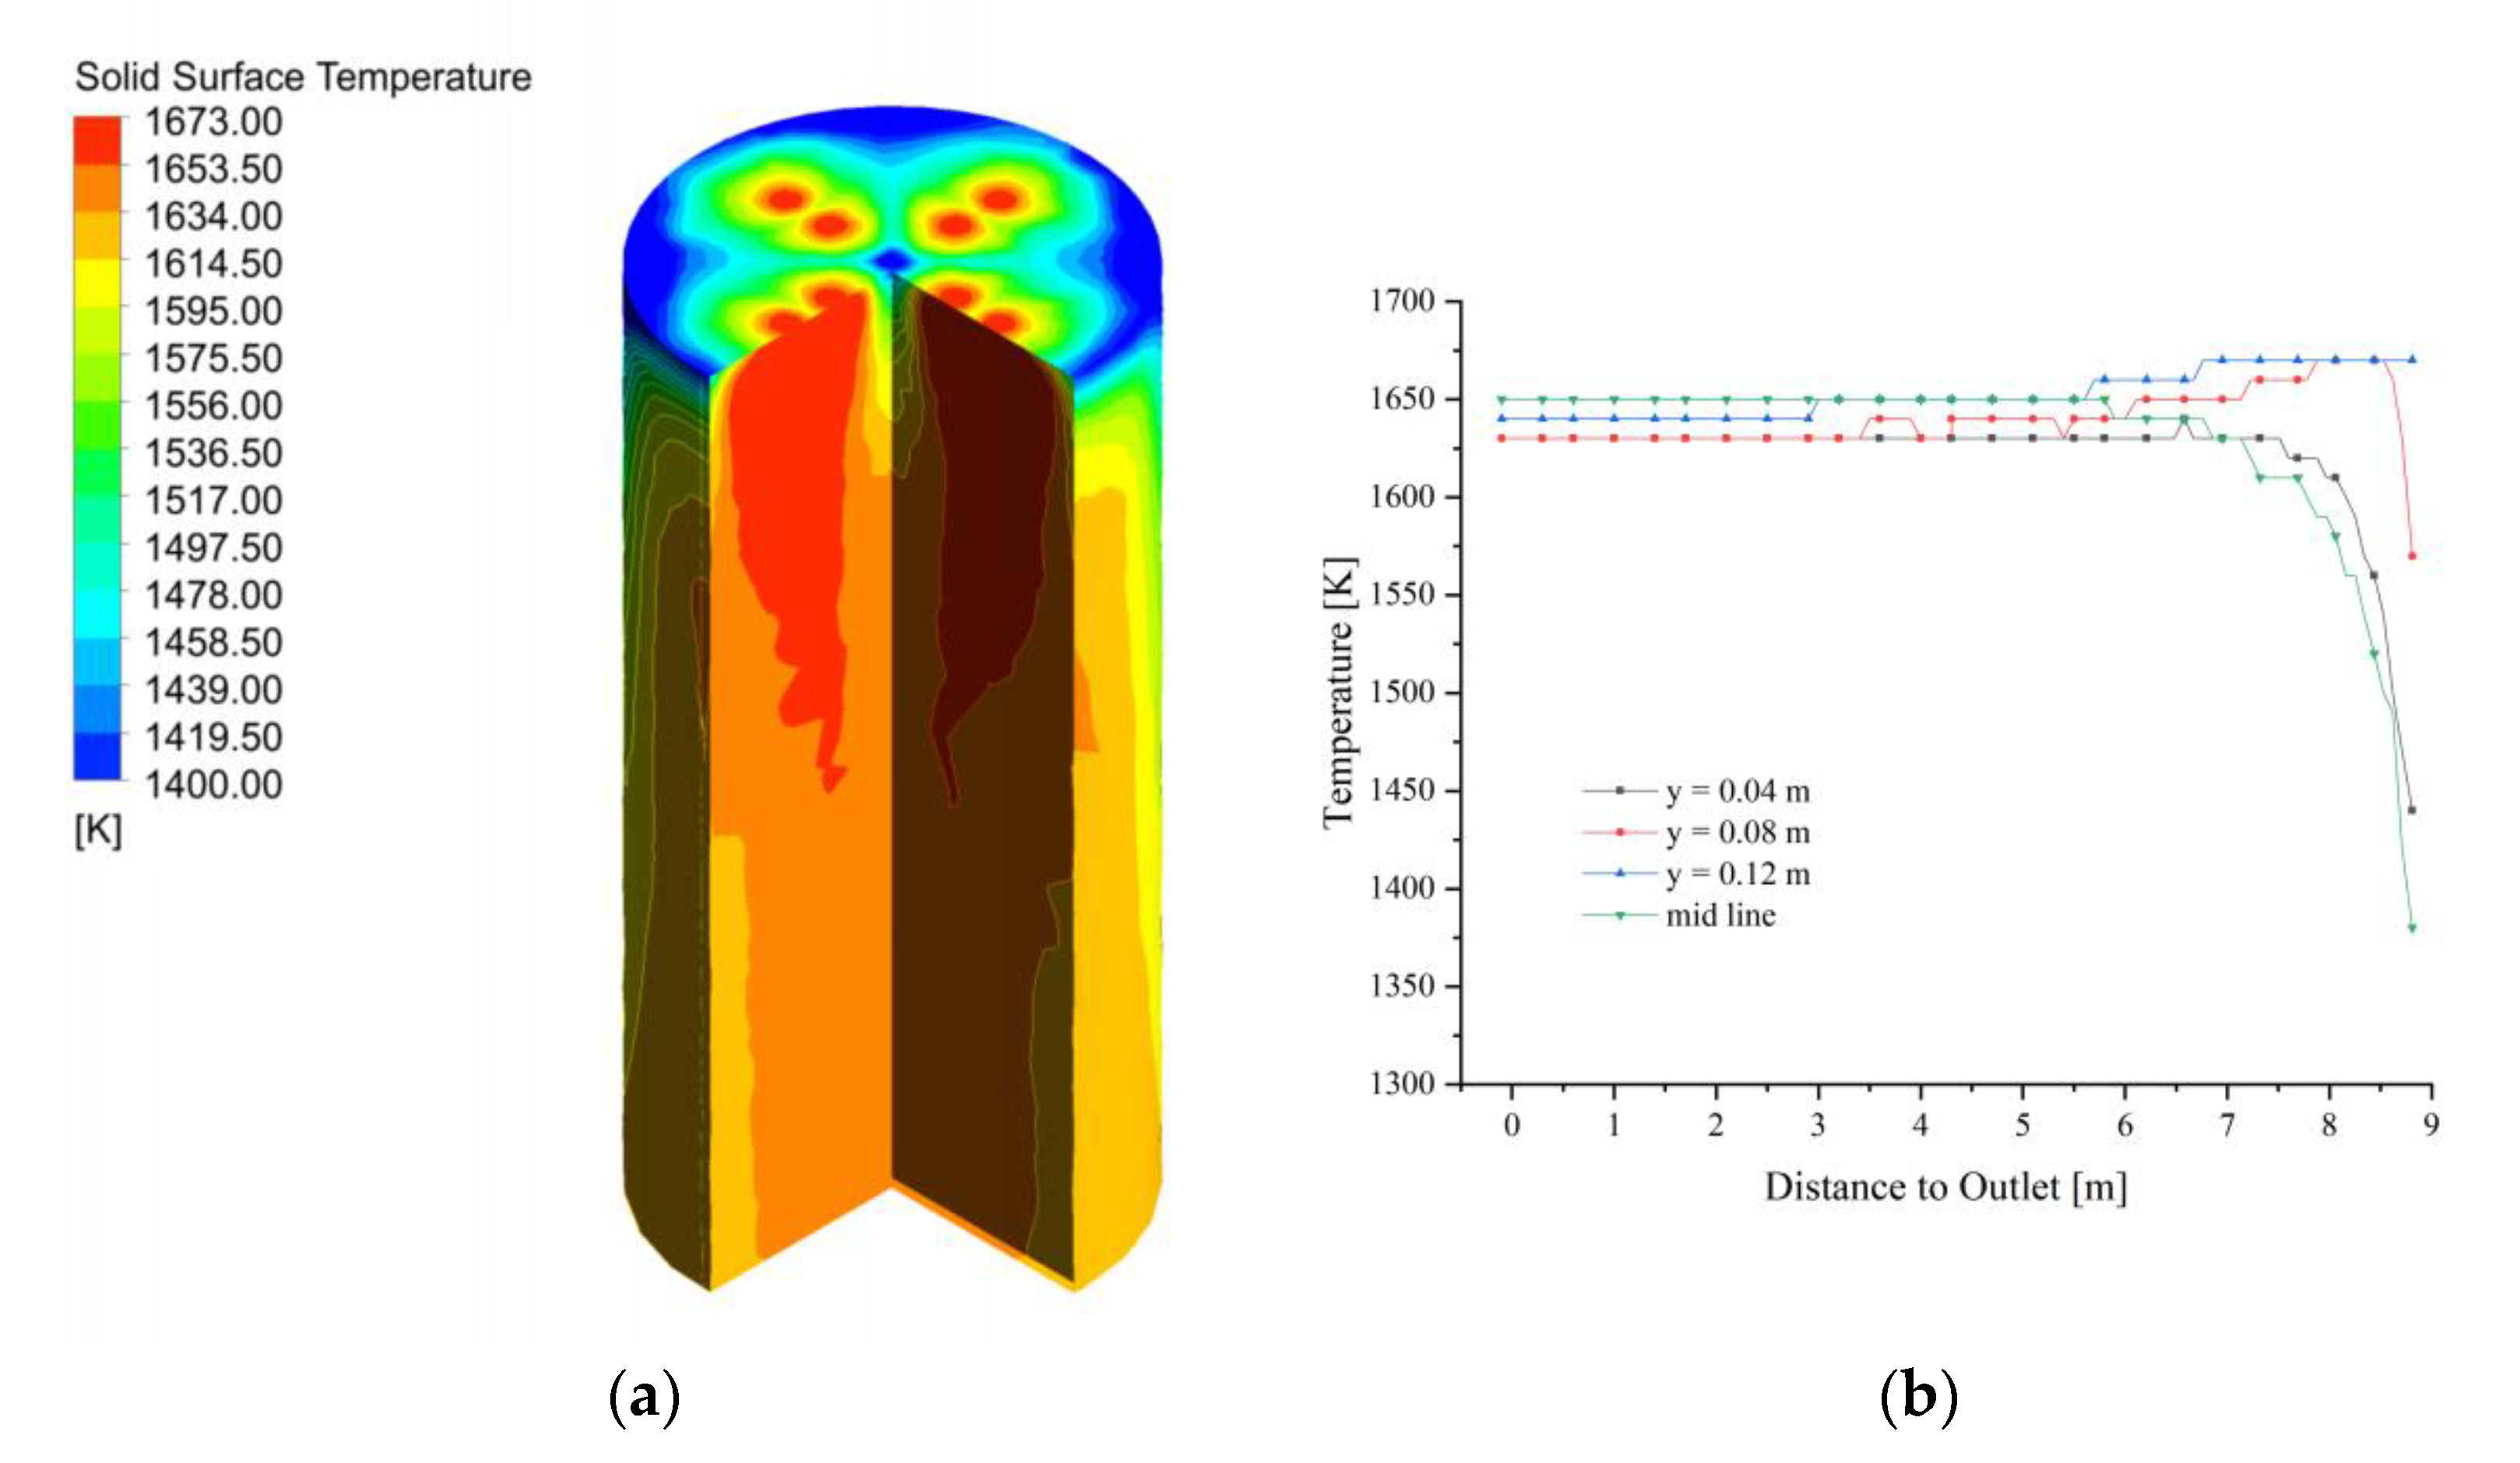
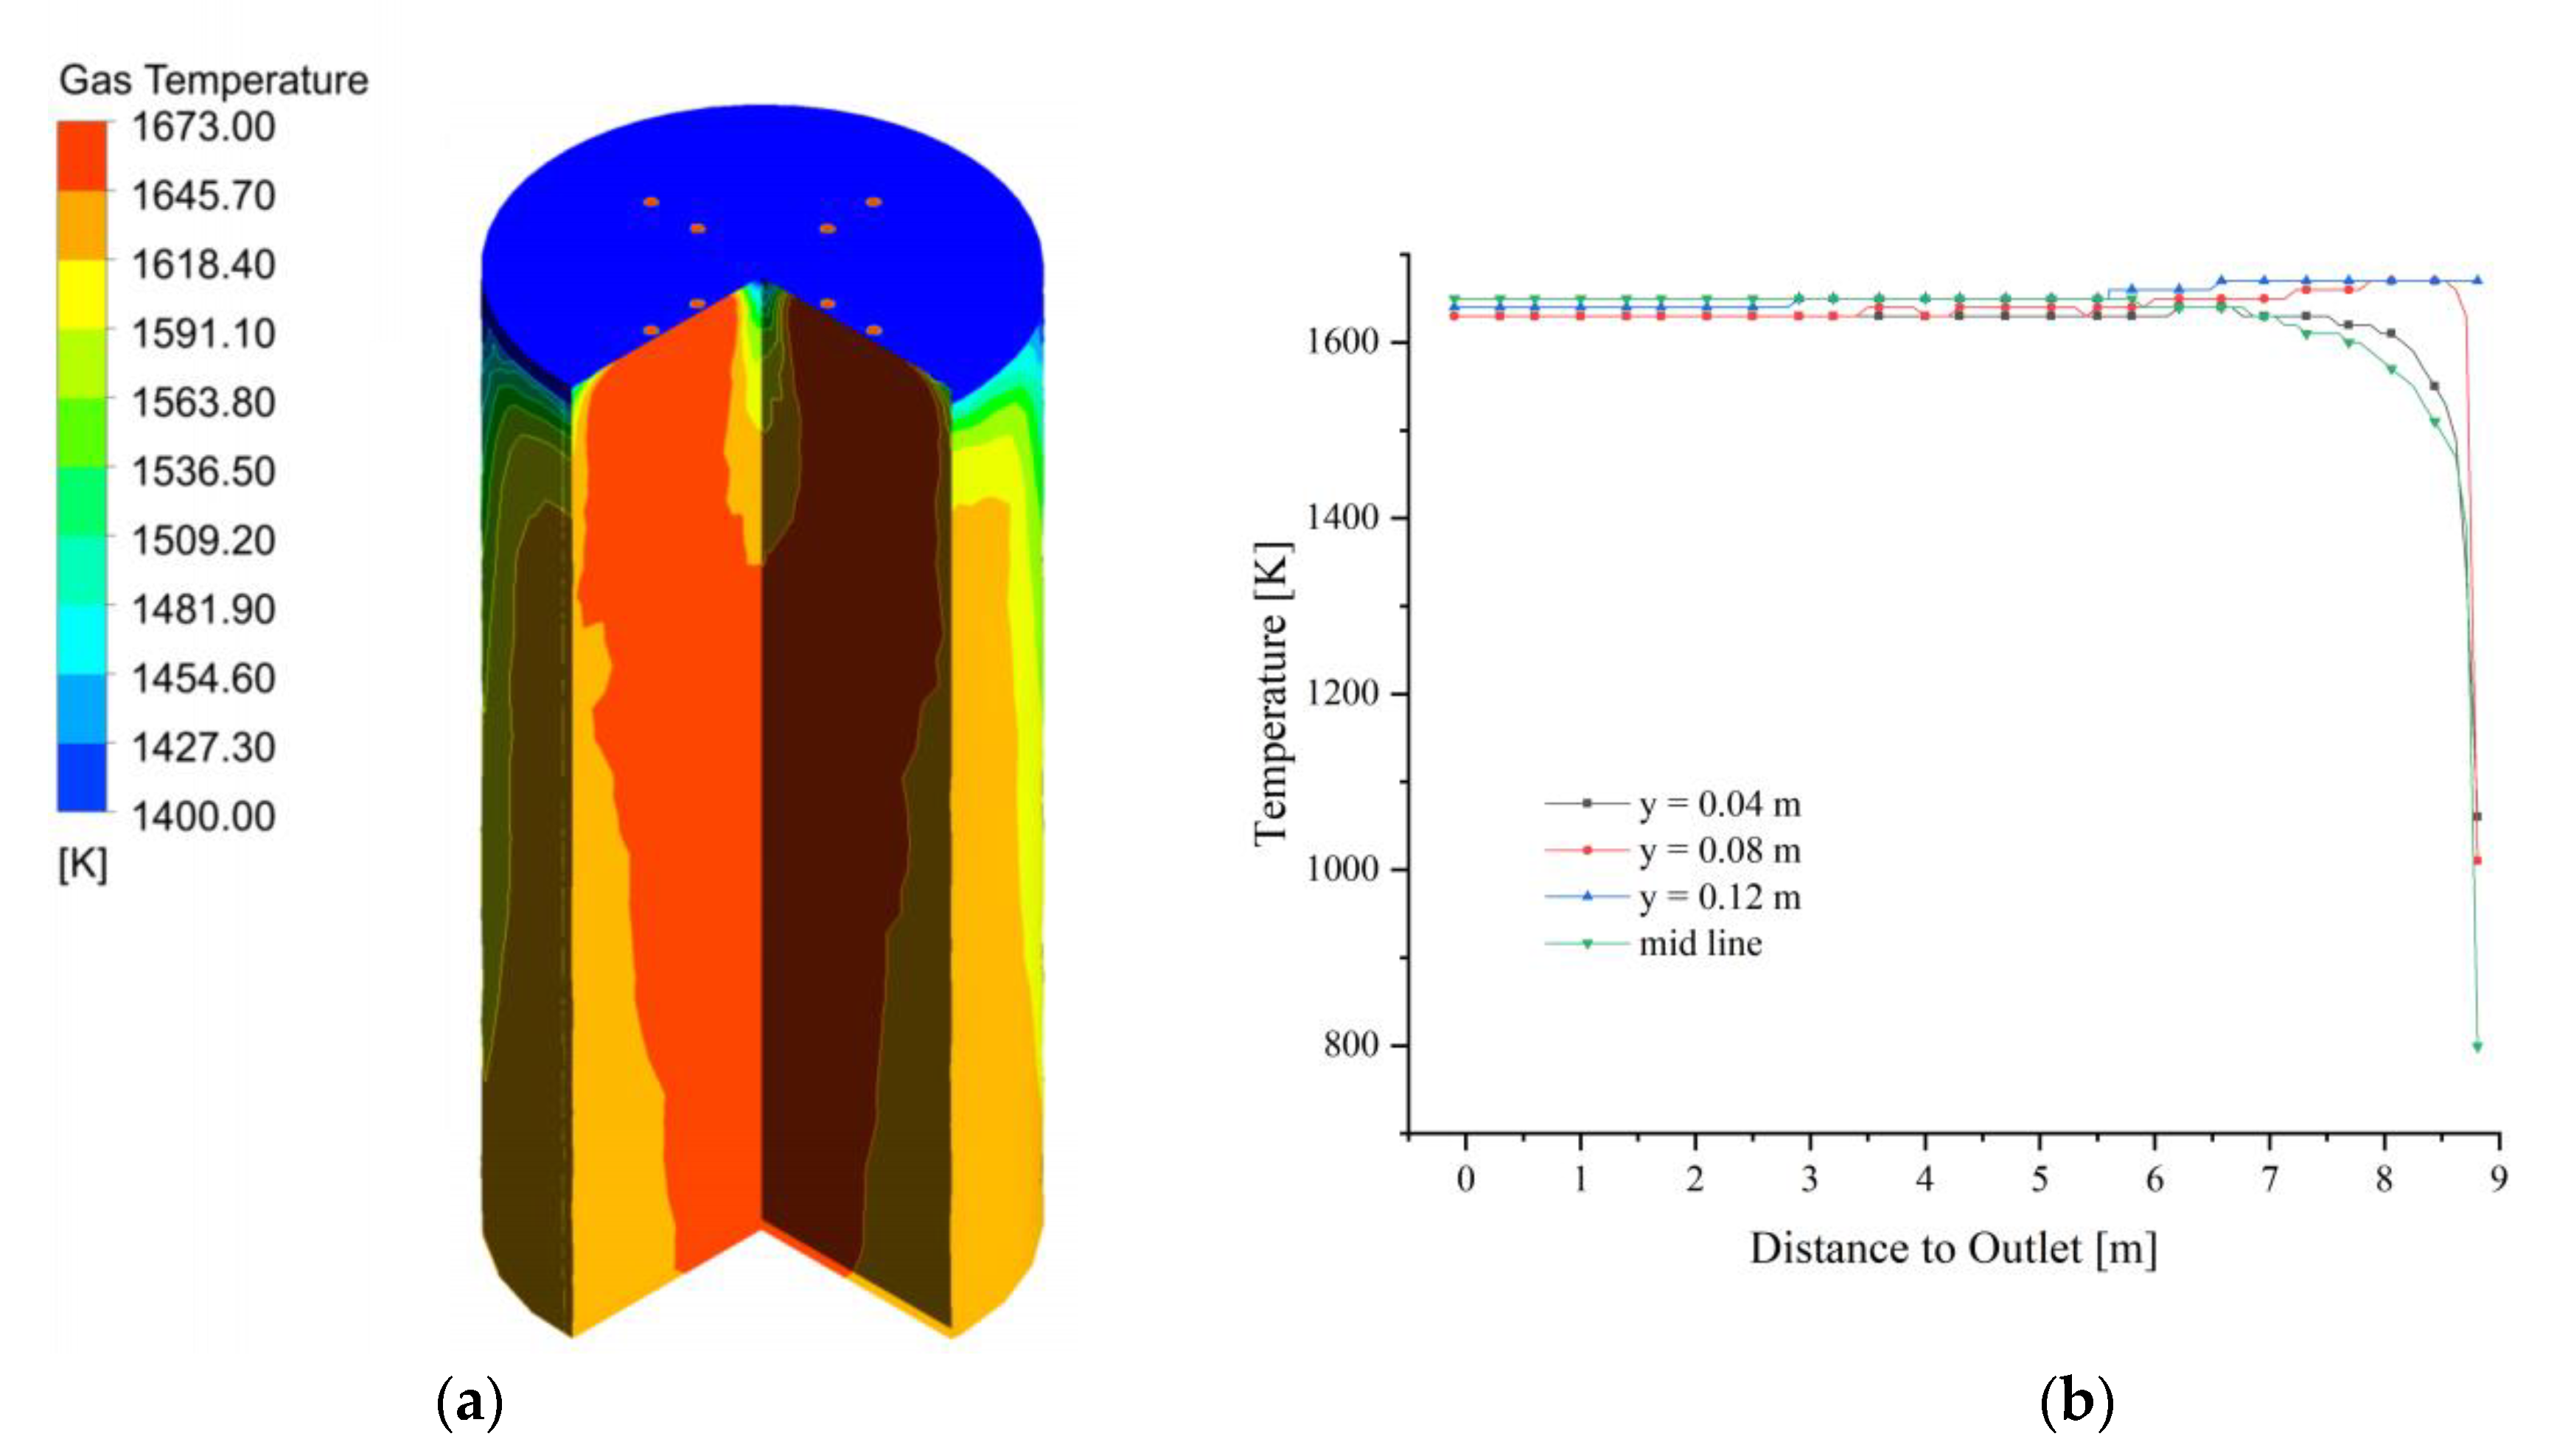
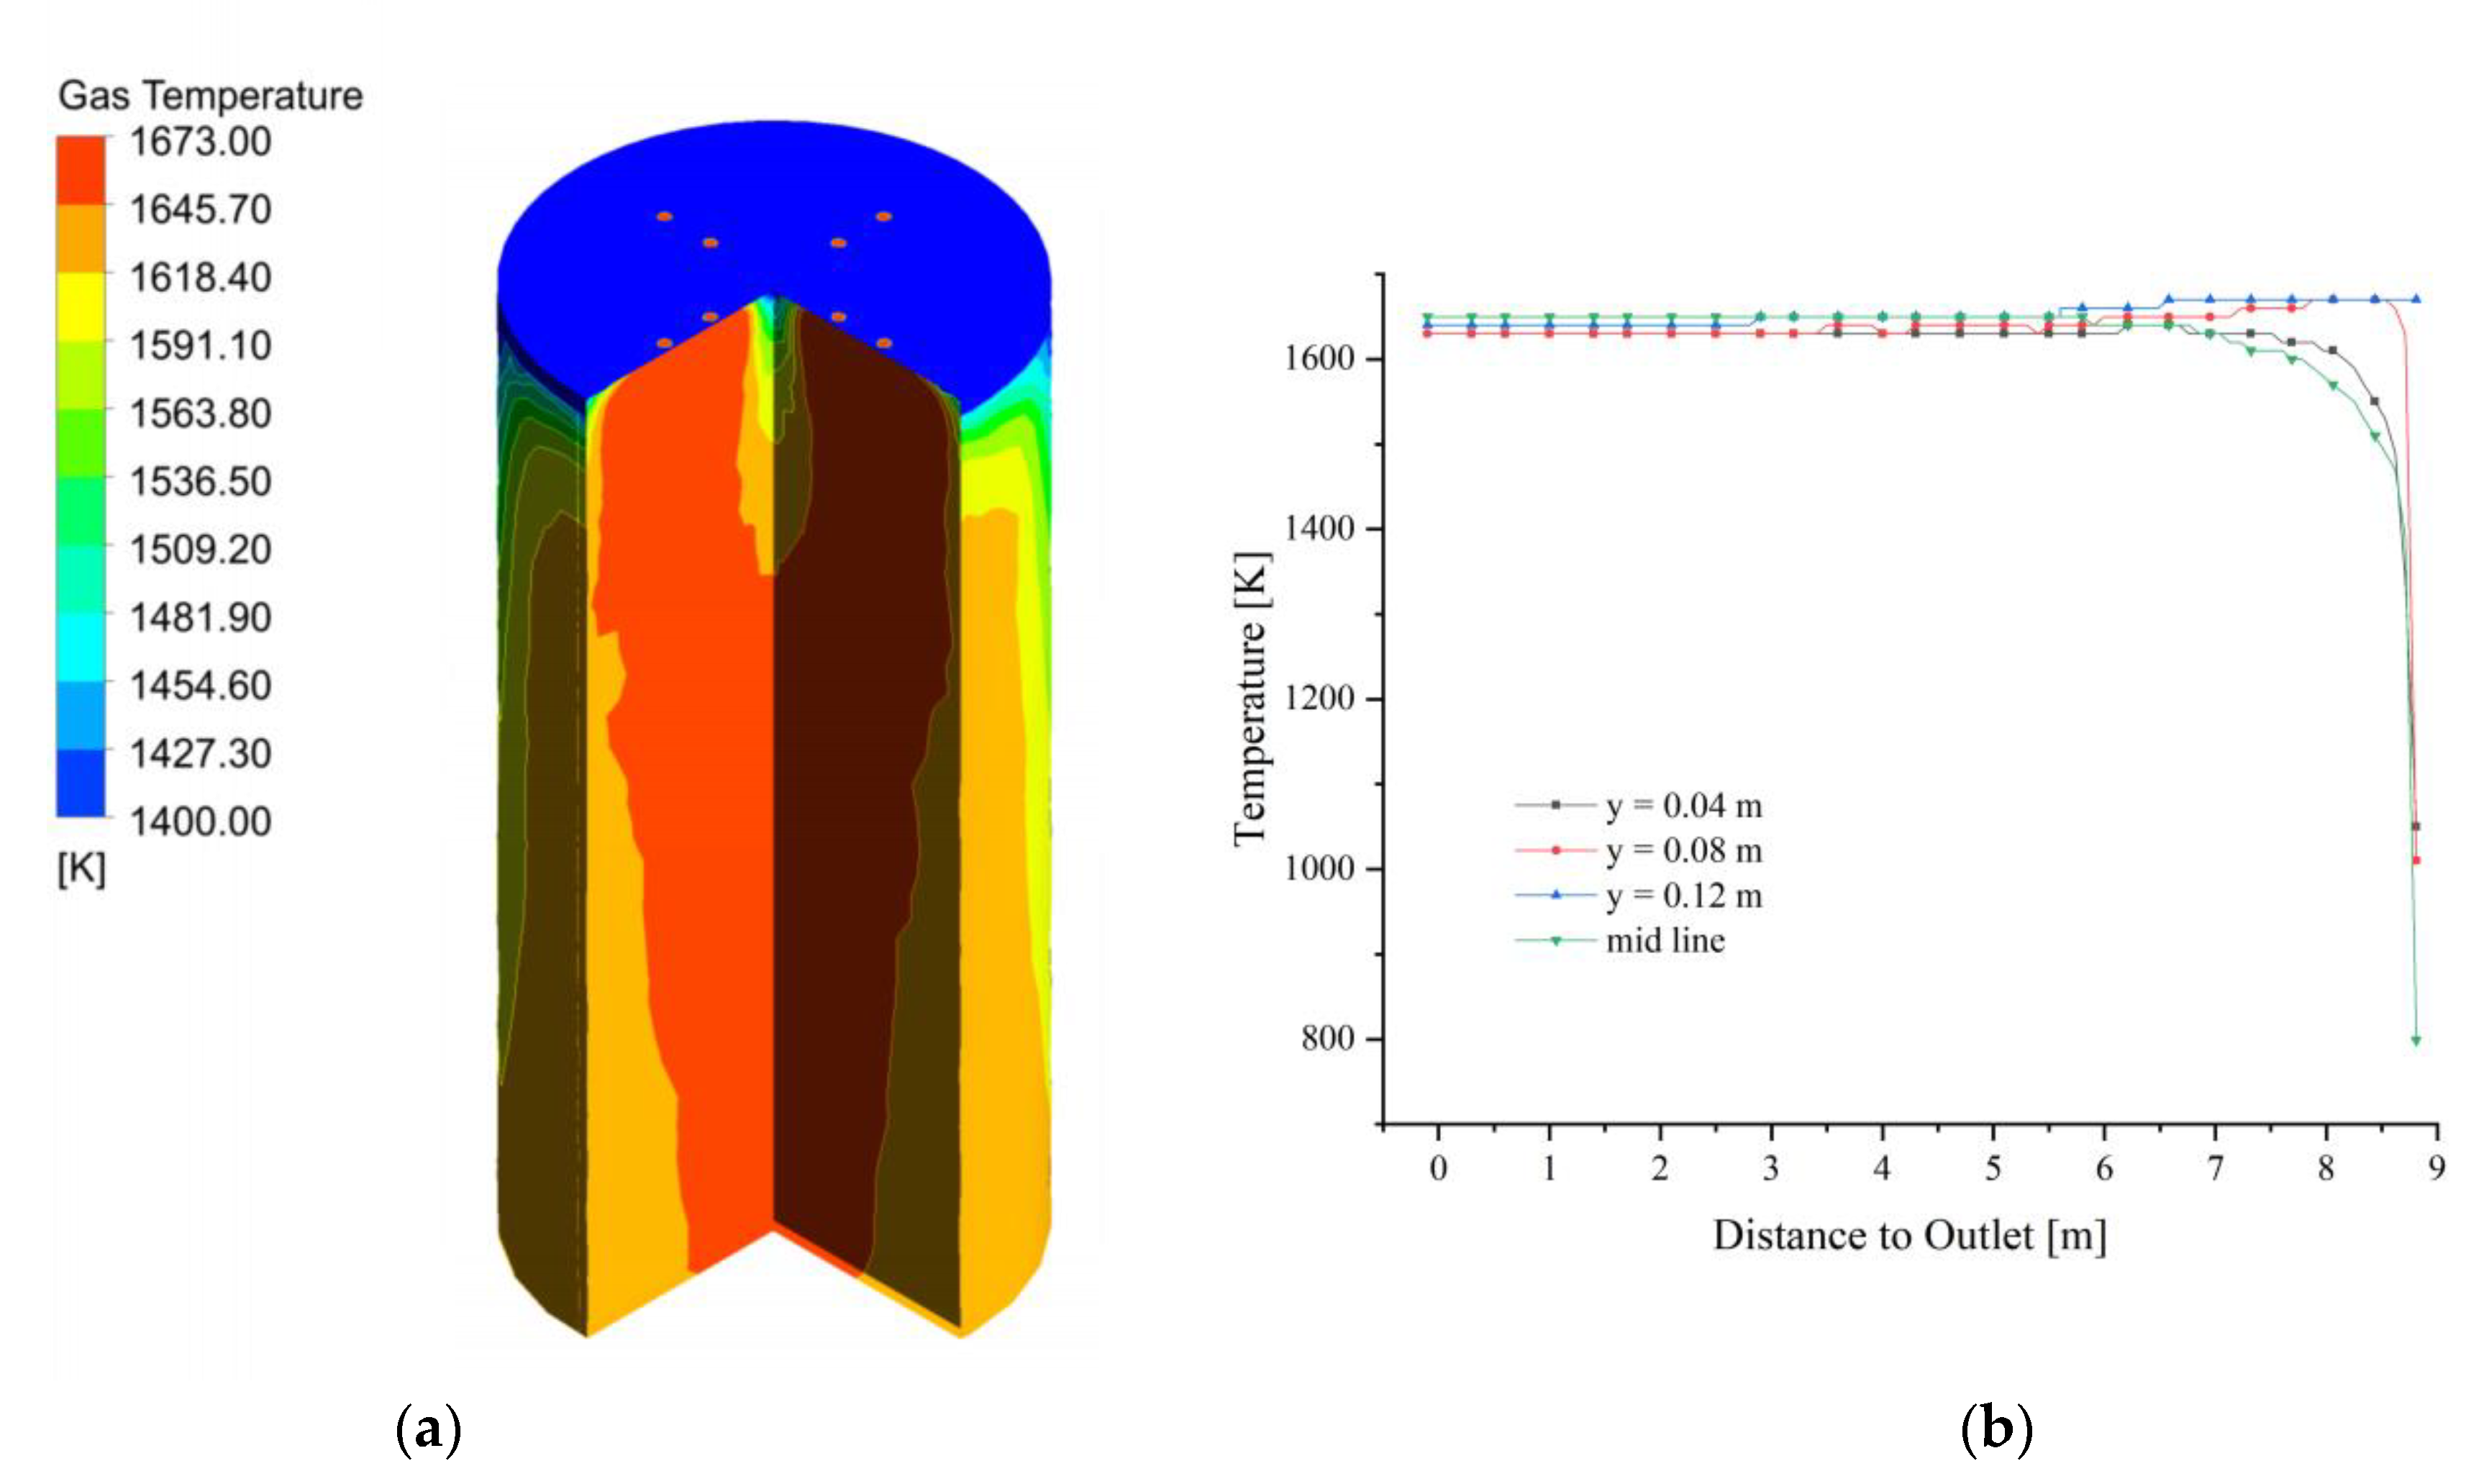
4.1. Gas-Solid Temperature Field and Decomposition of 40 mm Uniform Particle Size Limestone
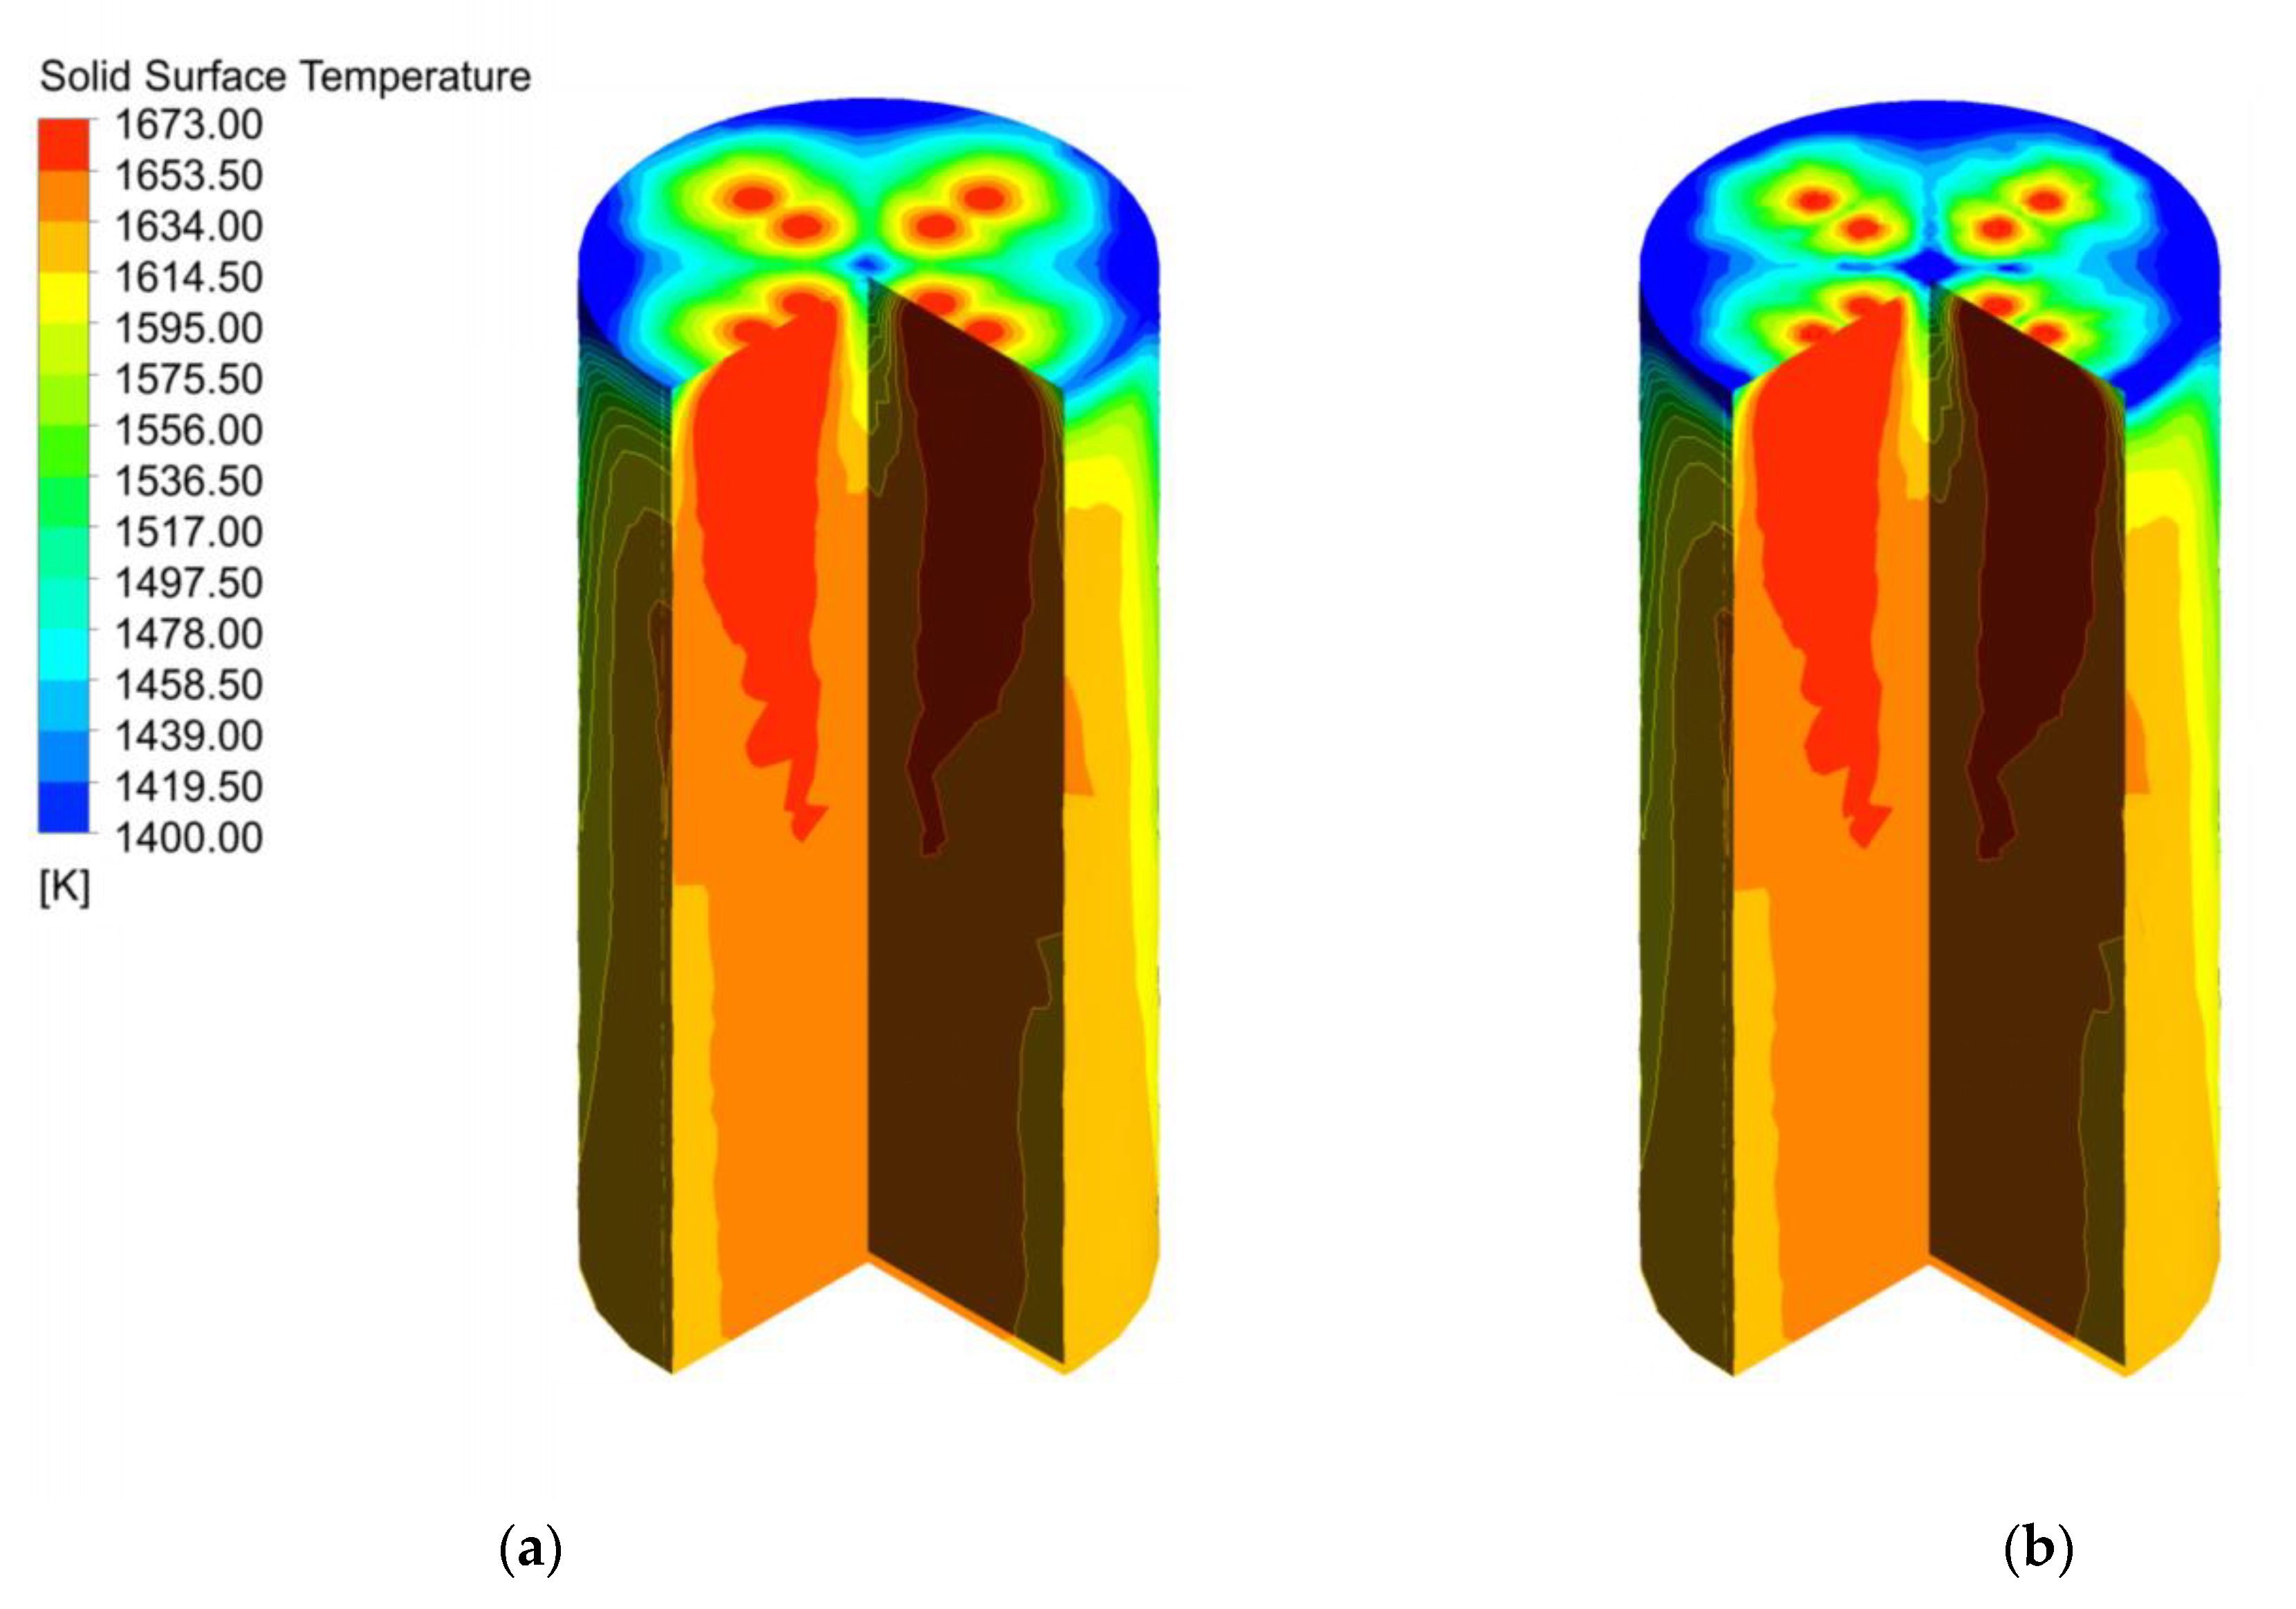
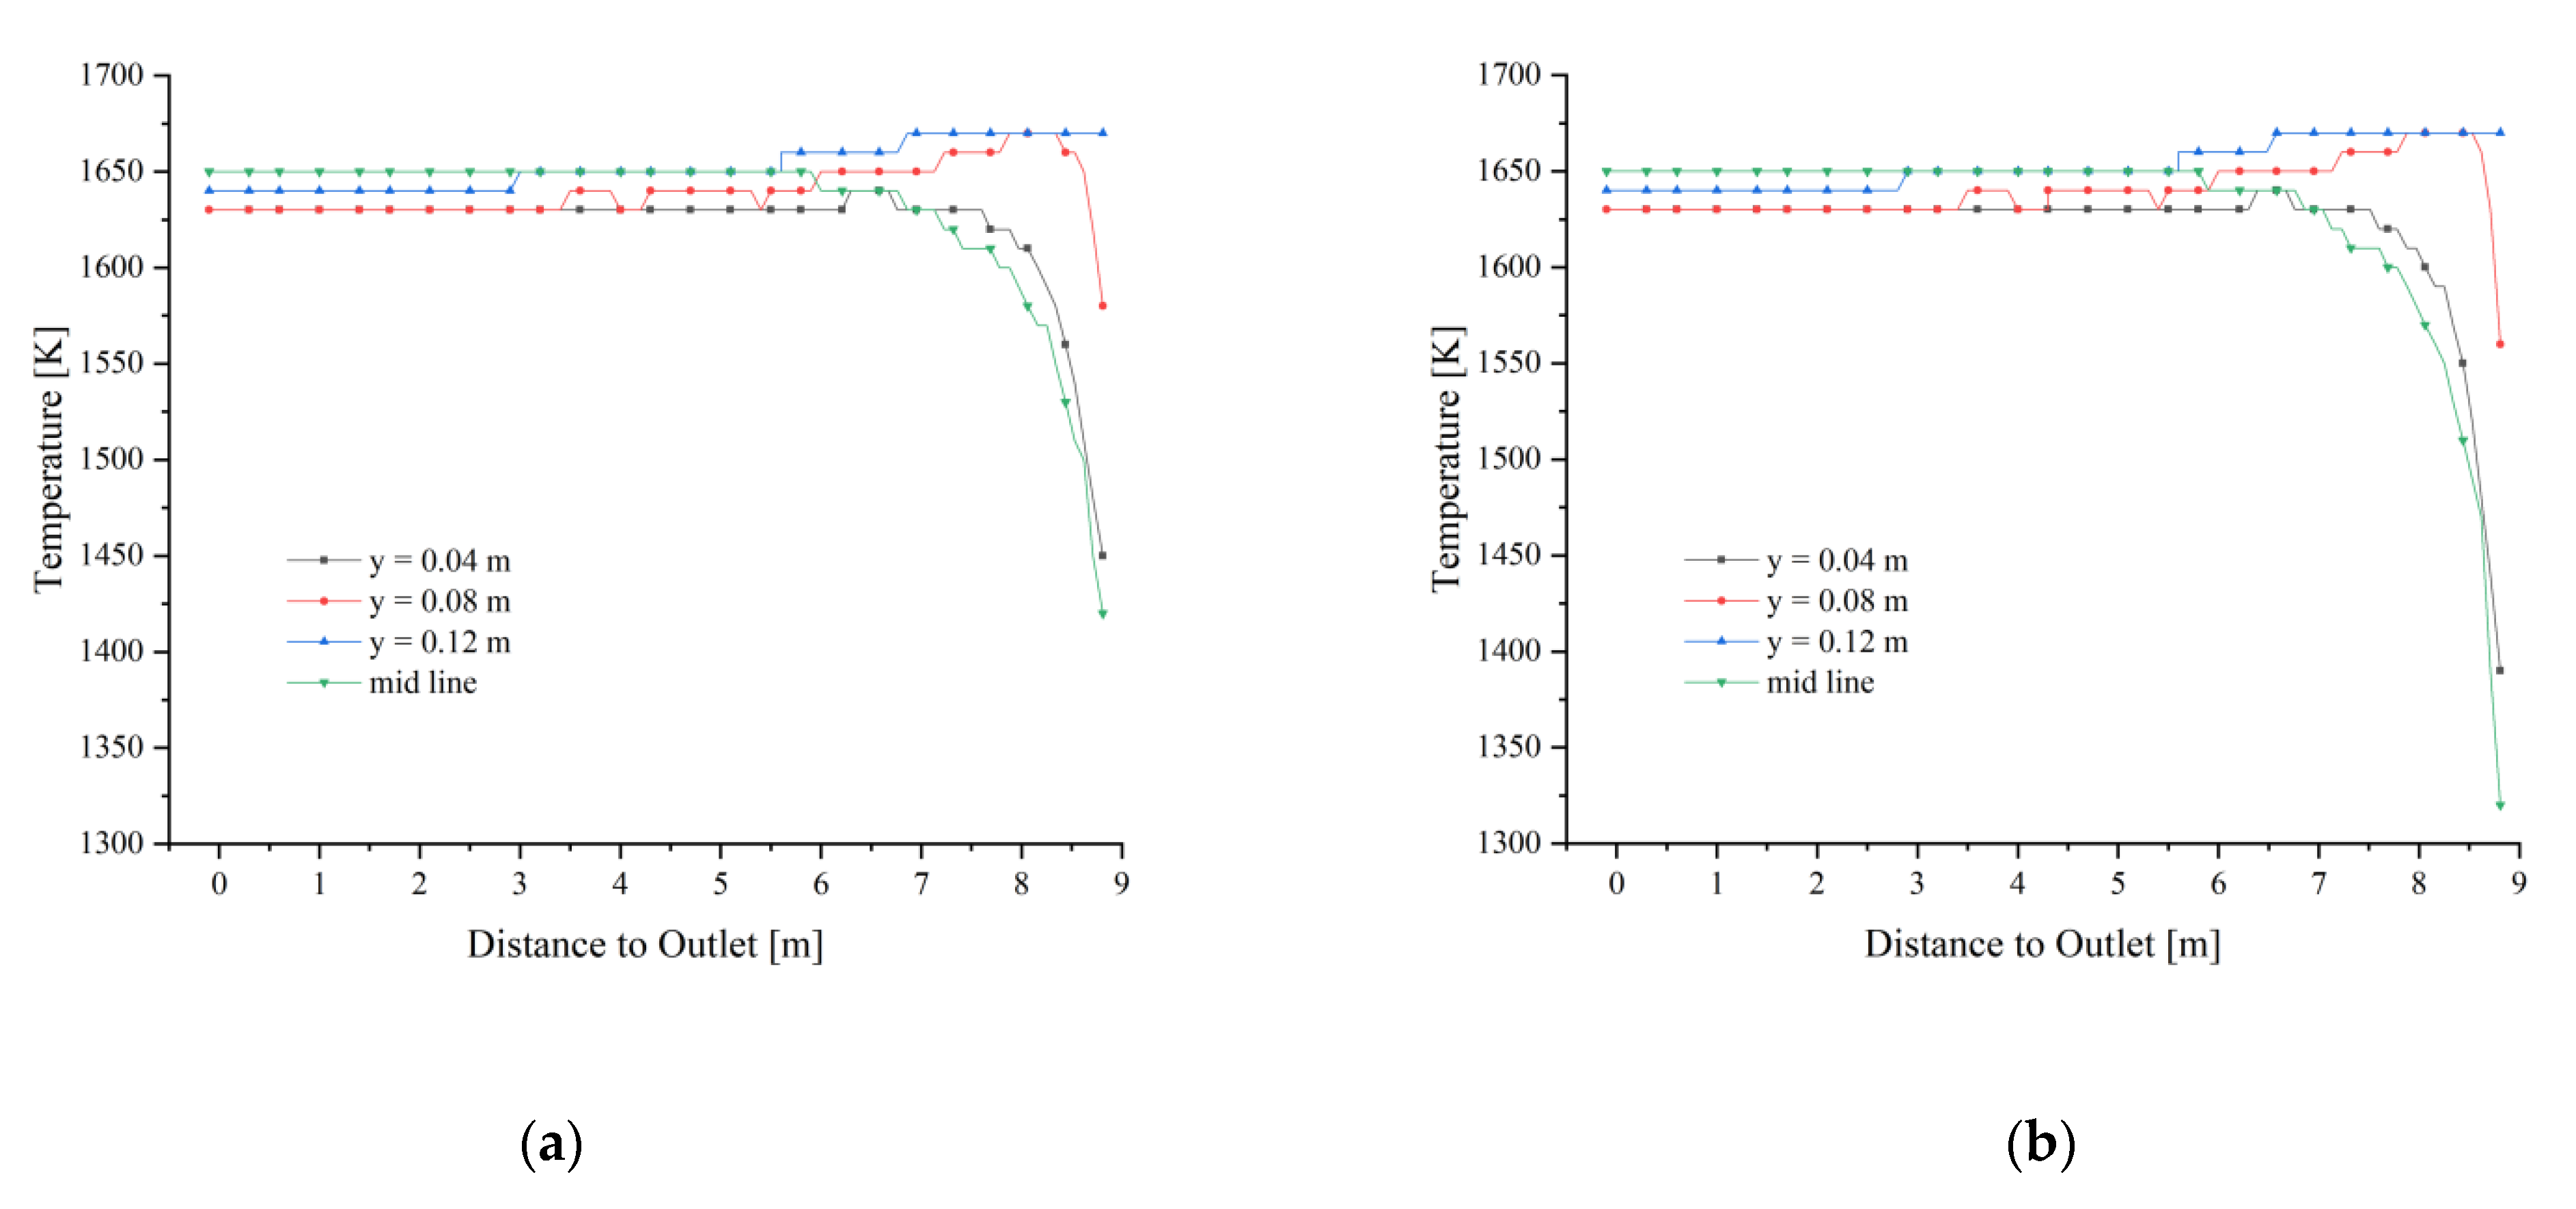
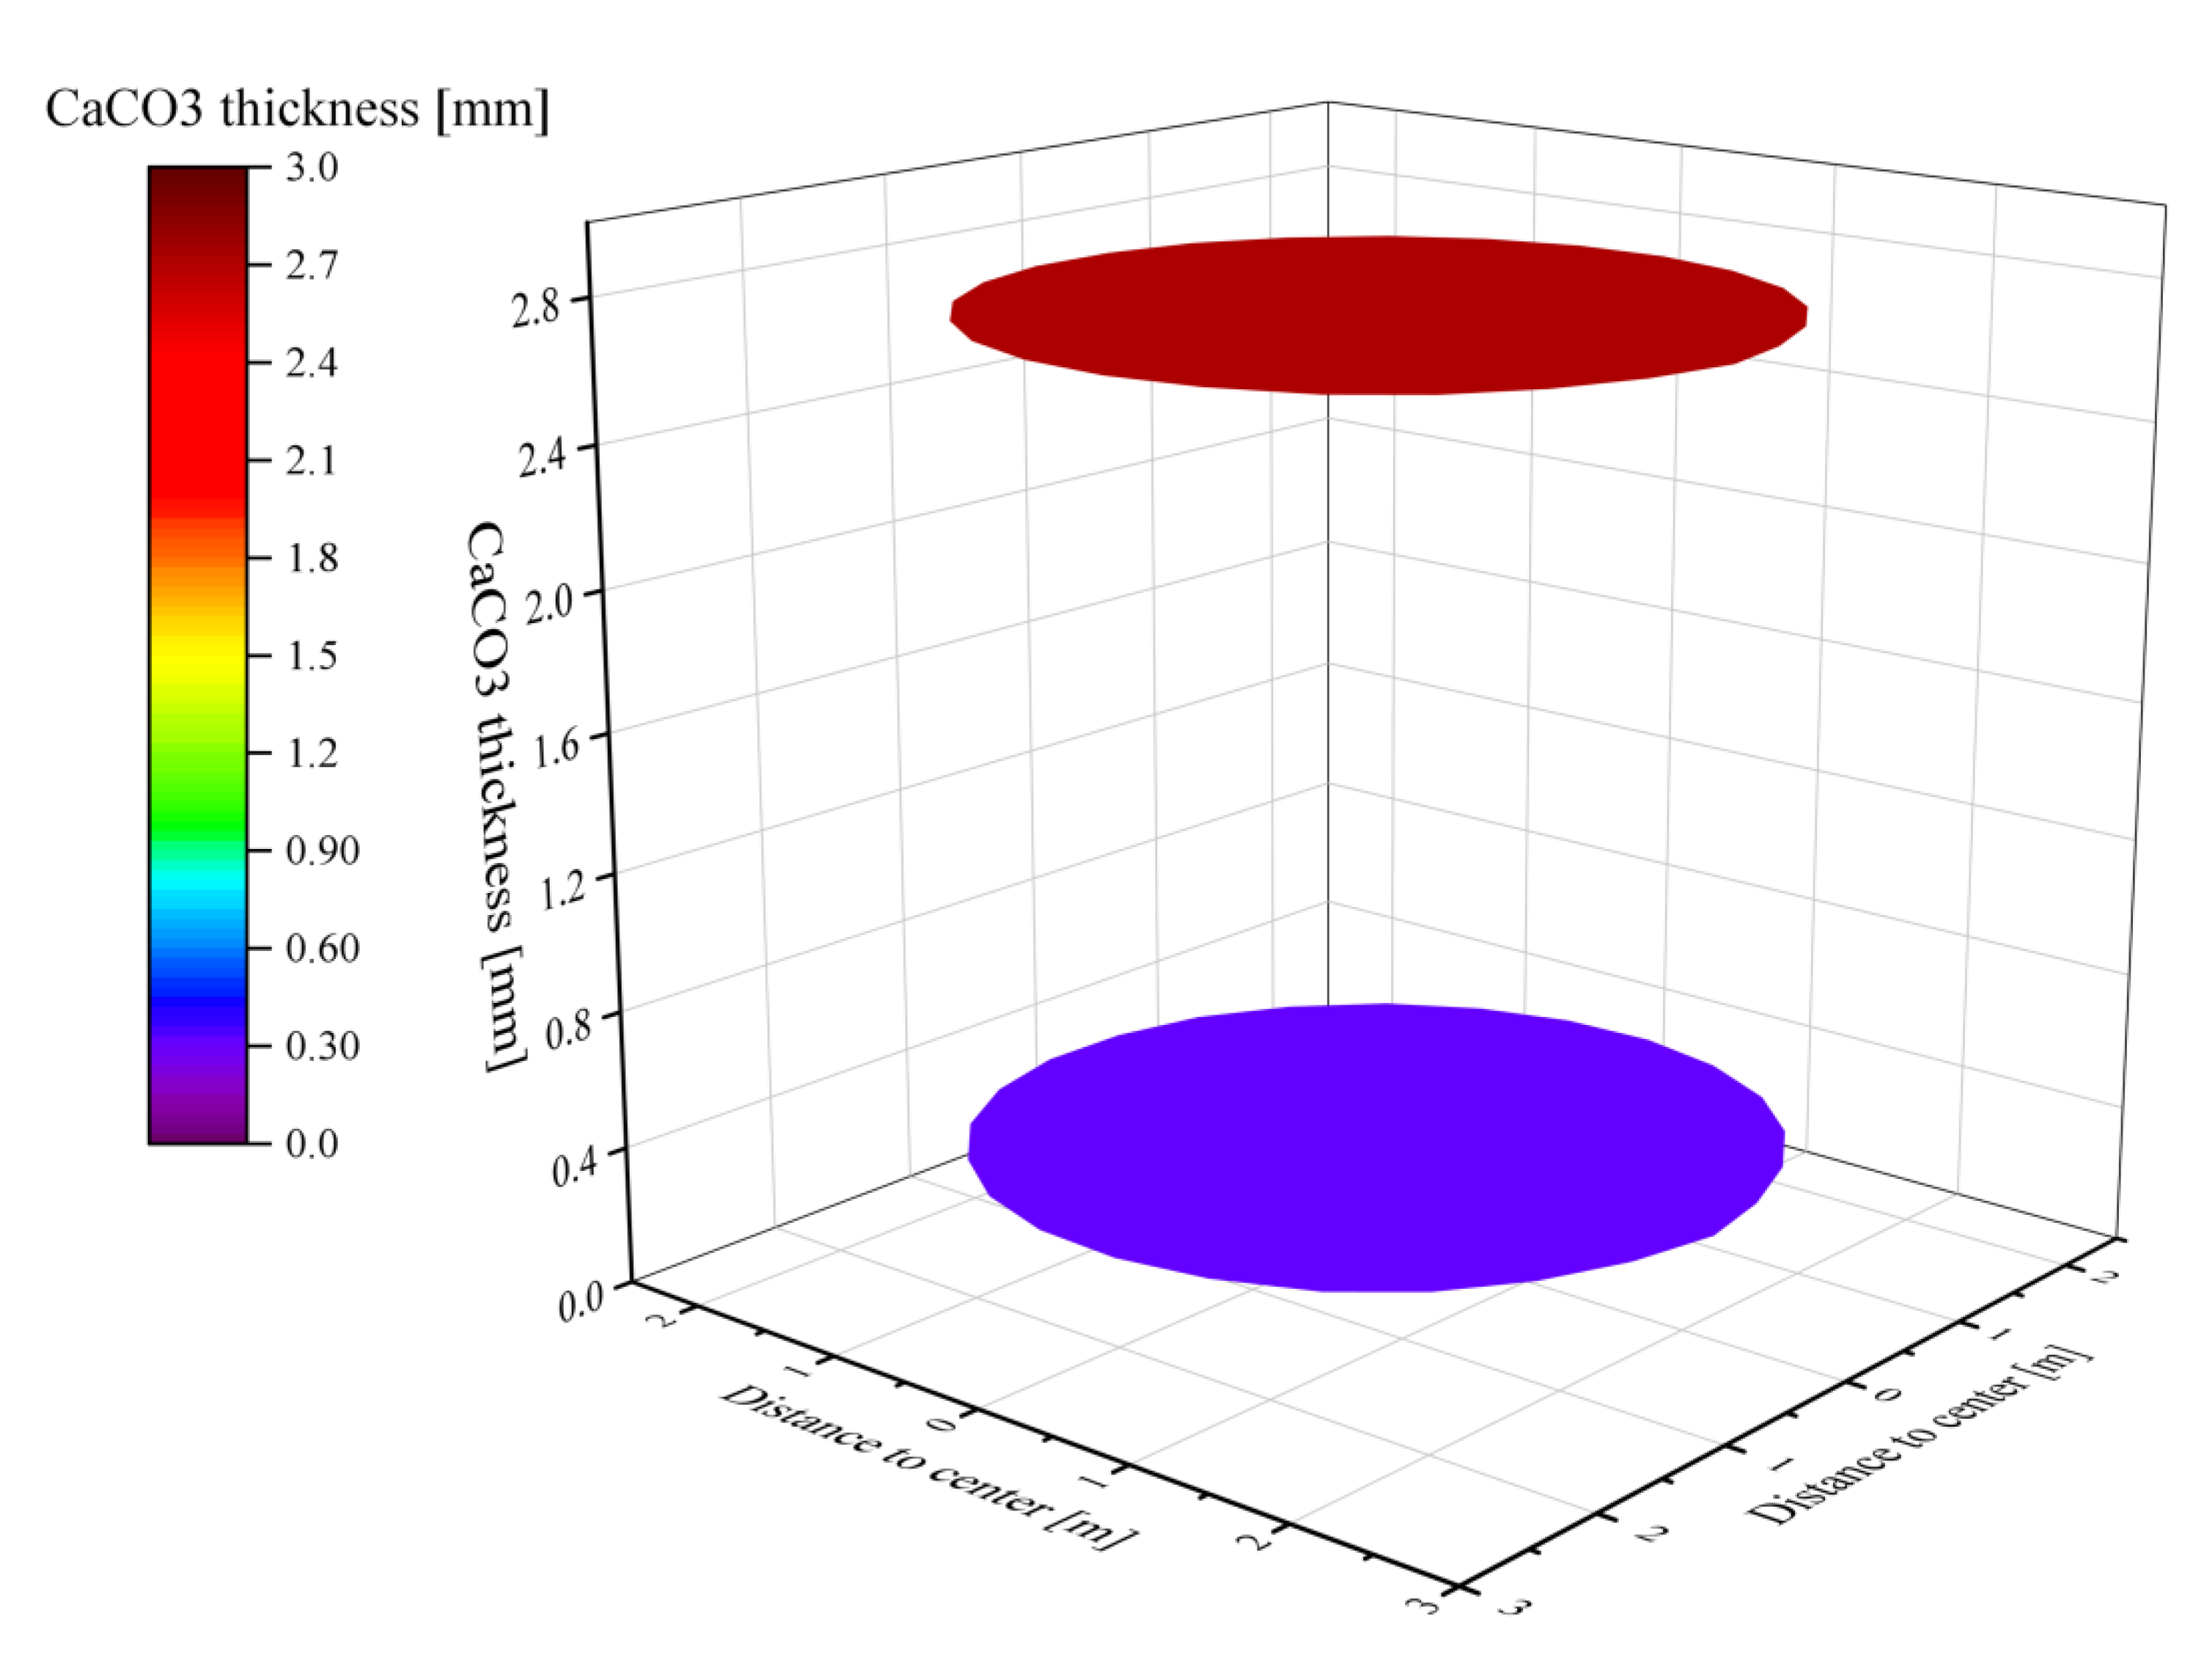
4.2. Temperature Field and Decomposition of Limestone with 40 mm and 80 mm
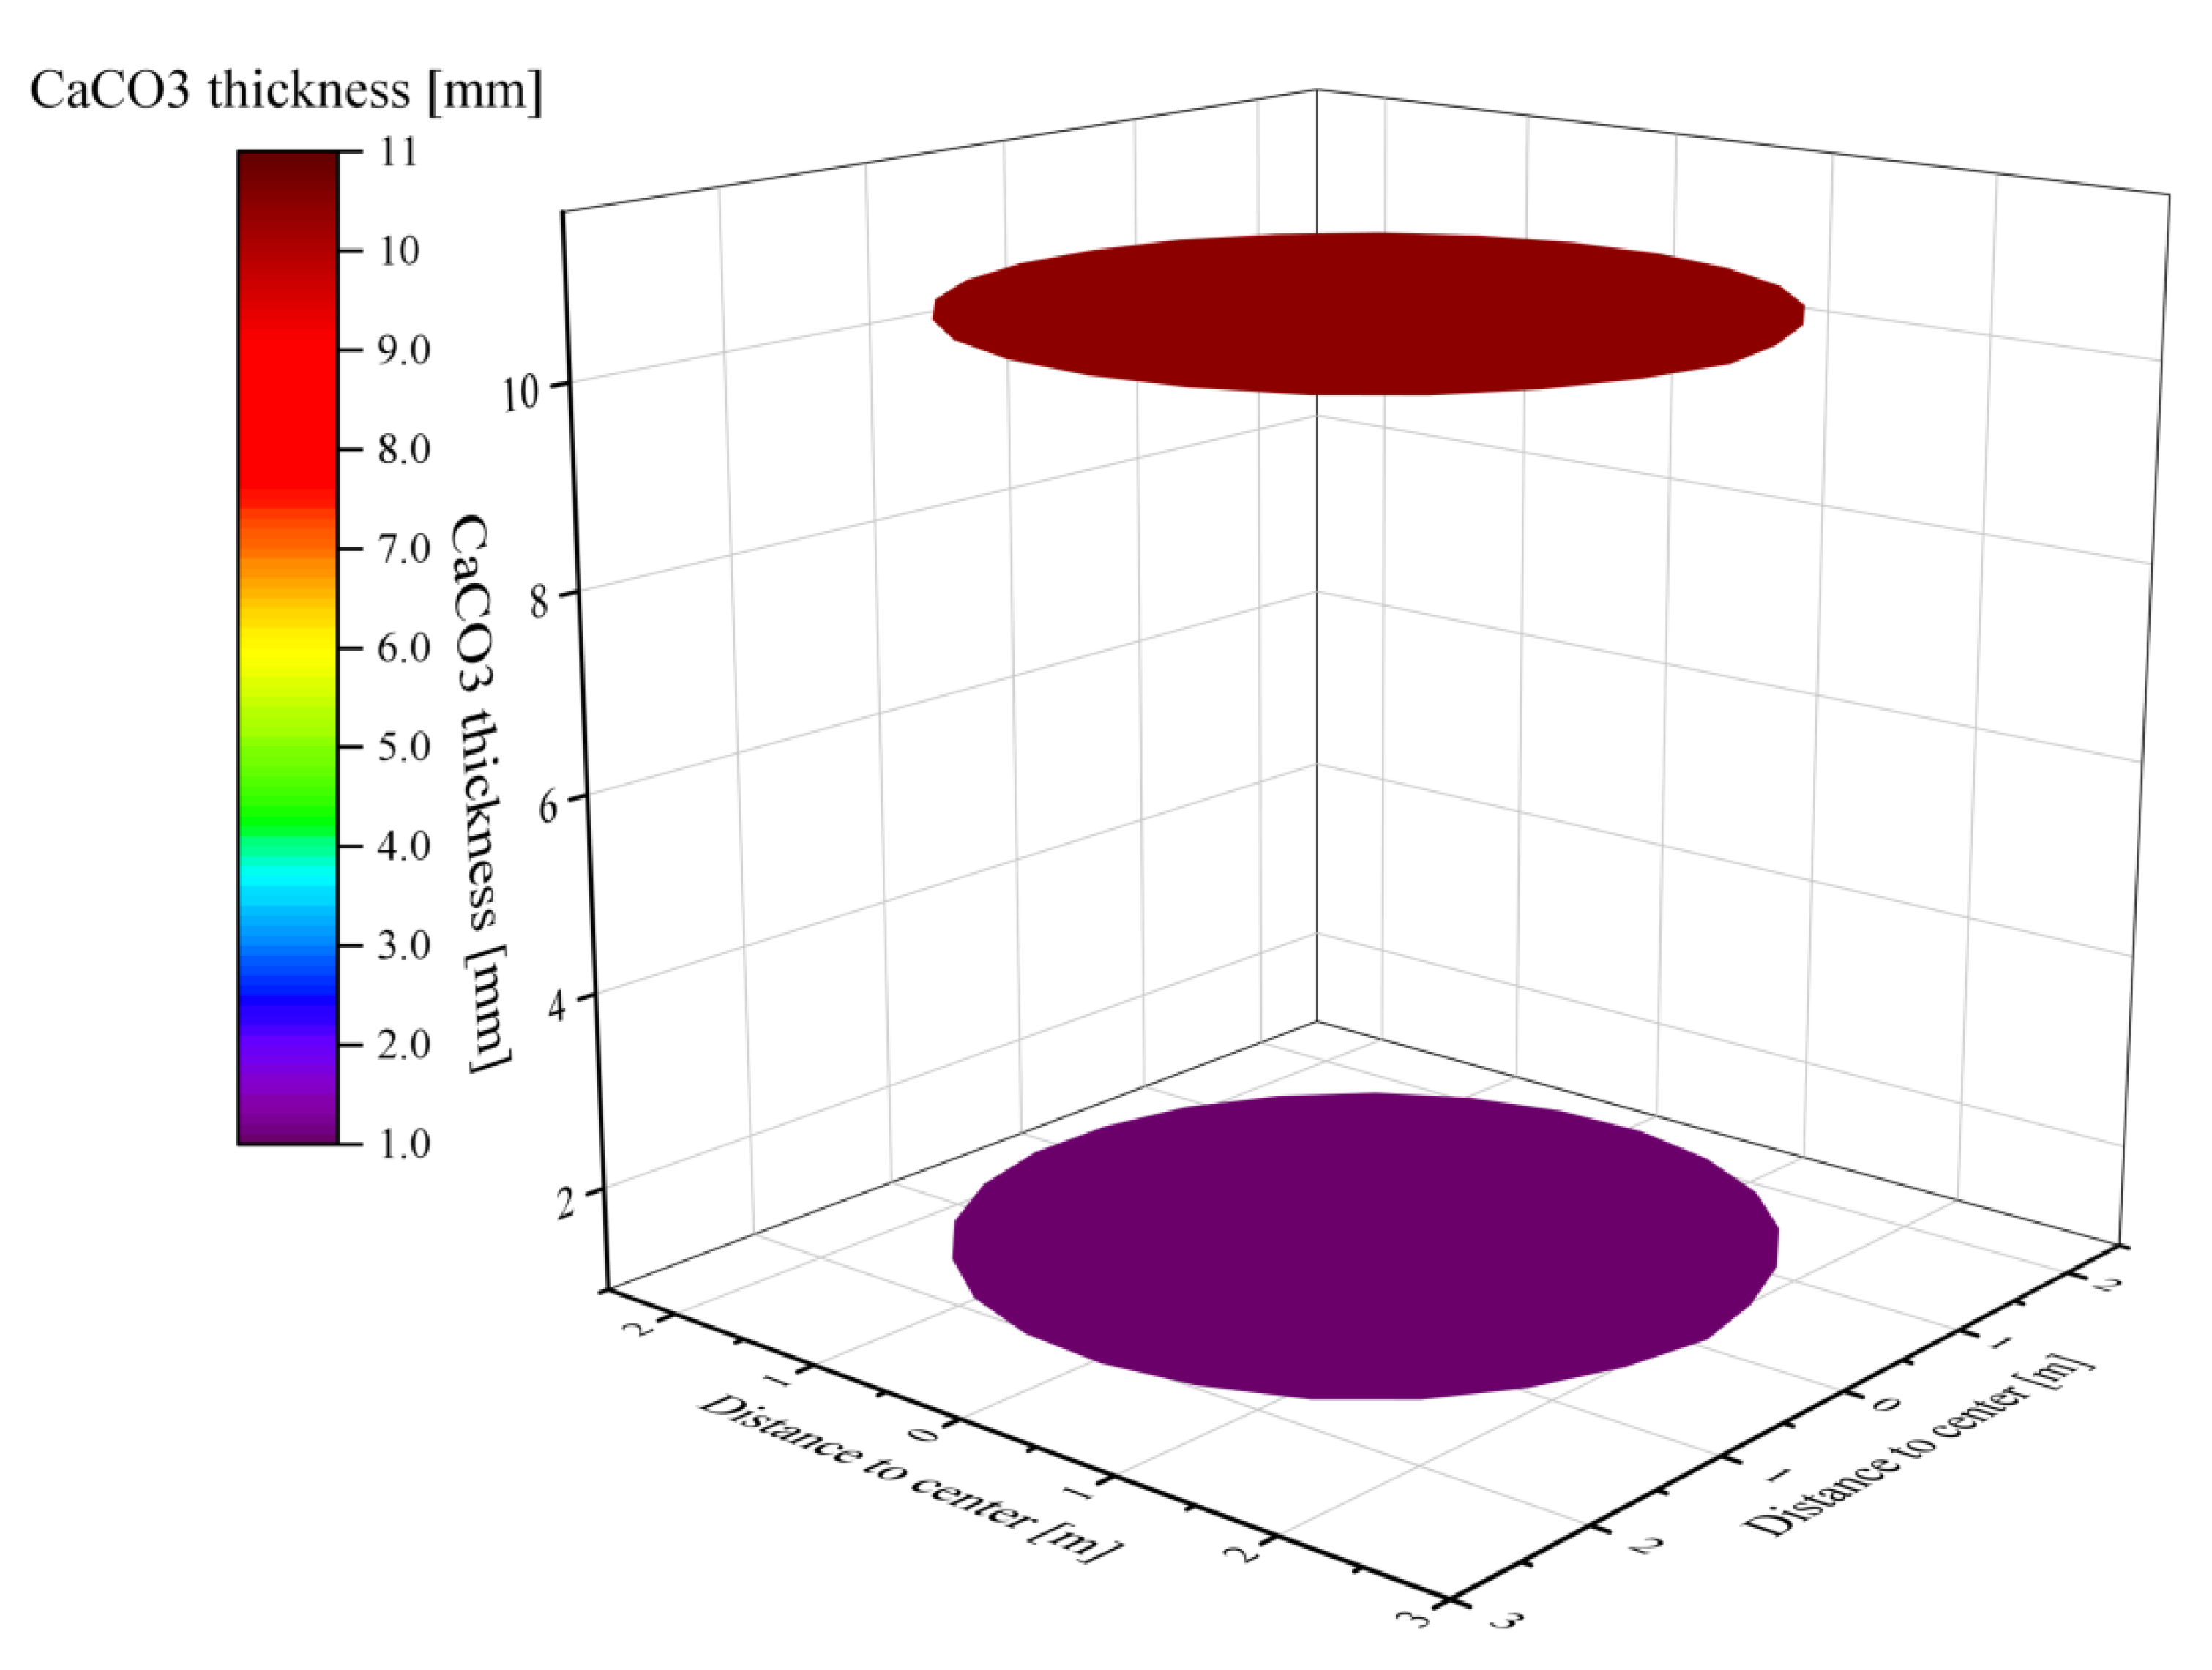
4.3. Temperature Field and Decomposition of Limestone with 40 mm and 120 mm
5. Conclusions
- (1)
- With the increasing void fraction, the resistance of the porous media region for the gas remains high, and the high-temperature fuel gas has less influence on the gas temperature field in the calcination zone.
- (2)
- Despite the large difference in specific surface area of limestone with different sizes, the difference in surface temperature under each size is smaller, the temperature is also regionally the same as the calcination zone extends downward.
- (3)
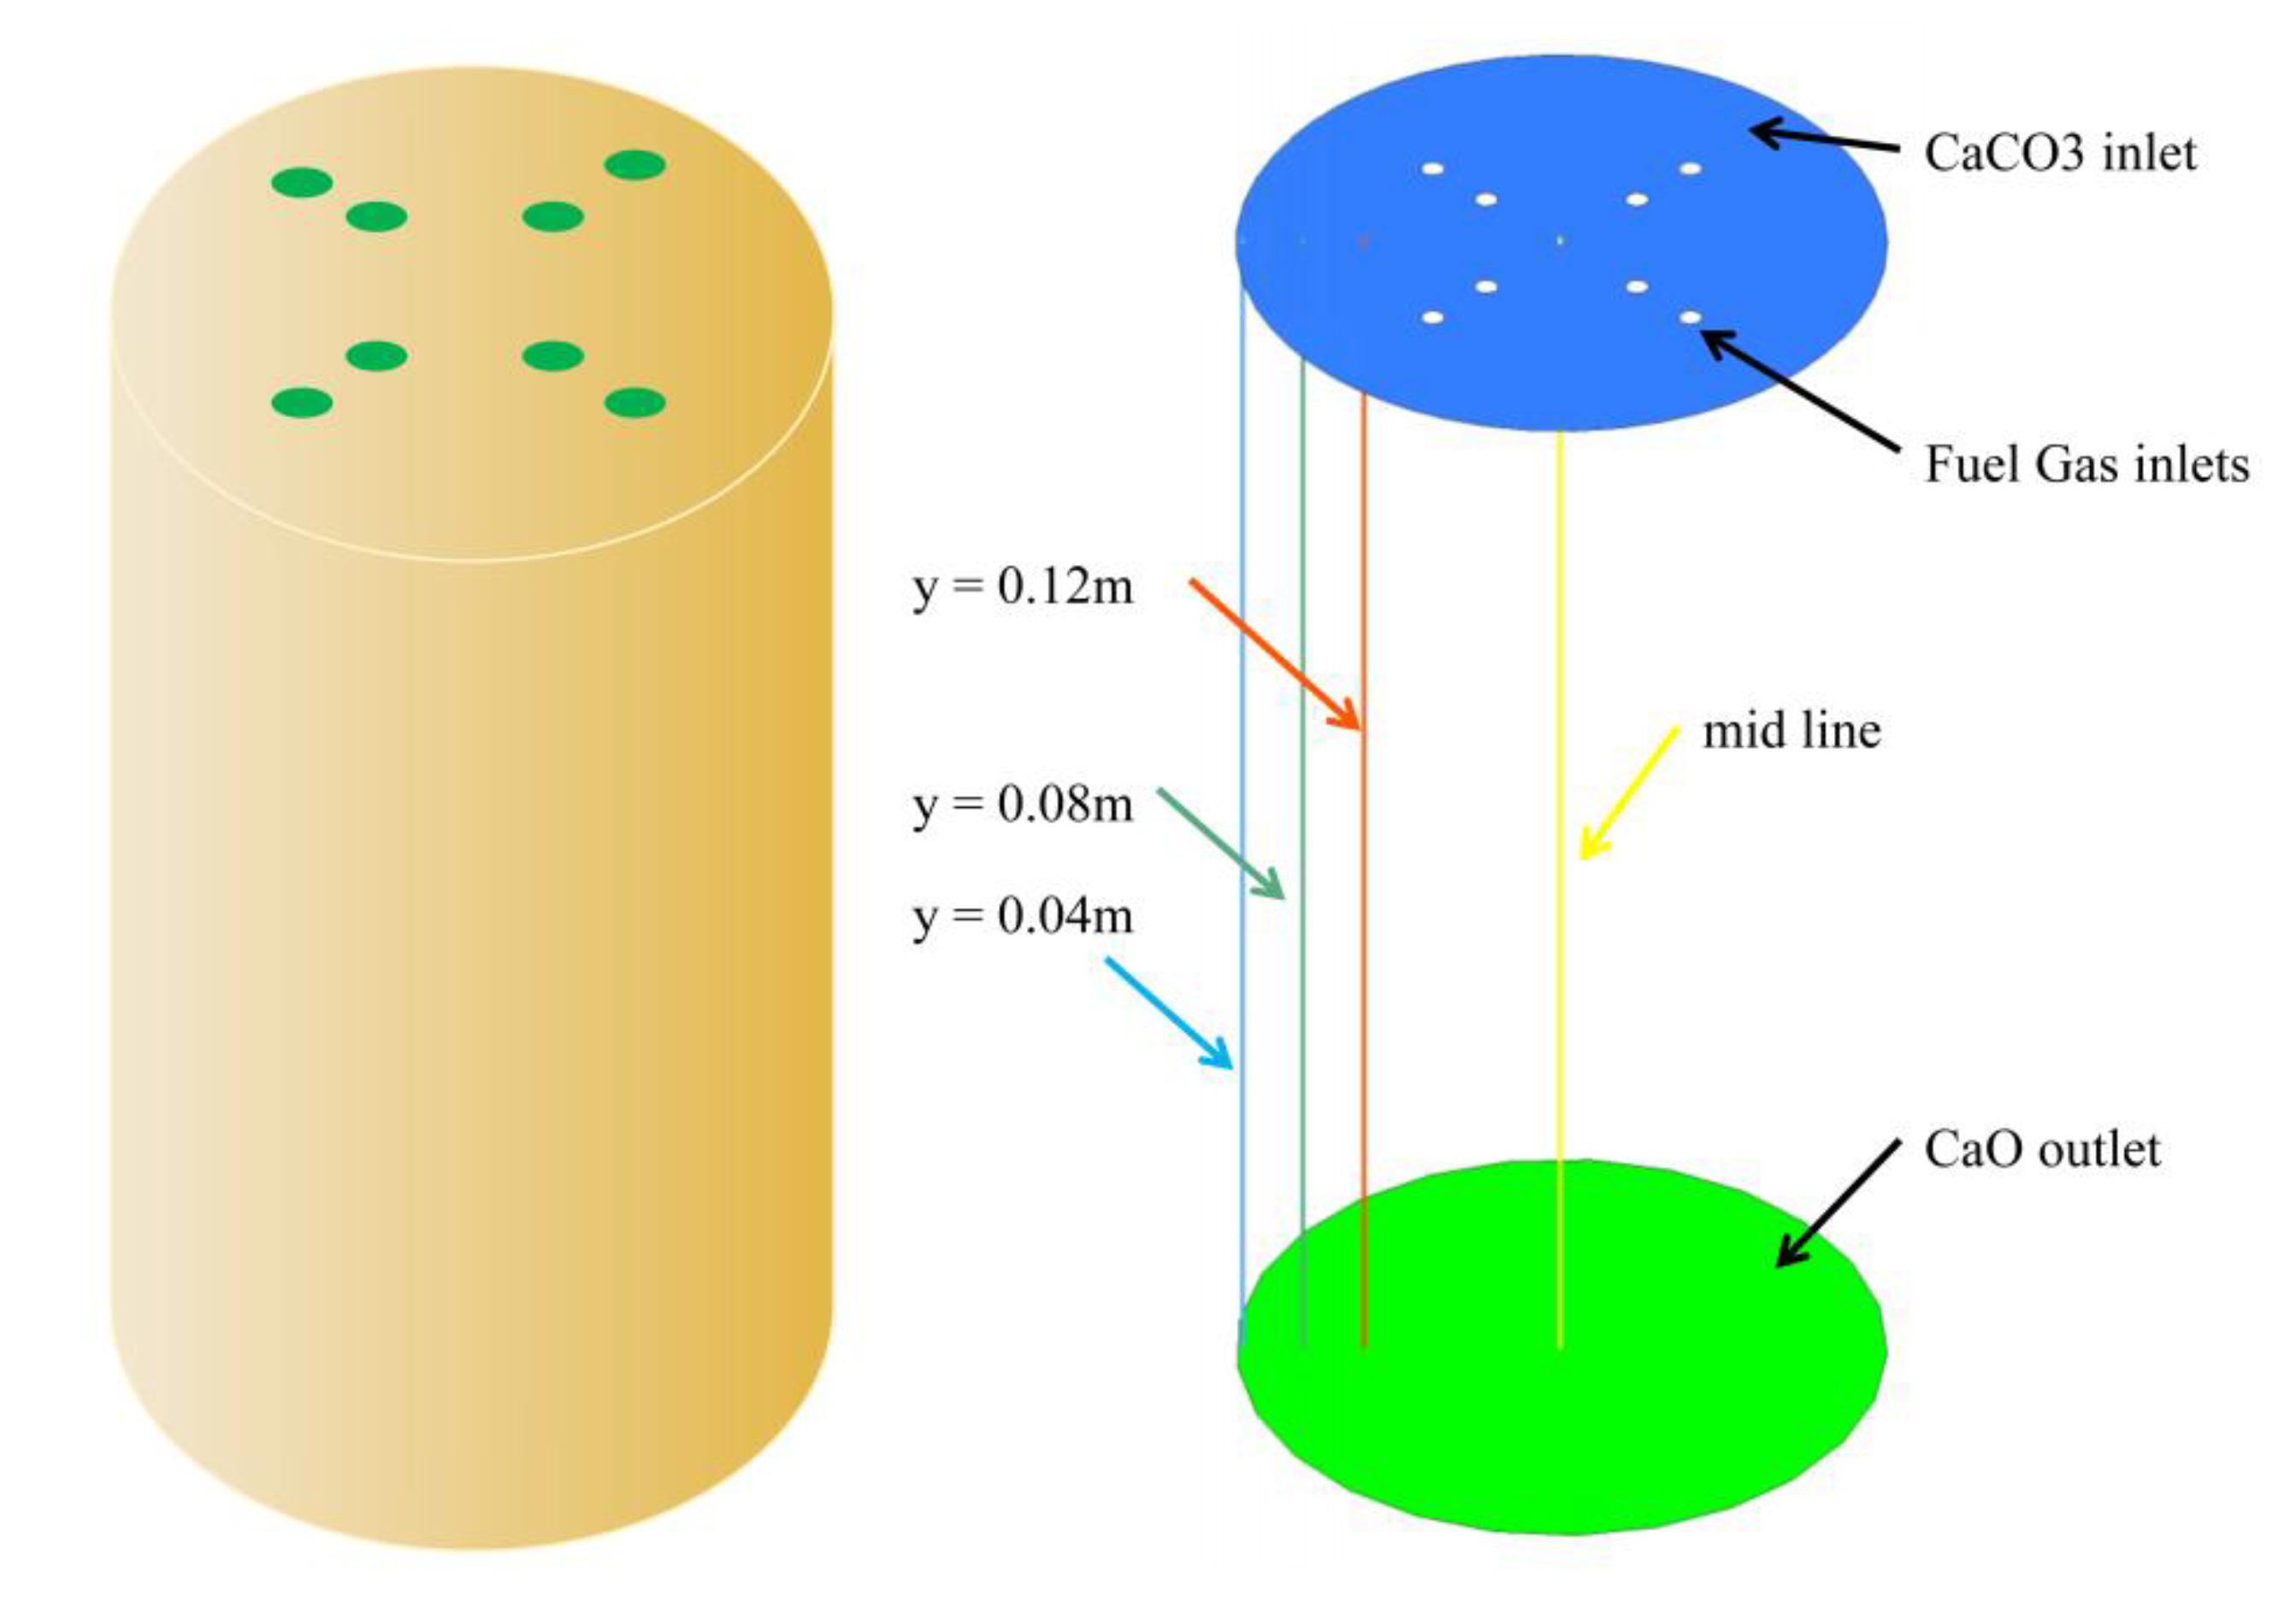
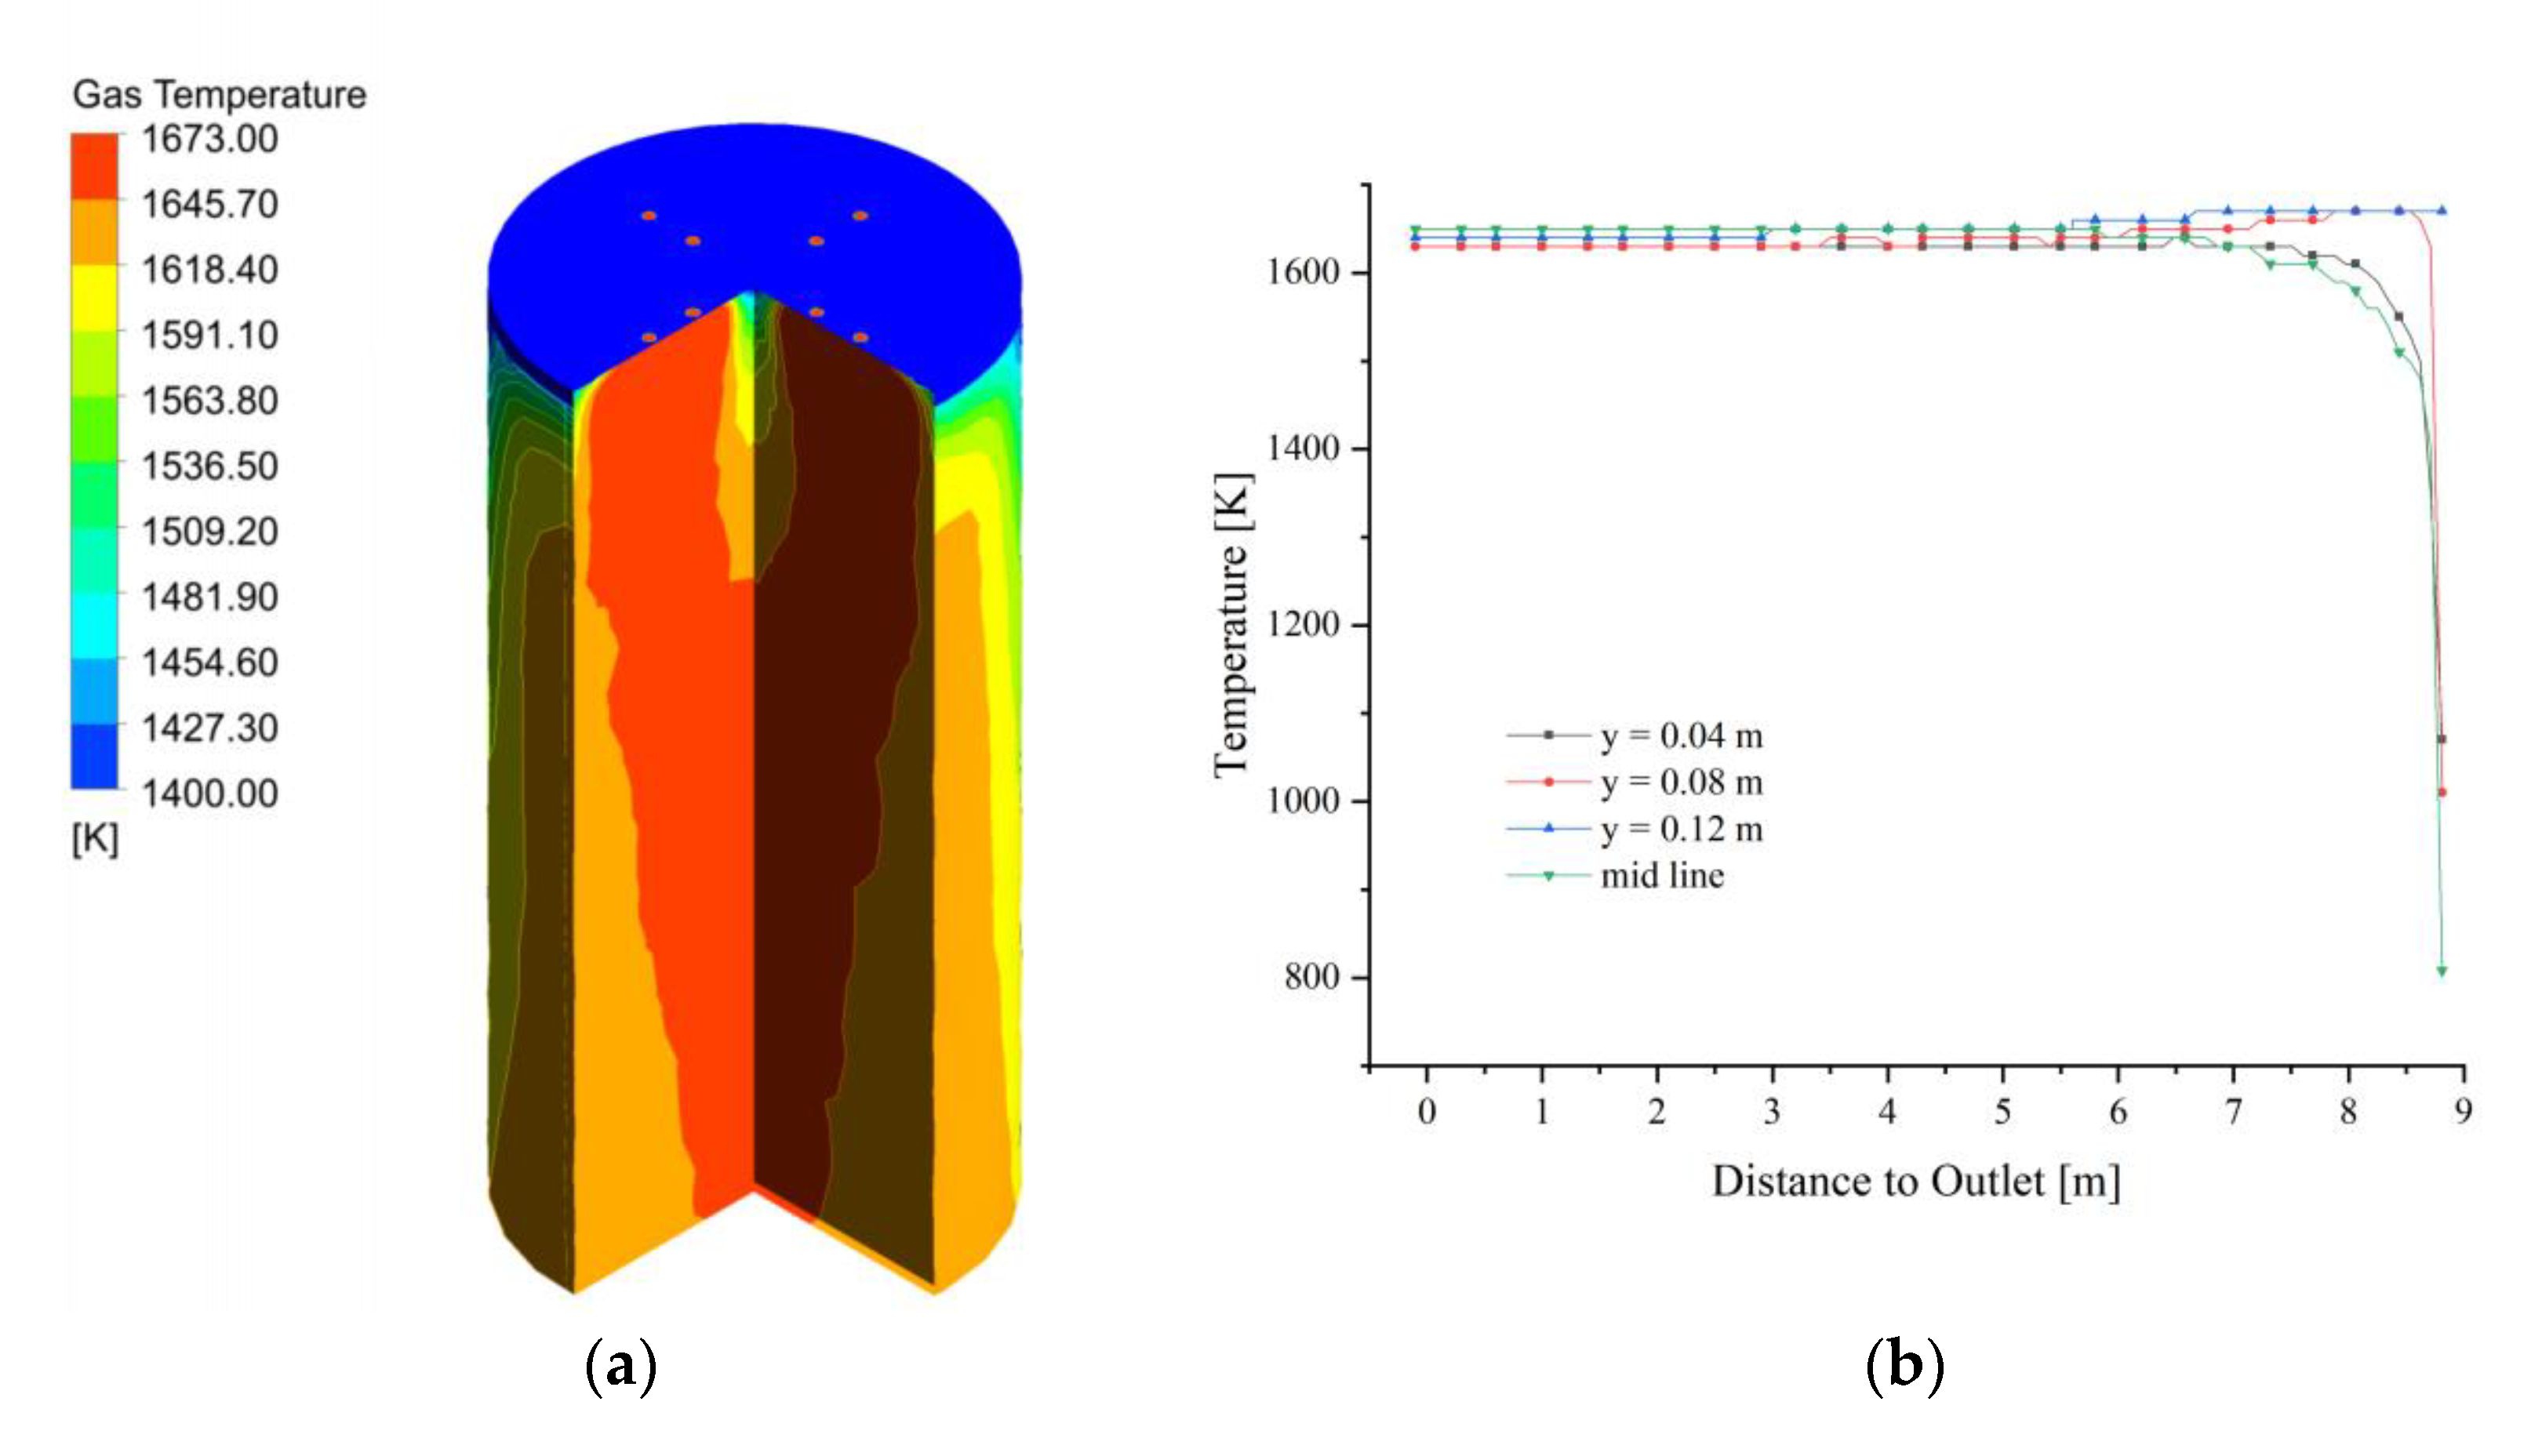
- The gas temperature and solid surface temperature gradually increased at y = 0.04 m, y = 0.08 m, and y = 0.12 m along the extension of the calcination zone and reached stability at about 7 m height. However, the temperature at y = 0.04 m, which is closest to the chamber wall, is always lower than that at y = 0.08 m and y = 0.12 m. The reason for this is, firstly, the distance from the fuel gas inlet, which is slightly less heated. The second reason is that the three locations (0.04 m, 0.08 m, and 0.12 m) are each interspersed with a limestone of 40 mm, and the thermal conductivity of limestone directly affects the temperature on the surface.
Author Contributions
Funding
Acknowledgments
Conflicts of Interest
Nomenclature
| ρg | Fluid density | ρi | Density of calcium carbonate |
| Dp | Diameter of the particles | ci | Specific heat capacity of calcium carbonate |
| α | Permeability in porous media | QD | Particle reaction rate |
| C2 | Inertial drag coefficient | ΔHR | Heat of decomposition of calcium carbonate(183,000 J/mol) |
| Relative molecular mass of calcium carbonate | Vp | Volume of individual particle | |
| Diameter of the internal core calcium carbonate | φCaO | Volume fraction of calcium oxide | |
| Density of the calcium carbonate | ρo | Density of calcium oxide | |
| RD | Limestone decomposition rate | co | Specific heat capacity of calcium oxide |
| kD | Reaction constants | Specific surface area of limestone | |
| Equilibrium partial pressure of carbon dioxide at the front of the reaction zone | heat transfer coefficient of gas solid two phase flow | ||
| CO2 partial pressure in the environment | σ | Stephen Boltzmann’s constant; 5.6697 × 10⁻⁸ W/(K4·m2) | |
| Average particle temperature | β | Radiation attenuation coefficient of porous media | |
| Temperature of internal core calcium carbonate | Nu | Nussel number | |
| Reaction rate correction factor | lZ | Stacked bed feature length | |
| Thermal conductivity of internal core calcium carbonate | Pr | Prandtl number | |
| Thermal conductivity of external core calcium oxide | Re | Reynolds number | |
| Calcium carbonate radius | Thermal diffusion coefficient | ||
| 1/2 calcium carbonate radius | Kinematic viscosity of gas | ||
| Calcium carbonate radius plus 1/2 calcium oxide layer radius | μ | Dynamic viscosity of gas | |
| Volume fraction of calcium carbonate | u | Velocity of gas movement |
References
- Senegačnik, A.; Oman, J.; Širok, B. Annular Shaft Kiln for Lime Burning with Kiln Gas Recirculation. Appl. Therm. Eng. 2008, 28, 785–792. [Google Scholar] [CrossRef]
- Bluhm-Drenhaus, T.; Simsek, E.; Wirtz, S.; Scherer, V. A Coupled Fluid Dynamic-discrete Element Simulation of Heat and Mass Transfer in a Lime Shaft Kiln. Chem. Eng. Sci. 2010, 65, 2821–2834. [Google Scholar] [CrossRef]
- George, P.A.O.; Gutiérrez, A.S.; Martínez, J.B.C.; Vandecasteele, C. Cleaner Production in A Small Lime Factory by Means of Process Control. J. Clean. Prod. 2010, 18, 1171–1176. [Google Scholar] [CrossRef]
- Gutiérrez, A.S.; Vandecasteele, C. Exergy-based Indicators to Evaluate the Possibilities to Reduce Fuel Consumption in Lime Production. Fuel Energy Abstr. 2011, 36, 2820–2827. [Google Scholar] [CrossRef]
- Deng, S.-X.; Xie, Q.-S.; Zhou, J.-M. A Lime Shaft Kiln Diagnostic Expert System Based on Holographic Monitoring and Real-time Simulation. Expert Syst. Appl. 2011, 38, 15400–15408. [Google Scholar] [CrossRef]
- Do, D.H.; Specht, E. Measurement and Simulation of Lime Calcination in Normal Shaft Kiln. Mater. Perform. Charact. 2012, 1, 1–14. [Google Scholar]
- Gutiérrez, A.S.; Martínez, J.B.C.; Vandecasteele, C. Energy and Exergy Assessments of a Lime Shaft Kiln. Appl. Therm. Eng. 2013, 51, 273–280. [Google Scholar] [CrossRef]
- Piringer, H. Lime Shaft Kilns. Energy Procedia 2017, 120, 75–95. [Google Scholar] [CrossRef]
- Krause, B.; Liedmann, B.; Wiese, J.; Bucher, P.; Wirtz, S.; Piringer, H.; Scherer, V. 3D-DEM-CFD Simulation of Heat and Mass Transfer, Gas Combustion and Calcination in an Intermittent Operating Lime Shaft Kiln. Int. J. Therm. Sci. 2017, 117, 121–135. [Google Scholar] [CrossRef]
- Mohammadpour, K. CFD Simulation of Reactive Flow in Lime Shaft Kilns Using Porous Media Model and Experimental Validation. Ph.D. Thesis, Otto-von-Guericke-Universität Magdeburg, Magdeburg, Germany, 2019. [Google Scholar]
- Hallak, B.; Specht, E.; Herz, F.; Gröpler, R.; Warnecke, G. Influence of Particle Size Distribution on the Limestone Decomposition in Single Shaft Kilns. Energy Procedia 2017, 120, 604–611. [Google Scholar] [CrossRef]
- Duan, S.; Li, B.; Rong, W. Study on Gas-Solid Heat Transfer and Decomposition Reaction of Calcination Process in an Annular Shaft Kiln Based on the Finite Volume Method. Processes 2022, 10, 648. [Google Scholar] [CrossRef]
- Duan, S.; Li, B.; Rong, W. Numerical Simulation Study of Gas-Solid Heat Transfer and Decomposition Processes of Limestone Calcined with Blast Furnace Gas in a Parallel Flow Regenerative Lime Kiln. Materials 2022, 15, 4024. [Google Scholar] [CrossRef]
- Kashyap, S.; Sarkar, J.; Kumar, A. Comparative performance analysis of different novel regenerative evaporative cooling device topologies. Appl. Therm. Eng. 2020, 176, 115474. [Google Scholar] [CrossRef]
- Garcia-Tenorio, C.; Wouwer, A.V.; Abbate, T.; Rijmenans, L. PFR Kiln Feature Selection for Modelling and Control. In Proceedings of the 2021 25th International Conference on System Theory, Control and Computing (ICSTCC), Iași, Romania, 20–23 October 2021. [Google Scholar]
- Orre, J.; Paananen, T.; Mattila, O. Modelling of the Lime Kiln at SSAB, Raahe. In Proceedings of the 61st SIMS Conference on Simulation and Modelling SIMS, Virtual, 22–24 September 2020. [Google Scholar]
- Jurtz, N.; Kraume, M.; Wehinger, G.D. Advances in fixed-bed reactor modeling using particle-resolved computational fluid dynamics (CFD). Rev. Chem. Eng. 2019, 35, 139–190. [Google Scholar] [CrossRef] [Green Version]
- Cheng, K.; Wang, Y.; Yang, Q. A Semi-resolved CFD-DEM Model for Seepage-induced Fine Particle Migration in Gap-graded Soils. Comput. Geotech. 2018, 100, 30–51. [Google Scholar] [CrossRef]
- Wu, H.; Gui, N.; Yang, X.; Tu, J.; Jiang, S. A Smoothed Void Fraction Method for CFD-DEM Simulation of Packed Pebble Beds with Particle Thermal Radiation. Int. J. Heat Mass Transf. 2018, 118, 275–288. [Google Scholar] [CrossRef]
- Shimada, R.; Kono, T.; Masuda, K.; Komoda, Y. The Numerical Analysis of Particle-size Distribution of Clusters in Shear Flow at One-dimensional Closed System and Three-dimensional Open System. Adv. Powder Technol. 2019, 30, 774–785. [Google Scholar] [CrossRef]
- Zhao, H.; Fei, X.; Zhang, B.; Zhao, S.; Li, G.; Cao, L. Controlling the Size of Fragrance Microcapsules Using Designed Agitator Paddles: Experiment and CFD Simulation. Particuology 2019, 43, 38–45. [Google Scholar] [CrossRef]
- Nagata, Y.; Minagawa, M.; Hisatomi, S.; Tsunazawa, Y.; Okuyama, K.; Iwamoto, M.; Sekine, Y.; Tokoro, C. Investigation of Optimum Design for Nanoparticle Dispersion in Centrifugal Bead Mill Using DEM-CFD Simulation. Adv. Powder Technol. 2019, 30, 1034–1042. [Google Scholar] [CrossRef]
- Ghaffari, M.; Hoffmann, A.C.; Skjold, T.; Eckhoff, R.K.; van Wingerden, K. A Brief Review on The Effect of Particle Size on The Laminar Burning Velocity of Flammable Dust: Application in A CFD Tool for Industrial Applications. J. Loss Prev. Process Ind. 2019, 62, 103929. [Google Scholar] [CrossRef]
- Ergun, S. Fluid Flow Through Packed Column. J. Mater. Sci. Chem. Eng. 1952, 48, 89–94. [Google Scholar]
- Lu, Z. Calculation of Effective Thermal Conductivity of Foam Porous Media. J. Nanjing Univ. Sci. Technol. 2001, 118, 257–261. [Google Scholar]
- Zhu, L.; Bai, J.; Qiao, B. Calculation of Convective Heat Transfer for Active Limes Pre-heater. Metall. Equip. 2012, 6, 6–8. [Google Scholar]


| Calculation Conditions | Value | Unit |
|---|---|---|
| Fuel gas inlet velocity | 20 | m/s |
| Fuel gas inlet temperature | 1673 | K |
| Fuel gas nozzle diameter (8) | 70 | mm |
| Cooling air inlet velocity | 10 | m/s |
| Cooling air inlet temperature | 300 | K |
| Cooling air inlet diameter | 1000 | mm |
| Material movement speed | 1.54 | m/h |
| Initial temperature of material (limestone) | 300 | K |
| Average diameter of material | 40, 80, 120 | mm |
| Calcium carbonate density | 3310 | kg/m3 |
| Calcium oxide density | 2810 | kg/m3 |
| Calcium carbonate thermal conductivity | 2.26 | W/m·k |
| Calcium oxide thermal conductivity | 0.07 | W/m·k |
| Calcium carbonate decomposition temperature | 1073 | K |
| Void fraction | 0.36, 0.41, 0.46 | - |
Publisher’s Note: MDPI stays neutral with regard to jurisdictional claims in published maps and institutional affiliations. |
© 2022 by the authors. Licensee MDPI, Basel, Switzerland. This article is an open access article distributed under the terms and conditions of the Creative Commons Attribution (CC BY) license (https://creativecommons.org/licenses/by/4.0/).
Share and Cite
Duan, S.; Li, B.; Rong, W. Numerical Simulation Study of Mixed Particle Size Calcination Processes in the Calcination Zone of a Parallel Flow Regenerative Lime Kiln. Materials 2022, 15, 4609. https://0-doi-org.brum.beds.ac.uk/10.3390/ma15134609
Duan S, Li B, Rong W. Numerical Simulation Study of Mixed Particle Size Calcination Processes in the Calcination Zone of a Parallel Flow Regenerative Lime Kiln. Materials. 2022; 15(13):4609. https://0-doi-org.brum.beds.ac.uk/10.3390/ma15134609
Chicago/Turabian StyleDuan, Shaopei, Baokuan Li, and Wenjie Rong. 2022. "Numerical Simulation Study of Mixed Particle Size Calcination Processes in the Calcination Zone of a Parallel Flow Regenerative Lime Kiln" Materials 15, no. 13: 4609. https://0-doi-org.brum.beds.ac.uk/10.3390/ma15134609