
Study on Oxygen Evolution Reaction Performance of Jarosite/C Composites

Department of Materials Science and Engineering, Guilin University of Technology, Guilin 541000, China
*
Authors to whom correspondence should be addressed.
†
These authors contributed equally to this work.
Materials 2022, 15(2), 668; https://0-doi-org.brum.beds.ac.uk/10.3390/ma15020668
Submission received: 30 November 2021
/
Revised: 30 December 2021
/
Accepted: 11 January 2022
/
Published: 17 January 2022
(This article belongs to the Topic Electromaterials for Environment & Energy)
Abstract
:In the electrolysis of water process, hydrogen is produced and the anodic oxygen evolution reaction (OER) dominates the reaction rate of the entire process. Currently, OER catalysts mostly consist of noble metal (NM) catalysts, which cannot be applied in industries due to the high price. It is of great importance to developing low-cost catalysts materials as NM materials substitution. In this work, jarosite (AFe3(SO4)2(OH)6, A = K+, Na+, NH4+, H3O+) was synthesized by a one-step method, and its OER catalytic performance was studied using catalytic slurry (the weight ratios of jarosite and conductive carbon black are 2:1, 1:1 and 1:2). Microstructures and functional groups of synthesized material were analyzed using XRD, SEM, FI-IR, etc. The OER catalytic performance of (NH4)Fe3(SO4)2(OH)6/conductive carbon black were examined by LSV, Tafel, EIS, ECSA, etc. The study found that the OER has the best catalytic performance when the weight ratio of (NH4)Fe3(SO4)2(OH)6 to conductive carbon black is 2:1. It requires only 376 mV overpotential to generate current densities of 10 mA cm−2 with a small Tafel slope (82.42 mV dec−1) and large Cdl value (26.17 mF cm−2).
1. Introduction
With the increasingly negative impact of fossil fuels on the environment, it is with a huge demand that modern science and technology need to pursue clean and sustainable energy [1,2]. Hydrogen production by water splitting, as a technology for producing clean energy, has caused extensive researches [3,4]. The electrochemical water splitting process includes the oxygen evolution reaction (OER) at the anode and the hydrogen evolution reaction (HER) at the cathode. The HER reaction is a two-electron transfer process, while OER is a four-electron transfer process, whose higher energy barrier dominates the rate of the cathodic hydrogen production [5]. Therefore, the development and research of cost-effective OER catalysts with high activity and long-periodic cycle stability is a primary task.
Noble-metal-based materials, including IrO2 and RuO2, are state-of-the-art OER electrocatalysts because of their high electrocatalytic OER activity both in alkaline and acidic solutions [6,7,8]. However, the large-scale application of IrO2 and RuO2 in OER is severely limited not only by the high cost but also by the scarcity of Ir and Ru [9]. Thus far, considerable research efforts have been devoted to the exploration of low-cost and highly active noble-metal-free catalysts to replace expensive and scarce precious catalysts [10,11,12]. Especially for transition metal Fe-based materials, including oxides/hydroxides [13,14,15], chalcogenides [16], phosphides [16,17], and nitrides [18], which have been investigated extensively as promising candidates for the OER.
Compared with these compounds, Fe-based polyanionic compounds [1,2,3,4], such as jarosite, are an earth-abundant natural mineral that belongs to the alunite supergroup with the formula AFe3(SO4)2(OH)6, where A represents different monovalent cations, such as K+, Na+, NH4+, and H3O+. At present, jarosite has been extensively studied by the acid leach mining industry due to the precipitation of jarosite in acidic media—a crucial step that allows for the physical separation of Fe3+ and other cations from the leach solution [19,20,21,22,23]. As a result, these refining plants produce large amounts of environmentally hazardous jarosite wastes that currently provide no commercial value. Fortunately, several researchers have explored the use of jarosite as a cathode in the lithium and sodium-ion battery [24,25,26]. According to our best efforts, there is no research on jarosite in OER so far. Therefore, exploring and tapping the potential of these environmentally harmful jarosite wastes in the field of OER is an attractive strategy to provide economic advantages for jarosite.
In this work, the design of applying jarosite to OER catalytic material is proposed. A simple one-step method was used to synthesize four various types of jarosite materials ((NaFe3(SO4)2(OH)6), KFe3(SO4)2(OH)6), (NH4)Fe3(SO4)2(OH)6, and ((H3O)Fe3(SO4)2(OH)6)). We explored the OER performance of these four catalysts under acidic, neutral and alkaline conditions. The electrochemical test results suggest that (NH4)Fe3(SO4)2(OH)6 shows the best OER activity among the four catalysts. When the weight ratio of (NH4)Fe3(SO4)2(OH)6 to conductive carbon black is 2:1, the overpotential of (NH4)Fe3(SO4)2(OH)6 is 376 mV at a current density of 10 mA cm−2 in alkaline conditions. Although this performance is not comparable to that of precious metals (IrO2), there is a lot of room to improve the performance, which is our future research task. In short, exploring the application of jarosite waste in OER can not only protect the environment but also improve its economic value.
2. Experimental Section
2.1. Materials
Fe(SO4)∙7H2O (99.0~101.0%), K2CO3 (99%), Na2CO3 (99.8%), (NH4)2SO4 (98.0%), NH3∙7H2O (25.0~28.0%) and C2H5OH (99.7%) were purchased from Guangxi Dragon Technology Company (Guangxi, China). Conductive carbon black (Ketjenblack) and Nafion solution (5 wt%) were purchased from Suzhou Yilongsheng Energy Technology Co., Ltd. (Suzhou, China) All chemicals used were of analytical grade and there was no need to further purification.
2.2. Preparation of (A)Fe3(SO4)2(OH)6, (A = K+, Na+ and NH4+)
FeSO4 and (NH4)2SO4 were dissolved in 250 mL and 100 mL of deionized water to form solution A (0.02 M FeSO4) and solution B (0.5 M (NH4)2SO4), respectively. Dilute H2O2 solution was added dropwise to solution A to oxidize Fe2+ to Fe3+ and then solution B was injected into the above solution with a water bath at a constant temperature of 95 °C and stirred magnetically for 3 h, meanwhile, the pH value of the mixed solution was maintained throughout at 1.5–2.0 with 1 M ammonia solution. Finally, the yellow precipitate (NH4)Fe3(SO4)2(OH)6 catalyst was collected, washed with deionized water and then dried in a vacuum at 80 °C. The main synthesis procedure for Na/KFe3(SO4)2(OH)6 is similar to that for (NH4)Fe3(SO4)2(OH)6, corresponding to the use of 0.5 M Na2CO3 and K2CO3 instead of 0.5 M (NH4)2SO4 solution and the replacement of the pH adjuster with 1 M Na2CO3 and K2CO3 solution, respectively.
2.3. Preparation of (H2O)Fe3(SO4)2(OH)6
A certain amount of FeSO4 was dispersed in 70 mL of deionized water, with stirring at 95 °C. H2O2 was used to oxidize Fe2+ to Fe3+. After it was completely oxidized, the reactants were transferred to a 100 mL reactor at 120 °C and kept for 12 h. The final product was collected after filtration and washed with deionized water several times.
2.4. Preparation of Working Electrode
Add 10 mg NH4-Fe3@KB-1((NH4)Fe3(SO4)2(OH)6 and conductive carbon black with a mass ratio of 2:1). These were dispersed into a mixed solvent of Nafion (30 µL), anhydrous ethanol (400 µL) and deionized water (600 µL). Form a uniform dispersion after ultrasonic for 30 min, then use a pipette gun to take the dispersion (4 µL), add to the glassy carbon electrode and dry. The working electrodes of other catalytic materials are prepared by using the same method.
2.5. Characterization
Scanning electron microscopy (SEM, Hitachi Works, Ltd., Tokyo, Japan) was conducted on S-4800 at 5 kV to perform microstructure analysis. The phase structure of the sample was analyzed by a X-ray powder diffractometer (XRD, X’Pert PRO, PANalytical B.V, Cu Kα, 40 kV, 40 mA, λ = 1.54056 Å, PANalytical B.V., Almelo, The Netherlands) at a scanning rate of 5°∙min−1. The functional groups of the samples were analyzed by Fourier transform infrared (FTIR, Thermo Nexus 407 spectrometer, White Bear Lake, MN, USA) and the laser Raman confocal microscope Raman spectrometer (Raman, Thermo Fisher Scientific DXR, thermoelectric company, 532 nm, White Bear Lake, MN, USA). Transmission electron microscopy (TEM, JEOL, Beijing, China) images were collected on Titan G260-300 at an acceleration voltage of 200 kV. Before BET and BJH measured via Surface area and pore porosimetry analyzer NoVA 1200e (Quantachrome Instruments, Shanghai, China), all samples were degassed for 5 h at 100 °C.
2.6. Electrochemical Measurements
All electrochemical measurements were conducted on a computer-controlled CHI 760E electrochemical workstation with a conventional three-electrode system. The glassy carbon electrode with a diameter of 3 mm was used as a working electrode, Ag/AgCl electrode and Hg/HgO electrode were respectively used as the reference electrode for the acidic (neutral) system and alkaline system, and graphite rods were used as a counter electrode. The measurements were performed in three different electrolytes, 0.05 M H2SO4, 1 M KOH, and 1 M PBS. All the potentials were converted to reversible hydrogen electrode (RHE) based on the formula ERHE = EHg/HgO + 0.0591 × pH + 0.098 and ERHE = EAg/AgCl + 0.0591 × pH + 0.1976. The polarization curves were measured at 5 mV s−1 and iR-corrected. Tafel plots were calculated using the Tafel formula η = b log j + a, where j is the current density, b is the Tafel slope, and a is the intercept relative to the exchange current density. EIS measurements were conducted under a particular applied potential in the frequency range 0.1 Hz to 100 kHz. The electrochemically active surface area (ECSA) was estimated by the double-layer capacitance (Cdl). The time-current curve was measured at a fixed voltage corresponding to 10 mA cm−2 of current density. All tests were performed at room temperature.
3. Results and Discussion
3.1. Characterization of Samples
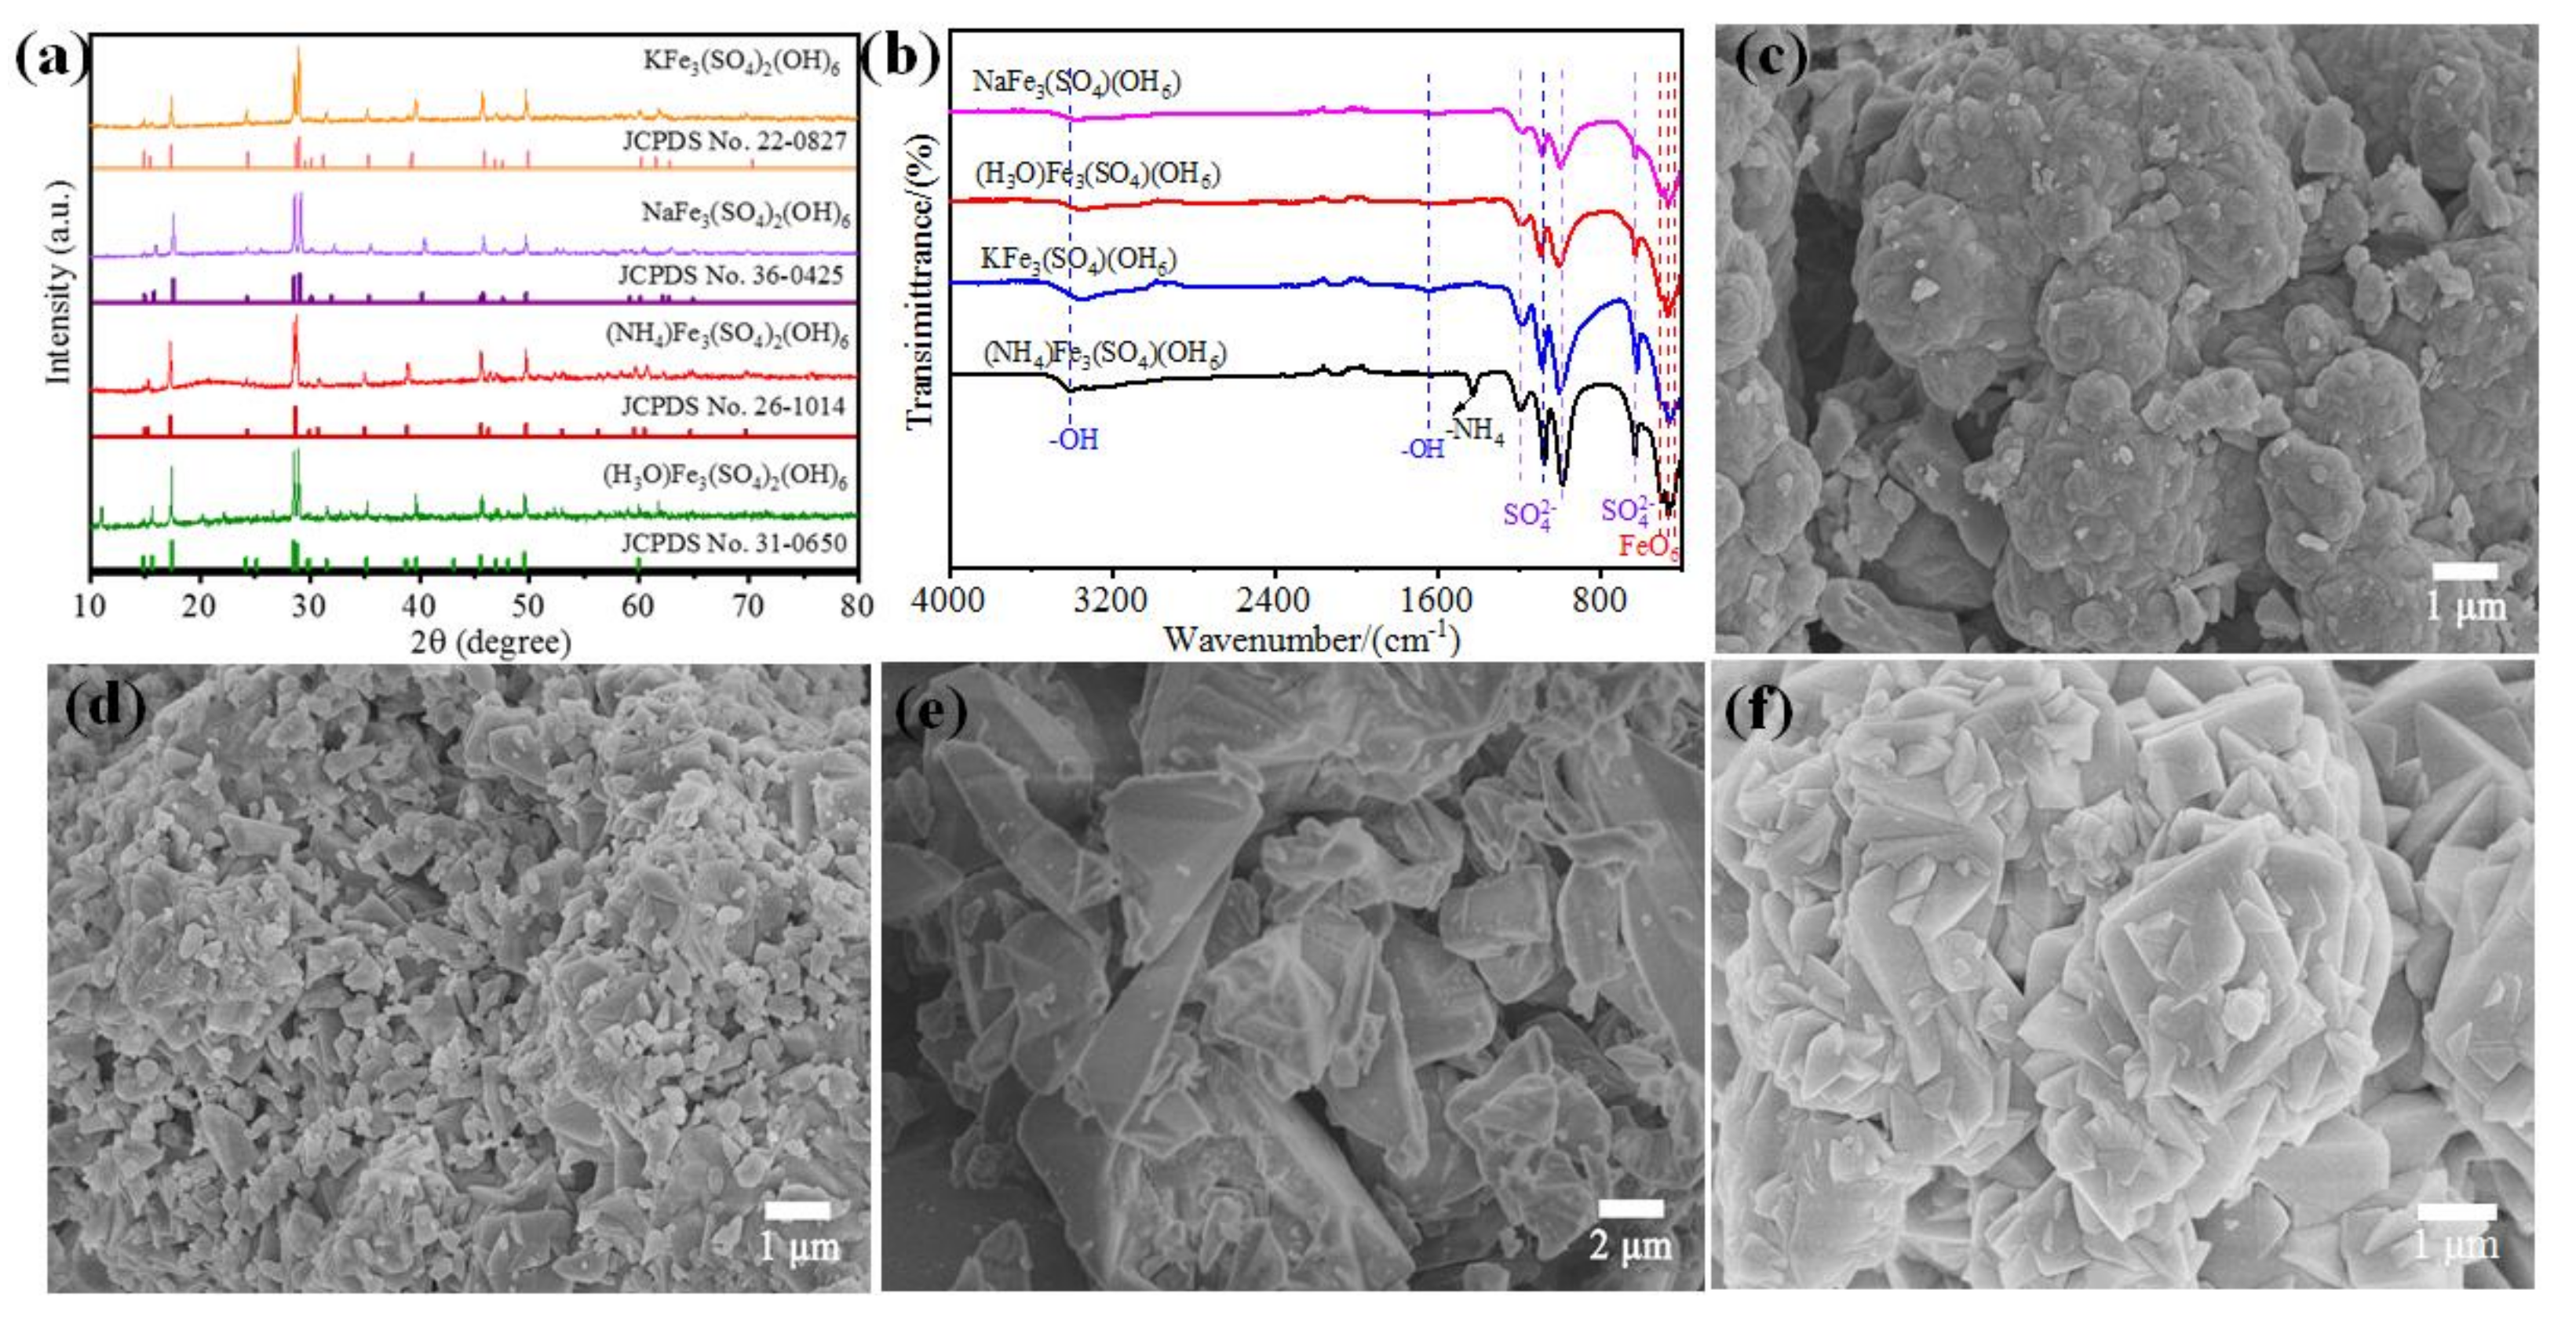
Four various types of jarosite were synthesized, named NaFe3(SO4)2(OH), KFe3(SO4)2(OH)6, (NH4)Fe3(SO4)2(OH)6 and (H3O)Fe3(SO4)2(OH)6, respectively. The crystal structure of various types of jarosite was firstly investigated by X-ray diffraction (XRD). As shown in Figure 1a, the diffraction pattern of the as-prepared jarosite can be indexed to the hexagonal system with a space group of R3m, suggesting the successful preparation of the jarosite samples.
Figure 1b shows the infrared spectrum test chart of the jarosite. The infrared absorption peaks of different jarosite appear at similar positions. The peaks appearing at 469 cm−1 and 502 cm−1 are Fe-O peaks. The corresponding peaks at 624 cm−1, 1082 cm−1, and 1204 cm−1 are SO42−. The broad and strong absorption peaks at 1004 cm−1 and 3416~3700 cm−1 are the stretching vibrations of –OH and the weaker absorption peak at 1638 cm−1 is caused by the bending vibration of H2O [27,28]. A sharp peak appears at 1425 cm−1 in the infrared spectrum of (NH4)Fe3(SO4)2(OH)6, which is regarded as the absorption of the –NH4 peak. According to the findings in the report [15], transition metal hydroxides have good OER catalytic performance and the presence of hydroxyl groups in jarosite makes it possible to have OER catalytic performance. This view is confirmed in the following electrochemical performance test.
It can be seen from the figure that KFe3(SO4)2(OH)6 (Figure 1c) and NaFe3(SO4)2(OH)6 (Figure 1d) have similar morphologies. Both of them are densely packed. The precipitation rate of KFe3(SO4)2(OH)6 is fast and the sample morphology has not yet been completely formed before it settles together. In the morphology of NaFe3(SO4)2(OH)6, it can be observed that they are stacked together in a rhombic structure, which has not yet been completely formed. It can be seen from Figure 1e that the particle diameter is larger and the shape is irregular. (NH4)Fe3(SO4)2(OH)6 (Figure 1f) is uniformly distributed in lumps of different sizes while particles do not appear to pile up, showing a larger specific surface area.
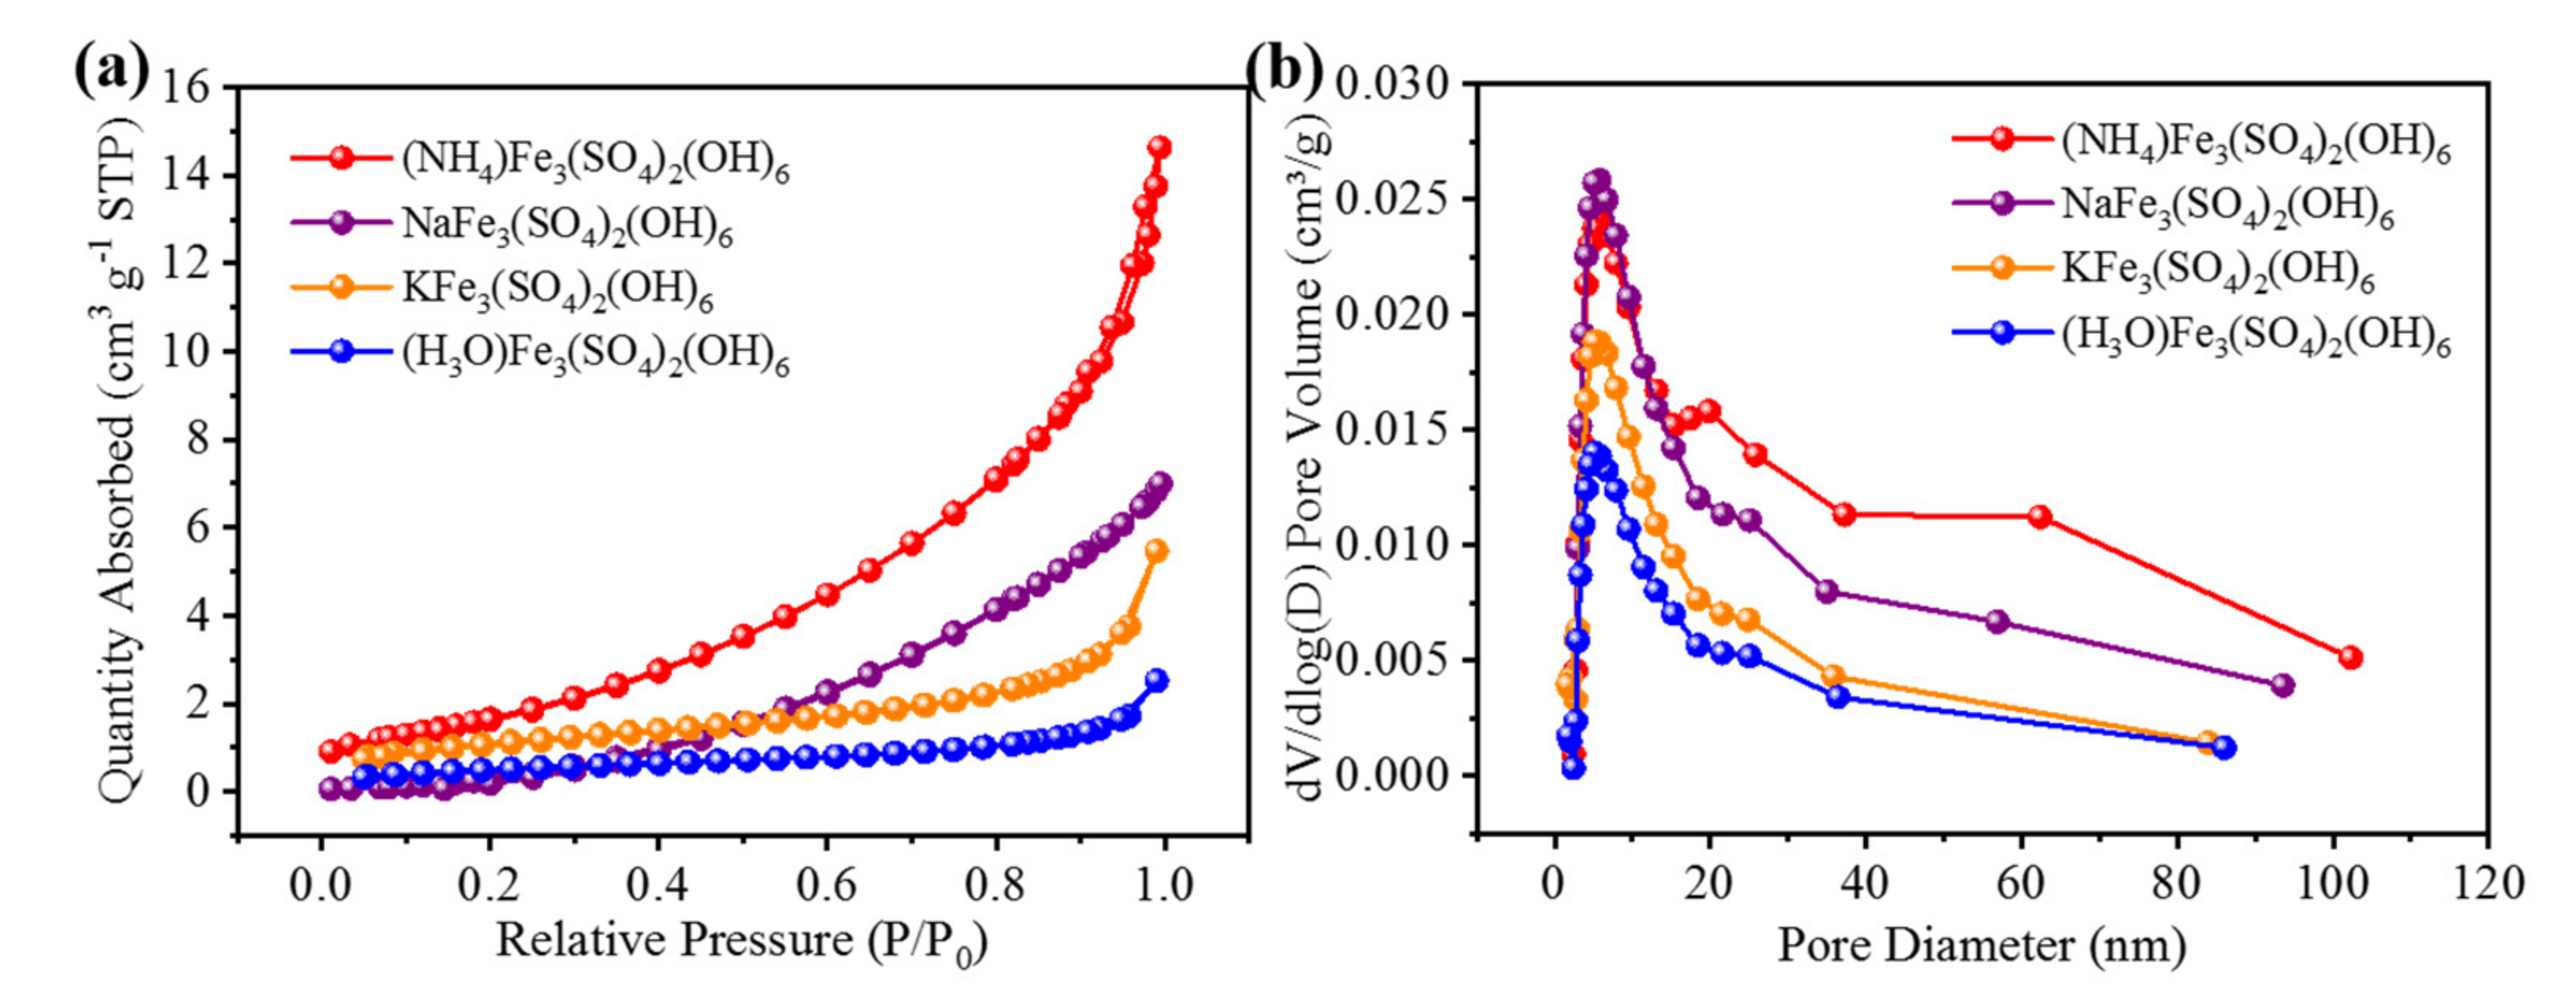
The nitrogen adsorption-desorption isotherm curves of the as-synthesized catalyst under various pressures were characterized with a Surface Area and Pore Porosimetry Analyzer NoVA 1200e., and the specific surface area and pore size distribution were calculated via Brumaire-Emmett-Teller(BET) and Barret-Joyner-Hallender (BJH) methods. As shown in Figure 2, (NH4)Fe3(SO4)2(OH)6 displays the highest BET surface areas of 6.5845 m2 g−1, which is higher than that of KFe3(SO4)2(OH)6 (4.6879 m2 g−1), NaFe3(SO4)2(OH)6 (4.1587 m2 g−1), and (H3O)Fe3(SO4)2(OH)6 (2.5179 m2 g−1). The pore size distribution curves of the four materials in Figure 2b suggest the existence of a mesoporous structure (~8 nm). The large specific surface area of the catalyst is very beneficial for the exposure of catalytic active sites for OER.
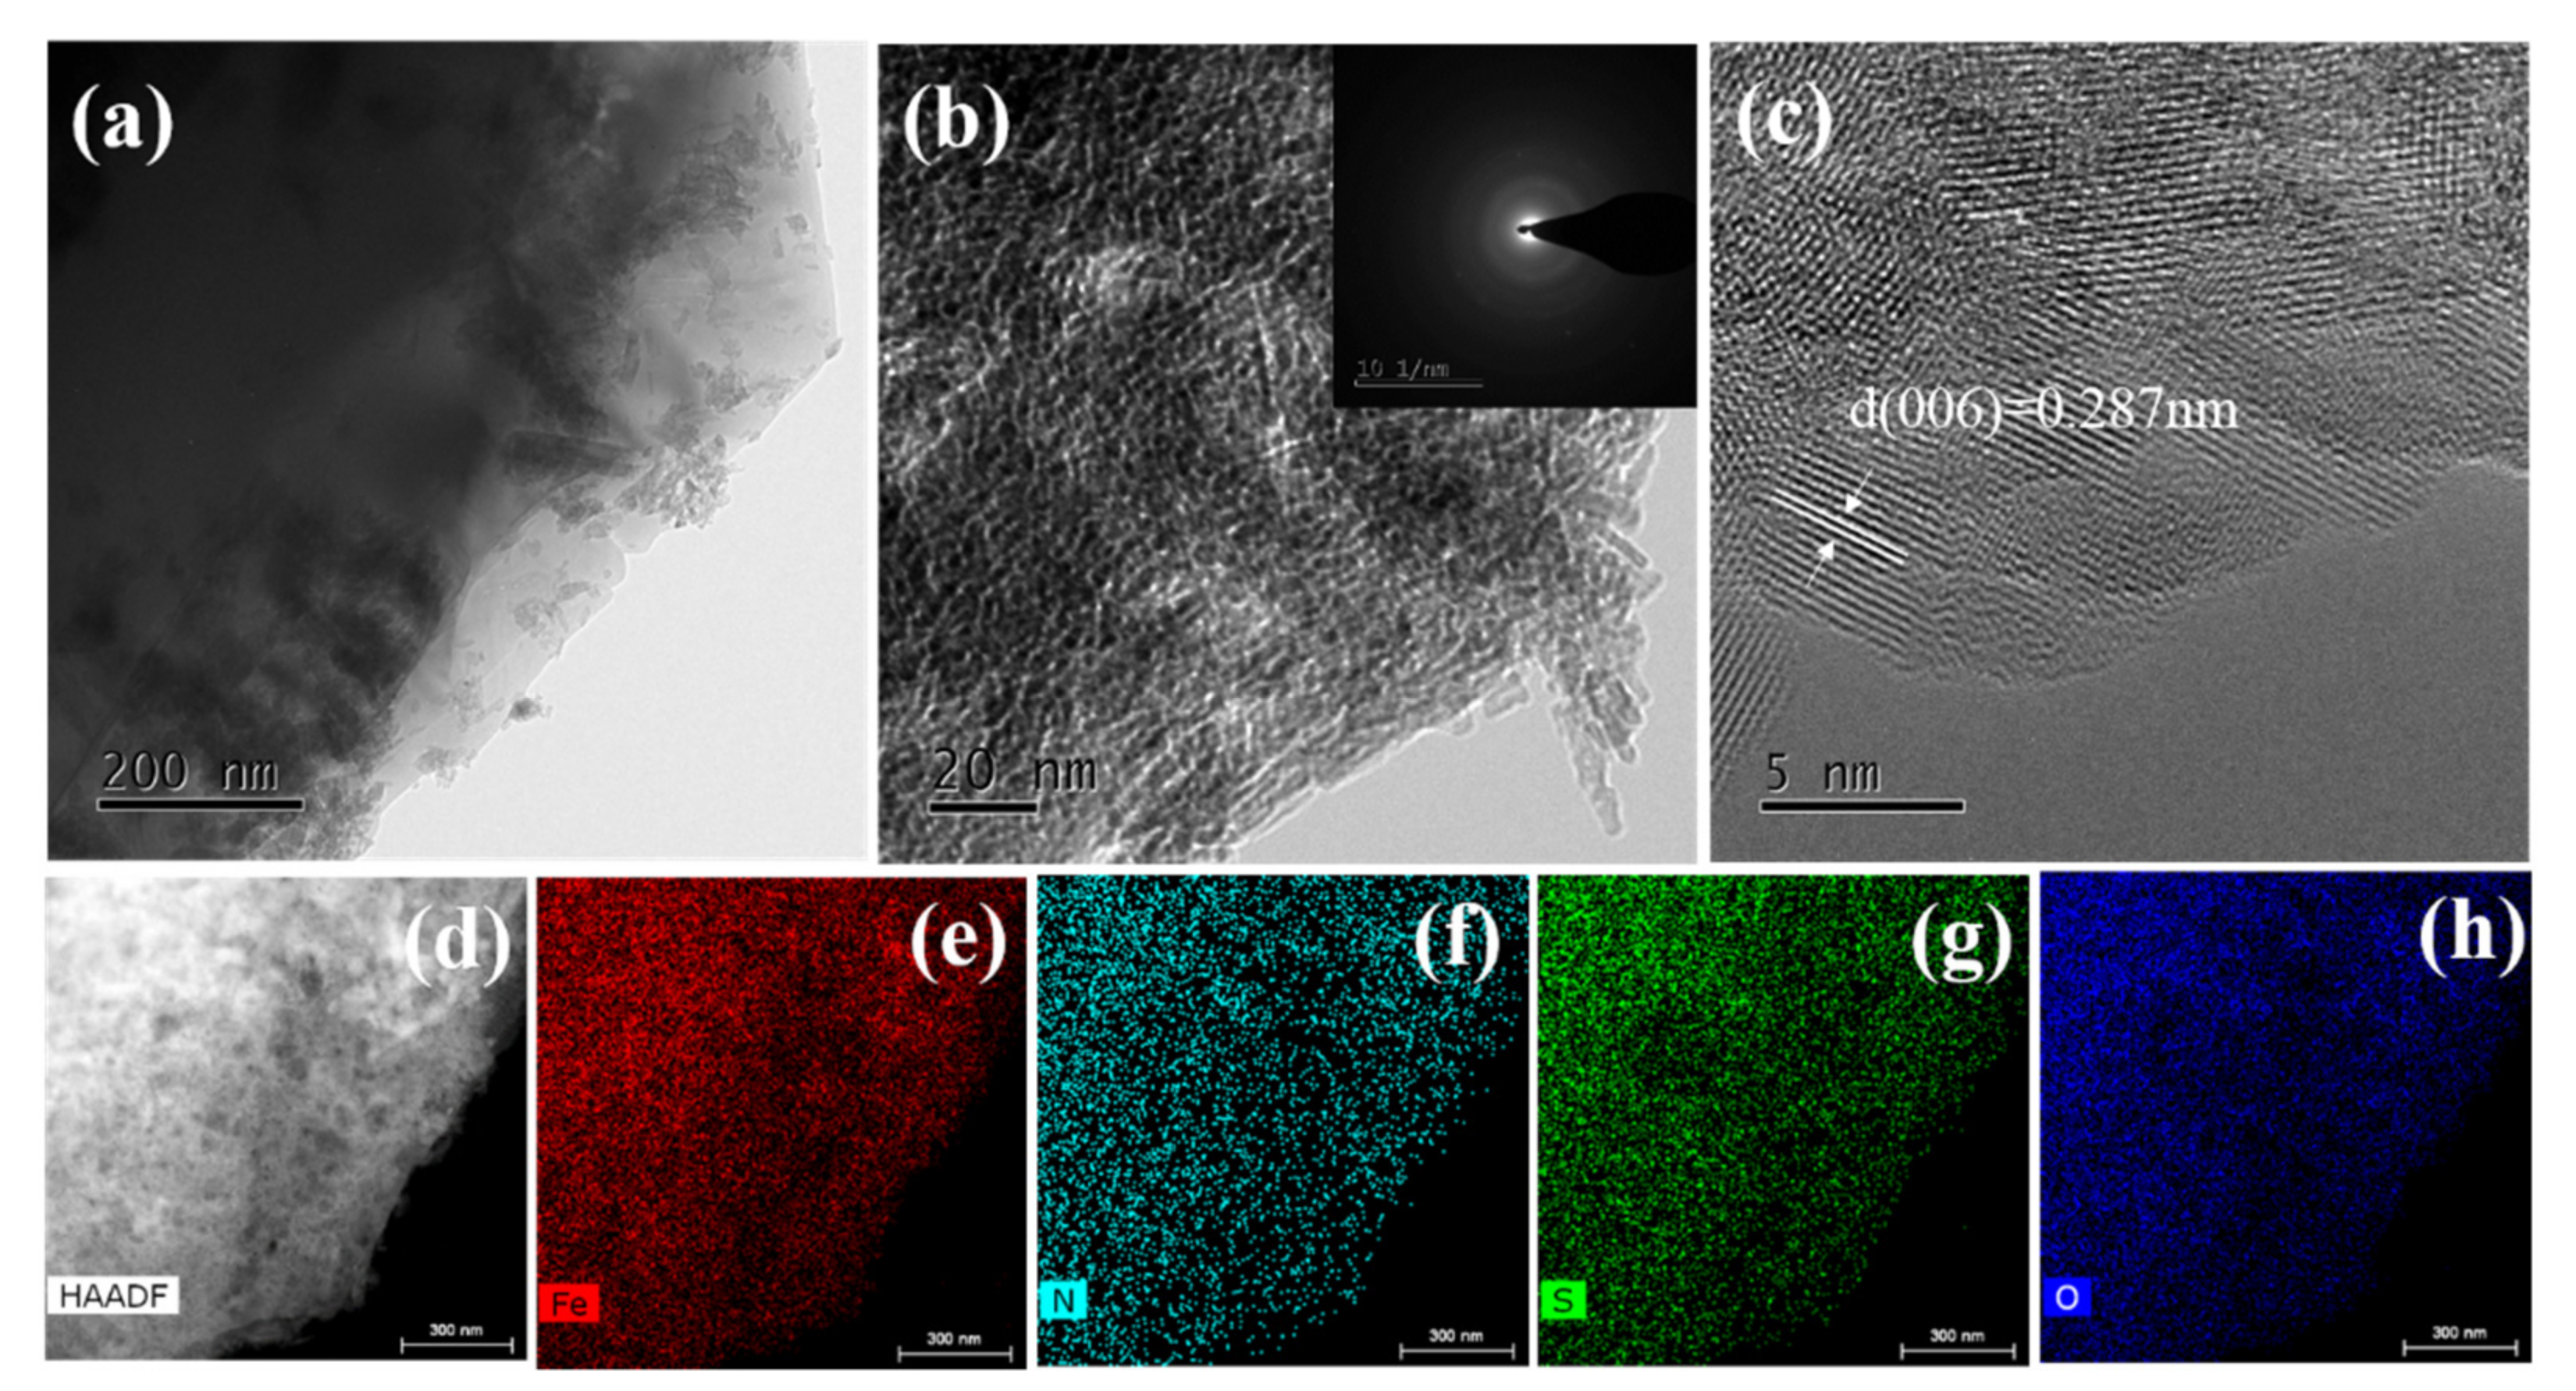
Transmission electron microscopy (TEM) was carried out to further identify the details of samples. Figure 3a,b shows the lamellar structure of the sample. It shows some branch-like structures, which can provide more active sites. The selected-area electron-diffraction (SAED) pattern (inset of Figure 3b) of (NH4)Fe3(SO4)2(OH)6 was also recorded. It displays the weak diffraction rings, which further explained how the prepared (NH4)Fe3(SO4)2(OH)6 possesses poor crystallization form. Figure 3c shows the recorded high-resolution transmission electron microscopy (HRTEM) image of the (NH4)Fe3(SO4)2(OH)6. The interplanar spacing of 0.287 nm was indexed matching the (006) crystal plane of (NH4)Fe3(SO4)2(OH), which is in good agreement with the XRD spectra. Furthermore, the high-angle annular dark-field scanning-TEM (HAADF–STEM) and its corresponding mapping were employed to analyze the distribution of the elements in the (NH4)Fe3(SO4)2(OH)6 catalyst. It shows that Fe, N, O, and S are evenly distributed across the entire nanoparticles without any noticeable segregation.
3.2. Electrochemical Analysis
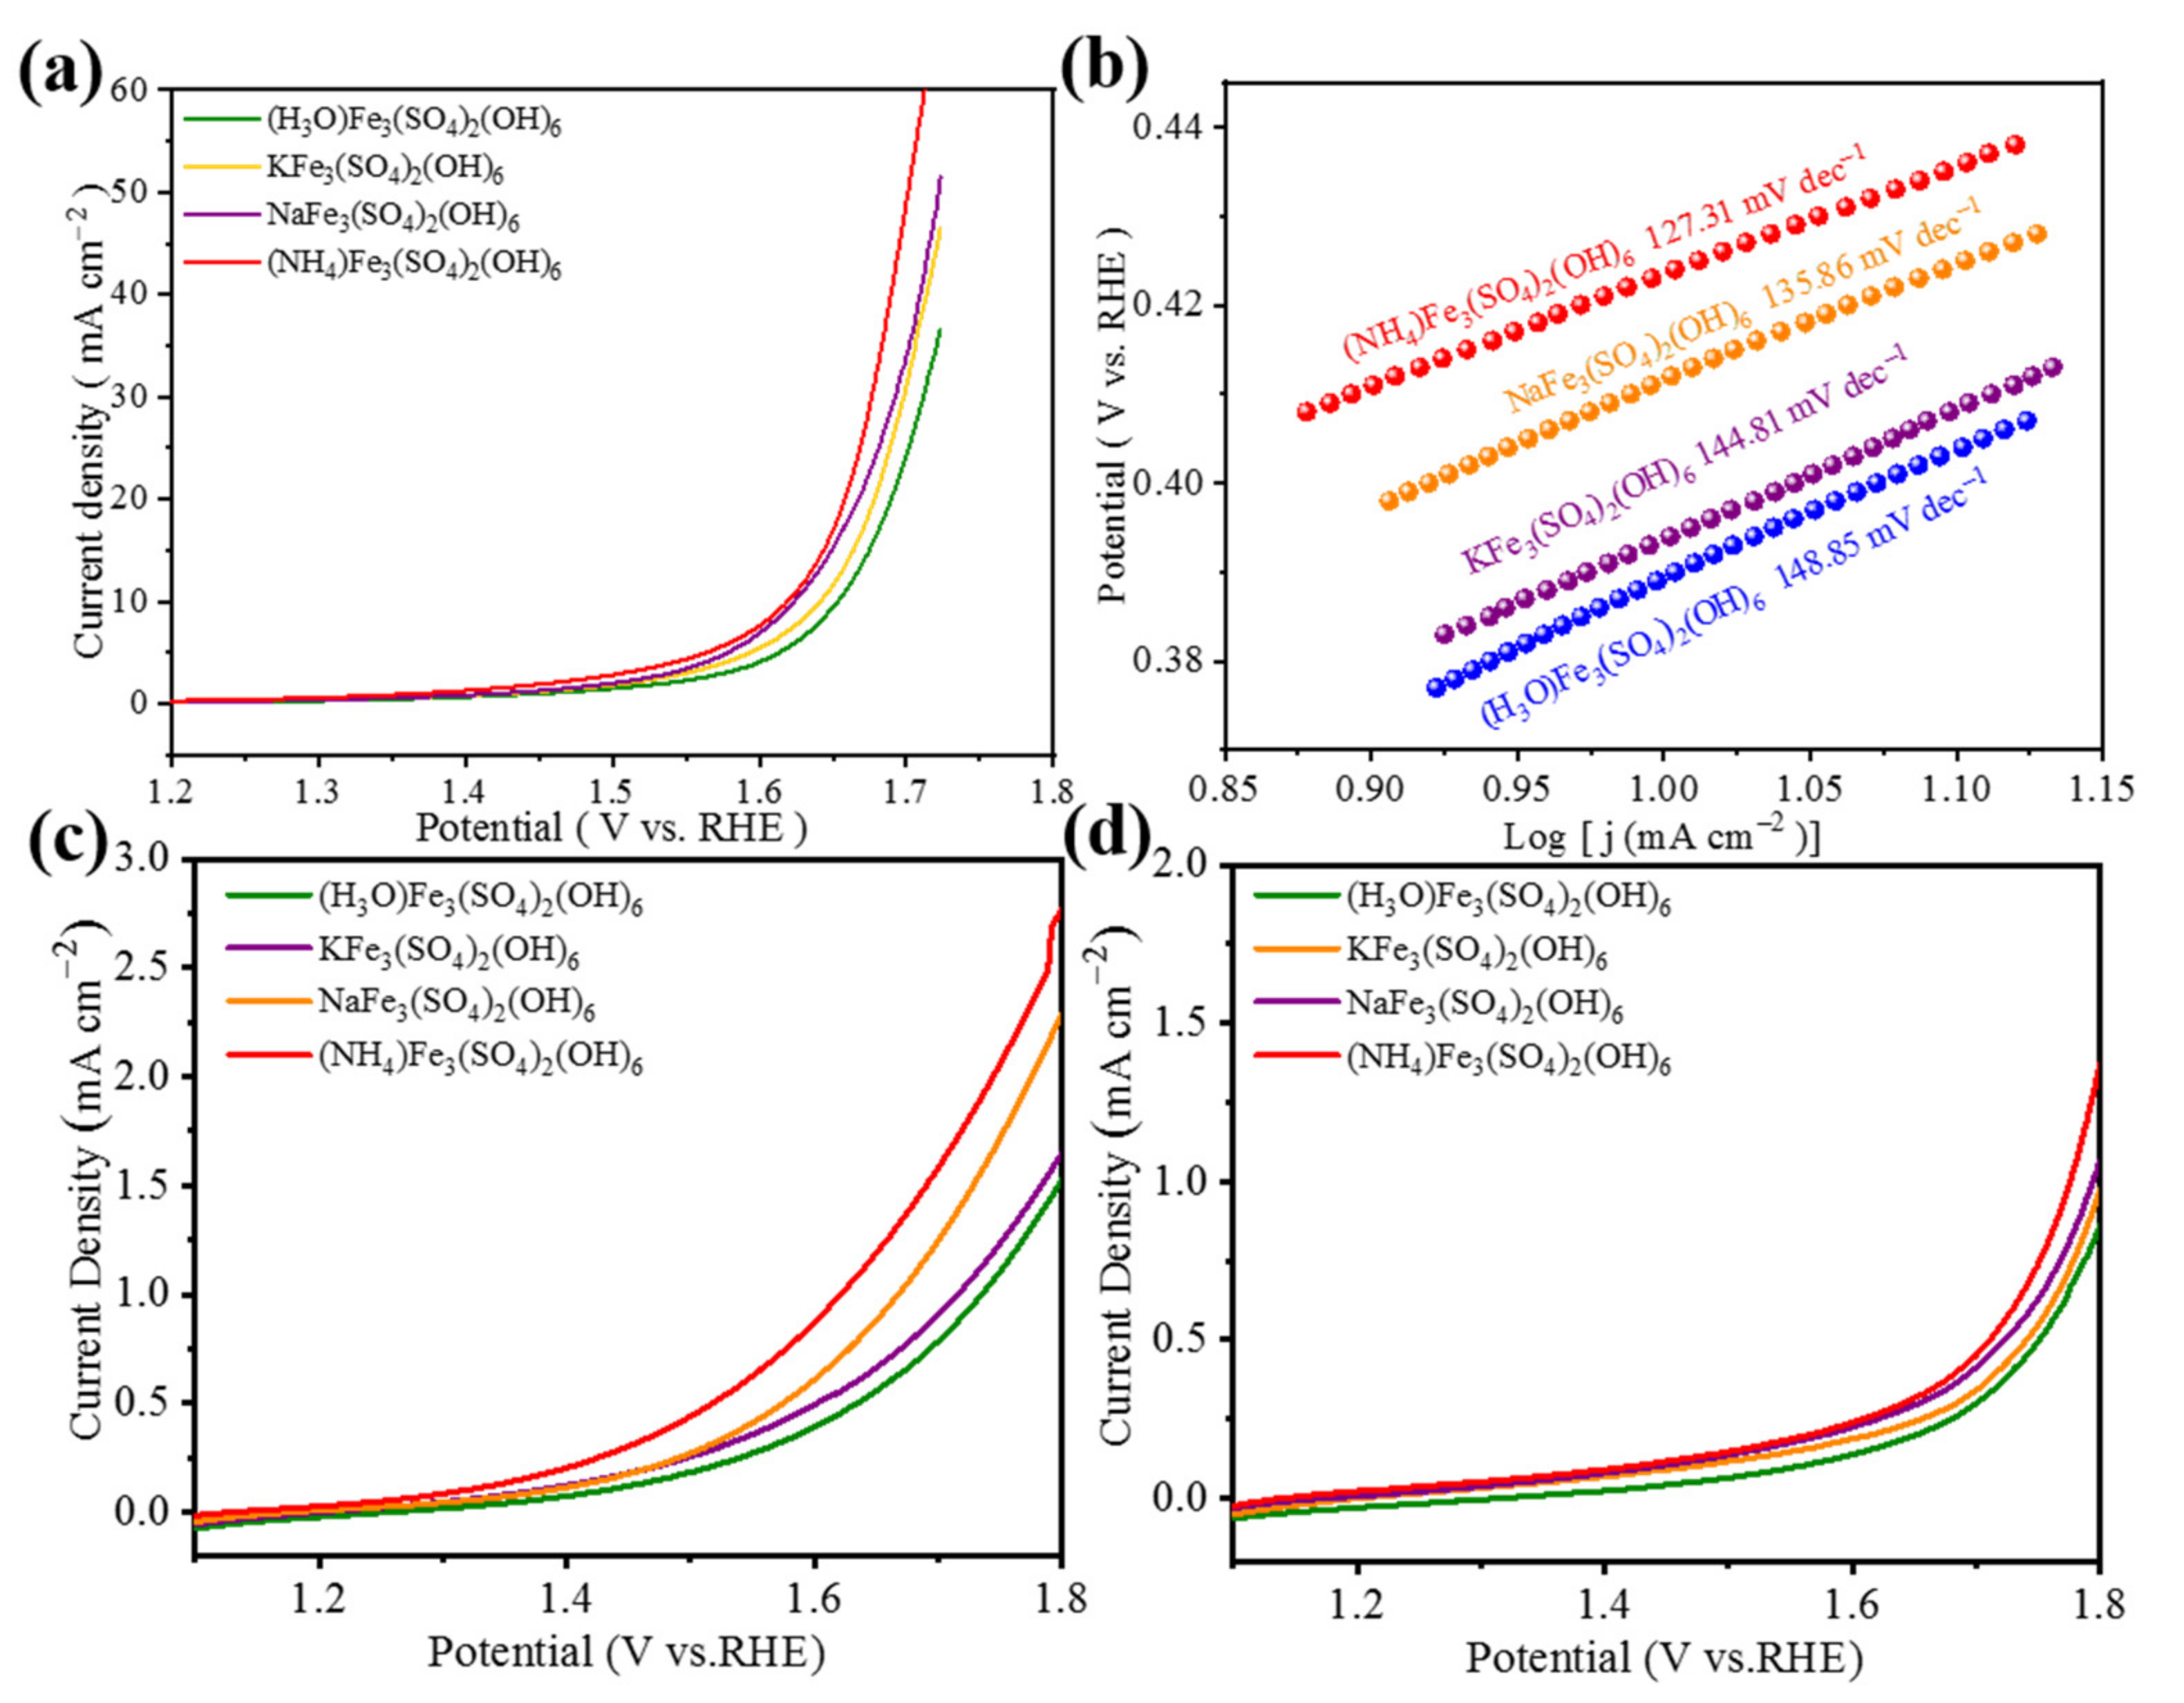
To increase the electronic conductivity of the jarosite, the catalyst slurry with a weight ratio of 1:1 (jarosite to conductive carbon black) was prepared and an OER polarization curve performance test was conducted. As shown in Figure 4a, when the current density is 10 mA cm−2, the overpotentials of KFe3(SO4)2(OH)6, NaFe3(SO4)2(OH)6, (H3O)Fe3(SO4)2(OH)6, and(NH4)Fe3(SO4)2(OH)6 are 412 mV, 400 mV, 424 mV, and 394 mV, respectively. Meanwhile, the Tafel slope of the (NH4)Fe3(SO4)2(OH)6 is 127.31 mV dec−1, which is smaller than those of the NaFe3(SO4)2(OH)6 (135.86 mV dec−1), KFe3(SO4)2(OH)6 (144.81 mV dec−1) and (H3O)Fe3(SO4)2(OH)6 (148.85 mV dec−1), which indicates that (NH4)Fe3(SO4)2(OH)6 shows an excellent OER activity among the four jarosite catalysts.
In addition, OER tests were carried out on four catalyst materials in the acidic (pH = 1 H2SO4) and neutral (pH = 7 PBS) solution. As shown in Figure 5c,d, the catalytic performance of (NH4)Fe3(SO4)2(OH)6 in the acidic and neutral solution is better than the other three materials. However, the OER performance of (NH4)Fe3(SO4)2(OH)6 in the acidic and neutral condition is far inferior to that in the alkaline condition. Therefore, we will take alkaline conditions as an example to focus on the (NH4)Fe3(SO4)2(OH)6 catalyst.
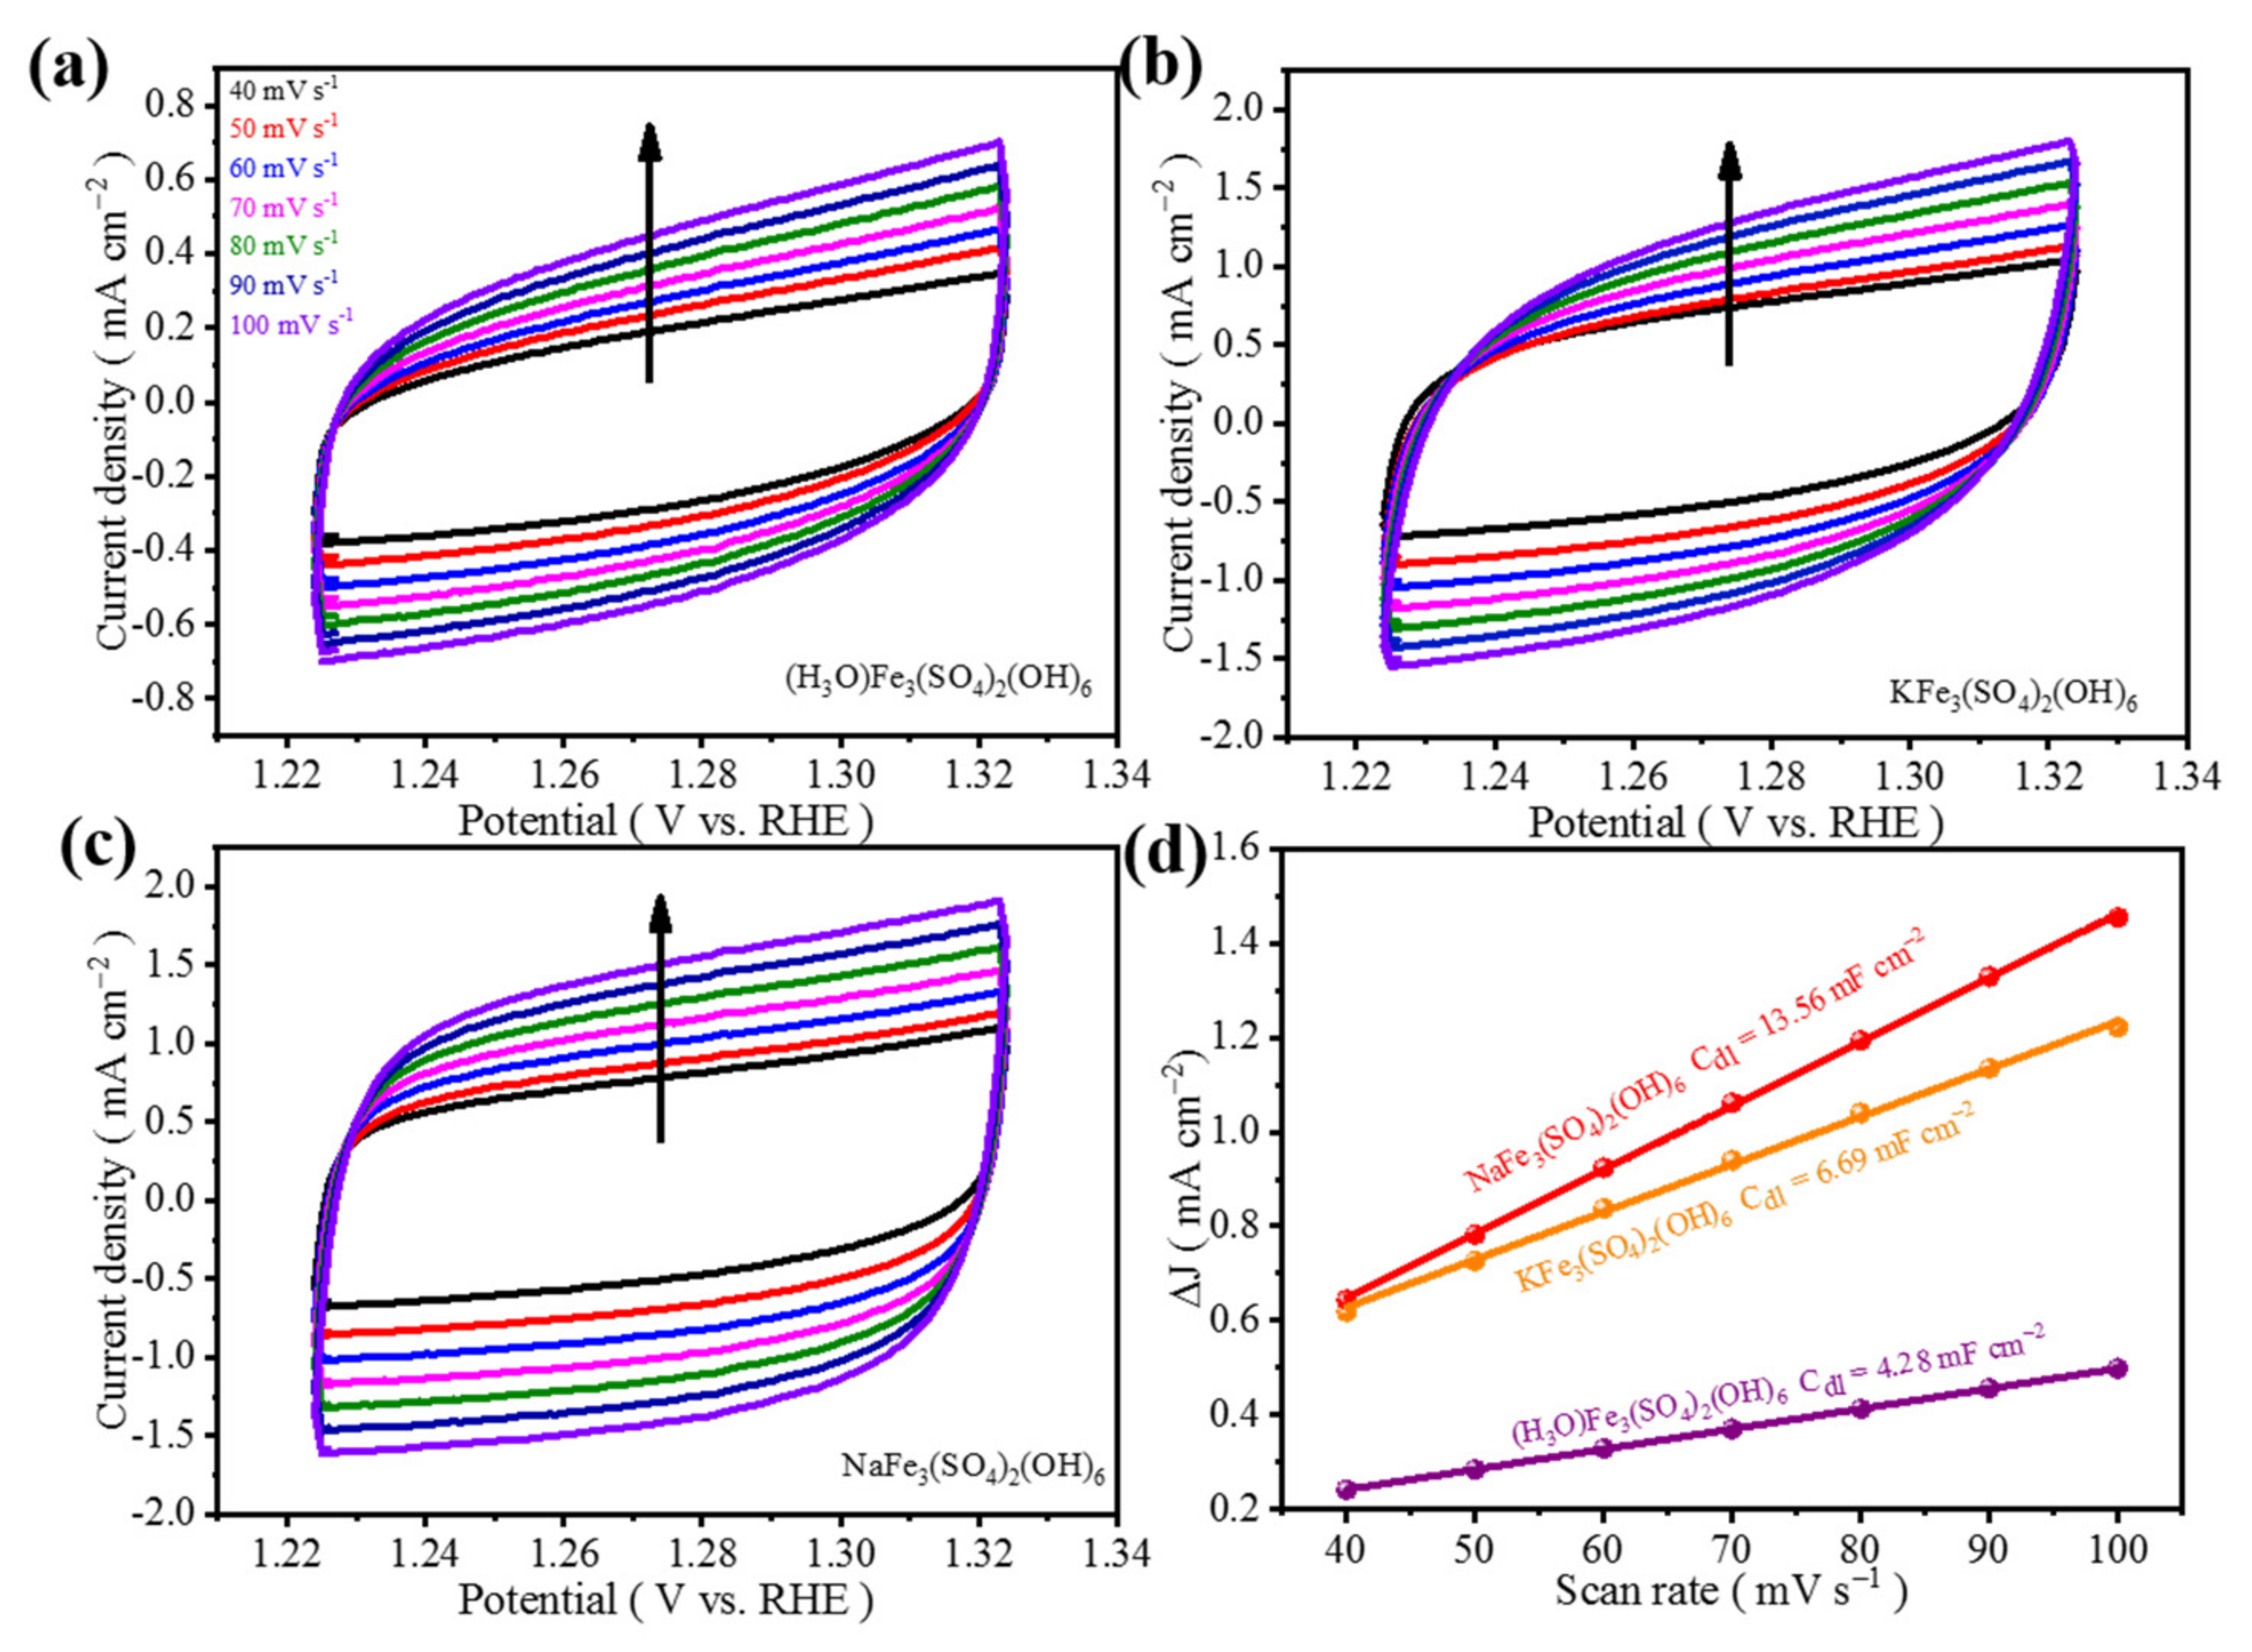
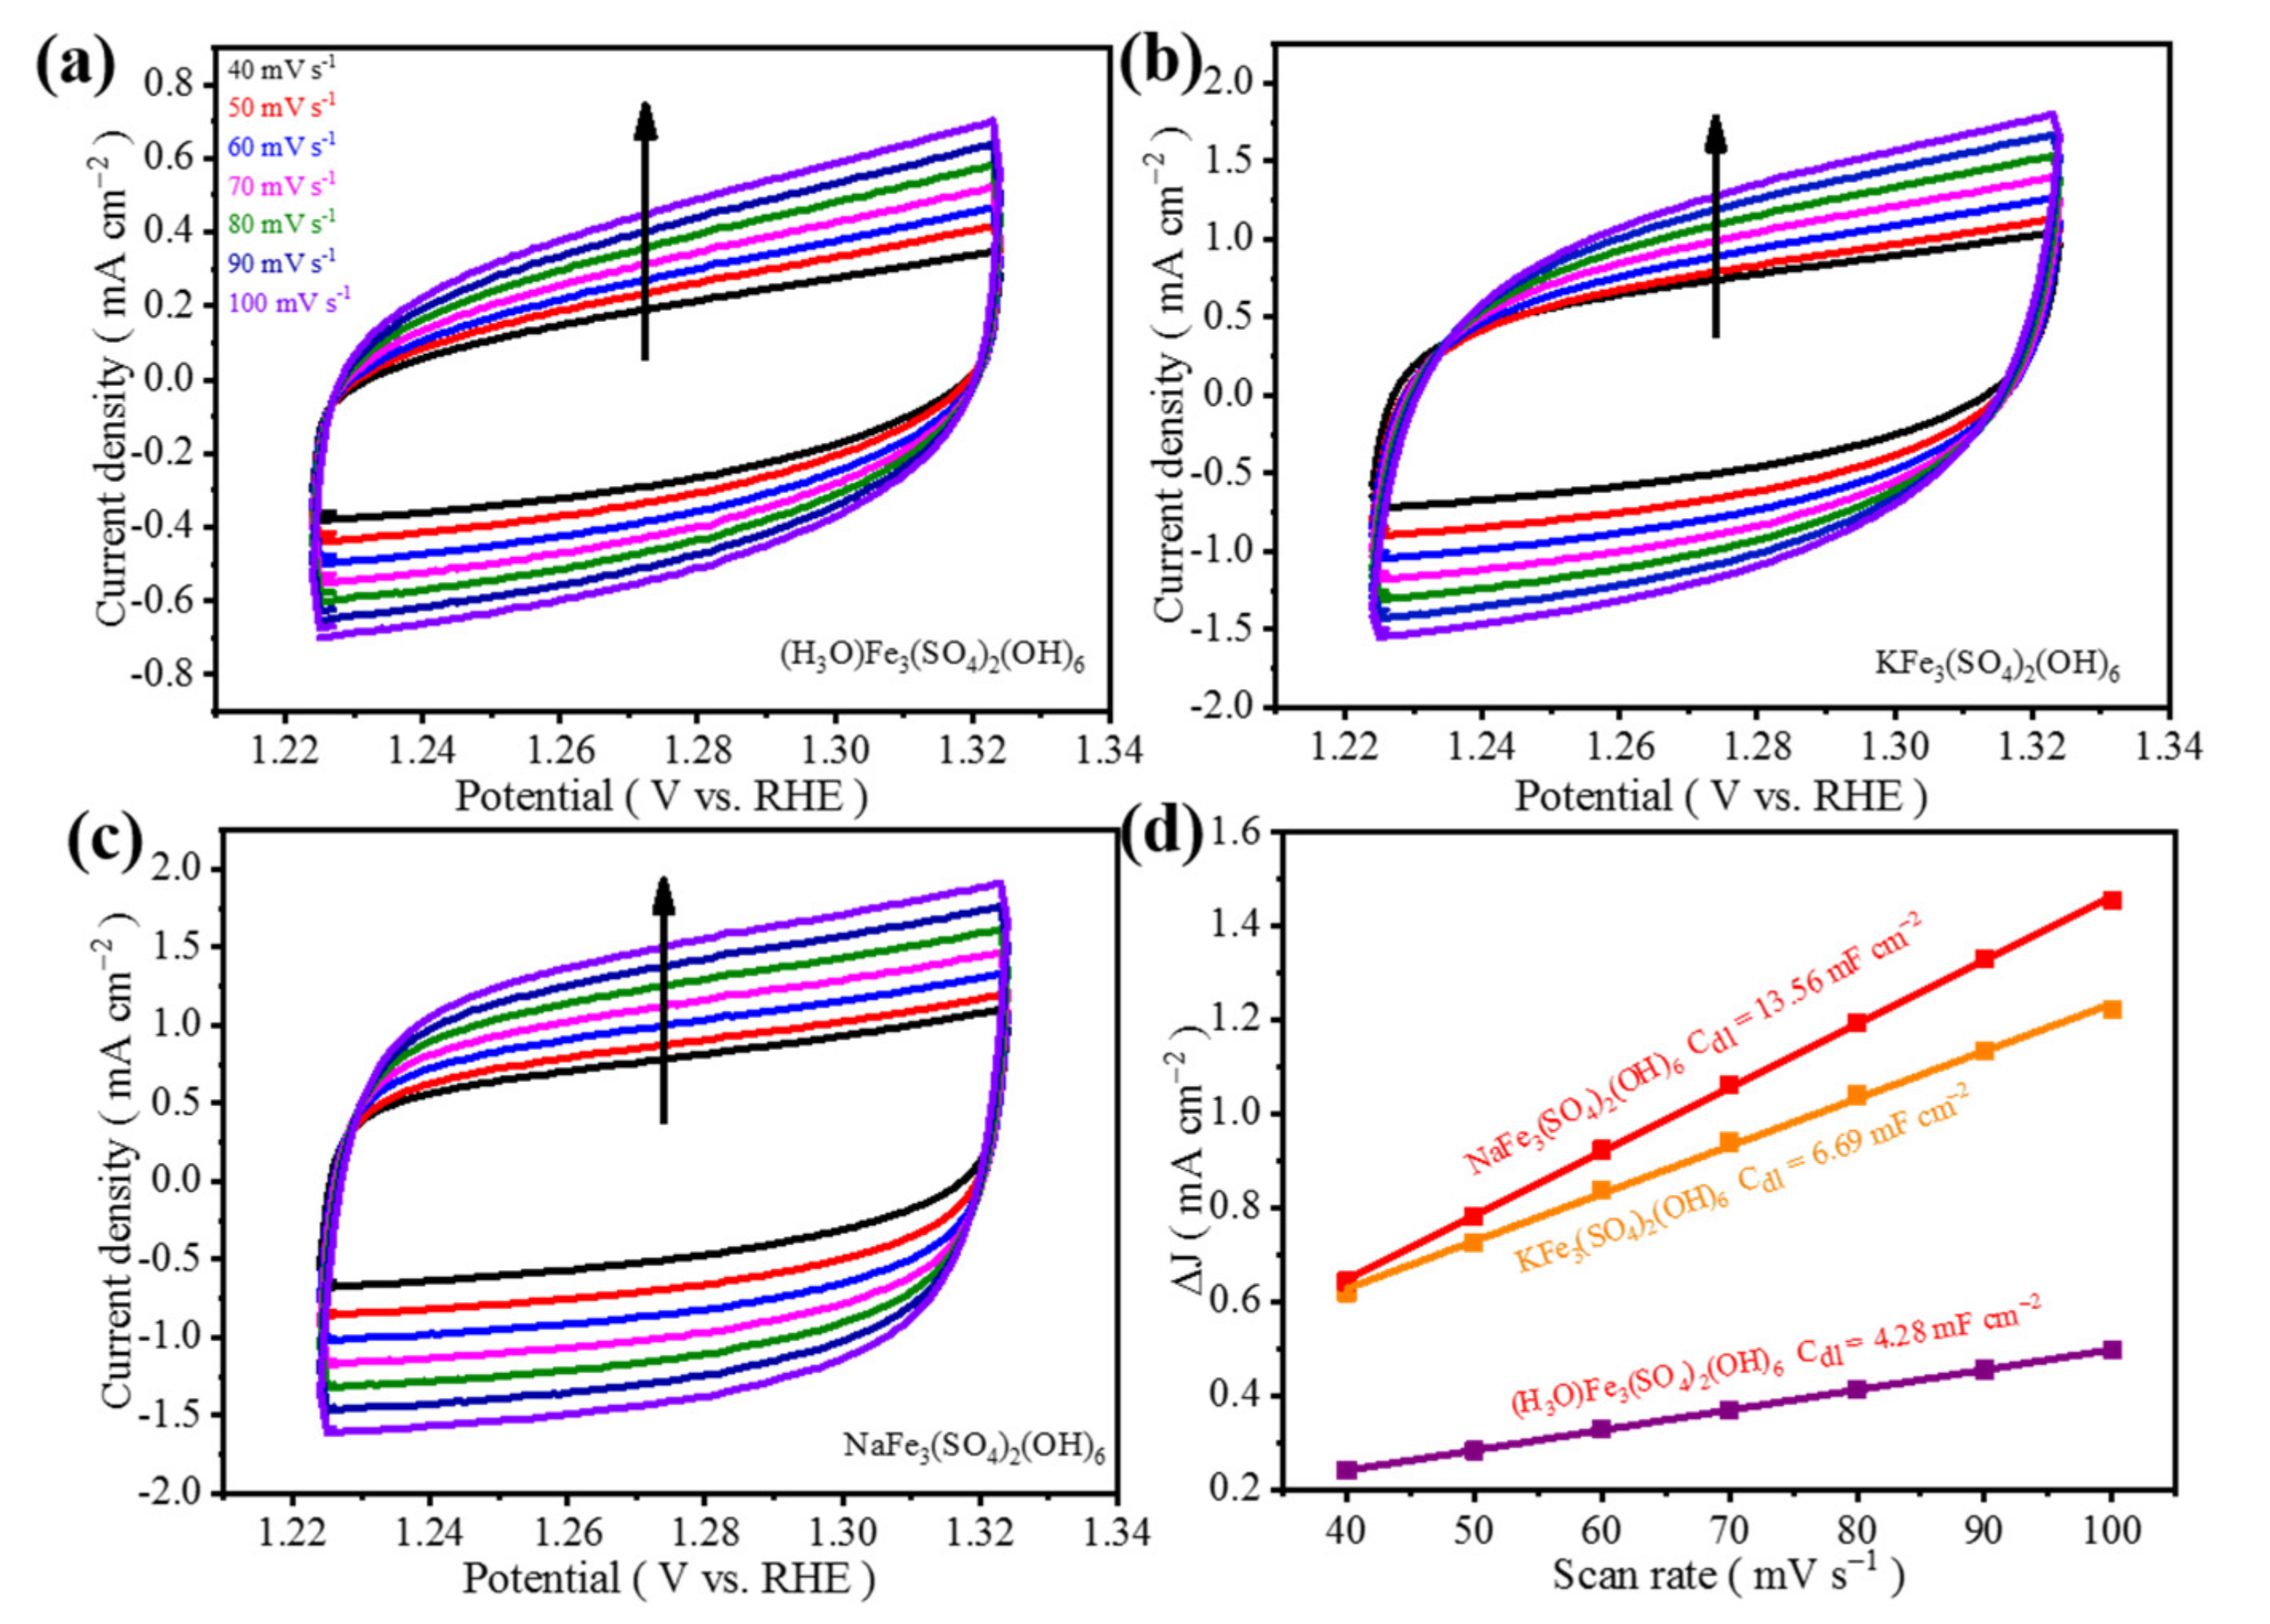
The electrochemical double-layer capacitance (Cdl) approach was applied to estimate the electrocatalytic active surface area (ECSA) from cyclic voltammetry curves at various scan rates over a small potential range. The (NH4)Fe3(SO4)2(OH)6 electrode possesses the largest Cdl of 15.49 mF cm−2 compared to those of KFe3(SO4)2(OH)6 (6.69 mF cm−2), NaFe3(SO4)2(OH)6 (13.56 mF cm−2), and (H3O)Fe3(SO4)2(OH)6 (4.28 mF cm−2) (Figure 5 and Figure 6), showing indeed that a larger ECSA of (NH4)Fe3(SO4)2(OH)6 allows for more exposed active sites to promote OER performance.
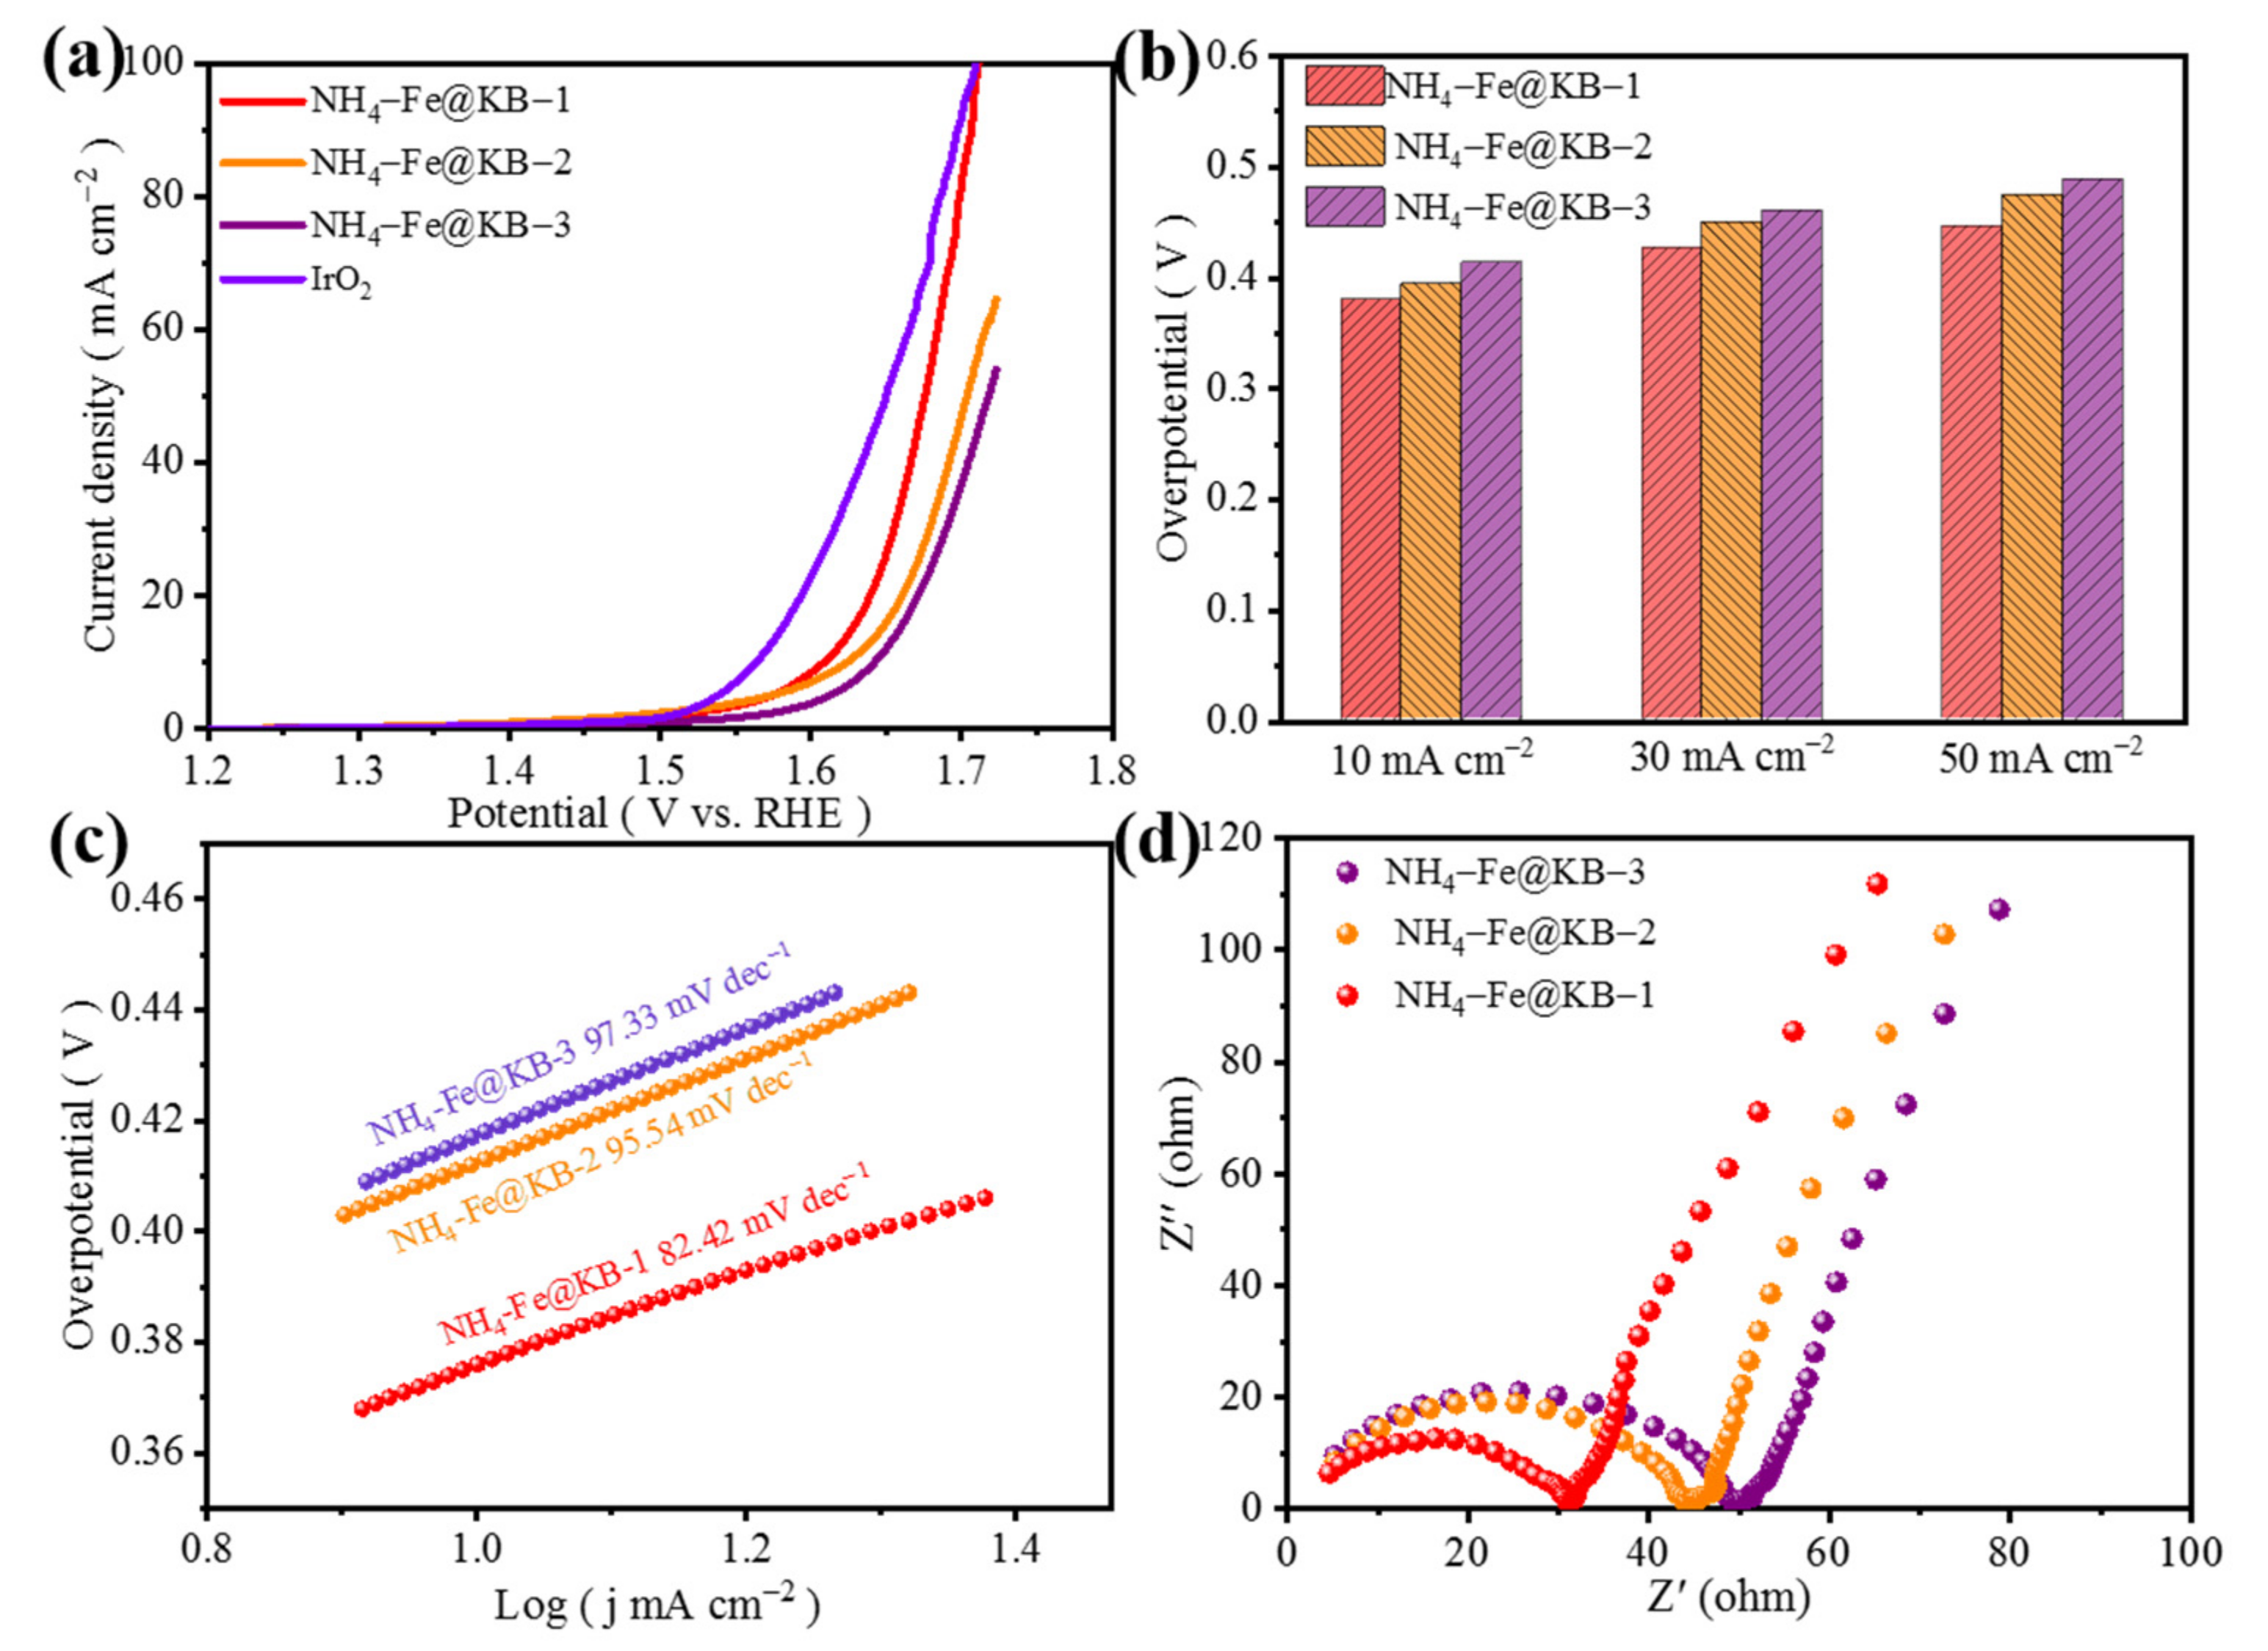
Different ratios of catalyst powder and conductive carbon black may affect the results. The different weight ratios of (NH4)Fe3(SO4)2(OH)6 and conductive carbon black (2:1, 1:1, 1:2) are prepared and the total mass of 10 mg is guaranteed. The samples are referred to as NH4-Fe3@KB-1, NH4-Fe@KB-2, NH4-Fe@KB-3 and IrO2. The OER polarization curve test was performed on them in 1 M KOH electrolyte saturated with oxygen, and the test results are shown in Figure 6a. Additionally, NH4-Fe3@KB-1 has better OER catalytic performance. When the current density is 10 mA cm−2, the overpotential of NH4-Fe3@KB-1 is 379 mV, and it is 15 mV and 34 mV lower than NH4-Fe3@KB-2 and NH4-Fe3@KB-3, respectively. Furthermore, (NH4)Fe3(SO4)2(OH)6 and IrO2 have the same overpotential when the current density is 100 mA cm−2. When the current density is 30 mA cm−2 and 50 mA cm−2, the overpotential of NH4-Fe3@KB-1 is still the lowest (Figure 6b). NH4-Fe3@KB-1 has a higher current density with the same measurement conditions.
To get insight into the OER kinetics, the Tafel slope values were calculated from the steady-state OER polarization curves. As shown in Figure 6c, NH4-Fe3@KB-1 (82.42 mV dec−1) has the smallest Tafel slope. Figure 6d is the AC impedance (EIS) test results of NH4-Fe3@KB-1, NH4-Fe3@KB-2 and NH4-Fe3@KB-3. The charge transfer resistance of NH4-Fe3@KB-1 is significantly smaller than that of NH4-Fe3@KB-2 and NH4-Fe3@KB-3, which suggests the catalytic interface and the electrolyte have a faster charge transfer rate.
The slope was calculated to get the Cdl value and the test result is shown in Figure 7. NH4-Fe3@KB-1 has the largest Cdl value of 26.17 mF cm−2, indicating that the ECSA of NH4-Fe3@KB-1 is large. This is allowing more active sites to be exposed and promotes the catalytic process of OER. This also explains the good OER catalytic performance of NH4-Fe3@KB-1.
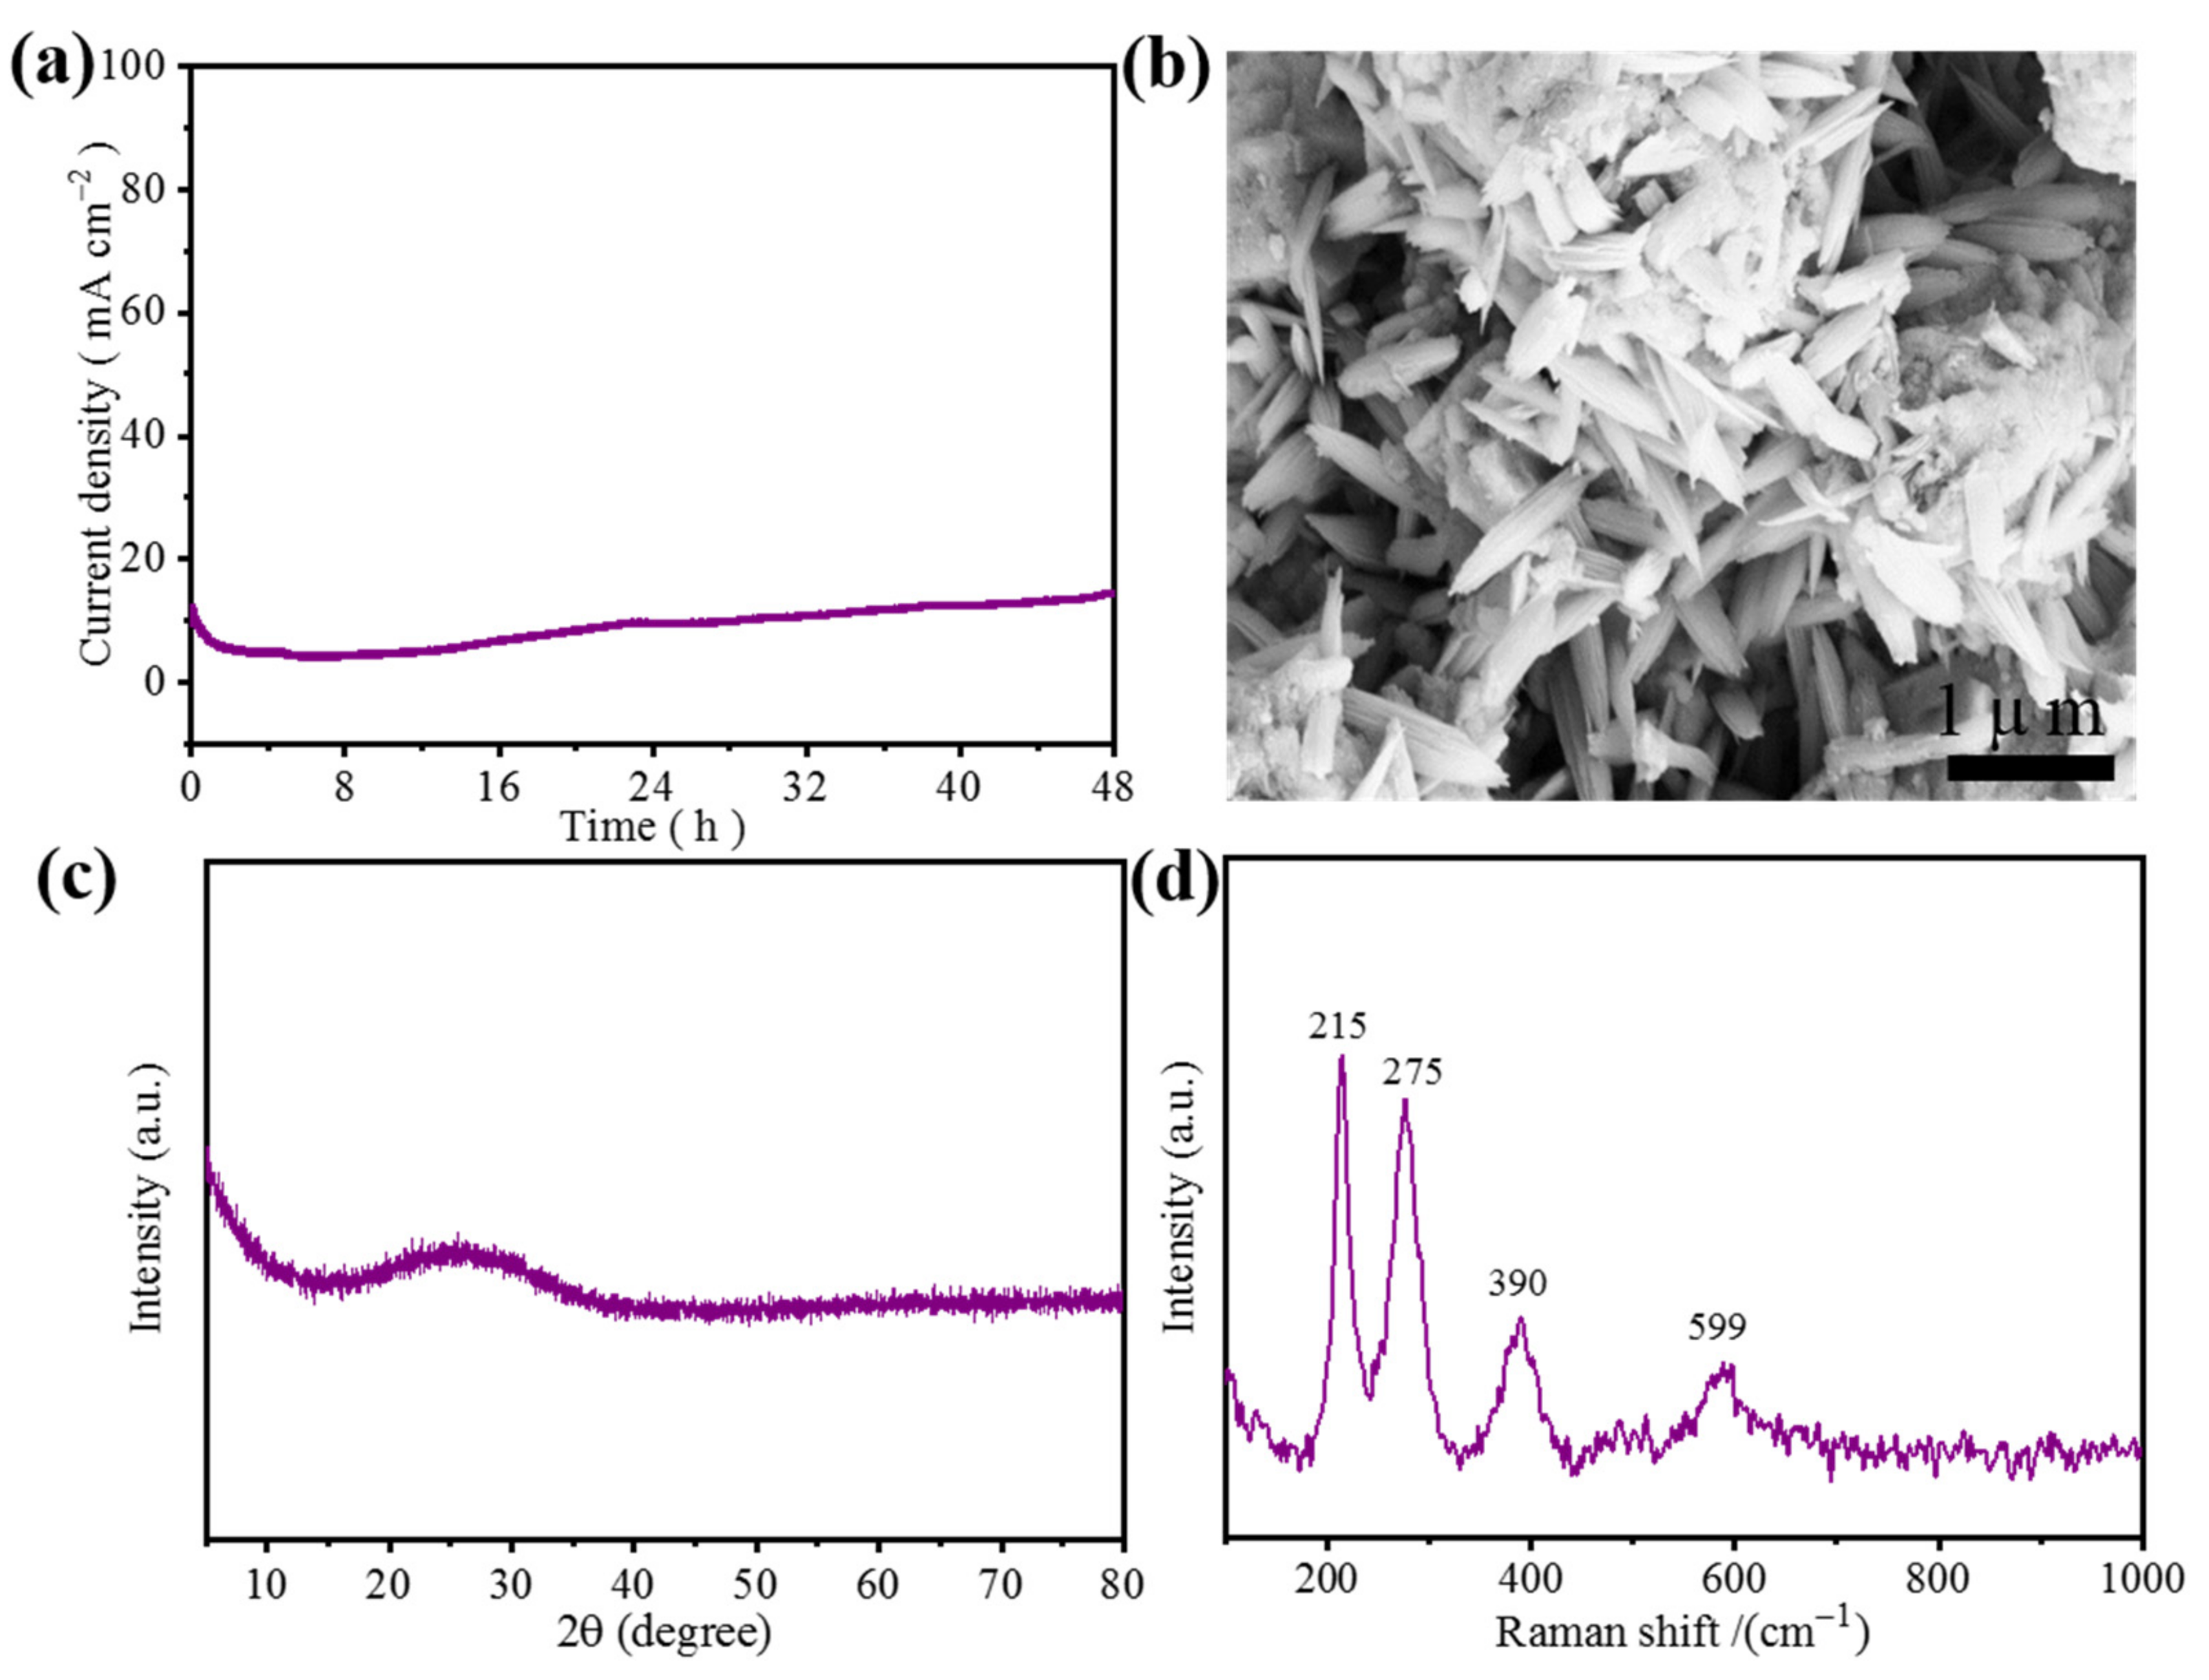
Additionally, durability was another significant parameter of the catalyst for OER. Through the i-t test, the stability of NH4-Fe3@KB-1 was evaluated, and the test was carried out for 48 h at a constant voltage of 0.68 V (vs. Hg/HgO) with a current density equal to 10 mA cm−2. The test results are shown in Figure 8a. With the increase in test time, the current density of NH4-Fe3@KB-1 increases slightly around 10 mA cm−2, which may be caused by the burst of oxygen bubbles generated during the test. Overall, NH4-Fe3@KB-1 still shows good stability. The structure and composition of (NH4)Fe3(SO4)2(OH)6 after the stability test was also studied in detail, with the SEM image of (NH4)Fe3(SO4)2(OH)6 (Figure 8b) after stability test displaying a newly formed rice-like structure, indicating that the (NH4)Fe3(SO4)2(OH)6 catalyst may have undergone surface reconstruction during electrolysis. In addition, the XRD pattern (Figure 8c) of the (NH4)Fe3(SO4)2(OH)6 catalyst showed an amorphous feature after OER. As with many reported works [29,30], the catalyst undergoes a surface reconstruction accompanied by the appearance of an amorphous structure (e.g., oxyhydroxide species) during the OER process, and the observed amorphous feature was further analyzed by Raman spectroscopy. As shown in Figure 8d, the four Raman bands at 215, 275, 390 and 599 cm–1 represent the phase of FeOOH, which is well-matched with the literature reports [31,32,33]. Therefore, it might be reasonable to conclude that (NH4)Fe3(SO4)2(OH)6 was transformed into amorphous FeOOH during the OER process.
4. Conclusions
In this work, a simple hydrothermal method was used to successfully prepare the jarosite. Furthermore, (NH4)Fe3(SO4)2(OH)6 shows the best catalytic performance. The OER catalytic performance of (NH4)Fe3(SO4)2(OH)6 and conductive carbon black with different weight ratios were further explored. The OER catalytic performance is best when the weight ratio of (NH4)Fe3(SO4)2(OH)6 to conductive carbon black is 2:1. Additionally, NH4-Fe3@KB-1 has a lower starting potential of 1.42 V (vs. RHE) and Tafel slope (82.42 mV dec−1). It also showed a small charge transfer resistance and a large Cdl (26.17 mF cm−2). The raw materials for preparing the synthetic are easily obtained and are low in price. Experimental results show that jarosite has a broad development space and further research is needed to improve its OER performance.
Author Contributions
Conceptualization, J.C., S.L. and Y.L.; methodology, J.C. and S.L.; software, J.C. and S.L.; validation, Z.Q., Z.L. and D.W.; formal analysis, J.C. and S.L.; investigation, J.C. and S.L.; resources, Y.L.; data curation, S.L.; writing—original draft preparation, J.C. and S.L.; writing—review and editing, J.C.; visualization, J.S. and Y.L.; supervision, J.S. and Y.L.; project administration, Y.L. All authors have read and agreed to the published version of the manuscript.
Funding
This research received no external funding.
Institutional Review Board Statement
Not applicable.
Informed Consent Statement
Not applicable.
Data Availability Statement
The data used to support the findings of this study are available from the corresponding author upon request.
Acknowledgments
The authors are grateful for the Key Laboratory of New Processing Technology for Nonferrous Metals and Materials, Ministry of Education, Guilin University of Technology.
Conflicts of Interest
The authors declare no conflict of interest.
References
- Zhao, D.D.; Zhang, N.; Bu, L.Z.; Shao, Q.; Huang, X.Q. The latest development of non-noble metal electrocatalytic oxygen evolution catalysts. Electrochemistry 2018, 24, 455–465. [Google Scholar]
- Guo, Y.X.; Shang, C.S.; Li, J.; Wang, E.K. Research progress in electrocatalytic hydrogen evolution, oxygen evolution, and oxygen reduction. Sci. China Chem. 2018, 48, 926–940. [Google Scholar]
- Shao, Q.; Yang, J.; Huang, X. The Design of Water Oxidation Electrocatalysts from Nanoscale Metal-Organic Frameworks. Chem. Eur. J. 2018, 24, 15143–15155. [Google Scholar] [CrossRef] [PubMed]
- Goodenough, J.B.; Park, K.S. The Li-ion rechargeable battery: A perspective. J. Am. Chem. Soc. 2013, 135, 1167–1176. [Google Scholar] [CrossRef] [PubMed]
- Wang, H.; Wang, W.; Xu, Y.Y.; Dong, S.; Xiao, J.; Wang, F.; Liu, H.; Xia, B.Y. Hollow nitrogen-doped carbon spheres with Fe3O4 nanoparticles encapsulated as a highly active oxygen-reduction catalyst. ACS Appl. Mater. Interfaces 2017, 9, 10610–10617. [Google Scholar] [CrossRef] [PubMed]
- Long, X.; Xiao, S.; Wang, Z.; Zheng, X.; Yang, S. Co intake mediated formation of ultrathin nanosheets of transition metal LDH-an advanced electrocatalyst for oxygen evolution reaction. Chem. Commun. 2015, 51, 1120–1123. [Google Scholar] [CrossRef]
- Luo, Y.; Wu, Y.; Wu, D.; Huang, C.; Xiao, D.; Chen, H.; Zheng, S.; Chu, P.K. NiFe-Layered Double Hydroxide synchronously activated by heterojunctions and Vacancies for the Oxygen Evolution Reaction. Appl. Mater. Interfaces 2020, 12, 42850–42858. [Google Scholar] [CrossRef] [PubMed]
- Zhang, X.; Zhang, X.; Xu, H.; Wu, Z.; Wang, H.; Liang, Y. Iron-Doped cobalt monophosphide Nanosheet/Carbon nanotube hybrids as active and stable electrocatalysts for water splitting. Adv. Funct. Mater. 2017, 27, 1606635. [Google Scholar] [CrossRef]
- Xu, K.; Chen, P.; Li, X.; Tong, Y.; Ding, H.; Wu, X.; Chu, W.; Peng, Z.; Wu, C.; Xie, Y. Metallic Nickel Nitride nanosheets realizing enhanced electrochemical water oxidation. J. Am. Chem. Soc. 2015, 137, 4119–4125. [Google Scholar] [CrossRef] [PubMed]
- Huo, J.; Wang, Y.; Yan, L.; Xue, Y.; Li, S.; Hu, M.; Jiang, Y.; Zhai, Q.G. In situ semi-transformation from heterometallic MOFs to Fe-Ni LDH/MOF hierarchical architectures for boosted oxygen evolution reaction. Nanoscale 2020, 12, 14514. [Google Scholar] [CrossRef] [PubMed]
- Lu, X.; Yim, W.L.; Suryanto, B.H.; Zhao, C. Electrocatalytic oxygen evolution at Surface-Oxidized multiwall carbon nanotubes. J. Am. Chem. Soc. 2015, 137, 2901–2907. [Google Scholar] [CrossRef] [PubMed]
- Lu, J.; Zhou, W.; Wang, L.; Jia, J.; Ke, Y.; Yang, L.; Zhou, K.; Liu, X.; Tang, Z.; Li, L.; et al. Core-shell nanocomposites based on gold nanoparticle @Zinc–iron- embedded porous carbons derived from metal-organic frameworks as efficient dual catalysts for oxygen reduction and hydrogen evolution reactions. ACS Catal. 2016, 6, 1045–1053. [Google Scholar] [CrossRef]
- Li, X.; Hao, X.; Wang, Z.; Abudula, A.; Guan, G. In-situ intercalation of NiFe LDH materials: An effificient approach to improve electrocatalytic activity and stability for water splitting. J. Power Sources 2017, 347, 193–200. [Google Scholar] [CrossRef]
- Smith, R.D.; Sporinova, B.; Fagan, R.D.; Trudel, S.; Berlinguette, C.P. Facile photochemical preparation of amorphous iridium oxide films for water oxidation catalysis. Chem. Mater. 2014, 26, 1654–1659. [Google Scholar] [CrossRef]
- Su, L.W.; Zhou, Z.; Shen, P.W. Core-shell Fe@Fe3C/C Nanocomposites as Anode Materials for Li Ion Batteries. Electrochim. Acta 2013, 87, 180–185. [Google Scholar] [CrossRef]
- Boyanov, S.; Bernardi, J.; Gillot, F.; Dupont, L.; Womes, M.; Tarascon, J.M.; Monconduit, L.; Doublet, M.L. FeP: AnotherAttractive Anode for the Li-Ion Battery Enlisting a Reversible Two-Step Insertion/Conversion Process. Chem. Mater. 2006, 18, 3531–3538. [Google Scholar] [CrossRef]
- Boyanov, S.; Womes, M.; Monconduit, L.; Zitoun, D. Mossbauer Spectroscopy and Magnetic Measurements As Comple-mentary Techniques for the Phase Analysis of FeP Electrodes Cycling in Li-Ion Batteries. Chem. Mater. 2009, 21, 3684–3692. [Google Scholar] [CrossRef]
- Ding, X.; Yin, S.; An, K.; Luo, L.; Shi, N.; Qiang, Y.; Pasupathi, S.; Pollet, B.G.; Shen, P.K. FeN stabilized FeN@Pt core-shell nanostructures for oxygen reduction reaction. J. Mater. Chem. A 2015, 3, 4462–4469. [Google Scholar] [CrossRef]
- Cai, Z.; Zhou, D.; Wang, M.; Bak, S.M.; Wu, Y.; Wu, Z.; Tian, Y.; Xiong, X.; Li, Y.; Liu, W.; et al. Introducing Fe2+ into nickel-iron layered double hydroxide: Local structure modulated water oxidation activity. Angew. Chem.-Int. Ed. 2018, 130, 9536–9540. [Google Scholar] [CrossRef]
- Basciano, L.C.; Peterson, R.C. The crystal structure of ammoniojarosite, (NH4)Fe3(SO4)W(OH)6 and the crystal chemistry of the ammoniojarosite-hydronium jarosite solid-solution series. Mineral. Mag. 2007, 71, 427–441. [Google Scholar] [CrossRef]
- Frost, R.; Wills, R.A.; Kloprogge, J.; Martens, W. Thermal decomposition of ammonium jarosite (NH4)Fe3(SO4)2(OH)6. J. Therm. Anal. Calorim. 2006, 84, 489–496. [Google Scholar] [CrossRef] [Green Version]
- Li, H.J.; Yang, H.Y.; Chen, G.B. Catalytic performance of biological method seeds on jarosite process. Trans. Nonferrous Met. Soc. China 2016, 26, 557–564. [Google Scholar] [CrossRef]
- Liu, F.; Shi, J.; Duan, J.; Zhou, L.; Xu, J.; Hao, X.; Fan, W. Significance of jarosite dissolution from the biooxidized pyrite surface on further biooxidation of pyrite. Hydrometallurgy 2018, 176, 33–41. [Google Scholar] [CrossRef]
- Xu, W.; Xie, Z.; Cui, X.; Zhao, K.; Zhang, L.; Mai, L.; Wang, Y. Direct growth of an economic green energy storage material: A monocrystalline jarosite-KFe3(SO4)2(OH)6-nanoplates@rGO hybrid as a superior lithium-ion battery cathode. J. Mater. Chem. A 2016, 4, 3735–3742. [Google Scholar] [CrossRef]
- Wu, N.; Tian, W.; Shen, J.; Qiao, X.; Sun, T.; Wu, H.; Zhao, J.; Liu, X.; Zhang, Y. Facile fabrication of a jarosite ultrathin KFe3(SO4)2(OH)6@rGO nanosheet hybrid composite with pseudocapacitive contribution as a robust anode for lithiumion batteries. Inorg. Chem. Front. 2019, 6, 192–198. [Google Scholar] [CrossRef]
- Wang, X.L.; Dong, L.Z.; Qiao, M.; Tang, Y.J.; Liu, J.; Li, Y.; Li, S.L.; Su, J.X.; Lan, Y.Q. Exploring the performance improvement of the oxygen evolution reaction in a stable bimetal-organic framework system. Angew. Chem.-Int. Ed. 2018, 57, 1–6. [Google Scholar]
- Gao, K.; Jiang, M.; Guo, C.; Zeng, Y.; Fan, C.; Zhang, J.; Reinfelder, J.R.; Huang, W.; Lu, G.; Dang, Z. Reductive dissolution of jarosite by a sulfate reducing bacterial community: Secondary mineralization and microflflora development. Sci. Total Environ. 2019, 690, 1100–1109. [Google Scholar] [CrossRef] [PubMed]
- Liu, C.; Ling, Z.; Zhang, J.; Bi, X.; Xin, Y. Laboratory Raman and VNIR spectroscopic studies of jarosite and other secondary mineral mixtures relevant to Mars. J. Raman Spectrosc. 2020, 51, 1575–1588. [Google Scholar] [CrossRef]
- Duan, Y.; Lee, J.Y.; Xi, S.; Sun, Y.; Ge, J.; Ong, S.J.H.; Chen, Y.; Dou, S.; Meng, F.; Diao, C.; et al. Anodic Oxidation Enabled Cation Leaching for Promoting Surface Reconstruction in Water Oxidation. Angew. Chem.-Int. Ed. 2021, 133, 7418–7425. [Google Scholar] [CrossRef]
- Liu, X.; Meng, J.; Ni, K.; Guo, R.; Xia, F.; Xie, J.; Li, X.; Wen, B.; Wu, P.; Li, M.; et al. Complete Reconstruction of Hydrate Pre-Catalysts for Ultrastable Water Electrolysis in Industrial-Concentration Alkali Media. Cell Rep. Phys. Sci. 2020, 1, 100241. [Google Scholar] [CrossRef]
- Hu, J.; Li, S.; Chu, J.; Niu, S.; Wang, J.; Du, Y.; Li, Z.; Han, X.; Xu, P. Understanding the Phase-Induced Electrocatalytic Oxygen Evolution Reaction Activity on FeOOH Nanostructures. ACS Catal. 2019, 9, 10705–10711. [Google Scholar] [CrossRef]
- Xiao, T.; Yang, C.; Lu, Y.; Zeng, F. One-pot hydrothermal synthesis of rod-like FeOOH/reduced graphene oxide composites for supercapacitor. Journal of Materials Science. Mater. Electron. 2014, 25, 3364–3374. [Google Scholar] [CrossRef]
- Ohtsuka, T.; Tanaka, S. Monitoring the development of rust layers on weathering steel using in situ Raman spectroscopy under wet-and-dry cyclic conditions. J. Solid State Electrochem. 2015, 19, 3559–3566. [Google Scholar] [CrossRef]
Figure 1.
(a) XRD patterns and (b) FT-IR spectra of various types of jarosite. SEM images of (c) KFe3(SO4)2(OH)6, (d) NaFe3(SO4)2(OH)6, (e) (H3O)Fe3(SO4)2(OH)6 and (f) (NH4)Fe3(SO4)2(OH)6.
Figure 1.
(a) XRD patterns and (b) FT-IR spectra of various types of jarosite. SEM images of (c) KFe3(SO4)2(OH)6, (d) NaFe3(SO4)2(OH)6, (e) (H3O)Fe3(SO4)2(OH)6 and (f) (NH4)Fe3(SO4)2(OH)6.

Figure 2.
(a) N2 adsorption-desorption isotherm curves, (b) the corresponding pore size distribution curves.
Figure 2.
(a) N2 adsorption-desorption isotherm curves, (b) the corresponding pore size distribution curves.

Figure 3.
(a,b) TEM images (the inset shows SAED), (c) HRTEM image, and (d–h) HAADF-TEM diagrams of (NH4)Fe3(SO4)2(OH)6 and the corresponding EDS elemental mapping images.
Figure 3.
(a,b) TEM images (the inset shows SAED), (c) HRTEM image, and (d–h) HAADF-TEM diagrams of (NH4)Fe3(SO4)2(OH)6 and the corresponding EDS elemental mapping images.

Figure 4.
Polarization curves for jarosite to conductive carbon black ratio of 1:1, (a) 1 M KOH (pH = 14) polarization curves, (b) Tafel plots derived from the Ph = 14 polarization curves, (c) 0.05 M H2SO4 (pH = 1) polarization curves, (d) 1 M PBS (pH = 7) polarization curves.
Figure 4.
Polarization curves for jarosite to conductive carbon black ratio of 1:1, (a) 1 M KOH (pH = 14) polarization curves, (b) Tafel plots derived from the Ph = 14 polarization curves, (c) 0.05 M H2SO4 (pH = 1) polarization curves, (d) 1 M PBS (pH = 7) polarization curves.

Figure 5.
CV curves of (a–c) (H3O)Fe3(SO4)2(OH)6, KFe3(SO4)2(OH)6, and NaFe3(SO4)2(OH)6 at different scan rates, (d) Cdl diagram of (H3O)Fe3(SO4)2(OH)6, KFe3(SO4)2(OH)6, and NaFe3(SO4)2(OH)6.
Figure 5.
CV curves of (a–c) (H3O)Fe3(SO4)2(OH)6, KFe3(SO4)2(OH)6, and NaFe3(SO4)2(OH)6 at different scan rates, (d) Cdl diagram of (H3O)Fe3(SO4)2(OH)6, KFe3(SO4)2(OH)6, and NaFe3(SO4)2(OH)6.

Figure 6.
(a) NH4-Fe3@KB-1, NH4-Fe3@KB-2, NH4-Fe3@KB-3 and IrO2 polarization curves; (b) NH4-Fe3@KB-1, NH4-Fe3@KB-2, NH4-Fe3@KB-3 at overpotentials reaching current densities of 10, 50, and 100 mA cm−2; (c,d) the Tafel slope and EIS diagram of NH4-Fe3@KB-1, NH4-Fe3@KB-2, NH4-Fe3@KB-3.
Figure 6.
(a) NH4-Fe3@KB-1, NH4-Fe3@KB-2, NH4-Fe3@KB-3 and IrO2 polarization curves; (b) NH4-Fe3@KB-1, NH4-Fe3@KB-2, NH4-Fe3@KB-3 at overpotentials reaching current densities of 10, 50, and 100 mA cm−2; (c,d) the Tafel slope and EIS diagram of NH4-Fe3@KB-1, NH4-Fe3@KB-2, NH4-Fe3@KB-3.

Figure 7.
CV curves of (a) NH4-Fe3@KB-1, (b) NH4-Fe3@KB-2, and (c) NH4-Fe3@KB-3 at different scan rates; (d) Cdl diagram of NH4-Fe3@KB-1, NH4-Fe3@KB-2, and NH4-Fe3@KB-3.
Figure 7.
CV curves of (a) NH4-Fe3@KB-1, (b) NH4-Fe3@KB-2, and (c) NH4-Fe3@KB-3 at different scan rates; (d) Cdl diagram of NH4-Fe3@KB-1, NH4-Fe3@KB-2, and NH4-Fe3@KB-3.

Figure 8.
(a) The chronoamperometric curve for NH4-Fe3@KB-1, (b) SEM after stability test, (c) XRD after stability test, (d) Raman after stability test.
Figure 8.
(a) The chronoamperometric curve for NH4-Fe3@KB-1, (b) SEM after stability test, (c) XRD after stability test, (d) Raman after stability test.

Publisher’s Note: MDPI stays neutral with regard to jurisdictional claims in published maps and institutional affiliations. |
© 2022 by the authors. Licensee MDPI, Basel, Switzerland. This article is an open access article distributed under the terms and conditions of the Creative Commons Attribution (CC BY) license (https://creativecommons.org/licenses/by/4.0/).
Share and Cite
MDPI and ACS Style
Chen, J.; Li, S.; Qu, Z.; Li, Z.; Wang, D.; Shen, J.; Li, Y. Study on Oxygen Evolution Reaction Performance of Jarosite/C Composites. Materials 2022, 15, 668. https://0-doi-org.brum.beds.ac.uk/10.3390/ma15020668
AMA Style
Chen J, Li S, Qu Z, Li Z, Wang D, Shen J, Li Y. Study on Oxygen Evolution Reaction Performance of Jarosite/C Composites. Materials. 2022; 15(2):668. https://0-doi-org.brum.beds.ac.uk/10.3390/ma15020668
Chicago/Turabian StyleChen, Junxue, Sijia Li, Zizheng Qu, Zhonglin Li, Ding Wang, Jialong Shen, and Yibing Li. 2022. "Study on Oxygen Evolution Reaction Performance of Jarosite/C Composites" Materials 15, no. 2: 668. https://0-doi-org.brum.beds.ac.uk/10.3390/ma15020668
Note that from the first issue of 2016, this journal uses article numbers instead of page numbers. See further details here.