Lung Lobe Segmentation Based on Lung Fissure Surface Classification Using a Point Cloud Region Growing Approach

1
College of Electrical and Information Engineering, Hunan University, Changsha 410082, China
2
College of Aerospace Science and Engineering, National University of Defense Technology, Changsha 410003, China
3
College of Biology, Hunan University, Changsha 410082, China
*
Author to whom correspondence should be addressed.
Algorithms 2020, 13(10), 263; https://doi.org/10.3390/a13100263
Submission received: 2 September 2020
/
Revised: 3 October 2020
/
Accepted: 13 October 2020
/
Published: 15 October 2020
(This article belongs to the Special Issue Machine Learning in Healthcare and Biomedical Application)
Abstract
:In anatomy, the lung can be divided by lung fissures into several pulmonary lobe units with specific functions. Identifying the lung lobes and the distribution of various diseases among different lung lobes from CT images is important for disease diagnosis and tracking after recovery. In order to solve the problems of low tubular structure segmentation accuracy and long algorithm time in segmenting lung lobes based on lung anatomical structure information, we propose a segmentation algorithm based on lung fissure surface classification using a point cloud region growing approach. We cluster the pulmonary fissures, transformed into point cloud data, according to the differences in the pulmonary fissure surface normal vector and curvature estimated by principal component analysis. Then, a multistage spline surface fitting method is used to fill and expand the lung fissure surface to realize the lung lobe segmentation. The proposed approach was qualitatively and quantitatively evaluated on a public dataset from Lobe and Lung Analysis 2011 (LOLA11), and obtained an overall score of 0.84. Although our approach achieved a slightly lower overall score compared to the deep learning based methods (LobeNet_V2 and V-net), the inter-lobe boundaries from our approach were more accurate for the CT images with visible lung fissures.
1. Introduction
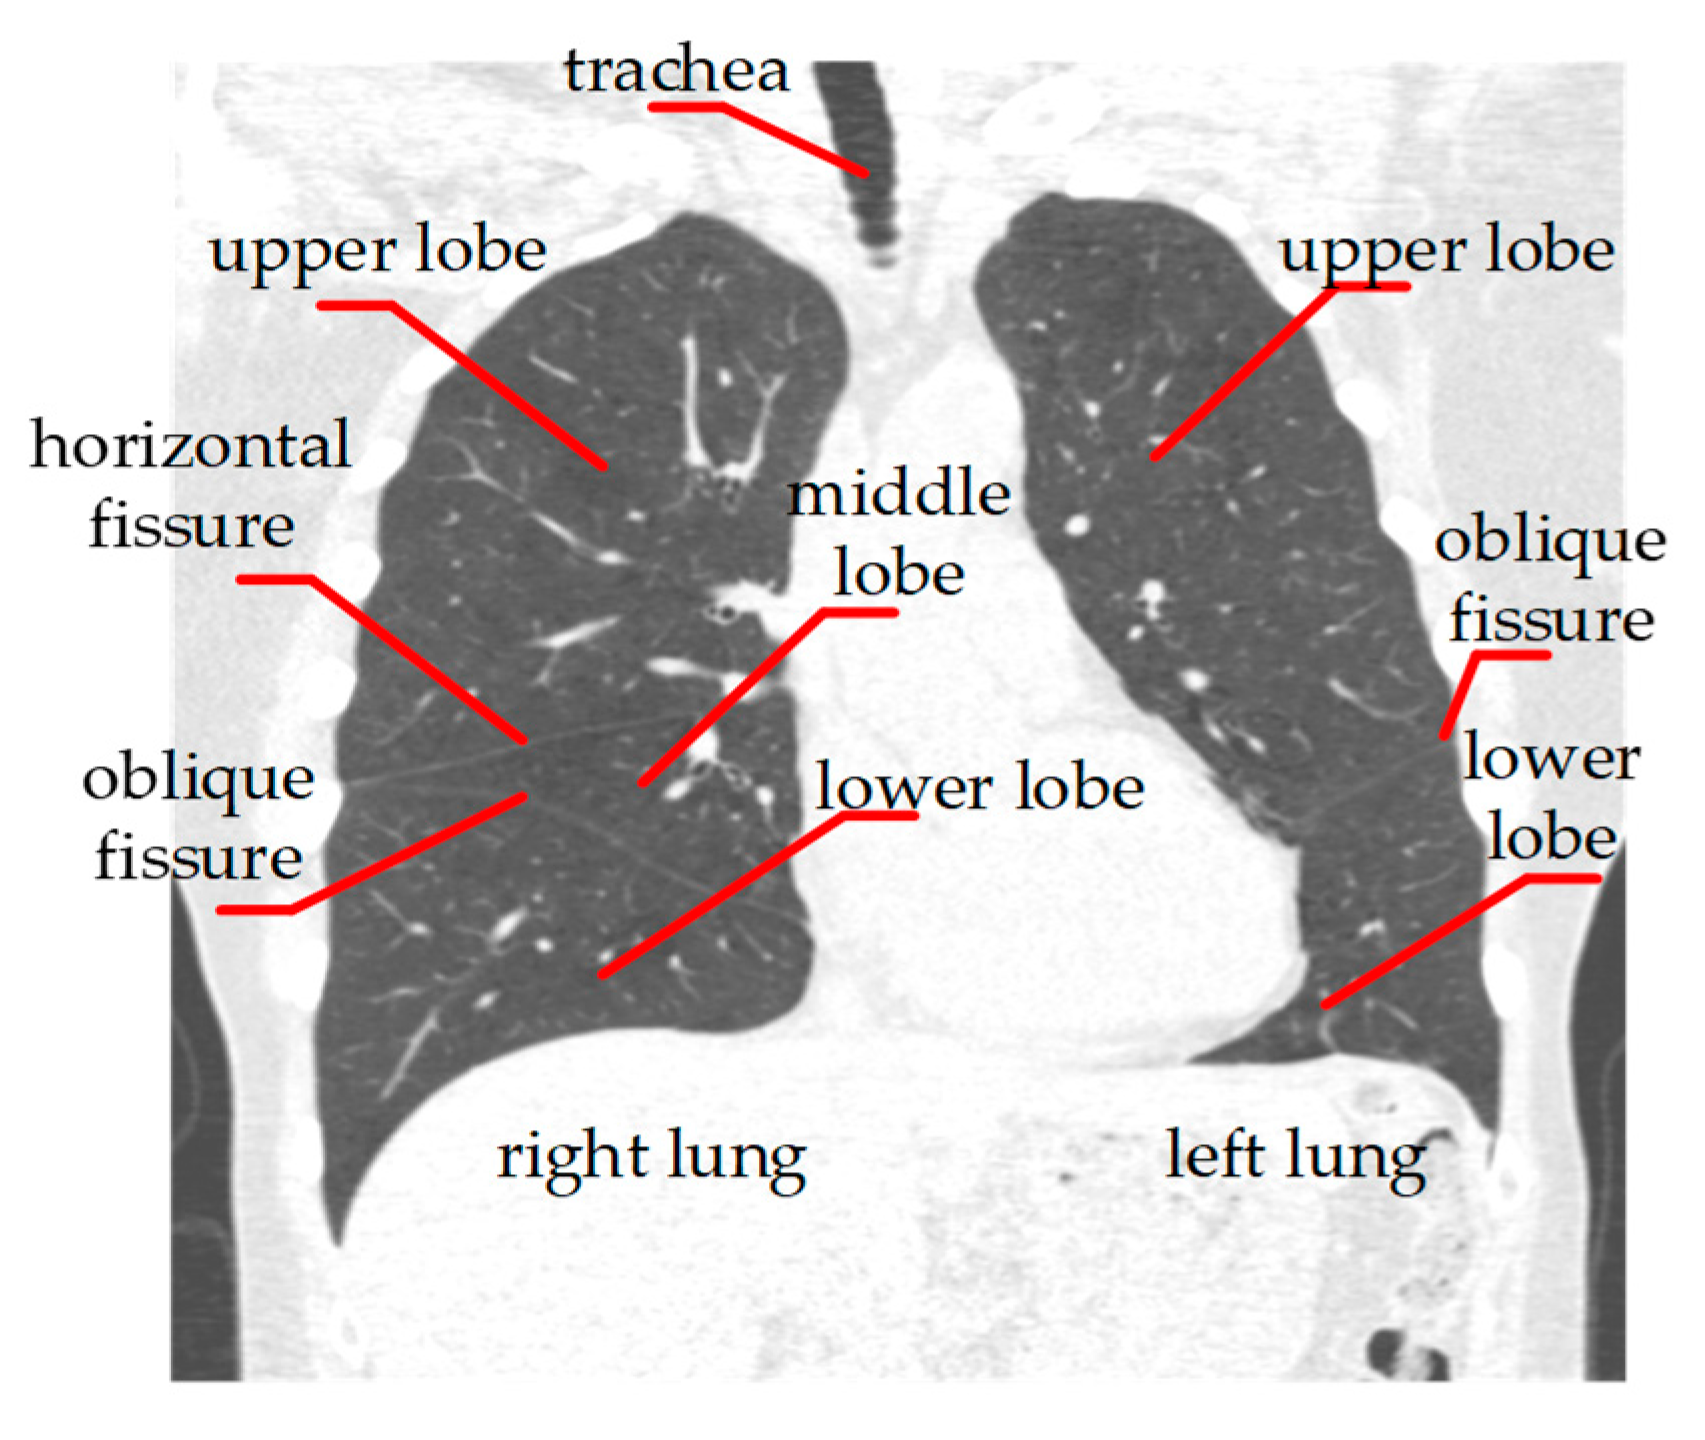
The human lung is divided into five lobes by the lung fissures and lung boundaries. The lung lobe is a relatively independent unit with regards to anatomical structure and function. Knowledge of the distribution of lung diseases among the lung lobes is important for treatment planning [1]. Moreover, lung lobe segmentation is indispensable for quantitative evaluation of lung diseases. Manual lung lobe segmentation suffers from subjective bias and variance. Therefore, there is a need to develop an automatic lung lobe segmentation method with high robustness and accuracy for clinical image data analysis.
Presently, a number of works have been devoted to lung lobe segmentation, which can be divided into two categories: the supervised machine learning method and the unsupervised traditional medical image processing method according to [2]. The traditional segmentation methods can be further classified into two categories: the algorithm based on the fusion of anatomical structure information and the method without the aid of anatomical structure.
Some machine learning methods have been used to segment lung lobes in recent years. George et al. used progressive holistically nested neural networks to predict lung lobe boundaries in 2D slices, and then combined them with the 3D random walker to achieve lung lobe segmentation [3]. Imran et al. proposed a fast and reliable progressive dense V-network [4]. In order to prevent over fitting, Ferreira et al. integrated several regularization methods on the basis of a residual network [5]. These methods based on deep learning can improve the efficiency of lung lobe segmentation to a certain extent, but they need a large amount of training data to be manually labeled by experts and high-end Graphics Processing Unit (GPU) equipment for training.
In the unsupervised traditional lung lobe segmentation algorithms, there are two main steps including lung segmentation and lung fissure detection. The former has been fully studied and is a stable and reliable algorithm [6,7,8]. On the other hand, automatic detection of pulmonary fissures is still challenging. There are some methods that use the local and global knowledge of lung anatomical structures to locate the lung fissure area, such as using airway and vessel information [9,10,11,12], which is based on the assumption that there are no blood vessels penetrating the pulmonary fissure and the airway tree can be divided into branch trees belonging to five lung lobes. These methods require segmentation of the airway and vessel tree, so the algorithm is time-consuming, and its performance depends on segmentation accuracy. For pathological data, once a segmentation error occurs, detection of the pulmonary fissure cannot be carried out successfully.
Because the right lung has two types of fissures, the horizontal fissure and the oblique fissure, it is necessary to classify them before segmenting the lobes correctly. In this paper, a lung lobe segmentation method based on lung fissure classification is proposed. In order to optimize the calculation and save space, we represent the pulmonary fissure surface extracted by a directional derivative of plate (DDoP) filter [13] as the point cloud data structure. Based on this, we can calculate the normal and curvature differences of the pulmonary fissure surface with high accuracy, and then realize the pulmonary fissure classification using a region growing approach. For missing pulmonary fissures after classification, they are interpolated and expanded by the multistage spline surface fitting method, and then combined fitted fissures with a lung mask to realize lung lobe segmentation. This method does not rely on anatomical structure information such as airways or vessels, and experiments show that it has higher reliability for detecting mild or moderate lesions on lung CT images.
2. Lung Lobe Segmentation Algorithm
Figure 1 shows the basic anatomical structures of the human lung. Based on this anatomical information, we propose a three—step lung lobe segmentation framework, which includes (1) lung segmentation, (2) lung fissure classification, and (3) lung fissure surface fitting and lung lobe segmentation. Among them, we adopt a relatively mature method for lung segmentation, which is briefly summarized. The other steps are more thoroughly described in this section.
2.1. Lung Segmentation
In order to segment lung lobes, it is necessary to correctly segment and identify the lungs including the left lung and right lung. We adopted the method proposed in [14], which mainly included coarse airway segmentation, lung segmentation, separation of left and right lung and pulmonary holes filling four steps. Firstly, the airway was located automatically by the morphological method after threshold processing in several cross-sectional slices at the top of the CT image and segmented by using the region growing method with leakage control, where voxels at the airway were taken as seed points. Secondly, the region growing method was further used to segment the lung. Then, after the removal of the airway, the separation of the left and right lung was judged by connectivity analysis. If not successful, the corrosion operator was run iteratively until the two were separated. Finally, by morphological closing operation, we filled the vessel holes to obtain the left and right lung masks.
2.2. Pulmonary Fissure Classification
The fissure formed by the bilayer visceral membrane in the lung is called the pulmonary fissure, which divides the lung into several lobes, as shown in Figure 1. After obtaining the left and right lungs, further pulmonary fissure extraction and classification are needed. Firstly, we used the DDoP filter and directional partition denoising and fusion algorithm to enhance and segment the lung fissure region in the CT image. Then, we used the point cloud to represent the sparse lung fissure surface, and finally we clustered the lung fissure according to the differences in the normal vector and curvature on the lung fissure surface.
2.2.1. Pulmonary Fissure Segmentation
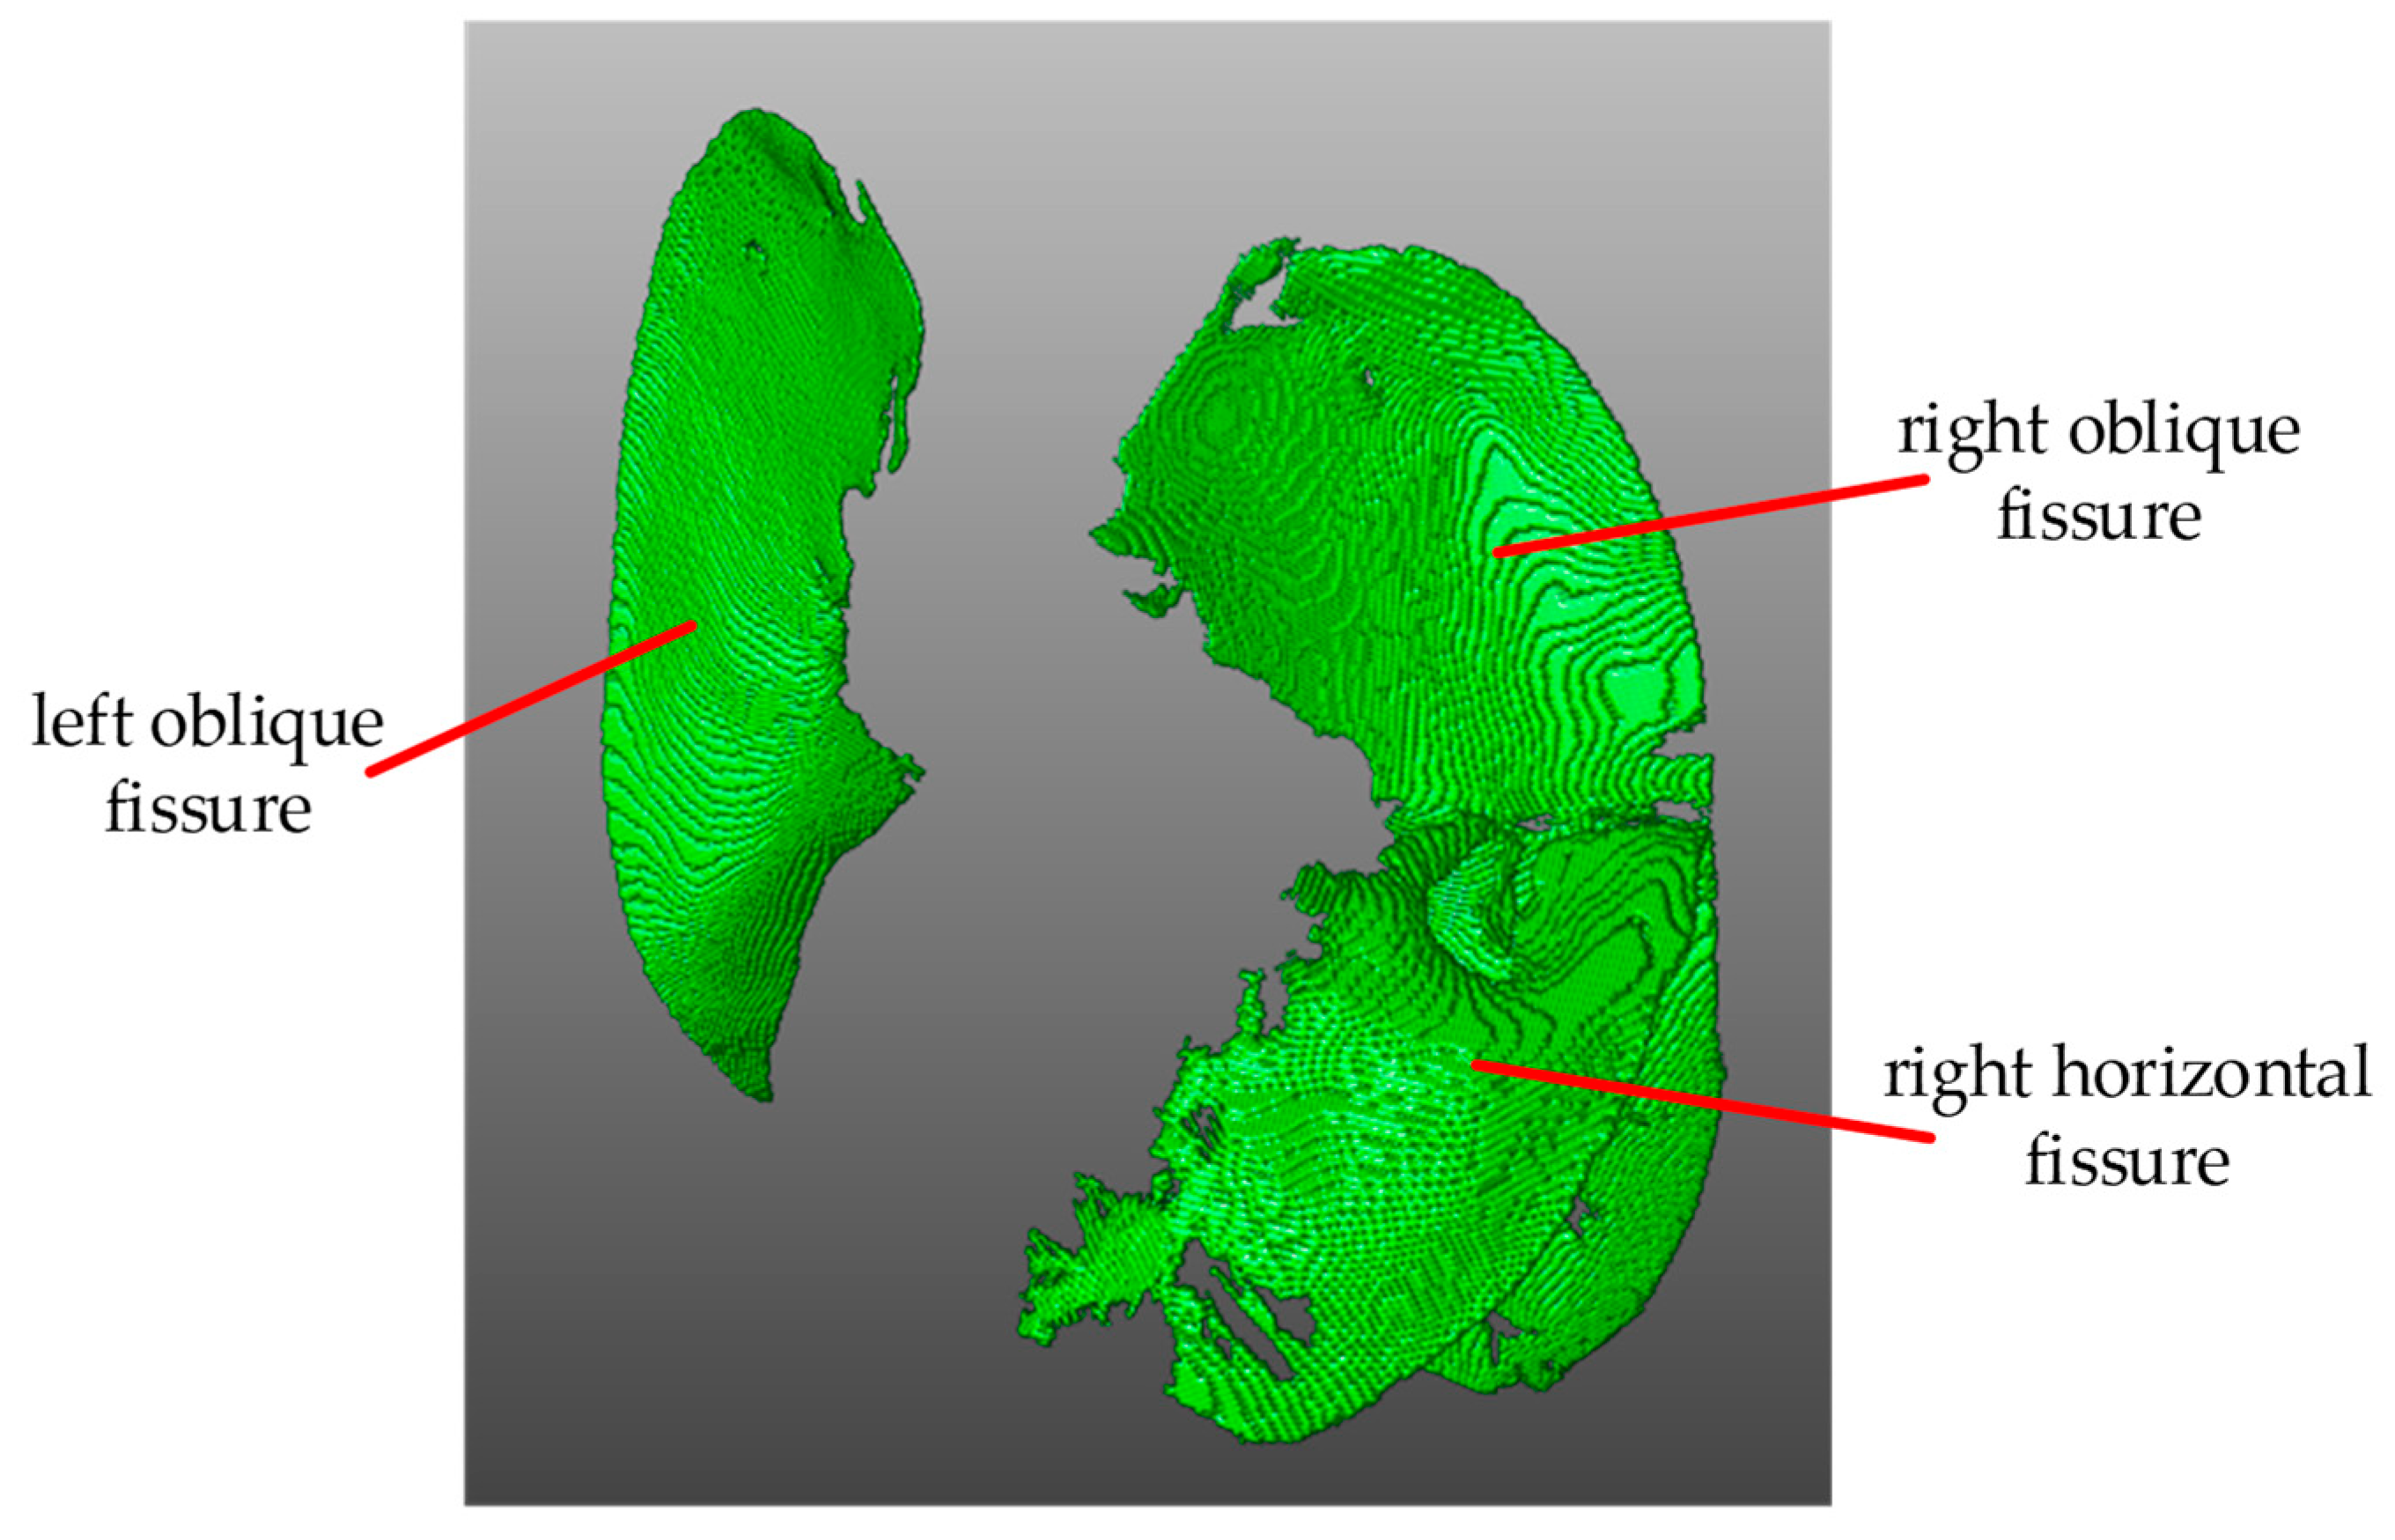
We used the method based on DDoP filter in [13] to segment the pulmonary fissure. The basic idea is to match the local CT image using a series of plate templates with different orientations. When the lung fissure surface is detected, the matching function obtains a high response and the corresponding template direction is the surface normal direction. Then, in postprocessing, directional partition denoising and the fusion algorithm based on the lung fissure’s features, including consistency of the normal vector and the largest connected area, are used to remove the nonpulmonary fissure surface structures and extract the lung fissure in 3D space. The segmentation result is shown in Figure 2.
2.2.2. Lung Fissure Surface Classification Using a Point Cloud Region Growing Approach
The overall process of classifying the lung fissures into the oblique fissure and horizontal fissure mainly includes two steps: (1) estimating the lung fissure surface’s normal vector and curvature based on point cloud data; (2) using the point cloud region growing approach to classify the lung fissure. The basic idea is to fuse the point cloud with similar properties (normal and curvature) in the neighborhood by the region growth algorithm, and then classify the pulmonary fissure according to the assumption that the oblique fissure area is greater than the horizontal fissure area.
There are several advantages to representing the lung fissure as a point cloud, including (1) the point cloud data can better represent the geometry shape, and it is convenient to calculate the normal vector and curvature more accurately, (2) unordered point cloud data saves memory space and has high computing efficiency, and (3) mature point cloud processing tools and algorithms can be used to complete specific pulmonary fissure analysis tasks, such as pulmonary fissure classification. The specific classification process is as follows.
Because the surface’s local area can be approximated as a plane, the problem of estimating the normal vector of a point on the surface can be solved by calculating the approximate plane’s normal vector. Estimating a plane by the least square method can be further simplified to analyze a covariance matrix formed for each neighborhood using principal component analysis [15]. The relationship between a covariance matrix and its eigenvalues and eigenvectors is formulated as Equation (1).
Each eigenvector of the covariance matrix shows a direction of a principal variation and the one associated with the smallest eigenvalue corresponds to the direction of the least variation, which is geometrically perpendicular to the direction of the most variation. This is the normal vector of the plane we simply estimate.
In order to further estimate the surface curvature, the dispersion of the point cloud along the normal direction is selected as the measurement criterion. The total dispersion of the neighborhood point cloud, i.e., the sum of distances from all neighborhood points to their center, can be obtained by
where denotes the center of gravity. Therefore, the proportion of the point cloud dispersion along the normal direction in total dispersion can be used to estimate surface curvature or variance as
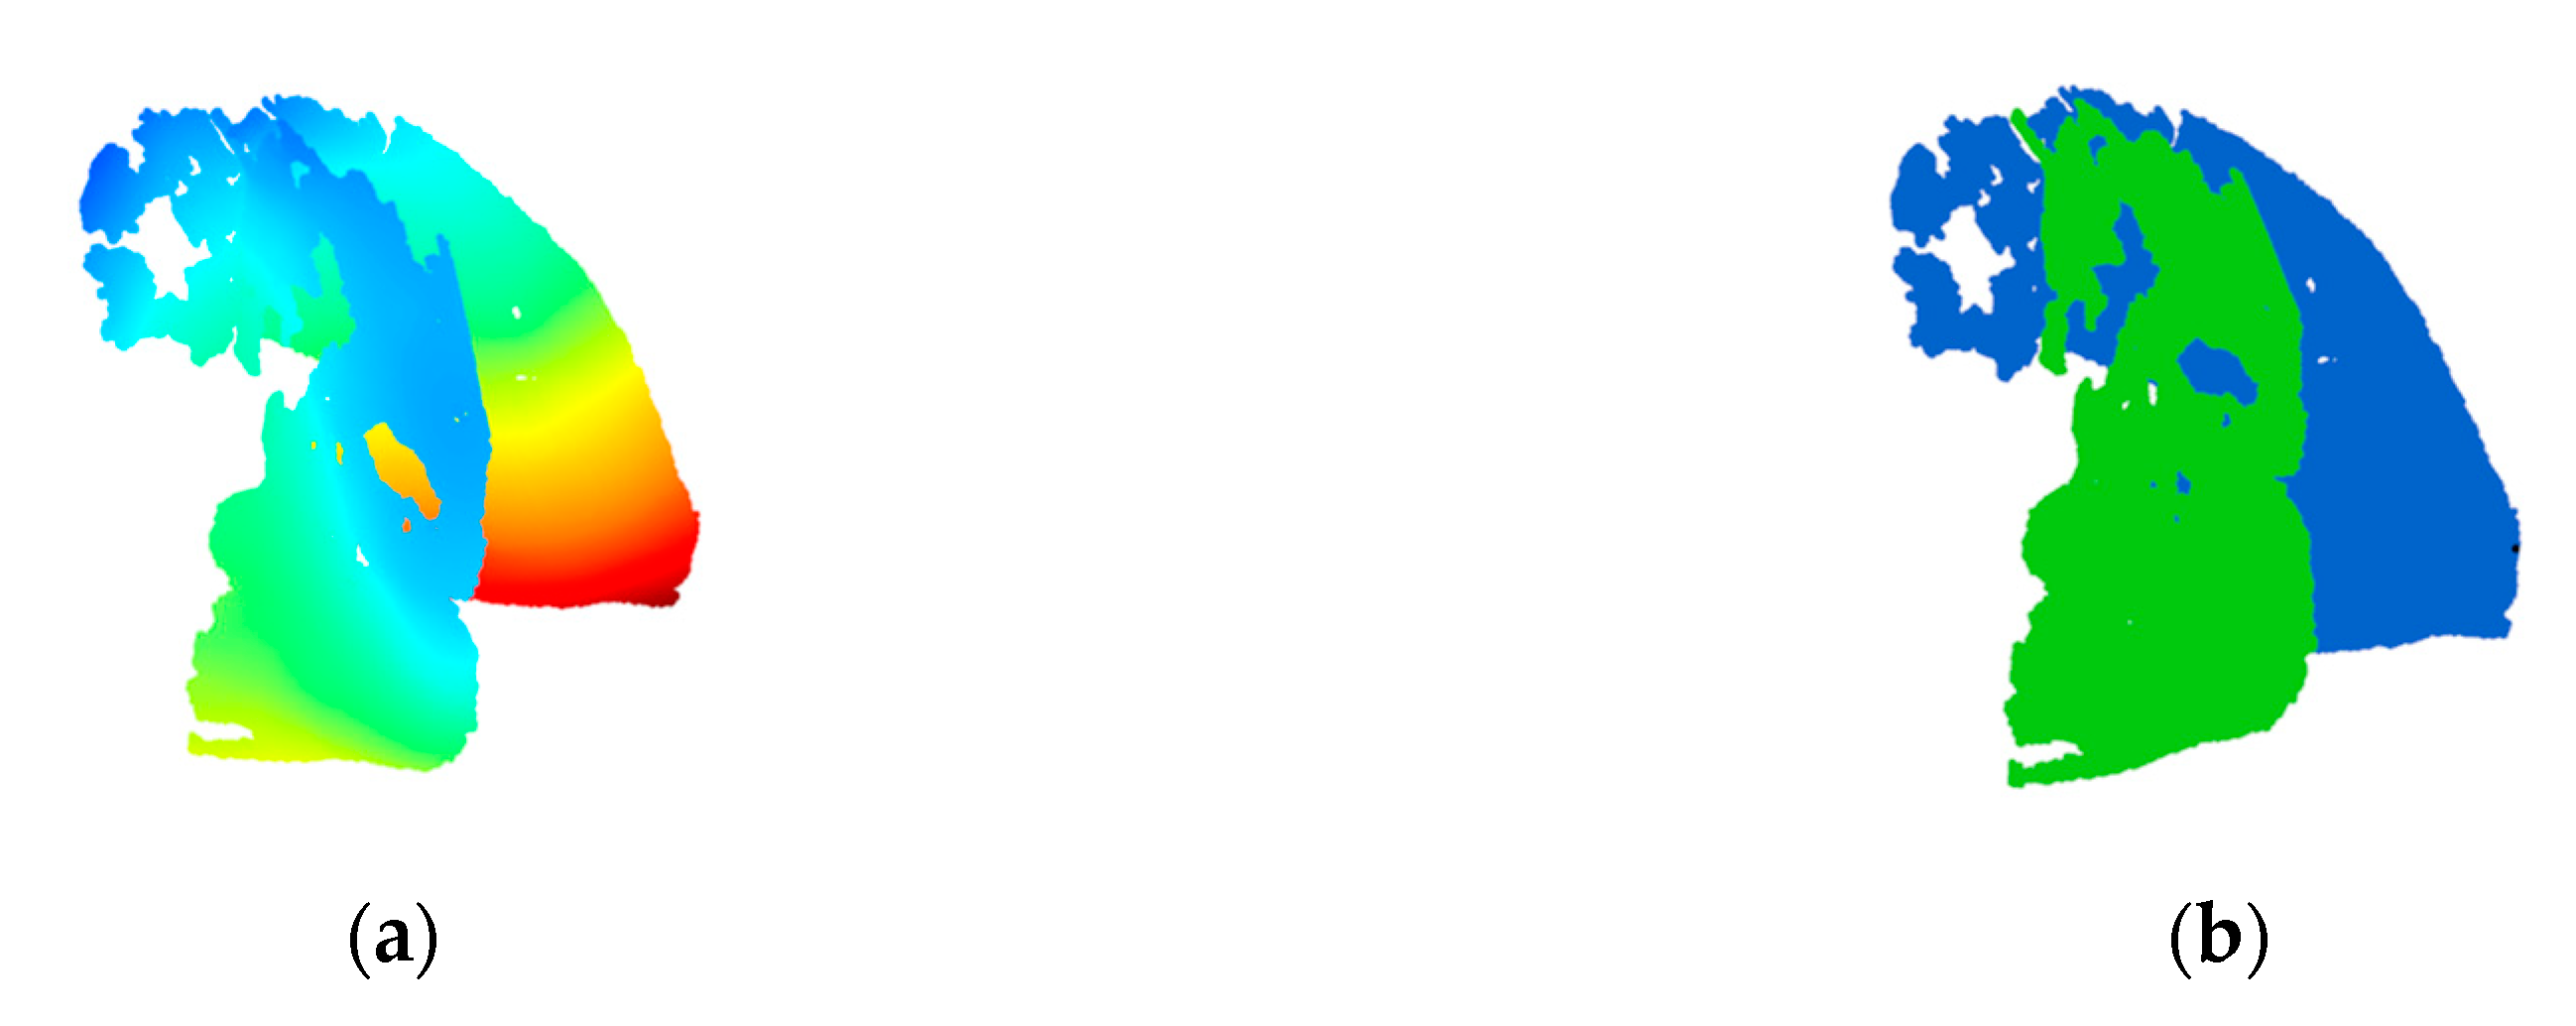
After obtaining the normal vector and curvature of the lung fissure surface, we could use them as a smooth constraint to realize the lung fissure clustering by the region growing method [16]. The algorithm is shown in Algorithm 1. The minimal curvature point is selected as the increasing seed point. If the normal vector intersection angle between the neighborhood point and the seed point is less than the set threshold, the neighborhood point is fused into the same category as the seed point and removed from the original point cloud set. If the curvature difference between the neighborhood point and the seed point is less than the set threshold, the neighborhood point is added to the seed point set for subsequent growth and the current seed point is removed from the seed point set. When the seed point set is empty, it indicates that this regional growing has been completed, and enters into the next region growing. This is repeated until all point clouds are marked. The angle threshold is set to 3° and the curvature threshold is set to 0.1. Figure 3 shows an example result of point cloud clustering, where the larger area is the oblique fissure and the smaller is the horizontal fissure.
| Algorithm 1 Regional growth clustering | |
| Input: | lung fissure point cloud , surface normal vector , surface curvature , neighborhood search function , curvature threshold , angle threshold |
| Output: | regional clustering set |
| 1: | initialization: available point cloud set: ; |
| 2: | whiledo |
| 3: | current growth region ; |
| 4: | current seed point set ; |
| 5: | = minimum curvature point in ; |
| 6: | ; |
| 7: | for to size({}) do |
| 8: | neighborhood point cloud of current seed ; |
| 9: | for to size({}) do |
| 10: | current neighborhood point ; |
| 11: | if {} contain and then |
| 12: | ; |
| 13: | ; |
| 14: | if then |
| 15: | ; |
| 16: | end if |
| 17: | end if |
| 18: | end for |
| 19: | end for |
| 20: | add the current growth region to the cluster set ; |
| 21: | end while |
2.3. Lung Fissure Surface Fitting and Lung Lobe Segmentation
As shown in Figure 3, there may be an incomplete lung fissure after classification, which results in the failure to segment adjacent lobes directly. To overcome it, we used the method named multistage B-spline fitting [17]. On the basis of the existing lung fissure information, we made up the missing lung fissure and extended it to the lung boundary to form a complete surface that could segment adjacent lung lobes. This method can take into account both the calculation efficiency and the fitting accuracy. The specific mathematical principle is as follows.
The fitting function can be constructed by using the known lung fissure coordinate . The component is defined as the independent variable, while the component is the function value, then the missing points’ coordinates can be obtained by the fitting function .
However, it is difficult to find a balance point between the shape smoothing and fitting accuracy in the B-spline fitting algorithm. The multistage B-spline fitting algorithm [17] can effectively overcome this problem by using top-down hierarchical control grid functions. Firstly, the coarse grid control function was used to get a rough estimate, and then the finer control grid function was iteratively used to fit the previous estimation error, finally giving a more accurate and smooth fitting function.
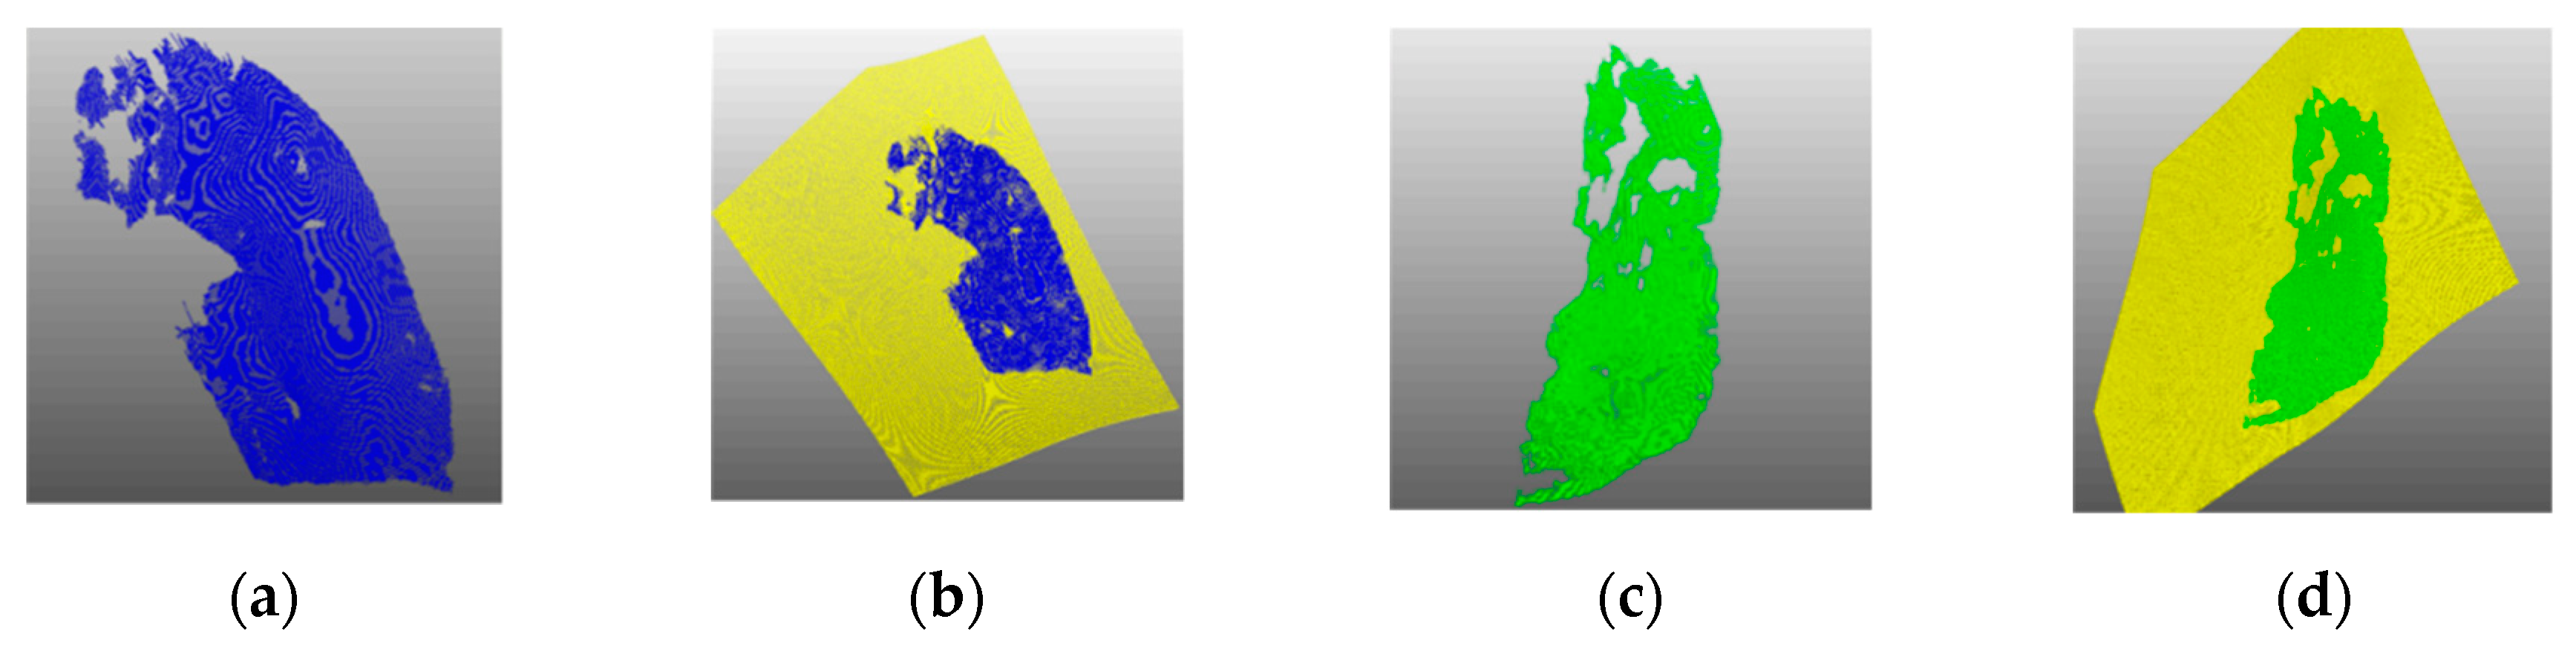
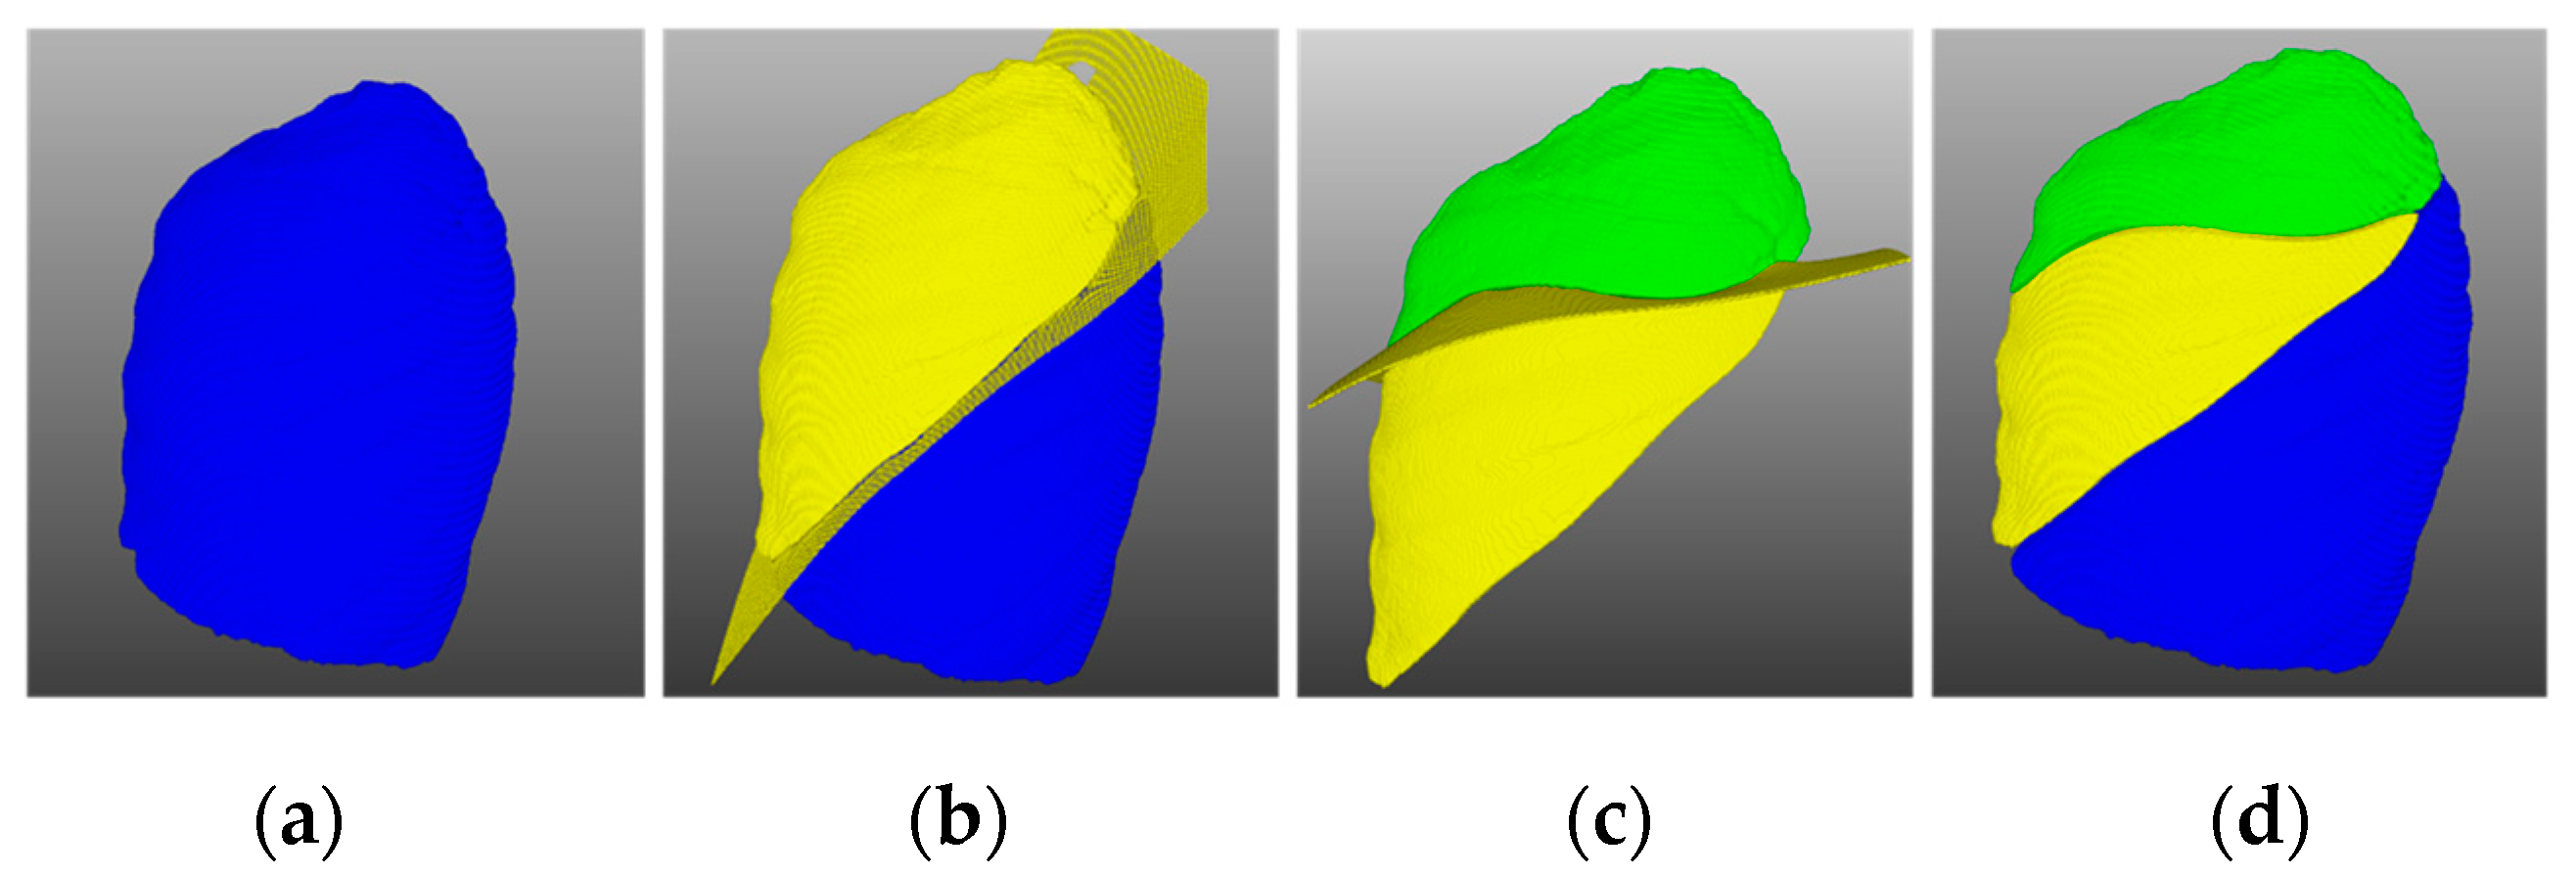
To verify the surface fitting effect, the incomplete right lung oblique fissure and horizontal fissure were taken as the fitting objects, their fitting results are shown in Figure 4. It can be seen that the fitting surface was smooth without deviation, could effectively fill the missing pulmonary fissure and ensure that it was consistent with the existing pulmonary fissure.
Through the above steps, the complete oblique fissure and horizontal fissure were fitted, and the lung could be easily separated into independent lung lobe units by using these surfaces. Since the right lung contains three lobes, we divided it in two steps. Firstly, the oblique fissure surface was used to segment the right lung into upper and lower parts, where the lower half was the lower lobe. Then we used the horizontal fissure surface to segment the upper half into upper lobe and middle lobe. The segmentation results are shown in Figure 5.
3. Experimental Results
We used data from 55 CT scans to verify the segmentation performance of the proposed method. This dataset was provided by the organizers of LOLA11 (Lobe and Lung Analysis 2011 Competition). It was obtained from a number of clinical institutions using different CT scanning equipment and covered different degrees of pathological data. At the same time, the competition organizers also provided the manual segmentation results for the performance evaluation of the segmentation methods. However, the gold standard data will not be released to the public and the segmentation results can only be uploaded to the competition website [18] for online evaluation.
In this section, the proposed method’s performance was verified from two aspects, including visual and quantitative evaluation. Mevislab [19] was used for 3D visualization. The evaluation score was obtained by observing and quantifying the size of the coincidence area between the segmentation results and the real lung lobes. The method for evaluating the size is
where is the lung segmentation result and is the lung lobe gold standard.
3.1. Visual Evaluation
This section shows the representative lung lobe segmentation results, and compares our method with the segmentation method based on airway or vessel anatomical information.
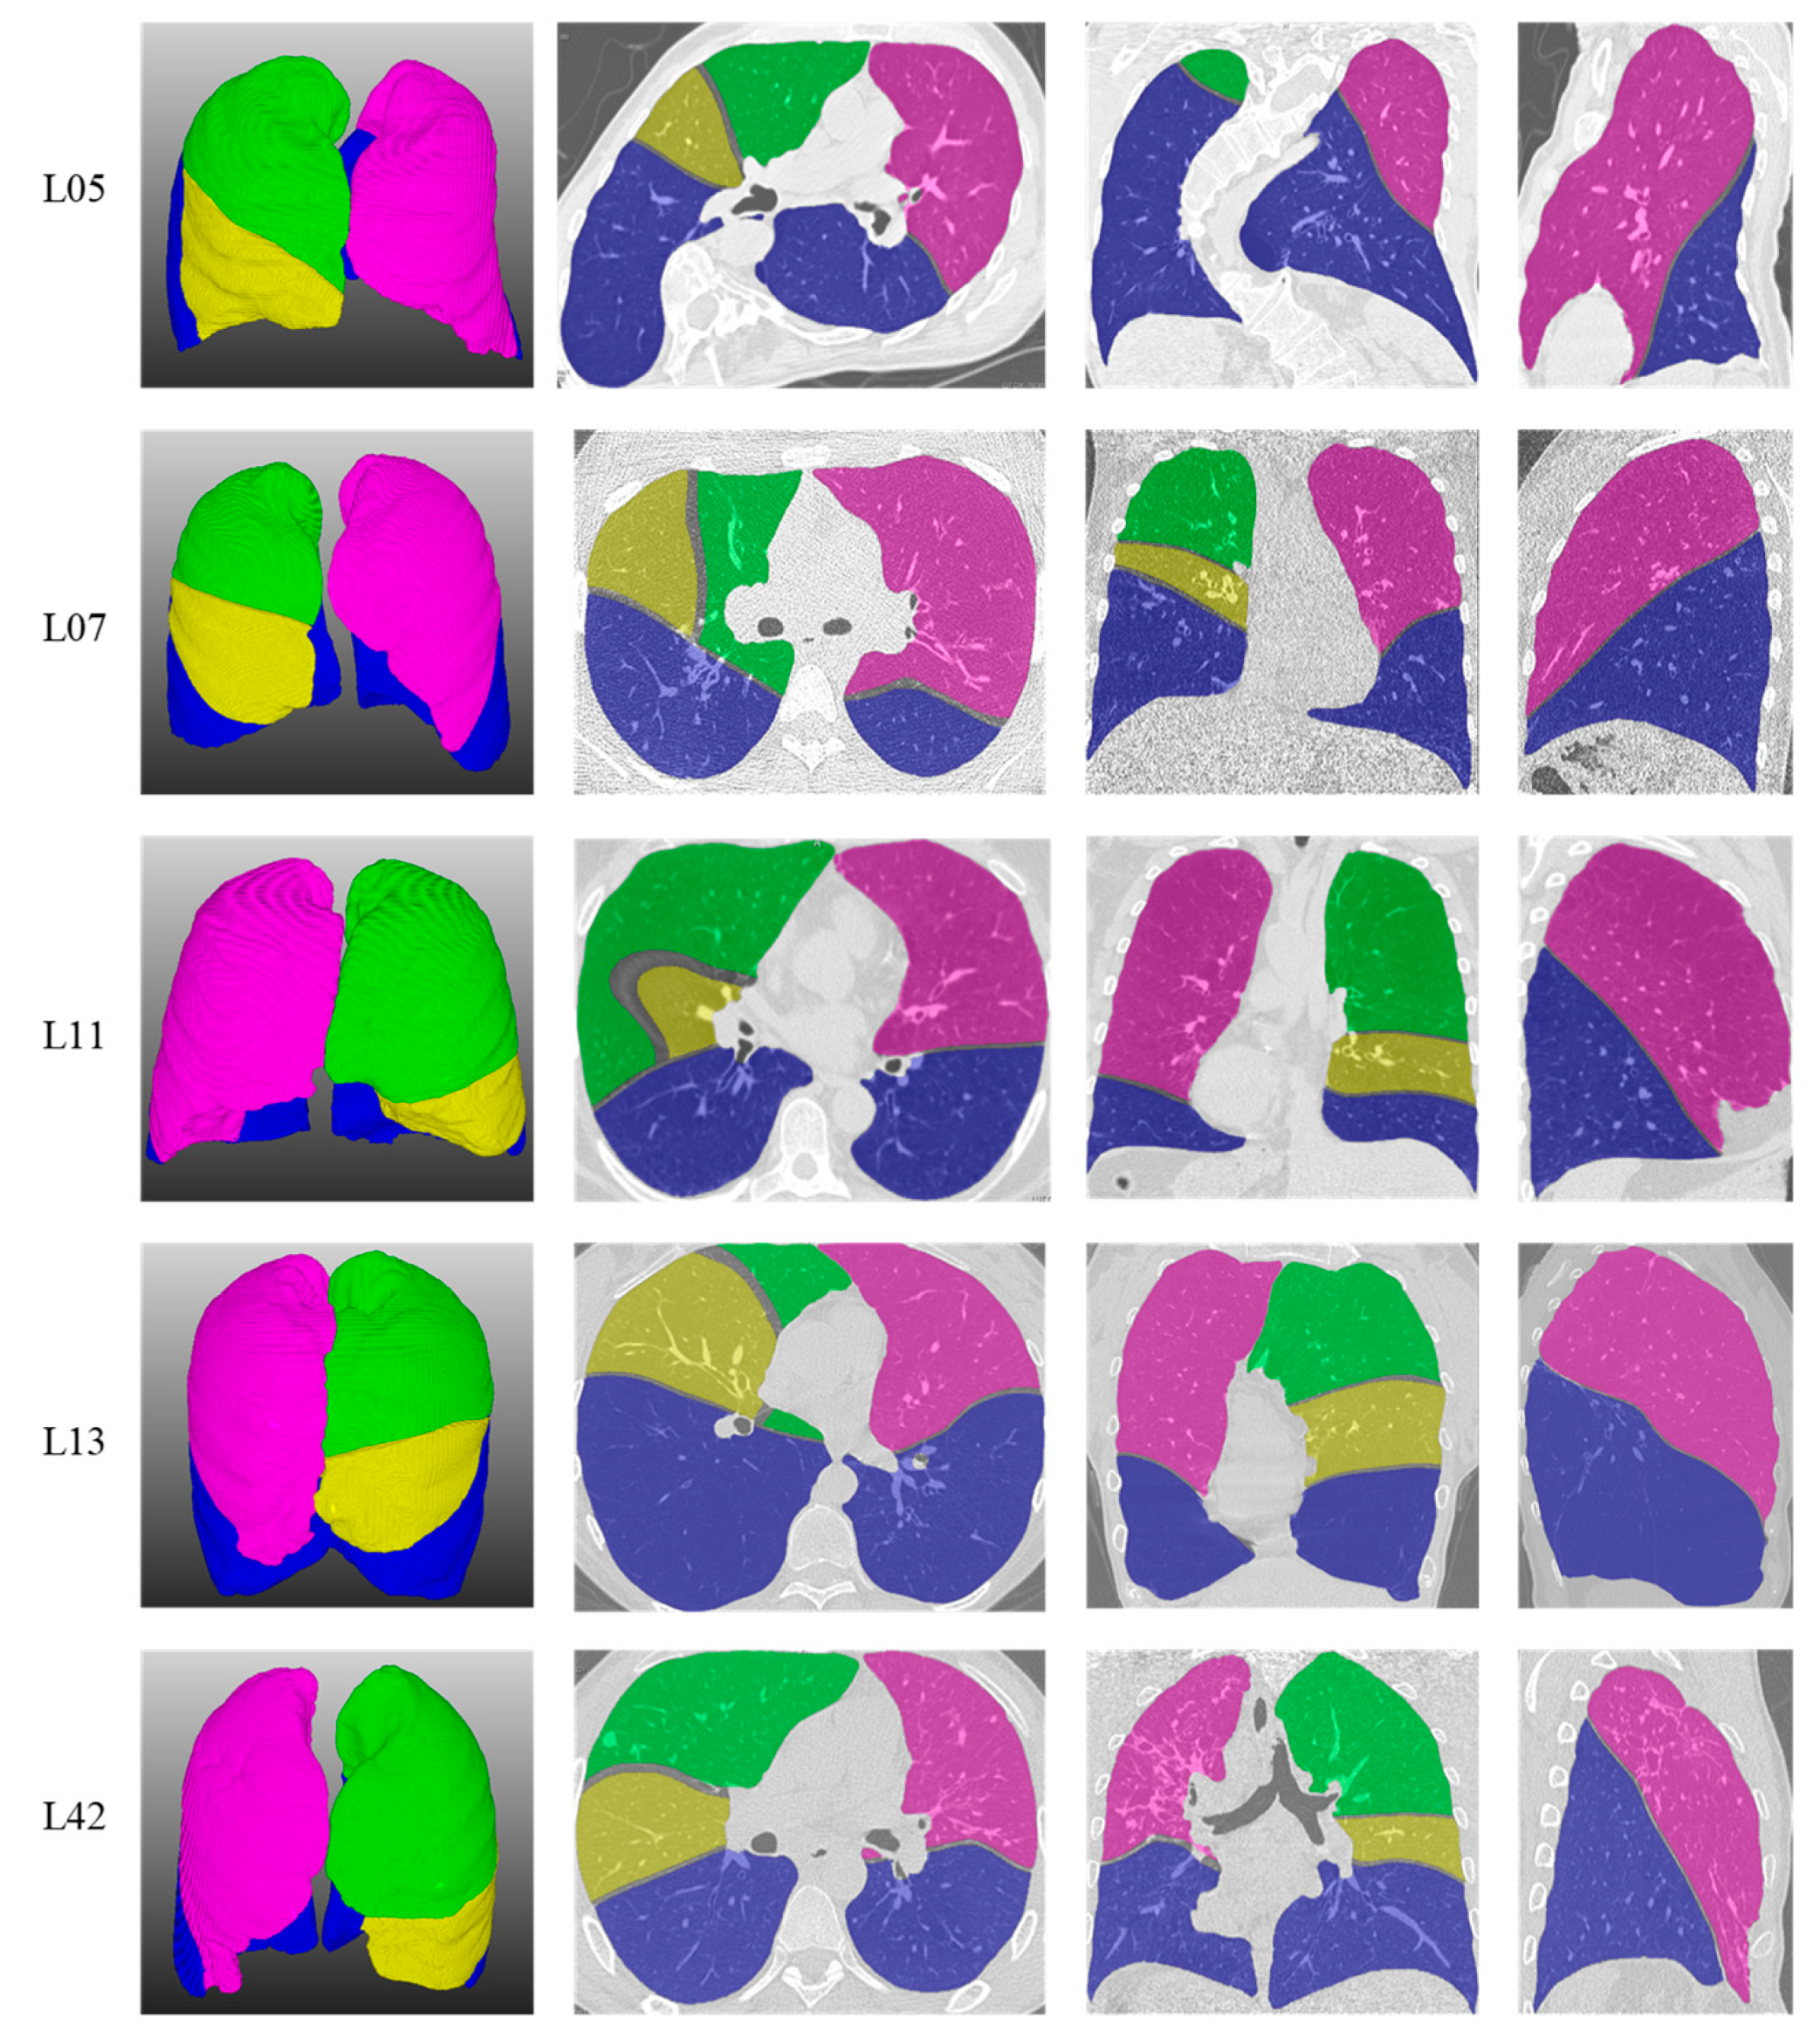
As shown in Figure 6, five representative lung lobe segmentation examples were selected here. Rows 1 to 5 are case 05, case 07, case 11, case 13 and case 42 in LOLA11, respectively. Columns 1 to 4 show the pulmonary lobe segmentation 3D results and the effects of superimposing the original data on the segmentation results’ transverse, coronal and sagittal planes, respectively. It can be seen from the L05 that although case 05 showed severe deformation due to scoliosis, the segmentation results using the proposed method were not affected and the boundaries of the lung lobe segmentation results were close to the real boundaries. Although case 07 was a low-dose CT image and the noise interference was serious, the segmentation results for L07 show that this method can still obtain a better segmentation effect. Pulmonary fibrosis was serious in case 11, but because of the strong noise suppression ability of the detection method, the lung lobe boundaries in L11 were close to the real pulmonary fissure and were not affected by noise. Case 42, from an emphysema patient, also achieved better segmentation results, as shown in L42. Experimental results showed that the proposed segmentation method not only achieved good segmentation performance on high-quality CT data, but also could segment the lung lobe correctly in pathological cases.
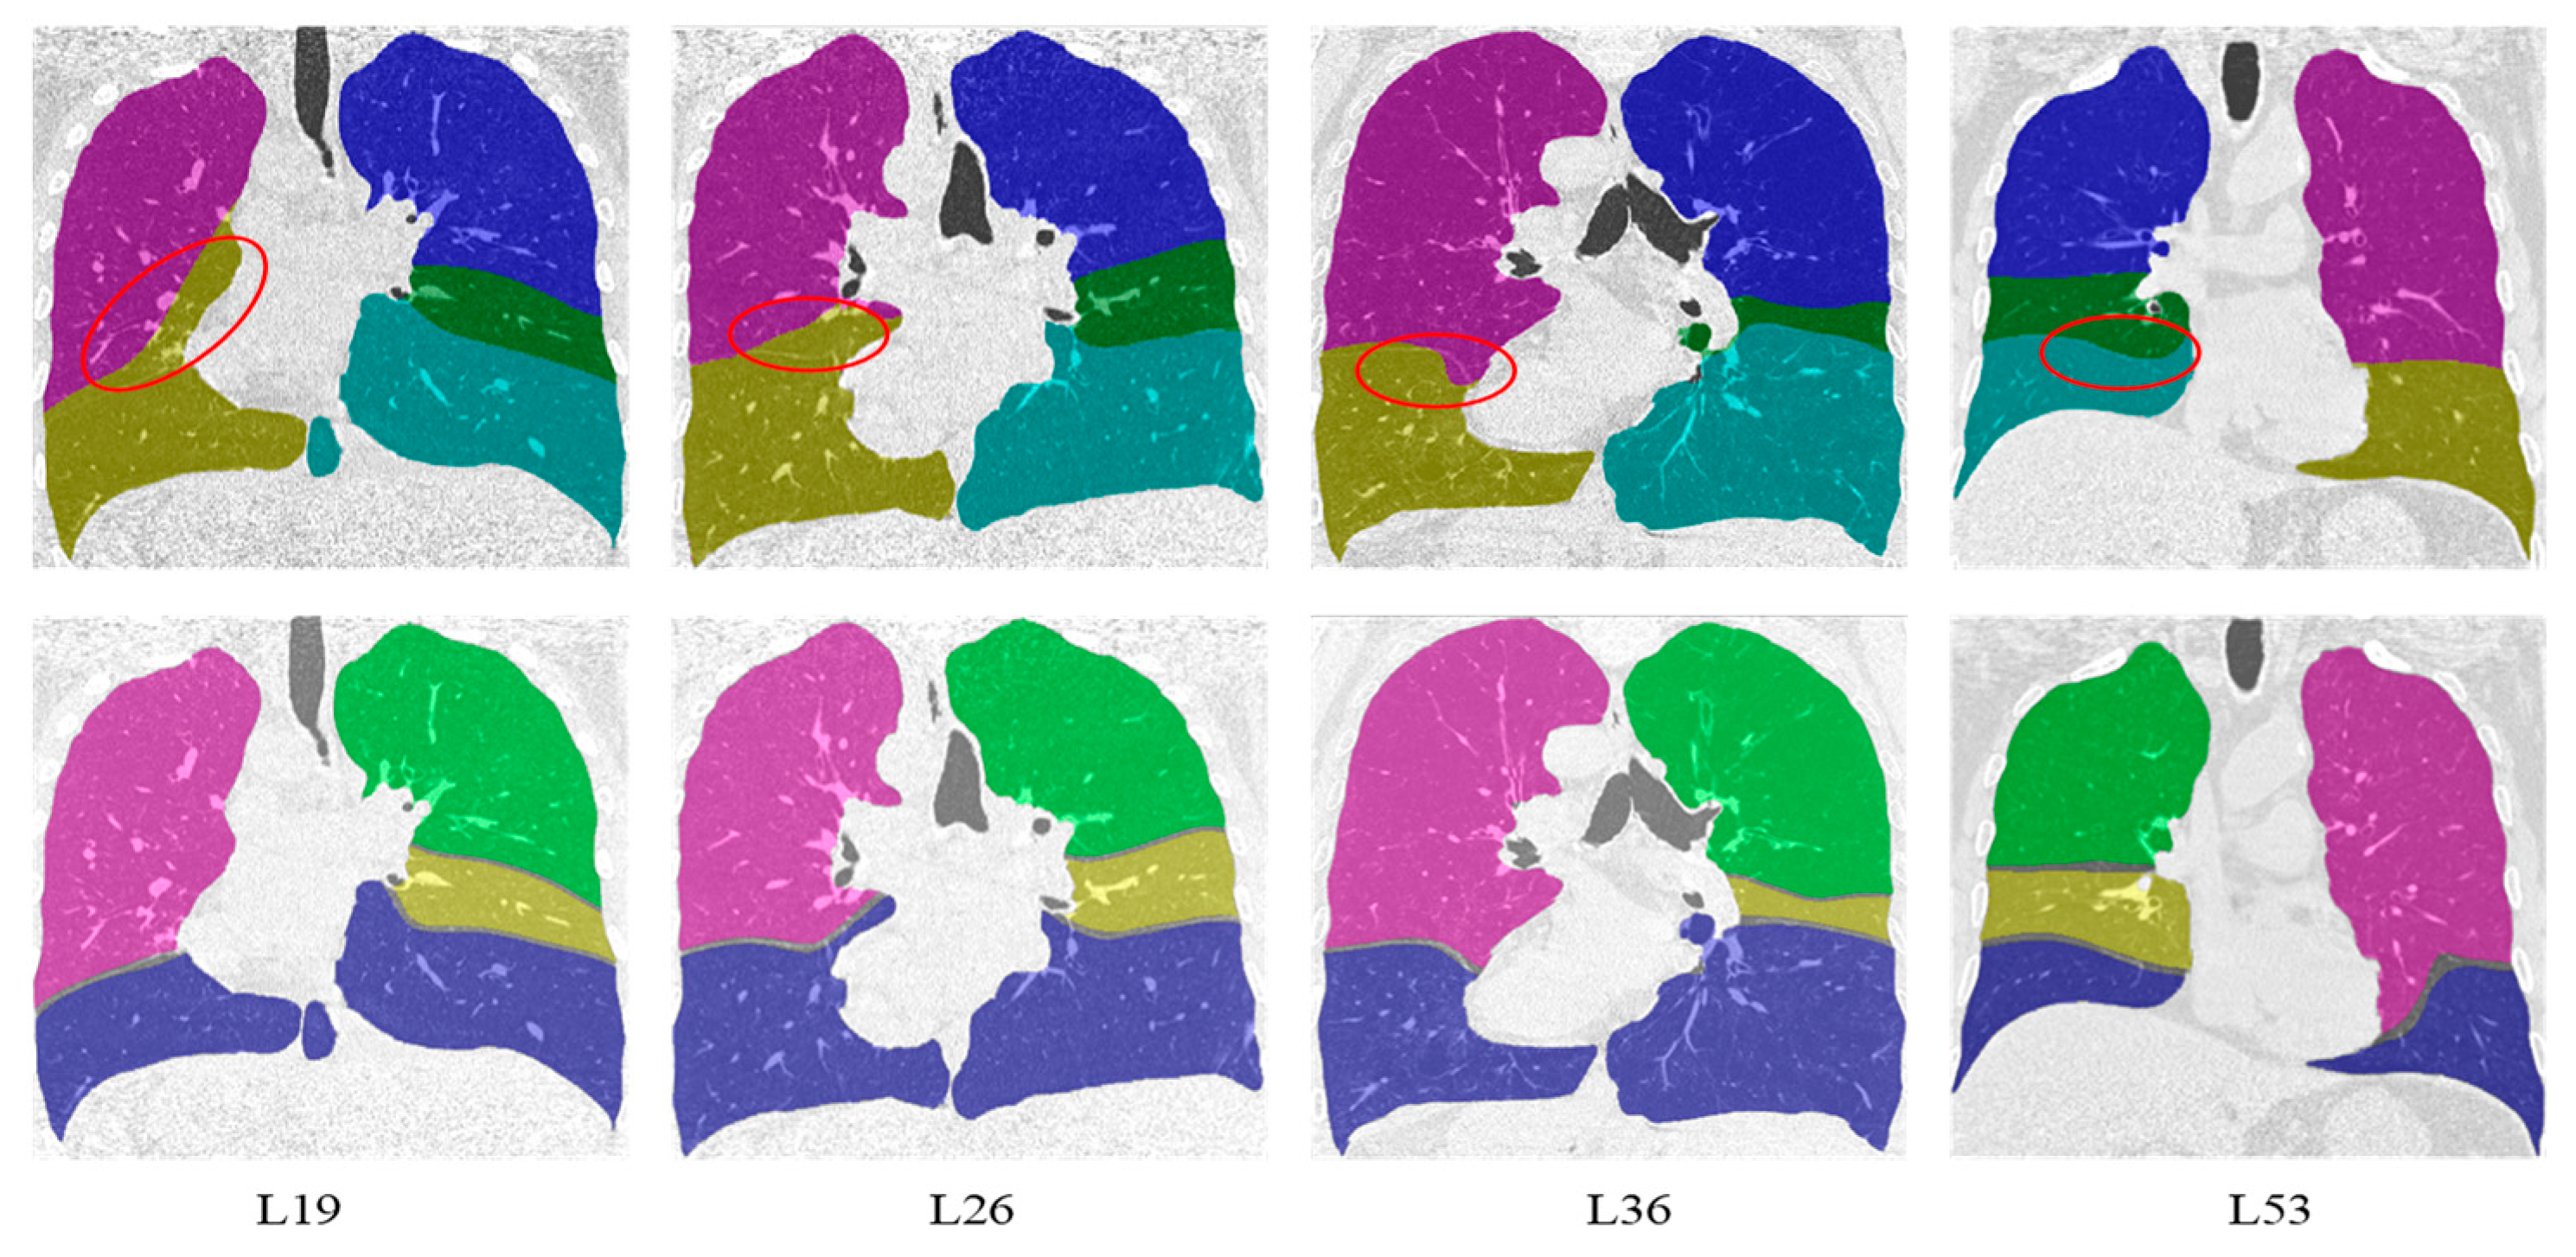
Compared with the lung lobe segmentation algorithm proposed by Doel et al. in [12], our algorithm has better performance in detecting visible pulmonary fissures because it is not affected by the segmentation accuracy of airways and vessels. The first and second lines in Figure 7 show the representative effects of superimposing the original data on the segmentation results’ coronal planes using Doel’s method and ours, respectively. From left to right are the results of case 19, case 26, case 36, and case 53. For Doel’s method, the areas marked with a red ellipse were the location of error segmentation. The possible reasons for these errors included two aspects: (1) the pulmonary fissure candidate areas located by the airway and vessel information were not accurate, and (2) the weak pulmonary fissures with uneven gray scale were missed.
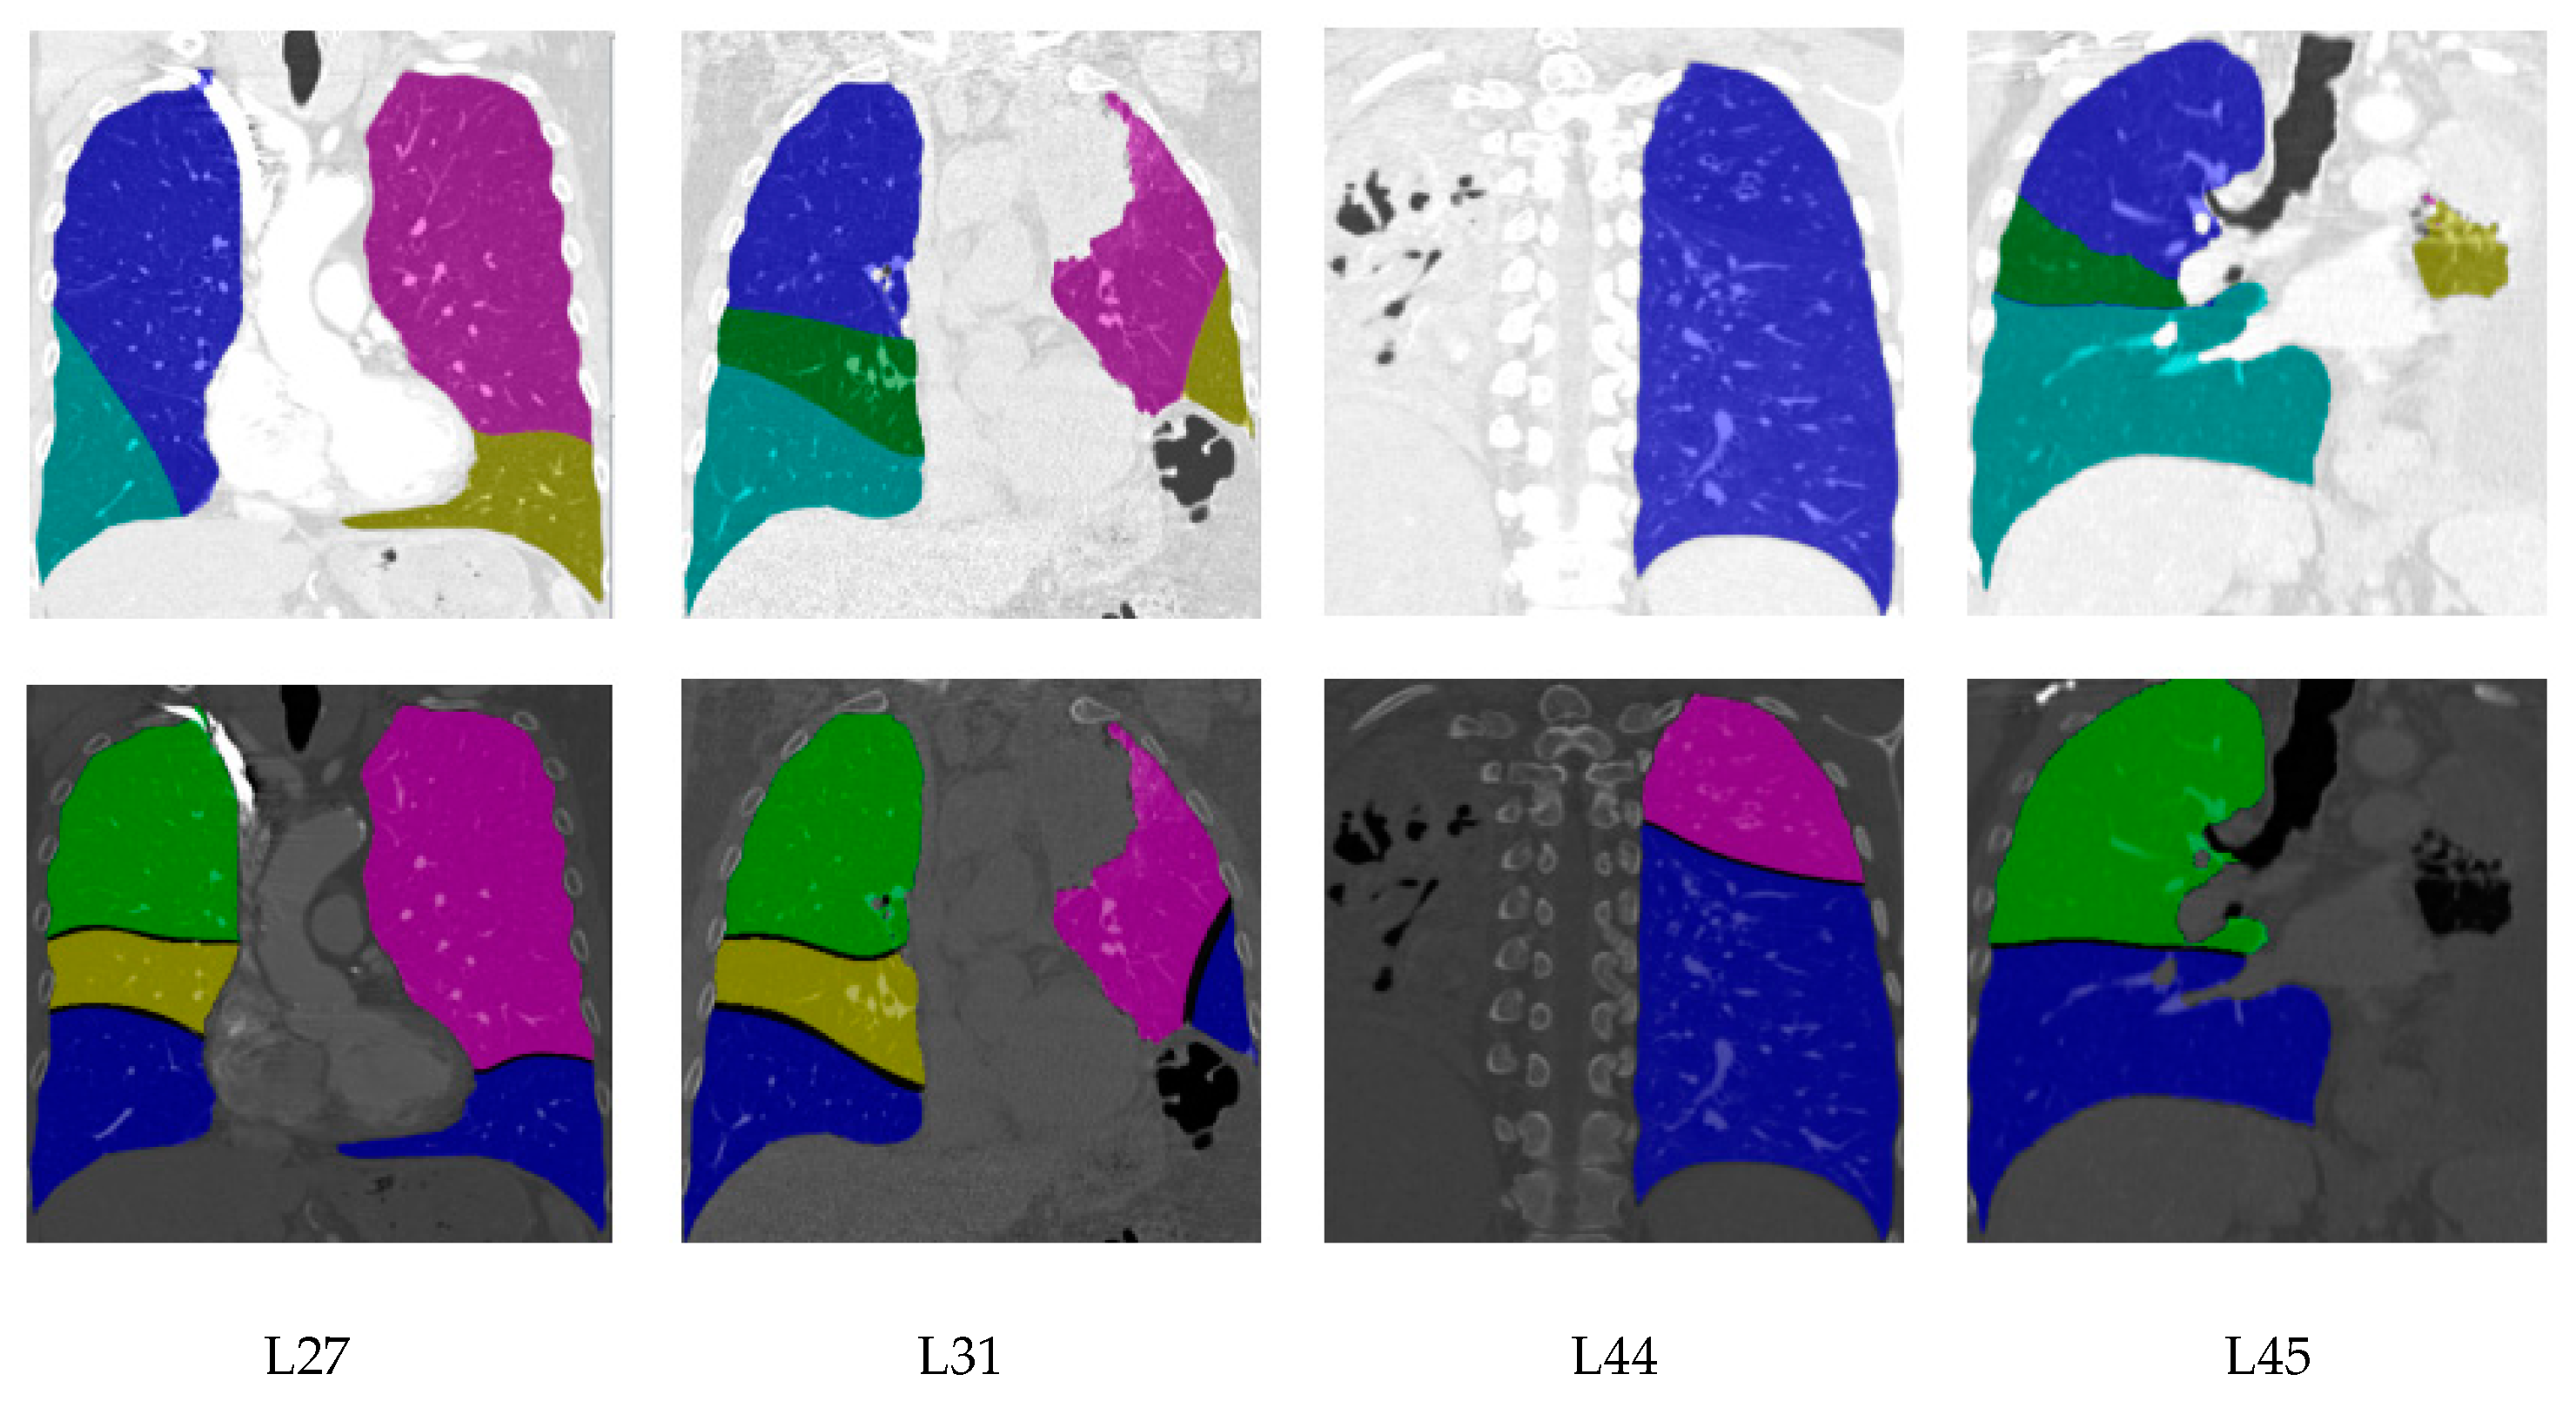
Besides, segmentation results for cases with moderate and low scores are shown in Figure 8. For case 27, the right middle lobe from our method and Doel’s method was inaccurate due to the incomplete horizontal fissure. For case 31, case 44 and case 45, the lung segmentation results were poor because of the invisible lung boundaries caused by lung disease, which directly affected the performance of the lobe segmentation. Furthermore, as demonstrated in L45, Doel’s method had the ability to construct the right middle lobe for the CT image with invisible lung fissures, while the proposed method could not deal with this situation.
3.2. Quantitative Evaluation
The quantitative evaluation results came from the online evaluation system of the competition website. The 55 LOLA11 cases’ segmentation results were uploaded to the competition website, and the background evaluation system executed the evaluation procedure and fed back the evaluation results. Specifically, according to Formula (4), each lung lobe’s coincidence degree in each data object was calculated, and then the coincidence degree mean value from each type of lung lobe was calculated. The overall score was the average value of the five lung lobes’ mean coincidence degrees. Furthermore, we used six other quantitative evaluation indicators based on the mean statistics including variance (SD), minimum (Min), quarter (Q1), median (Median), three-quarter (Q3) and maximum (Max).
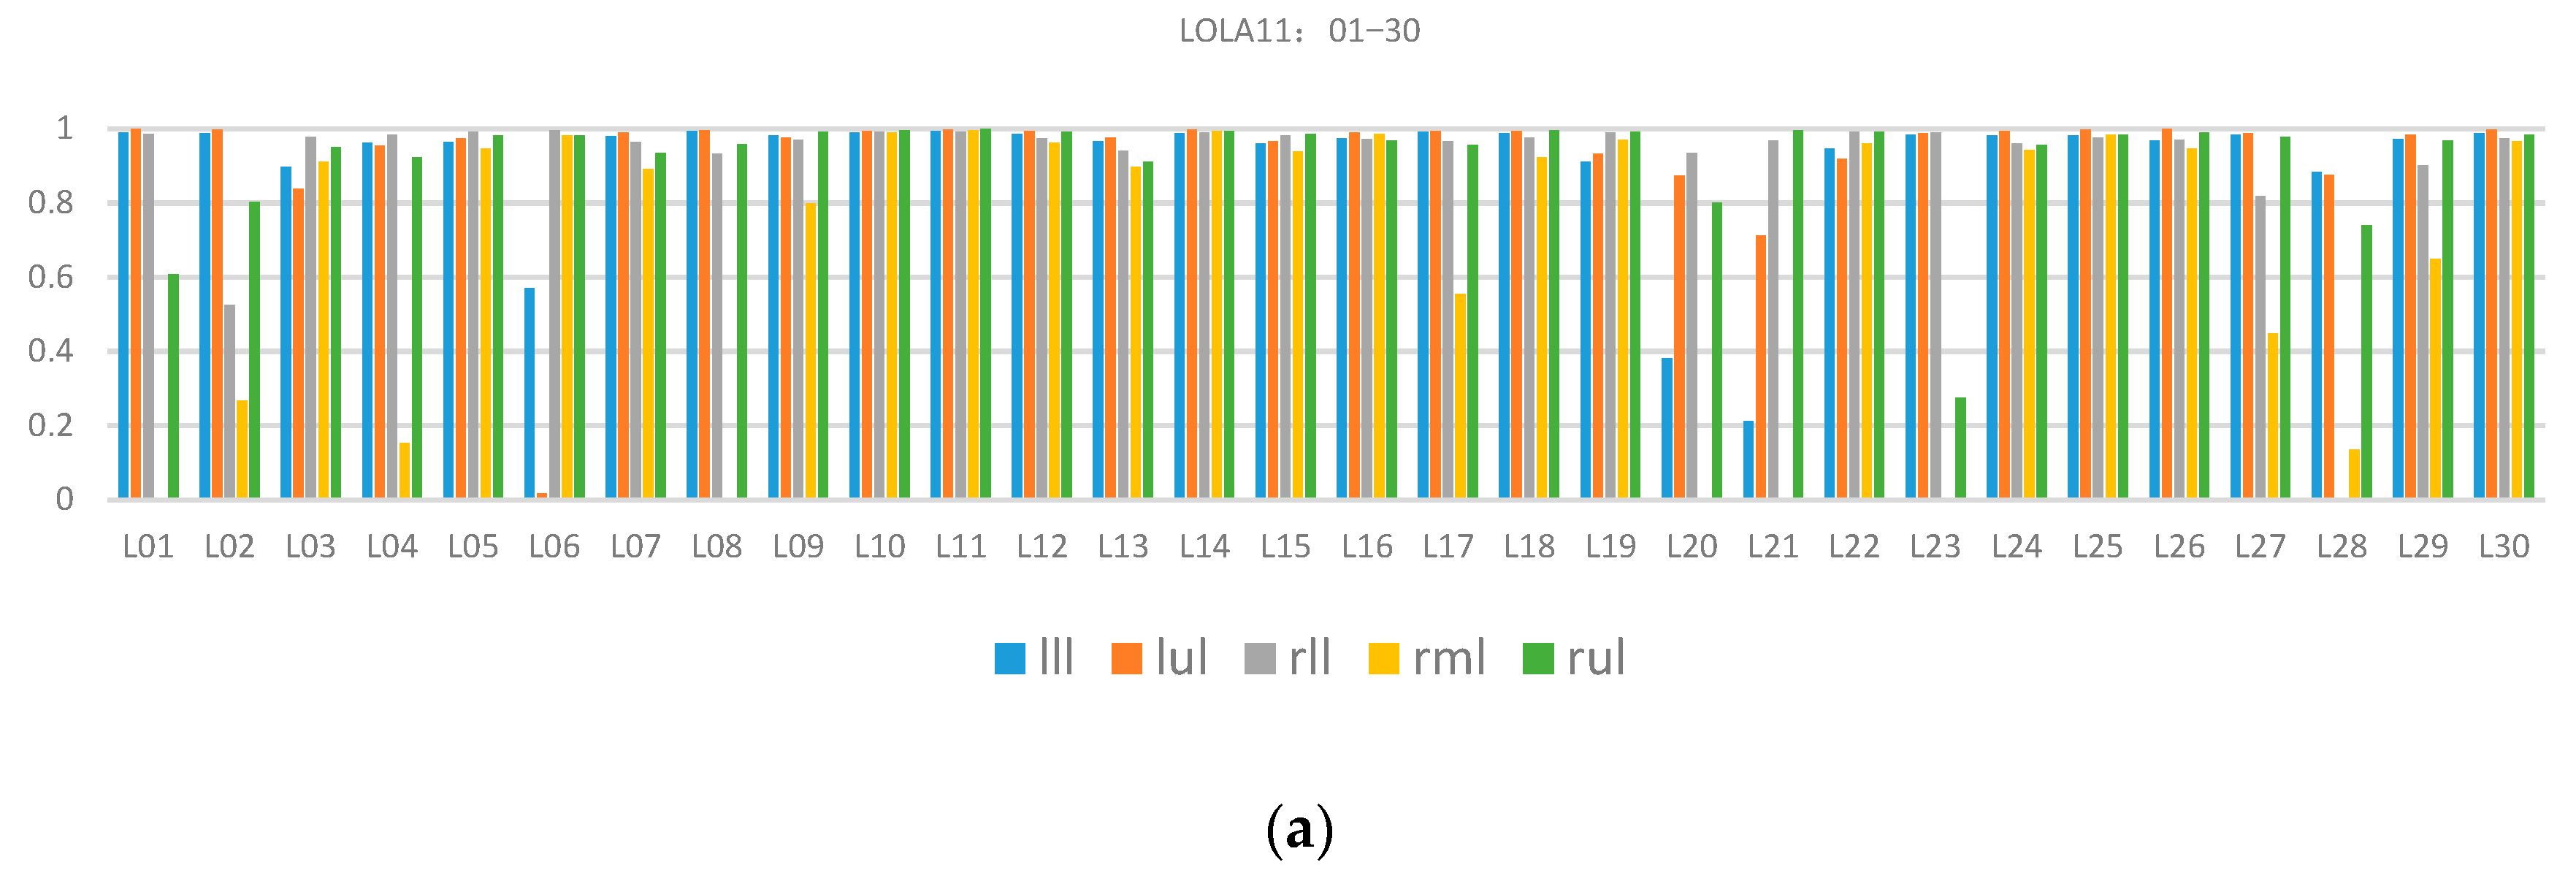
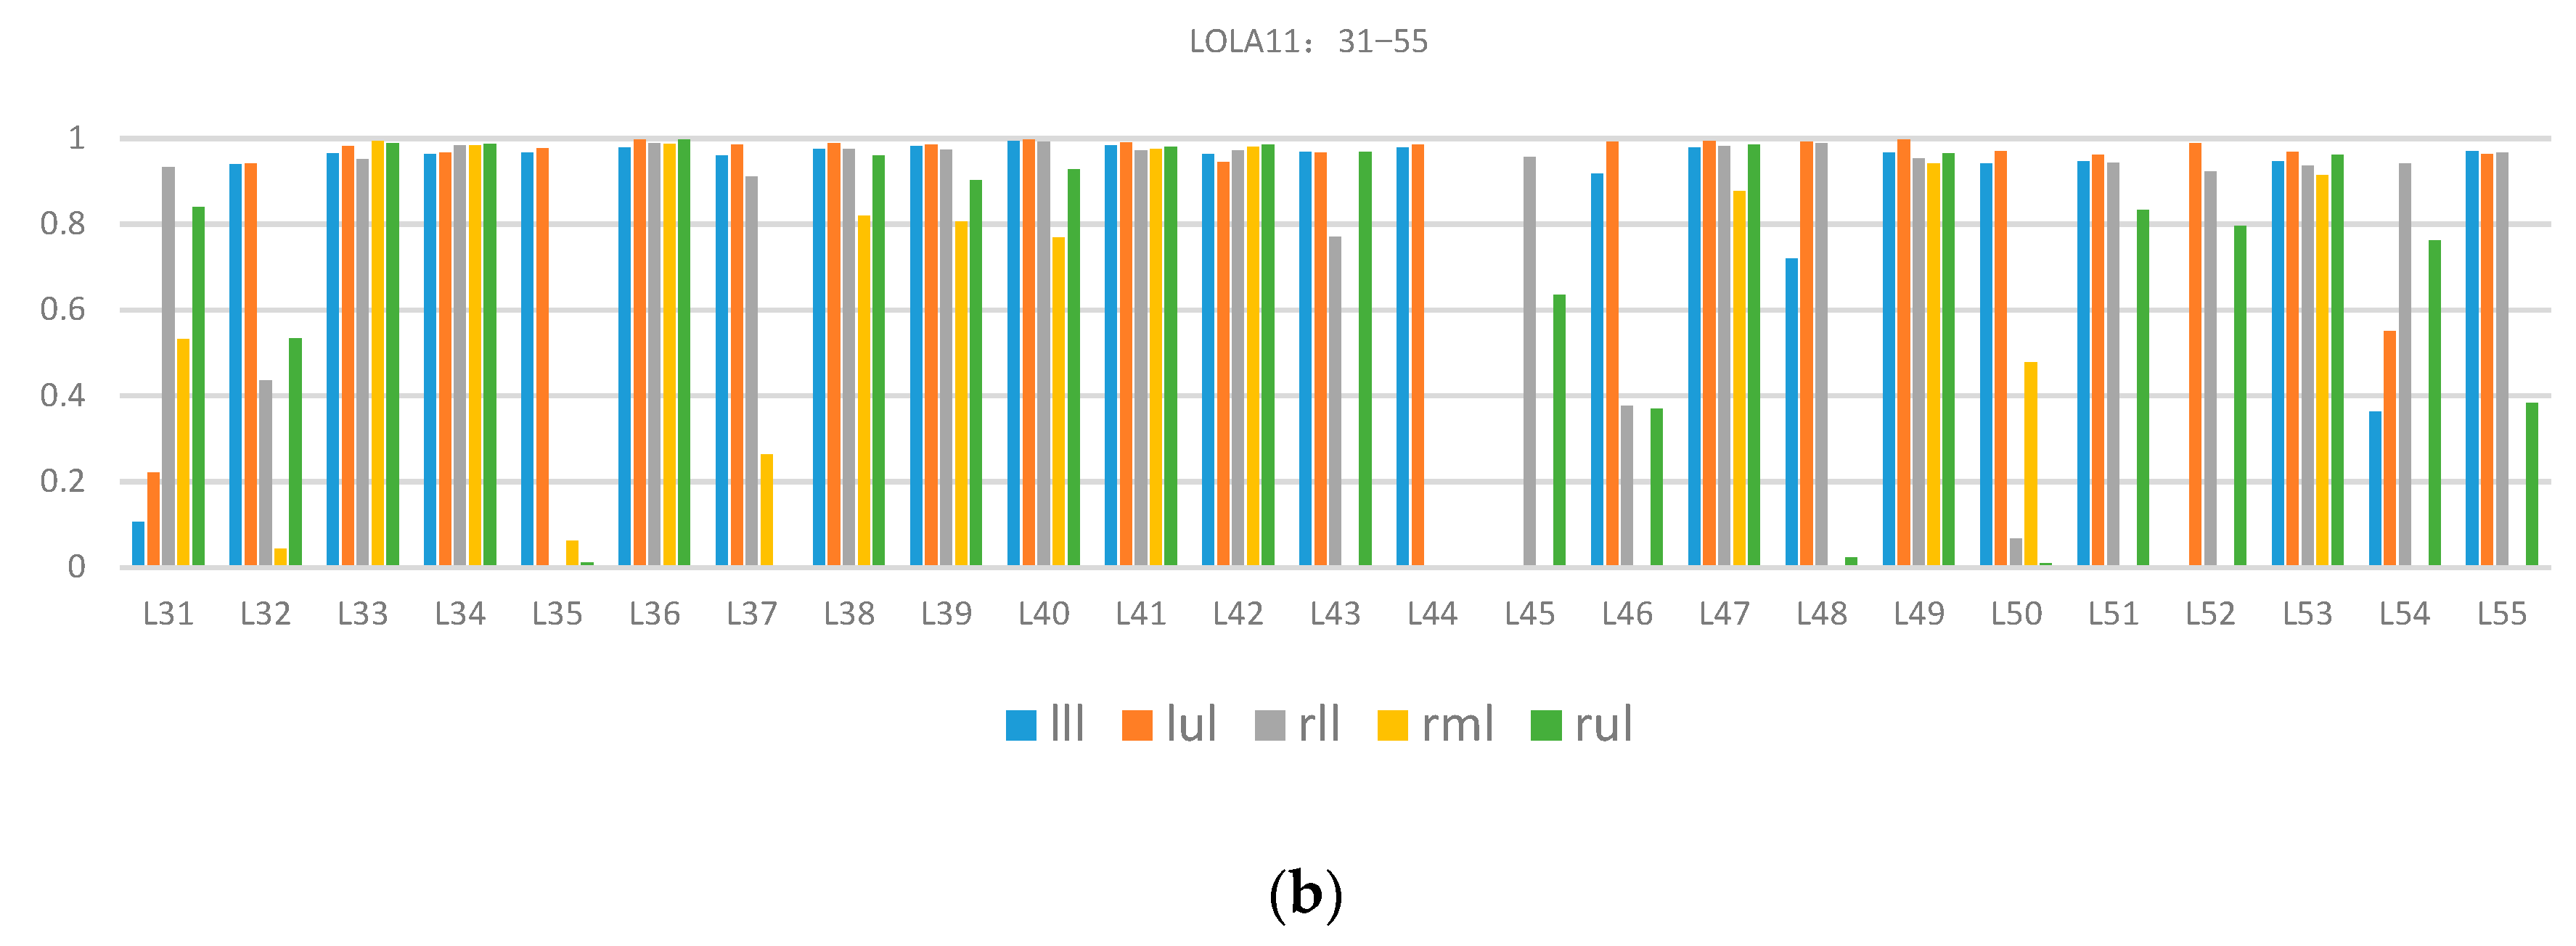
Table 1 presents the total quantitative evaluation results. The proposed method’s overall score was 0.84. The highest and lowest scores of single class assessment were from the left upper lobe (0.93) and right middle lobe (0.65), respectively. The variance of the right middle lobe was 0.4, which indicated that the data difference had a great influence on the segmentation performance and the reason was that there were many incomplete right lung horizontal fissures. For a more comprehensive understanding, including the effect of each case’s segmentation in the LOLA11 dataset, Figure 9 describes the specific coincidence degree score of each case.
As shown in Figure 9, many wrong segmentation results exist in the right middle lobes and there is still a lot of room for improvement. The reason for the poor performance was missing the detection of the horizontal fissure because it was difficult to image the horizontal fissures in the CT images when the horizontal fissures were nearly parallel to the CT scanning plane.
To further verify the performance of the proposed method, we compared the average score from each lung lobe between our method and two representative AI-based methods (a sequence of convolutional neural networks for marginal learning [20] and progressive dense V-Network [4]). The quantitative evaluation results on each lung lobe are shown in Table 2 (LobeNet_V2 is the name of the net in [20] given by authors for LOLA11). It indicates that our proposed method achieved a similar performance for most lung lobes except the right middle lobe, and there is even better segmentation performance on the left lung compared with V-net. Moreover, the proposed algorithm does not need a large number of labeled data for training and has advantages in operating efficiency.
4. Discussion
The proposed lung lobe segmentation framework has the following characteristics: (1) it does not rely on anatomical knowledge such as airways or vessels, but only relies on the assumption that the lung fissure can be represented as a continuous surface, (2) a fast and highly efficient multistage B-spline surface-fitting algorithm is used to fill the lung fissure hole and extend the lung fissure to the lung boundary to form a complete lung fissure surface, and (3) according to the difference in the normal vector and curvature in different pulmonary fissures, the right pulmonary fissure is classified as the horizontal and oblique fissure.
A large number of researchers use prior knowledge of lung anatomical structure to locate the lung fissure area, so as to reduce the false positive detection and estimate the invisible pulmonary fissure. Although this type of method can improve the detection efficiency, it is limited by the accuracy of prior anatomical structure knowledge. This limitation can be overcome by directly using the density distribution and shape features of the pulmonary fissure in 3D images, and better detection results can be obtained in lung data with visible lung fissures, such as the experimental results of the proposed method. In addition, compared with the deep learning method, which largely depends on a large amount of labeled data and uniformity of image acquisition devices, the proposed method has higher economy and applicability.
Experimental results show that this framework gives a good segmentation performance for most CT images, but for some others the horizontal fissure may be easily missed during pulmonary fissure detection. This is because the horizontal fissure often appears invisible in CT images. To solve this problem, it is necessary to integrate the anatomical information into the lung fissure segmentation and surface fitting stages, that is, to use the global information to extract the discontinuous pulmonary fissure surface, which will be a future job. Furthermore, for the deep learning method, we will explore integration of prior knowledge, such as global geometry or traditional image processing knowledge, into a convolution network, and hope to reduce the dependence on labeled data.
Author Contributions
Conceptualization, H.Z.; format analysis, H.Z.; investigation, X.C.; methodology, X.C. and H.Z.; project administration, P.Z.; resources, P.Z.; software, X.C.; validation, P.Z.; writing—original draft, X.C.; writing—review & editing, X.C. and H.Z. All authors have read and agreed to the published version of the manuscript.
Funding
This research was funded by National Natural Science Foundation of China, grant number 61571184 and 61733004, and funded the COVID-19 special item in Changsha Science and Technology Plan, grant number kq2001014.
Acknowledgments
We acknowledge the organizers of LOLA11 for providing the dataset and algorithm performance evaluation system.
Conflicts of Interest
The authors declare no conflict of interest.
References
- Han, M.K.; Agusti, A.; Calverley, P.M.; Celli, B.R.; Criner, G.; Curtis, J.L.; Fabbri, L.M.; Goldin, J.G.; Jones, P.W.; MacNee, W.; et al. Chronic obstructive pulmonary disease phenotypes: The future of COPD. Am. J. Respir. Crit. Care Med. 2010, 182, 598–604. [Google Scholar] [CrossRef] [PubMed] [Green Version]
- Doel, T.; Gavaghan, D.J.; Grau, V. Review of automatic pulmonary lobe segmentation methods from CT. Comput. Med. Imaging Graph. 2015, 40, 13–29. [Google Scholar] [CrossRef] [PubMed]
- George, K.; Harrison, A.P.; Jin, D.; Xu, Z.; Mollura, D.J. Pathological pulmonary lobe segmentation from CT images using progressive holistically nested neural networks and random walker. In Proceedings of the Deep Learning in Medical Image Analysis and Multimodal Learning for Clinical Decision Support, Quebec, QC, Canada, 14 September 2017; Springer: Berlin/Heidelberg, Germany, 2017; pp. 195–203. [Google Scholar]
- Imran, A.A.Z.; Hatamizadeh, A.; Ananth, S.P.; Ding, X.; Terzopoulos, D.; Tajbakhsh, N. Automatic segmentation of pulmonary lobes using a progressive dense V-Network. arXiv 2019, arXiv:1902.06362. [Google Scholar]
- Ferreira, F.T.; Sousa, P.; Galdran, A.; Sousa, M.R.; Campilho, A. End-to-end supervised lung lobe segmentation. In Proceedings of the International Joint Conference on Neural Networks (IJCNN), Rio De Janeiro, Brazil, 8–13 July 2018; IEEE: Piscataway, NJ, USA, 2018; pp. 1–8. [Google Scholar]
- Ukil, S.; Reinhardt, J.M. Smoothing lung segmentation surfaces in three-dimensional x-ray ct images using anatomic guidance1. Acad. Radiol. 2005, 12, 1502–1511. [Google Scholar] [CrossRef] [PubMed]
- Sun, X.; Zhang, H.; Duan, H. 3D computerized segmentation of lung volume with computed tomography. Acad. Radiol. 2006, 13, 670–677. [Google Scholar] [CrossRef] [PubMed]
- Pu, J.; Roos, J.; Chin, A.Y.; Napel, S.; Rubin, G.D.; Paik, D.S. Adaptive border marching algorithm: Automatic lung segmentation on chest CT images. Comput. Med. Imaging Graph. 2008, 32, 452–462. [Google Scholar] [CrossRef] [PubMed] [Green Version]
- Saita, S.; Kubo, M.; Kawata, Y.; Niki, N.; Ohmatsu, H.; Moriyama, N. An algorithm for the extraction of pulmonary fissures from low-dose multislice CT image. Syst. Comput. Jpn. 2006, 37, 63–76. [Google Scholar] [CrossRef]
- Pu, J.; Leader, J.K.; Zheng, B.; Knollmann, F.; Fuhrman, C.; Sciurba, F.C.; Gur, D. A computational geometry approach to automated pulmonary fissure segmentation in CT examinations. IEEE Trans. Med. Imaging 2009, 28, 710. [Google Scholar] [PubMed] [Green Version]
- Ukil, S.; Reinhardt, J.M. Anatomy-guided lung lobe segmentation in X-ray CT images. IEEE Trans. Med. Imaging 2008, 28, 202–214. [Google Scholar] [CrossRef] [PubMed] [Green Version]
- Doel, T.; Matin, T.N.; Gleeson, F.V.; Gavaghan, D.J.; Grau, V. Pulmonary lobe segmentation from CT images using fissureness, airways, vessels and multilevel B-splines. In Proceedings of the Biomedical Imaging (ISBI), 2012 9th IEEE International Symposium on, Barcelona, Spain, 2–4 May 2012; IEEE: Piscataway, NJ, USA, 2012; pp. 1491–1494. [Google Scholar]
- Zhao, H.; Stoel, B.C.; Staring, M.; Bakker, M.E.; Stolk, J.; Zhou, P.; Xiao, C. A framework for pulmonary fissure segmentation in 3D CT images using a directional derivative of plate filter. Signal Process. 2020, 173, 107602. [Google Scholar] [CrossRef]
- VanRikxoort, E.M.; deHoop, B.; Viergever, M.A.; Prokop, M.; Van Ginneken, B.B. Automatic lung segmentation from thoracic computed tomography scans using a hybrid approach with error detection. Med. Phys. 2009, 36, 2934–2947. [Google Scholar] [CrossRef] [PubMed]
- Wold, S.; Esbensen, K.; Geladi, P. Principal component analysis. Chemom. Intell. Lab. Syst. 1987, 2, 37–52. [Google Scholar] [CrossRef]
- Region Growing Approach. Available online: http://pointclouds.org/documentation/tutorials (accessed on 14 October 2020).
- Lee, S.; Wolberg, G.; Shin, S.Y. Scattered data interpolation with multilevel B-splines. IEEE Trans. Vis. Comput. Graph. 1997, 3, 228–244. [Google Scholar] [CrossRef] [Green Version]
- Competition Website. Available online: https://lola11.grand-challenge.org (accessed on 14 October 2020).
- MeVisLab. Available online: http://www.mevislab.de (accessed on 14 October 2020).
- Gerard, S.E.; Reinhardt, J.M. Pulmonary lobe segmentation using a sequence of convolutional neural networks for marginal learning. In Proceedings of the Biomedical Imaging (ISBI), 2019 16th IEEE International Symposium on Biomedical Imaging, Venezia, Italy, 24–27 April 2019; IEEE: Piscataway, NJ, USA, 2019; pp. 1207–1211. [Google Scholar]
Figure 1.
CT image of human lung.

Figure 2.
Pulmonary fissure segmentation result.

Figure 3.
Results of pulmonary fissure classification: (a) original pulmonary fissure point cloud, and (b) clustered pulmonary fissure point cloud.
Figure 3.
Results of pulmonary fissure classification: (a) original pulmonary fissure point cloud, and (b) clustered pulmonary fissure point cloud.

Figure 4.
Results of lung fissure surface fitting: (a) original right lung oblique fissure, (b) fitted right lung oblique fissure, (c) original right lung horizontal fissure, and (d) fitted right lung horizontal fissure.
Figure 4.
Results of lung fissure surface fitting: (a) original right lung oblique fissure, (b) fitted right lung oblique fissure, (c) original right lung horizontal fissure, and (d) fitted right lung horizontal fissure.

Figure 5.
Results of lung lobe segmentation: (a) original right lung, (b) segmentation using oblique fissure, (c) segmentation using horizontal fissure, and (d) segmentation result.
Figure 5.
Results of lung lobe segmentation: (a) original right lung, (b) segmentation using oblique fissure, (c) segmentation using horizontal fissure, and (d) segmentation result.

Figure 6.
Representative results of lobe segmentation from LOLA11.

Figure 7.
Comparison between present method (second line) and Doel’s method (first line) when the pulmonary fissure is visible.
Figure 7.
Comparison between present method (second line) and Doel’s method (first line) when the pulmonary fissure is visible.

Figure 8.
Comparison between our method (the second row) and Doel’s method (the first row) for moderate and low score segmentation results.
Figure 8.
Comparison between our method (the second row) and Doel’s method (the first row) for moderate and low score segmentation results.

Figure 9.
Quantitative evaluation results of lung lobe segmentation in the LOLA11 dataset: (a) results of case 01−case 30, and (b) results of case 31−case 55. The lll, lul, rll, rml and rul are left lower lobe, left upper lobe, right lower lobe, right middle lobe and right upper lobe, respectively.
Figure 9.
Quantitative evaluation results of lung lobe segmentation in the LOLA11 dataset: (a) results of case 01−case 30, and (b) results of case 31−case 55. The lll, lul, rll, rml and rul are left lower lobe, left upper lobe, right lower lobe, right middle lobe and right upper lobe, respectively.


Table 1.
Overall quantitative assessment of lobe segmentation on LOLA11 dataset.
| Mean | SD | Min | Q1 | Median | Q3 | Max | |
|---|---|---|---|---|---|---|---|
| Left lower lobe | 0.89 | 0.23 | 0.0 | 0.95 | 0.97 | 0.98 | 0.99 |
| Left upper lobe | 0.93 | 0.18 | 0.02 | 0.96 | 0.99 | 0.99 | 1 |
| Right upper lobe | 0.84 | 0.27 | 0.0 | 0.8 | 0.96 | 0.99 | 1 |
| Right middle lobe | 0.65 | 0.4 | 0.0 | 0.06 | 0.82 | 0.96 | 1 |
| Right lower lobe | 0.88 | 0.24 | 0.0 | 0.93 | 0.97 | 0.98 | 0.99 |
| Total score | 0.84 |
Table 2.
Comparison between our proposed method and AI-based methods.
| LobeNet_V2 | V-Net | The Proposed Method | |
|---|---|---|---|
| Left lower lobe | 0.91 | 0.88 | 0.89 |
| Left upper lobe | 0.95 | 0.92 | 0.93 |
| Right lower lobe | 0.96 | 0.92 | 0.88 |
| Right middle lobe | 0.87 | 0.76 | 0.65 |
| Right upper lobe | 0.94 | 0.91 | 0.84 |
Publisher’s Note: MDPI stays neutral with regard to jurisdictional claims in published maps and institutional affiliations. |
© 2020 by the authors. Licensee MDPI, Basel, Switzerland. This article is an open access article distributed under the terms and conditions of the Creative Commons Attribution (CC BY) license (http://creativecommons.org/licenses/by/4.0/).
Share and Cite
MDPI and ACS Style
Chen, X.; Zhao, H.; Zhou, P. Lung Lobe Segmentation Based on Lung Fissure Surface Classification Using a Point Cloud Region Growing Approach. Algorithms 2020, 13, 263. https://0-doi-org.brum.beds.ac.uk/10.3390/a13100263
AMA Style
Chen X, Zhao H, Zhou P. Lung Lobe Segmentation Based on Lung Fissure Surface Classification Using a Point Cloud Region Growing Approach. Algorithms. 2020; 13(10):263. https://0-doi-org.brum.beds.ac.uk/10.3390/a13100263
Chicago/Turabian StyleChen, Xin, Hong Zhao, and Ping Zhou. 2020. "Lung Lobe Segmentation Based on Lung Fissure Surface Classification Using a Point Cloud Region Growing Approach" Algorithms 13, no. 10: 263. https://0-doi-org.brum.beds.ac.uk/10.3390/a13100263
Note that from the first issue of 2016, this journal uses article numbers instead of page numbers. See further details here.