A New Click-Through Rates Prediction Model Based on Deep&Cross Network

1
The Industrial and Commercial Bank of China Limited, Guangzhou Branch, Guangzhou 510100, China
2
Department of Computer Science, Jinan University, Guangzhou 510632, China
3
Yunqu-Jinan University Joint AI Research Center, Guangzhou 510632, China
4
Guangzhou Yunqu Information Technology Company, Ltd., Guangzhou 510665, China
*
Author to whom correspondence should be addressed.
Algorithms 2020, 13(12), 342; https://0-doi-org.brum.beds.ac.uk/10.3390/a13120342
Submission received: 12 November 2020
/
Revised: 8 December 2020
/
Accepted: 11 December 2020
/
Published: 14 December 2020
(This article belongs to the Special Issue Model Predictive Control: Algorithms and Applications)
Abstract
:With the development of E-commerce, online advertising began to thrive and has gradually developed into a new mode of business, of which Click-Through Rates (CTR) prediction is the essential driving technology. Given a user, commodities and scenarios, the CTR model can predict the user’s click probability of an online advertisement. Recently, great progress has been made with the introduction of Deep Neural Networks (DNN) into CTR. In order to further advance the DNN-based CTR prediction models, this paper introduces a new model of FO-FTRL-DCN, based on the prestigious model of Deep&Cross Network (DCN) augmented with the latest optimization technique of Follow The Regularized Leader (FTRL) for DNN. The extensive comparative experiments on the iPinYou datasets show that the proposed model has outperformed other state-of-the-art baselines, with better generalization across different datasets in the benchmark.
1. Introduction
Online advertising has become the new mode of businesses in recent years, which can make full use of customers’ digital traces to achieve more precise outputs. Compared with traditional advertising, online advertising has the advantages of lower production cost, faster update and maintenance, larger information capacity, wider audience, more precise delivery, more efficient retrieval, and faster communication speed [1].
The underlying driving technology for online advertising is Click-Through Rates (CTR) estimation, in which the task is to predict the click probability of the browsers for some commodities in certain scenarios [2]. Accurate prediction of CTR will not only benefit advertisers’ promotion of products but also ensure users’ good experiences and interests [3]. However, the purpose of browsers for a web page is not to click the ads; thus, the overall click rates are low, with an average of about . Therefore, the collected click rate data is sparse, which leads to the cold start problem in recommendation systems [4].
At present, the research of CTR can be generally divided into two categories: CTR based on machine learning and CTR based on Deep Neural Networks (DNN). In the early stage, the task of CTR prediction mainly depends on the statistical characteristics of data, such as the logistic regression (LR) model that has been proposed in Reference [5,6]. And LR model is suitable for dealing with large-scale sparse features, using regularization for training, and can accomplish most of the click rate prediction tasks at that time. But, LR model is a linear model, and it is very dependent on manual feature engineering. So, it can not deal with complex feature combinations, and it is difficult for nonlinear tasks, too. The factorization machines (FM) model is then presented in Reference [7,8] to predict the click rate that combines the factorization and Support Vector Machine (SVM) and can realize feature combinations by implicit vector multiplications. It has more powerful functions than LR model and has been widely used in the click rate prediction and recommendation systems. Then, a Field-aware Factorization Machines (FFM) model is introduced [9]. The concept of field is defined and integrated into the FFM model to classify features of similar properties into the same field, which can refine the representation of hidden vectors. However, FFM is still unable to achieve high-order feature combinations. And Facebook has proposed the GBDT+LR fusion model for click rate prediction, in Reference [10], which incorporates the advantages of gradient boosting tree algorithm and logic regression model. GBDT can automatically combine high-order features, and logistic regression can deal with large-scale sparse features, so as to ensure little loss of information. Then, Google proposed Follow The Regularized Leader (FTRL), in Reference [11], for more advanced regularization and generalization. The FTRL model combined the power of forward backward splitting algorithm (FOBOS) [12] and regularized dual averaging algorithm (RDA) [13] and has been successfully be used for online optimization of logistic regression model.
In recent years, CTR based on Deep Neural Networks (DNN) has attracted a lot of attention from both academia and industry. For instance, a factorization neural network (FNN) is proposed in Reference [14] for CTR. The FNN can reduce the dimension of the class features, and the neural network can realize the non-linearity of the model. Google presents a Wide&Deep model in Reference [15], in which the core idea of the model is to combine the storage ability of linear models and the generalization ability of deep learning. The Product-based Neural Network (PNN) model is put forward in Reference [16] to predict the click through rate. The model first uses DNN to combine data features, and then uses product layer to further refine the cross operation of data features. The inner and outer product operations in this layer significantly improve the prediction performance of the PNN model. Then, DeepFM model came from Reference [17], which can learn both low-order features and high-order features at the same time and can enable faster training and achieve more accurate prediction. Then, Google proposed Deep&Cross Network (DCN) model, in Reference [18], for click rate prediction and personalized recommendations. The model is equipped with a cross network, which can effectively learn the feature interactions and greatly improve the effect of click rate prediction and personalized recommendations. Alibaba introduced Deep Interest Network (DIN), in Reference [19]. And this model captures the diversified interests of users as interest distribution, adopts attention mechanism to improve the weight of relevant and effective interests, and reduces the impact of unrelated interests. This model also adds a local perceptual feature similar to Convolutional Neural Networks (CNN), which can well perceive users’ interests in the target goods. The final click rate of the target goods is estimated according to the interest distribution of users. In [20], Sina puts forward the Feature Importance and Bilinear feature Interaction Network (FiBiNET) model that presents senet mechanism, which can realize dynamic learning of feature weights, as well as introduces a new bilinear function for feature interaction learning. And, more recently, Alibaba further proposed the Deep Session Interest Network (DSIN) model, in Reference [21]. DSIN models users’ behavior sequences on their historical sessions, resulting in more precise and efficient prediction. Additionally, CTR based on Deep Neural Networks (DNN) can be applied in other domains, like information retrieval, such as Reference [22], where a novel end-to-end cross-media semantic correlation learning model based on a deep hash network and semantic expansion for social network cross-media search (DHNS) are presented.
The introduction of DNNs in CTR prediction has gained significant improvements in performance. Compared with traditional machine learning algorithms, such as logistic regression and factorization machine, DNN-based CTR model can better deal with the combination of feature vectors and higher-order features, and it has structural advantages in improving prediction accuracy. However, there are still a lot of challenges to be addressed, which are as follows:
- The modeling of feature interactions is still limited. When a neural network learns high-order features, it is unable to effectively identify the importance and association of combined features, which further restricts the prediction accuracy of the model.
- Noise interference can be introduced in the embedding phase, and then it can skew the final prediction results.
- The data for CTR prediction is unbalanced, which leads to the issue that the classic deep model can not predict accurately, since it needs a lot of data of the same category to learn the discriminative features.
- The optimization algorithm to train the DNN may not work well because of the underlying distribution of data may be more complex than the assumption.
And this paper is to address these issues. In summary, the main contributions of this paper are as follows:
- Some preprocessing techniques, such as Synthetic Minority Oversampling Technique (SMOTE) [23], have been applied to optimize FO-FTRL-DCN, which aim to denoise and balance the data, leading to better performance.
- The proposed FO-FTRL-DCN model has been evaluated on multiple datasets of the prestigious benchmark of iPinYou, showing that the model has better performance compared with state-of-the-art baselines, and better generalization across different datasets.
2. Preliminaries
In this section, we review some fundamantal concepts concerning DNN and CTR, as well as some training and optimization techniques.
2.1. Embedding
Embedding is an essential approach in DNN to learn a latent representation of things using neural embedding algorithms in order to capture similarities by embedding them in a low dimensional space. Item2vec [24] is an embedding in recommendation systems, to represent items by embedded vectors.
In the recommendation system, the sequence of items is equivalent to the sequence of words. Each user’s behavior sequence constitutes a set. By subsampling, we can model the difference between popular items and not popular ones. For the input item sequence, we discard the item w with a certain probability. The calculation of the probability is as the Formula (1):
where is the frequency of the item w in the sequence, and is the preset threshold of the algorithm.
The truncated normal distribution is a special normal distribution that limits the range of variable values [25]. In the embedding stage, using the truncated normal distribution instead of the ordinary normal distribution can reduce some noise interference.
2.2. Oversampling
In binary classification problems, the imbalance of data is commonly seen, where there is a large gap between the number of positive samples and negative ones. Usually there are three ways to solve this problem: (1) threshold adjustment, which forces the classifier more inclined to the minority of classes; (2) undersampling, which is to reduce the number of the majority of samples to make the data more balanced; (3)oversampling, which is to increase the number of the minority of samples. Generally, the effect of oversampling and undersampling is better than that of the threshold adjustment, but sometimes there is a risk of overfitting, so we should use the appropriate regularization approaches together.
Generally speaking, oversampling works better than undersampling. And random oversampling is a simple oversampling method in which the idea is to take some samples randomly from a few kinds of data and add them to the original one to generate more balanced training data [26].
Synthetic Minority Oversampling Technique (SMOTE) [23] is an improved and prestigious sampling technique based on random oversampling. Because the strategy of random oversampling is to balance the data by simply copying minority samples randomly, it is very easy to lead to overfitting. The basic idea of SMOTE is to analyze the data of minority samples, synthesize new minority ones and add them to the original data, and balance the training ratio of positive and negative samples. The main algorithm flow of SMOTE is as follows (Algorithm 1).
| Algorithm 1 SMOTE. |
| Input: unbalanced data of positive and negative samples; Output: synthesized new minority samples; 1: Initializing minority samples ; 2: For to N: The Euclidean distance between and other samples is calculated, and the corresponding K-Nearest neighbor is obtained; 3: Determine the sampling rate R according to the proportion of positive and negative samples; 4: For to N: According to the sampling ratio R, several samples are randomly selected from the K-Nearest neighbors of , which are determined as ; Construct a new sample according to the determined ; 5: return ; |
2.3. Optimization for DNN
Compared with the traditional machine learning approaches, the CTR prediction based on DNN has made significant improvements. These models are composed of a multi-layer neural network, or can be combined with multiple DNNs for prediction. However, the training of DNNs is very tricky, and some essential optimization techniques must be involved to build a better CTR model.
2.3.1. Batch Normalization
Batch Normalization (BN) is proposed to solve the Internal Covariate Shift (ICS) problem [27]. BN is to standardize the input of each hidden layer, and force the input distribution of each layer back to the standard normal distribution. In this way, the gradient can be increased to avoid gradient vanishing and the increase of gradient can accelerate the speed of learning convergence [28]. The main algorithm flow is as follows (Algorithm 2):
| Algorithm 2 Batch Normalization (based on Mini-Batch). |
| Input:x value based on Mini-Batch: ; parameters to learn: ; Output: ; 1: ; // mini-batch mean 2: ; // mini-batch variance 3: ; // normalize 4: ; // scale and shift 5: return ; |
2.3.2. Dropout
Neural networks usually are easy to be overfitting [34]. In statistical machine learning, model ensemble can be used to deal with the problem, while, in DNN, dropout can effectively alleviate overfitting and plays the role of regularization.
In the training of feed-forward neural networks, dropout [27] is simply to make the activation value of neurons in the hidden layer be 0 with a certain probability p, so that the learning of neurons is more flexible, the model can learn more effective features, and the generalization of the model can be stronger.
The function of averaging is applied after dropout, since different network structures can produce different overfitting and averaging can make them cancel each other. Actually, dropout can be seen as a powerful ensemble of models, leading to better generalization and avoiding overfitting to a certain extent.
2.3.3. Activation Functions
The DNN model has a strong nonlinear fitting ability, which comes from the activation function. In the DNN-based model, it is very important to select the appropriate activation function to capture the non-linearity inside the data [35,36].
The activation functions commonly used are sigmoid function [37] of Formula (2), tanh function [38] of Formula (3), Rectified Linear Unit (ReLU) function [39] of Formula (4), PReLU (Parametric Rectified Linear Unit) function [40] of Formula (5), and Exponential Linear Unit (ELU) function [41] of Formula (6).
Generally speaking, each activation function has its own advantages and disadvantages. No activation function is suitable for all neural network models. In this paper, when designing the DNN-based CTR prediction model, we have tried each activation function separately, and carried out a lot of comparative experiments. Finally, we find that the sigmoid function and tanh function have better performance for our model and the baselines.
2.3.4. Training Techniques
In the task of CTR prediction based on DNN, the training process of neural network model is essentially to minimize the fitting loss. After defining the loss function, the key of learning is to use an optimization algorithm to minimize the loss function. Therefore, the optimization techniques play an important role, using iterations to get the optimal solution as close as possible. Especially in the complex CTR prediction task, it is very important to choose the optimization algorithm that matches the network model structure and the loss function [42,43].
In deep learning, the classical optimization algorithms are Stochastic Gradient Descent (SGD) [44], Momentum [45], AdaGrad [46], Adam [47], and Conjugate Gradient [48], and more complex ones are Newton method [49], FTRL-Proximal [8].
In general, each optimization algorithm has its own strength and weakness. In this paper, when training the deep CTR prediction model, we have tried each optimization algorithm above and found that FTRL-Proximal and Adam are more suitable for the our proposed model and the baselines.
3. The Proposed Model
As we can see from the recent advancements, the key factors to boost the performance of CTR are more advanced and effective feature combinations, and more state-of-the-art techniques from DNN to better train and capture non-linearity. Therefore, based on Follow The Regularized Leader (FTRL) [11] and Deep&Cross Network (DCN) [18], this paper proposes an integrated model with feature optimization (FO), namely FO-FTRL-DCN, which will be empowered jointly by the embedding based on DCN, SMOTE on the imbalance of data and the FTRL optimization algorithm [11]. More specifically, the major contributions of the model are as follows.
- First, in the embedding phase, the truncated normal distribution is introduced, which is a special normal distribution that limits the value range of variables. In the embedding stage, the truncated normal distribution can be used to replace the normal distribution to reduce some noise interference.
- Secondly, SMOTE is applied to tackle the imbalance of data, which can analyze the data of minority classes, synthesize new minority samples and add them to the original data, and balance the ratio of positive and negative samples.
- Thirdly, the advanced FTRL optimization algorithm is applied, which can greatly improve the optimization effect of CTR model in complex situations. FTRL is an efficient optimization algorithm and online learning algorithm in information retrievel and recommendation, combining the power of forward backward splitting (FOBOS) [12] and regularized dual averaging (RDA) [13]. It uses both and regularization terms in the iterative process, which greatly improves the prediction of the model. The latest version of FTRL-Proximal [8] is adopted in the proposed model and has gained substantial improvements in performance.
The general structure of FO-FTRL-DCN is shown in Figure 1. The backbone of the FO-FTRL-DCN model can be divided into two parts: one is the feed forward deep network; the other is the cross network.
The main ideas of FTR are detailed as follows.
3.1. The Pipeline
The input data of the proposed model mainly includes three types: user information, advertisement information and context information. After the input data flow is processed by SMOTE to handle the imbalance of data, it goes into the next stage of the embedding layer for further processing, and then flows into two branches of the deep network layer and the cross network layer for training. Then, the outputs from two branches are fused into the combination layer and, finally, mapped into a value in the range of through the sigmoid function of the output layer, and get the estimated Click-Through Rate. The sigmoid function is presented in Formula (7) and is the weight and is the bias.
For the input data, after SMOTE is used to deal with the imbalance of data, the augmented data is embedded in a unified way, including embedding optimization, stacking, and splicing, and then is sent to the two branches of the deep network layer and the cross network layer in different forms for training. In the cross layer, the explicit feature intersection is fully and effectively applied, and the mutual interactions between high-order features are fully learned in the deep network layer. The input of each hidden layer will go through batch normalization and activation function, and then the outputs from two branches will enter the combination layer to be incorporated into a vector, and, finally, the CTR prediction will be obtained through the sigmoid function of the output layer.
3.2. The Feature Optimization
The feature optimization (FO) is actually implemented by the two branches of the deep network and the cross network. The branch of the cross network plays the role to carry out effective explicit feature crossing, which is to learn certain bounded-degree feature interactions.
The cross network includes several cross layers, and the formula of each layer is as follows (8).
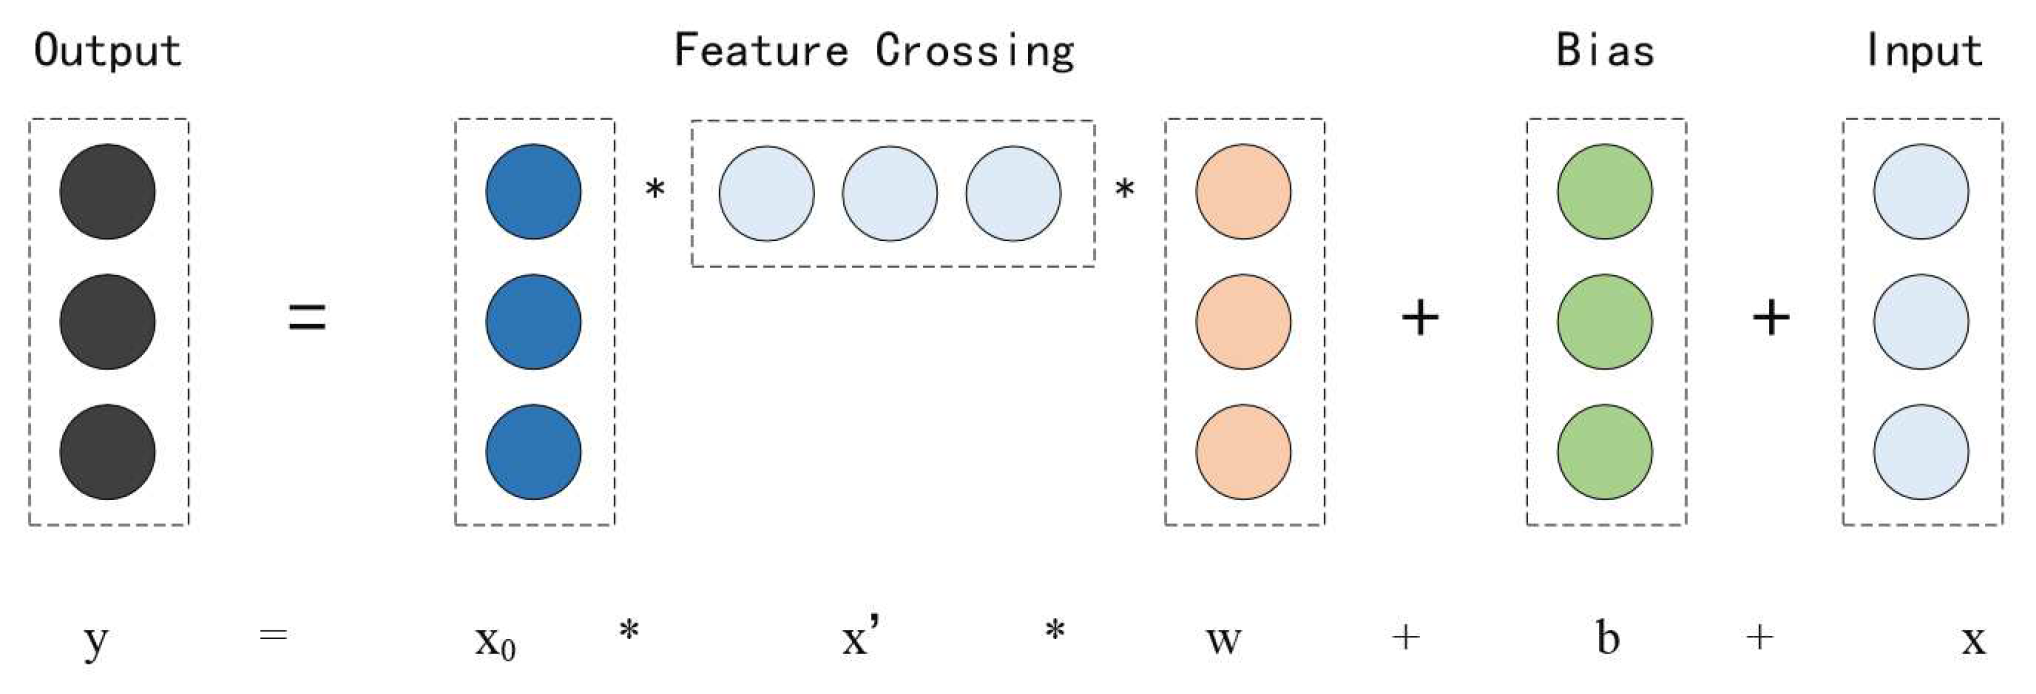
The calculation of an intersection is shown in Figure 2, where is the original embedding layer input and y is column vectors denoting the output from the current cross layers; w, b are the weight and bias parameters of the current layer. Each cross layer adds back its input x after a feature crossing, and the mapping function just fits the residual of .
From the special structure of the cross network, we can see that the degree of feature cross increases with the depth of the network layer. Because the number of parameters in the cross network may limit the capacity of the network, in order to better capture the high-order non-linear interactions of features, the model further introduces a parallel deep network, which is a fully connected feed forward neural network. The formula of each layer is as (9).
The complexity of the deep network can be estimated by the number of parameters. Assuming that the dimension of input of deep layer is d, the number of layers of deep network is , and the number of neurons in each deep layer is m, the complexity of the deep network is calculated as (10).
The model finally uses the cross entropy loss function with regularized terms as Formula (11).
In summary, in the input layer, SMOTE is used to synthesize minority samples to deal with the imbalance of data. In the embedding and stacking layer, sparse features of data are transformed into embedded vectors, in which embedding optimization is applied, and then embedding vectors and dense vectors are spliced together. In the cross layer, explicit features are effectively learned on how to cross. The parallel deep layer fully learns the interactions between higher-order features. The combination layer integrates the output of the cross layer and the deep layer, and the output layer gets the predicted CTR through a sigmoid function. During training, FTRL-Proximal algorithm [8] is adopted, showing greatly improved prediction performance.
4. Experimental Results
4.1. The Datasets
The proposed FO-FTRL-DCN mode for CTR prediction was evaluated on the famous benchmark of iPinYou https://contest.ipinyou.com/. We have carried out a large number of comparative studies and analysis. The iPinyou dataset consists of real advertising logs released by iPinYou company in 2013, which includes four types of log records: bidding, exposure opportunity, click, and conversion. Among them, exposure opportunity and click log can be used for CTR prediction. In the empirical studies, each data record is a corresponding exposure record, including the features, such as the users’ own information, the relevant information of the advertising contexts and the advertising, and the final click data. In these experiments, the exposure samples of the first 7 days were used as the training set, and the exposure samples of the next 3 days were used as the test set. In the experimental settings, we use the advertising and click logs of four advertisers: 1458, 3358, 3386, and 3427 in the iPinYou data to establish four datasets of advertising and click, respectively. Table 1 shows the sample statistics of these four datasets.
4.2. Experimental Settings
All the experiments have been carried out on a Linux server of Ubuntu 18.04 LTS (64 byte), with a CPU of Intel(R) Xeon(R) @2.10GHz, a GPU of NVIDIA TITAN RTX of 24G, and 64G RAM. In these experiments, Area Under the Curve (AUC) and logloss are used as the main evaluation metrics of the model, which are the most commonly used indicators to measure the performance of a CTR model. AUC is the area under ROC curve. The larger AUC value is, the better the prediction performance of the model is. Logloss is the cross entropy loss. The smaller the logloss value is, the smaller the error and the better the performance of the CTR prediction model is.
4.3. Results and Analysis
The CTR prediction performance of the FO-FTRL-DCN model has been evaluated by six comparative experiments as follows.
4.3.1. The First Experiment
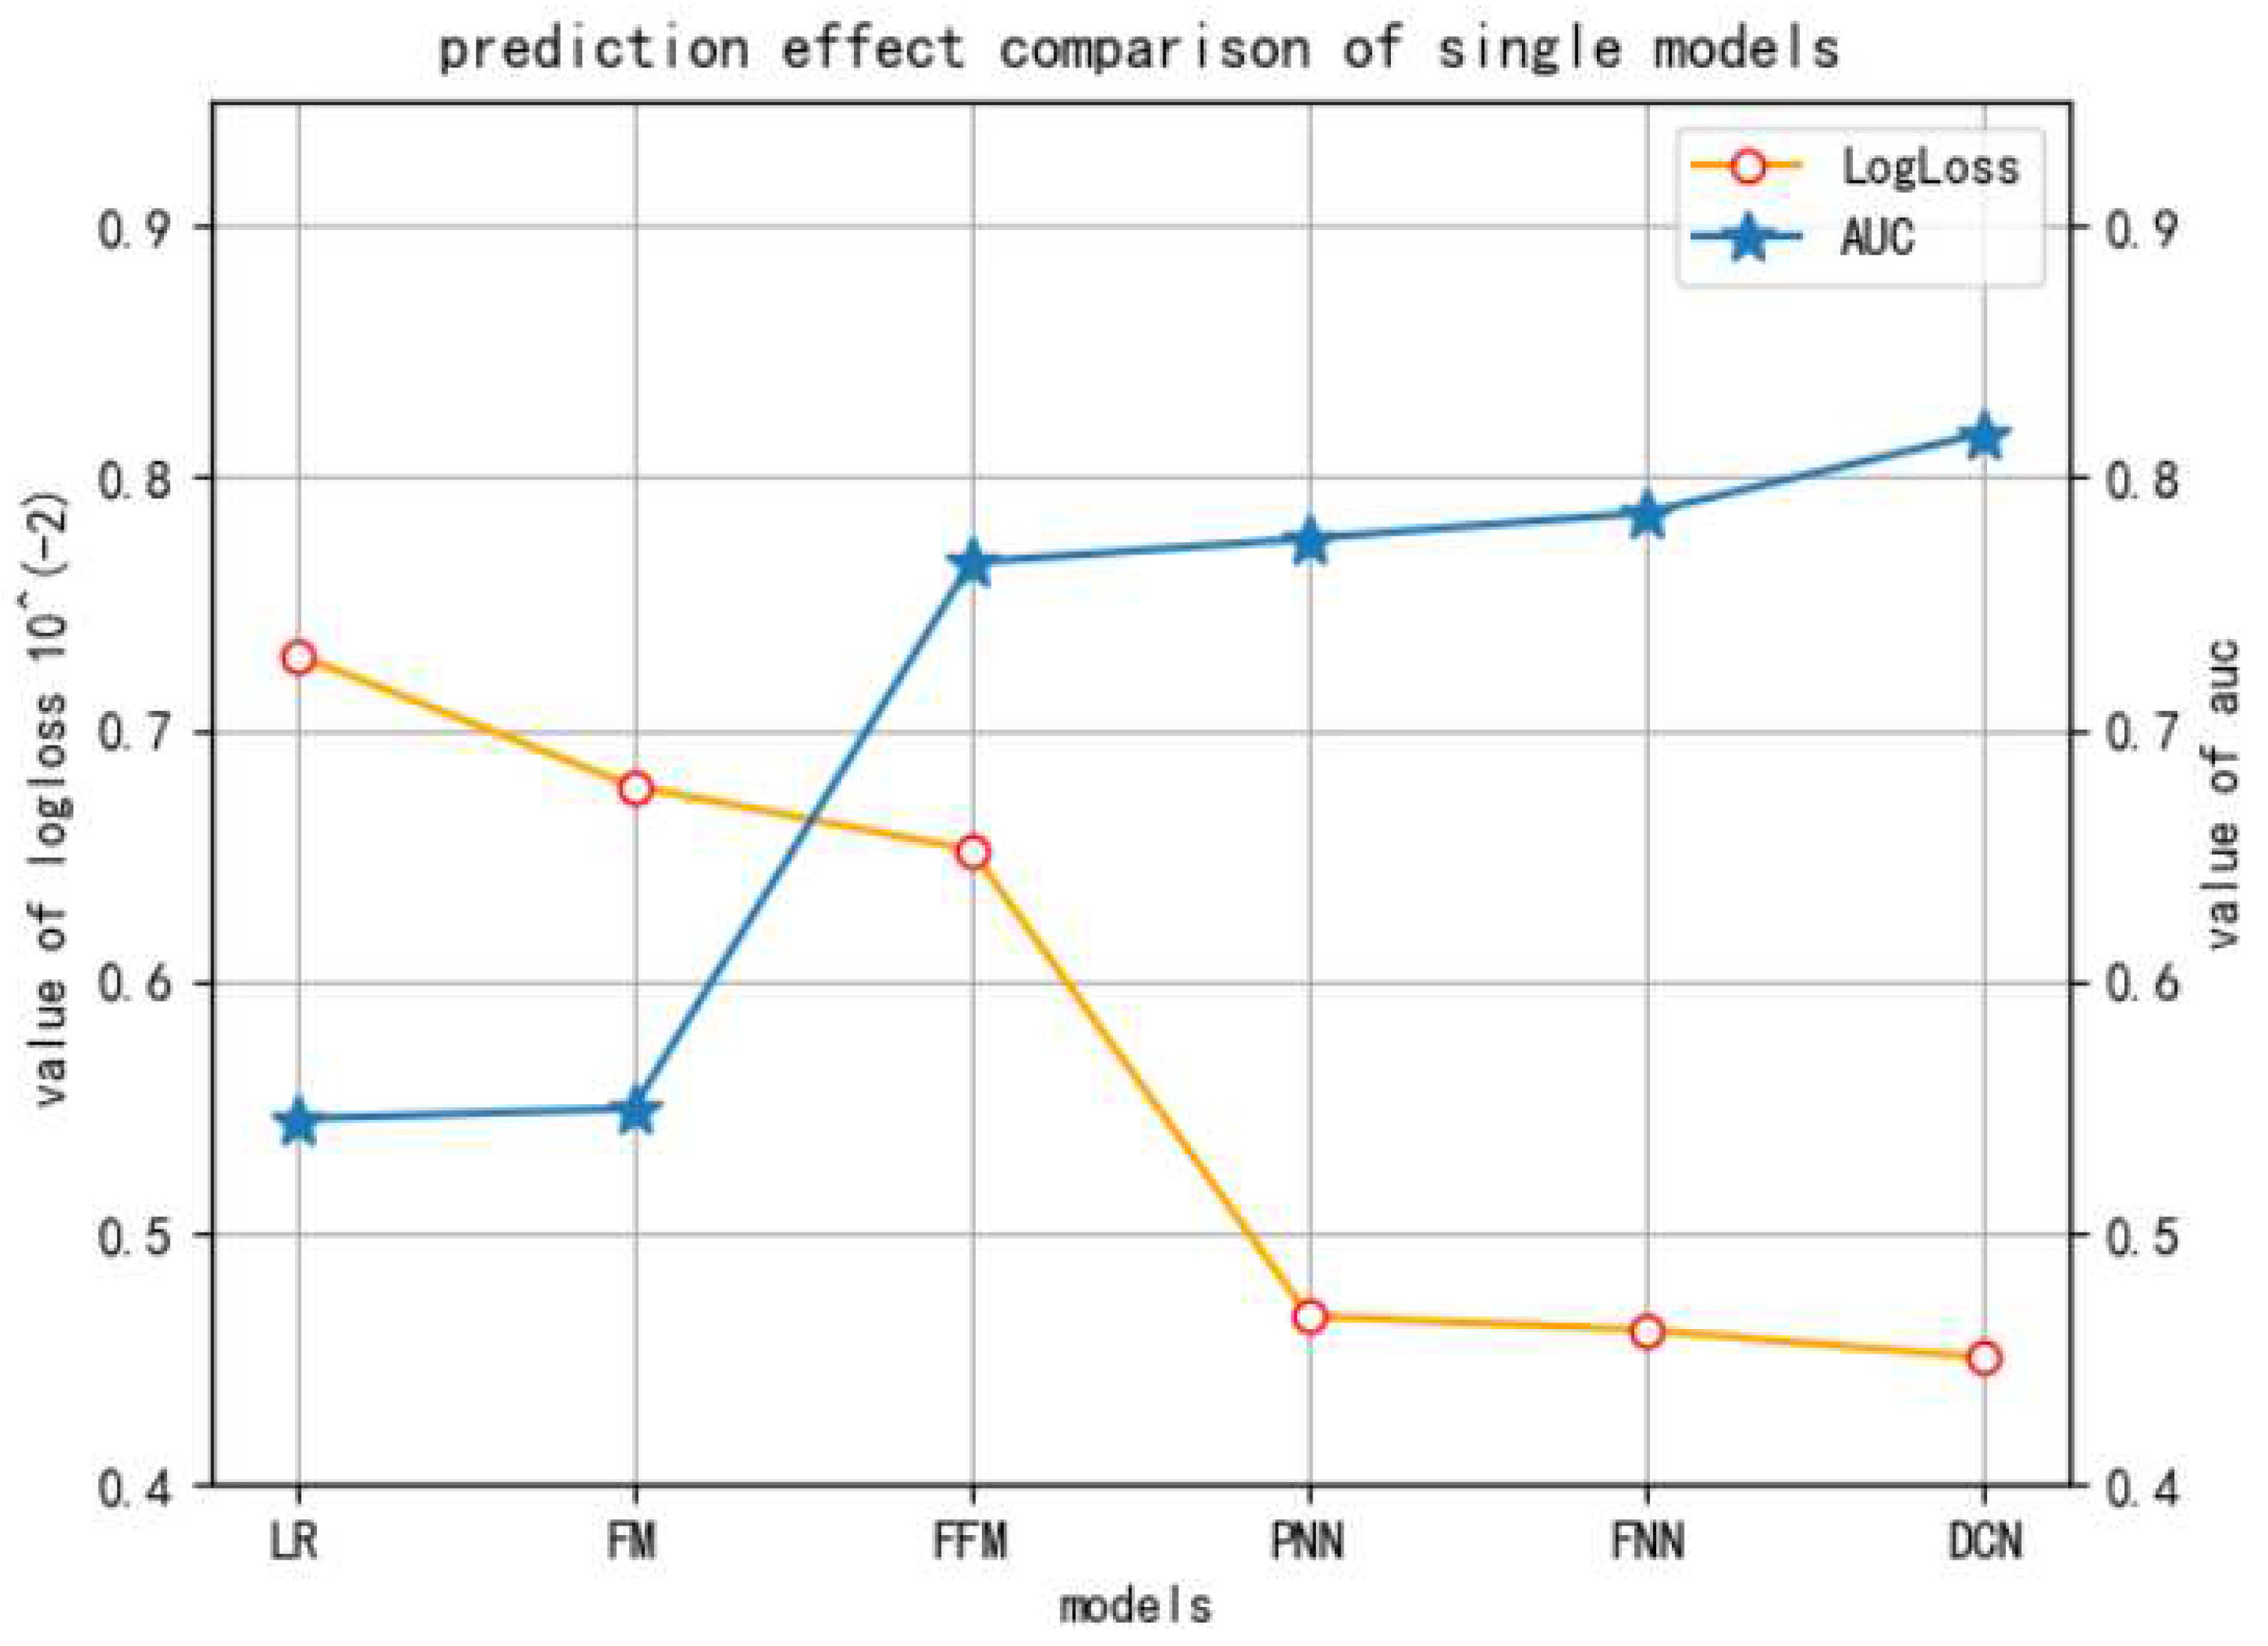
In the first experiment, the performance of several single models is compared in the CTR prediction (taking the dataset of ID 1458). The results are shown in Figure 3. The evaluation metrics are logloss and AUC.
It can be seen that in these typical CTR prediction models, the logloss value of DCN model is the least and AUC value is the best, which verifies the fundamental strength of DCN, upon which our model FO-FTRL-DCN is based.
4.3.2. The Second Experiment
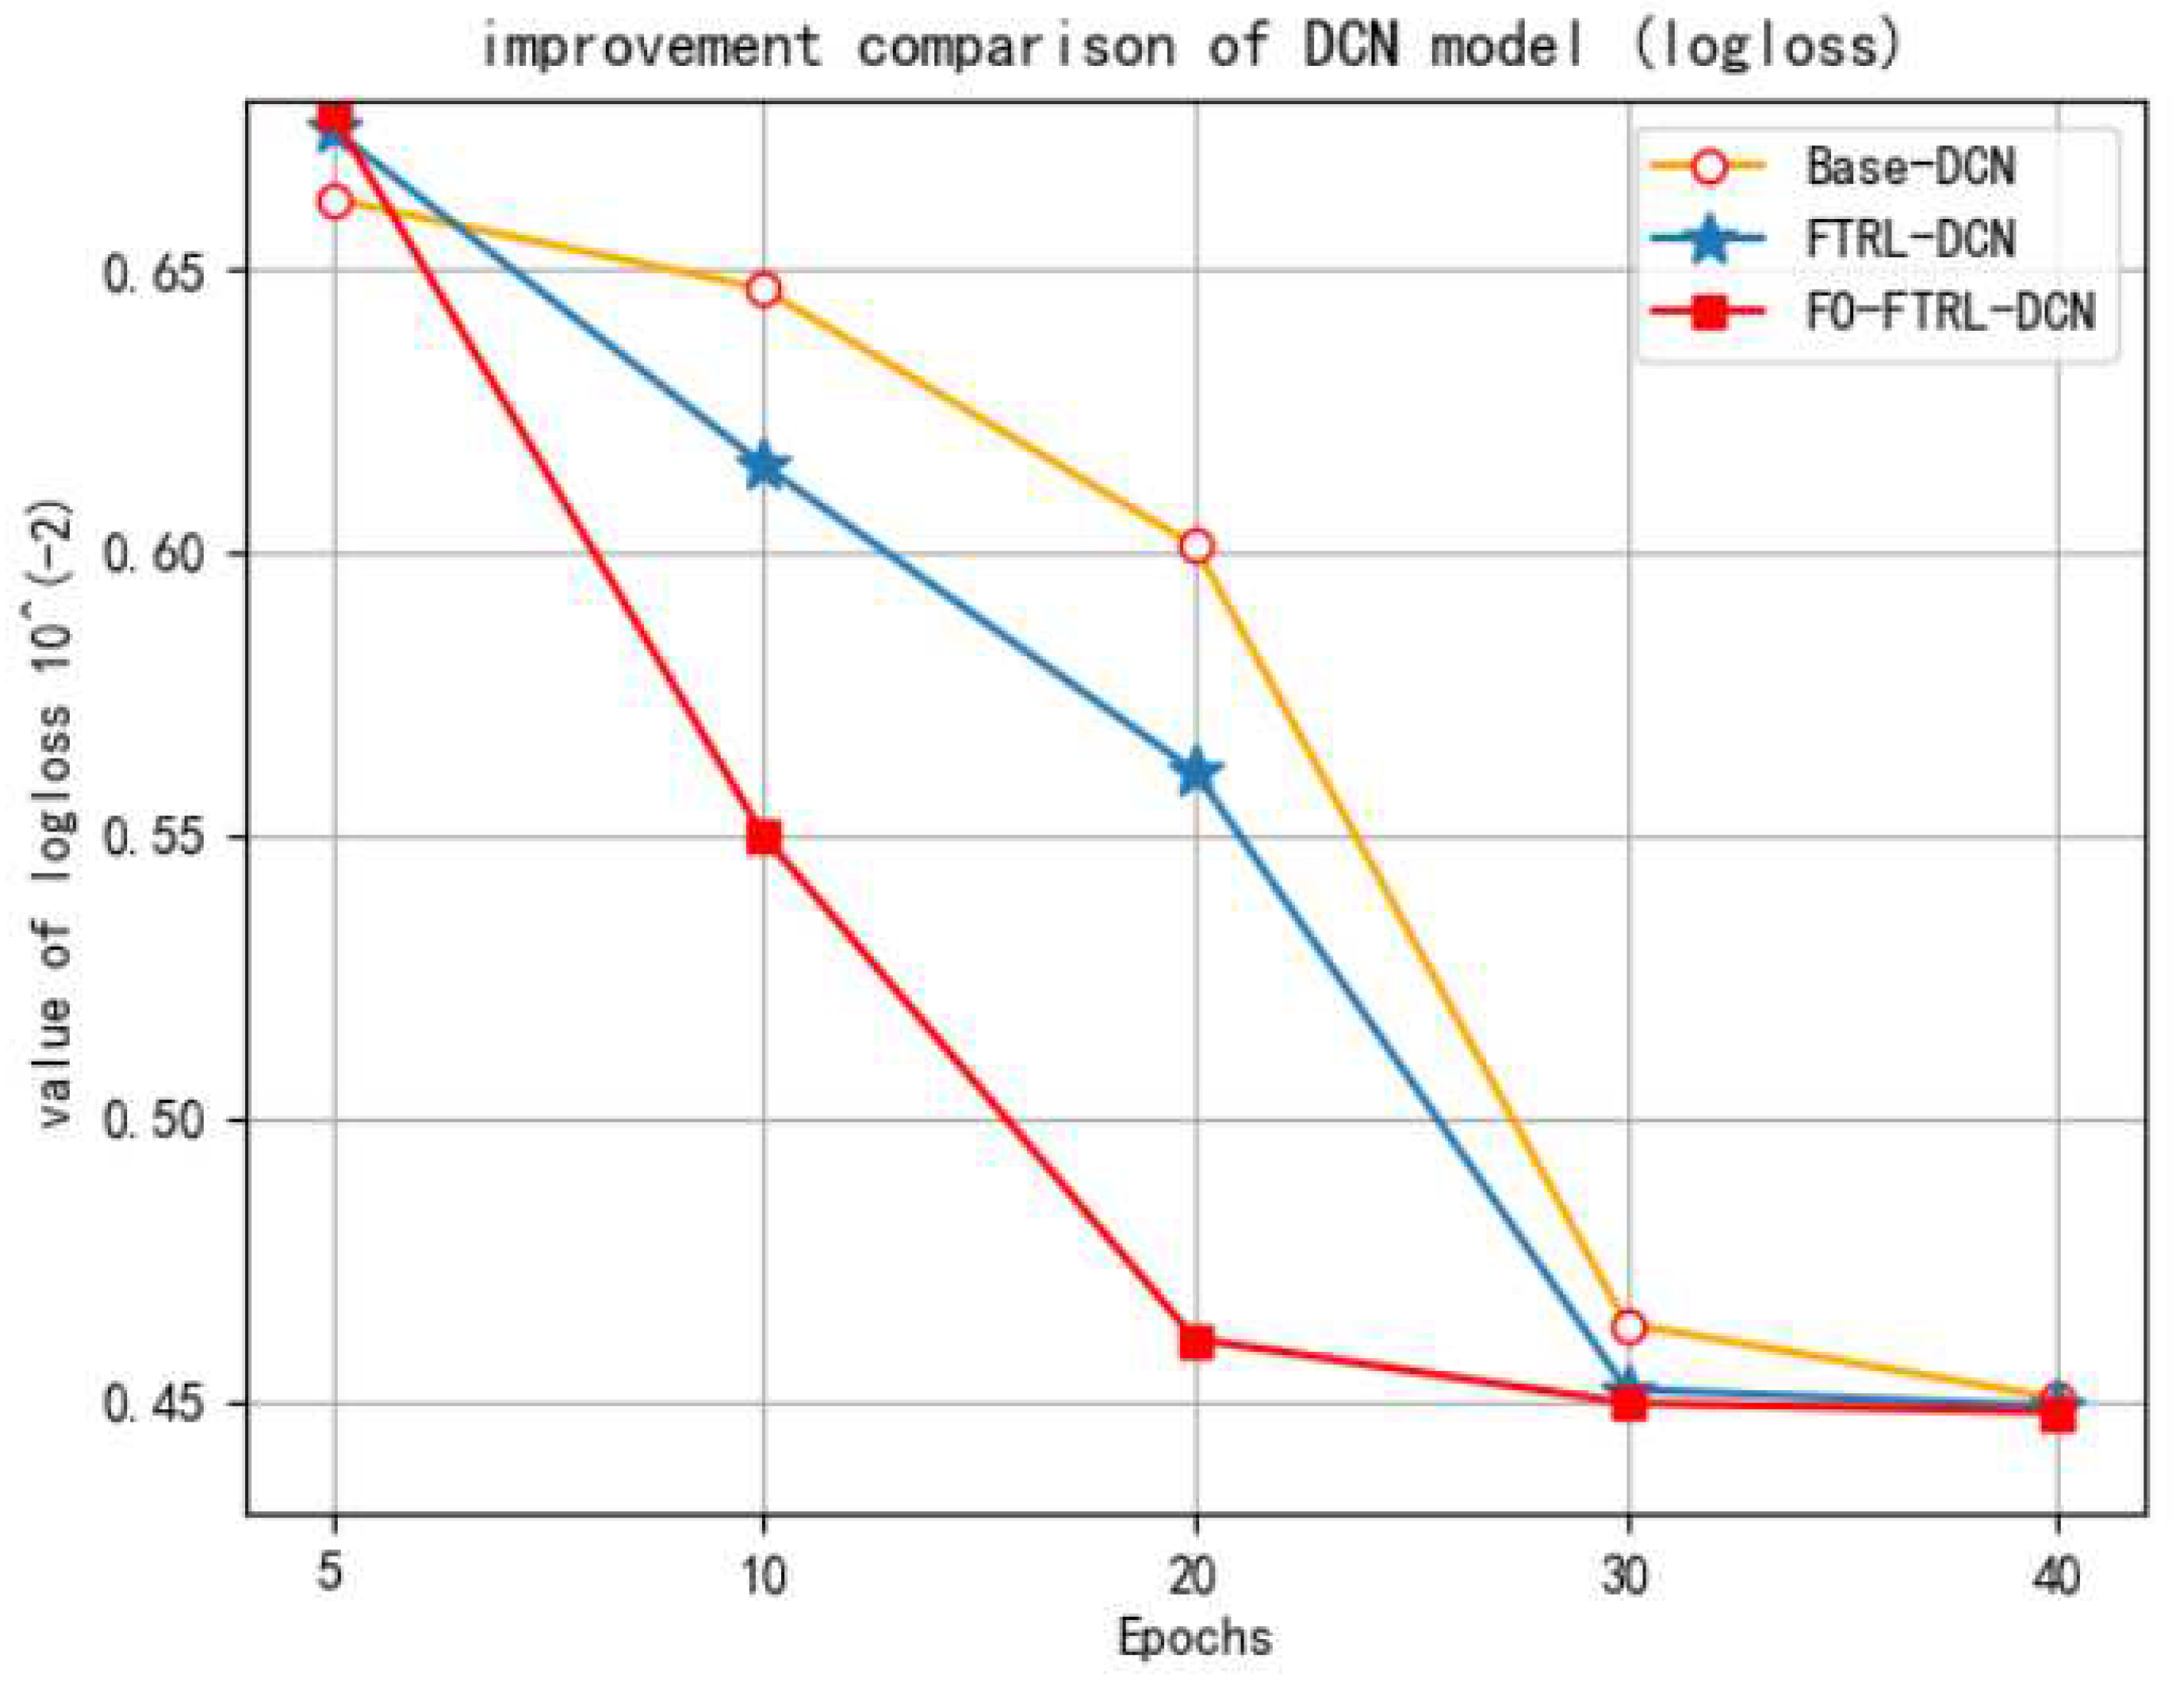
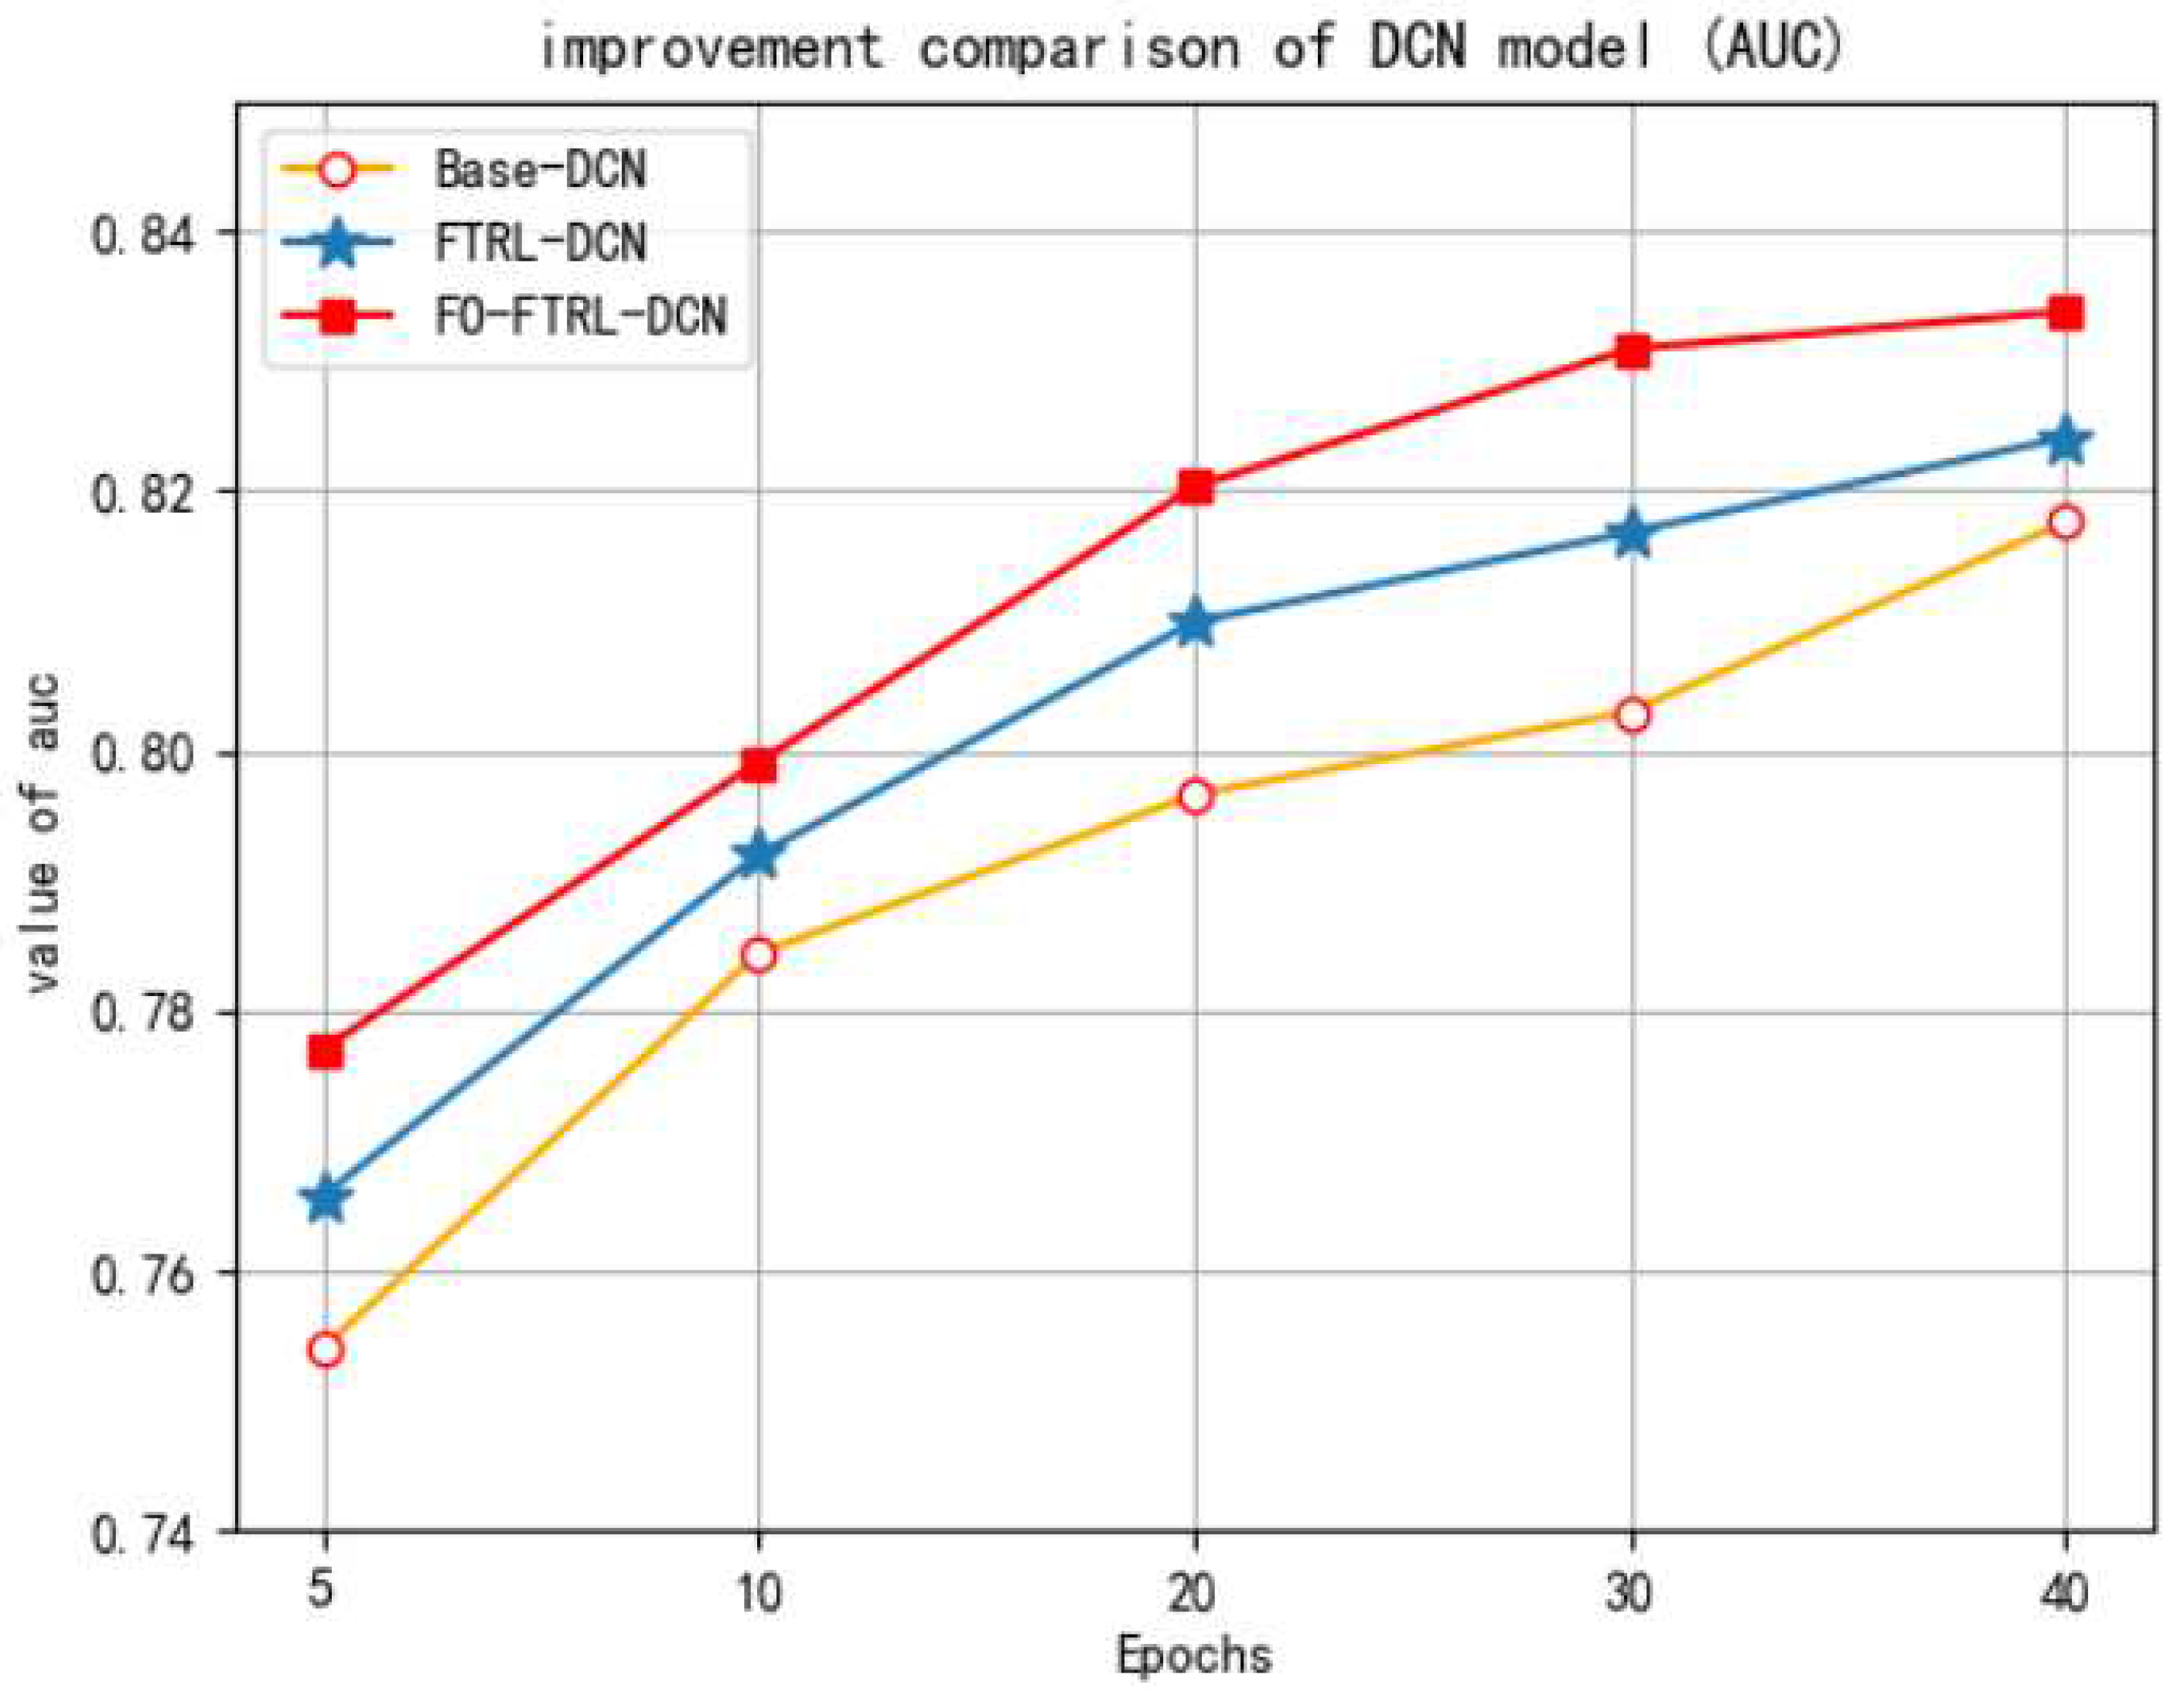
The second experiment is on the ablation study of the approaches proposed in this paper, we compared the DCN model with the proposed FO-FTRL-DCN model in the dataset of ID 1458, in which Base-DCN is the vanilla DCN model, FTRL-DCN is the DCN model with the FTRL optimization algorithm, and FO-FTRL-DCN is the FTRL-DCN model further combined with Feature Optimization (FO). The evaluation metrics are also logloss and AUC, and the comparative results of logloss and AUC are illustrated in Figure 4 and Figure 5, respectively.
In Figure 5, we can see that the convergence speed of FO-FTRL-DCN model is faster because, with embedding optimization and SMOTE, the learning speed and performance of the model are boosted. Finally, the logloss is the least after convergence. In Figure 5, it can be seen that the AUC of the FO-FTRL-DCN model is better than the other two models, and it is also the best after final convergence. The results of these ablation study justify the the efficacy of techniques proposed in this paper.
4.3.3. The Third Experiment
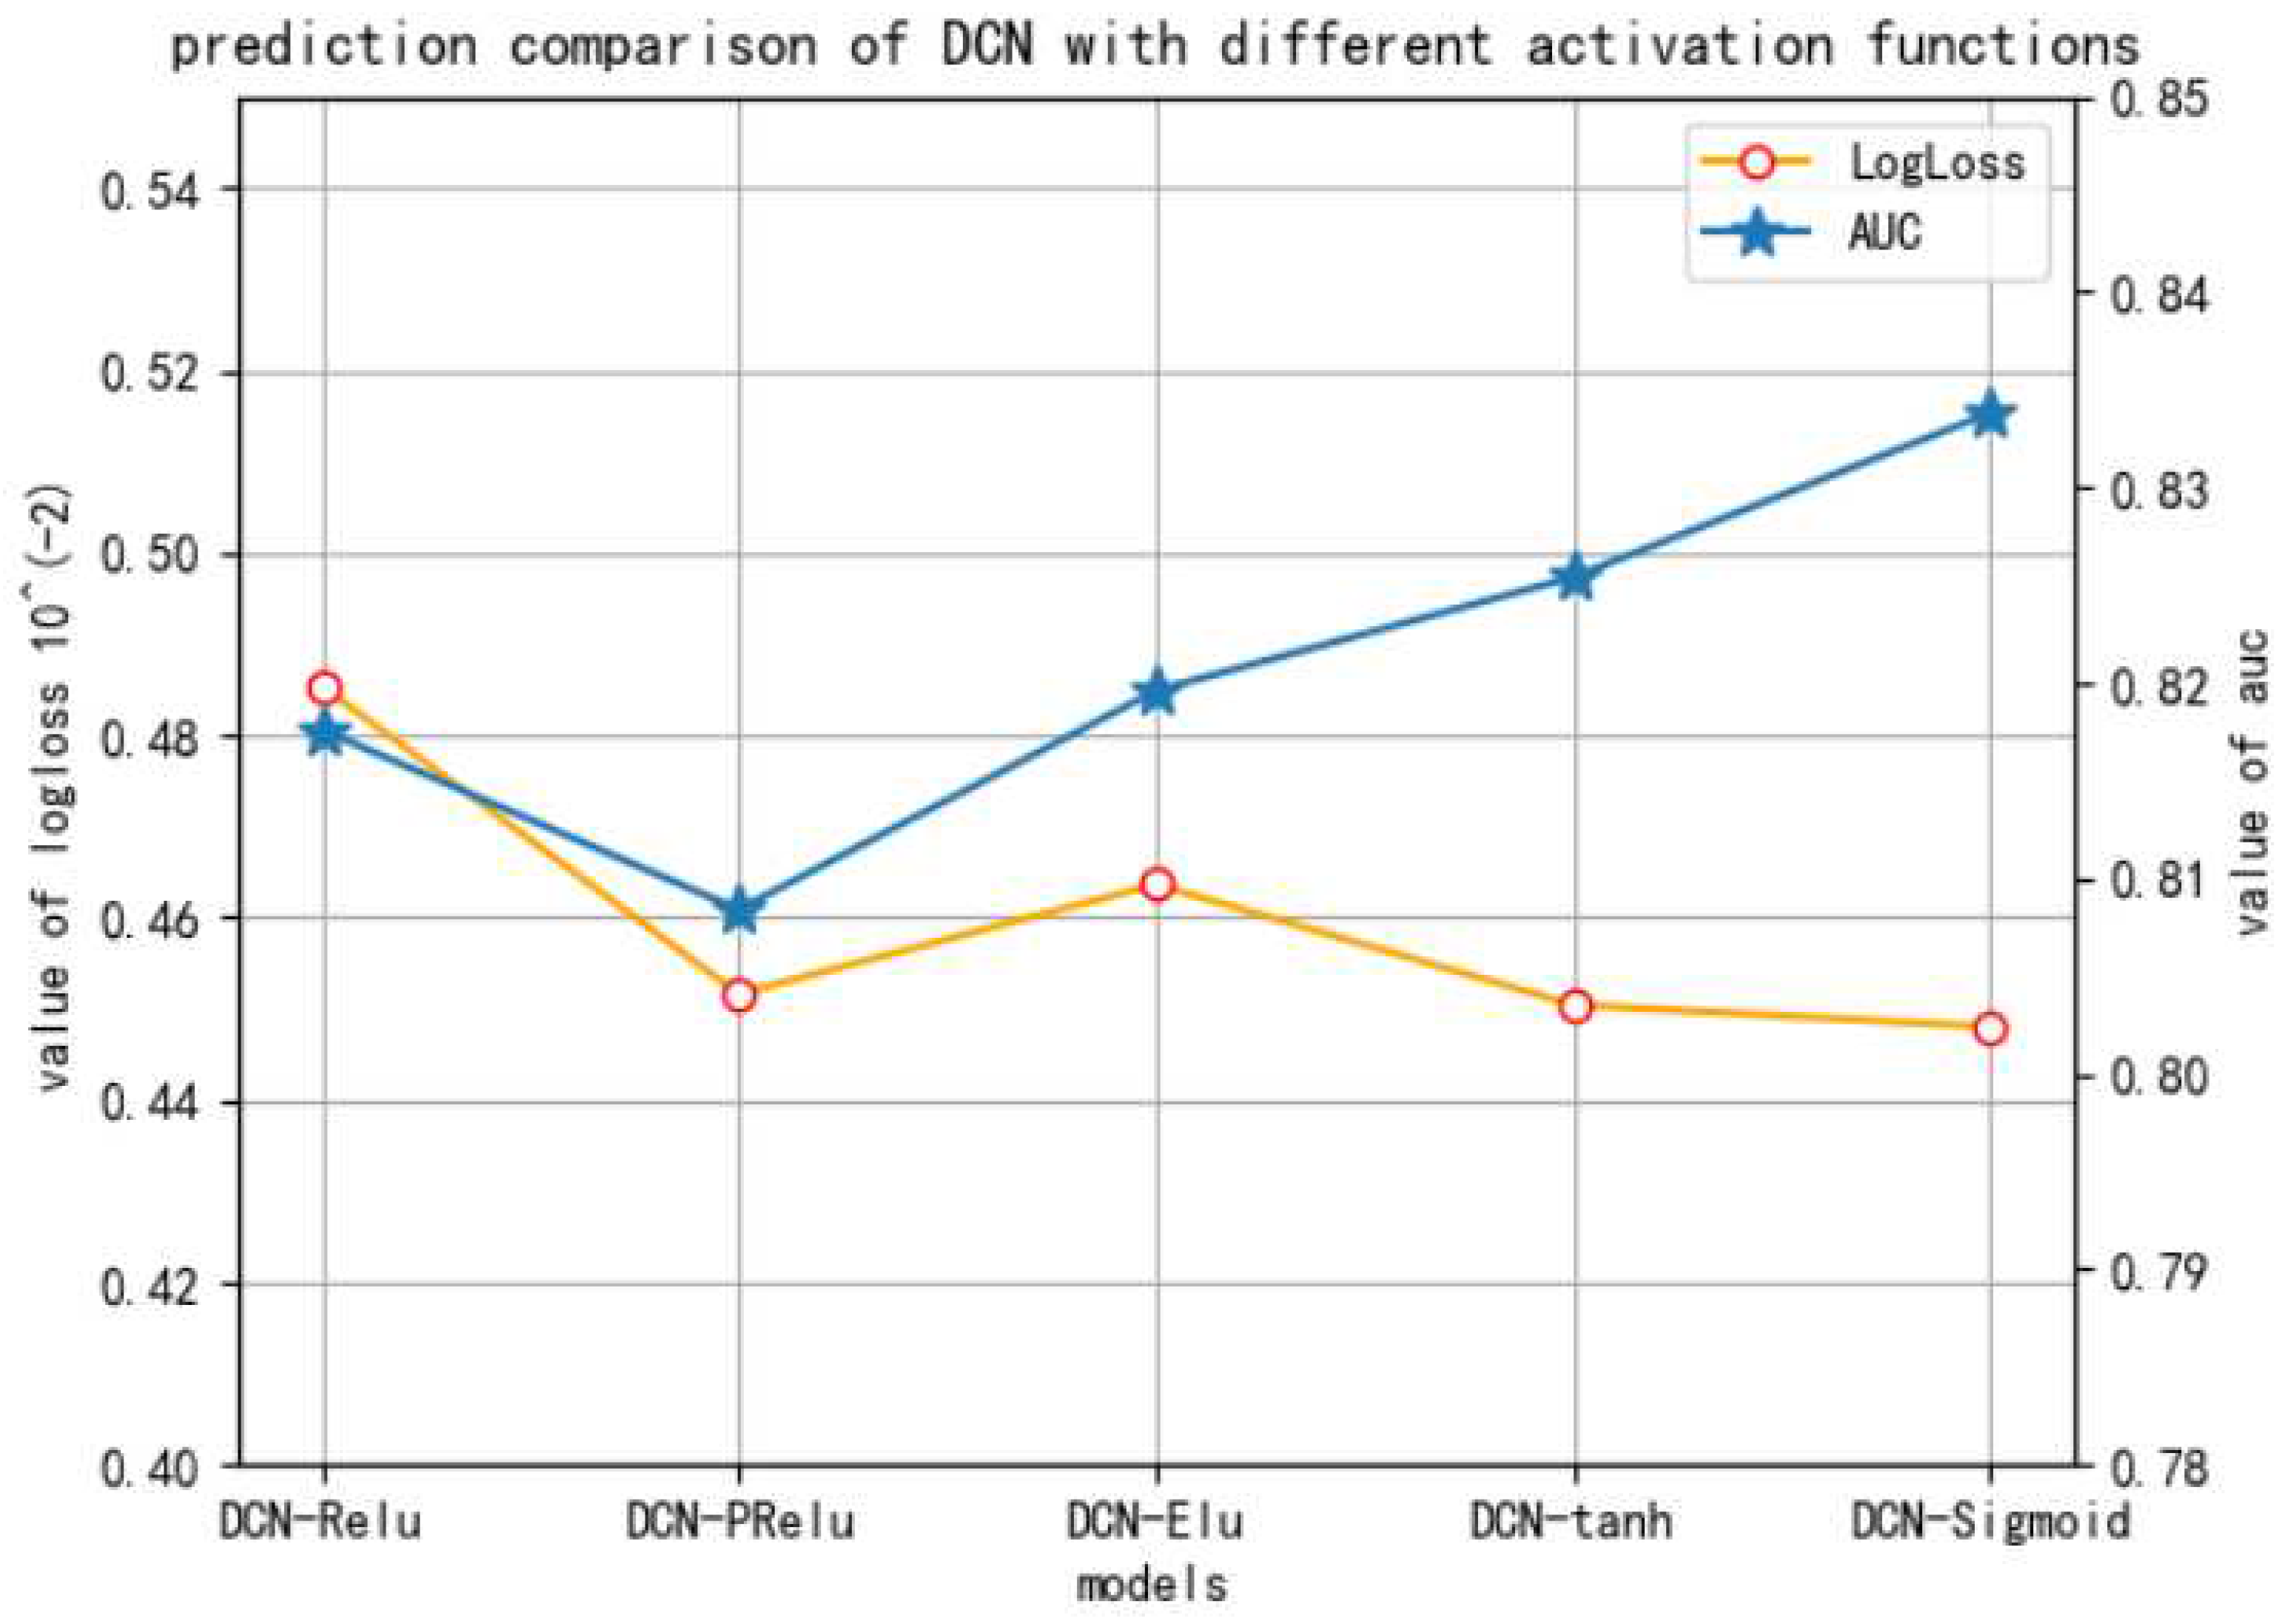
The third experiment is to compare different activation functions in DCN model, on the dataset of ID 1458. The results are presented in Figure 6, with metrics of logloss and AUC.
It can be seen that different activation functions can lead to different performance, and the logloss of DCN-sigmoid model is the least and AUC is the best, which verified that the DCN model with sigmoid activation function is the best option.
4.3.4. The Fourth Experiment
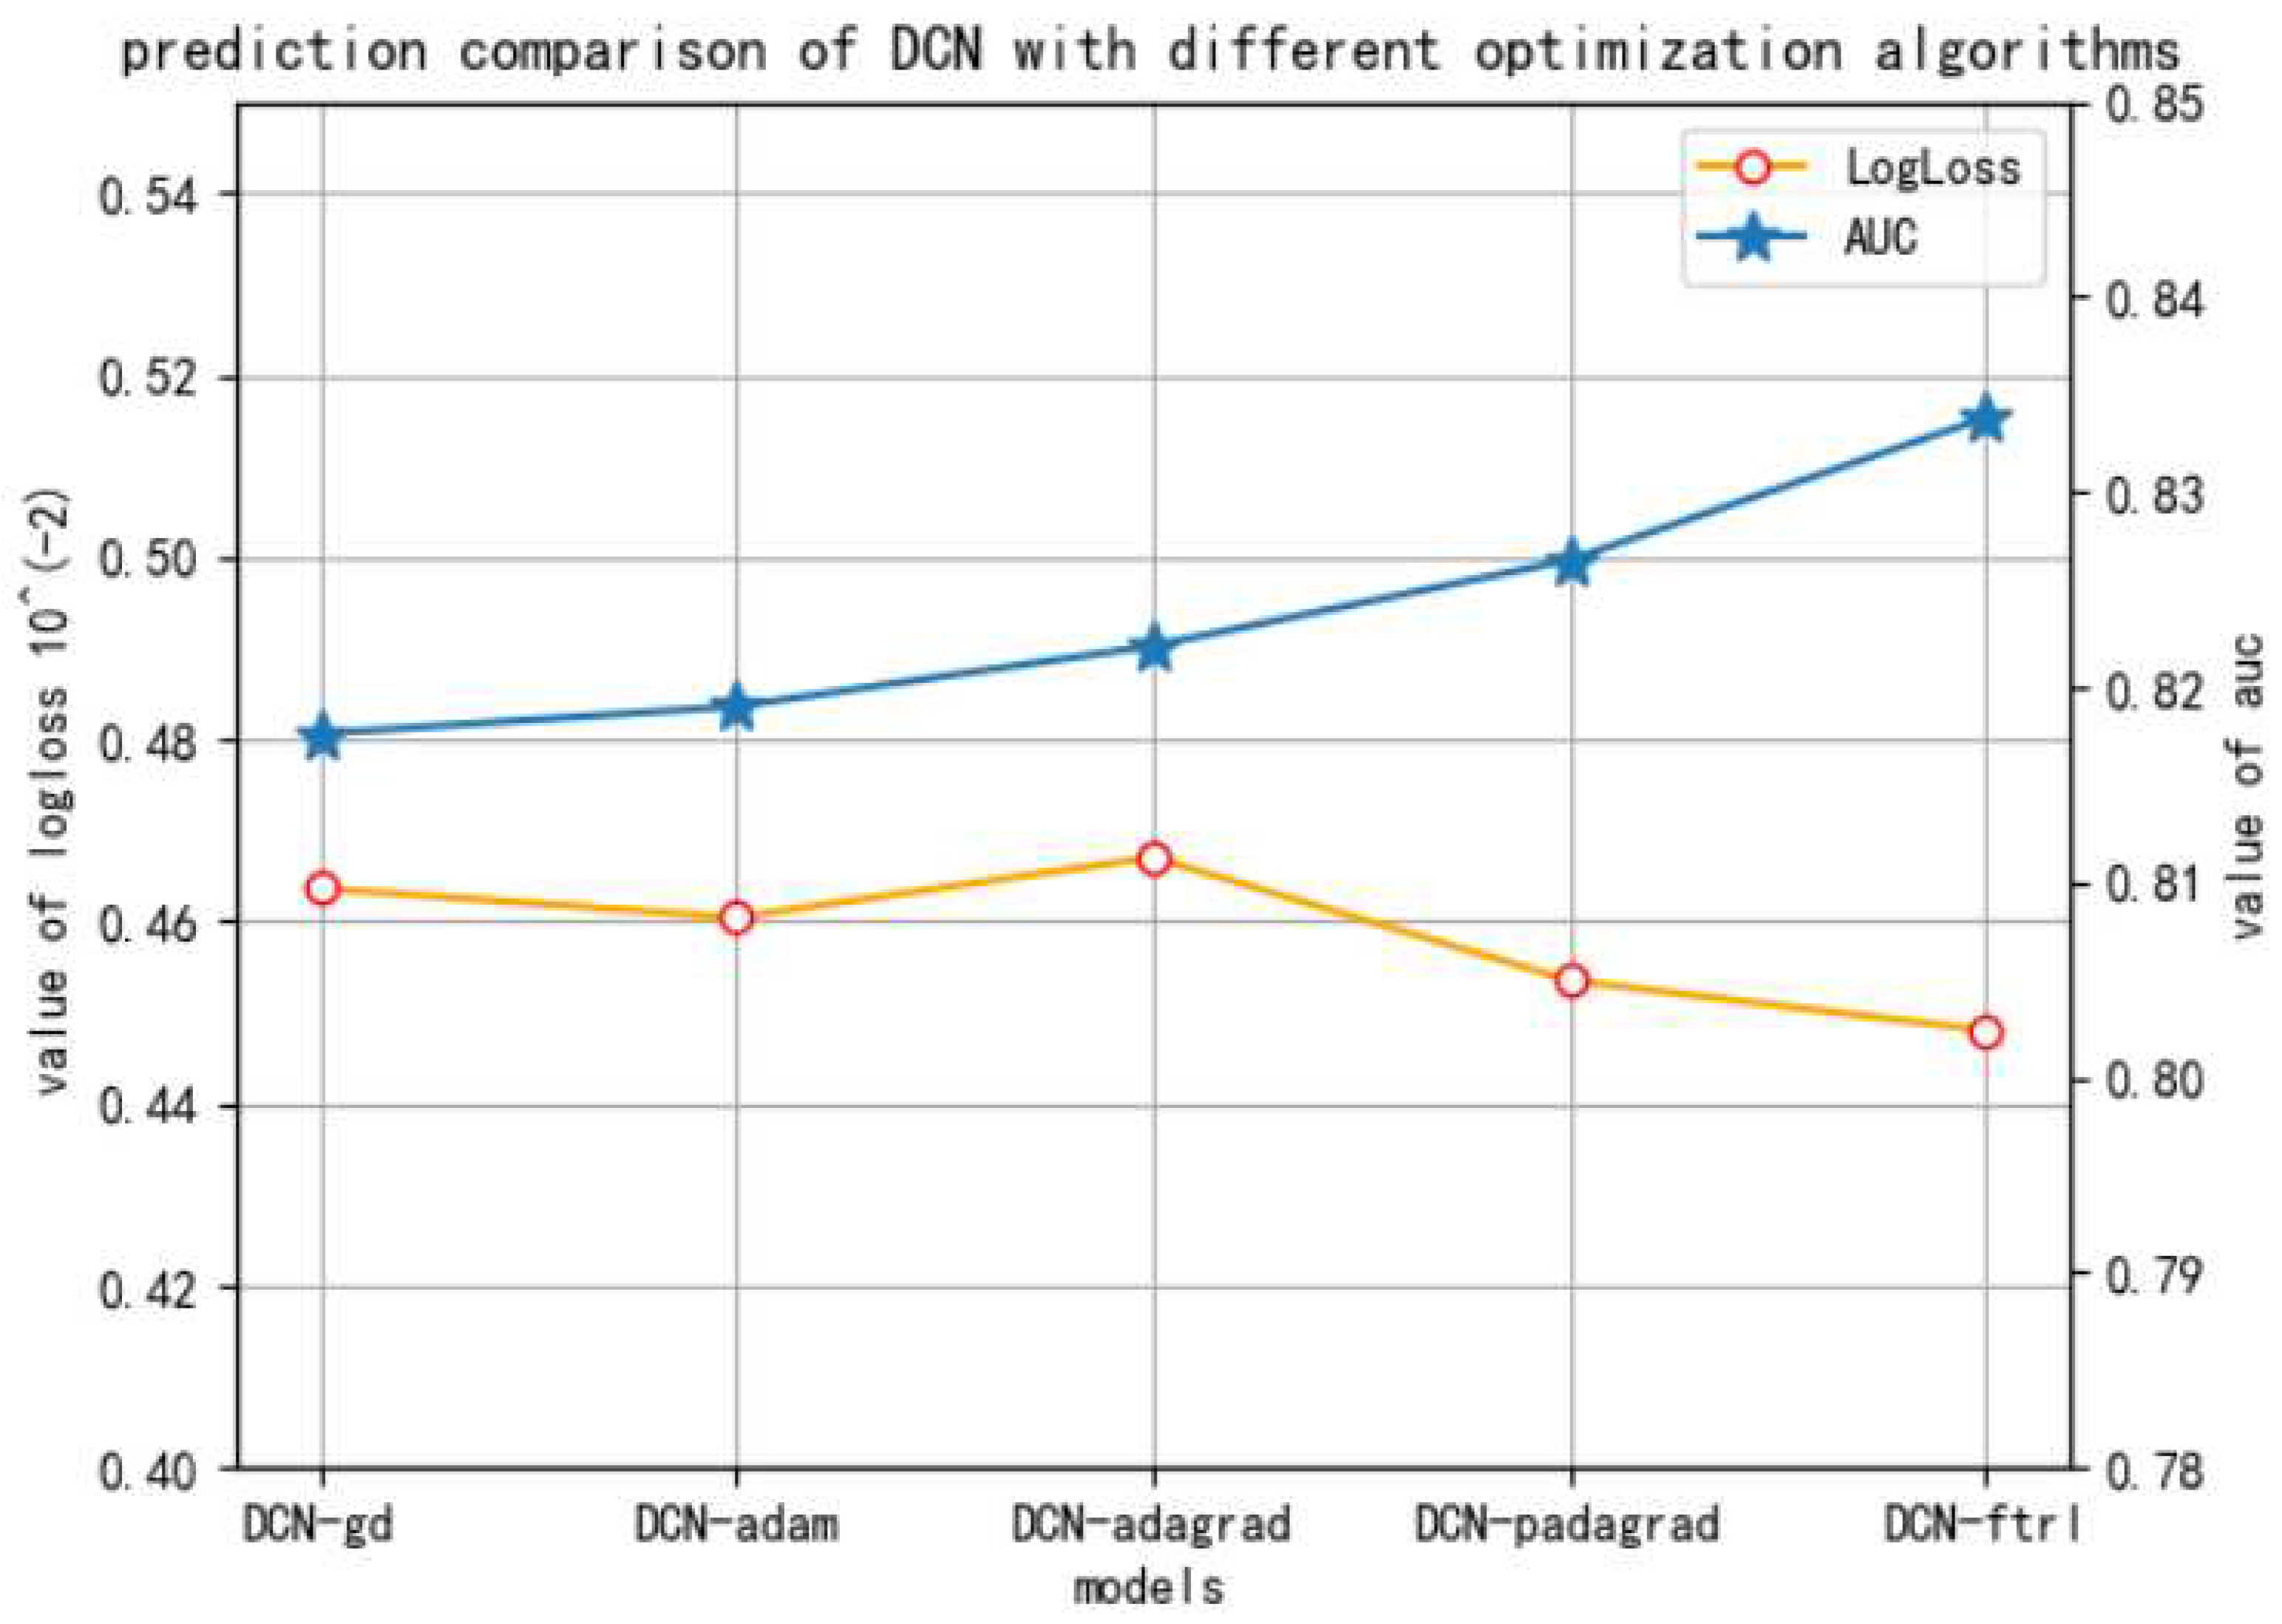
The fourth experiment is to illustrate the logloss and AUC of DCN models with different optimization algorithms on the dataset of ID 1458.
It can be seen in Figure 7 that the logloss value of DCN-FTRL model is the least and AUC is the best, concluding that DCN with FTRL optimization algorithm is the most competitive.
4.3.5. The Fifth Experiment
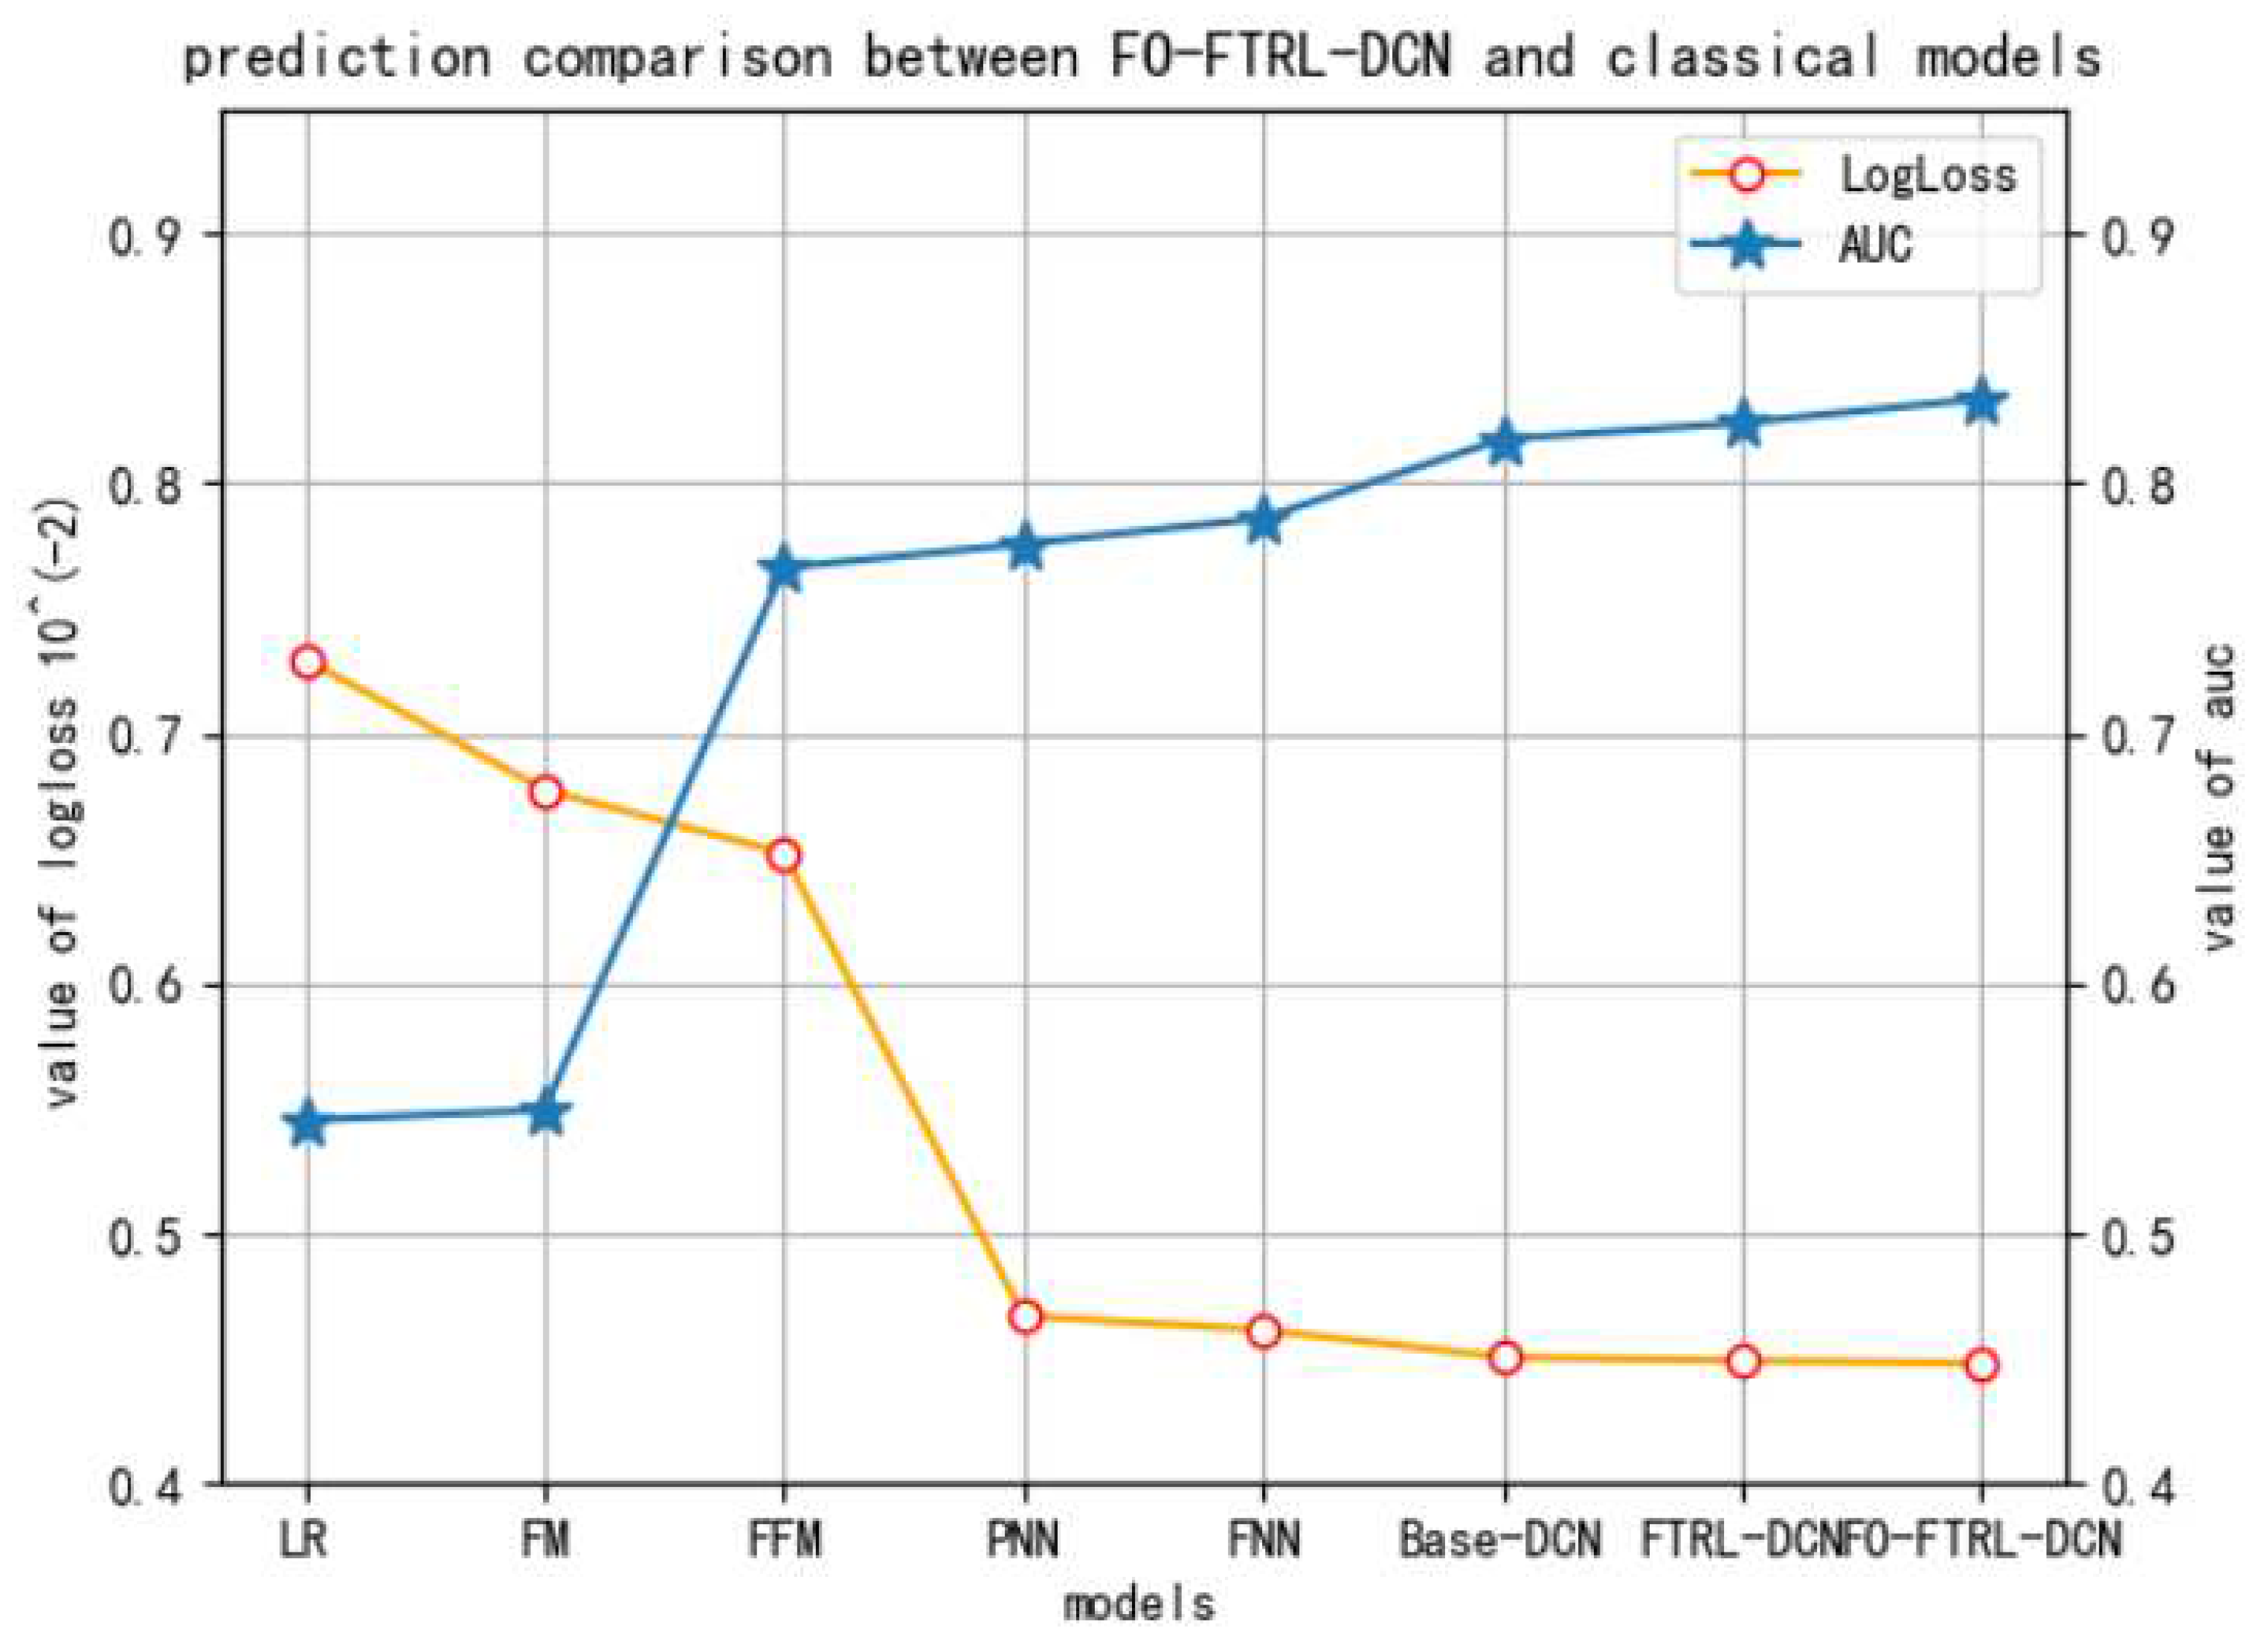
In the fifth experiment, FO-FTRL-DCN model is shown to outperform its predecessors and other state-of-the-art baselines on the dataset of ID 1458, which can be seen in Figure 8. The first five are classic CTR models, and the last three are Base-DCN (the vanilla DCN model), FTRL-DCN (DCN with FTRL optimization), and the proposed FO-FTRL-DCN.
It can be seen that, among these models, the logloss and AUC of the proposed FO-FTRL-DCN model is the best.
4.3.6. The Sixth Experiment
In the sixth experiment, the comprehensive performance comparisons between the proposed model and other state-of-the-art baselines across four datasets of iPinYou are exhibited in Table 2. The datasets of iPinYou are of ID 1458, 3358, 3386, and 3427, with metrics of logloss and AUC.
From Table 2, it can be seen that, across four iPinYou datasets, the logloss and AUC of FO-FTRL-DCN model are always the best, showing the robustness and generalization of our model in different datasets.
4.3.7. Summarization
It can be summarized from the above experimental studies that:
- The base model of DCN can be empowered with the integration of FO and FTRL.
- The sigmoid activation function works the best for the proposed FO-FTRL-DCN model.
- The overall performance of the proposed FO-FTRL-DCN model is better than prestigious state-of-the-art counterparts across different datasets of iPinYou, implying good generalization.
5. Conclusions and Future Research
In this paper, we introduced a FO-FTRL-DCN model for CTR prediction, which is based on Deep& Cross Network (DCN), augmented with the prestigious FTRL algorithm. The extensive comparative experiments on the iPinYou datasets show that the proposed model can outperform state-of-the-art baselines and the vanilla DCN itself, and the comprehensive performance is the best across different datasets, presenting satisfiable robustness and generalization.
This work can be further advanced, such as inserting sequential features during feature engineering and deeper network structures, to capture higher-order feature combinations.
Author Contributions
Conceptualization, G.H.; methodology, Q.C.; software, G.H. and C.D.; validation, C.D., G.H.; investigation, Q.C.; data curation, G.H.; writing—original draft preparation, G.H. and Q.C.; writing—review and editing, Q.C. and C.D.; visualization, G.H.; supervision, Q.C.; project administration, C.D.; funding acquisition, Q.C. All authors have read and agreed to the published version of the manuscript.
Funding
This research received no external funding.
Conflicts of Interest
The authors declare no conflict of interest.
References
- Bayer, E.; Srinivasan, S.; Riedl, E.; Skiera, B. The impact of online display advertising and paid search advertising relative to offline advertising on firm performance and firm value. Int. J. Res. Market. 2020. [Google Scholar] [CrossRef]
- Gligorijevic, J.; Gligorijevic, D.; Stojkovic, I.; Bai, X.; Goyal, A.; Obradovic, Z. Deeply supervised model for click-through rate prediction in sponsored search. Data Min. Knowl. Disc. 2019, 33, 1446–1467. [Google Scholar] [CrossRef]
- Kim, K.H.; Han, S. The effect of youtube Pre-Roll advertising on VTR (View through rate) and CTR (Click through rate). Indian J. Public Health Res. Dev. 2018, 9, 428. [Google Scholar] [CrossRef]
- Zhu, L.; Lin, J. A Pricing Strategy of E-Commerce Advertising Cooperation in the Stackelberg Game Model with Different Market Power Structure. Algorithms 2019, 12, 24. [Google Scholar] [CrossRef] [Green Version]
- McMahan, H.B.; Holt, G.; Sculley, D.; Young, M.; Ebner, D.; Grady, J.; Nie, L.; Phillips, T.; Davydov, E.; Golovin, D.; et al. Ad click prediction: A view from the trenches. In Proceedings of the 19th ACM SIGKDD International Conference on Knowledge Discovery and Data Mining, KDD 2013, Chicago, IL, USA, 11–14 August 2013; Dhillon, I.S., Koren, Y., Ghani, R., Senator, T.E., Bradley, P., Parekh, R., He, J., Grossman, R.L., Uthurusamy, R., Eds.; ACM: New York, NY, USA, 2013; pp. 1222–1230. [Google Scholar]
- Chapelle, O.; Manavoglu, E.; Rosales, R. Simple and Scalable Response Prediction for Display Advertising. ACM Trans. Intell. Syst. Tech. 2014, 5, 61:1–61:34. [Google Scholar] [CrossRef]
- Rendle, S. Factorization Machines. In Proceedings of the ICDM 2010, The 10th IEEE International Conference on Data Mining, Sydney, Australia, 14–17 December 2010; Webb, G.I., Liu, B., Zhang, C., Gunopulos, D., Wu, X., Eds.; IEEE Computer Society: New York, NY, USA, 2010; pp. 995–1000. [Google Scholar]
- Ta, A. Factorization machines with follow-the-regularized-leader for CTR prediction in display advertising. In Proceedings of the 2015 IEEE International Conference on Big Data, Big Data 2015, Santa Clara, CA, USA, 29 October–1 November 2015; pp. 2889–2891. [Google Scholar]
- Juan, Y.; Zhuang, Y.; Chin, W.; Lin, C. Field-aware Factorization Machines for CTR Prediction. In Proceedings of the 10th ACM Conference on Recommender Systems, Boston, MA, USA, 15–19 September 2016; pp. 43–50. [Google Scholar]
- He, X.; Pan, J.; Jin, O.; Xu, T.; Liu, B.; Xu, T.; Shi, Y.; Atallah, A.; Herbrich, R.; Bowers, S.; et al. Practical Lessons from Predicting Clicks on Ads at Facebook. In Proceedings of the Eighth International Workshop on Data Mining for Online Advertising, ADKDD 2014, New York, NY, USA, 24 August 2014; pp. 5:1–5:9. [Google Scholar]
- McMahan, H.B. Follow-the-Regularized-Leader and Mirror Descent: Equivalence Theorems and L1 Regularization. In Proceedings of the Fourteenth International Conference on Artificial Intelligence and Statistics, AISTATS 2011, Fort Lauderdale, FL, USA, 11–13 April 2011; pp. 525–533. [Google Scholar]
- Duchi, J.C.; Singer, Y. Efficient Online and Batch Learning Using Forward Backward Splitting. J. Mach. Learn. Res. 2009, 10, 2899–2934. [Google Scholar]
- Xiao, L. Dual Averaging Methods for Regularized Stochastic Learning and Online Optimization. J. Mach. Learn. Res. 2010, 11, 2543–2596. [Google Scholar]
- Zhang, W.; Du, T.; Wang, J. Deep Learning over Multi-field Categorical Data—A Case Study on User Response Prediction. In Proceedings of the Advances in Information Retrieval—38th European Conference on IR Research, ECIR 2016, Padua, Italy, 20–23 March 2016; pp. 45–57. [Google Scholar]
- Cheng, H.; Koc, L.; Harmsen, J.; Shaked, T.; Chandra, T.; Aradhye, H.; Anderson, G.; Corrado, G.; Chai, W.; Ispir, M.; et al. Wide & Deep Learning for Recommender Systems. In Proceedings of the 1st Workshop on Deep Learning for Recommender Systems, DLRS@RecSys 2016, Boston, MA, USA, 15 September 2016; pp. 7–10. [Google Scholar]
- Qu, Y.; Cai, H.; Ren, K.; Zhang, W.; Yu, Y.; Wen, Y.; Wang, J. Product-Based Neural Networks for User Response Prediction. In Proceedings of the IEEE 16th International Conference on Data Mining, ICDM 2016, Barcelona, Spain, 12–15 December 2016; pp. 1149–1154. [Google Scholar]
- Guo, H.; Tang, R.; Ye, Y.; Li, Z.; He, X. DeepFM: A Factorization-Machine based Neural Network for CTR Prediction. In Proceedings of the Twenty-Sixth International Joint Conference on Artificial Intelligence, IJCAI 2017, Melbourne, Australia, 19–25 August 2017; pp. 1725–1731. [Google Scholar]
- Wang, R.; Fu, B.; Fu, G.; Wang, M. Deep & Cross Network for Ad Click Predictions. In Proceedings of the ADKDD’17, Halifax, NS, Canada, 13–17 August 2017; pp. 12:1–12:7. [Google Scholar]
- Zhou, G.; Zhu, X.; Song, C.; Fan, Y.; Zhu, H.; Ma, X.; Yan, Y.; Jin, J.; Li, H.; Gai, K. Deep Interest Network for Click-Through Rate Prediction. In Proceedings of the 24th ACM SIGKDD International Conference on Knowledge Discovery & Data Mining, KDD 2018, London, UK, 19–23 August 2018; pp. 1059–1068. [Google Scholar]
- Huang, T.; Zhang, Z.; Zhang, J. FiBiNET: Combining feature importance and bilinear feature interaction for click-through rate prediction. In Proceedings of the 13th ACM Conference on Recommender Systems, RecSys 2019, Copenhagen, Denmark, 16–20 September 2019; pp. 169–177. [Google Scholar]
- Feng, Y.; Lv, F.; Shen, W.; Wang, M.; Sun, F.; Zhu, Y.; Yang, K. Deep Session Interest Network for Click-Through Rate Prediction. In Proceedings of the Twenty-Eighth International Joint Conference on Artificial Intelligence, IJCAI 2019, Macao, China, 10–16 August 2019; pp. 2301–2307. [Google Scholar]
- Liang, M.; Du, J.; Yang, C.; Xue, Z.; Li, H.; Kou, F.; Geng, Y. Cross-Media Semantic Correlation Learning Based on Deep Hash Network and Semantic Expansion for Social Network Cross-Media Search. IEEE Trans. Neural Netw. Learn. Syst. 2020, 31, 3634–3648. [Google Scholar] [CrossRef]
- Chawla, N.V.; Bowyer, K.W.; Hall, L.O.; Kegelmeyer, W.P. SMOTE: Synthetic Minority Over-sampling Technique. J. Artif. Intell. Res. 2002, 16, 321–357. [Google Scholar] [CrossRef]
- Barkan, O.; Koenigstein, N. Item2vec: Neural Item Embedding for Collaborative Filtering. In Proceedings of the Poster Track of the 10th ACM Conference on Recommender Systems (RecSys 2016), Boston, MA, USA, 17 September 2016; Guy, I., Sharma, A., Eds.; ACM: New York, NY, USA, 2016; Volume 1688. [Google Scholar]
- Zhu, Q.; Carriere, K. Detecting and correcting for publication bias in meta-analysis C A truncated normal distribution approach. Stat. Methods Med. Res. 2018, 27, 2722–2741. [Google Scholar] [CrossRef]
- Wang, Q.; Zhou, Y.; Zhang, W.; Tang, Z.; Chen, X. Adaptive sampling using self-paced learning for imbalanced cancer data pre-diagnosis. Exp. Syst. Appl. 2020, 152, 113334. [Google Scholar] [CrossRef]
- Goodfellow, I.; Bengio, Y.; Courville, A. Deep Learning; MIT Press: Cambridge, MA, USA, 2016. [Google Scholar]
- Savvopoulos, A.; Kanavos, A.; Mylonas, P.; Sioutas, S. LSTM Accelerator for Convolutional Object Identification. Algorithms 2018, 11, 157. [Google Scholar] [CrossRef] [Green Version]
- Ioffe, S.; Szegedy, C. Batch Normalization: Accelerating Deep Network Training by Reducing Internal Covariate Shift. In Proceedings of the 32nd International Conference on Machine Learning, ICML 2015, Lille, France, 6–11 July 2015; Bach, F.R., Blei, D.M., Eds.; MIT Press: Cambridge, MA, USA, 2015; Volume 37, pp. 448–456. [Google Scholar]
- Ba, L.J.; Kiros, J.R.; Hinton, G.E. Layer Normalization. arXiv 2016, arXiv:1607.06450. [Google Scholar]
- Ulyanov, D.; Vedaldi, A.; Lempitsky, V.S. Instance Normalization: The Missing Ingredient for Fast Stylization. arXiv 2016, arXiv:1607.08022. [Google Scholar]
- Wu, Y.; He, K. Group Normalization. In Proceedings of the Computer Vision—ECCV 2018—15th European Conference, Munich, Germany, 8–14 September 2018; Proceedings, Part XIII, Lecture Notes in Computer Science; Ferrari, V., Hebert, M., Sminchisescu, C., Weiss, Y., Eds.; Springer: Berlin, Germany, 2018; Volume 11217, pp. 3–19. [Google Scholar]
- Luo, P.; Ren, J.; Peng, Z.; Zhang, R.; Li, J. Differentiable Learning-to-Normalize via Switchable Normalization. In Proceedings of the 7th International Conference on Learning Representations, ICLR 2019, New Orleans, LA, USA, 6–9 May 2019. [Google Scholar]
- Andrade, B.; Gois, J.; Xavier, V.; Luna, A. Comparison of the performance of the multiclass classifiers: A new approach to overfitting test. Chemometr. Intell. Lab. Syst. 2020, 201, 104013. [Google Scholar] [CrossRef]
- Leshno, M.; Lin, V.Y.; Pinkus, A.; Schocken, S. Multilayer feedforward networks with a nonpolynomial activation function can approximate any function. Neural Netw. 1993, 6, 861–867. [Google Scholar] [CrossRef] [Green Version]
- Jang, J.; Cho, H.; Kim, J.; Lee, J.; Yang, S. Deep neural networks with a set of node-wise varying activation functions. Neural Netw. 2020, 126, 118–131. [Google Scholar] [CrossRef]
- Yin, X.; Goudriaan, J.; Lantinga, E.A.; Vos, J.; Spiertz, H.J. A Flexible Sigmoid Function of Determinate Growth. Ann. Bot. 2003, 91, 361–371. [Google Scholar] [CrossRef]
- Elwakil, S.A.; El-labany, S.K.; Zahran, M.A.; Sabry, R. Modified extended tanh-function method for solving nonlinear partial differential equations. Phys. Lett. A 2003, 299, 179–188. [Google Scholar] [CrossRef]
- Agarap, A.F. Deep Learning using Rectified Linear Units (ReLU). arXiv 2018, arXiv:1803.08375. [Google Scholar]
- Vydana, H.K.; Vuppala, A.K. Investigative study of various activation functions for speech recognition. In Proceedings of the Twenty-third National Conference on Communications, NCC 2017, Chennai, India, 2–4 March 2017; IEEE: New York, NY, USA, 2017; pp. 1–5. [Google Scholar]
- Wang, T.; Qin, Z.; Zhu, M. An ELU Network with Total Variation for Image Denoising. In Neural Information Processing—Proceedings of the 24th International Conference, ICONIP 2017, Guangzhou, China, 14–18 November 2017; Part III Lecture Notes in Computer Science; Liu, D., Xie, S., Li, Y., Zhao, D., El-Alfy, E.M., Eds.; Springer: Berlin, Germany, 2017; Volume 10636, pp. 227–237. [Google Scholar]
- van den Bergh, F.; Engelbrecht, A.P. Cooperative learning in neural networks using particle swarm optimizers. S. Afr. Comp. J. 2000, 26, 84–90. [Google Scholar]
- Faris, H.; Aljarah, I.; Mirjalili, S. Training feedforward neural networks using multi-verse optimizer for binary classification problems. Appl. Intell. 2016, 45, 322–332. [Google Scholar] [CrossRef]
- Bottou, L. Large-Scale Machine Learning with Stochastic Gradient Descent. In Proceedings of the 19th International Conference on Computational Statistics, COMPSTAT 2010, Paris, France, 22–27 August 2010; Lechevallier, Y., Saporta, G., Eds.; Physica-Verlag: Heidelberg, Germany, 2010; pp. 177–186. [Google Scholar]
- Wilson, A.C.; Recht, B.; Jordan, M.I. A Lyapunov Analysis of Momentum Methods in Optimization. arXiv 2016, arXiv:1611.02635. [Google Scholar]
- Mukkamala, M.C.; Hein, M. Variants of RMSProp and Adagrad with Logarithmic Regret Bounds. In Proceedings of the 34th International Conference on Machine Learning, ICML 2017, Sydney, NSW, Australia, 6–11 August 2017; Precup, D., Teh, Y.W., Eds.; PMLR: Cambridge, MA, USA, 2017; Volume 70, pp. 2545–2553. [Google Scholar]
- Kingma, D.P.; Ba, J. Adam: A Method for Stochastic Optimization. In Proceedings of the 3rd International Conference on Learning Representations, ICLR 2015, San Diego, CA, USA, 7–9 May 2015. [Google Scholar]
- Andrei, N. Scaled conjugate gradient algorithms for unconstrained optimization. Comp. Opt. Appl. 2007, 38, 401–416. [Google Scholar] [CrossRef]
- Schraudolph, N.N.; Yu, J.; Günter, S. A Stochastic Quasi-Newton Method for Online Convex Optimization. In Proceedings of the Eleventh International Conference on Artificial Intelligence and Statistics, AISTATS 2007, San Juan, Puerto Rico, 21–24 March 2007; Meila, M., Shen, X., Eds.; PMLR: Cambridge, MA, USA, 2007; Volume 2, pp. 436–443. [Google Scholar]
Figure 1.
The FO-Follow The Regularized Leader (FTRL)-Deep&Cross Network (DCN) model.

Figure 2.
The calculation of an intersection.

Figure 3.
The comparison of single models.

Figure 4.
The comparison of DCN model (logloss).

Figure 5.
The comparison of DCN model (Area Under the Curve (AUC).

Figure 6.
The comparison of DCN model with different activation functions.

Figure 7.
The comparison of DCN with different optimization algorithms.

Figure 8.
The comparison between FO-FTRL-DCN and classical models.


Table 1.
The statistics of four datasets of iPinYou.
| Dataset | Sample Number | Click Number | Click Rate () | Feature Domain | Feature Number | |
|---|---|---|---|---|---|---|
| ID = 1458 | Training set | 3083056 | 2454 | 0.79596 | 16 | 560802 |
| Test set | 614638 | 515 | 0.83789 | 16 | 560802 | |
| ID = 3358 | Training set | 1742104 | 1358 | 0.77952 | 16 | 491700 |
| Test set | 300928 | 260 | 0.86399 | 16 | 491700 | |
| ID = 3386 | Training set | 2847802 | 2076 | 0.72898 | 16 | 556884 |
| Test set | 545421 | 445 | 0.81588 | 16 | 556884 | |
| ID = 3427 | Training set | 2593765 | 1926 | 0.74255 | 16 | 551158 |
| Test set | 536795 | 366 | 0.68182 | 16 | 551158 |
Table 2.
The comparison between the proposed model and classical models on four datasets.
| Models | 1458 | 3358 | 3386 | 3427 | ||||
|---|---|---|---|---|---|---|---|---|
| AUC | LogLoss () | AUC | LogLoss () | AUC | LogLoss () | AUC | LogLoss () | |
| LR | 0.5452 | 0.7298 | 0.6463 | 0.6461 | 0.5217 | 0.6523 | 0.6741 | 1.720 |
| FM | 0.5493 | 0.6774 | 0.7007 | 0.9144 | 0.5415 | 0.6378 | 0.7327 | 1.270 |
| FFM | 0.7662 | 0.6521 | 0.8698 | 0.7680 | 0.7348 | 0.6978 | 0.8264 | 0.7152 |
| PNN | 0.7757 | 0.4669 | 0.8860 | 0.4756 | 0.7640 | 0.6245 | 0.8440 | 0.4607 |
| FNN | 0.7860 | 0.4613 | 0.8793 | 0.4804 | 0.7642 | 0.6013 | 0.8381 | 0.4680 |
| Base-DCN | 0.8176 | 0.4504 | 0.8860 | 0.4707 | 0.7941 | 0.5928 | 0.8337 | 0.4704 |
| FTRL-DCN | 0.8241 | 0.449 | 0.8914 | 0.4759 | 0.8017 | 0.5927 | 0.8543 | 0.4576 |
| FO-FTRL-DCN | 0.8338 | 0.448 | 0.8969 | 0.4697 | 0.8040 | 0.5891 | 0.8574 | 0.4564 |
Publisher’s Note: MDPI stays neutral with regard to jurisdictional claims in published maps and institutional affiliations. |
© 2020 by the authors. Licensee MDPI, Basel, Switzerland. This article is an open access article distributed under the terms and conditions of the Creative Commons Attribution (CC BY) license (http://creativecommons.org/licenses/by/4.0/).
Share and Cite
MDPI and ACS Style
Huang, G.; Chen, Q.; Deng, C. A New Click-Through Rates Prediction Model Based on Deep&Cross Network. Algorithms 2020, 13, 342. https://0-doi-org.brum.beds.ac.uk/10.3390/a13120342
AMA Style
Huang G, Chen Q, Deng C. A New Click-Through Rates Prediction Model Based on Deep&Cross Network. Algorithms. 2020; 13(12):342. https://0-doi-org.brum.beds.ac.uk/10.3390/a13120342
Chicago/Turabian StyleHuang, Guojing, Qingliang Chen, and Congjian Deng. 2020. "A New Click-Through Rates Prediction Model Based on Deep&Cross Network" Algorithms 13, no. 12: 342. https://0-doi-org.brum.beds.ac.uk/10.3390/a13120342
Note that from the first issue of 2016, this journal uses article numbers instead of page numbers. See further details here.