1. Introduction
Colombia’s health system is formed by the public sector and the private sector. The general social security system has two plans, contributory and subsidized. The contributory regime covers salaried workers, pensioners, and independent workers, with the subsidized plan covering anyone who cannot pay. Enrollment coverage increased from 96.6% in 2014 to 97.6% in 2015 [
1].
The National Health Authority’s primary purpose in Colombia is to improve the quality of healthcare and strengthening supervision, surveillance, and control of the health system. The 2015 Statutory Health Law No. 1751 places the responsibility for guaranteeing the right to health with the health system and recognizes health as a fundamental social right and makes it the state’s responsibility to pursue an approach in health promotion and disease prevention [
2].
The health sector in Colombia supports all initiatives for implementing new technologies to prevent cardiovascular diseases, disabilities, and high-cost hospitalization cases [
3]. There is a remarkable need to improve the prediction of the risk of conditions for the population through the integration and unification of massive volumes of data and the implementation of effective advance analytic solutions to improve the decision-making process and population health management in Colombia’s population [
4].
Keralty organization is formed by a group of insurance and health services companies with a global presence, which together develops an integral health model, whose purpose is to produce health and well-being to people throughout their lives. The organization is committed to keeping its users healthy and autonomous, focusing on prevention, identification, and management of health risks, control, and care of disease and dependency [
5]. The organization is a leader in Colombia by providing integrated health services and is recognized for their human, scientific, technical, and ethical approach [
6].
This paper presents how we can obtain value from a large volume of heterogeneous data generated by different data sources in healthcare, and the architecture implemented. The development of proper advanced data analytics methods such as machine learning and big data analytics to perform meaningful real-time analysis on the data to predict clinical complications before it happens and to support the decision-making process are challenging but much needed to handle the complexity of the data-driven problems we are currently facing.
1.1. Related Work
Several initiatives in Europe, Asia, and North America aim to develop healthcare digital platforms with collaborative access tools to allow the exchange and sharing of information and knowledge wherever and whenever needed throughout the attention process. This type of frameworks and architectures will allow maximum quality and efficiency for patient’s care, and to provide appropriate attention to the patient’s condition and risks.
Castilla and Leon, for example, implemented a digitalization of health services as a tool to increase the efficiency of the services and increase the security in the attention to patient [
7]. A healthcare cyber-physical system assisted by cloud and big data is being developed in the department of computer science at Pace University in New York [
8]. This system consists of a data integration layer, a data management layer, and a data-analytics service layer to improve the functioning of the healthcare system. In France, a group of researchers implemented a wearable knowledge as a service platform to cleverly manage heterogeneous data coming from wearable devices to assist the physicians in supervising the patient health [
9]. Another interesting work was presented at the International Conference on Computational Intelligence and Data Science (ICCIDS 2018). The authors proposed a hybrid four-layer healthcare model to improve disease diagnostic [
10]. In India, a centralized architecture for an end to end integration of healthcare systems deployed in the cloud environment was developed using fog computing [
11].
Medical organizations are investing more and more in developing a healthcare platform that integrates data, applications, business processes, and user interfaces to gain knowledge and useful insights for clinical decisions, drug recommendation systems, and better disease diagnoses. Some other examples of big data applications in healthcare can be found in healthcare monitoring, where data captured from wearable devices can assist providers in managing symptoms of patients online and adjust their prescriptions [
12]. An analytical platform called “MedAware” has been developed to detect errors in medical prescriptions and clinical errors, reducing the hospital admission and readmission in real-time [
13]. In the healthcare prediction field, a healthcare system called “Gemini (Generalizable Medical Information analysis and Integration system)” was developed to collect, process, and analyze large volumes of clinical data and apply machine learning algorithms for performing predictive analytics [
14]. Other platforms have been implemented for genomics data analytics to generate predictions based on DNA molecular changes and mutations [
15]. Another type of healthcare platform is related to the healthcare knowledge system, defined as the combination of clinical data and physician expertise to support clinical decision-making and diagnosis [
16].
1.2. Why Big Data and Machine Learning?
Big data and machine learning are redefining healthcare goals for the future. Healthcare data are impacting the way disease research is performed, and the level of complexity in population health management is increasing as the traditional fee for service approach is transformed into the value-based care model [
17,
18].
Population health management is basically the aggregation of patient health data from multiple data sources, and the analysis and transformation into actionable insights to generate informed decisions to improve clinical and financial outcomes [
19].
Big data technologies will allow us to bring large volumes of structured and unstructured data from disparate data sources into a data repository to be examined and analyzed. Machine learning models will assist in discovering insights from complex datasets with capabilities such as finding unseen patterns, making new predictions, and analyzing trends on health data. Machine learning is being used in a variety of clinical domains with the analysis of hundreds of clinical parameters resulting in effective and efficient models to improve the outcomes and quality of medical care models [
20].
The implementation of this platform shows the enormous potential in using big data to individualize medical treatment, the opportunity for improving the lives of the patients, delivering better medical care, and reduced waste at an operational level [
21]. Other chances for big data in healthcare for Keralty organization are:
A physician would know before prescribing whether the patient is at high-risk to become dependent and different treatment plans can be selected based on this information.
Psychosocial and clinical medical data could inform about the development of a chronic illness that can be properly diagnosed.
The organization can use big data to understand how they are performing, the opportunities to improve clinical care, and their capacity to redesign care delivery to their patients.
Using the platform’s analytics component to improve the quality of care and patient experience at the lowest possible cost is core to the organization.
Capturing streaming data and wearable data can provide to healthcare providers real-time insights about a patient’s health that will allow them to improve their decision-making process for treatment and medication.
Big data analysis can help the organization to deliver information that is evidence-based and can improve the efficiency, understanding, and implementation of the best practices associated with any disease.
In addition to the big data technologies used to build the platform, another essential component is the advanced analytic module of the platform. This module contains several machine learning algorithms to support clinical diagnosis. However, the organization should feel confident in these models and how they can be applied to specific use cases. These first models will alert providers to changes in high-risk conditions such as sepsis and hypertensive patients.
The main objective of this paper is to present the developed platform and its components to allow Keralty organization to derive better and more actionable insights from their data, i.e., to derive meaningful information from all these data in a way that allows them to improve care and lower costs needed for value-based reimbursement and business objectives while providing the highest quality care for population health management [
22]. The goal is to be aligned with the triple aim framework developed by the Institute for Healthcare Improvement that describes an approach to optimizing healthcare system performance.The implementation of this platform intends to resolve several problems in health services to assist patients and their families in managing their health by providing better access to healthcare services [
23].
2. Proposed Digital Health Platform
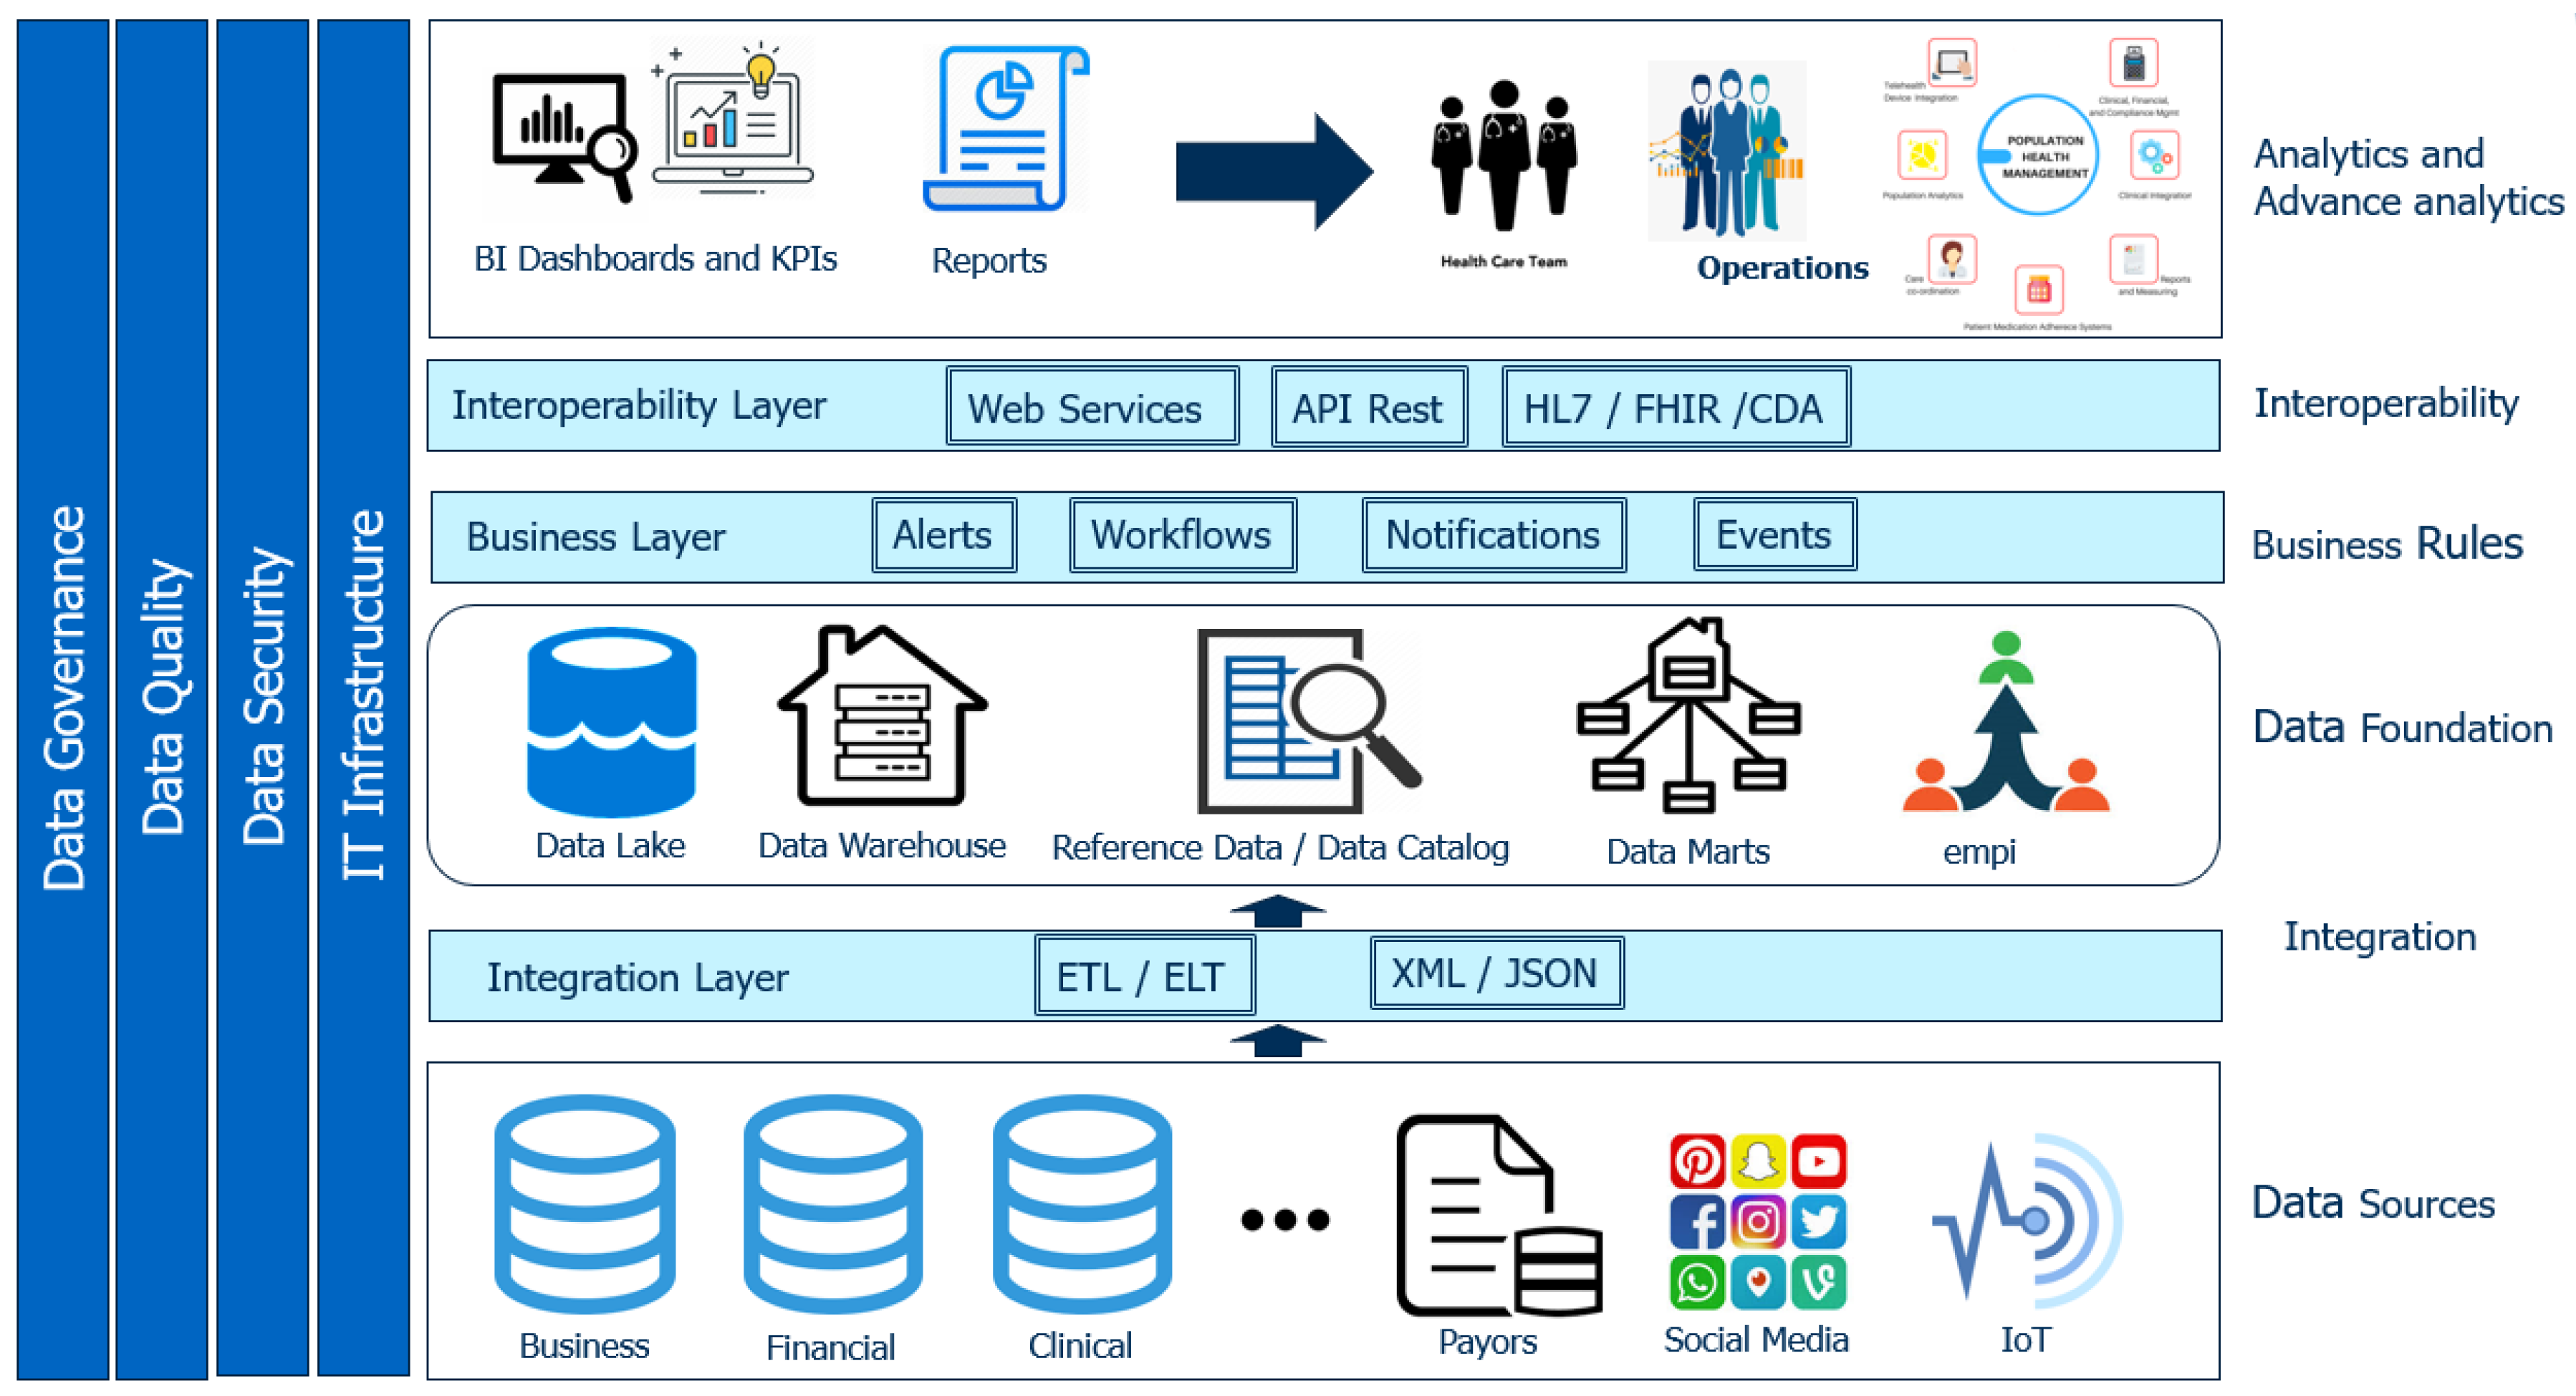
Keralty organization currently have several information systems such as Health Information Systems (HIS), Lab Information Systems (LIS), Radiology Information Systems (RIS), Enterprise Resource Planning (ERP), and Customer Relationship Management (CRM), among others, in their ambulatory care centers, hospitals, and home care, which support their integrated health model. The information from these systems was not consolidated on a single platform, and its access and availability generated an operative load, which obstructs all health management processes and the support of clinical decisions for physicians. Consequently, we proposed the design and implementation of a healthcare, clinical, and business data repository with advanced analytic capabilities to consume machine learning prediction models to improve the decision-making process and population health management at the organization. The digital health platform conceptual framework is shown in
Figure 1.
The implementation of the platform was an ambitious project that required integrating health information from disparate sources, building numerous technological and functional components, and the definition of IT management processes robust enough to support interoperability with other systems. The digital health information platform included patient-related data, Electronic Health Records (EHR), diagnostic reports, prescriptions, medical images, pharmacy records, research data, operational data, financial data, and human resources data.
This project was innovative and pioneered the designing and building of a comprehensive health digital platform for a healthcare organization in Colombia, with the patient being at the center of it and all of its information aggregated and summarized based on the standardized enterprise data repository. This information can be accessed quickly and intuitively when and where it is needed, hiding all technical complexity and providing longitudinal process management tools, as well as tools for decision support for professionals. The difference of this platform with other implementations was the development of a medical portal with a patient 360 view that uses data from the enterprise data repository to generate real-time early warning scores, patient surveillance, open API for hospitals integration, prediction of health risk patterns, high-risk markers, co-morbidity detection to predict critical diseases, early diagnosis of diseases, treatment comparison with medical guidelines, and measurement of efficiency of specific drugs to provide the best quality of care.
The Digital Healthcare platform architecture can ingest data from over 50 different source systems at the granular level, including claims, clinical, financial, administrative, wearables, genomics, and socioeconomic data. Few platforms today can integrate that many heterogeneous data sources successfully. The platform can consume machine learning models on-demand without the need for further development. The data logic models are on top of the raw data and can be accessed, reused, and updated through open APIs without the need for clinical and business logic changes. The platform was able to integrate successfully structured and unstructured data. It is commonly seen that this type of platforms in the market is built to either integrate structured data or unstructured but few cases successfully integrate both. Open microservices APIs were created for operations such as authorization, identity management, interoperability, and data pipeline management. These microservices enable the development of third-party applications to interoperate with the platform.
2.1. Platform Architecture
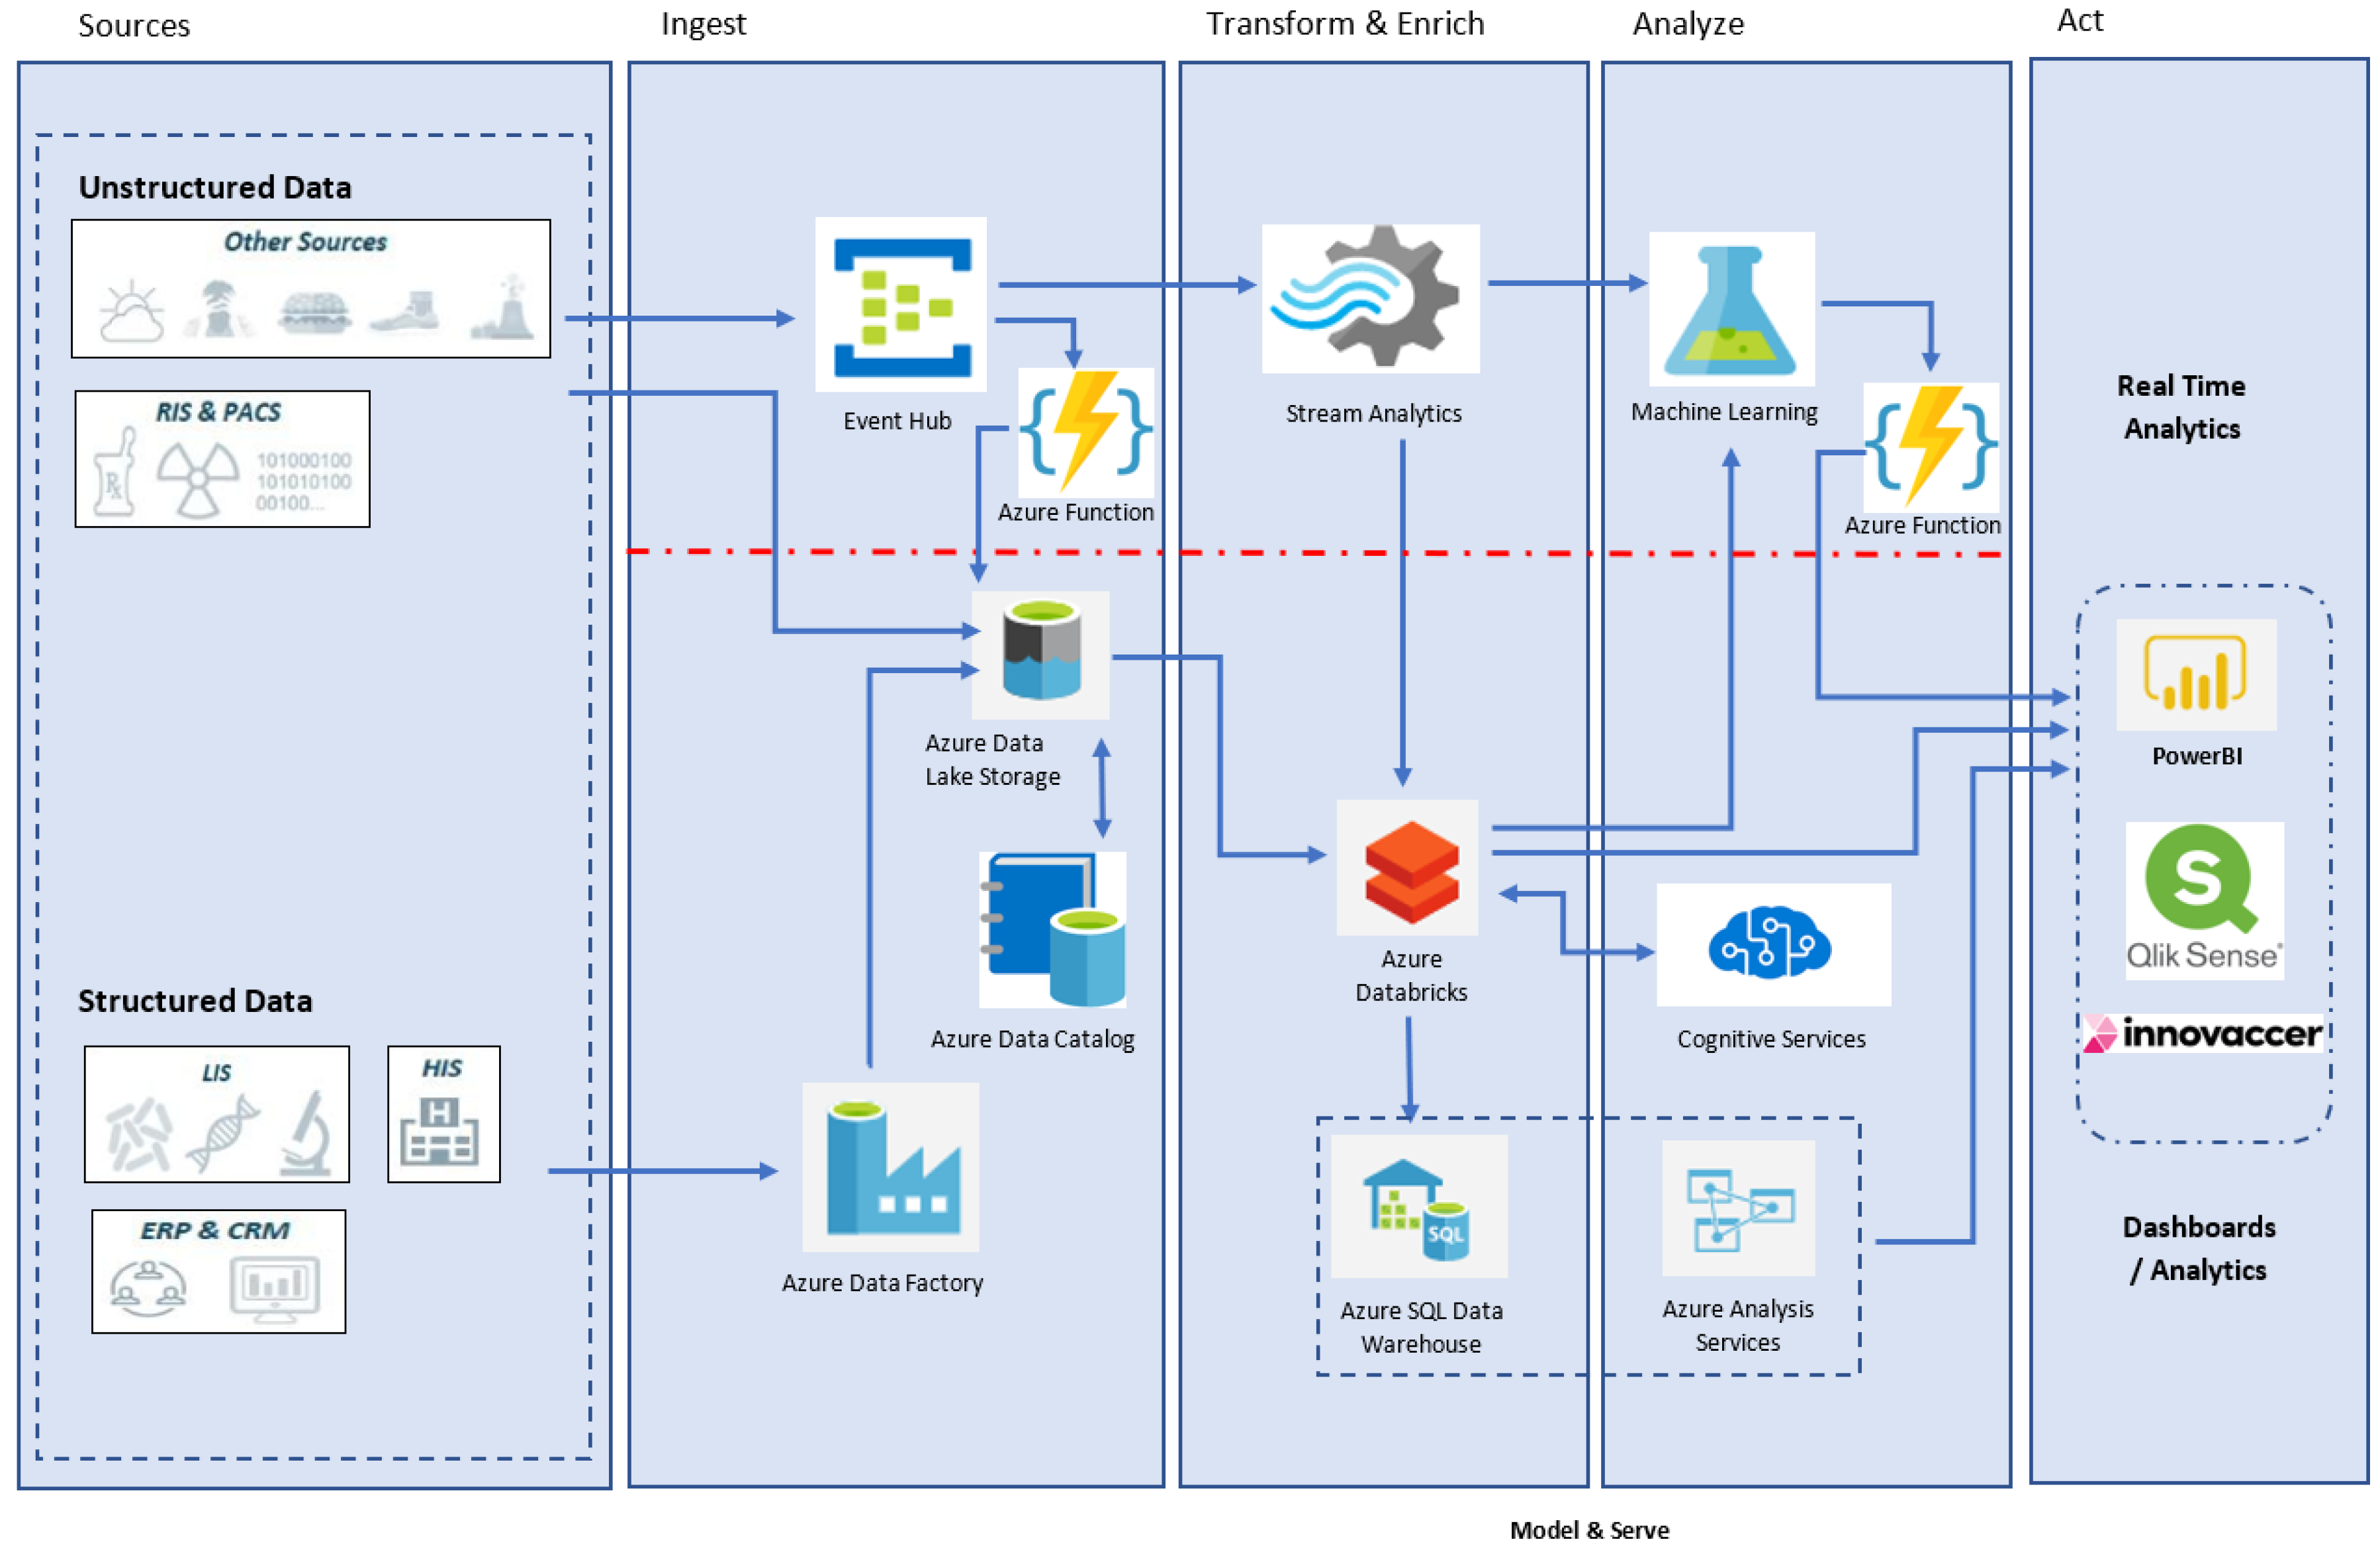
The initial approach was to build a big data processing pipeline with a Microsoft Azure lambda architecture to support real-time and batch analytics. This approach is shown in
Figure 2. This architecture has different mechanisms to consume data depending on the source and timing needed to generate insights. In addition, with this approach, we can have professionals with different skills working in parallel to build the platform.
The architecture contains a batch layer, a real-time layer, and a serving layer. The batch layer is in charge of persistent storage and is able to scale horizontally. The real-time layer process streaming data and performs dynamic computation. The serving layer query data on the repositories and consume the prediction models.
From the infrastructure point of view, the platform offers the flexibility of being implemented in a hybrid environment, namely the cloud and the local data processing center, through the use of virtualization techniques, containers, and load balancing systems. The design of the infrastructure was prepared to provide a flexible set of resources that can be used on-demand and based on the specific workload requirements. The infrastructure deployment relied heavily on automation to provide fluid operations.
2.2. Data Repository
An enterprise-wide staging repository for the big data analytics platform was considered. The data lake allows capturing data of any volume, type, and ingestion speed in one single place for storing heterogeneous data. This staging area included capabilities such as security, scalability, reliability, and availability. The data can be passed, processed directly from the staging area, or can be ingested to an enterprise data warehouse for historical load, preparation, and serve for BI and machine learning needs. This data warehouse repository has a scale-out architecture and massively parallel processing (MPP) engine.
Data models were developed to cover clinical, social, and healthcare program domains. Each model performs validations and processing on the data received, decoupling the processing and administration of the data from the source. These data models can also be extended to store additional attributes specific to the implementation, allowing these models to subscribe to certain types of messages, using the mapping and filtering options provided by the data processing pipelines. Once these subscriptions are created, the model will be loaded with all relevant messages to those who are subscribed and stored in the data lake.
For data storage, the data are loaded into a data warehouse with a daily refresh. This healthcare data repository contains a highly normalized data model for fast and efficient querying and analysis. This repository is read-only.
2.3. Integration and Interoperability
The platform provides a mechanism to integrate data from heterogeneous sources, define workflows to ingest data from different data stores, and transform and process data to data stores to be consumed by BI applications. A cloud-based data integration service is used to create these data-driven workflows and orchestrate all automation, transformation, and data movement in the platform. The main tasks this integration service should perform are: creation and scheduling of data pipelines to ingest data from different data sources, processing and transformation of the data, and store data in data stores such as data lakes or data warehouses.
Azure Data Factory automates and orchestrates the entire data integration process from end to end in the platform. We built the ETL (extract, transform, and load) pipelines with this Azure component. The data are extracted from the source locations, transformed from its source format to the target Azure data lake’s schema, and loaded into Azure data lake and the data warehouse, where they can be used for analytics and reporting. Azure Data Factory defines control flows that execute various tasks in the transform and load process.
We used the mechanism called mapping data flows, combining control flows and data flows to build the data transformations with an easy-to-use visual user interface. These data flows are then executed as activities within Azure Data Factory pipelines. Data Factory is certified by HIPAA (Health Insurance Portability and Accountability Act), which protects the data while they are in use with Azure. In the data flow, we created transformation streams where we define the source data and create the graph with the transformations, schema operations such as derived column, aggregate, surrogate keys and selects, and the output settings.
2.4. Data Security and Privacy Model
In terms of security, the platform guarantees authentication, access control, and encryption capabilities. The security mechanisms of the platform can provide protection, alert monitoring, and support the OAuth 2.0 protocol for authentication with REST interfaces. ACLs are enabled on folders, subfolders, and files. The platform also provides encryption mechanisms to protect the data. All these capabilities are accompanied by the implementation of enterprise security policies and regulatory compliance requirements.
2.5. Stream Analytics
The platform can handle mission-critical real-time data and offer end to end streaming pipelines with continuous integration and continuous delivery (CI-CD) services. Other capabilities such as in-memory processing, data encryption, and support of international security standards including HIPAA (Health Insurance Portability and Accountability Act), HITRUST (Health Information Trust Alliance), and GDPR (General Data Protection Regulation).
2.6. Advanced Analytics
The analytic data component consists of two areas: The first area is the BI models we develop for tactical, operational, and strategic decisions. The second area comprehends several prediction models that need to be developed. Currently, there are two prediction models developed by the authors of this paper to support population health management, specifically the diagnosis of sepsis and hypertension prediction [
24,
25]. These insights assist providers in the detection and tracking of chronic diseases. The machine learning component is used to build, test, consume, and deploy predictive analytic models on-demand and as requested for the organization. The platform provides self-service dashboards and visualizations that use data from the repositories to drive the decision-making process. The machine learning application layer is one of the essential layers of this platform.
Once the data are integrated, aggregated, and normalized in the system, the platform offers a tool to provide knowledge management through the business intelligence interface providing data analysis, design, and training of machine learning models, as well as development and management of results-based care indicators or population health management. The platform provides a tool where clinicians, researchers, and scientists can mine the data and get valuable information.
Machine learning models can be trained and customized in preconfigured data domains, allowing the storage of the results for future use. Data researchers and scientists can develop advanced tools to obtain information and value of the data stored in the solution, taking advantage of the model design, training, and validation component. We briefly present the predictive models implemented in the platforms.
Machine Learning Classification for a Hypertensive Population: This prediction model evaluates the association between gender, race, BMI (Body Mass Index), age, smoking, kidney disease, and diabetes using logistic regression. Data were collected from NHANES datasets from 2007 to 2016 to train and test the model, a dataset of 19,709 samples with (83%) non-hypertensive individuals and (17%) hypertensive individuals. The results show a sensitivity of 77%, a specificity of 68%, precision on the positive predicted value of 32% in the test sample, and a calculated AUC of 0.73 (95% CI [0.70–0.76]). The model used to estimate the probability that a person will belong to the hypertensive or non-hypertensive class is:
We used the logistic regression classification model in this experiment to evaluate the importance of the risk factor variables and their relationship with the prevalence of hypertension among a nationally representative sample of adults ≥20 years in the United States (n = 19,759). The distribution of the samples by hypertensive patients, gender, and race is shown in
Table 1.
We computed chi-square test between each independent variable and the dependent variable to indicate the strength of evidence that there is some association between the variables. Chi-square was selected due to the categorical form of the data used in the model, and it is considered one of the best methods to estimate the dependency between the class and the features when the feature can take a fixed number of possible values that belong to a group or nominal category.
Table 2 shows the
p-value for each variable; the null hypothesis is reject for any
p ≤ 0.05, while the null hypothesis is not rejected when
p > 0.05.
p-values for the variables GENDER, BMIRANGE_1, BMIRANGE_3, and KIDNEY_2 are not statistically significant at 0.05 alpha level; the clinical importance of these variables in the model for interpretation allows us to include them. We ran the model with and without the variables, and there were no significant changes in the accuracy score, positive predicted value rate, and true positive rate.
The training dataset was derived from a random sampling of 70% (13,831) of the extracted study population and the test sampling the remaining 30% (5928) to evaluate the model on the ground-truth that was never used for training. We ran the logistic regression model on the entire dataset to verify the accuracy score of the model.
The Logistic Regression model uses the logit function to express the relationship of the risk factors as:
The probability of success can be expressed as:
where
p is the predicted probability of having hypertension,
are the risk factors or independent variables, and
are the coefficients that are estimated by using the method of maximum likelihood and allow us to calculate the odds that, for every unit increase in
, the odds of having hypertension changes by
.
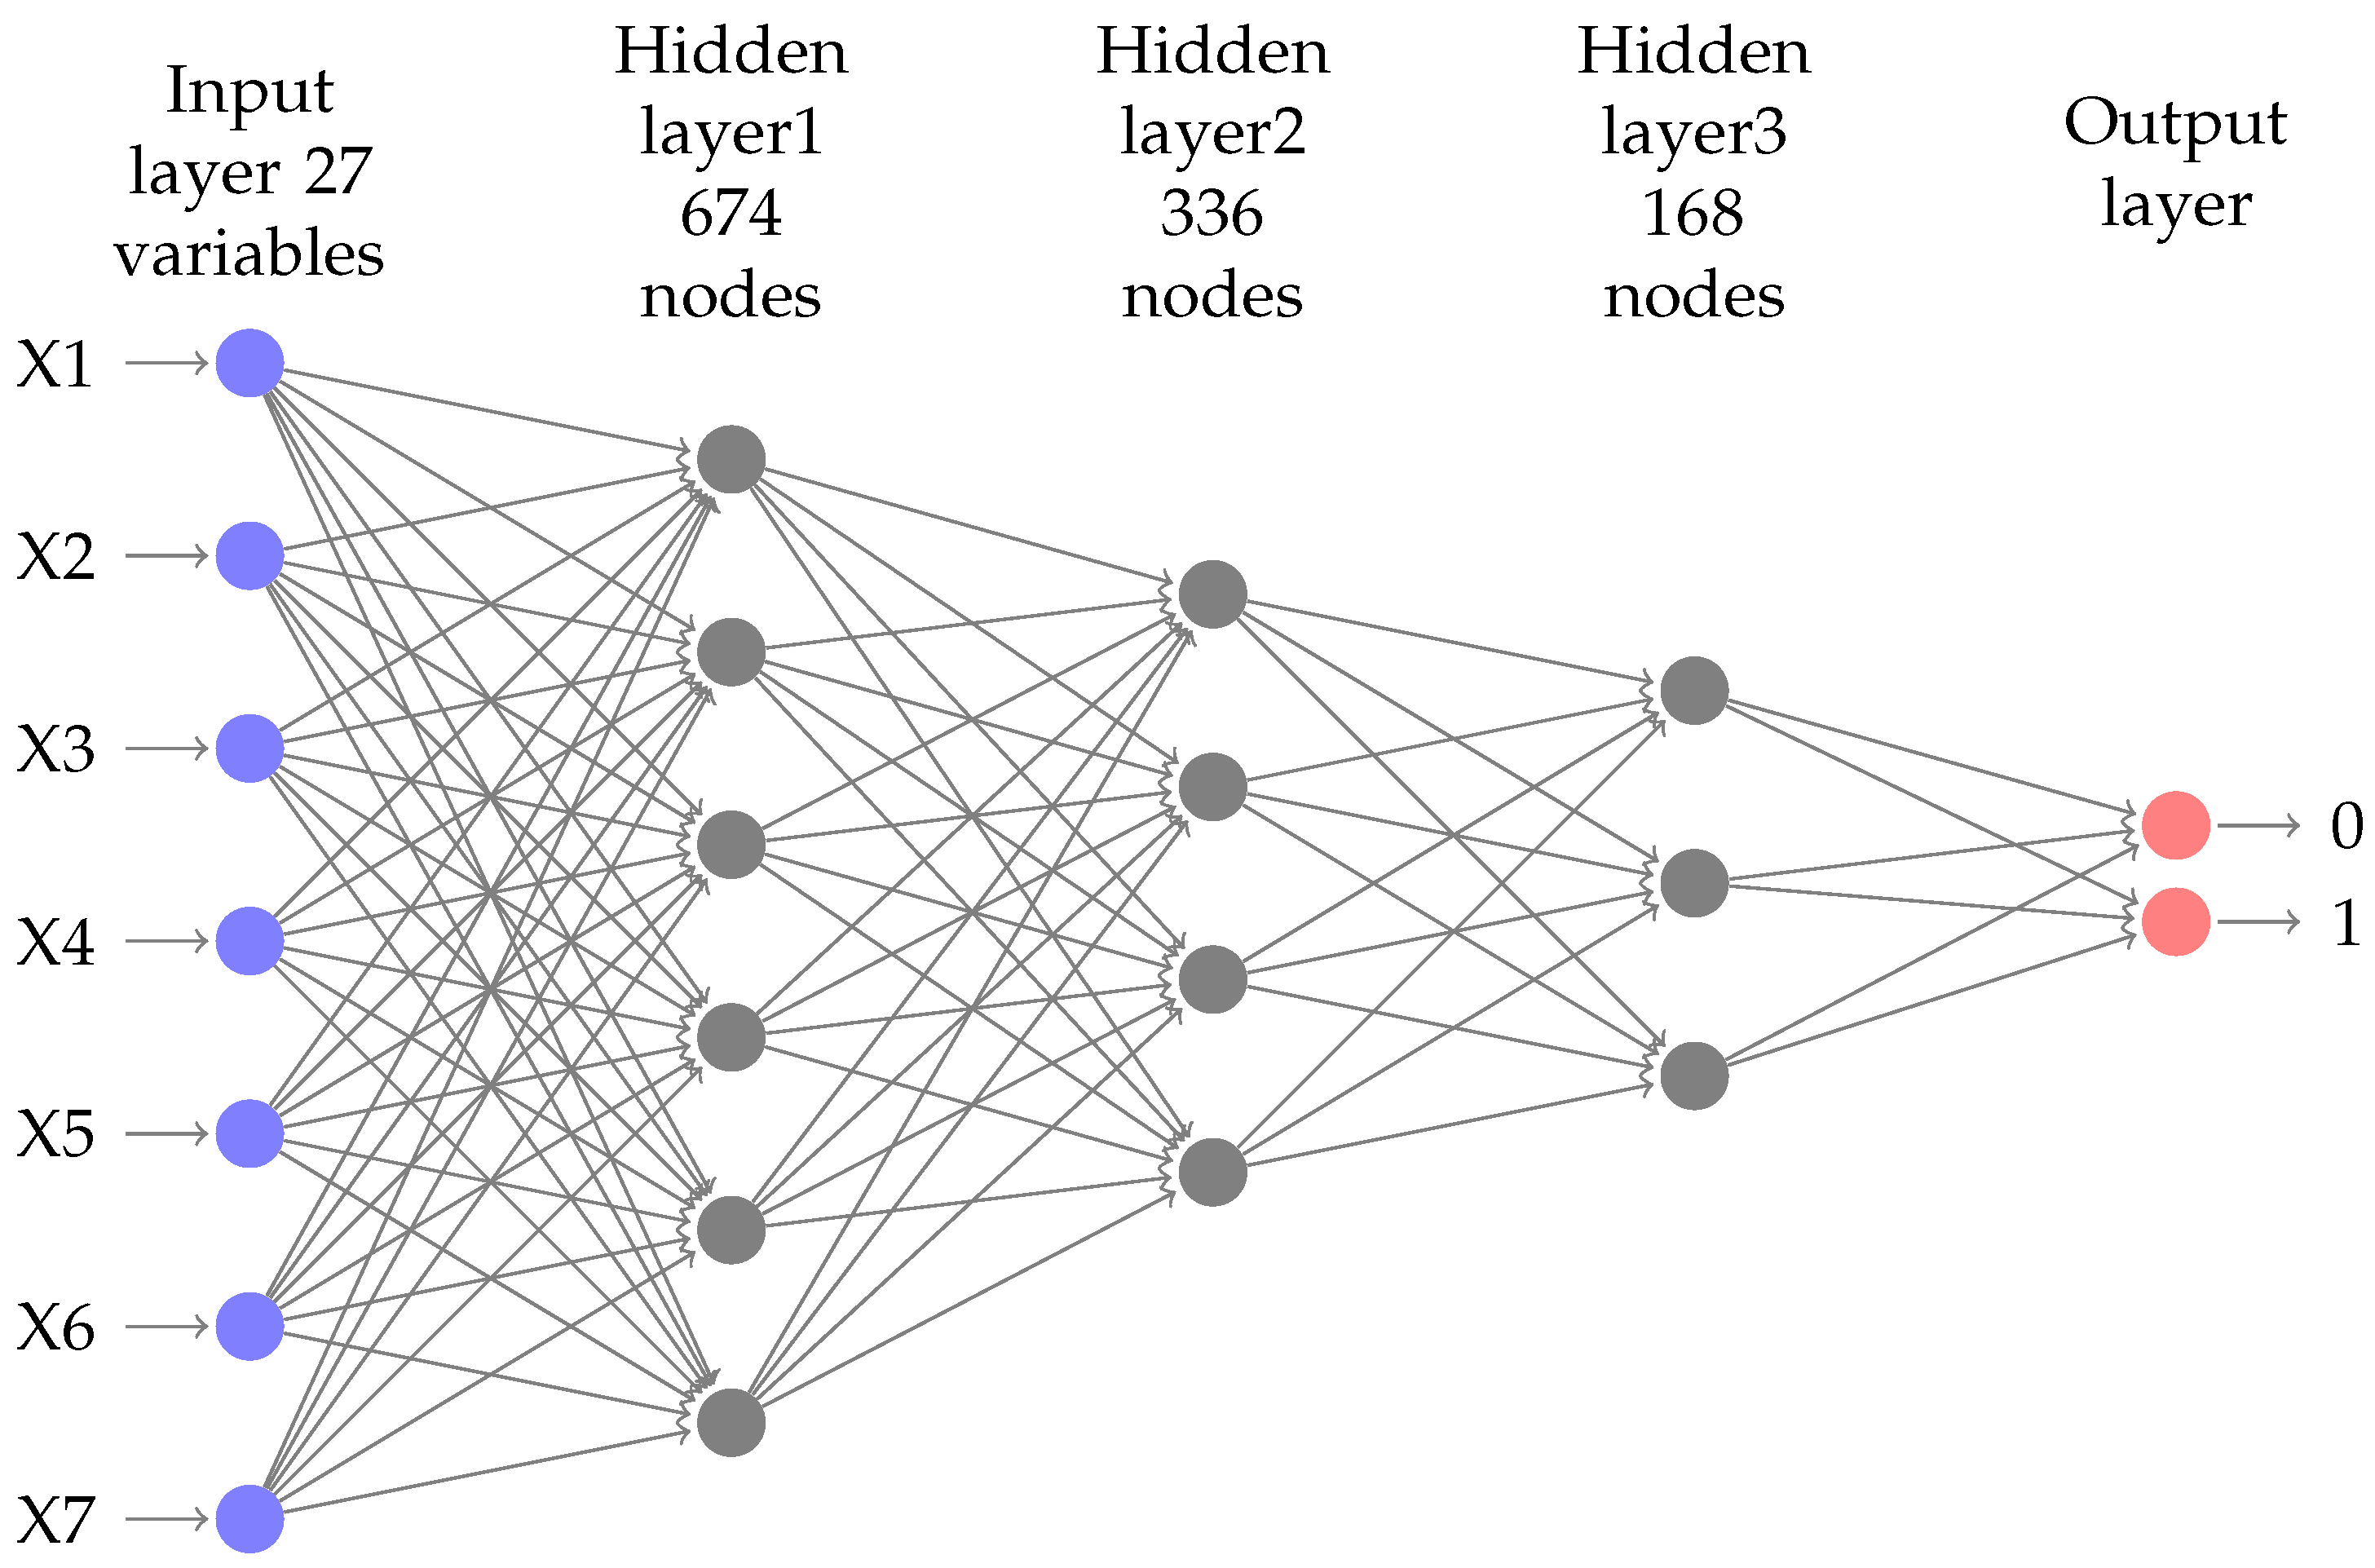
A neural network approach to predict early neonatal sepsis: We developed a non-invasive neural network classification model for early neonatal sepsis detection. The data used in this study are from Crecer’s Hospital center in Cartagena-Colombia. A dataset of 555 neonates with (66%) of negative cases and (34%) of positive cases was used to train and test the model. The study results show a sensitivity of 80.32%, a specificity of 90.4%, precision on the positive predicted value of 83.1% in the test, sample and a calculated area under the curve of 0.925 (95% Confidence Interval [91.4–93.06]). The neural network architecture can be seen in
Figure 3.
Table 3 shows the parameters of the architecture. Labels X1–X7 are informative only, and the input size is 27 variables.
The model used an anonymous dataset from a private medical institution in Cartagena, Colombia, from 2016 to 2017. Demographic, laboratory data, blood pressure, and body measures data were part of the dataset. This dataset includes cases of live newborns of ages inferior to 72 h with a diagnosis of early neonatal sepsis by clinical criteria and laboratory blood cultures. Control cases were part of the dataset including all newborns healthy by clinical diagnosis and who returned healthy for a follow up at 72 h.
This retrospective study includes 186 cases and 368 controls based on a case-control relationship of 1:2 with a 95% trust factor and power of 80%. Bivariate analysis and logistic regression were performed to detect the variables associated with early sepsis, and the statistical significance was considered at the alpha level of 0.05.
This model considered nine sociodemographic, fourteen obstetric, nine neonatal, and four maternal infectious related pathology variables.
Table 4 shows the quantitative sociodemographic variables,
Table 5 shows the qualitative sociodemographic variables,
Table 6 shows the quantitative neonatal variables,
Table 7 shows the qualitative neonatal variables,
Table 8 shows the quantitative obstetric variables,
Table 9 shows the qualitative obstetric variables, and
Table 10 shows the qualitative maternal infections of the cases and controls.
A bivariate chi-square test with correction was performed to the qualitative variables to find a statistical association between the independent variable and the possibility to develop early neonatal sepsis. For continuous variables, the Mann–Whitney U test was performed. From this statistical analysis, it is essential to show that we did not find significant statistical evidence for the variables age, start of marital status at younger than 18 years old, gender, APGAR (Appearance, Pulse, Grimace, Activity, and Respiration) value less than 7 after 1 and 5 min, the number of pregnancies, and the type of birth. Prenatal control is not associated with the case of sepsis; however, assisting to five prenatal controls are associated with the protection to avoid the appearance of early neonatal sepsis. There was no evidence with the variables IUGR (Intrauterine Growth Restriction) background and multiple pregnancies. Twenty-seven (27) variables were selected as input variables for our artificial neural network architecture.
In terms of computational timing, It is difficult to evaluate the complexity and timing of a machine learning algorithm. However, based on the algorithmic complexity, we can measure the time performance in terms of its training time complexity using big O notation because the classification time of the models can vary depending on the stress in the computational performance and power. In terms of timing, the classification prediction with the trained models is less than 1 s. The time complexity of the logistic regression could be expressed as
, where f is the number of features (+1 because of bias),
c is the number of possible outputs,
s is the number of samples, and
E is the number of epochs to run. For the neural network approach,
, where
p is the number of features and
is the number of neurons at layer
i in a neural network [
26].
3. Actual Platform Benefits
The implementation of the platform became the digital healthcare ecosystem for the organization. The organization can populate workflow information systems with critical decision-making insights, accurate and reliable healthcare data that significantly increased the value of the healthcare outcome to patients and care providers. This platform delivers significant benefits to the organization, such as physicians having an intelligent application that can be configured to their preferences and optimized to their disciplines, patients receiving more personalized care, an improvement in healthcare workflow and patient care, and personalized care for physicians and patients.
We describe in the following subsections several use cases that effectively present the change and digital transformation of the organization with the implementation of the platform.
3.1. Reduce Total Cost of Care for Care Coordination
With a robust data analytic component, the organization was able to prioritize opportunities for improvement and to improve the way care is coordinated and delivered throughout its network of hospitals and medical facilities. The results include a considerable increase in financial results in just six months.
The organization uses the platform to generate timely, meaningful, and actionable data to drive change and improve the quality of care for patients. The organization uses the data for risk-stratification of the network’s population, prioritization of the care coordination activities, and prevention activity’s interventions. Risk stratification was completed for all patients, enabling care managers to identify individuals at various risk levels for unnecessary services and high-cost utilization, improving patient outcomes and experience. The analytical component also reduces unnecessary visits, facilitates access to specialty care and community-based services, and achieves healthcare outcomes. Other benefits include 3% increase in the detection of high-risk patients with primary care, 20% increase in the number of patients with ongoing care managed, and 10% percent reduction in emergency department utilization per member among care managed patients.
3.2. Self-Service Analytic
As described in this paper, the healthcare platform combines and standardizes data across different source systems to provide actionable insights in a single platform. The platform integrates data from different sources, such as claims data, cost data, financial data, clinical data, and other patient data. With self-service analytics, the organization increases the number of users accessing the analytic component, improving data visibility and providing actionable insights to improve patient outcomes.
3.3. Reduce Deaths from Sepsis
The organization improved sepsis mortality rates and improving care outcomes by using the advanced analytic component of the platform. Sepsis impacts almost 1.7 million adults in the U.S. and is responsible for nearly 270,000 annual deaths. One-third of all hospital deaths are patients with sepsis [
27]. The machine learning prediction model used in the platform was developed by one of the authors of this paper, as described before. It is still too early to mention the results of the utilization of this feature. However, the goal of the organization is to reduce its sepsis mortality rate, the costs of the creation of its sepsis care transformation team, and the implementation of an evidence-based sepsis care practice.
3.4. Discussion and Limitations
The digital health platform helps Keralty organization with closing the gaps between multiple datasets, improving clinical benefits, improving patient’s lives, supporting better decision-making to manage larger populations, and improving overall health outcomes. However, the need for algorithms with high accuracy in medical diagnosis is still a challenge that needs to be improved precisely and efficiently [
28]. The increasing complexity of building end-to-end platforms to integrate disparate systems and to apply machine learning techniques in specific areas such as computer vision, natural language processing, reinforcement learning, and other generalized methods present many challenges when forming the interdisciplinary team needed and the set of technological components used for the implementation.
Some challenges should be considered in the design and implementation of machine learning projects for healthcare. One of the most critical challenges requires algorithms that can answer causal questions. These questions are beyond classical machine learning algorithms because they require a formal model of interventions [
29]. To address this type of question from the analytical component of the platform, we need to learn from data differently and to gain knowledge in causal models to understand how machine learning algorithms need to be trained. Another challenge is to create reliable outcomes from heterogeneous data sources with the participation of SME (Subject Matter Experts) who understand the disease; the machine learning predictive accuracy and correct clinical interpretation depend on the criteria and context of the disease. Providers and machine learning engineers should work together on model interpretability and applicability. Machine learning implementation is not an easy task; the selection of predictive features and optimization of hyperparameters is another challenge that needs to be mastered to implement models that provide useful insights [
30]. The success and meaningful use of these algorithms, and their integration into the platform depends on the accuracy of the models and their interpretability.
6. Conclusions and Future Work
This paper provides details of an optimized and secure healthcare platform that revolutionizes the healthcare industry in Colombia by providing better information to patients and care teams. The use of this technology reduces the costs associated with healthcare.
The proposed digital health platform allows us to address population health challenges, to understand better patient’s health, and to find hidden patterns that traditional data analytics fail to find. The organization can use unified patient-generated data, financial data, and socioeconomic data to detect patterns and to discover a group of patients who share similar health behavior. The analysis of clinical and non-clinical data allows predicting patient’s health with better accuracy. The platform also allows better health discoveries and actions based on treatment history for individuals and groups of patients.
Keralty organization recognized that better care coordination was required for patients receiving care. The organization wanted to improve quality outcomes, provider engagement and recruitment, and its own economic health. To meet these objectives, the organization focuses on clinician engagement and organizational alignment, ensuring widespread access to meaningful, actionable data, and the use of the healthcare analytics platform to inform decisions and drive improvement. Keralty believes the use of machine learning will be one of the most important, life-saving technologies ever introduced to the organization. We believe the opportunities are virtually limitless for the platform to improve and accelerate clinical, workflow, and financial outcomes.
More future work needs to be done on the platform to continue improving all the benefits for the entire organization. Tools for performing knowledge discovery process will be added to the ecosystem. The organization is planning to start the implementation of prescriptive analytics models to assist the organization in making smarter decisions in population health management. The architecture team will look at the possibility of implementing Map/Reduce-based computations for processing data with high scalability and to execute low latency and high concurrency analytical queries on top of Hadoop clusters.

 ,
, 


