Unsupervised Text Feature Selection Using Memetic Dichotomous Differential Evolution

1
Discipline of Information Technology, Mathematics and Statistics, Murdoch University, Perth 6150, Australia
2
College of Science, Baghdad University, Baghdad 10001, Iraq
*
Authors to whom correspondence should be addressed.
Algorithms 2020, 13(6), 131; https://0-doi-org.brum.beds.ac.uk/10.3390/a13060131
Submission received: 30 March 2020
/
Revised: 19 May 2020
/
Accepted: 20 May 2020
/
Published: 26 May 2020
(This article belongs to the Special Issue Memetic Algorithms for Solving Very Complex Optimization Problems)
Abstract
:Feature Selection (FS) methods have been studied extensively in the literature, and there are a crucial component in machine learning techniques. However, unsupervised text feature selection has not been well studied in document clustering problems. Feature selection could be modelled as an optimization problem due to the large number of possible solutions that might be valid. In this paper, a memetic method that combines Differential Evolution (DE) with Simulated Annealing (SA) for unsupervised FS was proposed. Due to the use of only two values indicating the existence or absence of the feature, a binary version of differential evolution is used. A dichotomous DE was used for the purpose of the binary version, and the proposed method is named Dichotomous Differential Evolution Simulated Annealing (DDESA). This method uses dichotomous mutation instead of using the standard mutation DE to be more effective for binary purposes. The Mean Absolute Distance (MAD) filter was used as the feature subset internal evaluation measure in this paper. The proposed method was compared with other state-of-the-art methods including the standard DE combined with SA, which is named DESA in this paper, using five benchmark datasets. The F-micro, F-macro (F-scores) and Average Distance of Document to Cluster (ADDC) measures were utilized as the evaluation measures. The Reduction Rate (RR) was also used as an evaluation measure. Test results showed that the proposed DDESA outperformed the other tested methods in performing the unsupervised text feature selection.
1. Introduction
Knowledge discovery from text is becoming a challenging task due to the increasing volumes of electronic data [1]. In most cases, processing text data in its original format without feature reduction could affect machine learning accuracy, efficiency and data comprehensibility [2]. Thus, using the dimensionality techniques to reduce the extra features is important to be applied. Feature Selection (FS) methods are used to reduce feature space by filtering out the extra text features [3]. Unlike feature extraction methods such as Principal Component Analysis (PCA) or compression methods using information theory, FS methods select a smaller number of features without changing them. FS preserves original features; in that case, important original features are kept unchanged [4]. The use of machine learning techniques has been popular in document classification and clustering. In general, machine learning performance could be affected in processing high dimensional datasets. Therefore, the combination of FS with machine learning becomes an important issue in different applications like document classification and clustering. After FS, the size of selected feature groups from text becomes less than the original space, and as a result, the storage, processing and time requirements of non-contributing features will be reduced. This will make machine learning more efficient. Moreover, FS improves the performance of the model to obtain better cluster detection due to the elimination of redundant and non-significant features [4].
For document clustering, each document is represented by a set of relevant terms in a Vector Space Model (VSM). Each document has a multi-dimensional feature space, and each dimension is represented by a numeric value (weight) corresponding to a specific featured term, which is calculated using various weighting schemes. However, not all weighted features (keywords) are similarly important. Therefore, irrelevant and confusing features should be excluded. That is, for an n feature space, the number of possible feature representations reaches 2n. As the number of text documents increases over time, the number of features, n, will increase accordingly [5,6,7].
There are a few other newer weighting schemes such as the CloVe and the Word2Vec [5]. In terms of the Word2Vec, it uses a neural network for calculating word embeddings according to the context of the words. Although it achieved remarkable results in [5], it was not used in this paper because it could mismatch the proposed feature selection method, which is the main focus of this paper. Unlike Word2Vect, in CloVe [6] the frequency of co-occurrences is important information. By training only the non-zero elements in a word-word co-occurrence matrix, this model leverages statistical information. In contrast, it does not consider the entire sparse matrix or relay on individual context windows in a massive corpus. The model generates a meaningful substructure vector space. Exploring the Words2Vect and CloVe or any other weighting schemes is out of the scope of this paper.
Feature selection could be modelled as an optimization problem due to the large number of possible solutions that might be valid. However, the search for the best solution is a difficult task that requires an optimization search method that makes it easier to look for the best solution [8]. In recent years, researchers have used the stochastic methods in two different ways, supervised and unsupervised [2,9]. The supervised method is more commonly used, and it has been widely studied in the field of text categorization. The supervised FS depends on the availability of the class labels, which are mandatory to be used by the classifiers, and the class labels are used to group features according to their classification accuracy.
For instance, in [7] a neural network-based FS system was proposed that controlled the redundancy in the selected features by merging two penalties into one objective function. The goal of the Group-Lasso penalty is to generate sparsity in features in a grouped way. The redundancy control penalty, which measures dependency among features, is used for controlling the level of redundancy among the nominated features. Both penalty terms incorporate the L2,1-norm of weights matrix between hidden layers and input. These penalty terms are non-smooth at the source, and therefore, one efficient and simple smoothing tool was used to overcome this problem.
On the other hand, unsupervised FS is not widely discussed and tested in text mining literature. In [7] it was stated that the “curse of dimensionality” problem as a result of high data dimensions could reduce the capability of datasets of learning algorithms and also needs high storage and computational operations. In this paper, a hybrid filter-based feature selection algorithm based on a combination of clustering and the modified Binary Ant System (BAS), named FSCBAS, was presented, to overcome the search space and high dimensional data challenges in an efficient way. The proposed model uses both local and global search techniques within and between clusters. This method is basically a combination of the genetic algorithm and simulated annealing; a damped mutation strategy was presented that prevented the search from falling into local optimum areas. Moreover, a redundancy reduction policy was adopted for the estimation of the correlation between the nominated features. It can be noticed that the method presented in [7] still uses classifiers even though it is an unsupervised feature selection method. Therefore, it is not purely considered an unsupervised method. In [8] a comprehensive and structured review of the most recently proposed unsupervised feature selection methods was presented. A taxonomy of proposed methods in that domain was given, and the main properties of these methods were highlighted. Moreover, their basic concepts were also described. In addition, a summary of the advantages and disadvantages was also given for each one of those methods. In addition, an experimental comparison was also conducted. Finally, some important challenges in this research area were discussed.
The stochastic global search can be applied to perform both the supervised and unsupervised feature selection. For instance, the Genetic Algorithm (GA) is an example of the stochastic methods that have been used frequently for feature selection. However, due to the global search nature of the GA, the Memetic Algorithm (MA) was proposed. The MA has been used to hybridize the global search performed by the GA with a problem-specific local search. The local search helps to exploit the regions of interest within the space [9] MA has contributed to producing high-quality solutions in different optimization problems [10]. It is a population-based method that aims to find the best individual (agent) by exploiting and exploring the search space. There is continual research that discusses new ways to provide different algorithmic combinations using the MA to solve different scientific and engineering problems [10,11,12]. To the best of our knowledge, little effort has been made to optimize the unsupervised text FS for document clustering.
The challenge of performing unsupervised FS is associated with the absence of referencing class labels, which makes it impossible to utilize the same validation criteria used with the supervised FS for classification. For example, in [13] a method named Meaning Based Feature Selection (MBFS) which is based on the Helmholtz principle from the Gestalt theory of human perception. Two classifiers were used to evaluate the performance of that method. However, using the classifiers in the unsupervised feature selection is not suitable due to the need to use the class lables for the classifers. Moreover, there are no standardized measures that can be used to assess the performance of unsupervised methods due to the lack of enough research in this domain as the meaning of the best feature subsets may differ across different methods. In effect, the limited number of the unsupervised FS methods found in the literature has only been used is unsupervised wrapper FS [14].
In light of what has been discussed above, it can be summarized that using memetic (hybrid) methods could be more successful than using filter or wrapper methods separately. However, many of the available filter methods used with hybrid methods are not suitable for unsupervised FS due to the necessity of the existence of class labels. As an exception, there are a few examples of unsupervised text filter methods such as the Mean Absolute Distance (MAD) method reported in [11]. A feature relevancy score is assigned by the MAD for every feature by calculating the distance of each feature from the mean of the entire set. The Mean-Median (MM) [12] is also another example of an unsupervised filter. Unlike the MAD, the MM calculates the absolute distance of each feature between the median and mean values. All these methods are capable of local search [11,12,13,14,15,16]. Simulated Annealing (SA), which is a method used to solve optimization problems, simulates the heating of material and then slowly reducing the temperature to decrease the defects, therefore, reduce the system energy. SA can be used for unsupervised feature selection. SA is a metaheuristic method that differs from other methods. It is not a population-based method; instead, it only works on a single solution at a time, and that makes it a good candidate for local search. More recently, a Whale Optimization Algorithm (WOA) was used in combination with the SA in a hybrid wrapper-filter scheme. The WOA was hybridized with SA to improve the quality of the resultant features [17].
To summarize, it is noted that the majority of the research conducted in the last decade recommended the use of the hybrid wrapper and filter methods for FS due to their complementary advantages. Using this hybrid FS scheme is based on the same principles as the memetic optimization explained earlier. In that context, each optimization problem should start with a random number of solutions. In the proposed FS problem, we start the proposed FS-based optimization method with a random number of feature combinations. Memetic optimization is expected to refine that number of solutions and reduce it into an optimal solution. The reason behind using memetic optimization to conduct our proposed feature selection method is that it has the capability of combining the local with the global search to get better search ability for the best solution. In FS, the local search represents the filter method, while the global search represents the wrapper. Thus, it becomes important in our method to use memetic optimization to do this combination [18].
This paper proposes the Dichotomous Differential Evolution with Simulated Annealing (DDESA) feature selection methods. SA is used to improve the exploitation of solution space, and dichotomous DE is used as a global search to perform the explorative aspect. SA could be used for a supervised and unsupervised feature selection. In this presented work, SA is utilized as a local search unsupervised filter method, which is an essential component in memetic optimization. The Mean Absolute Distance (MAD) filter is used as a feature subset internal evaluation criterion. Class labels are not required by MAD as it discovers similarities between features according to their intrinsic properties.
2. Preliminaries
2.1. The Formal Description of Optimizing Clustering Problems
Document clustering can be represented as a document corpus named D, such that di ∈ D, where di represents a particular document. The di document is transformed into a vector, vi, which is composed of several components named weights. In other words, the document corpus can be formalized as a 2-D matrix (M). This matrix has D rows (the same number as the documents number) and V columns, where each mij is an element of matrix M that represents the weight of the jth feature of the ith document. Thus, in this matrix, each row is a vector representing a document, and each column represents a feature of those documents.
The clustering works on this matrix to find the most relevant documents and label them as one cluster (C), where ci ⊆ C. Thus, for a document subset C1 where C1 ⊆ C, it must have more relevant documents and be distinct from other subsets Cn ⊆ C. In this case, clustering aims to find the optimal representation by considering the minimal distance of documents within the same class. Similarly, it looks for the maximum distance between documents located in different classes. Thus, the clustering objective is to find out the representation that has the highest adequacy regarding a large number of potential candidate solutions. That could be represented using the Stirling number of the second kind, which is usually represented in the notion S(n,k), where S represents the number of representations of the n objects in a non-empty cluster (k).
It has been proven that the clustering is an NP-hard optimization problem even with the cases where there is no more than two classes. This shows that the clustering by testing all possible solutions of n vectors of d-dimensions into any number of clusters is computationally infeasible. This problem is far more complex when the number of clusters becomes unknown. Then, the number of combinations equals the sum of the Stirling numbers of the second kind. Therefore, optimization is used to reduce the search space. However, obtaining the optimal solution is not guaranteed [19].
2.2. Differential Evolution (DE)
DE is a population-based metaheuristic search method which has a population with N floating point solutions represented as X1, X2,G, ..., XN,G, (N is the population size). G is the generation counter, and each individual is a nominated solution, initialized randomly in the search space. It begins with a first random population X1,0, X2,0, ..., XN,0,. Later, the DE operators, i.e., crossover mutation, and selection operators are applied to refine each generation after the other. This process continues until the stopping criteria become true. For instance, a specified number of generations has been reached or the goal accuracy error level has been minimized under a specific value (ε).
Iteratively, in each generation, G, the optimization is performed by first executing the mutation operator. The solution vector produced by the mutation is Vi, for each single solution Xi (or, namely, the target vector) and would be generated by the mutation strategy.
The famous and largely used mutation strategy is the “DE/rand/1”, which is represented as represented in Equation (1).
where i = 1, 2, ..., N, and r1, r2, and r3 are three randomly chosen solutions from the population [1, 2, ..., N], and these solutions should not be duplicated. F is the DE mutation parameter. Then, DE commonly performs binomial crossover for recombining the target vector Xi, and the vector resulted from the mutation Vi, and the trial vector Ui,j,k which is produced as follows:
where j = 1, 2, ..., D, jrand ∈ {1, 2, ..., D} is an integer that is randomly chosen, rand j ∈ [0,1] is a random number that is uniformly distributed in the jth dimension, while Cr is a control parameter selected between [0,1] that represents the crossover probability. Finally, in order to select the better solution among the trail and target vectors, and , respectively, the selection operator is applied as shown in Equation (3).
In order to make the standard DE work with binary-based optimization problems such as the feature selection problem, a large number of modified versions of DE were proposed, in particular the use of logical operators such as those provided by [20] In this version, the classical mutation of the DE has been replaced by the binary mutation represented in Equation (4).
2.3. Document Pre-Processing
Document preparation incorporates the steps that are responsible for the transformation of documents into numeric data. It involves the following:
- Tokenization: truncating the characters into an understandable set of words separated by white spaces or punctuations.
- Stop words and special character removal: this step is responsible for removing unnecessary words or characters. Such words are common words like pronouns, articles, and common verbs.
- Stemming: stemming is a way to reduce the available number of keywords by unifying them if they have the same grammatical root.
- Weighting: this step quantifies the keywords according to their frequency of occurrence in the document once and in the corpus once again. The widely utilized method for weighting is the Term Frequency-Inverse Document Frequency (TF.IDF), as shown in Equation (5) [21].where wij is the resulted weight, and tfij is the ith term frequency for document j, while N is the total number of documents, and finally, dfi is the inverse document frequency that is the counter of that term in all documents.
- Normalization: this step normalizes the weights in such a way that all weights belonging to [0,1] by using the normalization Equation (6).where w_normalized is the new normalized weight.
After performing the above preprocessing steps, the Term-Document Matrix (TDM) is generated. Each row represents a document while each column is a keyword (in this stage, the keywords are named features).
2.4. Dichotomous Differential Evolution Optimization
The dichotomous binary DE method is based on a dichotomous mechanism and binary string representation. This method was used in [20] to solve the binary Knapsack problem.
2.4.1. Dichotomous Mutation
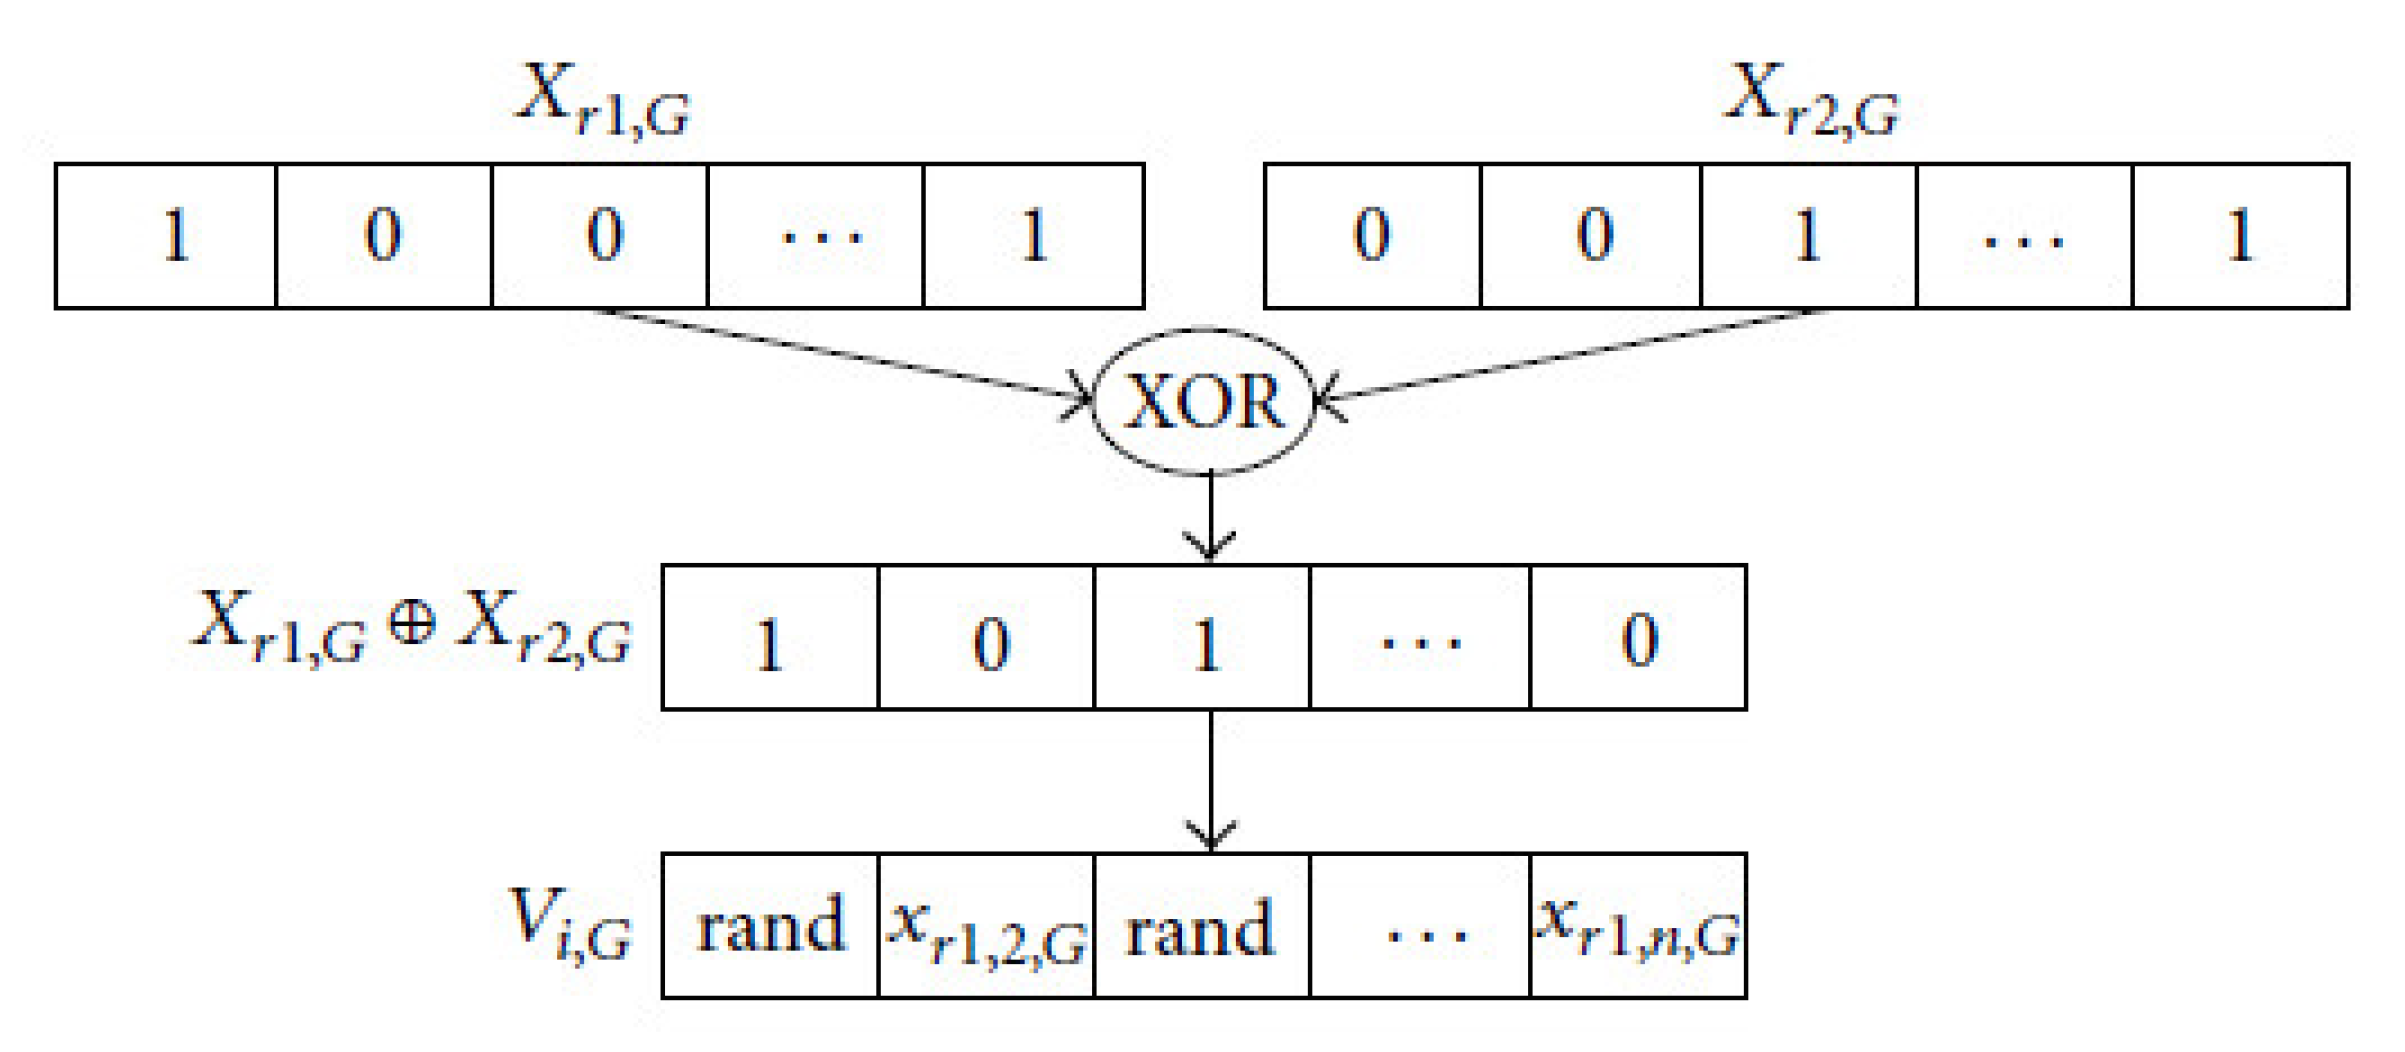
The dichotomous mutation used in [20] will be used in this paper, which is based on the XOR logical operator. The “0” coded bit after applying the XOR operator indicates if any selected two bits are similar; otherwise, the “1” encoded bits represent that the two selected bits are different. According to that arrangement of the feature patterns of a pair of randomly selected solutions, the dichotomous mutation would execute difference operators. Figure 1 illustrates an example of this mutation type. The mutation operator used in our proposed method can be represented as follows:
As an example of generating a new solution using dichotomous mutation is shown in Table 1.
2.4.2. Dichotomous Crossover
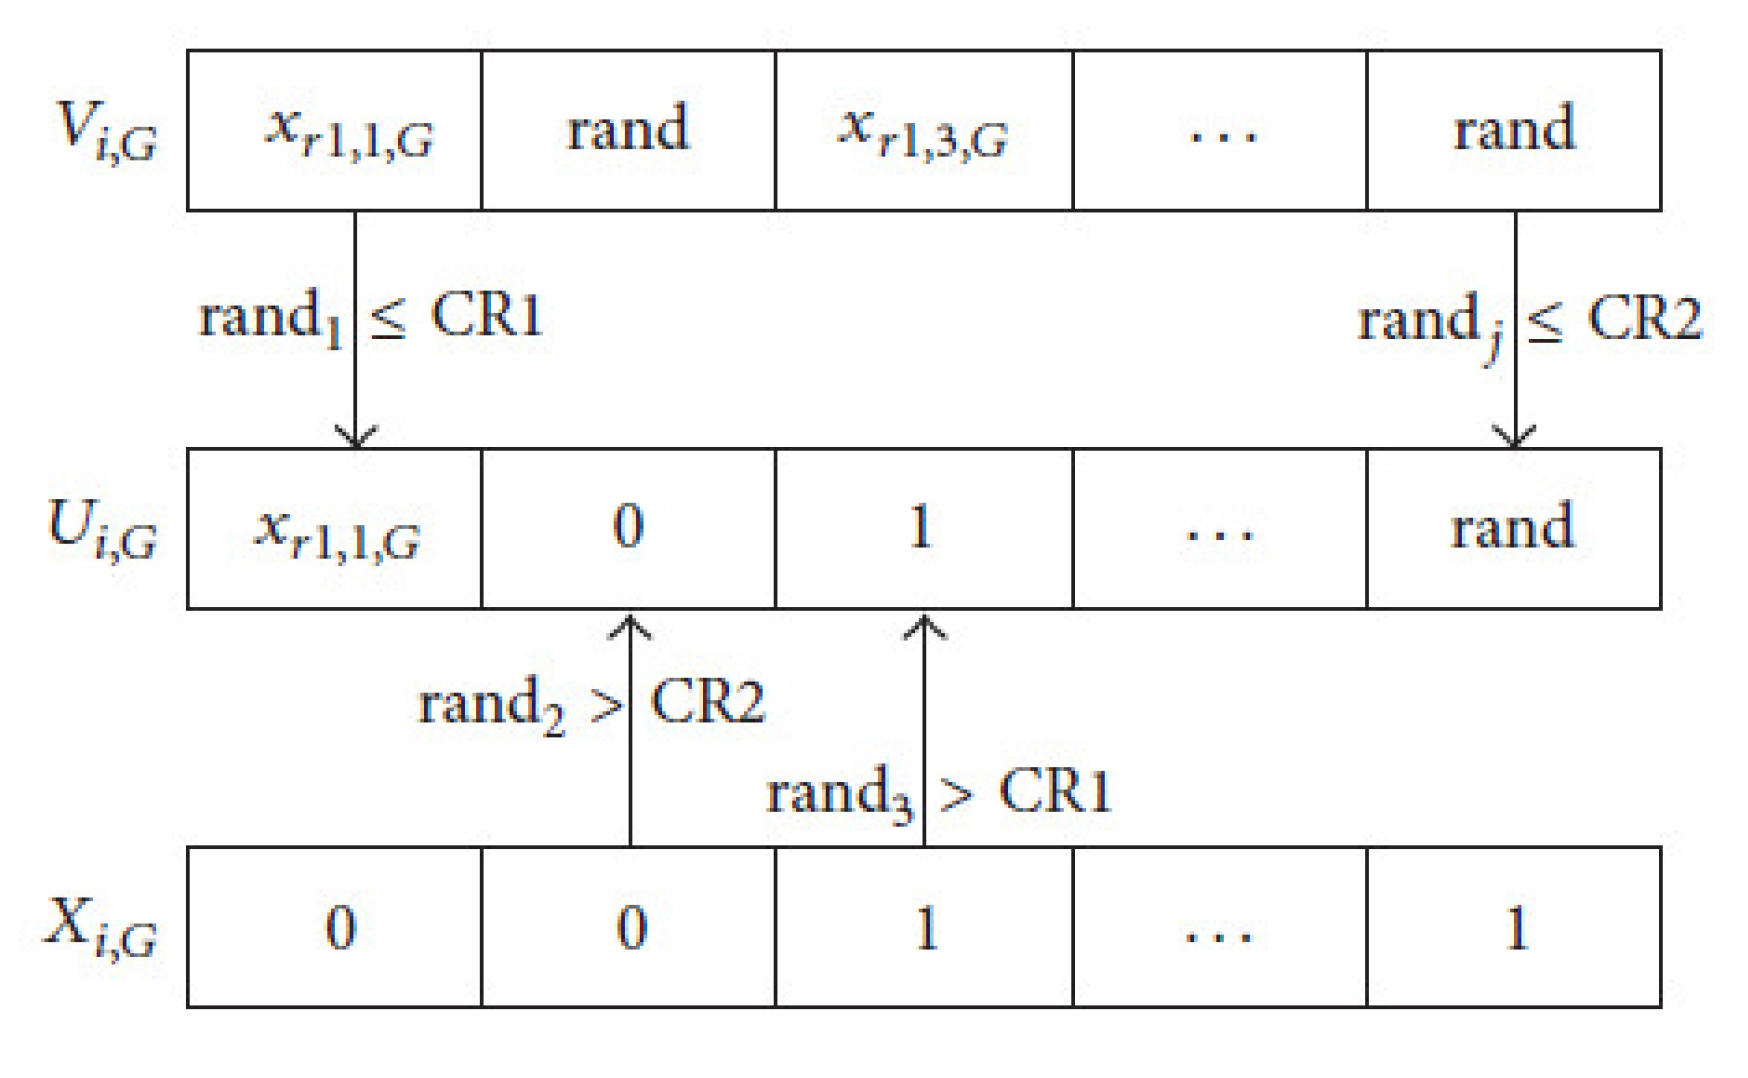
The dichotomous crossover operation is utilized for producing the trial vector Ui, by combining parts of both mutant vector Vi, and the target vector Xi, Figure 2 shows an illustrative example of the way that the dichotomous crossover is working. The trial vector, is produced by applying the following equations:
There is a similarity between both mechanisms of the standard DE crossover and the dichotomous one. However, the difference between them is that the dichotomous crossover has two crossover probabilities, while only one crossover probability is used with the standard DE. Considering the jth bit of a trial vector, if there are common bits between xr1,j,G, and xr2,j,G, then Crj and Cr1 are equal. On the other hand, if there are different bits between xr1,j,G and xr2,j,G, then Crj and Cr2 are equal. As shown in Figure 2, the bits of the trial vector resulted from target vector xi, and mutant vector Vi, with difference probabilities of crossover. Figure 2 shows how to conduct the crossover for the first, second, third, and nth bit of Ui, depend on Cr1, Cr2, Cr1, and Cr2, respectively. In Algorithm 1, the above steps of the proposed dichotomous method used for the unsupervised feature selection is shown:
| Algorithm 1. Dichotomous DE logical steps |
| Input: Population size N, Crossover probability Cr; objective function MAD Initialize the population P0 by random of N candidate solutions for i = 1 to N if Xi,0 is an infeasible individual then Execute Algorithm 1 for ratio-greedy repair end if Evaluate the objective function value (Xi,0) end for FEs = NP while FEs < MaxFEs do for i = 1: NP do Randomly select two individuals xr1, and xr2, from population PG Execute the dichotomous mutation to generate a mutate individual Vi, Execute the dichotomous crossover to generate a trial individual Ui, if Ui,G is an infeasible individual then Execute Algorithm 1 for ratio-greedy repair end if Evaluate the objective function value (Ui,) if f(Ui,G) > f(Xi,G) then Xi, = Ui,G end if end for FEs = FEs + NP end while Output: Optimal individual with the maximum profit value |
2.5. Simulated Annealing
Simulated annealing is a single solution meta-heuristic method that depends on hill-climbing methodology. In order to avoid the local optima stagnation in the global search, SA uses a particular probability for accepting a worst solution. This algorithm begins with a random solution generated from scratch (new solution). Iteratively, a neighboring solution to the optimal solution is generated in accordance to a previously defined neighboring structure and assessed using an objective function. The enhancement move (the neighboring solution is better than the original one) in all cases is accepted, whereas a less fit neighboring solution is accepted with a particular probability based on Boltzmann probability, P = e − θ/T, where θ equals the difference of the fitness of the best solution and the new random solution neighbor (Trial-Sol). In addition, T is a factor (named the temperature) which iteratively decreases during the search process on the basis of a specific cooling plan [22,23]. In this paper, all parameters were adopted from those used in [22]. The way that the simulated annealing is run is indicated by Algorithm 2.
| Algorithm 2: simulated annealing local search |
| T0 = constant value Best-Sol ← S i ’ δ (Best-Sol ) ← δ (S i)//δ fitness function while T > T 0 randomly generated solution Trial-Sol in the neighbouring of Si’ calculate δ(Trial-Sol) if (δ (Trial-Sol ) > δ (Best-Sol)) S i ← Trial-Sol; Best-Sol←Trial-Sol; δ (S i ‘)←δ (Trial-Sol); δ(Best-Sol) ← δ(Trial-Sol); else if ((δ( Trial-Sol ) = δ( Best-Sol)) Calculate|Trial-Sol|and|Best-Sol|; if (|Trial-Sol|< |Best-Sol|) S i ’ ← Trial-Sol; Best-Sol← Trial-Sol; δ(Si ’)← δ(Trial-Sol); δ(Best-Sol)← δ(Trial-Sol); end if else//accepting the worse solution produce θ = δ(Trial-Sol) – δ(Best-Sol)) produce a random value, P = [0,1]; if (P ≤ e −θ/T) S i’← Trial-Sol; δ(S i)← δ(Trial-Sol); end if end if T = 0.93 ∗ T;//update temperature end while Output Best-Sol |
3. Unsupervised Text Feature Selection Using Memetic Optimization
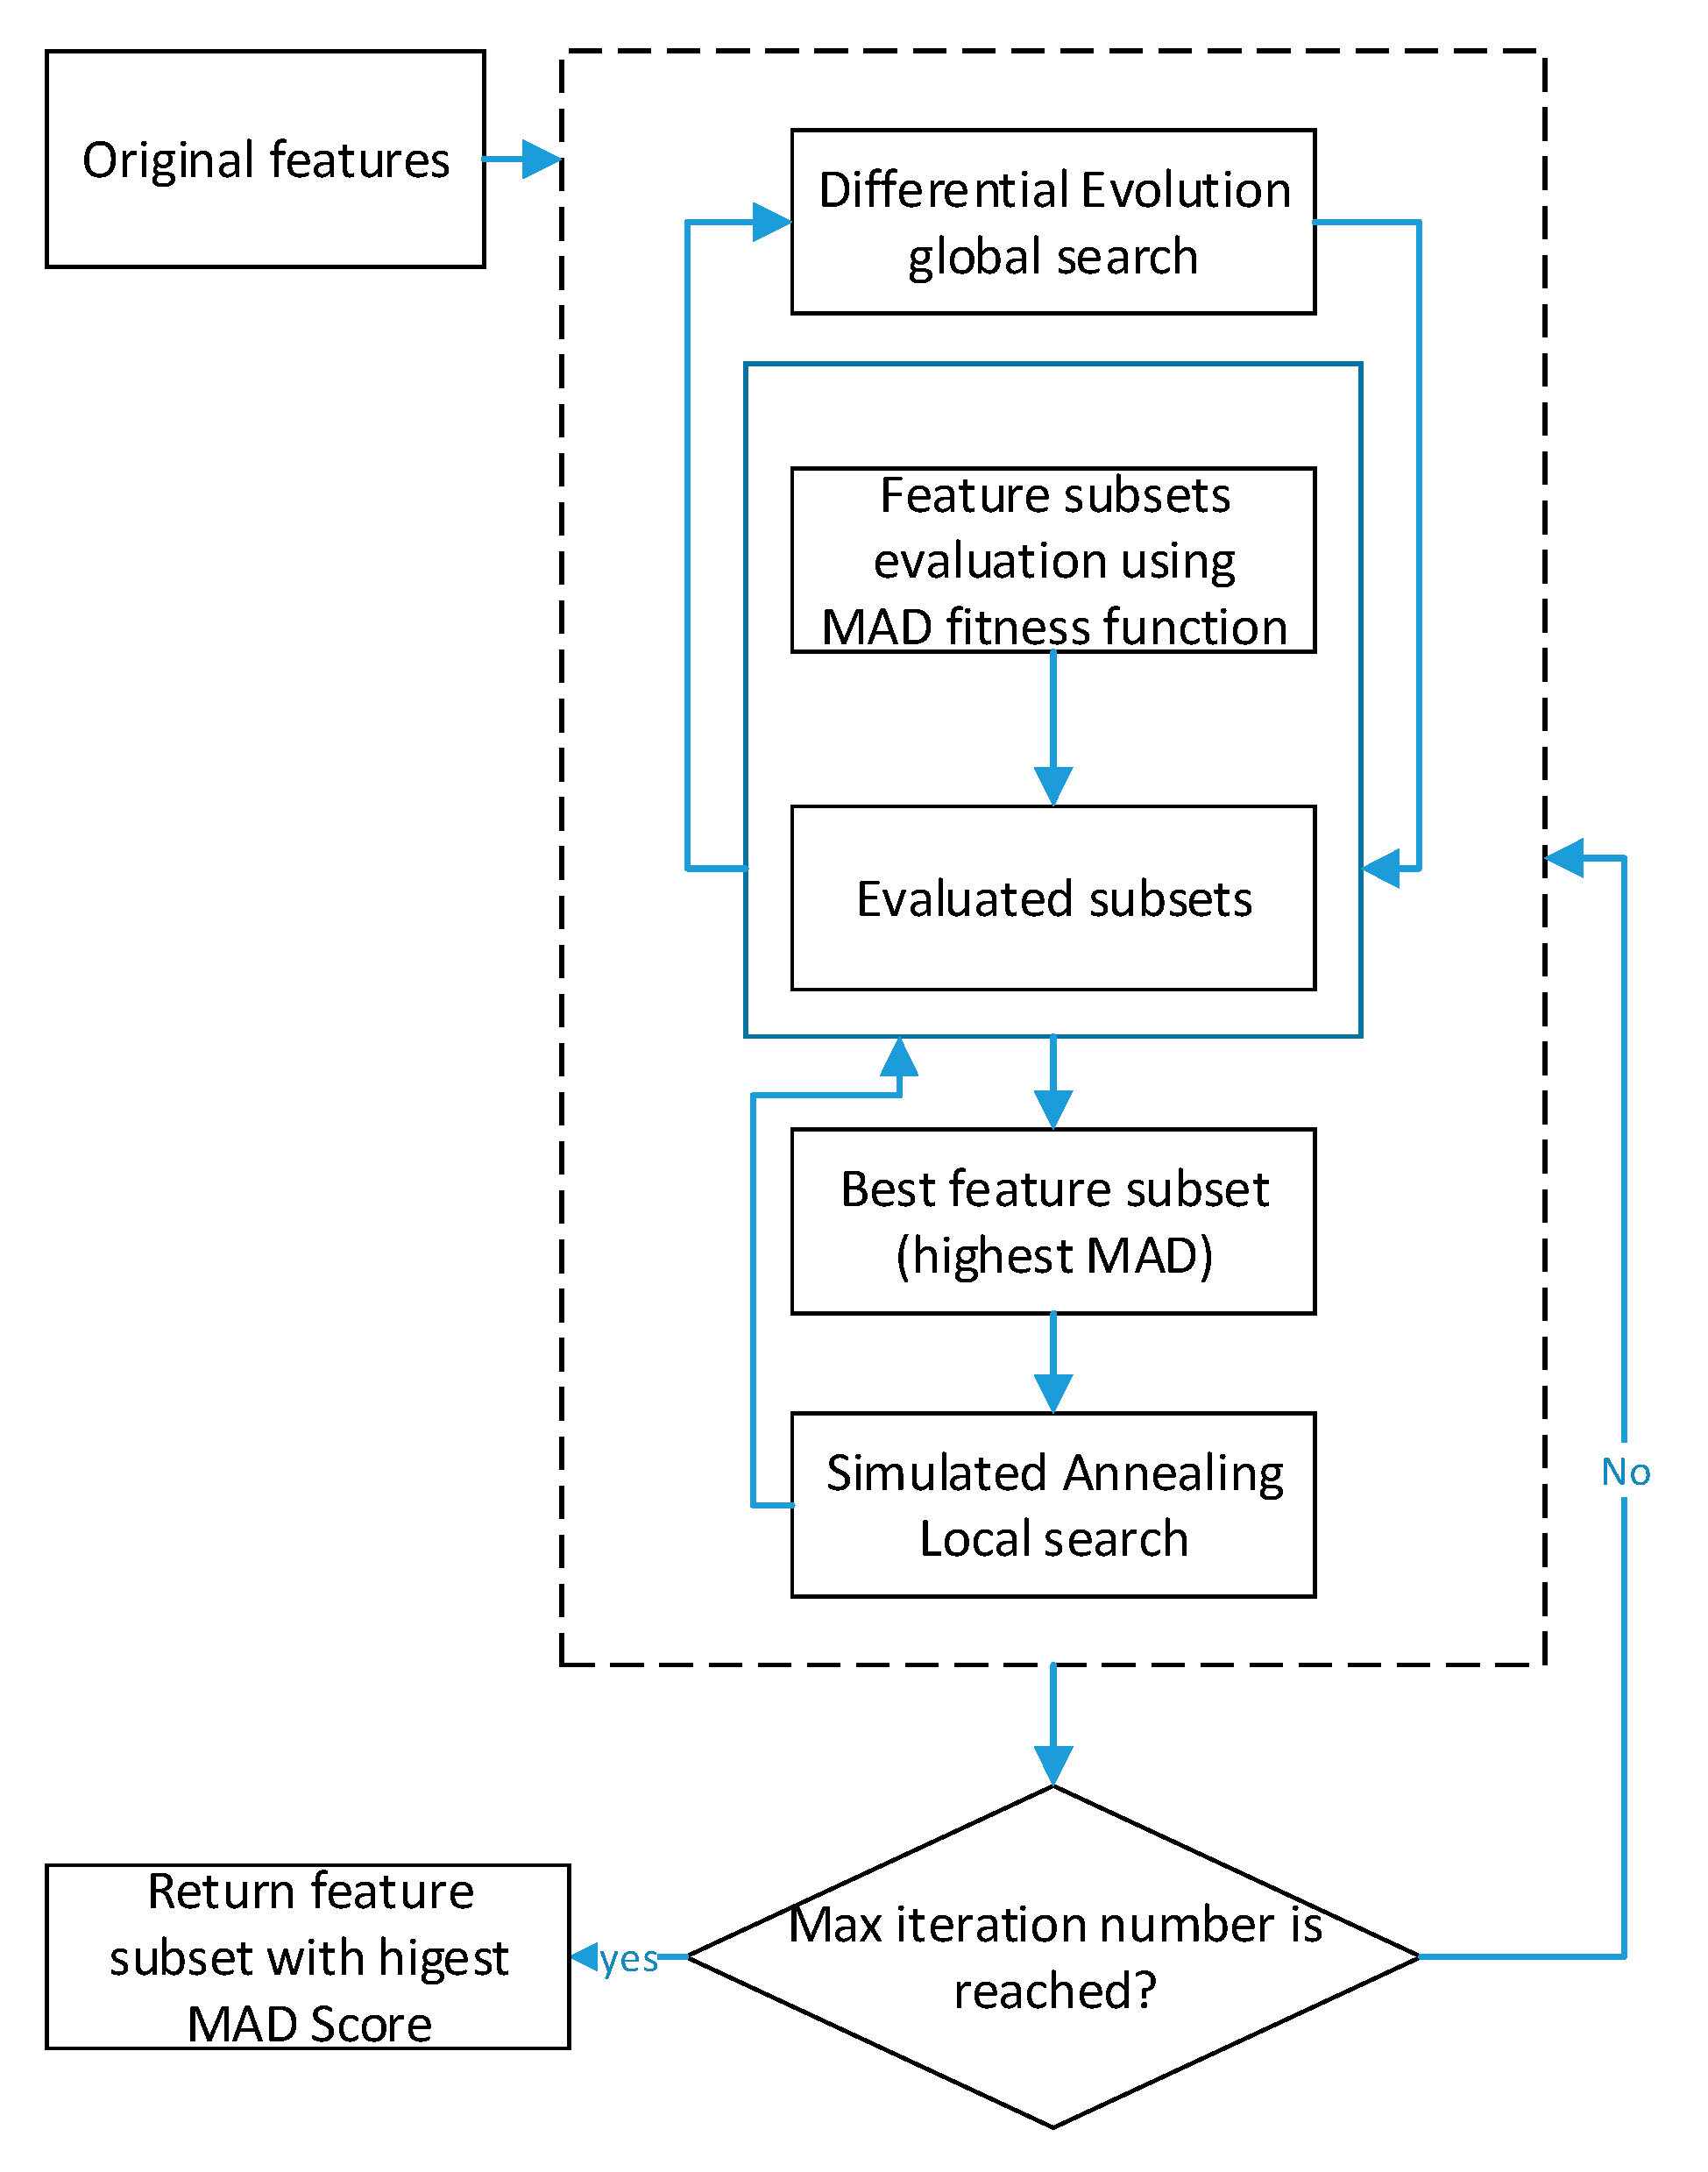
The proposed method has four phases. First, the text document’s corpus is transformed into numerical data in the pre-processing phase, as was described earlier. Second, the resultant data are fed into the proposed feature selection method. Third, document clustering is performed using the resultant features. Finally, evaluation measures are used to assess the resultant clusters. In this subsection, the main steps of the proposed method of feature selection are described; the main steps are listed as follows:
- The population is first randomly initialized, and then the solutions are refined in each generation. Each solution consists of a random subset of features, as shown in Table 2. All solutions are encoded using a binary encoding scheme. As the unsupervised feature selection is a discrete binary-based optimization problem, the range of every solution is limited only to [0,1]. Each solution is represented as a string of random binary values, and the length of each solution represents the number of features. The presence of a feature is represented by one, while the absence of it is represented by 0. Each solution is modified using the differential evolution mutation and crossover operators.
- The fitness calculation is performed first using the Mean Absolute Distance, MAD, as shown in the Equation (10).where m is the number of features (one valued in any particular solution), and is the trail vector resulted from the dichotomous crossover, while n is the number of documents containing feature i. The reason behind using the MAD fitness function is to find the score of each feature and to find its distance from the mean values of that feature in all documents with no consideration of the original class labels using a data-driven scheme.
- Simulated annealing is used as a local search modifier; it resembles the metaheuristic operators when applied as a local search in the memetic search. Almost the same idea of using mutation and crossover is followed by using the local search. The solution chosen for the local search is the one that has the highest MAD fitness value. Simulated annealing is used to guide the differential evolution search in the search space. The control parameters required for the SA are the initial temperature (T0) and the cooling schedule (T), which were adopted from [17].
Table 2 shows an illustration of each solution, which is composed of an n number of features, and each solution is weighted using the MAD objective function.
The evaluation measures are important to observe for the performance of each feature selection method and its effect on the clustering algorithm. Two types of measurements are used in the experiments, which are the internal and external evaluation measures [24]. The F-macro and F-micro are used as external measures, while the internal measure used is the Average-Document-Distance-to-the-Cluster-Centroid (ADDC) [25,26] It is noteworthy that the F-micro resembles the F-measure in other studies. A thorough analysis is conducted in the next section by observing the maximization of the F-scores and the minimization of the ADDC measure using different feature selection methods. The Reduction Rate (RR) is also used as a measurement that can observe how many irrelevant features are dropped in relation to the above mentioned two measurements. The reduction rate can be calculated as shown in Equation (11).
An illustrative example of the proposed feature section can be described as follows. If there is a document set with eight documents and seven features, the features are produced after using the TF.IDF weight scheme. Each weight is normalized between 0 and 1. Then the document corpus will be represented as shown in Table 3. The relevant code of the proposed method is provided in this link: https://github.com/kevinwongmurdoch/DE-SA.
4. Datasets
The datasets used are two criminal report datasets and two benchmark datasets. Table 3 shows the detailed information about the datasets. More explanation of the datasets used is given below.
- D1. 6 Event Crimes. This dataset is collected from the online news available at (http://www.bernama.Com/bernama/v8/index.php). The first dataset has six classes of crimes, whereas the other dataset has ten categories. In Table 3, the number of documents and the number of classes in each of those datasets are reported.
- D2. 10 Types of Crime. This contains ten types of criminal reports which contain 2,422 documents and 15,601 features.
- D3. Reuters. This dataset is available at the Machine Learning Repository (https://archive.ics.uci.edu/ml/datasets/Reuters-21578+Text+Categorization+Collection). Although this dataset is diversified and challenging, many labels in the documents are missing. There is a large number of multi-labelled documents. In addition, the number of classes is skewed leading to inconsistent class sizes. In order to deal with these drawbacks, the same edition utilized in [27] is also used in this present research. The edition includes only the label documents and single-labelled documents. Furthermore, the number of documents chosen for each class is 200.
- D4. 20news Groups. This dataset consists of data collected from 20 news sources. It is also available at the Machine Learning Repository (https://archive.ics.uci.edu/ml/datasets/Twenty+Newsgroups).
- D5. Pair 20news Groups. This sub-dataset contains the.talk.Politics, Mideast, and talk.Politics.Misc, which is a subset of D4.
5. Test Results and Experimental Strategy
The tests are conducted first by using the retrieved features for the k-means clustering. For comparisons, all features (All), FS Harmony Search Document Clustering (FSHSTC) [28], the FS Genetic Algorithm Document Clustering (FSGATC) [29], and the DE in [30] methods are used. “All” represents the original feature space without reduction, while FSHSTC and FSGATC are two recently proposed unsupervised feature selection methods. Moreover, the native differential evolution is also used as an FS method in the comparisons. All these methods are compared with the DESA and DDESA methods. Indirect evaluation of features is conducted via the use of clustering evaluation measures after using the k-means, as can be seen in Table 4. The number of runs of the k-means is set to be more than one run. Consequently, taking the average of all runs is more reliable than depending on one run only. This is because the k-means is highly sensitive to the initial centroid representation. On the other hand, a direct evaluation of feature subsets via the reduction rate is also reported in Table 5. The reduction rate, the fitness convergence, and the internal and external clustering evaluation measures can give a complete view of the reduced features subset. Comparing the F-macro, F-micro, and ADDC results with the reduction rate can give an idea of the effectiveness of the feature selection methods used. Theoretically, if a particular method achieved a higher reduction rate with higher F-macro and F-micro scores, that means this method is more effective than the method that achieves comparable F-scores or ADDC scores but with lower reduction rates.
In this subsection, the reduction rate, the Average Distance from Centroid to Document (ADDC) and the F-macro and F-micro (F-measure) results are given. It is important to mention that the F-macro and F-micro are referred to as F-scores; in the tests, the highest F-scores after the clustering indicate the higher accuracy of the resultant features. On the other hand, the ADDC score is used to measure the compactness of the clusters. In these tests, we are looking for the features that shorten distances between documents with any particular cluster. Ideally, the ADDC score should be minimized, while the F-scores should be maximized. The relationship between the internal and external evaluation measures represented by the ADDC and the F-scores seems to have complex incremental and decrement trends. From experience, it could be said that the performance of these measures can be classified into three categories. First, is the ideal case where the internal (ADDC) is minimized, and the external (F-scores) is maximized by the same amount but in opposite directions. The second case happens when the internal measure remains the same or slightly fluctuates, while the F-scores move significantly. This case can be accepted because the variation of the F-scores can give a clue of the positive or negative algorithm’s performance despite the stability (or the slight variation) of the internal measure.
The last case, which is the worst case, occurs when both criteria have similar trends. In other words, when the ADDC and F-scores either increase or decrease both in one direction. The method that has such behavior could be considered an ill-performing method due to the instability of the internal measure. Based on these assumptions, it might be perceived that the internal and external measures have two different goals in data-driven problems such as document clustering. It is not only dependent on one measure; rather, both the internal and external measures should be taken into account. The relationship between these two measures needs more in-depth research to understand their behavior and how results can be predicted as one measure by observing the performance of the other. However, the study of this relationship is out of the scope of this paper. All the above explanation is intended to help understand the nature of the performance of both F-scores and the ADDC in our text feature selection, as reported in Table 4. In Table 4, the values of the minimum, maximum, and average ADDC and F-scores are listed in different runs. Table 4 contains five sections; each one represents a particular dataset. The first section lists the results of the “6 Events Crimes” dataset that has minimum, maximum, and average scores of F-scores and ADDC.
It can be seen that the results of the average of all runs for the proposed DDESA method are 0.573 and 0.608 for minimum, 0.886 and 0.897 for maximum, and 0.761 and 0.778 for average values. All these scores are higher than the other competent methods, including “All”, which uses the entire feature space. The ADDC measure of the average values of the “6 Events Crimes” dataset obtained using DESA is slightly higher than the average ADDC obtained using the DESA method. The slight increase of ADDC can be accepted as the corresponding F-scores are much higher than the scores achieved using other methods in terms of their ADDC scores. The second section describes the Classic3; in this section, similar information is shown as in the “6 Events Crimes” dataset section, as is listed in the table. Again, it can be seen that the DDESA achieved higher results of clustering in terms of F-scores in comparison to other methods, including the “All” method. The ADDC values of the DDESA method also show an improvement by obtaining the least values among other methods. However, the ADDC values are still insignificant when they are compared to other methods. Therefore, the use of external measures will be considered.
The “Pair 20news Groups” is a subset of the “20news Groups” dataset used to see the effect of using different methods on the two-class only dataset. The distinction of this dataset and other datasets used is that it has only two classes. Undoubtedly, the lower class number makes it much easier for the clustering algorithm to predict the right class for each document without the confusion of dividing features into multiple classes. Therefore, it can be seen that all feature selection methods tested have almost similar behavior. There are no significant changes in the performance of the DESA method when compared with other methods in terms of the external and internal measures. Due to the lower class number, the feature selection does not seem to be playing a notable role.
Reuters is one of the widely used benchmark datasets. In this dataset, the values achieved DDESA are comparable with those achieved using the FSGATC method for the maximum. Correspondingly, the ADDC values of the DDESA were less than other methods, including “All” with minimum, maximum, and average values. Finally, with “10 Types of Crimes”, the values of the DDESA are very comparable to other methods in terms of the F-scores and ADDC, including the “All” method.
Through Table 4, an idea can be concluded that using feature selection improves the performance of internal and external evaluation measures. However, due to the existence of some similarities between the results obtained using different feature selection methods in terms of the internal evaluation measure ADDC, such as what happened in the “Pair 20news Groups” dataset, it becomes necessary to use another measurement that can determine the effectiveness of each method regarding the information shown in Table 4. Therefore, the use of the reduction rate of features can be used in conjunction with the information provided in Table 4 to determine which method achieved the highest F-scores, the lowest ADDC, and the highest reduction rate.
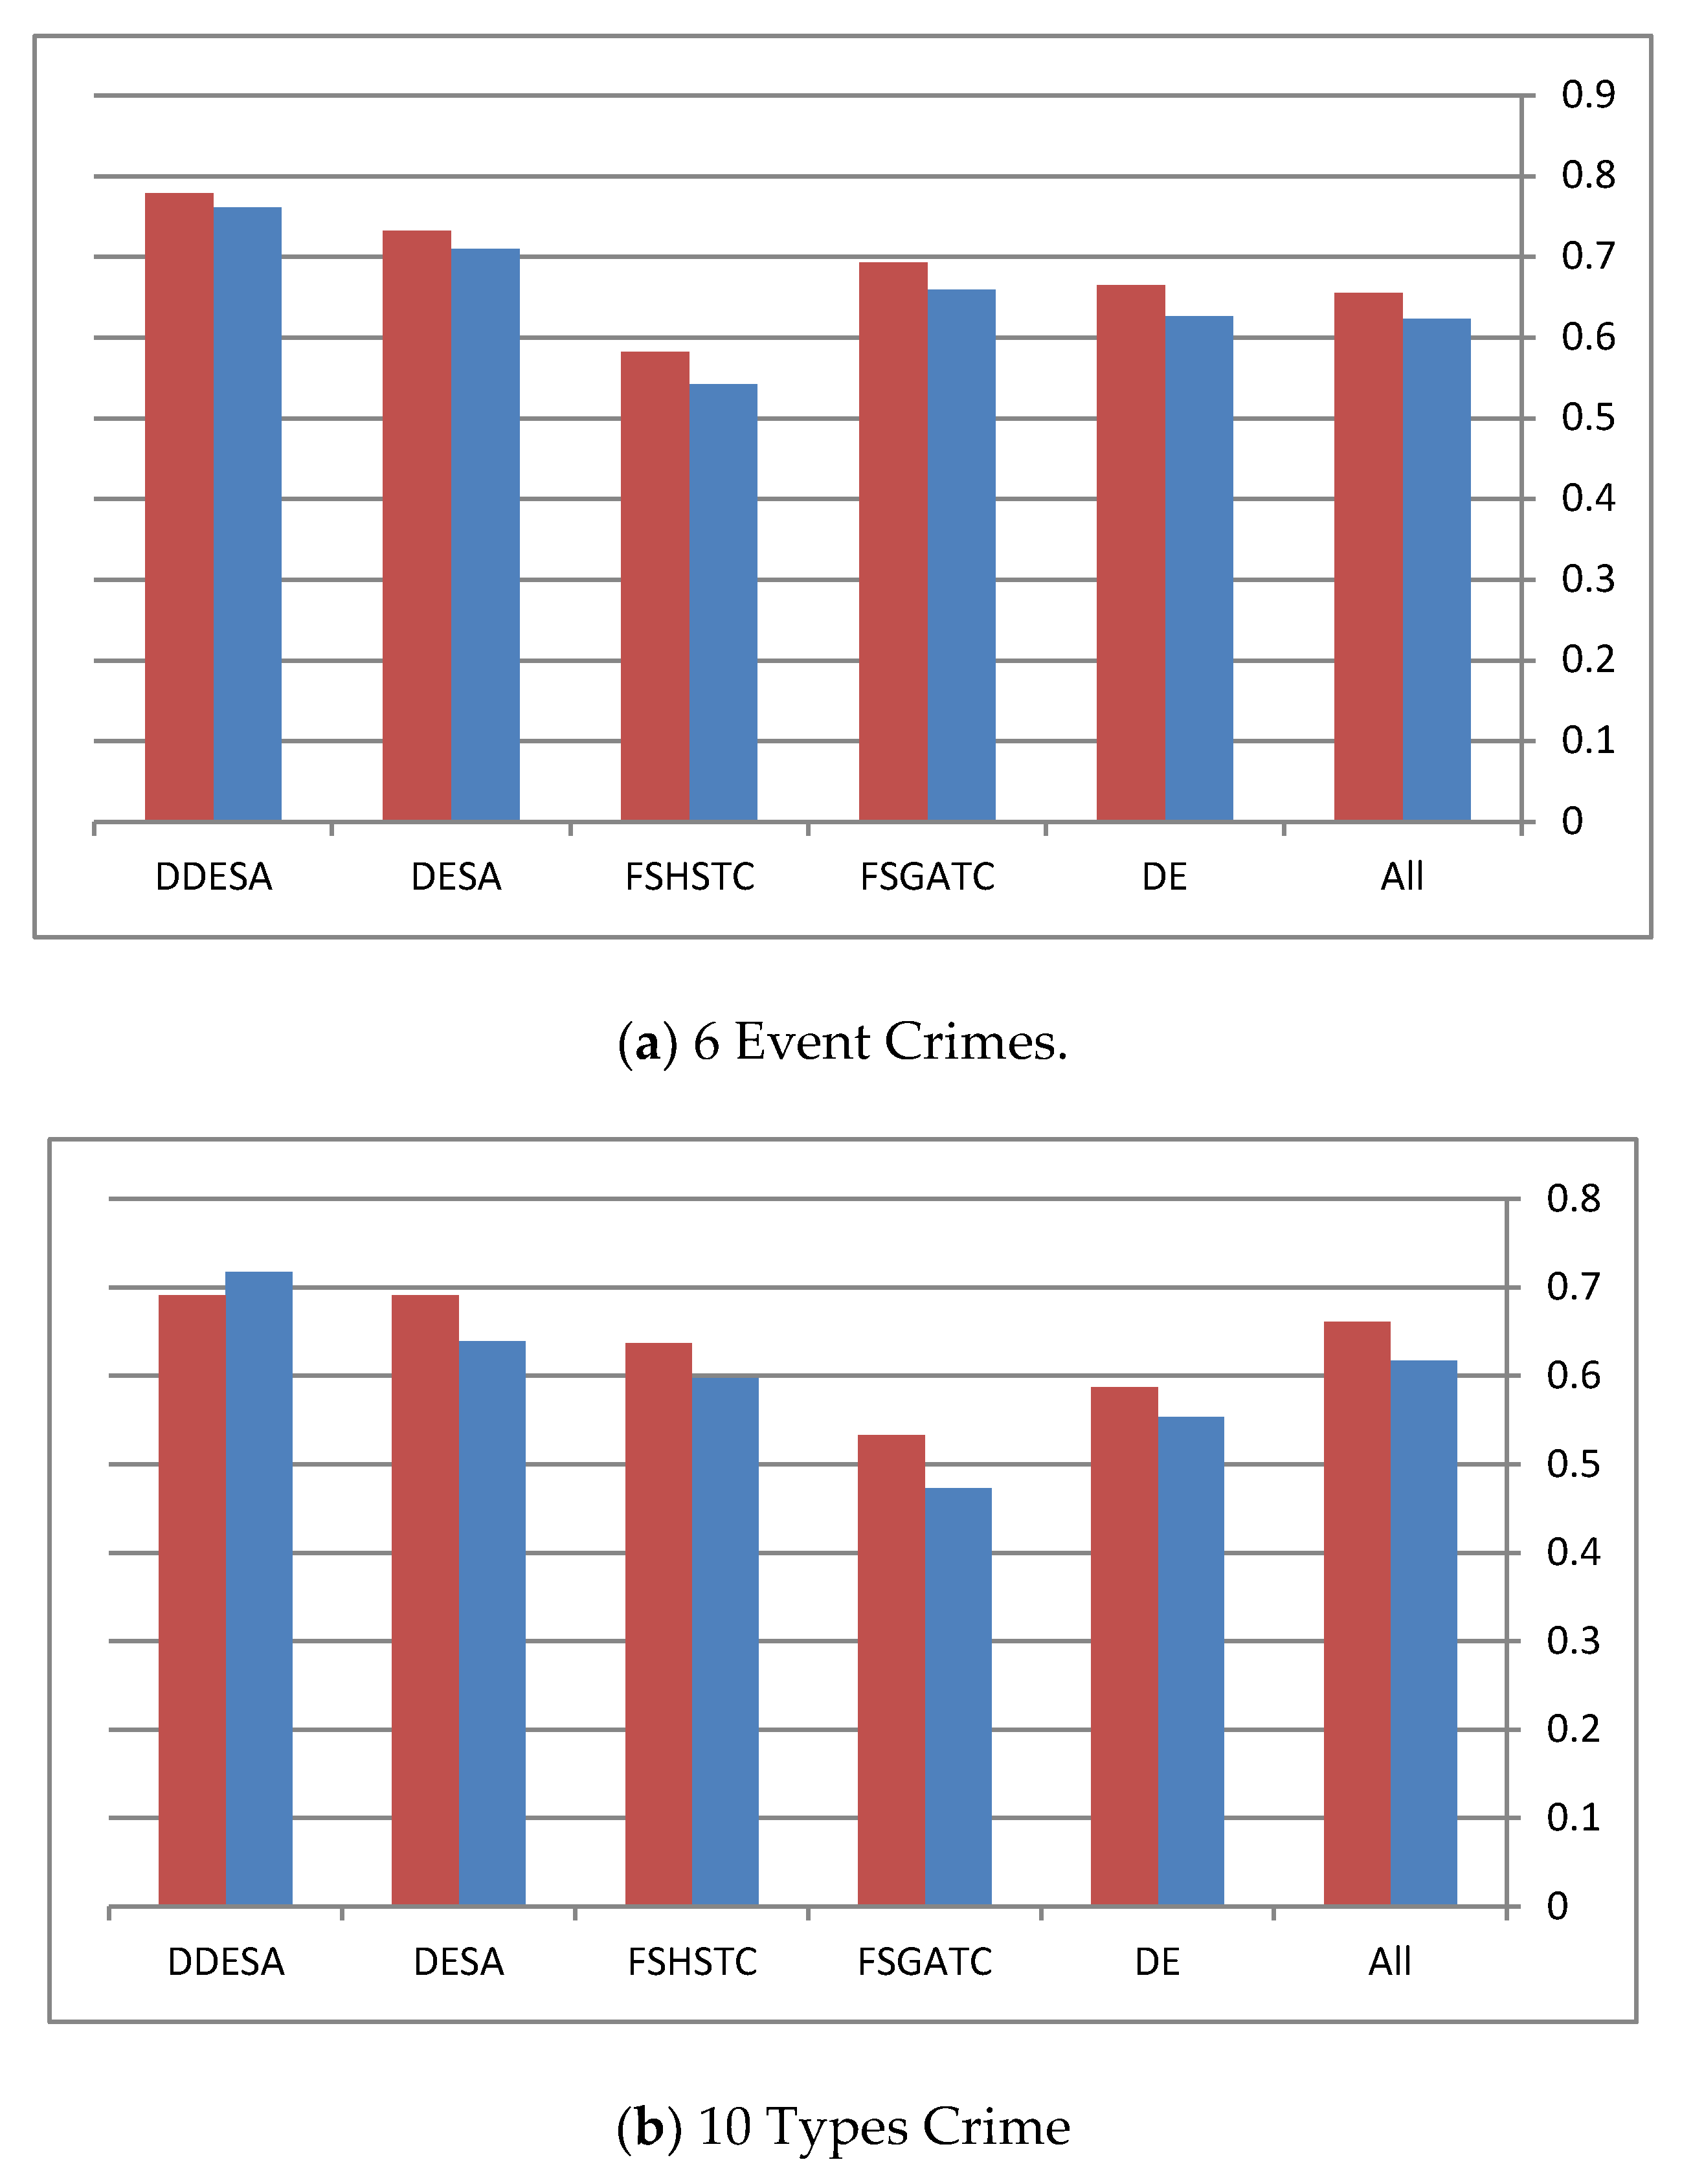
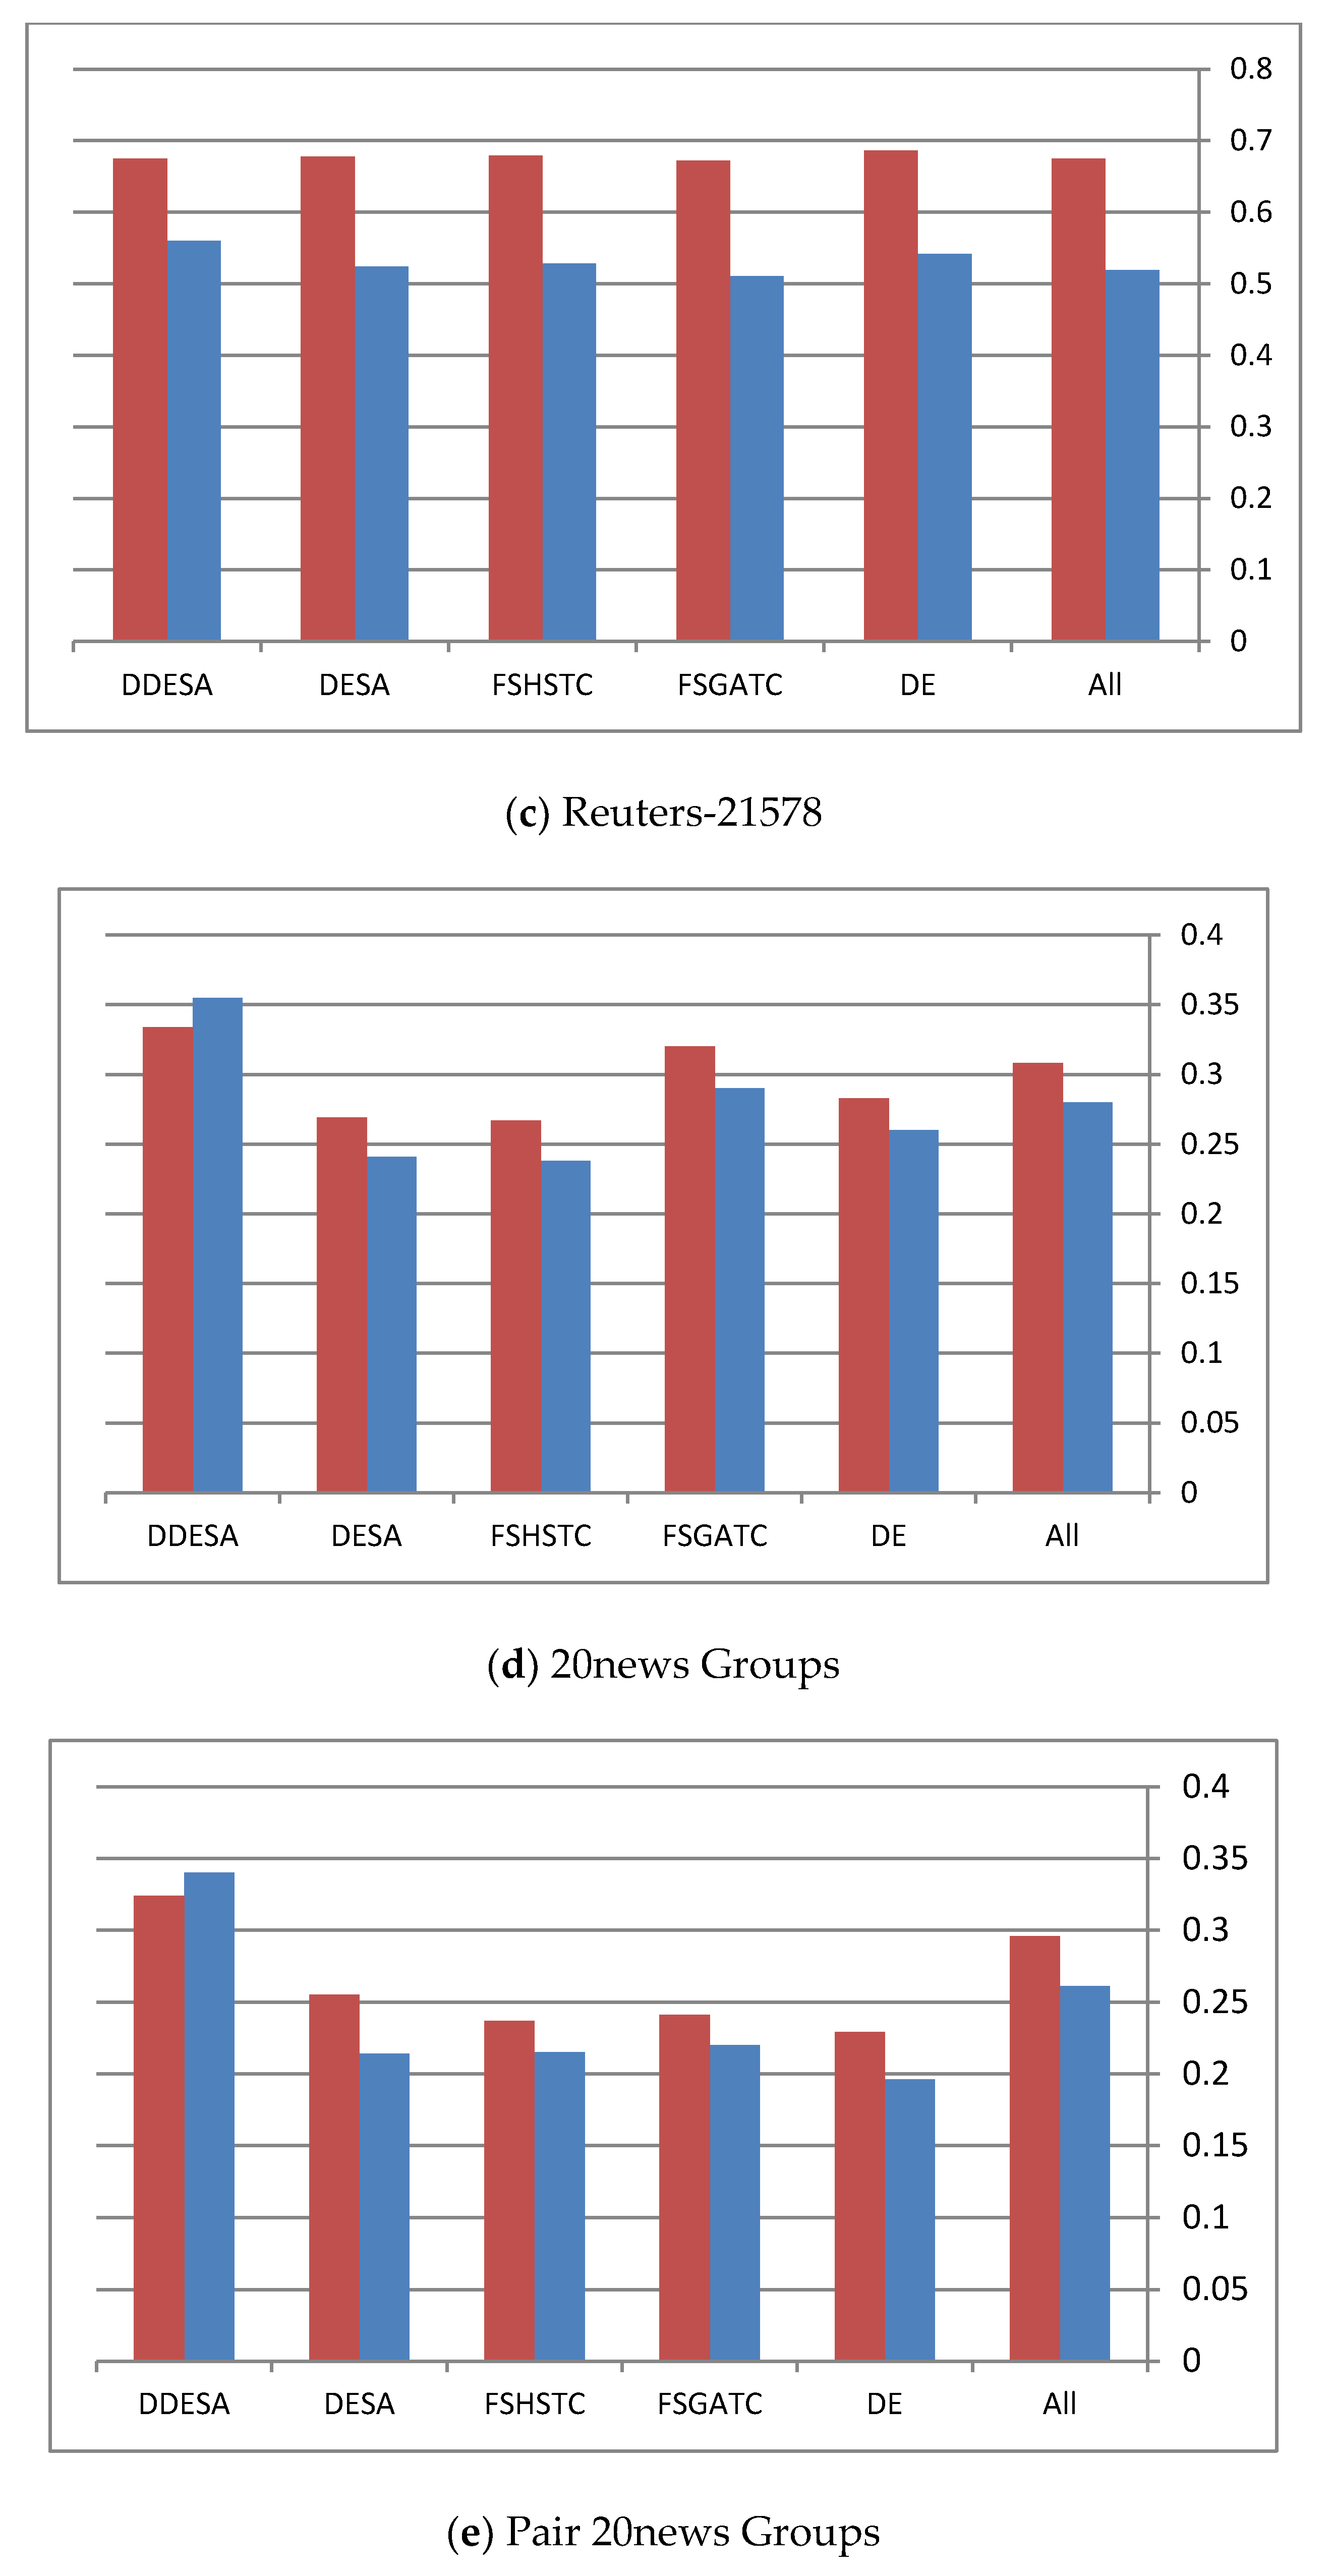
Table 5 lists the total number of original features, the total number of selected features, and the relationship between them. In Table 5, it can be seen that the reduction rates of both the DDESA and DESA methods exceed the ones obtained by other methods. When it comes to the clustering performance after using the DESA FS in both versions, the performance remains at an equal or better level than using “All” features or using other state-of-the-art methods, as shown in Table 4. Furthermore, in Table 5, it can be noticed that DESA and DDESA reduction rates are more than half of the features, ranging between 0.51 and 0.77; the F-scores and the ADDC achieved using the DDESA method are still comparable with the scores achieved by the other methods, including the “All” method. In Figure 4, the red bar refers to the Average F-micro measure while the blue bar refers to the ADDC measure.
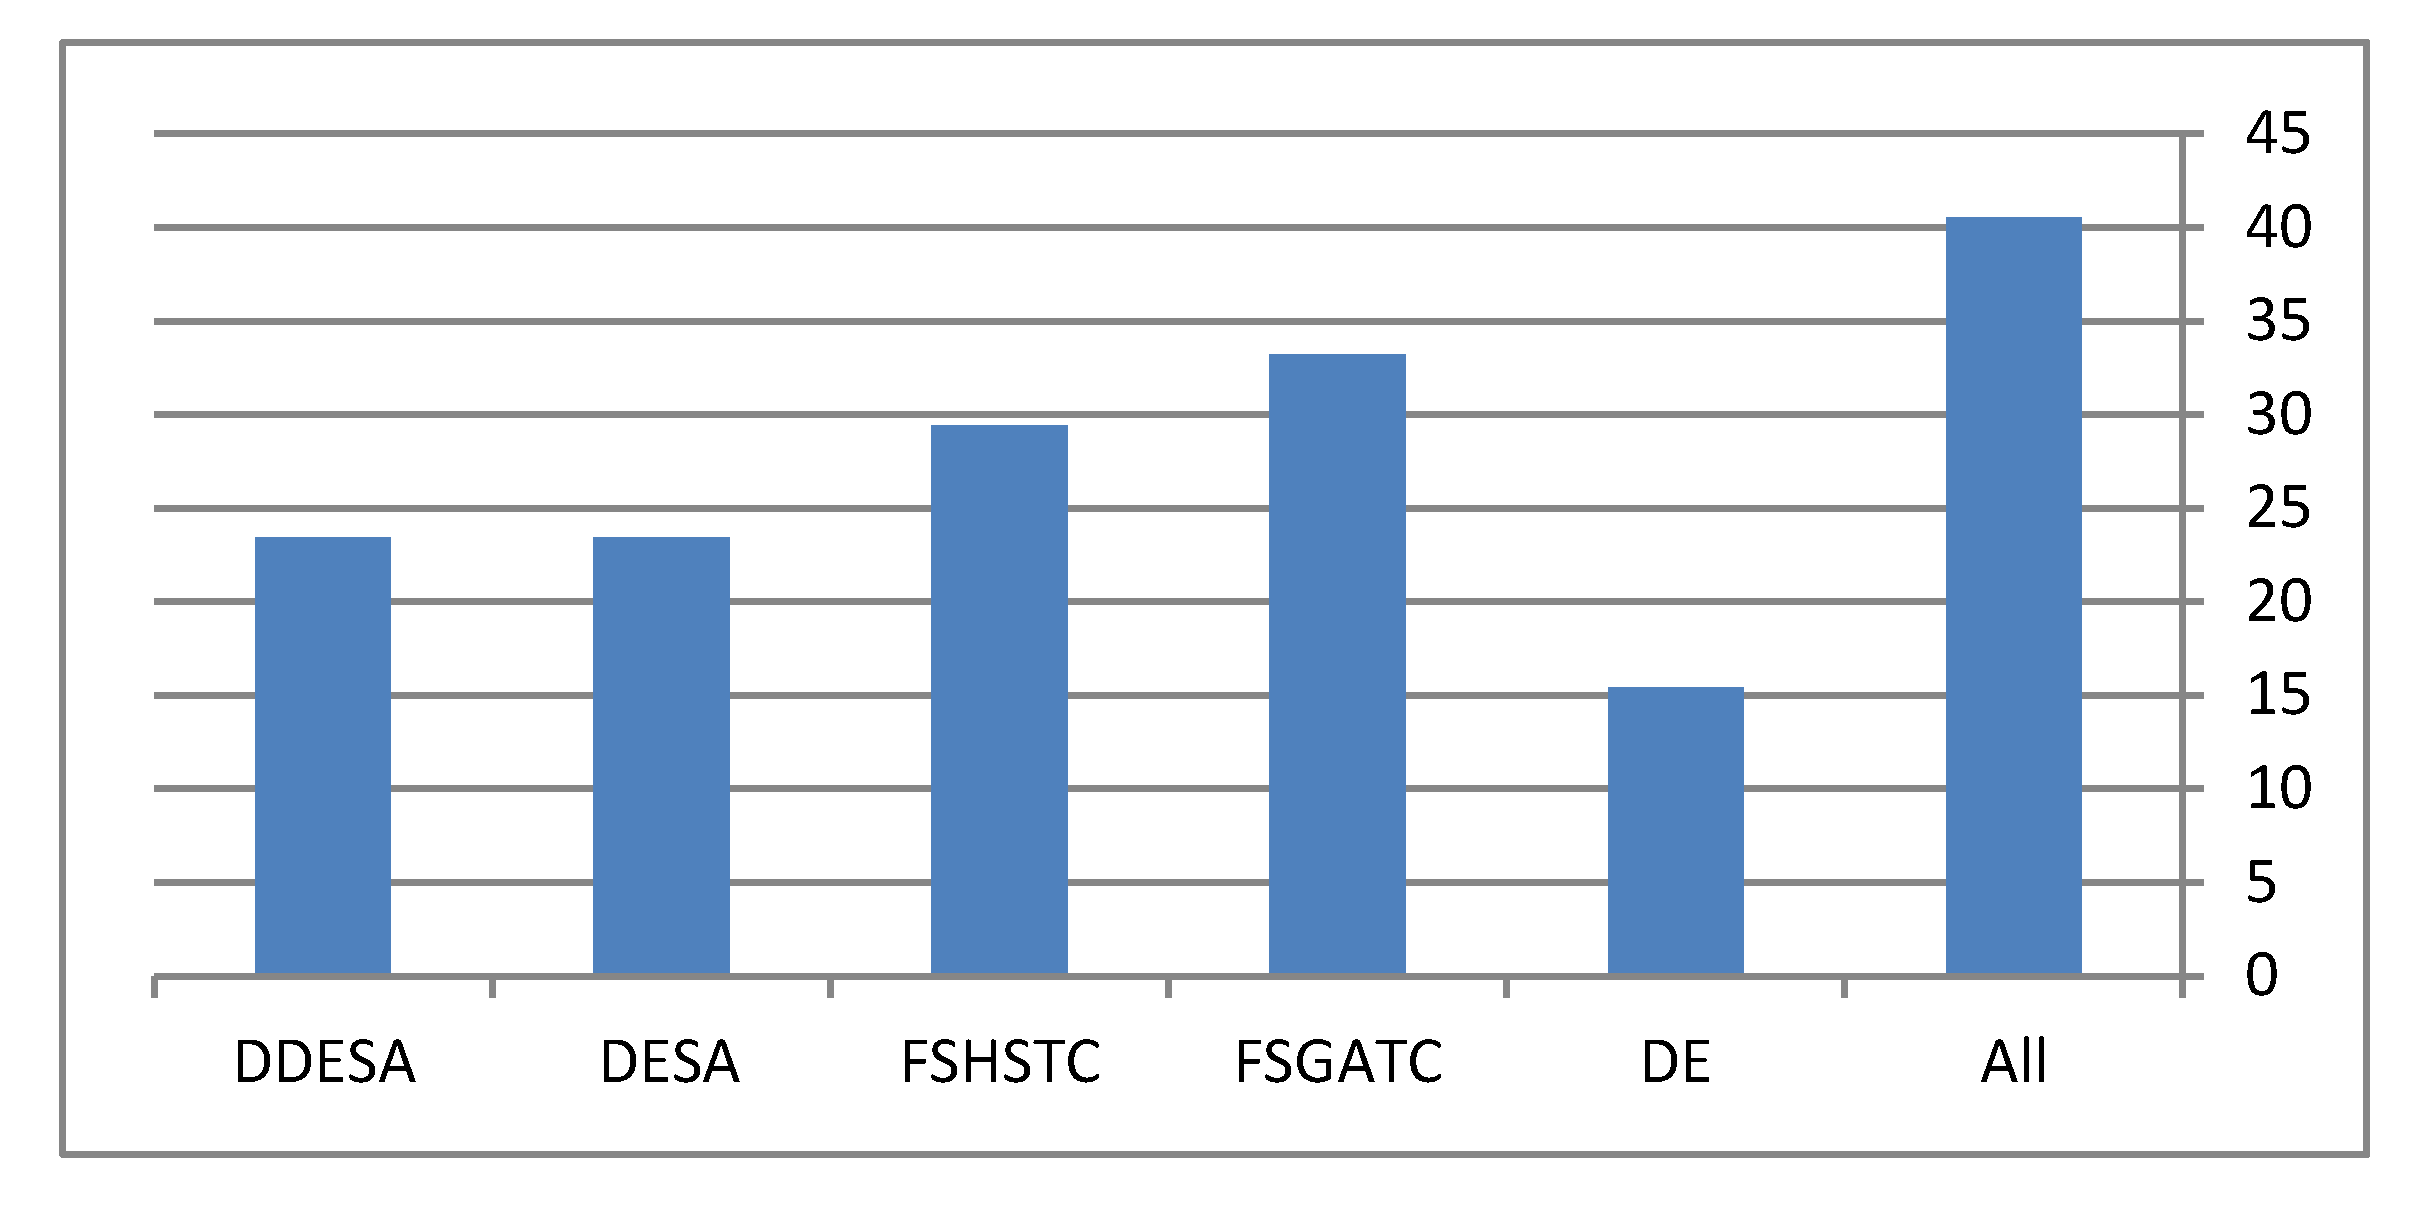
By examining each dataset in Figure 4, it becomes clear that the performance of the DDESA method is slightly better than the other methods. This figure shows the performance of all methods in terms of the average F-micro and F-macro results throughout all the runs. However, for Figure 4c, it can be noticed that all methods preformed equally, and the reason behind this was justified earlier in this section. Finally, the average execution time of the compared methods is represented in Figure 5.
From Figure 5, it becomes clear as a general trend that all hybrid methods take more time than the non-hybrid methods. For instance, the DE is a non-hybrid method and it showed that it takes about half the time needed for the other methods. In contrast, using “All” feature would lead to an increase in the execution time, which means unnecessary features are used. When it comes to our proposed method, the DDESA, it showed that its time consumption is less than the other hybrid methods used in the tests. However, as for future work, enhancements might be made to reduce further the time taken by our proposed method.
6. Conclusions
This paper presents a feature selection method that is capable of detecting informative features by using the hybridization of a wrapper and filter methods in an unsupervised manner. The proposed method combines SA with the binary differential evolution method. SA is used as a filter method. The resultant method is DDESA. This method was compared against the standard DE wrapper and also against two other state-of-the-art unsupervised feature selection methods, namely FSGATC and FSHSTC. The performance of the DESA, DDESA, and other compared methods was evaluated indirectly via external and internal evaluation of clustering. The reduction rate and fitness function convergence using MAD was also considered. The reduction rate measures the percentage of feature reduction for each method, while MAD measures the convergence of each of the tested methods. The method that achieves the highest reduction rate and highest MAD is considered the best. The DDESA method achieved the highest F-scores with the majority of datasets. It also achieved the lowest ADDC values (internal measure that is needed to be minimized) with the majority of datasets. The reduction rate values also suggest that DDESA outperformed other tested methods.
Author Contributions
I.A.-J., K.W.W. conceived and designed the study. I.A.-J. conducted the experiments. I.A.-J., K.W.W., C.C.F. and H.X. provide analysis and comments of the results and finalised the discussions. I.A.-J. wrote the early version of the manuscript. I.A.-J., K.W.W., C.C.F., H.X. critically reviewed and finalised the manuscript. All authors have read and agreed to the published version of the manuscript.
Funding
This research received no external funding.
Conflicts of Interest
There is no conflict of interest.
References
- Korde, V.; Mahender, C.N. Text classification and classifiers: A survey. Int. J. Artif. Intell. Appl. 2012, 3, 85. [Google Scholar]
- Abualigah, L.M.; Khader, A.T.; Hanandeh, E.S. A new feature selection method to improve the document clustering using particle swarm optimization algorithm. J. Comput. Sci. 2018, 25, 456–466. [Google Scholar] [CrossRef]
- Diaz-Valenzuela, I.; Loia, V.; Martin-Bautista, M.J.; Senatore, S.; Vila, M.A. Automatic constraints generation for semisupervised clustering: Experiences with documents classification. Soft Comput. 2015. [Google Scholar] [CrossRef]
- Gui, J.; Sun, Z.; Ji, S.; Tao, D.; Tan, T. Feature selection based on structured sparsity: A comprehensive study. IEEE Trans. Neural Netw. Learn. Syst. 2017, 28, 1490–1507. [Google Scholar] [CrossRef] [PubMed]
- Zhaleh, M.; Akhlaghian Tab, F.; Salavati, C. Hybrid fast unsupervised feature selection for high-dimensional data. Expert Syst. Appl. 2019, 124, 97–118. [Google Scholar]
- Solorio-Fernández, S.; Carrasco-Ochoa, J.A.; Martínez-Trinidad, J.F. A review of unsupervised feature selection methods. Artif. Intell. Rev. 2020, 53, 907–948. [Google Scholar] [CrossRef]
- Wang, J.; Zhang, H.; Wang, J.; Pu, Y.; Pal, N.R. Feature Selection Using a Neural Network with Group Lasso Regularization and Controlled Redundancy. IEEE Trans. Neural Netw. Learn. Syst. 2020. [Google Scholar] [CrossRef]
- Xue, B.; Zhang, M.; Browne, W.N.; Yao, X. A survey on evolutionary computation approaches to feature selection. IEEE Trans. Evol. Comput. 2016, 20, 606–626. [Google Scholar] [CrossRef] [Green Version]
- Song, W.; Qiao, Y.; Park, S.C.; Qian, X. A hybrid evolutionary computation approach with its application for optimizing text document clustering. Expert Syst. Appl. 2015, 42, 2517–2524. [Google Scholar] [CrossRef]
- Zong, W.; Wu, F.; Chu, L.-K.; Sculli, D. A discriminative and semantic feature selection method for text categorization. Int. J. Prod. Econ. 2015, 165, 215–222. [Google Scholar] [CrossRef]
- Bharti, K.K.; Singh, P.K. A three-stage unsupervised dimension reduction method for text clustering. J. Comput. Sci. 2014, 5, 156–169. [Google Scholar] [CrossRef]
- Ferreira, A.J.; Figueiredo, R.A.T. Efficient feature selection filters for high-dimensional data. Pattern Recogn. Lett. 2012, 33, 1794–1804. [Google Scholar] [CrossRef] [Green Version]
- Tutkan, M.; Ganiz, M.C.; Akyokuş, S. Helmholtz principle based supervised and unsupervised feature selection methods for text mining. Inf. Process. Manag. 2016, 52, 885–910. [Google Scholar] [CrossRef]
- Al-Jadir, I.; Wong, K.W.; Fung, C.C.; Xie, H. Text Document Clustering Using Memetic Feature Selection. In Proceedings of the 9th International Conference on Machine Learning and Computing, Singapore, 24–26 February 2017; pp. 415–420. [Google Scholar]
- Lee, J.; Kim, D.-W. Memetic feature selection algorithm for multi-label classification. Inf. Sci. 2015, 293, 80–96. [Google Scholar] [CrossRef]
- Al-Jadir, I.; Wong, K.W.; Fung, C.C.; Xie, H. Differential Evolution Memetic Document Clustering Using Chaotic Logistic Local Search. In Neural Information Processing: 24th International Conference, ICONIP 2017, Guangzhou, China, 14–18 November 2017, Proceedings; Part I; Liu, D., Xie, S., Li, Y., Zhao, D., El-Alfy, E.-S.M., Eds.; Springer International Publishing: Cham, Swizerland, 2017; pp. 213–221. [Google Scholar] [CrossRef]
- Mafarja, M.M.; Mirjalili, S. Hybrid Whale Optimization Algorithm with simulated annealing for feature selection. Neurocomputing 2017, 260, 302–312. [Google Scholar] [CrossRef]
- Kannan, S.S.; Ramaraj, N. A novel hybrid feature selection via Symmetrical Uncertainty ranking based local memetic search algorithm. Knowl. Based Syst. 2010, 23, 580–585. [Google Scholar] [CrossRef]
- Aggarwal, C.C.; Reddy, C.K. Data Clustering: Algorithms and Applications; CRC Press: Boca Raton, FL, USA, 2013. [Google Scholar]
- Uysal, A.K.; Gunal, S. The impact of preprocessing on text classification. Inf. Process. Manag. 2014, 50, 104–112. [Google Scholar] [CrossRef]
- Peng, H.; Wu, Z.; Shao, P.; Deng, C. Dichotomous binary differential evolution for knapsack problems. Math. Probl. Eng. 2016. [Google Scholar] [CrossRef] [Green Version]
- Merendino, S.; Celebi, M.E. A Simulated Annealing Clustering Algorithm Based On Center Perturbation Using Gaussian Mutation. In Proceedings of the FLAIRS Conference, Marco Island, FL, USA, 22–24 May 2017. [Google Scholar]
- Saruhan, H. Differential evolution and simulated annealing algorithms for mechanical systems design. Eng. Sci. Technol. Int. J. 2014, 17, 131–136. [Google Scholar] [CrossRef] [Green Version]
- Montazeri, M.; Naji, H.R.; Faraahi, A. A novel memetic feature selection algorithm. In Proceedings of the Information and Knowledge Technology (IKT), Shiraz, Iran, 28–30 May 2013; pp. 295–300. [Google Scholar]
- Lamirel, J.-C.; Cuxac, P.; Chivukula, A.S.; Hajlaoui, K. Optimizing text classification through efficient feature selection based on quality metric. J. Intell. Inf. Syst. 2015, 45, 379–396. [Google Scholar] [CrossRef]
- Forsati, R.; Keikha, A.; Shamsfard, M. An improved bee colony optimization algorithm with an application to document clustering. Neurocomputing 2015, 159, 9–26. [Google Scholar] [CrossRef]
- Fodeh, S.; Punch, B.; Tan, P.-N. On ontology-driven document clustering using core semantic features. Knowl. Inf. Syst. 2011, 28, 395–421. [Google Scholar] [CrossRef]
- Abualigah, L.M.; Khader, A.T. Unsupervised text feature selection technique based on hybrid particle swarm optimization algorithm with genetic operators for the text clustering. J. Supercomput. 2017, 73, 1–23. [Google Scholar] [CrossRef]
- Abualigah, L.M.; Khader, A.T.; Al-Betar, M.A. Unsupervised feature selection technique based on genetic algorithm for improving the Text Clustering. In Proceedings of the 7th International Conference on Computer Science and Information Technology (CSIT), Amman, Jordan, 13–14 July 2016; pp. 1–6. [Google Scholar]
- Chunming, F.; Yadong, X.; Chao, J.; Xu, H.; Zhiliang, H. Improved Differential Evolution with Shrinking Space Technique for Constrained Optimization. Chin. J. Mech. Eng. 2017, 30, 553–565. [Google Scholar]
Figure 1.
Dichotomous mutation example.

Figure 2.
Dichotomous crossover example.

Figure 3.
DDESA unsupervised feature selection.

Figure 4.
(a–e) The performance of different algorithms on the different datasets.


Figure 5.
The execution time of the tested algorithms.


Table 1.
An example of dichotomous mutation.
| x1 | x2 | r | x3 | x4 | x4 | x5 | x6 |
|---|---|---|---|---|---|---|---|
| 1 | 1 | 1 | 0 | 0 | 1 | 1 | 1 |
| 1 | 0 | 1 | 1 | 1 | 0 | 0 | 1 |
| 0 | 1 | 0 | 1 | 0 | 0 | 1 | 1 |
| 0 | 1 | 0 | 1 | 0 | 0 | 1 | 1 |
| 1 | 0 | 0 | 1 | 0 | 0 | 0 | 0 |
| 1 | 1 | 0 | 0 | 1 | 1 | 1 | 1 |
where in Table 1, x1 and x2 are two random vectors selected from the DE population, r is a random vector, x3 = (x1 or x2), x4 = not(x3), x5 = (x4 and x1), and x6 = (x4 or x5).
Table 2.
Initial population of features; each row (Si) is a solution, and each column is a feature.
| Solution | Index1 | Index2 | Index3 | Index n | Fitness |
|---|---|---|---|---|---|
| S1 | 0 | 1 | 1 | 1 | MAD1 |
| S2 | 1 | 0 | 1 | 1 | MAD2 |
| S3 | 1 | 1 | 1 | 0 | MAD3 |
| . | |||||
| Sn | 0 | 0 | 0 | 1 | MADm |
Table 3.
Datasets.
| Dataset | D# | #Classes | Instances | Features |
|---|---|---|---|---|
| 6 Event Crimes | D1 | 6 | 223 | 3864 |
| 10 Types Crime | D2 | 10 | 2422 | 15,601 |
| Reuters-21578 | D3 | 10 | 2277 | 13,310 |
| 20news Groups | D5 | 20 | 1489 | 6738 |
| Pair 20news Groups | D4 | 2 | 1071 | 9497 |
Table 4.
Internal and external evaluation measure.
| Qualities | Minimum | Maximum | Mean | |||||||
|---|---|---|---|---|---|---|---|---|---|---|
| Method | F-Macro | F-Micro | ADDC | F-Macro | F-Micro | ADDC | F-Macro | F-Micro | ADDC | |
| 6 Events | All | 0.346 | 0.371 | 0.503 | 0.750 | 0.779 | 0.573 | 0.623 | 0.655 | 0.546 |
| DE | 0.238 | 0.259 | 0.539 | 0.781 | 0.803 | 0.584 | 0.626 | 0.665 | 0.561 | |
| FSGATC | 0.335 | 0.359 | 0.543 | 0.876 | 0.889 | 0.587 | 0.659 | 0.693 | 0.567 | |
| FSHSTC | 0.371 | 0.388 | 0.525 | 0.655 | 0.701 | 0.558 | 0.542 | 0.582 | 0.544 | |
| DESA | 0.541 | 0.568 | 0.539 | 0.860 | 0.870 | 0.596 | 0.710 | 0.732 | 0.577 | |
| DDESA | 0.573 | 0.608 | 0.554 | 0.887 | 0.897 | 0.629 | 0.761 | 0.779 | 0.491 | |
| 10 Types Crime | All | 0.416 | 0.484 | 0.524 | 0.735 | 0.766 | 0.627 | 0.617 | 0.661 | 0.595 |
| DE | 0.462 | 0.510 | 0.509 | 0.691 | 0.732 | 0.610 | 0.553 | 0.587 | 0.583 | |
| FSGATC | 0.399 | 0.476 | 0.470 | 0.599 | 0.676 | 0.791 | 0.473 | 0.533 | 0.776 | |
| FSHSTC | 0.492 | 0.528 | 0.620 | 0.716 | 0.756 | 0.694 | 0.597 | 0.637 | 0.654 | |
| DESA | 0.416 | 0.484 | 0.484 | 0.760 | 0.786 | 0.552 | 0.639 | 0.691 | 0.509 | |
| DDESA | 0.606 | 0.567 | 0.424 | 0.795 | 0.767 | 0.486 | 0.717 | 0.691 | 0.449 | |
| Pair of 20news | All | 0.515 | 0.673 | 0.539 | 0.520 | 0.675 | 0.605 | 0.519 | 0.675 | 0.591 |
| DE | 0.538 | 0.684 | 0.649 | 0.543 | 0.686 | 0.670 | 0.542 | 0.686 | 0.666 | |
| FSGATC | 0.505 | 0.669 | 0.422 | 0.515 | 0.673 | 0.566 | 0.511 | 0.672 | 0.498 | |
| FSHSTC | 0.524 | 0.678 | 0.685 | 0.529 | 0.680 | 0.720 | 0.528 | 0.679 | 0.710 | |
| DESA | 0.524 | 0.678 | 0.428 | 0.524 | 0.678 | 0.428 | 0.524 | 0.678 | 0.428 | |
| DDESA | 0.560 | 0.675 | 0.304 | 0.560 | 0.675 | 0.304 | 0.560 | 0.675 | 0.304 | |
| Reuters-21578 | All | 0.177 | 0.194 | 0.403 | 0.559 | 0.616 | 0.536 | 0.280 | 0.308 | 0.476 |
| DE | 0.205 | 0.212 | 0.395 | 0.345 | 0.366 | 0.477 | 0.260 | 0.283 | 0.438 | |
| FSGATC | 0.181 | 0.196 | 0.450 | 0.426 | 0.467 | 0.493 | 0.290 | 0.320 | 0.468 | |
| FSHSTC | 0.179 | 0.232 | 0.416 | 0.280 | 0.309 | 0.504 | 0.238 | 0.267 | 0.474 | |
| DESA | 0.200 | 0.228 | 0.396 | 0.294 | 0.331 | 0.466 | 0.241 | 0.269 | 0.420 | |
| DDESA | 0.308 | 0.310 | 0.157 | 0.398 | 0.387 | 0.181 | 0.355 | 0.334 | 0.163 | |
| 20news Groups | All | 0.115 | 0.145 | 0.413 | 0.386 | 0.424 | 0.559 | 0.261 | 0.296 | 0.499 |
| DE | 0.104 | 0.135 | 0.434 | 0.307 | 0.326 | 0.526 | 0.196 | 0.229 | 0.477 | |
| FSGATC | 0.104 | 0.135 | 0.363 | 0.383 | 0.410 | 0.606 | 0.220 | 0.241 | 0.454 | |
| FSHSTC | 0.143 | 0.160 | 0.501 | 0.334 | 0.349 | 0.609 | 0.215 | 0.237 | 0.549 | |
| DESA | 0.115 | 0.140 | 0.476 | 0.425 | 0.453 | 0.560 | 0.214 | 0.255 | 0.528 | |
| DDESA | 0.235 | 0.225 | 0.308 | 0.392 | 0.406 | 0.540 | 0.340 | 0.324 | 0.386 | |
Table 5.
Reduction rate.
| Method | Dataset | Old Features | New Features | Reduction Rate |
|---|---|---|---|---|
| DE | 6 Event Crimes | 3863 | 1936 | 0.5 |
| 10 Types Crime | 362 | 141 | 0.61 | |
| Reuters-21578, | 9496 | 4688 | 0.51 | |
| 20news Groups | 507 | 189 | 0.63 | |
| Pair 20news Groups | 15,600 | 3697 | 0.76 | |
| FSGATC | 6 Event Crimes | 3863 | 1920 | 0.5 |
| 10 Types Crime | 362 | 183 | 0.49 | |
| Reuters-21578 | 9496 | 4758 | 0.5 | |
| 20news Groups | 507 | 235 | 0.54 | |
| Pair 20news Groups | 15,600 | 3670 | 0.76 | |
| FSHSTC | 6 Event Crimes | 3863 | 1924 | 0.5 |
| 10 Types Crime | 362 | 186 | 0.49 | |
| Reuters-21578 | 9496 | 4770 | 0.5 | |
| 20news Groups | 507 | 250 | 0.51 | |
| Pair 20news Groups | 15,600 | 3710 | 0.76 | |
| DESA | 6 Event Crimes | 3863 | 1910 | 0.51 |
| 10 Types Crime | 362 | 108 | 0.7 | |
| Reuters-21578 | 9496 | 4600 | 0.52 | |
| 20news Groups | 507 | 174 | 0.66 | |
| Pair 20news Groups | 15,600 | 3653 | 0.77 | |
| DDESA | 6 Event Crimes | 3863 | 1892 | 0.51 |
| 10 Types Crime | 362 | 94 | 0.74 | |
| Reuters-21578 | 9496 | 3780 | 0.6 | |
| 20news Groups | 507 | 160 | 0.68 | |
| Pair 20news Groups | 15,600 | 3528 | 0.77 |
© 2020 by the authors. Licensee MDPI, Basel, Switzerland. This article is an open access article distributed under the terms and conditions of the Creative Commons Attribution (CC BY) license (http://creativecommons.org/licenses/by/4.0/).
Share and Cite
MDPI and ACS Style
Al-Jadir, I.; Wong, K.W.; Fung, C.C.; Xie, H. Unsupervised Text Feature Selection Using Memetic Dichotomous Differential Evolution. Algorithms 2020, 13, 131. https://0-doi-org.brum.beds.ac.uk/10.3390/a13060131
AMA Style
Al-Jadir I, Wong KW, Fung CC, Xie H. Unsupervised Text Feature Selection Using Memetic Dichotomous Differential Evolution. Algorithms. 2020; 13(6):131. https://0-doi-org.brum.beds.ac.uk/10.3390/a13060131
Chicago/Turabian StyleAl-Jadir, Ibraheem, Kok Wai Wong, Chun Che Fung, and Hong Xie. 2020. "Unsupervised Text Feature Selection Using Memetic Dichotomous Differential Evolution" Algorithms 13, no. 6: 131. https://0-doi-org.brum.beds.ac.uk/10.3390/a13060131
Note that from the first issue of 2016, this journal uses article numbers instead of page numbers. See further details here.