Capturing Protein Domain Structure and Function Using Self-Supervision on Domain Architectures


1
L3S Research Center, Leibniz University Hannover, 30167 Hannover, Germany
2
Knowledge-Based Systems Laboratory, Leibniz University Hannover, 30167 Hannover, Germany
*
Author to whom correspondence should be addressed.
Algorithms 2021, 14(1), 28; https://0-doi-org.brum.beds.ac.uk/10.3390/a14010028
Submission received: 28 December 2020
/
Revised: 6 January 2021
/
Accepted: 15 January 2021
/
Published: 19 January 2021
Abstract
:Predicting biological properties of unseen proteins is shown to be improved by the use of protein sequence embeddings. However, these sequence embeddings have the caveat that biological metadata do not exist for each amino acid, in order to measure the quality of each unique learned embedding vector separately. Therefore, current sequence embedding cannot be intrinsically evaluated on the degree of their captured biological information in a quantitative manner. We address this drawback by our approach, dom2vec, by learning vector representation for protein domains and not for each amino acid base, as biological metadata do exist for each domain separately. To perform a reliable quantitative intrinsic evaluation in terms of biology knowledge, we selected the metadata related to the most distinctive biological characteristics of a domain, which are its structure, enzymatic, and molecular function. Notably, dom2vec obtains an adequate level of performance in the intrinsic assessment—therefore, we can draw an analogy between the local linguistic features in natural languages and the domain structure and function information in domain architectures. Moreover, we demonstrate the dom2vec applicability on protein prediction tasks, by comparing it with state-of-the-art sequence embeddings in three downstream tasks. We show that dom2vec outperforms sequence embeddings for toxin and enzymatic function prediction and is comparable with sequence embeddings in cellular location prediction.
1. Introduction
A primary way in which proteins evolve is through rearrangement of their functional/structural units, known as protein domains [1,2]. The domains are independent folding and functional modules, and thus they exhibit conserved sequence segments. Prediction algorithms exploited this information and used, as input features, the domain composition of a protein for various tasks. For example, [3] classified the cellular location, and [4,5] predicted the associated Gene Ontology (GO) terms. There exist two ways to represent domains; either by the linear order in a protein, domain architectures [6], or by a graph where nodes are domains and edges connect domains that co-exist in a protein [1,2].
Moreover, [7] investigated whether the domain architectures had grammar as a natural spoken language. They compared the bi-gram entropy of domain architectures for Pfam domains [8] to the respective entropy of the English language, showing that although it was lower than the English language, it was significantly different from a language produced after shuffling the domains. Prior to this result, methods had exploited the domain architecture representation to various applications, such as fast homology search [9] and retrieval of similar proteins [10].
Word embeddings are unsupervised learning methods which have, as input, large corpora, and where they output a dense vector representation of words contained in the sentences of these documents based on the distributional semantic hypothesis, that is, the meaning of a word can be understood by its context. Thus, a word vector represents local linguistic features, such as lexical or semantical information, of the respective word. Several methods to train word embeddings have been established, for example, [11,12,13]. These representations have been shown to hold several properties, such as analogy and grouping of semantically similar words [14,15]. Importantly, these properties are learned without the need of a labeled data set. Word embeddings are currently the mainstream input for neural networks in the Natural Language Processing (NLP) field, as firstly, they reduce the feature space, compared to 1-hot representation, and secondly, they provide word features that encapsulate relations between words based on linguistic features. The use of word embeddings improved the performance on most of the tasks, such as sentiment analysis or Named Entity Recognition (NER) [16].
Various methods used to create embeddings for proteins have been proposed [17,18,19,20,21,22,23]. ProtVec fragmented the protein sequence in 3-mers for all possible starting shifts, then learned embeddings for each 3-mer and represented the respective protein as the average of its constituting 3-mer vectors [17]. SeqVec utilized and extended the Embeddings from Language Models (ELMo) [24] to learn a dense representation per amino acid residue, resulting in matrix representations of proteins, created by concatenating their learned residue vectors [21].
Focusing on their word segmentation, we note that learning embeddings for each amino acid or 3-mer may not always reflect evolutionary signals. That is, a pair of proteins with low sequence similarity is still a member of the same protein super-family, preserving similar function [25].
The previous embedding approaches evaluated the learned representations intrinsically, in a qualitative manner. They averaged out the whole protein amino acid embeddings to compute the aggregated vector. Then, known biological characteristics of proteins are used, such as biophysical, chemical, structural, enzymatic, and taxonomic, as distinct colors in a reduced 2-D embedding space. In such visualizations, previous embedding approaches reported the appearance of distinct clusters of proteins, each consisting of proteins with similar properties. For downstream evaluation, they measured the improvement of performance in downstream tasks.
Concerning the qualitative intrinsic evaluation, two caveats exist. First, researchers averaged out the protein amino acid vectors, where consequently, this qualitative evaluation is not related in a straightforward way with each learned embedding vector trained per amino-acid. In addition, this averaging-out operation may not reveal the function of the most important sites of a protein, meaning the comparative result holds a low degree of biological significance. Second, we argue that the presented qualitative evaluations lack the ability to assess different learned embeddings in a sophisticated manner. This is because there is no systematic way to quantitatively compare 2-D plots of reduced embedding spaces, each produced by a protein-embedding method in investigation.
Indeed for word embeddings, there has been an increase in methods to evaluate word representations intrinsically and in a quantitative manner, such as [26,27]. Having such evaluation metrics allows us to validate the knowledge acquired per each word vector and use the best-performing space for downstream tasks. However, intrinsic evaluations of current amino acid embedding representations are prevented by incomplete biological metadata at amino acid level, for all disposed proteins, in the UniProtKnowledgeBase (UniProtKB) [28].
To address this limitation in quantitative intrinsic evaluations of protein sequence embeddings, we present our approach with five major contributions:
- Our dom2vec approach is developed, in which words are InterPro annotations and sentences are the domain architectures. Then, we use the word2vec method to learn the embedding vector representation for each InterPro annotation.
- A quantitative intrinsic evaluation method is established based on the most significant biological information for a domain—its structure and function. First, we evaluated the learned embedding space for domain hierarchy comparing known domain parent–children relations to cosine similarity of the parent domain. Then, we investigated the performance of a nearest neighbor classifier, , to predict the secondary structure class provided by SCOPe secondary structure class [29] and the Enzyme Commission (EC) primary class. Finally, we equally examined the performance of the classifier to predict the GO molecular function class for three example model organisms and one human pathogen.
- Strikingly, we observed that reaches adequate accuracy, compared to on randomized domains vectors, for secondary structure, enzymatic function, and GO molecular function. Thus, we hypothesized an analogy between word embedding clustering by local linguistic features and protein domains clustering by domain structure and function.
- To evaluate our embeddings extrinsically, we inputted the learned domains embeddings to simple neural networks and compared their performance with state-of-the-art protein sequence embeddings in three full-protein tasks. We surpassed both SeqVec and ProtVec for the toxin presence and enzymatic primary function prediction task, and we reported comparable results in the cellular location prediction task.
- The pre-trained protein domain embeddings are available online at https://0-doi-org.brum.beds.ac.uk/10.25835/0039431, to be used by the research community.
The remainder of the paper is organized as follows: related work on protein embeddings is reviewed in Section 2. The methodology used to train and evaluate dom2vec embeddings is described in Section 3. The intrinsic and extrinsic evaluation results are presented in Section 4. In Section 5, we conclude.
2. Background
Current studies on protein embeddings are evaluated intrinsically and extrinsically. In extrinsic evaluation, prediction measures, like performance on a supervised learning task, are most commonly used to evaluate the quality of embeddings. For example, the ProtVec work [17] evaluated their proposed embeddings extrinsically by measuring their performance in predicting protein family and disorder. SeqVec [21] assessed their embeddings extrinsically by measuring performance on protein-level tasks, prediction of sub-cellular localization and water solubility, and residue-level tasks, and prediction of the functional effect of single amino acid mutations. However, extrinsic evaluation methods are based on a downstream prediction task, thus not measuring the biological information captured by each learned subsequence vector separately.
Previous studies evaluated the quality of their sequence embeddings intrinsically, by averaging the amino acid embedding vectors per protein and then drawing t-SNE visualizations [30] using distinct biological labels of a protein as colors, such as taxonomy, SCOPe, and EC primary class. However, this qualitative assessment hinders the selection of the best-performing embeddings, irrespective of the downstream task, because there is not a sophisticated method to rank 2-D visualizations.
Nevertheless, in NLP, the quality of a learned word embedding space is often evaluated intrinsically in a quantitative manner by considering relationships among words, such as analogies. Compared to qualitative evaluation, quantitative intrinsic evaluation enables assessment of the degree of biological information captured by the embeddings. This advantage allows us to choose the best set of parameters to create the embeddings that contain the highest degree of meaningful information without choosing a specific downstream task.
From all discussed protein embeddings studies, only [23] developed quantitative intrinsic evaluation methods. To benchmark their Pfam domain embeddings, they used the following three experiments. First, they benchmarked the performance of the nearest neighbor classifier predicting the three main GO ontologies of a Pfam using its embedding vector. Second, they assessed the Matthew’s correlation coefficient [31] between Pfam embedding and first-order Markov encodings. They also assessed the vector arithmetic to compare GO conceptual binary assignment—for example, one pair was intracellular (GO:0005622) vs. extracellular (GO:0005615).
Our approach differs from [23] in four main points. First, we trained embeddings for all domain annotations of all proteins available in Interpro. That is, we included all available InterPro annotations, consisting of super-family, family, single domains, and functional sites, as “words” input to the word2vec method. Therefore, we used a broader set of annotations for the whole spectrum of organisms. Besides, word2vec was developed for sentences of natural languages, which have a moderate number of words. In order to copy with this assumption for the sentence length, we resolved overlapping and redundant annotations in order to increase the number of InterPro annotations, making our input more suitable for the word2vec method. Second, we benchmarked over the two word2vec models (CBOW and SKIP) and their parameters for each experiment of our quantitative intrinsic evaluation step, and consequently, we used our assessment to choose the best embedding space. Third, we established three unique intrinsic evaluation benchmarks for domain hierarchy, SCOPe secondary structure, and EC primary class. Lastly, our approach was also extrinsically evaluated on three downstream tasks in order to show that dom2vec embeddings can surpass or be comparable to state-of-the-art protein sequence embeddings.
3. Materials and Methods
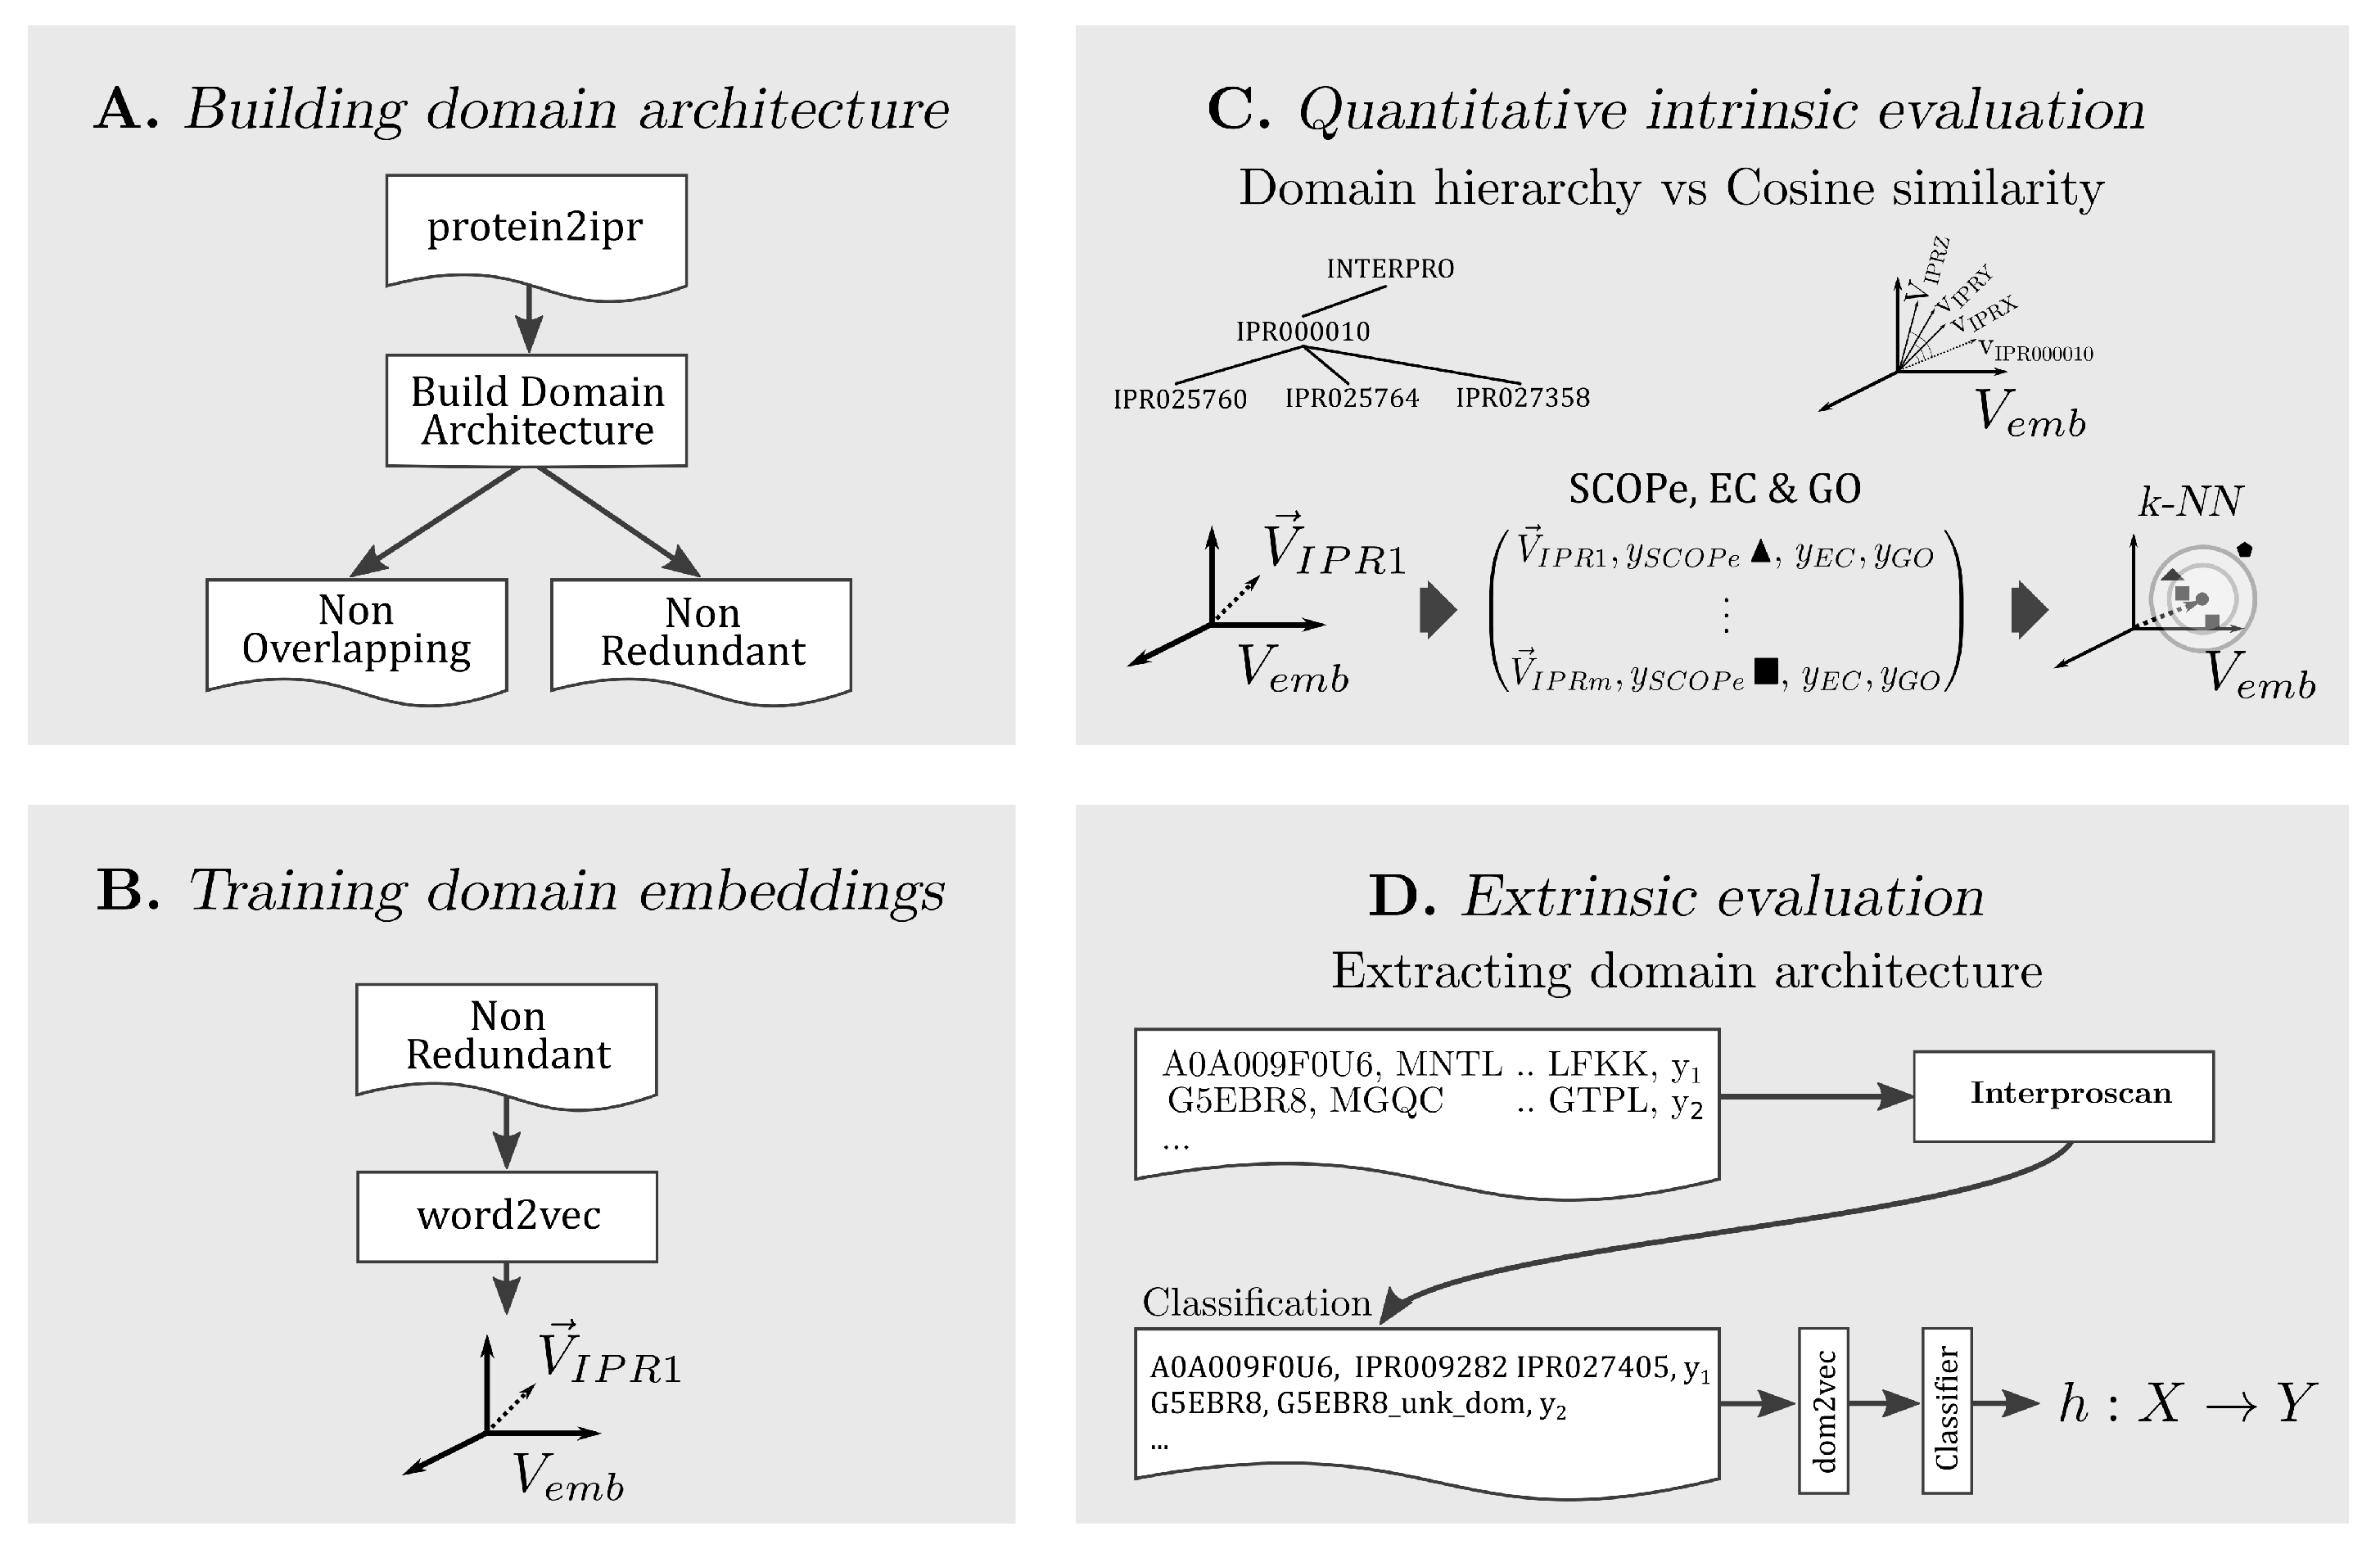
In the following, the methodology for each part of our approach is explained. A conceptual summary is presented in Figure 1.
3.1. Building Domain Architectures
The InterPro database contains functional annotations for super-family, family, and single domains, as well as functional protein sites. Hereafter, we will refer to all such functional annotations as InterPro annotations. Furthermore, we will denote by domain architectures the ordered arrangement of domains in a protein. We consider two distinct strategies to represent a protein based on its domain architecture, consisting of either non-overlapping or non-redundant annotations. For both annotation types, we insert each annotation, based on the annotation’s beginning and end, in an interval tree . For each entry of the , we save the annotation InterPro identifier, significance score, and length. Based on the annotation type, we apply the following two distinct strategies to create the linear domain architectures:
Non-overlapping annotations. For each overlapping region in a protein, we keep the longest annotation out of all overlapping ones. Annotations of non-overlapping regions are included.
Non-redundant annotations. For each overlapping region in a protein, we keep all annotations with a distinct InterPro identifier. We break ties for annotations with the equal InterPro identifier by filtering in the longest one. Similarly, we keep annotations of non-overlapping regions.
For both annotation types, we sort the filtered-in annotations by their starting position. Finally, following the approach of [5], we also added the “GAP” domain to annotate more than 30 amino acid sub-sequences, which does not match any InterPro annotation entry.
An example of the resulting domain architectures for the Diphthine synthase protein is shown in Figure 2. All domains are overlapping, with the largest one colored in blue, and the non-overlapping annotation is the single longest domain (IPR035966). All other domains have a unique InterProID; therefore, the set of non-redundant InterPro annotations includes all presented domains which are sorted with respect to their starting position, and colored in green.
Applying the previous steps for all annotated proteins produces the domain architectures, constituting the input corpus to the following embedding module.
3.2. Training Domain Embeddings
Given a protein, we assumed that words were its resolved InterPro annotations and sentences were the protein domain architectures. By this assumption, we learned task-independent embeddings for each InterPro annotation using two variants of word2vec: a continuous bag of words and skip-gram model, hereafter denoted as CBOW and SKIP respectively. See [12] for technical details on the difference between these approaches. Through this training, each InterPro annotation is associated with a task-independent embedding vector.
3.3. Quantitative Intrinsic Evaluation
In the following, we use the metadata for the most characteristic properties of domains, in order to evaluate the learned embedding space for various hyper-parameters of word2vec. We propose four intrinsic evaluation approaches for domain embeddings: domain hierarchy based on the family/subfamily relation, SCOPe secondary structure class, EC primary class, and GO molecular function annotation.
We refer to the embedding space learned by word2vec for a particular set of hyperparameters as . The k nearest neighbors of a domain d is found by using the Euclidean distance, and it is denoted as .
To inspect the relative performance of on each of the following evaluations, we randomized all domain vectors and ran each evaluation task. That is, we assigned to each domain vector a newly created random vector, for each unique dimensionality of embedding space, irrespective of all other embedding method parameters.
Domain Hierarchy
InterPro defines a strict family–subfamily relationship among domains. This relationship is based on sequence similarity of the domain signatures. We refer to the children of domain p as . We use these relationships to evaluate an embedding space, posing the following research question,
: Did vectors of hierarchically close domains form clusters in the ?
Evaluation We predicted the closest domains on cosine similarity of their vector to the parent vector, and we denote this predicted set as . For all learned embedding spaces, we measured their recall performance, , defined as follows:
SCOPe Secondary Structure Class
We extracted the secondary structure of Interpro domains from the SCOPe database and formed the following research question,
: Did vectors of domains, with same secondary structure class, form clusters in the ?
Evaluation We evaluated by retrieving of each domain. Then, we applied stratified 5-fold cross-validation and measured the performance of a k-nearest neighbor classifier to predict the structure class of each domain. The intrinsic evaluation performance metric is the average accuracy across all folds, .
EC Primary Class
The enzymatic activity of each domain is given by its primary EC class [32] and we pose the following research question,
: Did vectors of domains, with the same enzymatic primary class, form clusters in the ?
Evaluation We again evaluate using k nearest neighbors in a stratified 5-fold cross-validation setting. The average accuracy across all folds, , is again used to quantify the intrinsic quality of the embedding space.
GO Molecular Function
For our last intrinsic evaluation, we aimed to assess using the molecular function GO annotation. We extracted all molecular function GO annotations associated with each domain. In order to account for differences in specificity of different GO annotations, we always used the depth-1 ancestor of each annotation, that is, children of the root molecular function term, GO:0003674.
Since model organisms have the most-annotated proteins, we created GO molecular function data sets for one example of prokaryote (Escherichia coli, denoted E. coli); one example of a simple eukaryote (Saccharomyces cerevisiae, denoted S.cerevisiae); and one complex eukaryote (Homo sapiens, denoted Human). To also assess our embeddings for not highly annotated organisms, we included a molecular function data set for an example of a human pathogen (Plasmodium falciparum, denoted as Malaria). Finally, we pose the following research question,
: Did vectors of domains, with the same GO molecular function, form clusters in the ?
Evaluation Similarly, k nearest neighbors is used here in a stratified 5-cross-validation setting. Average accuracy across all folds, , is again used to quantify performance.
3.4. Qualitative Evaluation
As a preliminary evaluation strategy, we used qualitative evaluation approaches adopted in an existing work. To follow the qualitative approach of ProtVec and SeqVec we also visualized the embedding space for selected domain superfamilies, to answer the following research question,
: Did vectors of each domain superfamily form a cluster in the ?
Evaluation First, we added the vector of each domain in a randomly chosen domain superfamily to an empty space. Then, we performed principle component analysis (PCA) [33] to reduce the space in two dimensions, and observed the formed clusters.
3.5. Extrinsic Evaluation
In addition, we assessed the learned by examining the performance change in downstream tasks. For the three supervised tasks, TargetP, Toxin, and NEW, the domain representations were used as input in simple neural networks. Next, our model performance was compared to the state-of-the-art protein embeddings, ProtVec and SeqVec.
TargetP
This data set is about predicting the cellular location of a given protein. We downloaded the TargetP data set provided by [34], and we also used the non-plant data set. This data set consists of 2738 proteins accompanied by their uniprot ID, sequence, and cellular location label, which can be nuclear, cytosol, pathway, or signal and mitochondrial. Finally, we removed all instances with a duplicate set of domains, resulting in a total of 2418. This is a multi-class task, and its class distribution is summarized in Appendix E.
Evaluation For the TargetP, we used the mc-AuROC performance metric.
Toxin
The research work [35] introduced a data set associating protein sequence to toxic or other physiological content. We used the hard setting, which provides a uniprot ID, sequence, and the label toxin content or non-toxin content, for 15,496 proteins. Finally, we kept only the proteins with unique domain composition, resulting in 2270 protein instances in total. This is a binary task, and the class distribution is shown in Appendix E.
Evaluation As the Toxin data set is a binary task, we used AuROC as a performance metric.
NEW
The NEW data set [36] contains the data for predicting the enzymatic function of proteins. For each of the 22,618 proteins, the data set provides the sequence and the EC number class. The primary enzyme class, the first digit of an EC number, is our label on this prediction task, resulting in a multi-class task. Finally, we removed all instances with duplicate domain composition, resulting in a total of 14,434 protein instances. The possible classes are six, and the class distribution is shown in Appendix E.
Evaluation The NEW data set is a multi-class task; thus, we used mc-AuROC as a performance metric.
3.5.1. Data Partitioning
We divided each data set into 70/30% train and test splits. To perform model selection, we created inner three-fold cross-validation sets on the train split.
Out-of-vocabulary experiment We observed that the performance of classifiers depending on protein domains was highly dependent on the out-of-vocabulary (OOV) domains, as first discussed in [37]. OOV domains are all the domains contained in the test set, but not in the train. For TargetP, Toxin, and NEW, we observed that approximately 60%, 20%, and 20% of test proteins contained at least one OOV domain, respectively.
For the TargetP containing the highest OOV, we experimented to compensate for the high degree of OOV. We split the test set into shorter sets by an increasing degree of OOV, namely 0%, 10%, 30%, 50%, 70%, and 100%. Then, we trained models for the whole train set and benchmarked the performance on each of these test subsets.
Generalization experiment For the Toxin and NEW data sets, experiencing low OOV, we sought to investigate the generalization of the produced classifier. We increased the number of training examples that the model was allowed to learn from and we benchmarked always in the entire test set. To do so, we created training splits of size 10%, 20%, and 50% of the whole train set. To perform significance testing, we trained on 10 random subsamples for each training split percentage, and then tested on the separate step set. We used the paired sample t-test, the Benjamini–Hochberg multiple-test, to compare the performance between a pair of classifiers on the test set.
3.5.2. Simple Neural Models for Prediction
We consider a set of simple, well-established neural models to combine the InterPro annotation embeddings for each protein to perform downstream tasks, that is, for extrinsic evaluation tasks. In particular, we use FastText [38], convolutional neural networks (CNNs) [39], and recurrent neural networks (RNNs) with long- and short-term memory (LSTM) cells [40] and bi-directional LSTMs.
4. Results
4.1. Building Domain Architecture
We used the domain hits for UniProt proteins from InterPro version 75, containing 128,660,257 proteins with an InterPro signature, making up 80.9% of the total UniProtKB proteome (version 2019_06). For all these proteins, we extracted the non-overlapping and non-redundant sequences, which we process in the next section. The number of unique non-overlapping sequence was (35,183 + 1), where the added “GAP” domain and non-redundant domain was (36,872 + 1) plus the “GAP”. Comparing this to the total number of domains in InterPro version 75, which was 36,872, we observed that non-overlapping InterPro annotations captured 95.42%, and the non-redundant domain captured 100% of the InterPro annotation entries. To enable visual comparison of the created type of domain architectures versus the downloaded InterPro annotations, in Figure 2 we illustrate the non-overlapping and non-redundant domain architectures of the Diphthine synthase protein. This same protein, Diphthine synthase, was picked as an example illustration for annotations in the latest InterPro work [41].
4.2. Training Domain Embeddings
Domain Architectures
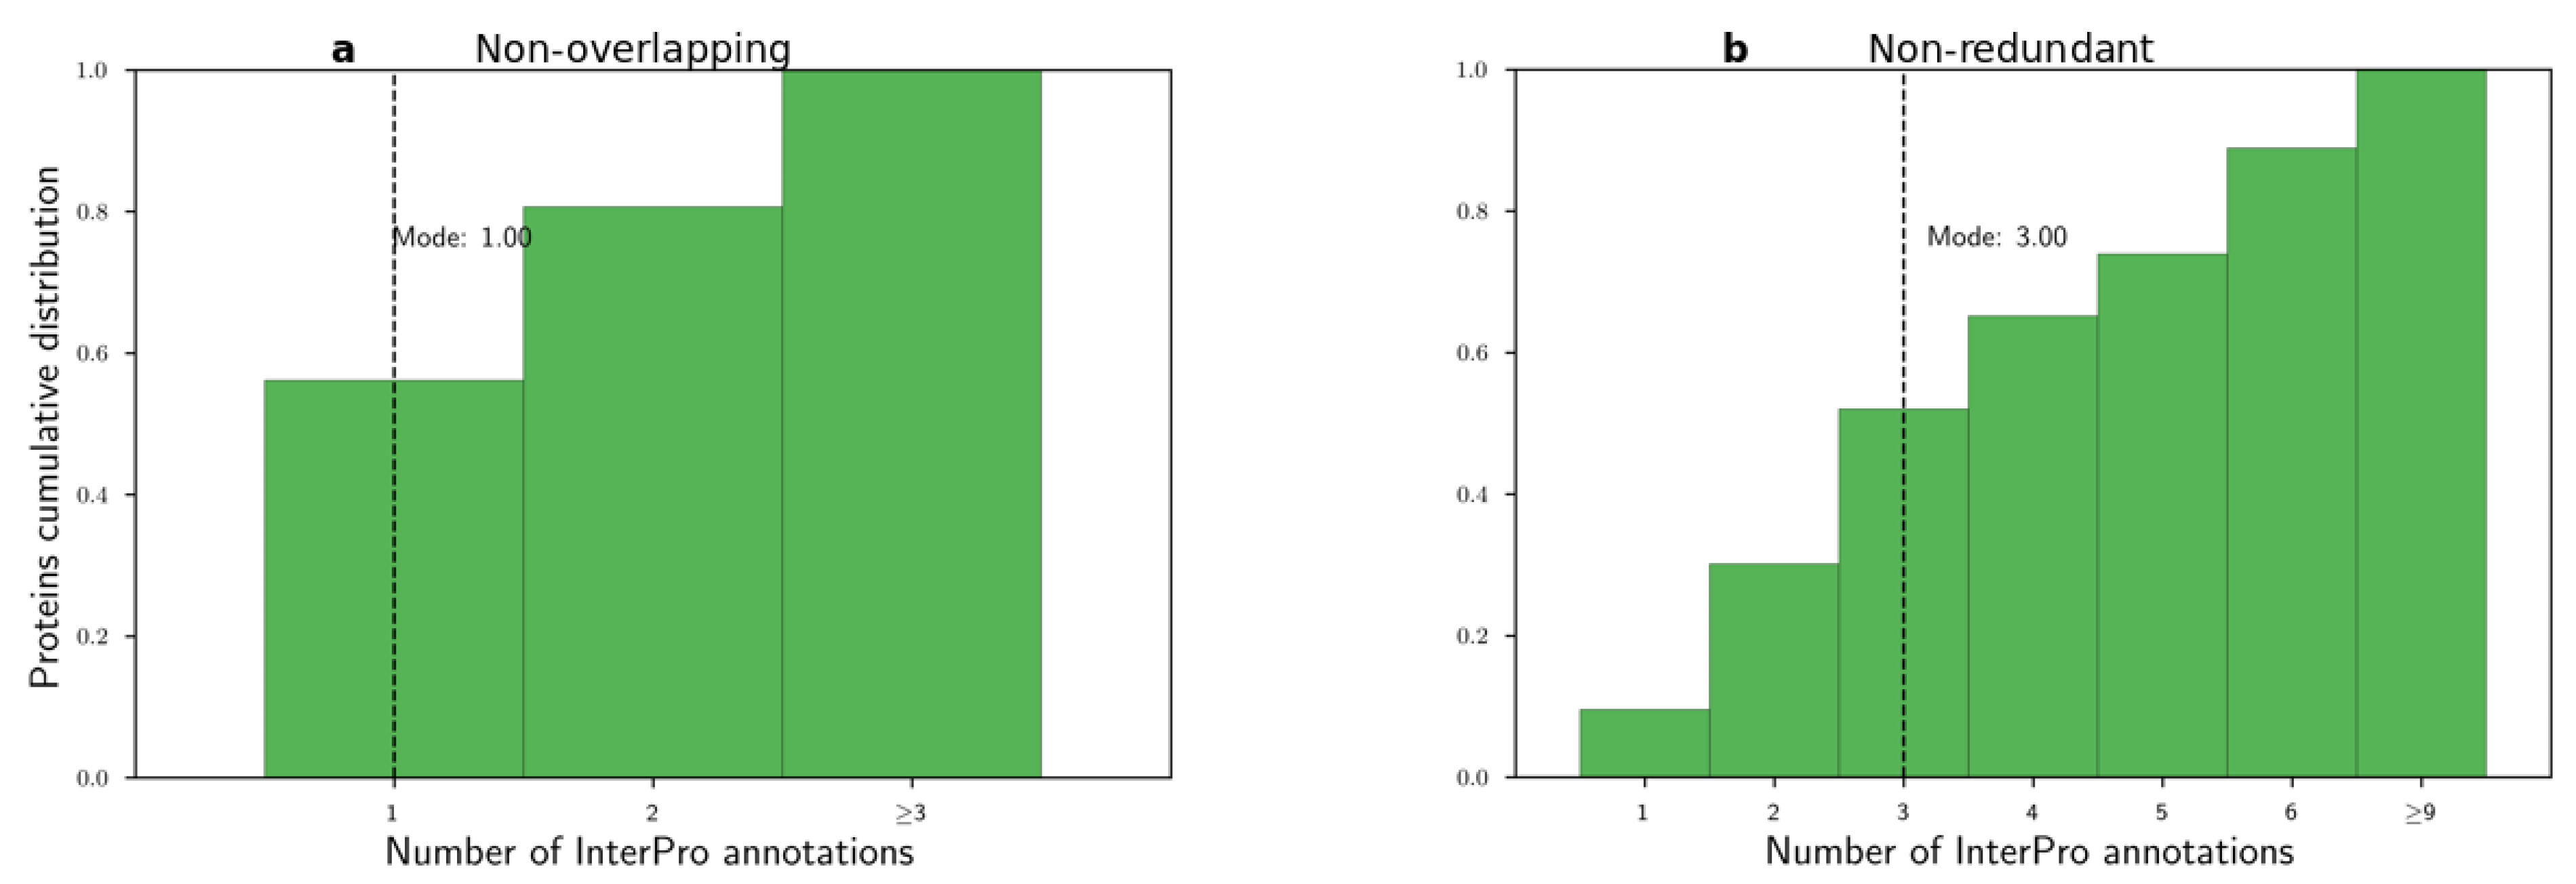
Before applying the word2vec method, we examined the histograms of the number of non-overlapping and non-redundant InterPro annotations per protein in Figure 3. We observed that these distributions were long-tailed with modes equal to 1 and 3, respectively. Then, we used both CBOW and SKIP algorithms to learn domain embeddings. We used the following parameter sets. Based on the histograms, we selected the context window parameter for the word to be 2 or 5, . For the number of dimensions, we used common values from the NLP literature, . We trained the embeddings from 5 to 50 epochs with step size 5 epochs . Finally, all other parameters were set to their default values. For example, the negative sampling parameter was set to default, = 5.
4.3. Quantitative Intrinsic Evaluation
In the following, we evaluated each instance of learned embedding space for both non-overlapping and non-redundant representations of domain architectures. An instance of space is the embedding space learned for a combination of the product . Consequently, the total number of embedding space instances is . Let denote such an embedding space instance. In the following subsection, we evaluated each for domain hierarchy, secondary structure, enzymatic primary class, and GO molecular function. Finally, all reported performances are shown for the best-performing epoch value (). Results are shown in Table 1.
4.3.1. : Did Vectors of Hierarchically Close Domains Form Clusters in the ?
For the first research question, we loaded the parent–child tree , provided by InterPro, consisting of 2430 parent domains. Then, for each , we compared the actual and predicted children of each parent, and we averaged out the recall for all parents. For ease of presentation, we show only the results for non-redundant InterPro annotations at Table 1a, and we provide the complete results in the Appendix A.
From Table A1 and Table 1a (Appendix A), we observed that SKIP performed better overall, and the embeddings learned from non-redundant InterPro annotations always had better average recall values compared to the non-overlapping ones. The best-performing achieved average of 0.538. We compared this moderate performance of with the performance of the randomized spaces, which was equal to 0. We concluded that our embedding spaces greatly outperformed each randomized space for domain hierarchy relation. Therefore, we admitted that the majority of domains of the same hierarchy were placed in close proximity in the embedding space.
4.3.2. : Did Vectors of Domains with the Same Secondary Structure Class Form Clusters in the ?
We extracted the SCOPe class for each InterPro domain. This resulted in 25,196 domains with an unknown secondary structure class, 9411 with a single secondary structure class, and 2265 domains with more than one assigned class (multi-label). For clarity, we removed all multi-label and unknown instances, resulting in 9411 single-labeled instances. The class distribution of the resulting data set is shown in Appendix B.
We measured the performance of the classifier in each to examine the homogeneity of the space with respect to the SCOPe class. We split the 9411 domains in 5-fold stratified cross-validation sets. To test the change in prediction accuracy for an increasing number of neighbors, we used different sets of neighbors, namely, . We summarized the results for the best-performing , which was for non-redundant InterPro annotations in Table 1b. We show the respective table for non-overlapping InterPro annotations in Appendix B. We compared these accuracy measurements to the respective ones of the random spaces, and we found that the lowest accuracy values, achieved for (non-overlapping, CBOW, w = 5, = 200, = 15), as shown in Appendix Table A2, are twice as high as the accuracy values of the random spaces for all possible dimensions. Consequently, we concluded that domain embeddings of the same secondary structure class formed distinct clusters in the learned embedding space.
4.3.3. : Did Vectors of Domains, with the Same Enzymatic Primary Class, Form Clusters in the ?
We processed the EC primary class, resulting in 29,354 domains with unknown EC, 7248 domains with only one EC, and 721 with more than one EC. As before, we removed all multi-label and unknown instances, leaving 7428 domains with known EC. We augmented a domain instance with its vector representation for each , and then we used to predict the EC label. See Appendix C for the class distribution of the EC task.
We reported the average obtained in embedding spaces learned using non-redundant InterPro annotations in Table 1c. We show the respective table for non-overlapping in Appendix C. We compared these accuracy measurements to the respective ones of the random spaces. We found that the minimum average value was equal to 60.51 and was achieved using (non-overlapping, CBOW, w = 5, = 200, = 15), presented in Appendix Table A3. That value was approximately twice as large as the accuracy values of the random spaces for all possible dimensions; the maximum average for random space with = 100 was 32.64. Hence, we were able to accept that domain embeddings of the same EC primary class formed distinct clusters in a learned embedding space.
4.3.4. : Did Vectors of Domains with the Same GO Molecular Function Form Clusters in the ?
We parsed the GO annotation file of InterPro to extract first-level GO molecular function for domains for the four organisms. We followed the same methodology to examine the homogeneity of a with respect to GO molecular function annotations. For each , we augmented each domain by its vector and its GO label, and we classified each domain using . As before, we used 5-fold stratified cross-validation for evaluation. In our experiments, we varied the number of neighbors to test its influence on the change of performance.
For space limitations, we summarized the performances showing only the best average accuracy over the number of neighbors. For ease of presentation, we omitted the result tables for the first three organisms and show only that for Human, but we discuss the results for all organisms. See Appendix D for full results.
For Malaria, the best average accuracy was 76.86 (non-redundant, SKIP, w = 5, = 100, = 40) and the minimum was 56.94 (non-overlapping, CBOW, w = 5, = 100, = 10), presented in Table A4b,c respectively. We compared this moderate minimum accuracy to the maximum level of accuracy obtained by the randomized embedding space, which was 47.57 for = 200. Therefore, we concluded that dom2vec embeddings outperformed the random baseline by at least 10 percent.
For E. coli, the best accuracy score was 81.72 (non-redundant, SKIP, w = 5, = 50, = 5), and the minimum was 67.34 (non-overlapping, CBOW, w = 2, = 200, = 5), shown in Table A5b,c respectively. Compared with the random baseline, achieving a best accuracy score of 64.46, we observed that, again, dom2vec was able to surpass the random baseline.
For Yeast, the best accuracy score was 75.10 (non-redundant, SKIP, w = 5, = 50, = 50), and the minimum accuracy value was 59.82 (non-overlapping, CBOW, w = 5, = 50, = 50), presented in Table A6b,c respectively. We contrasted this to the maximum accuracy level obtained in a random space, which was 53.73 (achieved for = 100), to report that dom2vec vectors in captured GO molecular function classes at a much higher degree than randomized vectors.
For Human, the best average performance for non-redundant InterPro annotations are shown in Table 1d. The best average accuracy level was 75.96, scored by 2-NN for (non-redundant, SKIP, w = 5, = 50, = 40). The minimum accuracy value was 57.7, obtained by (non-overlapping, CBOW, w = 2, = 50, = 10) shown in Table A7b. The best performance of a random space was 37.36 (Table A7b). We compared the minimum accuracy level of trained spaces with the best of the random spaces. We found that the minimum accuracy achieved in the dom2vec spaces was 20 percentage values higher than the best performance of the random space.
For all four example organisms, we observed that the SKIP on non-redundant InterPro annotations produced , in which achieved the best average accuracy. For three out of the four organisms, the best performances were achieved for the lowest number of dimensions ( = 50). In all cases, we found that the worst-performing dom2vec embeddings outperformed the random baselines. By these findings, we affirmed that domain embeddings of the same GO molecular function class formed distinct clusters in the learned embedding space.
4.4. Concluding on Quantitative Intrinsic Evaluation
Based on the previous four experiments, we aimed to evaluate the learned spaces and select the best domain embedding space for downstream tasks. In all experiments, the non-redundant InterPro annotations created better-performing embedding spaces compared to non-overlapping annotations. We reached this finding by comparing the modes of a number of annotations per protein for the two annotation types, Figure 3. We hypothesized that, by the very low mode for non-overlapping annotations, a mode equal to one annotation, the word2vec method could not produce embeddings for even the stringent context window value of two. In contrast, 52% of proteins contained less than or equal to three non-redundant InterPro annotations.
This makes SKIP able to produce embedding spaces by attaining the best intrinsic performance. From the individual results, we saw that the configuration of parameters (non-redundant, SKIP, w = 5, = 50) brought the best results in performance for SCOPe, EC, and GO for E. coli, Yeast, Human, second best for Malaria, and the sixth best recall (0.507) for the domain hierarchy relation. Therefore, we will denote as , the space produced by (non-redundant, SKIP, w = 5, = 50, = 50).
4.5. Qualitative Evaluation
: Did Vectors of Each Domain Superfamily Form a Cluster in the ?
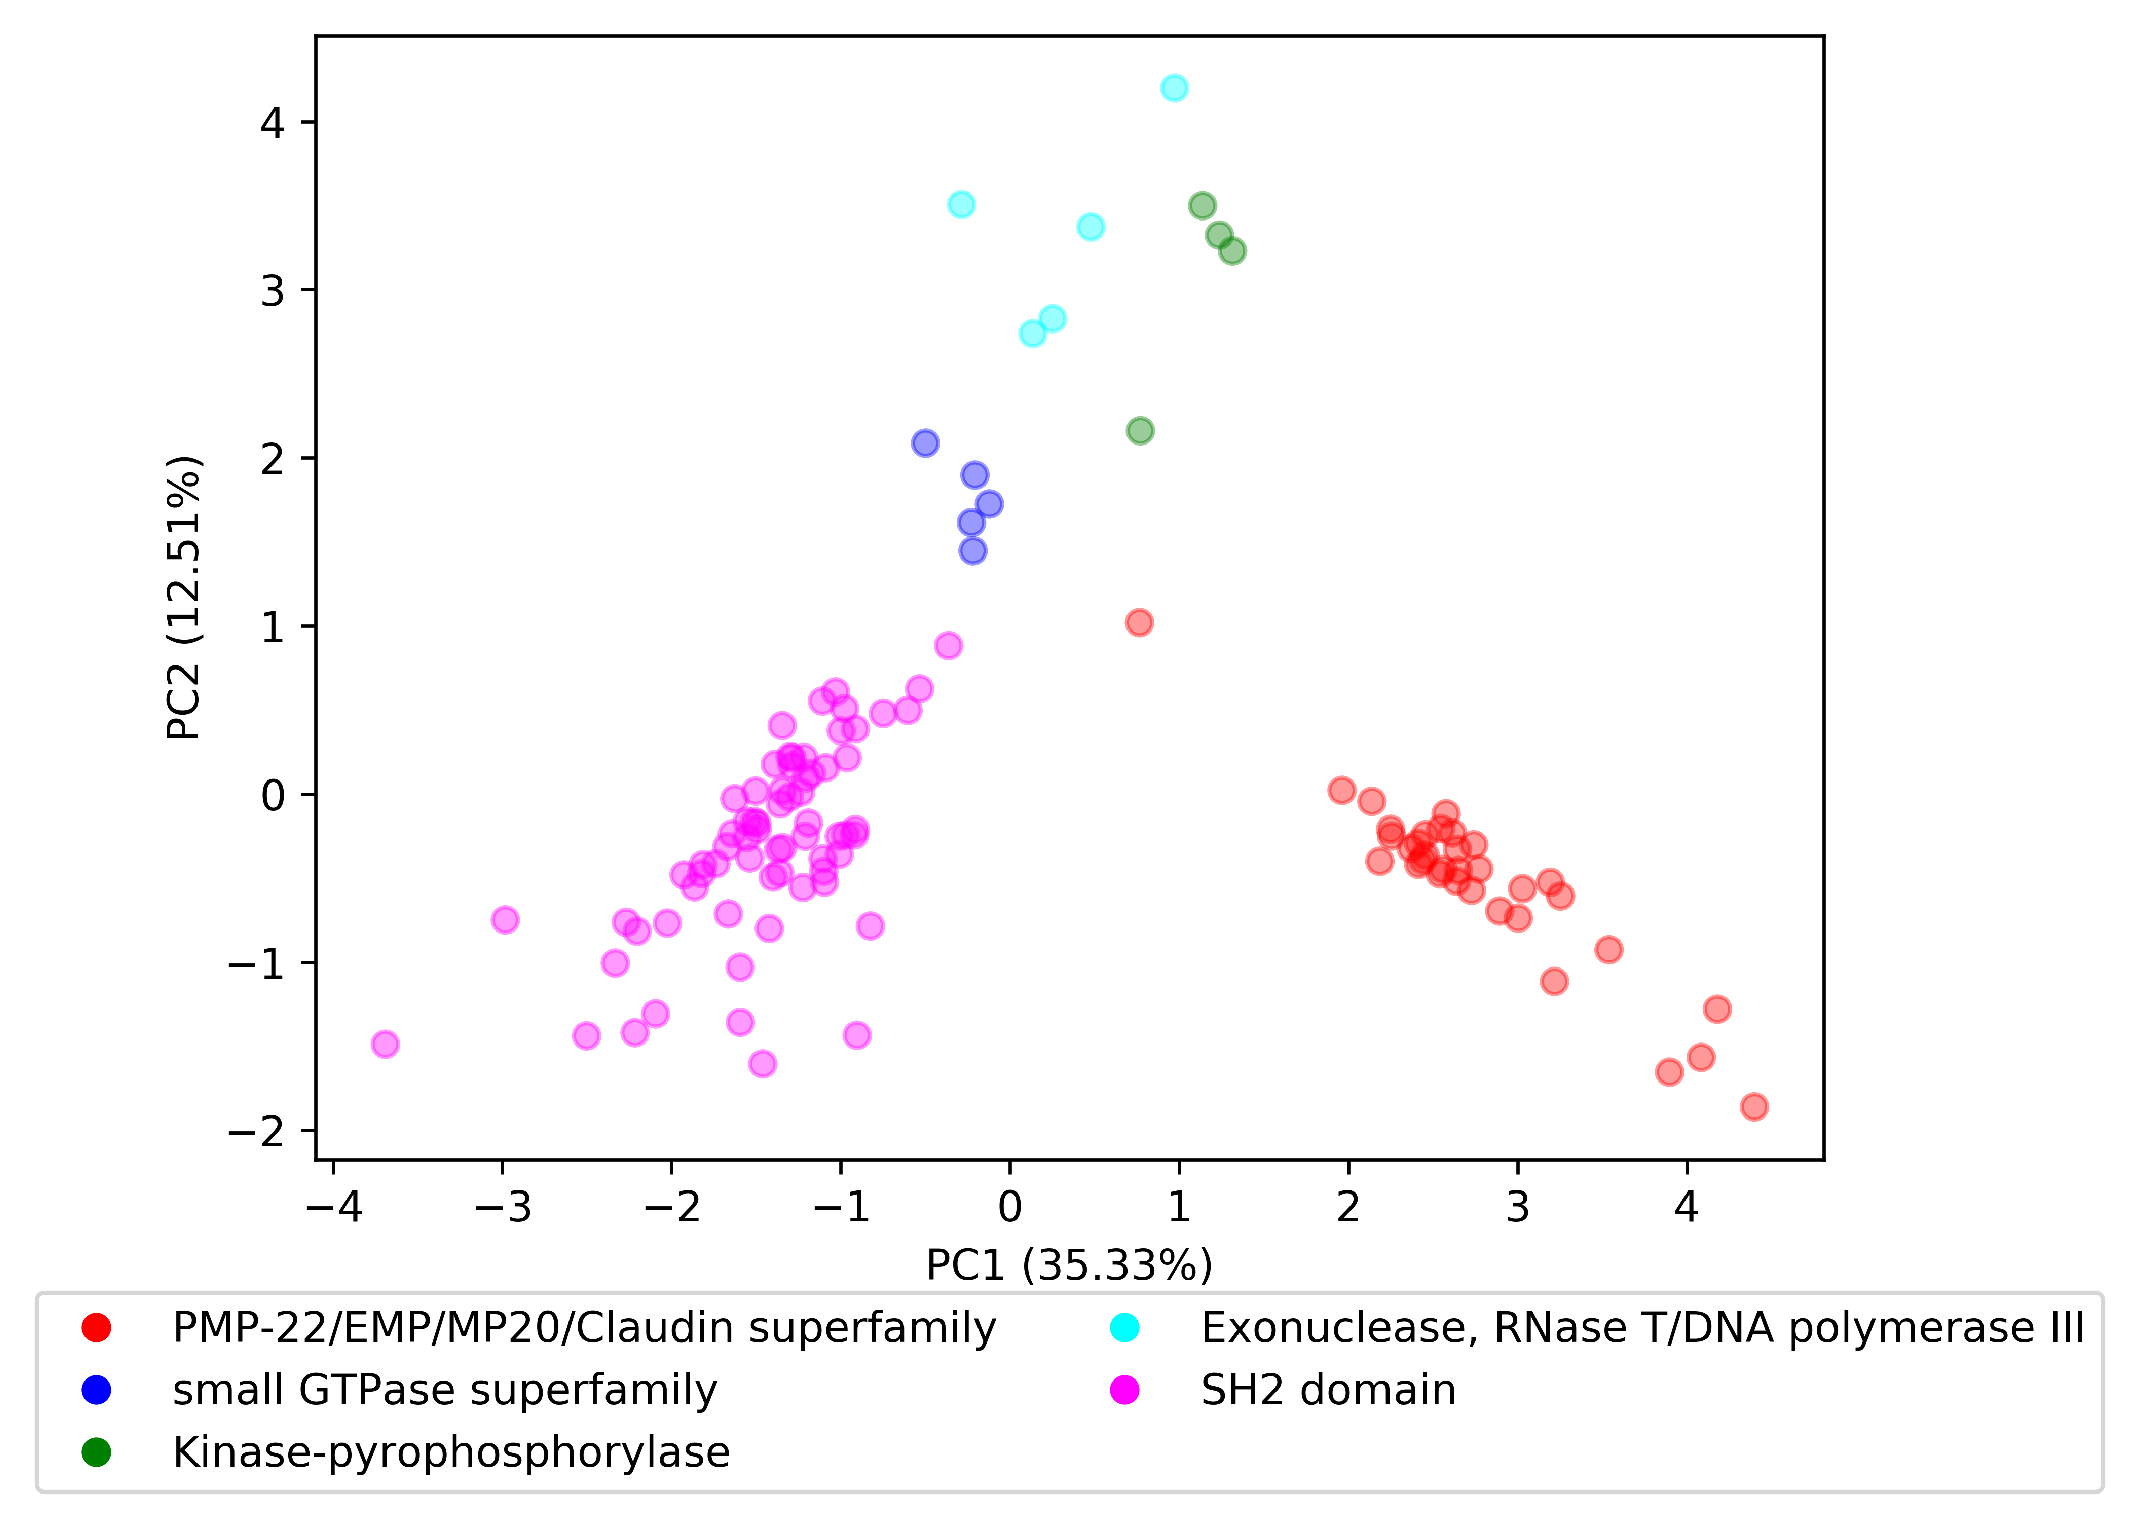
To explore the in terms of the last research question, , we randomly selected five InterPro domain superfamilies to perform the visualization experiment. The selected domain superfamilies were PMP-22/EMP/MP20/Claudin superfamily with parent InterPro id IPR004031, small GTPase superfamily with parent InterPro id IPR006689, Kinase-pyrophosphorylase with parent InterPro id IPR005177, Exonuclease, RNase T/DNA polymerase III with parent InterPro id IPR013520, and SH2 domain with parent InterPro id IPR000980.
We loaded the parent–child tree , provided by InterPro, and for each domain superfamily starting from the parent domain, we included recursively all domains that had a subfamily relationship with this parent domain. For example, the Kinase-pyrophosphorylase domain superfamily had domain parent IPR005177, which in turn had two immediate domain subfamilies IPR026530 and IPR026565. The IPR026565 domain contained a subfamily domain with ID IPR017409, where consequently, the set of domains for Kinase-pyrophosphorylase domain superfamily was {IPR005177, IPR026530, IPR026565, and IPR017409}. We retrieved the vectors for each domain in each superfamily in the . Finally, we applied principal component analysis (PCA) to produce a two-dimensional space.
Visualization of the reduced space is depicted in Figure 4. Domain embeddings of each superfamily are organized in well-separated clusters. The cluster of the Exonuclease, RNase T/DNA polymerase III superfamily had the highest dispersion of all presented superfamilies. By this finding, we could answer the research question with the following: Embedding vectors of the same superfamily are well-clustered in the trained .
4.6. Extrinsic Evaluation
4.6.1. Extracting Domain Architectures
For each data set that contained the UniProt identifier for the protein instance, we extracted the domain architectures for non-redundant InterPro annotations, already created in Section “Building domain architectures”. For all proteins whose UniProt identifier could not be matched, or for data sets not providing the protein identifier, we used InterProScan [42] to find the domain hits per protein. For proteins without a domain hit after InterProScan, we created a protein-specific, artificial protein-long domain; for example, we assigned to the protein G5EBR8, a protein-long domain named “G5EBR8_unk_dom”.
4.6.2. Model Selection
To select which simple neural model we should compare to the baselines, we performed hyperparameter selection using an inner, three-fold cross-validation on the training set; the test set was not used to select hyperparameters. We used common parameters, with a dropout of 0.5, batch size of 64, an Adam optimizer [43] with learning rate of 0.000, weight decay for the last fully connected layer of 0, and number of epochs equal to 300. As a final hyperparameter, we allowed updates to the learned domain embeddings, initialized by selected dom2vec embeddings. The results are shown in Appendix E.
4.7. Running Baselines
Then, we used the same network as the one in the right side of Figure 5 of [21]; we refer to this network as SeqVecNet. Namely, the network first averages the 100 (ProtVec) or 1024 (SeqVec) dimensional embedding vector for a protein; it then applies a fully connected layer to compress a batch of such vectors into 32 dimensions. Next, a ReLU activation function (with 0.25 dropout) was applied to that vector, followed by batch normalization. Finally, another fully connected layer was followed by the prediction layer. As the third baseline, we added the 1-hot of domains in order to investigate the performance change compared to dom2vec learned embeddings.
Evaluation
For TargetP, we sought to investigate the effect of OOV on the produced classifier compared to sequence-based embeddings classifiers which do not experience OOV, as their used sequence features were highly common in both the train and test sets. For the Toxin and NEW datasets, we benchmarked the generalization of the produced classifier compared to the sequence-based embeddings classifiers. Finally, for both kinds of experiments, we used the trained models on each test set. Hence, this evaluation shows how differences in the training set affect performance on the test set. The resulting performances are shown in Figure 5.
Out-of-vocabulary experiment For TargetP, we validated that OOV will affect the performance of domains dependent classifiers. That is, for OOV in the range of 0–30%, the dom2vec classifier was comparable to the best-performing model, SeqVec. However, when OOV increased even further, then the performance of our model dropped, though still being competitive with the SeqVec. dom2vec greatly outperformed the 1-hot representation, validating the NLP assumption that unsupervised embeddings improve classification on unseen words—in this context, protein domains—compared to 1-hot word (domain) vectors.
Generalization experiment For both Toxin and NEW, dom2vec significantly outperformed SeqVec, ProtVec, domains 1-hot vectors, and Benjamini–Hochberg multiple-test corrected p-value < 0.05. In the Toxin data set, we observed that ProtVec learned the less variant model, but with the trade-off obtaining the lowest performance (mc-AuROC). For the NEW data set, the dom2vec 1-hot representation was the second-best representation outperforming SeqVec and ProtVec, allowing us to validate the finding that domain composition is the most important feature for enzymatic function prediction, as concluded by [36].
5. Conclusions
In this work, we presented dom2vec, an approach for learning quantitatively assessable protein domain embeddings using the word2vec method on domain architectures from InterPro annotations.
We have shown that dom2vec adequately captured the domain SCOPe structural information, EC enzymatic function, and the GO molecular function of each domain with such available metadata information. However, dom2vec produced moderate results in the domain hierarchy evaluation task. After investigating the properties of domain families that dom2vec produces these moderate results, we concluded that dom2vec cannot capture the domain hierarchy, mostly for domain families of low cardinality. We argue that by using more complex classifiers compared to , we could gain in hierarchy performance, but this was not the scope of our evaluation.
Importantly, we did discover that dom2vec embeddings captured the most distinctive biological characteristics of domains, secondary structure, and enzymatic and molecular function for an individual domain. That is, word2vec produced domain embeddings which clustered sufficiently well by their structure and function class. Therefore, our finding supported the accepted modular evolution of proteins [1], in a data-driven way. It also made possible a striking analogy between words in natural language that clustered together in word2vec space [14], and protein domains in domain architectures that clustered together in dom2vec space. Therefore, we parallel the semantic and lexical similarity of words to the functional and structural resemblance of domains. This analogy may augment the research on understanding the nature of rules underlying the domain architecture grammar [7]. We are confident that this interpretability aspect of dom2vec will allow researchers to apply it reliably, so as to predict biological features of novel domain architectures and proteins with identifiable InterPro annotations.
In downstream task evaluation, dom2vec significantly outperformed domain 1-hot vectors and state-of-the-art sequence-based embeddings for the Toxin and NEW data sets. For the TargetP, dom2vec was comparable to the best-performing sequence-based embedding, Seqvec, for OOV up to 30%. Therefore, we recommend using dom2vec in combination with sequence embeddings to boost prediction performance.
Author Contributions
Conceptualization, D.P.M.; methodology, D.P.M.; software, D.P.M.; formal analysis, D.P.M.; investigation, D.P.M.; data curation, D.P.M.; writing–original draft preparation D.P.M.; validation, D.P.M. and W.N.; resources, W.N.; writing–review and editing, D.P.M., W.N.; visualization, D.P.M.; supervision, W.N.; project administration, D.P.M.; funding acquisition, W.N. All authors have read and agreed to the published version of the manuscript.
Funding
This study was funded by the Ministry for Science and Culture of Lower Saxony Germany (MWK: Ministerium für Wissenschaft und Kultur) within the project “Understanding Cochlear Implant Outcome Variability using Big Data and Machine Learning Approaches”, project id: ZN3429.
Institutional Review Board Statement
Not applicable.
Informed Consent Statement
Not applicable.
Data Availability Statement
The pre-trained protein domain embeddings are available online at https://0-doi-org.brum.beds.ac.uk/10.25835/0039431, through the Research Data Repository service of Leibniz University Hannover.
Acknowledgments
D.P.M. would like to thank Sofia K. Forslund for the helpful suggestions on selecting metadata related to the most important biological characteristics of domains. Besides, D.P.M. would like to thank Brandon Malone for suggesting the generalization experiment for the downstream evaluation.
Conflicts of Interest
The authors declare no conflict of interest.
Appendix A. Domain Hierarchy
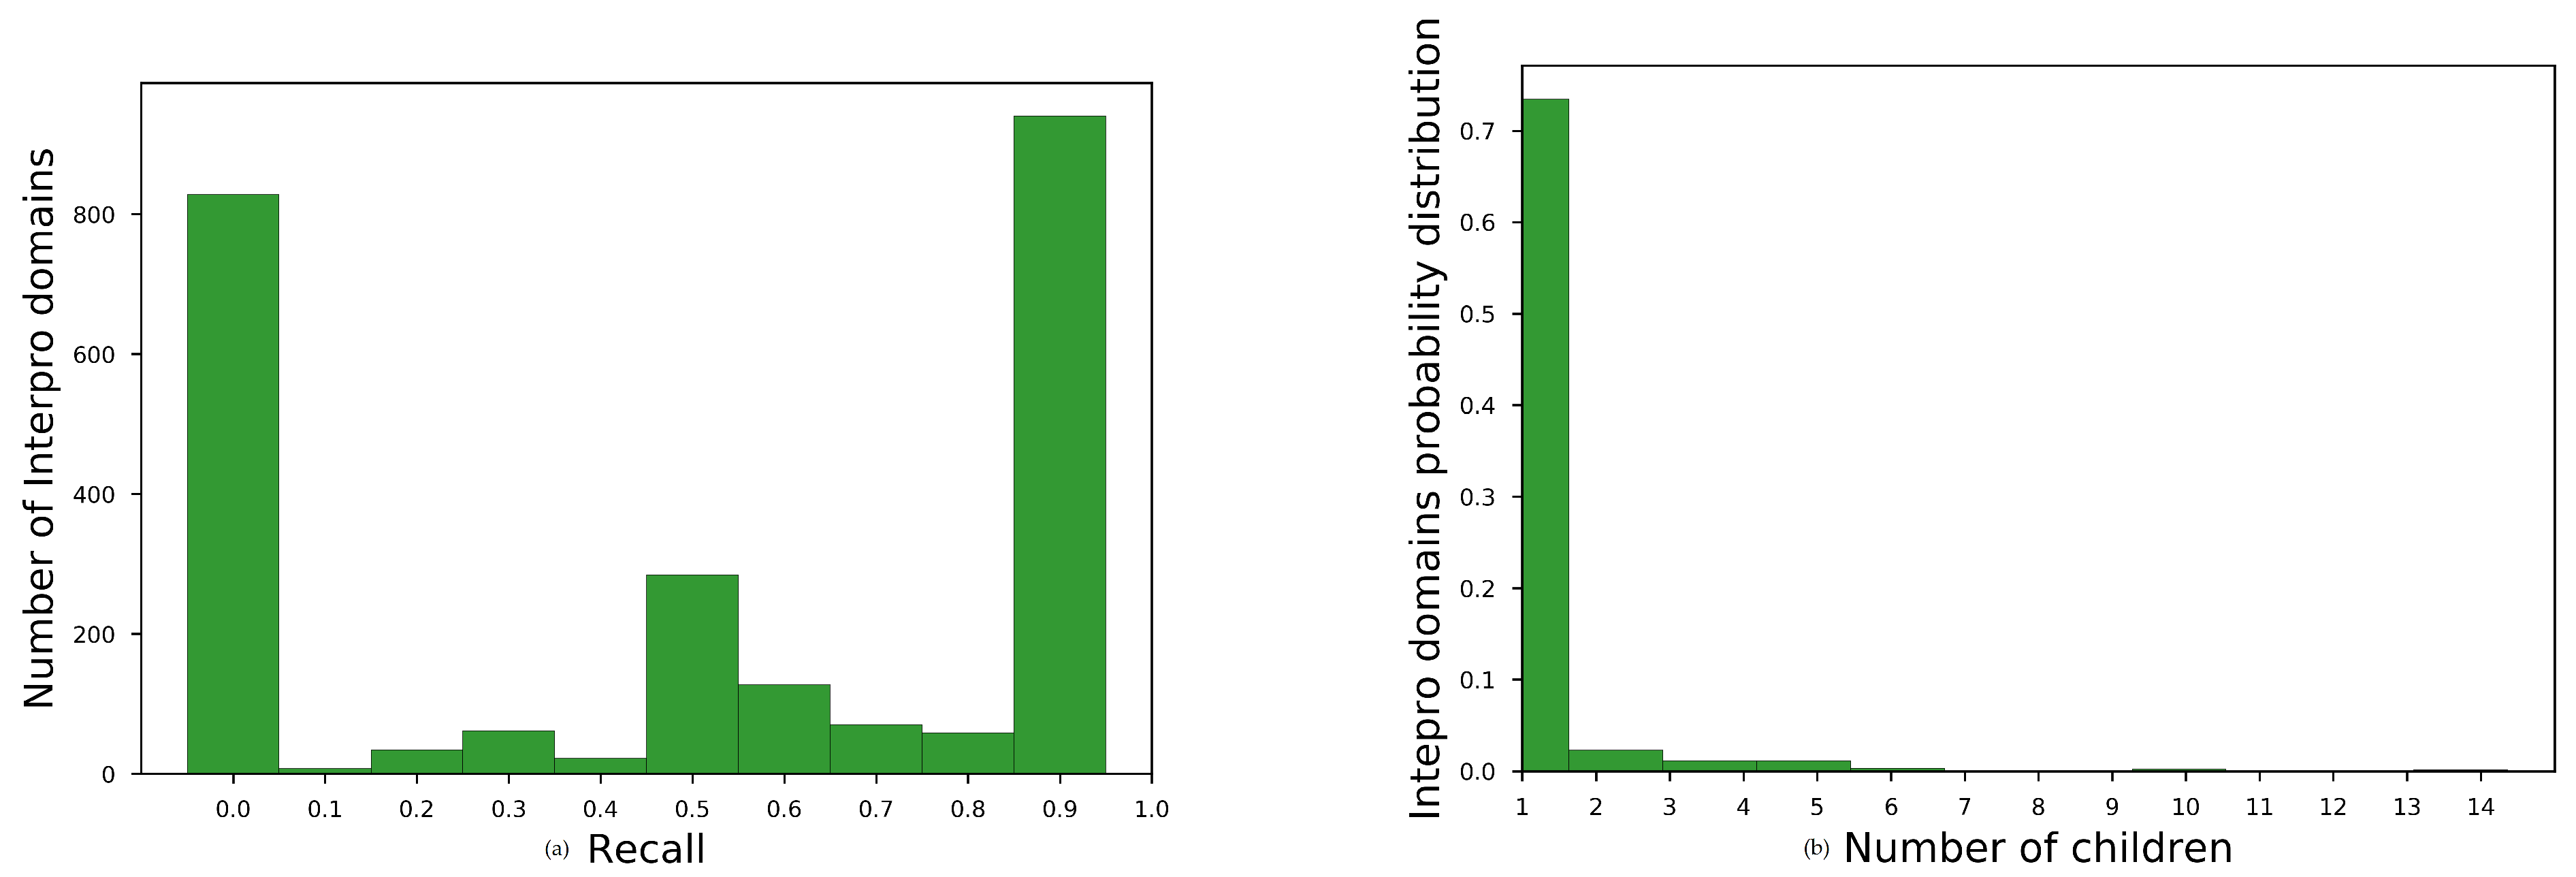
Average recall for all InterProparents in , see main paper, for no overlapping sequences are shown in Table A1. The histogram of average recall for best-performing embedding space is shown at Figure A1a. We observe that the embeddings space brought close domains with unknown family–subfamily relation for almost the one third of the parent domains (827 out of 2430).
To diagnose the reason for this moderate performance, we plotted the histogram of the number of children for each parent having recall 0, Figure A1b. We observed that most of these parents had only one child. Consequently, the embedding space should have been very homogeneous, for each of these parent child relation, in order to acquire better recall than 0.
Figure A1.
Diagnostic plots for domain hierarchy assessment task. (a) histogram for SKIP, w = 2, = 200, = 5 for non-redundant annotations. and (b) Histogram of number of children for parents with =0.
Figure A1.
Diagnostic plots for domain hierarchy assessment task. (a) histogram for SKIP, w = 2, = 200, = 5 for non-redundant annotations. and (b) Histogram of number of children for parents with =0.


Table A1.
Average for non-overlapping annotations, best shown in bold.
| Model∖ Dimension | = 50 | = 100 | = 200 |
|---|---|---|---|
| CBOW, w = 2 | 0.242 ( = 15) | 0.259 ( = 20) | 0.263 ( = 15) |
| CBOW, w = 5 | 0.242 ( = 45) | 0.252 ( = 30) | 0.25 ( = 15) |
| SKIP, w = 2 | 0.287 ( = 20) | 0.316 ( = 30) | 0.32 ( = 20) |
| SKIP, w = 5 | 0.284 ( = 20) | 0.302 ( = 30) | 0.311 ( = 30) |
| random | 0 | 0 | 0 |
Appendix B. SCOPe Secondary Structure Class
Classes distribution of secondary structure class is shown at Table A2a. Average accuracy over all folds, , for non-overlapping annotations shown in Table A2b.
Table A2.
SCOPe evaluation. (a) SCOPe class summary, (b) average accuracy over all folds, , for non-overlapping annotations (default k = 2), best shown in bold.
Table A2.
SCOPe evaluation. (a) SCOPe class summary, (b) average accuracy over all folds, , for non-overlapping annotations (default k = 2), best shown in bold.
| SCOPe Class | No. of Domains | ||
|---|---|---|---|
| a | 1868 | ||
| b | 1806 | ||
| a|b | 2303 | ||
| a+b | 2320 | ||
| multi-domain | 304 | ||
| membrane/cell | 309 | ||
| small | 501 | ||
| (a) SCOPe classes | |||
| Model∖ Dimension | = 50 | = 100 | = 200 |
| CBOW, w = 2 | 50.01 ( = 30) | 50.69 ( = 25) | 50.45 ( = 20) |
| CBOW, w = 5 | 49.59 ( = 25) | 50.03 ( = 25) | 48.82 ( = 15) |
| SKIP, w = 2 | 51.83 ( = 30) | 51.79 ( = 20) | 51.78 ( = 15) |
| SKIP, w = 5 | 51.54 ( = 35) | 51.65 ( = 15) | 51.34 ( = 15) |
| random | 22.75 (k = 40) | 24.18 (k = 40) | 23.39 (k = 40) |
| (b) | |||
Appendix C. EC Primary Class
Classes distribution of EC primary class is shown at Table A3a. Average accuracy over all folds, , for non-overlapping shown in Table A3b.
Table A3.
EC evaluation. (a) EC class summary, (b) average accuracy over all folds, , for non-overlapping annotations (k = 2), best shown in bold.
Table A3.
EC evaluation. (a) EC class summary, (b) average accuracy over all folds, , for non-overlapping annotations (k = 2), best shown in bold.
| EC Primary Class | No. of Domains | ||
|---|---|---|---|
| Oxidoreductases | 1102 | ||
| Transferases | 2490 | ||
| Hydrolases | 2190 | ||
| Lyases | 524 | ||
| Isomerases | 318 | ||
| Ligases | 448 | ||
| Translocases | 176 | ||
| (a) EC classes | |||
| Model∖ Dimension | = 50 | = 100 | = 200 |
| CBOW, w = 2 | 61.23 ( = 10) | 61.33 ( = 10) | 60.66 ( = 15) |
| CBOW, w = 5 | 61.22 ( = 20) | 60.51 ( = 10) | 60.61 ( = 15) |
| SKIP, w = 2 | 63.56 ( = 10) | 63.92 ( = 20) | 62.58 ( = 20) |
| SKIP, w = 5 | 62.47 ( = 10) | 63.44 ( = 10) | 62.94 ( = 15) |
| random | 31.51 (k = 40) | 32.64 (k = 40) | 31.68 (k = 20) |
| (b) | |||
Appendix D. GO Molecular Function
Appendix D.1. Malaria
GO class distribution and average accuracy over all folds,, for non-overlapping and non-redundant annotations, for Malaria, are shown in Table A4a–c respectively.
Table A4.
Malaria GO molecular function evaluation. (a) GO class summary, (b,c) Average accuracy over all folds, , for non-overlapping and non-redundant annotations, whenever k is not shown k = 2, best shown in bold case.
Table A4.
Malaria GO molecular function evaluation. (a) GO class summary, (b,c) Average accuracy over all folds, , for non-overlapping and non-redundant annotations, whenever k is not shown k = 2, best shown in bold case.
| GO Class | No. of Domains | ||
|---|---|---|---|
| Catalytic activity | 676 | ||
| Binding | 440 | ||
| Structural molecule activity | 171 | ||
| Transporter activity | 63 | ||
| Molecular function regulator | 22 | ||
| Transcription regulator activity | 13 | ||
| Cargo receptor activity | 1 | ||
| Molecular carrier activity | 1 | ||
| (a) GO classes | |||
| Model∖ Dimension | = 50 | = 100 | = 200 |
| CBOW, w = 2 | 58.2 (k = 5, = 35) | 58.24 (k = 5, = 5) | 57.87 ( = 5) |
| CBOW, w = 5 | 57.87 ( = 10) | 56.94 ( = 10) | 57.1 ( = 5) |
| SKIP, w = 2 | 59.48 (k = 5, = 10) | 59.82 ( = 15) | 58.68 ( = 10) |
| SKIP, w = 5 | 60.61 ( = 10) | 59.01 ( = 10) | 59.39 () |
| random | 46.21 (k = 40) | 46.62 (k = 40) | 45.99 (k = 40) |
| (b) for non-overlapping annotations | |||
| Model∖ Dimension | = 50 | = 100 | = 200 |
| CBOW, w = 2 | 67.33 ( = 5) | 64.88 ( = 5) | 61.13 ( = 5) |
| CBOW, w = 5 | 66.74 ( = 5) | 66.75 ( = 5) | 63.89 ( = 5) |
| SKIP, w = 2 | 75.79 ( = 35) | 75.64 ( = 45) | 74.91 ( = 5) |
| SKIP, w = 5 | 76.79 ( = 10) | 76.86 ( = 40) | 72.75 ( = 20) |
| random | 46.58 (k = 40) | 46.22 (k = 40) | 47.57 (k = 40) |
| (c) for non-redundant annotations | |||
Appendix D.2. E. coli
GO class distribution and average accuracy over all folds, , for non-overlapping and non-redundant annotations, for E. coli, are shown in Table A5a–c respectively.
Table A5.
E. coli GO molecular function evaluation. (a) GO class summary, (b,c) Average accuracy over folds, , for non-overlapping and not-redundant annotations, whenever k is not shown k = 2, best shown in bold.
Table A5.
E. coli GO molecular function evaluation. (a) GO class summary, (b,c) Average accuracy over folds, , for non-overlapping and not-redundant annotations, whenever k is not shown k = 2, best shown in bold.
| GO Class | No. of Domains | ||
|---|---|---|---|
| Catalytic activity | 1565 | ||
| Binding | 476 | ||
| Transporter activity | 211 | ||
| Structural molecule activity | 117 | ||
| Transcription regulator activity | 39 | ||
| Molecular function regulator | 15 | ||
| Molecular carrier activity | 3 | ||
| Translation regulator activity | 1 | ||
| Molecular transducer activity | 1 | ||
| (a) GO classes | |||
| Model∖ Dimension | |||
| CBOW, w = 2 | 67.66 (k = 5, = 30) | 67.46 (k = 20, = 5) | 67.34 (k = 20, = 5) |
| CBOW, w = 5 | 67.78 (k = 5, = 5) | 67.46 (k = 20, = 5) | 67.34 (k = 20, = 5) |
| SKIP, w = 2 | 68.15 (k = 5, = 5) | 67.54 (k = 5, = 5) | 67.75 (k = 20, = 5) |
| SKIP, w = 5 | 69.1 (k = 5, = 5) | 67.82 (k = 5, = 5) | 68.15 (k = 5, = 5) |
| random | 64.46 (k = 40) | 64.46 (k = 40) | 64.46 (k = 40) |
| (b) for non-overlapping annotations | |||
| Model∖ Dimension | = 50 | = 100 | = 200 |
| CBOW, w = 2 | 71.41 (k = 5, = 5) | 68.45 (k = 5, = 5) | 67.87 ( = 5) |
| CBOW, w = 5 | 74.95 ( = 5) | 71.69 ( = 5) | 68.91 ( = 5) |
| SKIP, w = 2 | 81.27 ( = 5) | 80.32 ( = 5) | 80.36 ( = 5) |
| SKIP, w = 5 | 81.72 ( = 5) | 81.64 ( = 5) | 80.77 ( = 5) |
| random | 64.38 (k = 40) | 64.46 (k = 40) | 64.38 (k = 40) |
| (c) for non-redundant annotations | |||
Appendix D.3. Yeast
GO class distribution and average accuracy over all folds, , for non-overlapping and non-redundant annotations, for Yeast, are shown in Table A6a–c respectively.
Table A6.
S.cerevisiae GO molecular function evaluation. (a) GO class summary, (b,c) Average accuracy over folds,, for non-overlapping and non-redundant annotations, best shown in bold.
Table A6.
S.cerevisiae GO molecular function evaluation. (a) GO class summary, (b,c) Average accuracy over folds,, for non-overlapping and non-redundant annotations, best shown in bold.
| GO Class | No. of Domains | ||
|---|---|---|---|
| Catalytic activity | 1177 | ||
| Binding | 585 | ||
| Structural molecule activity | 208 | ||
| Transporter activity | 112 | ||
| Transcription regulator activity | 46 | ||
| Molecular function regulator | 40 | ||
| Translation regulator activity | 2 | ||
| Molecular transducer activity | 2 | ||
| Molecular carrier activity | 1 | ||
| Cargo adaptor activity | 1 | ||
| (a) GO classes | |||
| Model∖ Dimension | = 50 | = 100 | = 200 |
| CBOW, w = 2 | 60.05 (k = 20, = 5) | 59.87 (k = 20, = 5) | 59.87 (k = 20, = 5) |
| CBOW, w = 5 | 59.82 (k = 20, = 15) | 60.24 (k = 20, = 5) | 60.70 (k = 20, = 5) |
| SKIP, w = 2 | 60.74 (k = 5, = 10) | 60.79 (k = 5, = 10) | 61.53 (k = 5, = 5) |
| SKIP, w = 5 | 61.38 (k = 5, = 10) | 60.75 (k = 20, = 5) | 60.61 (k = 20, = 10) |
| random | 53.36 (k = 40) | 53.64 (k = 40) | 53.64 (k = 40) |
| (b) for non-overlapping annotations | |||
| Model∖ Dimension | = 50 | = 100 | = 200 |
| CBOW, w = 2 | 64.37 (k = 5, = 5) | 64.87 (k = 5, =5) | 62.4 (k = 5, = 5) |
| CBOW, w = 5 | 67.17 (k = 5, = 50) | 65.11 (k = 5, = 5) | 63.31 (k = 5, = 5) |
| SKIP, w = 2 | 73.36 (k = 5, = 20) | 73.86 (k = 5, = 5) | 72.29 (k = 5, = 5) |
| SKIP, w = 5 | 75.1 (k = 5, = 50) | 74.1 (k = 5, = 10) | 73.02 (k = 5, = 5) |
| random | 53.59 (k = 40) | 53.73 (k = 40) | 53.18 (k = 40) |
| (c) for non-redundant annotations | |||
Appendix D.4. Human
GO class distribution and average for non-overlapping annotations, for Human, is shown in Table A7a,b.
Table A7.
Human GO molecular function evaluation: (a) GO class summary, (b) Average accuracy over folds, , for non-overlapping annotations, when k is not shown k = 2, best shown in bold.
Table A7.
Human GO molecular function evaluation: (a) GO class summary, (b) Average accuracy over folds, , for non-overlapping annotations, when k is not shown k = 2, best shown in bold.
| GO Class | No. of Domains | ||
|---|---|---|---|
| Catalytic activity | 1945 | ||
| Binding | 1583 | ||
| Transporter activity | 377 | ||
| Molecular transducer activity | 355 | ||
| Structural molecule activity | 262 | ||
| Transcription regulator activity | 203 | ||
| Molecular function regulator | 168 | ||
| Cargo receptor activity | 9 | ||
| Molecular carrier activity | 1 | ||
| Cargo adaptor activity | 1 | ||
| (a) GO classes | |||
| Model∖ Dimensions | = 50 | = 100 | = 200 |
| CBOW, w = 2 | 57.7 ( = 10) | 58.82 ( = 10) | 58.04 (k = 5, = 10) |
| CBOW, w = 5 | 58.1 ( = 30) | 58.9 ( = 35) | 58.2 ( = 10) |
| SKIP, w = 2 | 60.51 (k = 5, = 15) | 60.67 ( = 10) | 59.3 ( = 10) |
| SKIP, w = 5 | 60.59 (k = 5,ep=35) | 60.18 (k = 5, = 10) | 59.84 (k = 5, = 10) |
| random | 36.72 (k = 40) | 36.44 (k = 40) | 37.36 (k = 40) |
| (b) for non-overlapping annotations | |||
Appendix E. Extrinsic Evaluation
Class distribution for TargetP, Toxin and NEW data sets shown in Table A8a–c respectively. Model selection over hyperparameters, including architecture, shown in Table A9.
Table A8.
Class summary for downstream tasks. (a) TargetP, (b) Toxin and (c) NEW.
| Location | No. of Proteins |
|---|---|
| Nuclear | 1072 |
| Cytosolic | 405 |
| Pathway/Signal | 605 |
| Mitochondrial | 304 |
| (a) TargetP | |
| Toxicity | No. of Proteins |
| Toxin | 1747 |
| Non toxin | 523 |
| (b) Toxin | |
| EC Primary Class | No. of Proteins |
| Oxidoreductases | 2234 |
| Transferases | 5232 |
| Hydrolases | 4099 |
| Lyases | 1124 |
| Isomerases | 731 |
| Ligases | 1124 |
| (c) NEW | |
Table A9.
Average performance of simple neural architectures using as input dom2vec on inner three-fold cross-validation. For Toxin AuROC is shown and for the two other data sets mc-AuROC is shown. Best values shown in bold.
Table A9.
Average performance of simple neural architectures using as input dom2vec on inner three-fold cross-validation. For Toxin AuROC is shown and for the two other data sets mc-AuROC is shown. Best values shown in bold.
| Model ∖ Data Set | TargetP | Toxin | NEW |
|---|---|---|---|
| CNN, size = (1,2), filters = 200 | 0.9191 | 0.9074 | 0.9845 |
| CNN, size = 1, filters = 128 | 0.9288 | 0.8957 | 0.9844 |
| FastText (uni-gram) | 0.8829 | 0.9029 | 0.9818 |
| LSTM, dim = 512, layer = 1 | 0.9103 | 0.9025 | 0.9857 |
| bi-LSTM, dim = 512, layer = 1 | 0.921 | 0.9052 | 0.9857 |
| SeqVecNet dim = 32 | 0.9017 | 0.9086 | 0.9876 |
| SeqVecNet dim = 512 | 0.9206 | 0.9145 | 0.9864 |
| SeqVecNet dim = 1024 | 0.9228 | 0.9034 | 0.9861 |
References
- Moore, A.D.; Björklund, Å.K.; Ekman, D.; Bornberg-Bauer, E.; Elofsson, A. Arrangements in the modular evolution of proteins. Trends Biochem. Sci. 2008, 33, 444–451. [Google Scholar] [CrossRef]
- Forslund, K.; Sonnhammer, E.L. Evolution of protein domain architectures. In Evolutionary Genomics; Springer: Berlin, Germany, 2012; pp. 187–216. [Google Scholar]
- Chou, K.C.; Cai, Y.D. Using functional domain composition and support vector machines for prediction of protein subcellular location. J. Biol. Chem. 2002, 277, 45765–45769. [Google Scholar] [CrossRef] [Green Version]
- Forslund, K.; Sonnhammer, E.L. Predicting protein function from domain content. Bioinformatics 2008, 24, 1681–1687. [Google Scholar] [CrossRef] [Green Version]
- Doǧan, T.; MacDougall, A.; Saidi, R.; Poggioli, D.; Bateman, A.; O’Donovan, C.; Martin, M.J. UniProt-DAAC: Domain architecture alignment and classification, a new method for automatic functional annotation in UniProtKB. Bioinformatics 2016, 32, 2264–2271. [Google Scholar] [CrossRef] [PubMed] [Green Version]
- Scaiewicz, A.; Levitt, M. The language of the protein universe. Curr. Opin. Genet. Dev. 2015, 35, 50–56. [Google Scholar] [CrossRef] [Green Version]
- Yu, L.; Tanwar, D.K.; Penha, E.D.S.; Wolf, Y.I.; Koonin, E.V.; Basu, M.K. Grammar of protein domain architectures. Proc. Natl. Acad. Sci. USA 2019, 116, 3636–3645. [Google Scholar] [CrossRef] [PubMed]
- Sonnhammer, E.L.; Eddy, S.R.; Birney, E.; Bateman, A.; Durbin, R. Pfam: Multiple sequence alignments and HMM-profiles of protein domains. Nucleic Acids Res. 1998, 26, 320–322. [Google Scholar] [CrossRef] [Green Version]
- Terrapon, N.; Weiner, J.; Grath, S.; Moore, A.D.; Bornberg-Bauer, E. Rapid similarity search of proteins using alignments of domain arrangements. Bioinformatics 2013, 30, 274–281. [Google Scholar] [CrossRef] [PubMed] [Green Version]
- Marchler-Bauer, A.; Bo, Y.; Han, L.; He, J.; Lanczycki, C.J.; Lu, S.; Chitsaz, F.; Derbyshire, M.K.; Geer, R.C.; Gonzales, N.R.; et al. CDD/SPARCLE: Functional classification of proteins via subfamily domain architectures. Nucleic Acids Res. 2016, 45, D200–D203. [Google Scholar] [CrossRef] [Green Version]
- Collobert, R.; Weston, J.; Bottou, L.; Karlen, M.; Kavukcuoglu, K.; Kuksa, P. Natural language processing (almost) from scratch. J. Mach. Learn. Res. 2011, 12, 2493–2537. [Google Scholar]
- Mikolov, T.; Chen, K.; Corrado, G.S.; Dean, J. Efficient Estimation of Word Representations in Vector Space. In Proceedings of the 1st International Conference on Learning Representations, Scottsdale, AR, USA, 2–4 May 2013. [Google Scholar]
- Pennington, J.; Socher, R.; Manning, C. GloVe: Global Vectors for Word Representation. In Proceedings of the 2014 Conference on Empirical Methods in Natural Language Processing, Doha, Qatar, 25–29 October 2014. [Google Scholar]
- Mikolov, T.; Sutskever, I.; Chen, K.; Corrado, G.S.; Dean, J. Distributed representations of words and phrases and their compositionality. In Proceedings of the 27th Advances in Neural Information Processing Systems, LakeTahoe, NV, USA, 5–10 December 2013. [Google Scholar]
- Drozd, A.; Gladkova, A.; Matsuoka, S. Word embeddings, analogies, and machine learning: Beyond king-man+woman=queen. In Proceedings of the 26th International Conference on Computational Linguistics: Technical Papers, Osaka, Japan, 5–10 December 2016. [Google Scholar]
- Attardi, G.; Cozza, V.; Sartiano, D. Detecting the scope of negations in clinical notes. In Proceedings of the Second Italian Conference on Computational Linguistics CLiC-it 2015, Trento, Italy, 3–4 December 2015; pp. 130–135. [Google Scholar]
- Asgari, E.; Mofrad, M.R.K. Continuous Distributed Representation of Biological Sequences for Deep Proteomics and Genomics. PLoS ONE 2015, 10, e0141287. [Google Scholar] [CrossRef] [PubMed]
- Yang, K.K.; Wu, Z.; Bedbrook, C.N.; Arnold, F.H. Learned protein embeddings for machine learning. Bioinformatics 2018, 34, 2642–2648. [Google Scholar] [CrossRef] [PubMed] [Green Version]
- Bepler, T.; Berger, B. Learning Protein Sequence Embeddings using Information from Structure. In Proceedings of the 7th International Conference on Learning Representations, New Orleans, LA, USA, 6–9 May 2019. [Google Scholar]
- Asgari, E.; McHardy, A.C.; Mofrad, M.R.K. Probabilistic variable-length segmentation of protein sequences for discriminative motif discovery (DiMotif) and sequence embedding (ProtVecX). Sci. Rep. 2019, 9, 1–16. [Google Scholar] [CrossRef] [PubMed] [Green Version]
- Heinzinger, M.; Elnaggar, A.; Wang, Y.; Dallago, C.; Nechaev, D.; Matthes, F.; Rost, B. Modeling aspects of the language of life through transfer-learning protein sequences. BMC Bioinform. 2019, 20, 723. [Google Scholar] [CrossRef] [Green Version]
- Alley, E.C.; Khimulya, G.; Biswas, S.; AlQuraishi, M.; Church, G.M. Unified rational protein engineering with sequence-based deep representation learning. Nat. Methods 2019, 16, 1315–1322. [Google Scholar] [CrossRef]
- Buchan, D.W.; Jones, D.T. Learning a functional grammar of protein domains using natural language word embedding techniques. Proteins: Struct. Funct. Bioinform. 2020, 88, 616–624. [Google Scholar] [CrossRef]
- Peters, M.E.; Neumann, M.; Iyyer, M.; Gardner, M.; Clark, C.; Lee, K.; Zettlemoyer, L. Deep contextualized word representations. In Proceedings of the 16th Annual Conference of the North American Chapter of the Association for Computational Linguistics: Human Language Technologies, New Orleans, LA, USA, 1–6 June 2018. [Google Scholar]
- Loewenstein, Y.; Raimondo, D.; Redfern, O.C.; Watson, J.; Frishman, D.; Linial, M.; Orengo, C.; Thornton, J.; Tramontano, A. Protein function annotation by homology-based inference. Genome Biol. 2009, 10, 1–8. [Google Scholar] [CrossRef] [Green Version]
- Schnabel, T.; Labutov, I.; Mimno, D.; Joachims, T. Evaluation methods for unsupervised word embeddings. In Proceedings of the 2015 Conference on Empirical Methods in Natural Language Processing, Lisbon, Portugal, 17–21 September 2015. [Google Scholar]
- Lastra-Díaz, J.J.; Goikoetxea, J.; Taieb, M.A.H.; García-Serrano, A.; Aouicha, M.B.; Agirre, E. A reproducible survey on word embeddings and ontology-based methods for word similarity: Linear combinations outperform the state of the art. Eng. Appl. Artif. Intell. 2019, 85, 645–665. [Google Scholar] [CrossRef]
- The UniProt Consortium. UniProt: The universal protein knowledgebase. Nucleic Acids Res. 2017, 45, D158–D169. [Google Scholar] [CrossRef] [Green Version]
- Fox, N.K.; Brenner, S.E.; Chandonia, J.M. SCOPe: Structural Classification of Proteins-extended, integrating SCOP and ASTRAL data and classification of new structures. Nucleic Acids Res. 2013, 42, D304–D309. [Google Scholar] [CrossRef]
- Maaten, L.V.; Hinton, G. Visualizing data using t-SNE. J. Mach. Learn. Res. 2008, 9, 2579–2605. [Google Scholar]
- Matthews, B.W. Comparison of the predicted and observed secondary structure of T4 phage lysozyme. Biochim. Et Biophys. Acta (BBA)-Protein Struct. 1975, 405, 442–451. [Google Scholar] [CrossRef]
- Fleischmann, A.; Darsow, M.; Degtyarenko, K.; Fleischmann, W.; Boyce, S.; Axelsen, K.B.; Bairoch, A.; Schomburg, D.; Tipton, K.F.; Apweiler, R. IntEnz, the integrated relational enzyme database. Nucleic Acids Res. 2004, 32, D434–D437. [Google Scholar] [CrossRef] [PubMed] [Green Version]
- Pearson, K. LIII. On lines and planes of closest fit to systems of points in space. Lond. Edinb. Dublin Philos. Mag. J. Sci. 1901, 2, 559–572. [Google Scholar] [CrossRef] [Green Version]
- Emanuelsson, O.; Nielsen, H.; Brunak, S.; Von Heijne, G. Predicting subcellular localization of proteins based on their N-terminal amino acid sequence. J. Mol. Biol. 2000, 300, 1005–1016. [Google Scholar] [CrossRef] [Green Version]
- Gacesa, R.; Barlow, D.J.; Long, P.F. Machine learning can differentiate venom toxins from other proteins having non-toxic physiological functions. PeerJ Comput. Sci. 2016, 2, e90. [Google Scholar] [CrossRef]
- Li, Y.; Wang, S.; Umarov, R.; Xie, B.; Fan, M.; Li, L.; Gao, X. DEEPre: Sequence-based enzyme EC number prediction by deep learning. Bioinformatics 2017, 34, 760–769. [Google Scholar] [CrossRef] [Green Version]
- Luong, T.; Sutskever, I.; Le, Q.; Vinyals, O.; Zaremba, W. Addressing the Rare Word Problem in Neural Machine Translation. In Proceedings of the 53rd Annual Meeting of the Association for Computational Linguistics, Beijing, China, 26–31 July 2015. [Google Scholar]
- Joulin, A.; Grave, E.; Bojanowski, P.; Mikolov, T. Bag of tricks for efficient text classification. In Proceedings of the 15th Conference of the European Chapter of the Association for Computational Linguistics, Valencia, Spain, 3–7 April 2017. [Google Scholar]
- LeCun, Y.; Bottou, L.; Bengio, Y.; Haffner, P. Gradient-based learning applied to document recognition. Proc. IEEE 1998, 86, 2278–2324. [Google Scholar] [CrossRef] [Green Version]
- Hochreiter, S.; Schmidhuber, J. Long short-term memory. Neural Comput. 1997, 9, 1735–1780. [Google Scholar] [CrossRef]
- Mitchell, A.L.; Attwood, Y.K.; Babbitt, P.C.; Blum, M. InterPro in 2019: Improving coverage, classification and access to protein sequence annotations. Nucleic Acids Res. 2019, 47, D351–D360. [Google Scholar] [CrossRef] [Green Version]
- Jones, P.; Binns, D.; Chang, H.Y.; Fraser, M.; Li, W.; McAnulla, C.; McWilliam, H.; Maslen, J.; Mitchell, A.; Nuka, G.; et al. InterProScan 5: Genome-scale protein function classification. Bioinformatics 2014, 30, 1236–1240. [Google Scholar] [CrossRef] [PubMed] [Green Version]
- Kingma, D.P.; Ba, J.L. Adam: A Method for Stochastic Optimization. In Proceedings of the 3rd International Conference on Learning Representations, San Diego, CA, USA, 7–9 May 2015. [Google Scholar]
Figure 1.
Summary of our approach divided in four parts, building two forms of domain architectures, training domain embeddings, performing intrinsic and extrinsic evaluation of dom2vec embeddings.
Figure 1.
Summary of our approach divided in four parts, building two forms of domain architectures, training domain embeddings, performing intrinsic and extrinsic evaluation of dom2vec embeddings.

Figure 2.
Non-overlapping and non-redundant domain architectures of the Diphthine synthase protein.
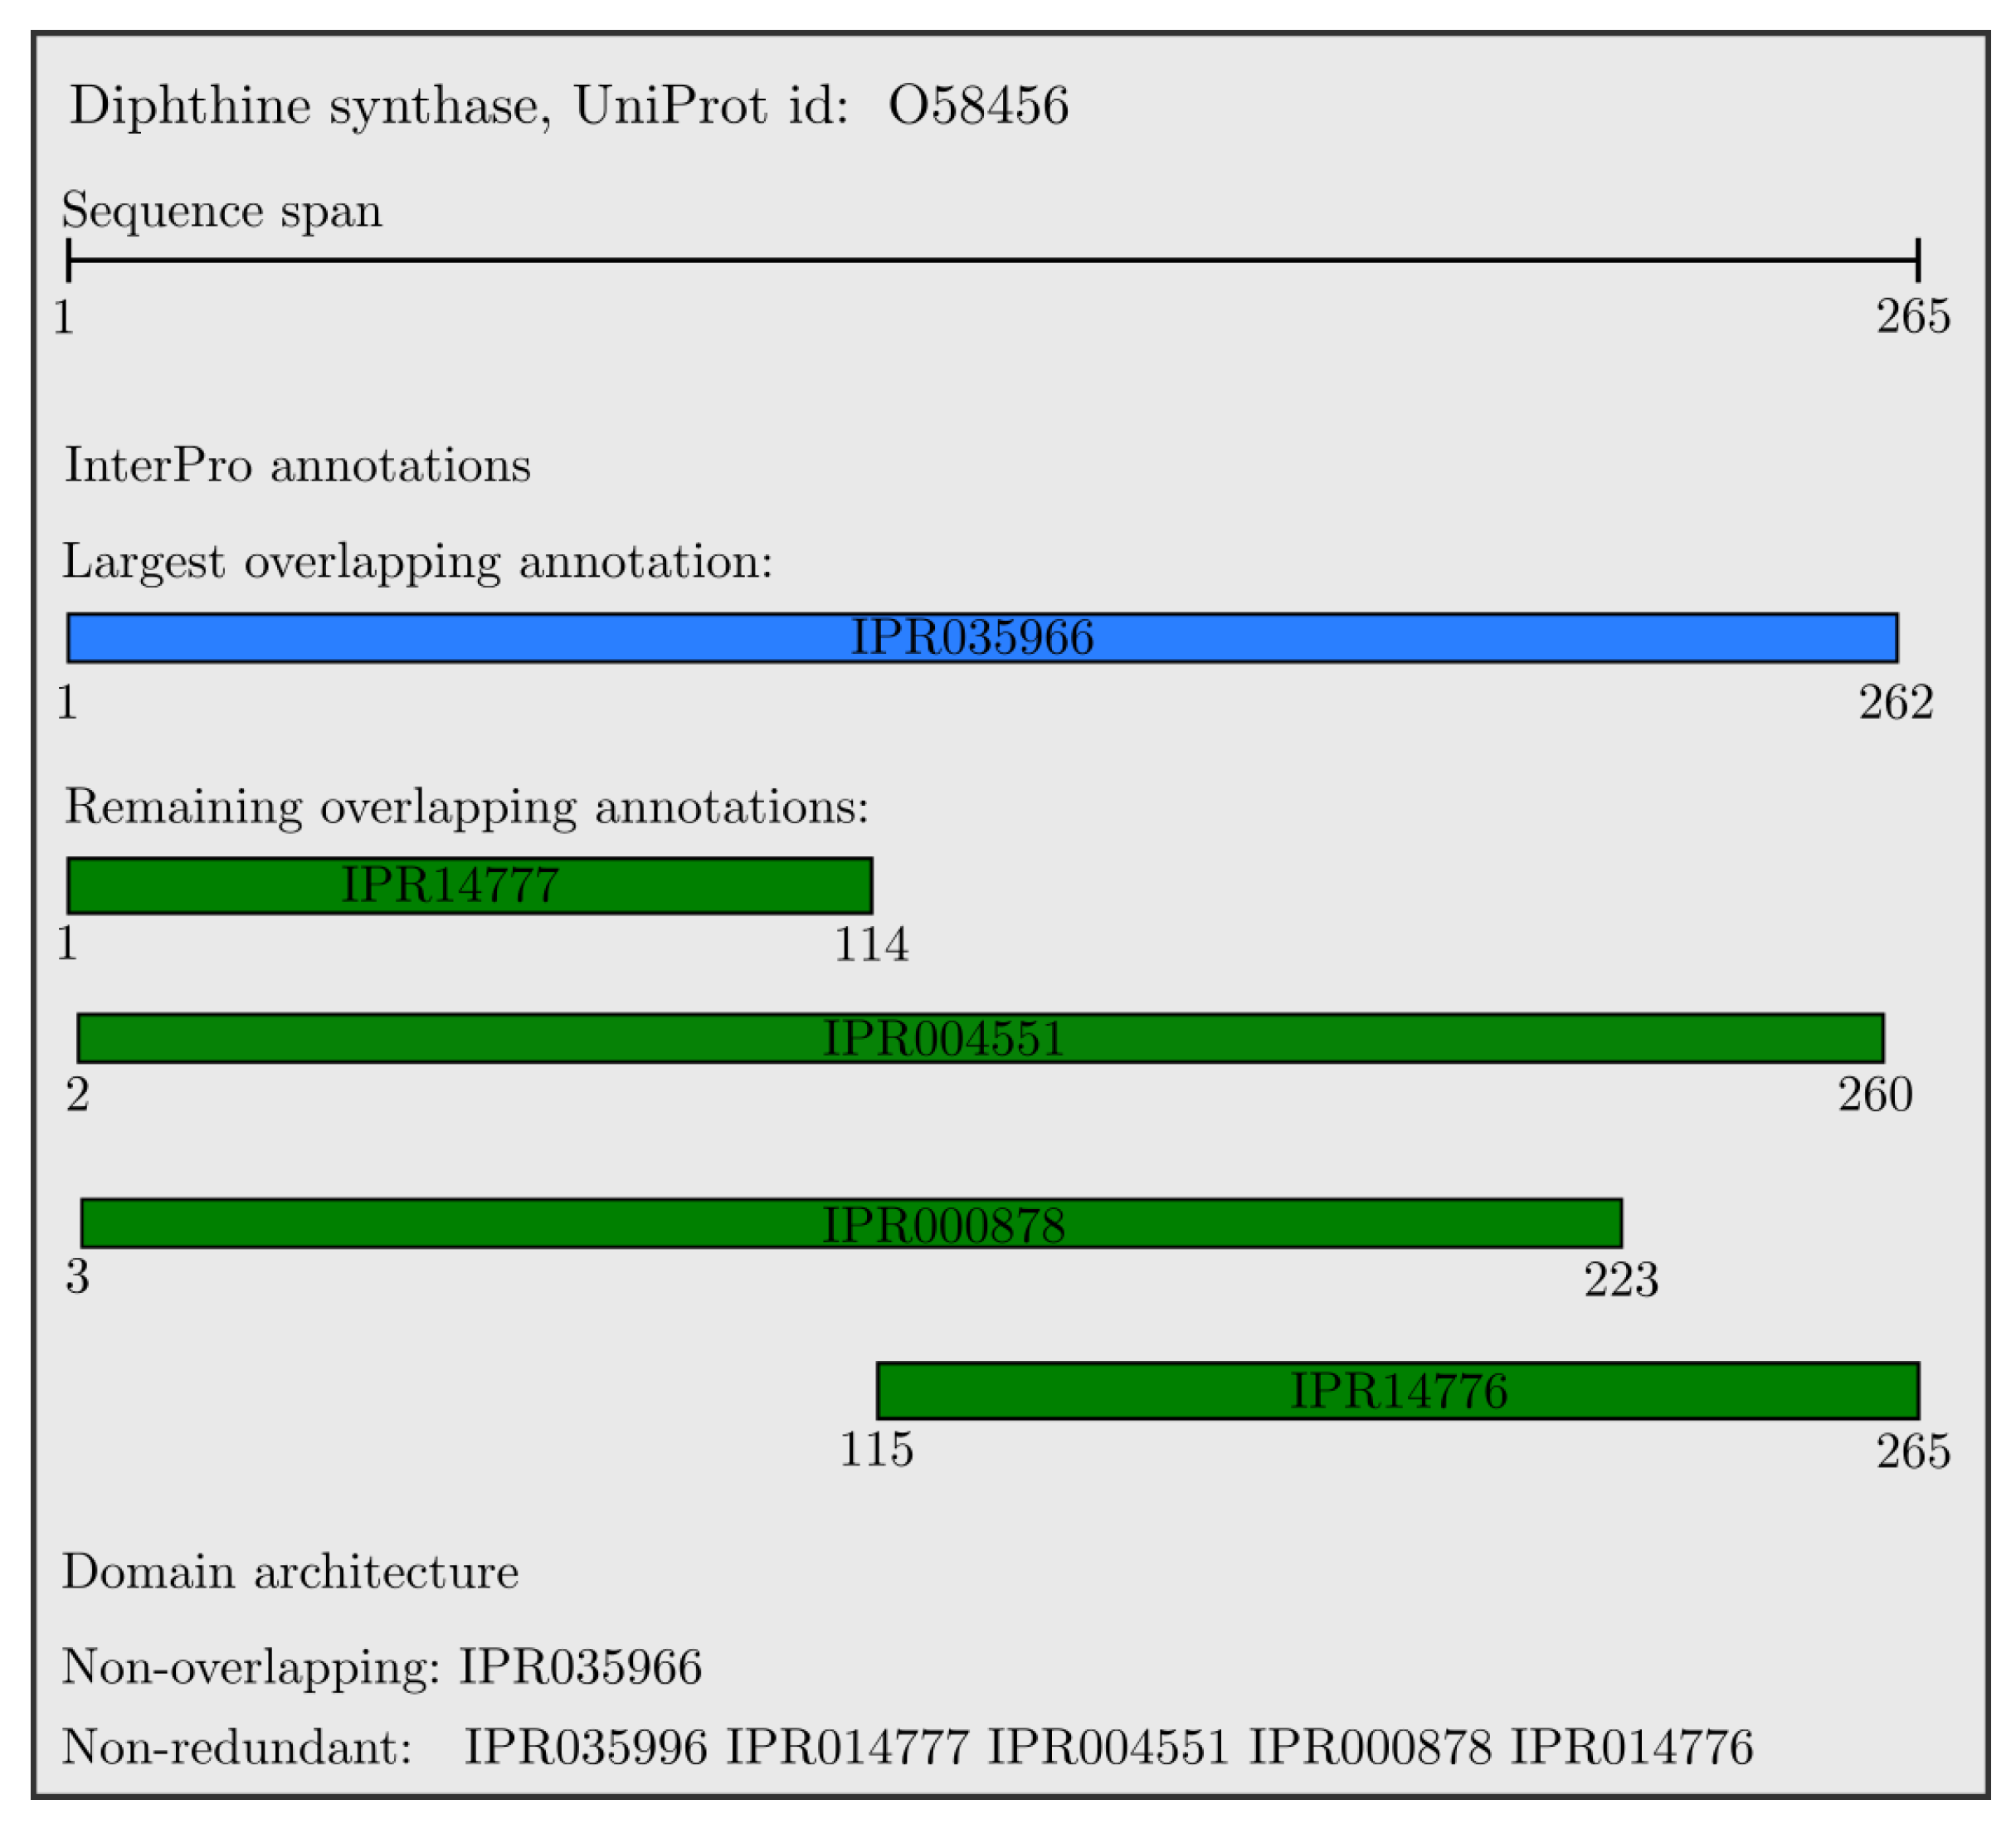
Figure 3.
Histograms of number of InterPro annotations per protein. (a) Non-overlapping and (b) non-redundant annotations.
Figure 3.
Histograms of number of InterPro annotations per protein. (a) Non-overlapping and (b) non-redundant annotations.

Figure 4.
Domain vectors for five domain superfamilies in the dom2vec space.

Figure 5.
Downstream performance. Sub-figure (a) refers to the OOV experiment, while (b,c) refer to the generalization experiment. The marked points represent the mean performance on the test set, and the shaded regions show one standard deviation above and below the mean.
Figure 5.
Downstream performance. Sub-figure (a) refers to the OOV experiment, while (b,c) refer to the generalization experiment. The marked points represent the mean performance on the test set, and the shaded regions show one standard deviation above and below the mean.
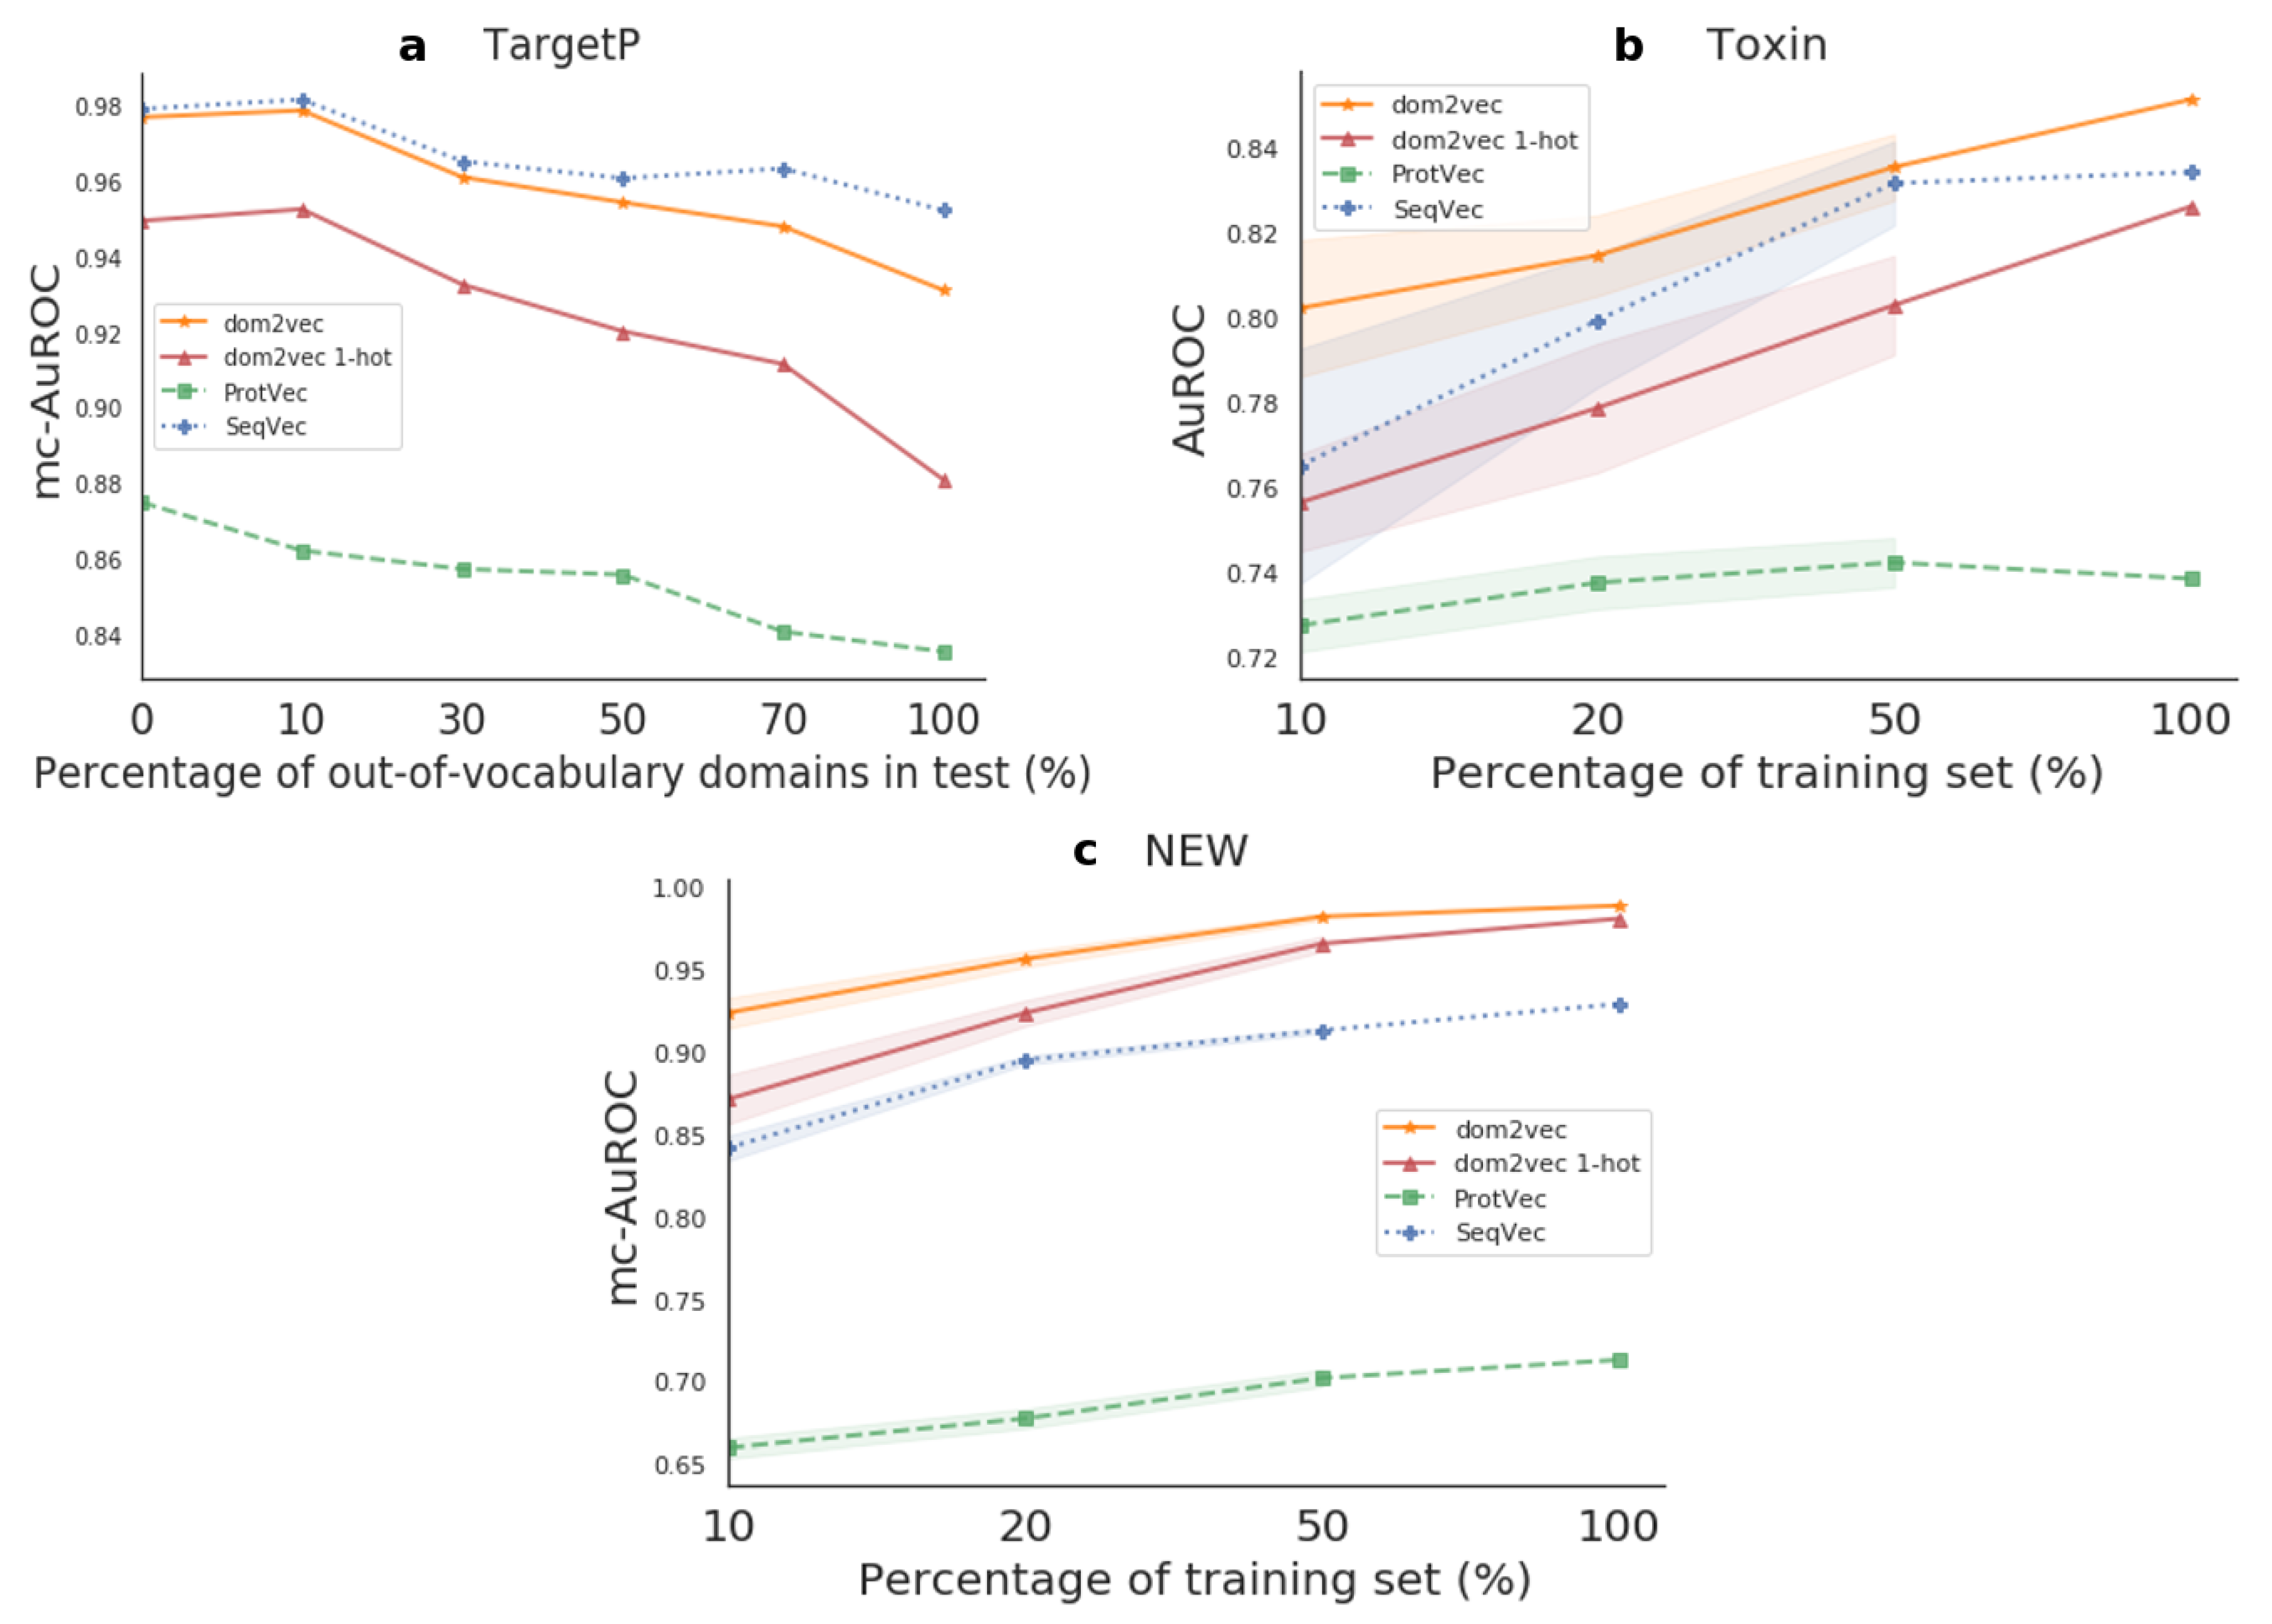
Table 1.
Intrinsic evaluation performance. (a) for non-redundant InterPro annotations. (b–d): average accuracy over all folds: (b): , (c) and (d) for non-redundant InterPro annotations. For all tables, results are shown for the best-performing value; if k is not shown, then k = 2. Best performance of an evaluation task shown in bold.
| (a) Domains hierarchy | |||
| Model∖ Dimension | = 50 | = 100 | = 200 |
| CBOW, w = 2 | 0.406 ( = 10) | 0.412 ( = 10) | 0.414 ( = 5) |
| CBOW, w = 5 | 0.405 ( = 30) | 0.402 ( = 35) | 0.382 ( = 10) |
| SKIP, w = 2 | 0.512 ( = 5) | 0.53 ( = 5) | 0.538 ( = 5) |
| SKIP, w = 5 | 0.507 ( = 5) | 0.525 ( = 5) | 0.524 ( = 5) |
| random | 0 | 0 | 0 |
| (b) SCOPe Secondary structure | |||
| Model∖ Dimension | = 50 | = 100 | = 200 |
| CBOW, w = 2 | 77.09 ( = 5) | 76.35 ( = 5) | 75.77 ( = 5) |
| CBOW, w = 5 | 78.15 ( = 5) | 76.94 ( = 5) | 76.84 ( = 5) |
| SKIP, w = 2 | 84.42 ( = 45) | 84.42 ( = 40) | 84.08 ( = 30) |
| SKIP, w = 5 | 84.56 ( = 25) | 84.06 ( = 45) | 83.72 ( = 10) |
| random | 23.39 (k = 40) | 23.49 (k = 40) | 22.76 (k = 20) |
| (c) EC primary class | |||
| Model∖ Dimension | = 50 | = 100 | = 200 |
| CBOW, w = 2 | 76.88 ( = 5) | 75.85 ( = 5) | 75.39 ( = 5) |
| CBOW, w = 5 | 80.89 ( = 5) | 79.89 ( = 5) | 77.16 ( = 5) |
| SKIP, w = 2 | 89.47 ( = 35) | 89.06 ( = 40) | 88.86 ( = 5) |
| SKIP, w = 5 | 90.85 ( = 30) | 90.41 ( = 15) | 90.2 ( = 5) |
| random | 33.62 (k = 40) | 32.06 (k = 40) | 32.28 (k = 40) |
| (d) GO molecular function (Human) | |||
| Model∖ Dimension | = 50 | = 100 | = 200 |
| CBOW, w = 2 | 66.94 ( = 5) | 66.32 ( = 5) | 66.32 ( = 5) |
| CBOW, w = 5 | 67.77 ( = 5) | 65.87 ( = 5) | 65.77 ( = 5) |
| SKIP, w = 2 | 74.77 ( = 40) | 74.18 ( = 5) | 73.14 ( = 5) |
| SKIP, w = 5 | 75.96 ( = 40) | 75.53 ( = 10) | 74.98 ( = 5) |
| random | 37.05 (k = 40) | 37.03 (k = 20) | 37.05 (k = 40) |
Publisher’s Note: MDPI stays neutral with regard to jurisdictional claims in published maps and institutional affiliations. |
© 2021 by the authors. Licensee MDPI, Basel, Switzerland. This article is an open access article distributed under the terms and conditions of the Creative Commons Attribution (CC BY) license (http://creativecommons.org/licenses/by/4.0/).
Share and Cite
MDPI and ACS Style
Melidis, D.P.; Nejdl, W. Capturing Protein Domain Structure and Function Using Self-Supervision on Domain Architectures. Algorithms 2021, 14, 28. https://0-doi-org.brum.beds.ac.uk/10.3390/a14010028
AMA Style
Melidis DP, Nejdl W. Capturing Protein Domain Structure and Function Using Self-Supervision on Domain Architectures. Algorithms. 2021; 14(1):28. https://0-doi-org.brum.beds.ac.uk/10.3390/a14010028
Chicago/Turabian StyleMelidis, Damianos P., and Wolfgang Nejdl. 2021. "Capturing Protein Domain Structure and Function Using Self-Supervision on Domain Architectures" Algorithms 14, no. 1: 28. https://0-doi-org.brum.beds.ac.uk/10.3390/a14010028
Note that from the first issue of 2016, this journal uses article numbers instead of page numbers. See further details here.