
Modeling and Optimization in Resource Sharing Systems: Application to Bike-Sharing with Unequal Demands


Intelligent Transportation and Logistics Systems Laboratory, Tsinghua-Berkeley Shenzhen Institute, Shenzhen 518055, China
*
Author to whom correspondence should be addressed.
Algorithms 2021, 14(2), 47; https://0-doi-org.brum.beds.ac.uk/10.3390/a14020047
Submission received: 8 December 2020
/
Revised: 25 January 2021
/
Accepted: 27 January 2021
/
Published: 30 January 2021
(This article belongs to the Special Issue Simulation-Optimization in Logistics, Transportation, and SCM)
Abstract
:The imbalanced distribution of shared bikes in the dockless bike-sharing system (a typical example of the resource-sharing system), which may lead to potential customer churn and lost profit, gradually becomes a vital problem for bike-sharing firms and their users. To resolve the problem, we first formulate the bike-sharing system as a Markovian queueing network with higher-demand nodes and lower-demand nodes, which can provide steady-state probabilities of having a certain number of bikes at one node. A model reduction method is then designed to reduce the complexity of the proposed model. Subsequently, we adopt an operator-based relocation strategy to optimize the reduced network. The objective of the optimization model is to maximize the total profit and act as a decision-making tool for operators to determine the optimal relocation frequency. The results reveal that it is possible for most of the shared bikes to gather at one low-demand node eventually in the long run under the influence of the various arrival rates at different nodes. However, the decrease of the number of bikes at the high-demand nodes is more sensitive to the unequal demands, especially when the size of the network and the number of bikes in the system are large. It may cause a significant loss for operators, to which they should pay attention. Meanwhile, different estimated values of parameters related with revenue and cost affect the optimization results differently.
1. Introduction
The existence of idle resources and people’s willingness to well use them to promote the sharing economy has brought several lifestyle changes, including various traffic modes. The sharing economy means people can share resources (e.g., services, skills, assets, etc.) through a network of private individuals and businesses, which may often but not always be at lower costs. Shared mobility, a typical resource sharing pattern, has become more popular and common, such as bike-sharing [1], ride-sharing [2], car-sharing [2] and electric vehicle sharing [3]. Apparently, the shared transport emergence contributes to protecting the environment, conserving energy, reducing traffic congestion and improving transportation resource utilization and availability [4].
However, there remain some limitations of current shared transport systems. For instance, users cannot find an available shared vehicle or bicycle nearby sometimes, or they have to spend too much time seeking idle ones when they are in a hurry. Sometimes, the idle cars or bikes are parked in low demand areas, causing potential profit loss for operators [3]. An essential reason is tidal commuter flows [1]; more specifically, citizens usually travel from residential areas (or home) to public transit locations (subway stations) or popular areas (e.g., commercial zones) during peak hours, thereby resulting in rare bikes in residential zones, whereas the overwhelming number of shared bikes near popular zones [5]. An optional solution for improving this is to rebalance or reposition shared resources, e.g., reposition shared-bikes by trucks in bike-sharing systems (see [6]) and reposition shared cars in vehicle sharing systems (see [3]).
This paper focuses on bike-sharing and aims at solving rebalance problems existing in bike-sharing systems. Generally, there are two typical types of bike-sharing systems: the traditional bike-sharing system with docking stations (e.g., Citi Bike, Divvy and Ford GoBike in America, see [1]) and the dockless bike-sharing system (e.g., Mobike in China, see [5]). The dockless bike-sharing system, the focus of this work and the latest type of bike-sharing system, also termed the free-floating bike-sharing system, implies users are allowed to park their bikes everywhere they want rather than fixed docking stations. As the dockless bike-sharing system emerges, the traditional bike-sharing system tends to lose competitiveness and gradually vanish in some countries, especially China.
Numerous previous studies concentrate on optimizing rebalance (or relocation) decisions, which includes two main streams: vehicle-based (also terms operator-based) approach and user-based approach [7]. For vehicle-based approach, the rebalance decision involves pick-up decisions (from which station to pick up how many idle bikes), drop off decisions (to which station to drop off bikes) and the routing decisions, and then the rebalance strategy is executed by a fleet of trucks (see, e.g., [6,8,9,10]). Such a rebalance approach requires accurate demand prediction and cannot handle dynamic settings in real-time well. The user-based approach attempts to guide customers to rebalance the shared-bikes by providing monetary incentives, e.g., recommend pick-up or drop-off areas for users (see [5]), design incentive programs (see, e.g., the Bike Angels program in [1]). Instead of determining the optimal practical level decisions (i.e., pick-up and delivery decisions) and incentive policies (for user-based rebalance), this work focuses on analyzing how the key factors affect system performance based on the Markovian queueing networks formulation and optimizing the rebalance frequency.
The rest of this paper is organized as follows. The relevant literature on resource-sharing system and rebalance in bike-sharing system is reviewed in Section 2. In Section 3, we first present a complete problem description and then introduce the Markovian queueing networks formulation in Section 3.1. Afterwards, the rebalance strategy optimization model is presented in Section 3.2. Section 4 provides the analysis and discussion of the steady-state probabilities derived from the theoretical models under the influence of unequal demands. Moreover, we address the profit analysis based on the optimization model in this section. Finally, some valuable conclusions and suggestions about the dockless bike-sharing system, especially from the operators’ perspective, are presented in Section 6.
2. Literature Review
Initially, few articles focus on the feasibility and impacts of bike-sharing as a new public transportation mode in urban areas [11,12,13]. Recently, more papers begin to discuss the sustainable development of bike-sharing systems, especially the dockless bike-sharing systems [10,14,15,16,17,18,19]. Because the study of dockless bike-sharing is still in progress, and some mature studies on the station-based bike-sharing can guide the development of the study on dockless bike-sharing, we review the literature on both station-based bike-sharing and dockless bike-sharing. Some other typical transport sharing systems are mentioned due to their contributions to resource sharing. These related studies can be classified into three major categories: system design, system analysis and system optimization. Each category involves a review of some major topics and relevant progress.
2.1. System Design
To build or expand a bike-sharing system, bike-sharing firms need to select an area and investigate the potential demand for shared bikes. Based on the essential research, these firms decide the scale of the network system, select bike pick-up locations and allocate shared bikes to each node in the network to meet the potential demand. There are several ways to estimate demand by connecting with various factors. One traditional way is to do a population study and a sample survey to determine the locations of the pick-up/drop-off nodes in the system [20]. Frade and Ribeiro proposed a methodology considering the distance and slope of city paths between any two traffic zones [21]. In the age of big data, some researchers extract valuable information from a large amount of historical data collected from existing bike-sharing systems. Xu et al. used deep learning approach with trip data to estimate dynamic demand for a citywide dockless bike-sharing system [22]. Besides demand prediction, how to build a bike-sharing network and where to allocate a number of bikes to serve users in the network are considered. Çelebi et al. considered station locations and bike allocation using a set-covering model and a queueing model for a station-based bike-sharing system, given a number of stations [23]. Cheng et al. [18] found that the station-based bikes are used more frequently near subway stations and commercial zones, whereas the dockless shared bikes are preferred in residential areas and near major roads, which provides useful suggestions for system operators to enhance the system efficiency by allocating and deploying these two types of shared bikes well.
2.2. System Analysis
In the operation phase of bike-sharing systems, many data can be collected and analyzed to find patterns (e.g., system patterns, bike usage and trip characteristics) and make changes from operators’ perspective. Mátrai and Tóth [16] aimed to identify the differences among various bike-sharing systems. According to their results, four main types of bike-sharing systems are involved after clustering: public systems, private systems, mixed systems and other systems. Bordagaray et al. used binary probit models to investigate travel behavior and impacts of different usage types (e.g., round trips, rental time reset and bike substitution) [24]. Gurumurthy et al. matched different single-person trips by identifying similar time and routes from cellphone-based real-time data using MATLAB [25]. Yang et al. used dockless bike data to analyze bike mobility patterns based on unique bike IDs, including spatial and temporal patterns [26]. Ji et al. compared regularity of bike usage between station-based bike-sharing and dockless bike-sharing [27]. Besides usage pattern analysis, Bakogiannis et al. paid attention to user perceptions and evaluated the information to get ideas about how to improve user experience [28]. For operators, gaining profits is important. Profits have a close relationship with costs and revenues. Yoon et al. investigated the impacts of different pricing plans in several cities on membership demand and ridership and presented a new pricing plan based on the estimated cost per trip and price sensitivity of customers to improve revenue [29]. Estrada et al. focused on how to determine operational cost based on defined performance, expected functionality of a system and cost driver analysis [30]. Chen et al. aimed at maximizing the profits by using the advantage of hassle costs, which are derived from the provided convenience of travel for customers [31].
Moreover, some literature analyze the impact of COVID-19 on the performance and the feasibility of the bike-sharing system [32,33,34]. According to the questionnaire survey and analysis results of reference [34], commuters who were previously commuting with taxis or ride-hailing/ride-sharing service now prefer shared bikes due to the safety concerns (reduce interpersonal contact). Teixeira et al. explored the relationship between bike sharing and subway systems by analyzing the trip data of New York City during the COVID-19 pandemic. The results reveal that travel demand in the bike-sharing system is more stable than subway system, and bike-sharing system enhances the robustness (the capability to resist disruptive events) of urban transport systems. Besides, they found a modal trend that some subway customers leave the systems and head to bike-sharing system. Hua et al. [32] examined that travel demand of bike sharing in Nanjing, China decreased significantly due to the pandemic control policies. These works implies that the COVID-19 leads to huge uncertainty and change in travel demand for bike-sharing systems, which bring new challenges on travel demand prediction and operation issues.
2.3. System Optimization
Several topics are involved in system optimization: fleet size management, rebalance of shared resources, etc. Sayarshad et al. proposed a multi-periodic optimization formulation to determine the minimum bike fleet size by maximizing the total profits [35]. Since that the main topic of system optimization related to this work is rebalance/relocation of shared resources, we mainly review rebalance related literature in this section. Optimizing resource-sharing systems by relocation, which means relocating shared resources (e.g., cars and bikes) to solve the problem of imbalanced distribution of resources and try to make supply meet demand, is mainly discussed. Taking shared bikes as an example, a main principle is to move extra bikes from locations which have a surplus supply of bikes to locations which have a shortage of bikes. Relocation strategies have two primary types: operator-based relocation strategy (see [6,8,9,10,14,15]) and user-based relocation strategy (see [1,5,7,36,37]). Some studies perform joint rebalance strategy by merging them together (see, e.g., [19]). An operator-based relocation strategy means relocation is driven by operators’ behavior (e.g., reposition by trucks) and a user-based relocation strategy means relocation is directly driven by users (e.g., design appropriate incentives).
In the early stage, the user-based relocation strategy may be sufficient to handle imbalance for the system. When user-based relocation is insufficient, operator-based relocation is applied by using a fleet of trucks to relocate bikes through well-designed routes. Liu et al. solved a static relocation problem and minimized the weighted sum of three factors (inconvenience level of finding an available bike, lost demand and operational time) [38]. Brinkmann et al. proposed a stochastic-dynamic lookahead policy to cope with changing demand patterns [39]. Legros used a Markov decision process to determine the priority of stations where bikes need to be relocated and minimizes the ratio of arrival rate of unsatisfied users who cannot find any bikes to determine the number of relocated bikes at appointed stations [40]. Brendel et al. adopted a user-based relocation strategy to increase usage in an electric vehicle sharing system [41]. Reiss et al. combined operator-based relocation with user-based relocation, which is called as a hybrid relocation strategy, in a dockless bike-sharing system [42].
Several factors affect the performance of relocation strategy, e.g., region partitioning policy, demand prediction, faulty bikes, etc. Many studies optimize the relocation strategy based on region partitioning, but, usually, the region partitioning results seems to be inefficient due to no well-predefined geographical zones. For example, for irregular areas, inefficient zone partitioning decisions may lead to very large errors in relocation stage. Jin et al. [19] investigated the effects of geographical zone scale on the imbalance estimation of the dockless bike-sharing system and the relocation decisions. Besides, they developed a region decomposition approach to handle large scale instances based on appropriate scales. Cheng et al. [17] designed a recurrent neural networks-based real-time rental and return demand prediction approach, which can offer estimated demand information as input parameters for rebalance optimization model. Moreover, sometimes, faulty bikes will lead to infeasibility of relocation strategy [15]. More specificity, all the shared bikes in the system (including faulty ones) are assumed as available inventory if faulty bikes are not considered in the problem; this assumption makes operators fail to estimate the actual real-time supply information and is more likely to result in impractical rebalance decisions. Du et al. [15] formulated the bike rebalancing problem with faulty bikes and operator-based rebalance policy for dockless bike-sharing systems, where a fleet of heterogeneous trucks, multiple depots and multiple visiting are considered. Usama et al. [14] explicitly considered the shifting decisions of faulty bikes rather than relocating them to the nearest station, i.e., bring broken bikes to the depot for repair.
Most existing literature related to rebalancing optimization adopts integer programming, reinforcement learning and heuristic approaches, which aim to make operational level decisions (e.g., truck route and the number of bikes to pickup/drop off at each node). A few studies use queueing theory to model bike-sharing problems and provide tactical level decisions (e.g., rebalance frequency). Sayarshad et al. obtained the queueing delay by using the queueing-based approximation and related the delay to a cost constraint of a dynamic relocation optimization model [43]. Samet et al. presented a closed queuing network model for a station-based bike-sharing system [44]. For station-based bike-sharing systems, customers may wait at a station to pick up or return a bike, because the parking spaces are fixed and finite. For dockless bike-sharing systems, wait time is negligible. If customers can find an available bike to ride, they will not wait behind others. If customers cannot find one, they will leave quickly and feel dissatisfied.
3. Methodology
3.1. Markovian Queueing Networks
3.1.1. Assumptions and Notations
The dockless bike-sharing system is modeled by a closed Markovian queueing network with connected nodes and a total of bikes. The bikes are distributed among the nodes. and are the sets of N nodes and K bikes, separately. Customers arrive at node to pick up bikes to ride and return bikes at node . Let be the transition probability from node to node . All of the nodes are fully connected because of the customers’ bike trips. The transition probabilities can reflect the information of customers’ destinations as well as geographical environment. If the route between two nodes is long and steep, there will be a low probability of riding bikes between these two nodes. High demand leads to a large value of the arrival rate. The main assumptions are made as follows:
- Customers arrive at a node one by one for picking up bikes rather than arriving in groups.
- The inter-arrival times of customers are exponentially distributed (i.e., the number of customer arrivals within a unit time interval is Poisson distributed) with an arrival rate at node i, and the arrivals at each node are completely independent.
- All of the probabilities are the same for each route from a start node to a destination node (which can also be the start node itself), which means for every pair of i and j.
- The time spent on picking up or dropping off bikes is negligible, which means customers do not have to wait in lines at any node in the network, and the trip time is not considered as an independent parameter in the theoretical models as our focus is the steady states in the long run, but it is included in the simulation model.
- The number of bikes is evenly distributed at each node at the beginning of the operation, and the total number of bikes in the system is fixed.
- The capacity of each node is large enough to accommodate K bikes.
- If a node has no bike during a period of time, customers will still arrive randomly and leave immediately, and the service for these customers will be regarded as the lost demand.
The notations are summarized in Table 1.
3.1.2. A Markovian Queueing Network with Higher Demands
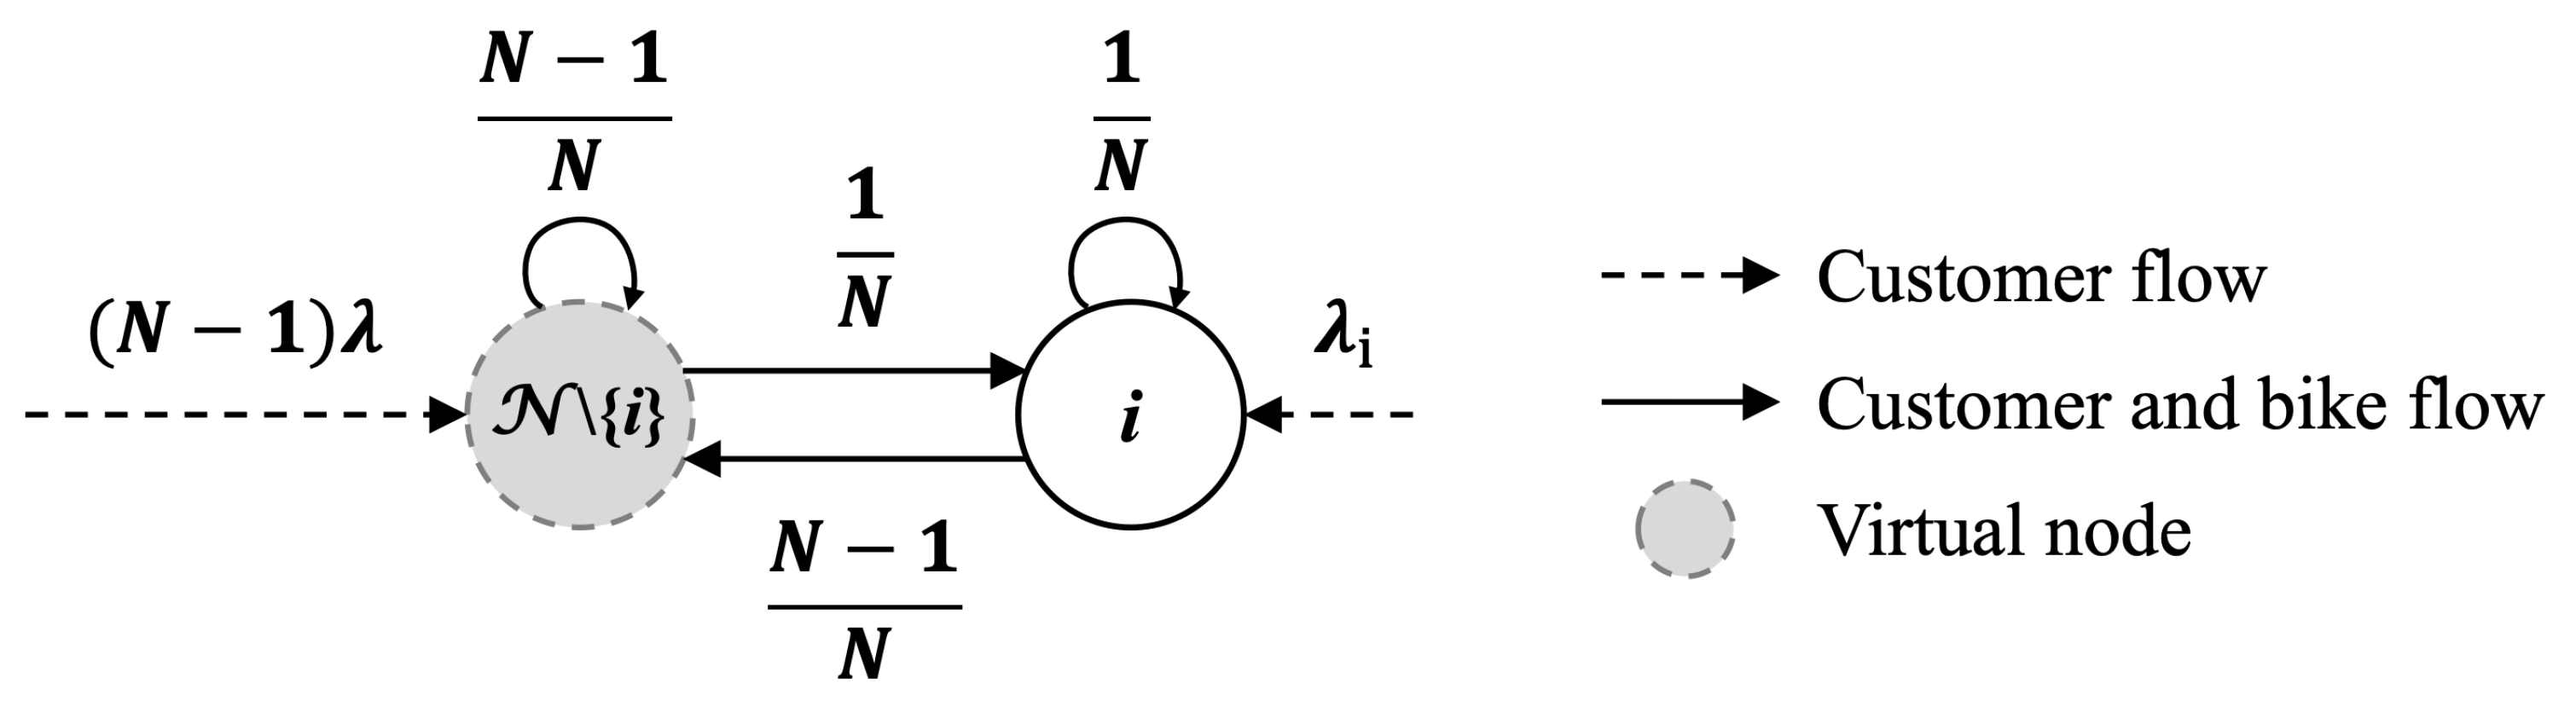
Samet et al. studied the possibility of applying a model reduction method to a closed queueing network [44]. The aim is to reduce the complexity of the network model. When the network model is used to model a dockless bike-sharing system, both the excessive nodes and their intricate relationship increase the burden of calculation rapidly and make the problem more difficult to solve. Considering the potential barrier, a model reduction method is adopted based on the basic idea proposed by Samet et al. [44]. The main idea of this method is to aggregate multiple nodes into a virtual single node. The additive property of independent Poisson random variables demonstrates its reliability from a demand-side perspective. If taking a three-node network as an example, we reduce a three-node system into a two-node system with a virtual node (i.e., a combination of two of the nodes). It is shown by the results that the aggregation of two nodes reduces the state space of the network significantly, from a three-tuple state space: to a two-tuple space: . More generally, a simplified model with one single node (i.e., node i) and a combination of nodes as a virtual node is shown in Figure 1.
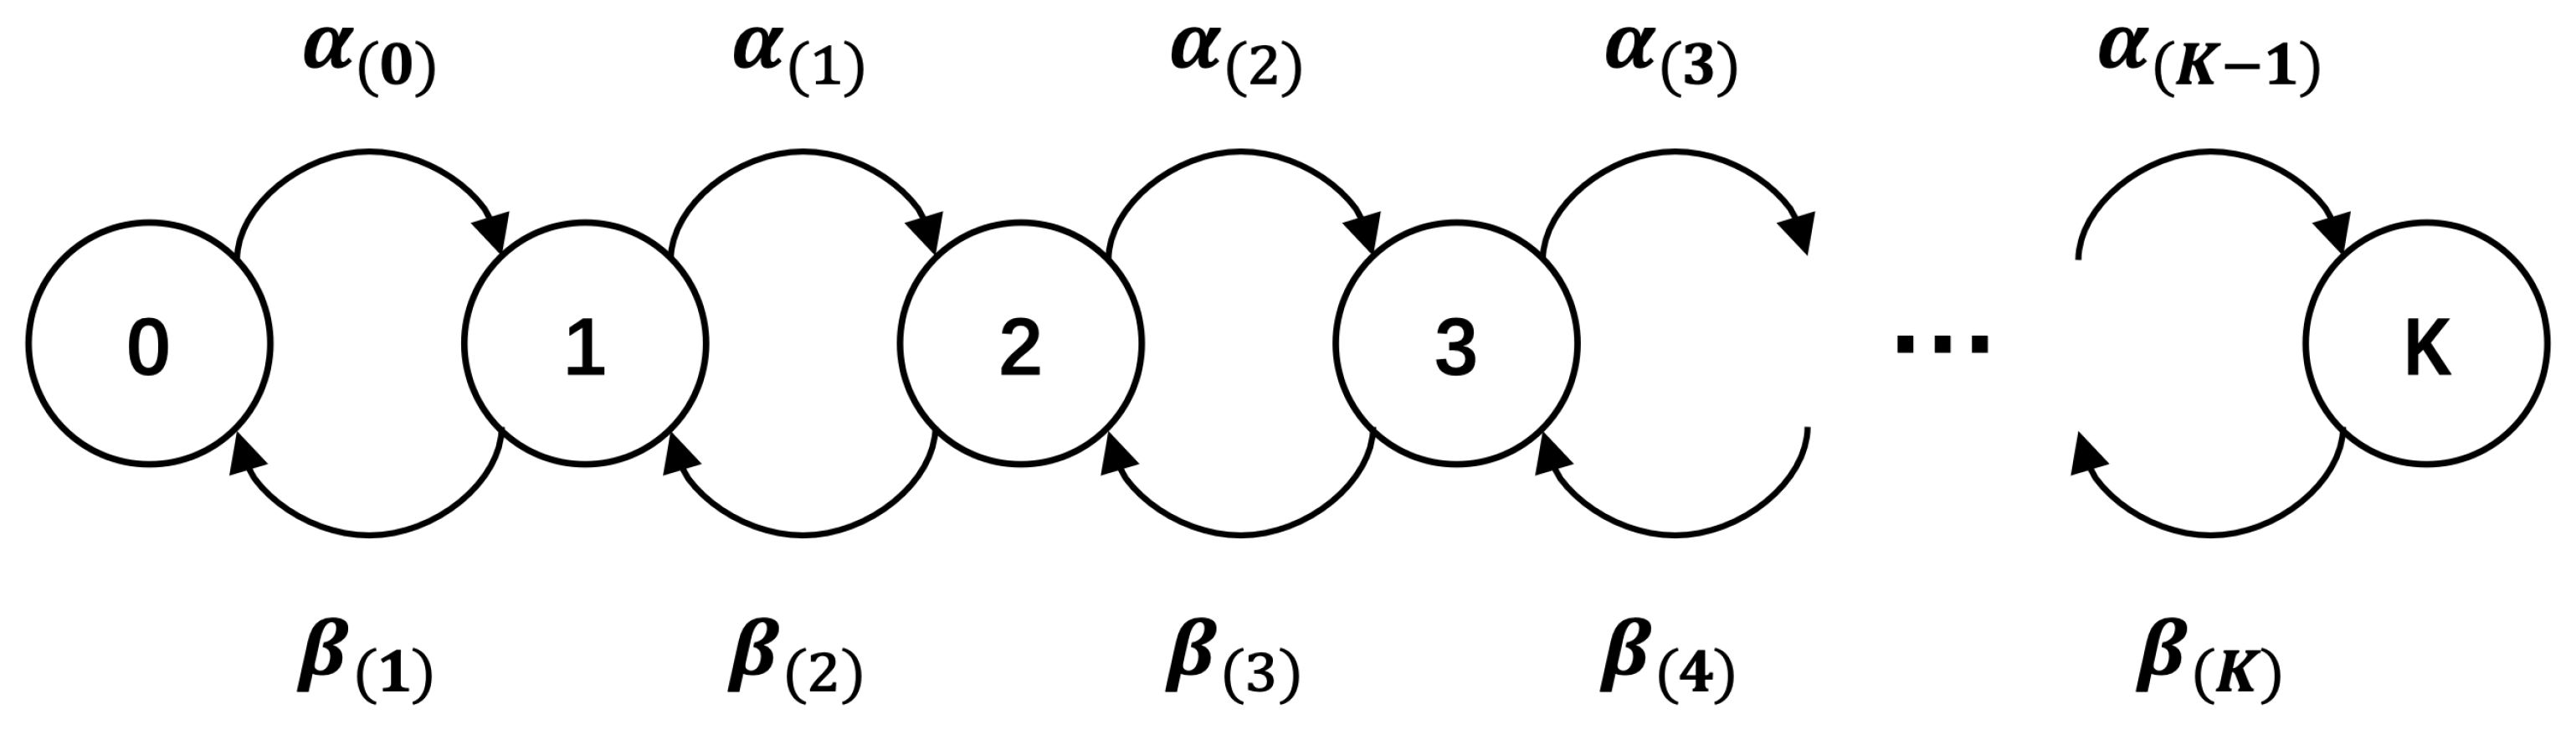
In this subsection, we build network models based on the model reduction method and differentiate a node with higher demands from the other nodes (i.e., ). We assume that it is possible to have zero bikes at the nodes which are inside a virtual node during the state transition process of the dockless bike-sharing system (see Figure 2). The digits in circles represent the changing number of bikes at the high-demand node. The number of bikes at a virtual node is K minus the circled number. Therefore, each circled number can be described as a state of the system. and are the state transition rates. means the rate of returning one bike, which is picked up at one of the nodes from the virtual node, at node i. means renting one bike at node i and returning it at one of the other nodes except node i. Although the complexity increases with the increasing number of nodes in the system, general formulas are concluded.
A three-node system:
A four-node system:
A N-node system:
is given by
The steady-state probabilities are given by
Based on , the formula of is yielded by
which leads to the formula of :
The value of tends to be 1 when is far larger than .
3.1.3. A Markovian Queueing Network with Higher Demands and Lower Demands
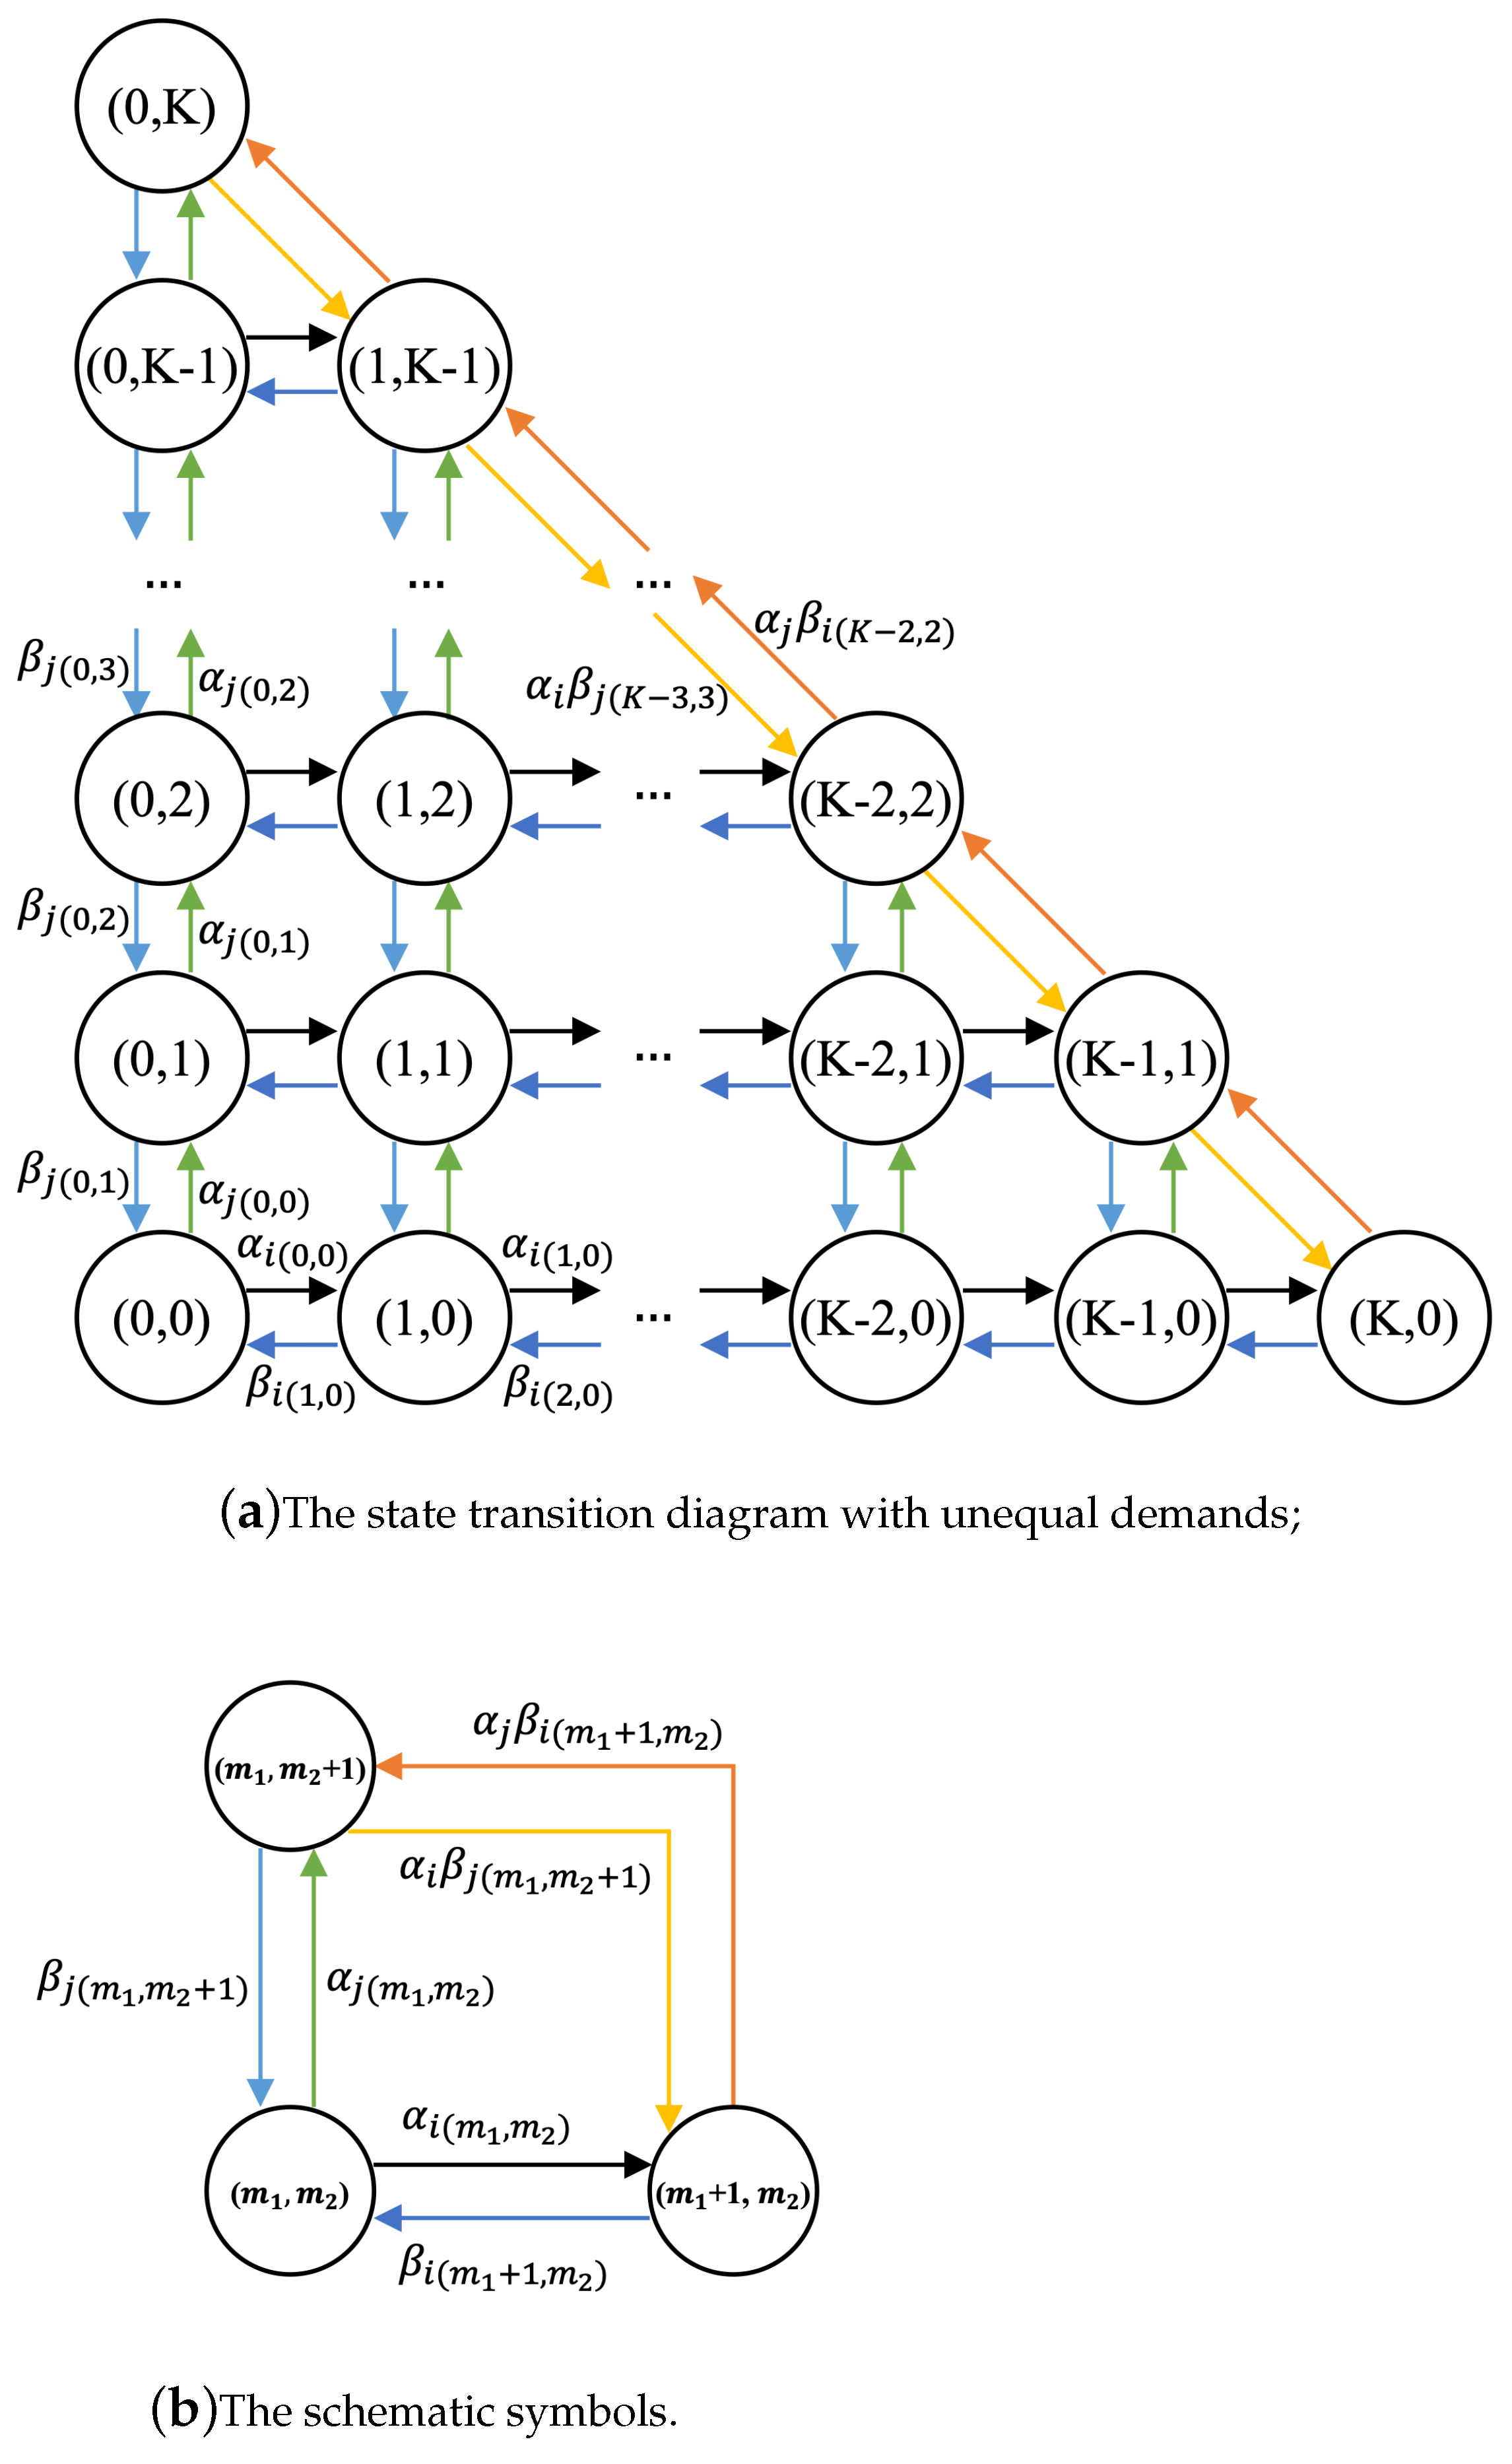
In reality, a bike-sharing system may include multiple nodes with complex and diverse demands from customers. To make the models more related to a real-world network, the Markovian queueing network model is extended in the paper to analyze the system under the influence of unequal demands, which include the higher demands and the lower demands. The reduced N-node network of the extension model is shown in Figure 3. Node i refers to a node with higher demands, and node j refers to a node with lower demands than the nodes (whose arrival rates are the same and represented by ) inside a virtual node (i.e., ).
With the existence of a virtual node and two single nodes, a three-tuple state space is used to represent the changing states of the whole system. Thanks to the fixed total number of bikes, a two-tuple state space performs a similar function, which represents the number of bikes at nodes i and j, separately (see Figure 4a,b). Each transition of the states means transferring one bike at a time. The six types of transition rates are defined as follows:
According to a main principle that the sum of the values of inflows equals to the sum of the values of outflows in a steady-state system, multiple equations (which are centered on each steady state and its directly-connected states) can be deducted. Equations are given as follows ():
In addition, there is a constraint toward the sum of the steady-state probabilities:
A unique solution of the steady-state probabilities can be obtained by solving the set of equations. The probabilities of having bikes at node i and the probabilities of having bikes at node j are given by the following formulas:
Since it is a problem of solving non-homogeneous linear equations, we can use matrix inversion or other efficient algorithms to compute the solutions. In this paper, we use the open source R statistics software to obtain the values of steady-state probabilities. The limitation is that the burden of computation becomes huger with the increase of K.
3.2. Rebalance Strategy Optimization Model
According to the probabilistic results of the Markovian network model with one high-demand node, shared bikes are likely to leave the high-demand node and gather at the relatively low-demand nodes in the system in the long run. The basic relocation strategy we tend to adopt is to relocate the extra bikes from the relatively low-demand nodes (which have been aggregated into a virtual node in the network model with one high-demand node) to the high-demand node (which is represented as node i in the network model with one high-demand node) to reach the initial number of bikes at each node. The relocation strategy can be implemented as many times as needed during normal operation of the bike-sharing system, and the relocation frequency can reflect the number of times of relocation.
In this paper, we assume that a more effective relocation strategy is able to reduce the value of more rapidly, which can be described as . represents the steady-state probability of having zero bikes at node i under the influence of relocation. The formulas and descriptions are based on the Markovian queueing network model with higher demands. When operators implement the relocation strategy more frequently, decreases from a basic value of . To determine the relationship between the probabilities without relocation and the probabilities with relocation, we have . When equals , , where the value of r represents no relocation is implemented in the system. means the operators start to relocate bikes. Considering that the sum of all the probabilities equals 1, the other probabilities are assumed to increase proportionately to satisfy the constraint, which are given by
For , we have
Our aim is to maximize the total profit obtained by the operators of the dockless bike-sharing system after implementing the relocation strategy. The operating revenue comes from the customers who rent the shared bikes and return them successfully without any trouble. In reality, the customers often have to pay for the time they spend using the bikes. We assume that the operating revenue is in proportion to the customer demand, the number of available bikes at each node and the unit price charged by the operators. If there is a high demand for shared bikes or there is a large number of available bikes in the area, it is likely to squeeze more revenue from the customers. Based on the adjusted probabilities of having a number of bikes at node i, the operating revenue is given by
The operating cost can be divided into the cost of relocations (which is assumed to be in proportion to the relocation frequency and the unit cost of implementing the relocation strategy) and the penalty derived from the unmet demands (which is assumed to be in proportion to the arrival rate, the possibility of having zero bikes at each node and the unit cost of penalties). Due to the given constraint for r, if no relocation is implemented in the system, the cost of relocations will not occur. According to the initial assumption that the nodes inside a virtual node are the same, it is assumed that, when the total number of bikes at these nodes (i.e., the nodes which are aggregated into one virtual node) is less than the number of the nodes inside the virtual node, there may be no bike available at some of these nodes. If the arrival rate at the node where there is no bike available for customers to use is large or the possibility of having zero bikes at the node is high, the cost of penalty from unmet demands will increase. The sum of the operating cost is given by
The total profit after implementing the relocation strategy can be calculated by the following formula:
means the total profit with the corresponding relocation frequency r. represents the optimal relocation frequency which corresponds to the maximum profit that the operators can obtain after relocating the bikes in the system. It is found that the relationship between and r takes the shape of a concave curve. Before the relocation frequency reaches the turning point, increases with the increase of r. After the turning point, decreases with the increase of r. The turning point turns out to be the best choice for the relocation frequency and the total profit. Therefore, we take a derivative of the total profit with respect to the relocation frequency in order to get the formula of . The first-order partial derivative of Equation (29) with respect to r is given by
When the first-order partial derivative equals 0, can be calculated by the following formula
4. Results
4.1. Probabilistic Results
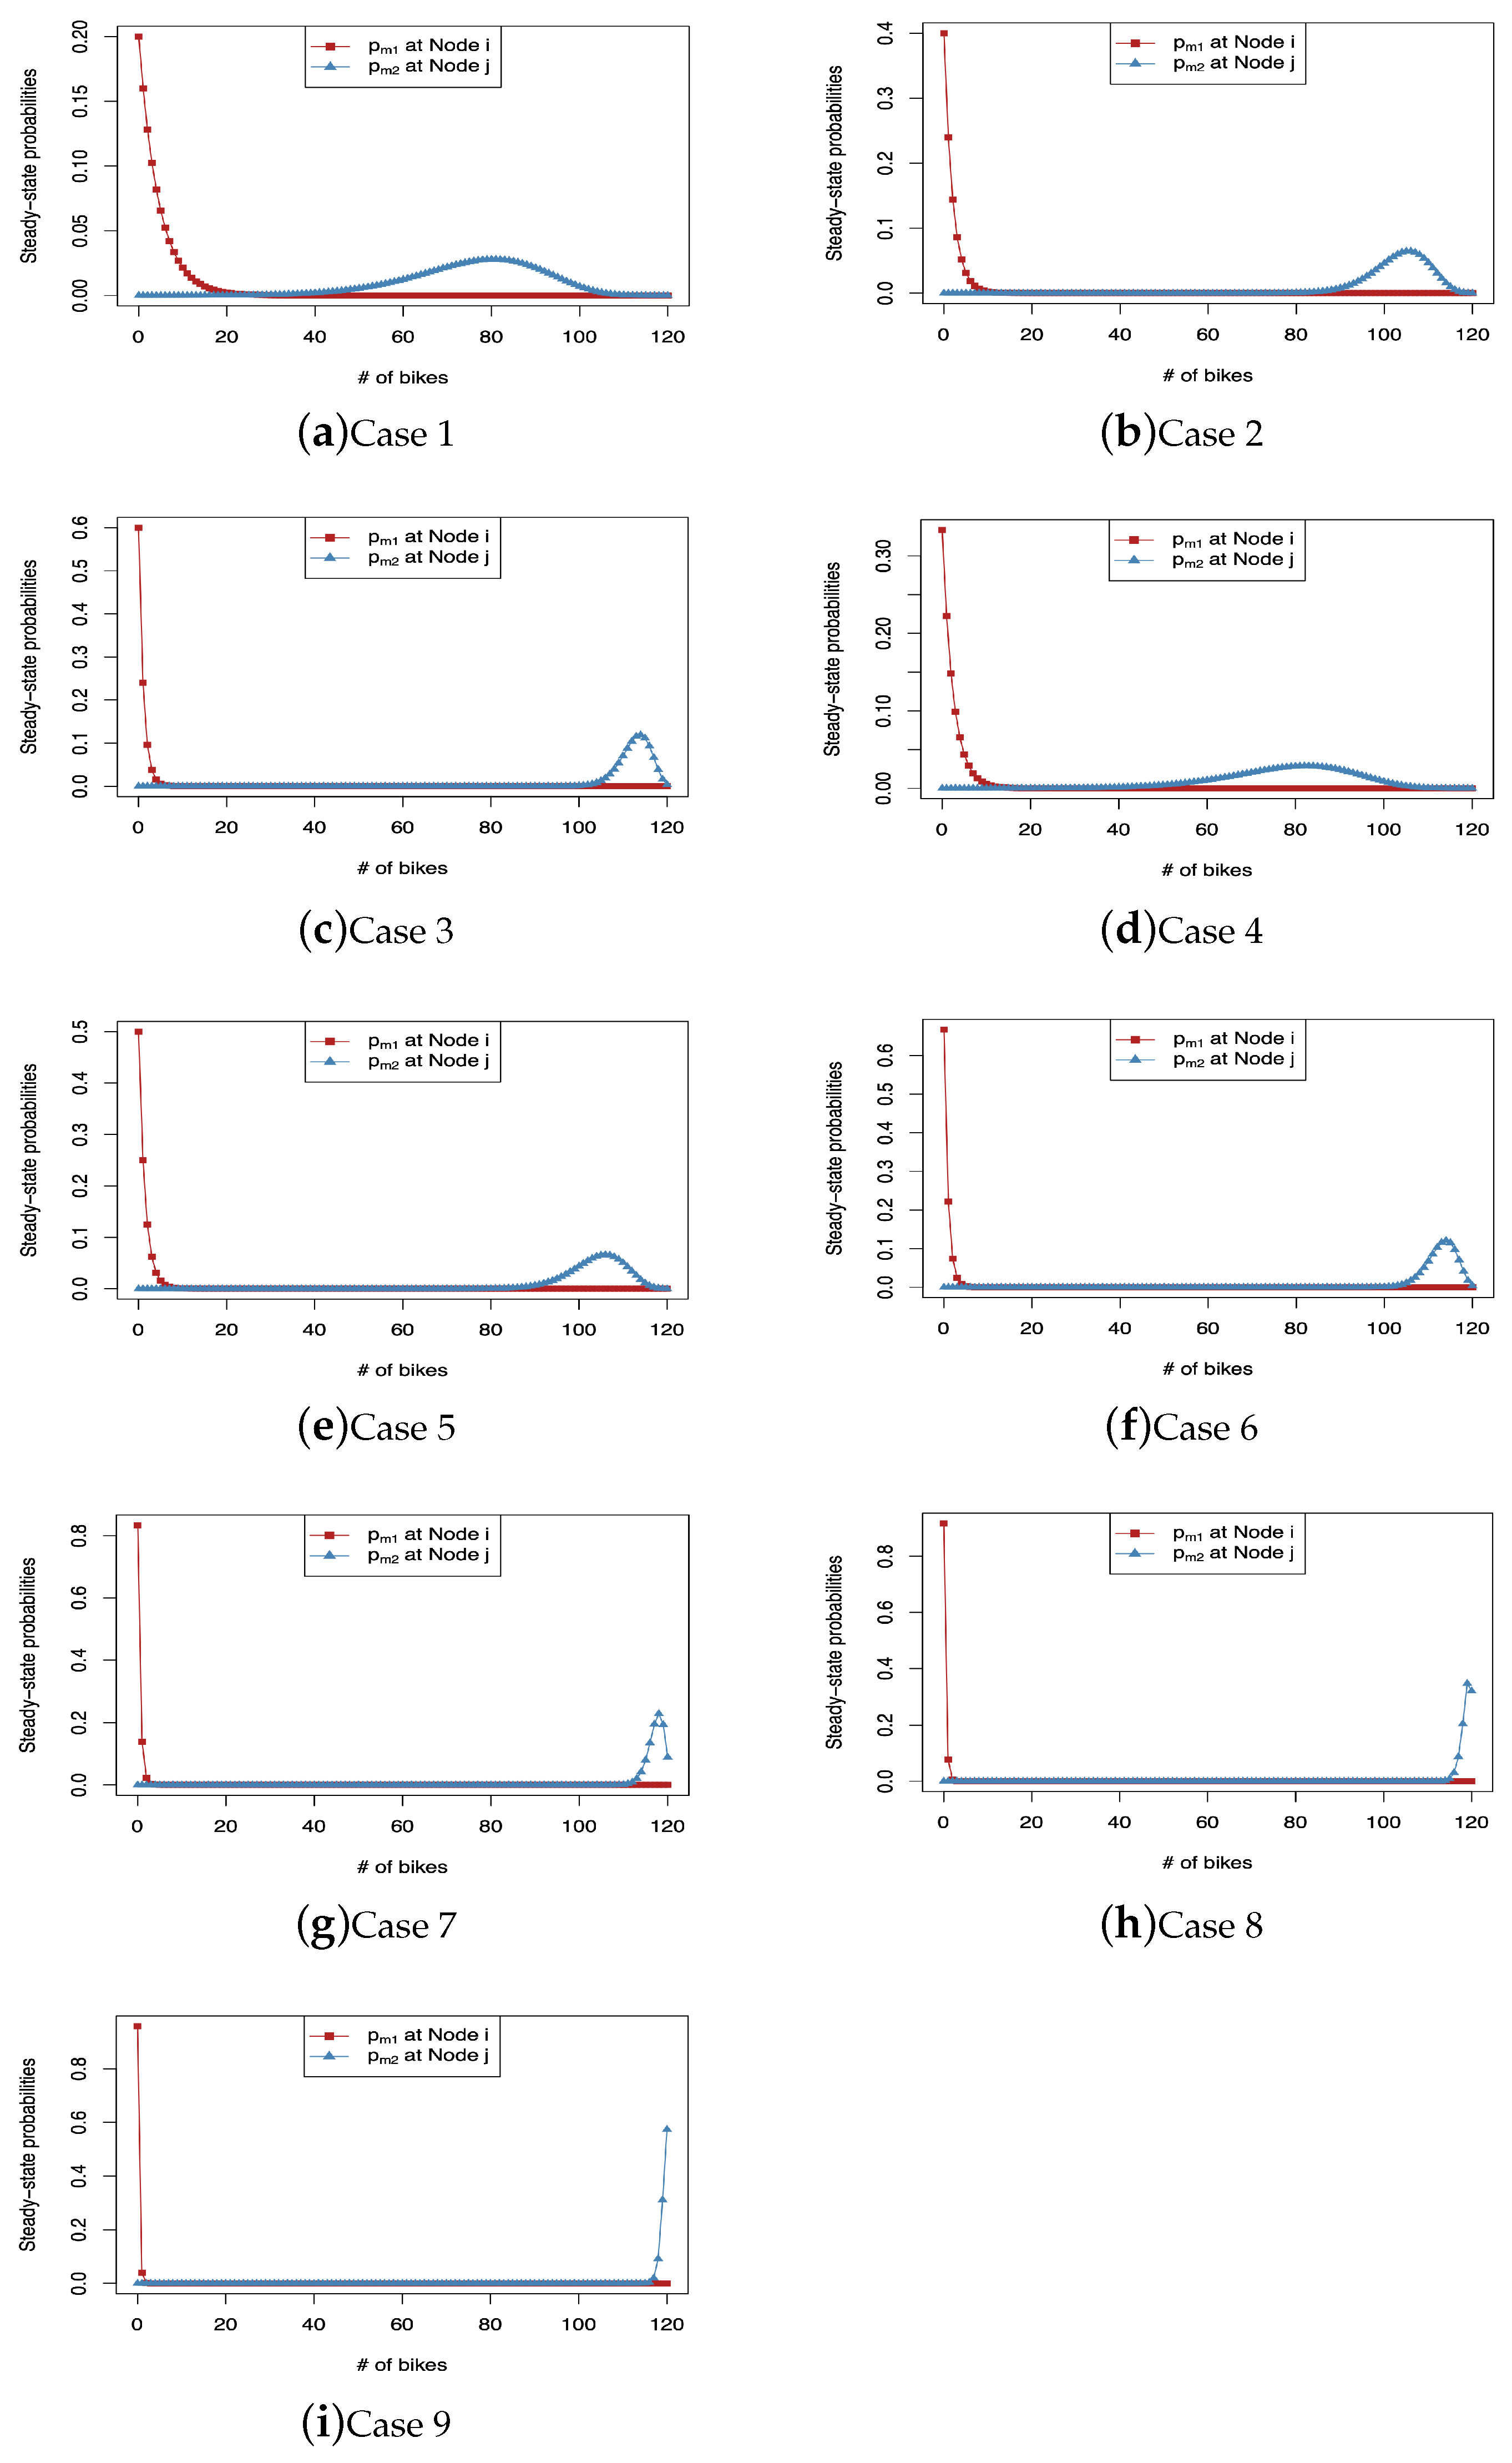
The relationship between the steady-state probabilities and the arrival rates at different nodes in the network model with unequal demands is investigated in multiple cases by numerical experiments. The setting of the arrival rates and the corresponding figures of the cases are shown in Table 2.

Table 2.
Setting of the arrival rates in the network model with unequal demands.
| Case ID | Figure | |||
|---|---|---|---|---|
| Case 1 | 1 | 1 | 0.8 | Figure 5a |
| Case 2 | 1 | 1 | 0.6 | Figure 5b |
| Case 3 | 1 | 1 | 0.4 | Figure 5c |
| Case 4 | 1 | 1.2 | 0.8 | Figure 5d |
| Case 5 | 1 | 1.2 | 0.6 | Figure 5e |
| Case 6 | 1 | 1.2 | 0.4 | Figure 5f |
| Case 7 | 1 | 1.2 | 0.2 | Figure 5g |
| Case 8 | 1 | 1.2 | 0.1 | Figure 5h |
| Case 9 | 1 | 1.2 | 0.05 | Figure 5i |
It can be concluded from the change of the arrival rates at different nodes that the long-term bike distribution in the dockless bike-sharing system is more sensitive to the higher demands than the lower demands. Due to the difference, the number of bikes at the nodes with higher demands decreases more quickly and more likely than the increase of the number of bikes at the nodes with lower demands. For the nodes with middle demands, the number of bikes may decrease more mildly compared with the decreased number of bikes at the nodes with higher demands. It is suggested that the operators should pay more attention to the high-demand nodes, which may suffer the biggest loss in the system. Unless one low-demand node has the smallest arrival rate which is terribly different from the arrival rates at the other nodes, there is a relatively small possibility that all of the bikes in the system are transferred to one low-demand node in a limited period of time, which can be regarded as the biggest imbalance of bikes in the system.
4.2. Profitability Results
4.2.1. The Effect of Relocation-Related Parameters
c and are two positive parameters which can be regarded as a measure of the effectiveness of an adopted relocation strategy. If the relocation strategy is more effective, c is supposed to decrease and is supposed to increase, which can contribute a low probability of having zero bikes at the high-demand node under the influence of relocations. In the numerical experiments, c and are changed separately to analyze their influence on the performance of the optimization model, as shown in Figure 6.
The value of decreases with the increase of in Figure 6a,b. When c decreases or increases, the maximum profit tends to increase and the optimal relocation frequency tends to decrease. It is indicated that the relocation strategy works well. An effective relocation strategy can reduce the relocation frequency and save the expense of frequent relocations, which can increase the total profit indirectly. However, the concavity and convexity of the curves shown in these two figures is different between c and . In Figure 6a, is more sensitive when the value of c is small, and is more sensitive when the value of c is large. In Figure 6b, is more sensitive when the value of is small, and is more sensitive when the value of is large. Since it is preferable for operators to gain more profits, a combination of a small c and a large can properly decrease the sensitivity of and to the effectiveness of relocation strategies, which allows the operators to make more flexible decisions about what kind of relocation strategies they want to adopt.
4.2.2. The Effect of Revenue-Related and Cost-Related Parameters
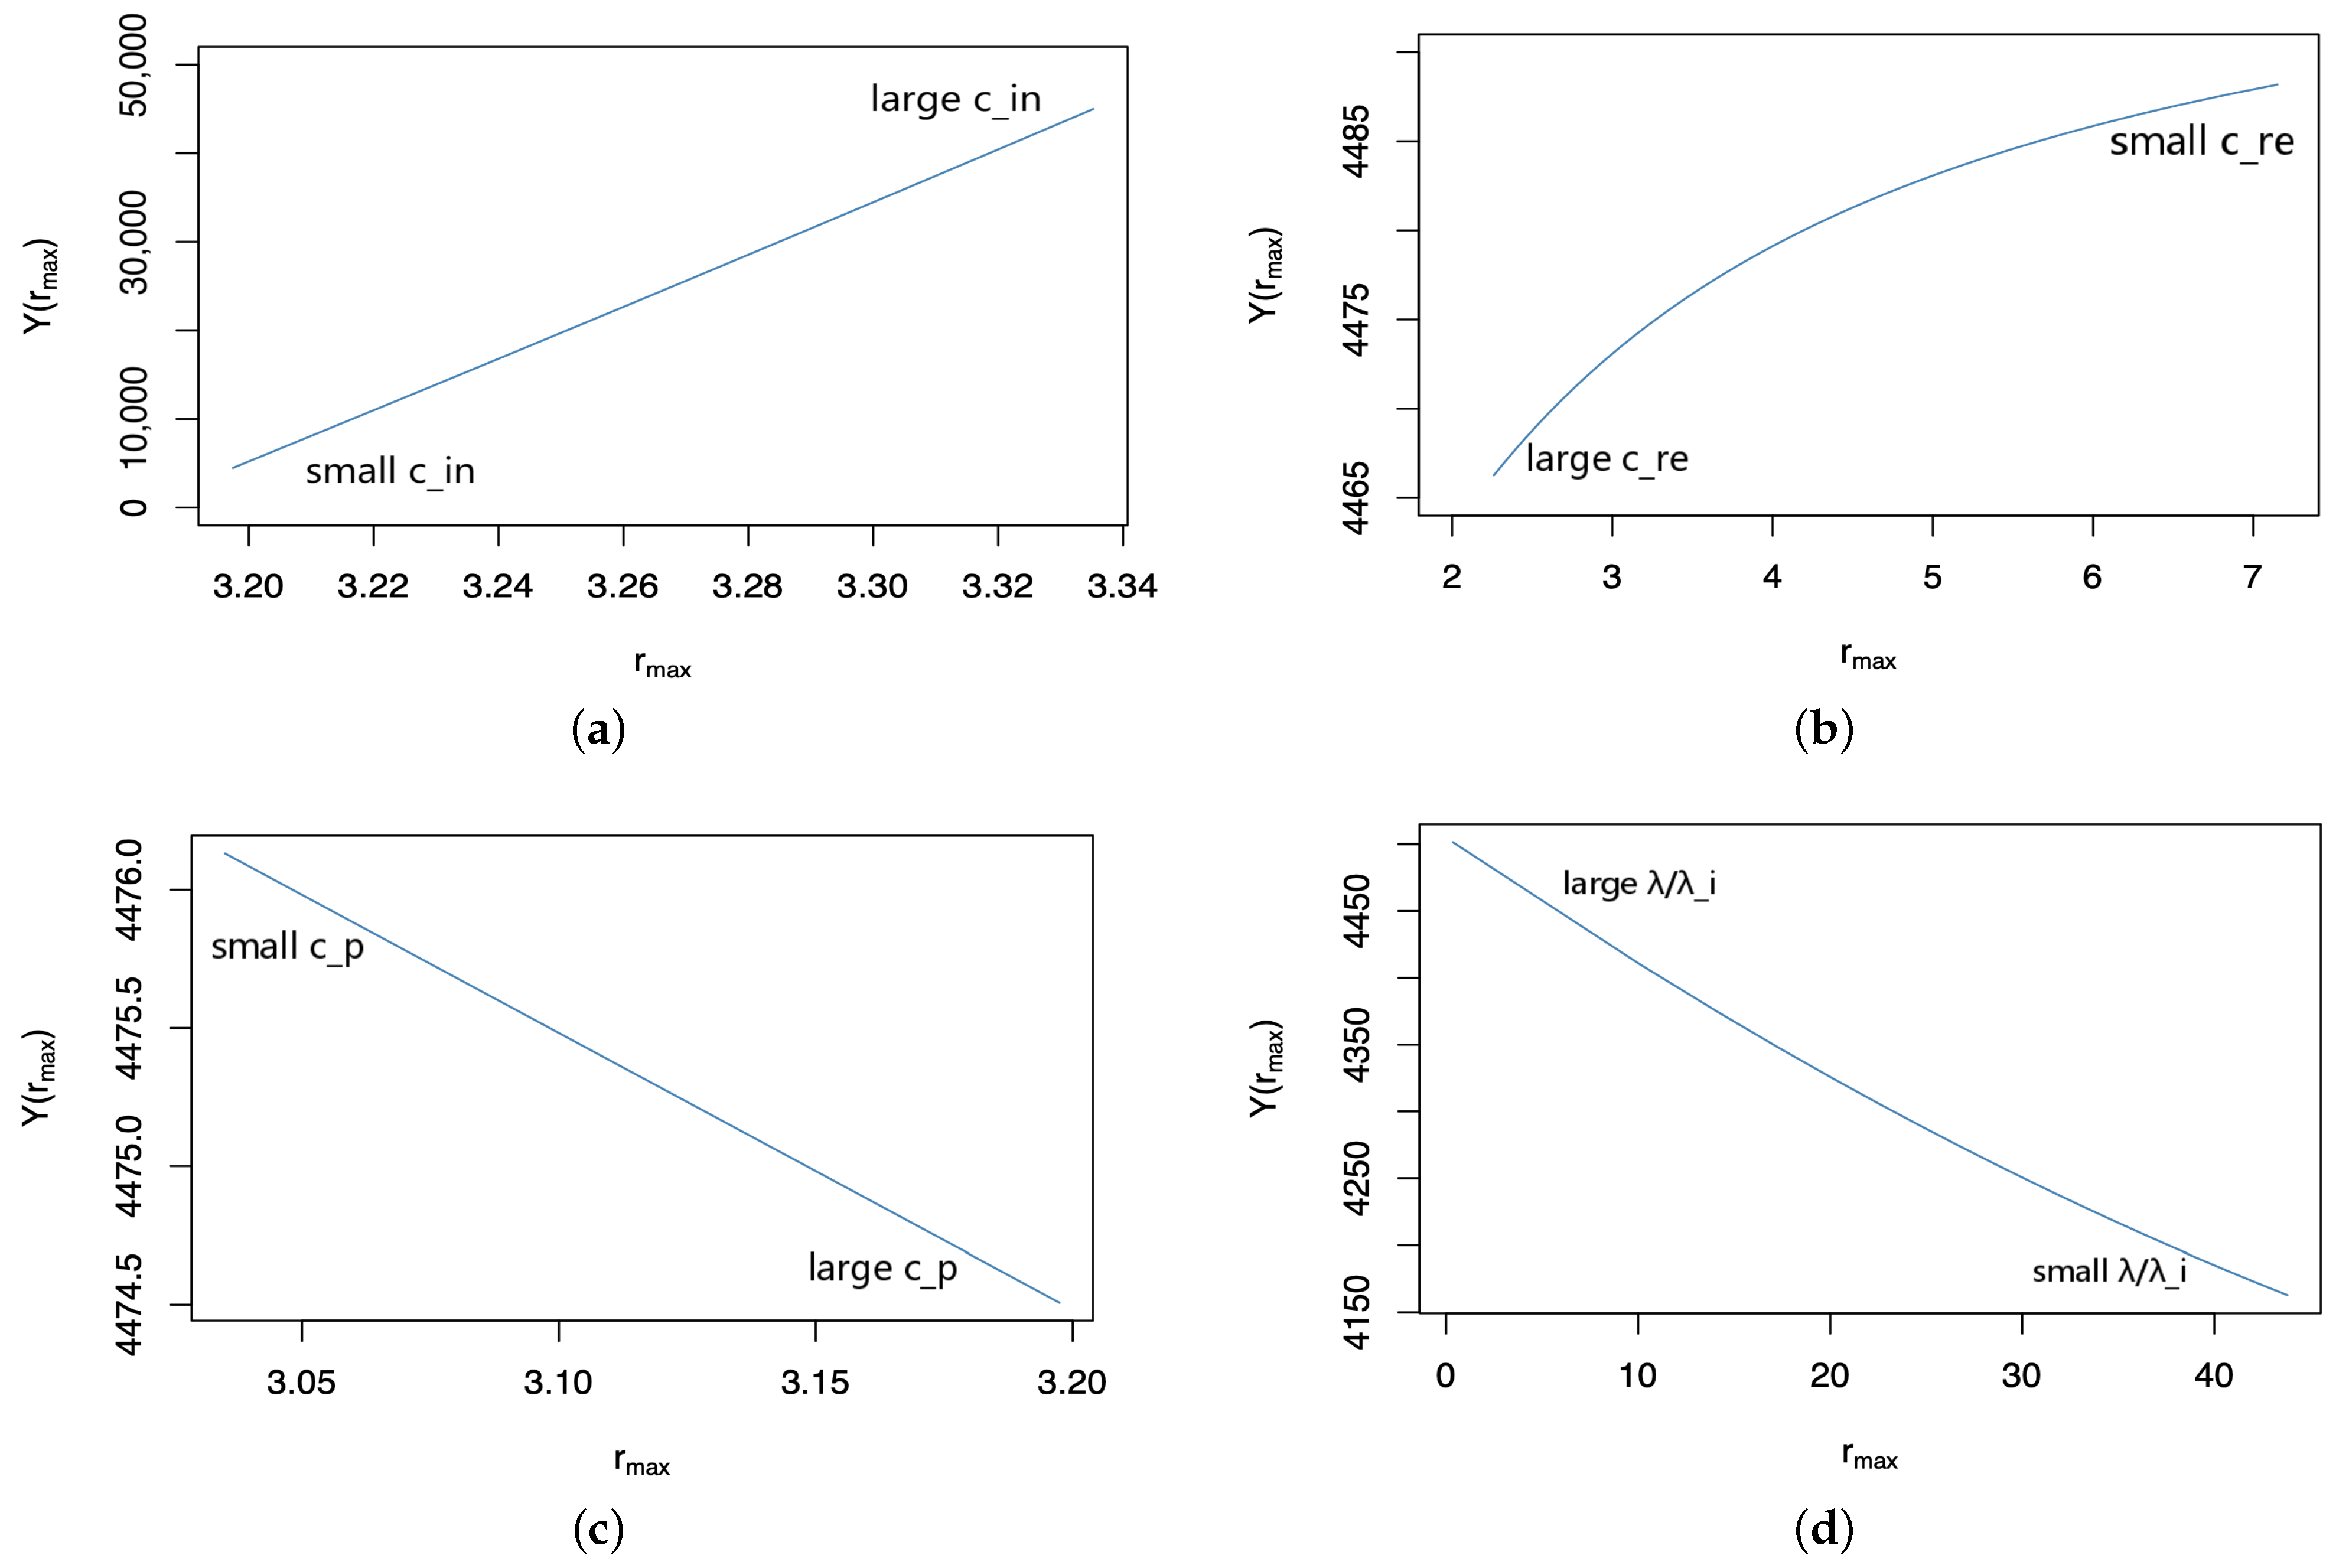
and are parameters related to the operating revenue and the operating cost. As shown in Figure 7a,b, increases with the increase of under the influence of and . increases with the decrease of under the influence of (Figure 7c). It can be explained by the different meanings of these parameters. The relocation strategy can reset the number of bikes at each node to an initial state, which make the bike-sharing system able to supply the customers with enough bikes after each relocation. Due to the definition of , the high price means operators can generate more revenue by satisfying the customer demand, which can be promised by frequent relocations. Therefore, with the increase of , both the optimal relocation frequency and the maximum profit increase. According to the change of and , as shown in Figure 7a, is insensitive to the increase of and is sensitive to the increase of . In reality, operators can make more profits by raising the unit price. However, they have to consider the unit price given by their competitors, who have the ability to pull regular customers from them.
Although acquiring a large revenue from customers can cover the expense on relocations to some extent, the increase of the optimal relocation frequency is slight. For operators, pricing decisions have a significant influence on the total profit but have a slight effect on the decision-making about relocating bikes. As shown in Figure 7b, with the increase of , both and decrease. It is because that the high cost of relocating bikes is supposed to decrease the relocation frequency to save cost for operators. With the decrease of relocation frequency, the total profit decreases due to the huge expense on relocations and the decreased revenue caused by the occasional shortage of bikes at some nodes. The slope of the curve in Figure 7b indicates that is more sensitive to the change of than , especially when has a small value.
It is suggested that operators should consider how to reduce the expense on relocating bikes in the system, which can be very beneficial to solve the imbalance problem of bike distribution. In Figure 7c, increases and decreases with the increase of . The large value of means a large penalty of losing customers, which happens when customers arrive at the node where there is no bike available. The increase of relocation frequency can minimize the losses by relocating bikes to the nodes with high demands. With the increase of the penalty and the increased cost derived from frequent relocations, the total profit decreases. In the real world, the unit cost of penalty from unmet demands is difficult to measure. In the numerical experiments, the value of is set far larger than the values of and . It is because unmet demands may have a significant impact on the loyalty of the regular customers. If the customers often cannot find any bikes to ride, they are likely to feel dissatisfied with the dockless bike-sharing system and turn to alternatives, which may bring about great losses (e.g., an obvious decrease in the potential revenue) for the bike-sharing company. Therefore, setting a large value of in the optimization model for a relocation problem can emphasize the need for a suitable relocation frequency.
4.2.3. The Effect of Arrival Rates
The arrival rate is the most important parameter which is concerned with the customer demand for bike service in the paper. The influence of the arrival rates at different nodes on the relocation problem is also investigated by a numerical experiment. In Figure 7d, increases and ) decreases with the decrease of . It is because that the decrease of means the customer demand at different nodes becomes more unequal, which leads to an increased possibility of the imbalanced distribution of bikes in the system. Frequent relocations are needed to deal with this problem. Due to the high cost of frequent relocations, the total profit decreases. From the results, it is observed that, compared with the maximum profit, the optimal relocation frequency is more sensitive to the difference of the arrival rates at different nodes in the network, especially when is small. When gets close to 1, the optimal relocation frequency decreases rapidly and becomes very close to 0. Therefore, we suggest that the operators should pay attention to the difference of the customer demand among the nodes, especially when the demand is always changing as the time goes by. Not only does the unequal demand have a significant influence on the bike distribution in the long term, but also it requires multiple times of relocating bikes in the bike-sharing system. If the unit cost of relocations is high, the operators may have to spend a huge amount of money on relocating bikes under the influence of a small value of .
5. Discussion
By analyzing the results of Markovian queueing network, we can obtain the several interesting findings. Compared with the high-demand node, the number of bikes at the lower-demand node changes at a much slower rate. As a whole, we guess that the number of bikes at the higher-demand node is likely to be smaller than the number of bikes at each of the middle-demand nodes (if there are a relatively large number of middle-demand nodes) and is much smaller than the number of bikes at the lower-demand node. The bike distribution at the lower-demand node is not sensitive to the increase of the arrival rate at the higher-demand node, which means bikes at the higher-demand node are likely to be scattered at both the lower-demand node and some middle-demand nodes. It is suggested that the operators should pay more attention to the nodes with higher demands, where the number of bikes decreases rapidly, rather than the nodes with lower demands, where the number of bikes increases relatively slowly, although these all belong to two extremes of the nodes with different customer demand. When the total number of bikes in the system is fixed, the expected number of bikes at the low-demand node in the long run tends to decrease and its possible range becomes broader with the increase of the number of nodes and the decrease of the initial number of bikes at each node. It suggests that a large number of nodes in the network can reduce the influence of the unequal demands moderately and make the long-term bike distribution more balanced than a small number of nodes in the network. Meanwhile, a larger initial number of bikes at each node can lead to a more imbalanced distribution of shared bikes in the system without human intervention.
The rebalance problem is solved by an operator-based rebalance strategy based on the proper utilization of probabilistic results provided by the theoretical models. The main objective is to maximize the total profit and get the optimal relocation frequency. It is found that the relationship between the total profit and the relocation frequency takes the shape of a concave curve, which makes it quick to find the global optimal point by taking derivative of the expression.
There are various key parameters related to the optimization problem (i.e., the indexes which can measure the effectiveness of each relocation c and , the unit price , the unit cost of relocation , the unit cost of unmet demands and the different ratios of arrival rates). It is common sense from a business perspective that operators prefer the solution which can bring more profits and requires a low frequency of relocating bikes.
The numerical experiments show that small values of c and and large values of can fit the preference. A small value of c and a large value of can reduce the probability of having zero bikes at the high-demand node, which means an effective relocation strategy can result in a low frequency of relocation and increase the total profit mainly by saving the total cost. When the value of c is small, the maximum profit is more sensitive to the change of the optimal relocation frequency, while, when the value of is large, the maximum profit is less sensitive to the change of the optimal relocation frequency. Therefore, a small c and a large are complementary to each other, which can provide one of the criteria for operators to select useful relocation strategies.
When the ratio of arrival rates is changed in the optimization model, it is indicated that a large difference between the arrival rates is going to decrease the total profit and make the optimal relocation frequency increase rapidly, which totally deviates from the operators’ purpose. The unequal demands not only have an adverse effect on bike distribution but also influence the relocation frequency and the profit operators can obtain. What the operators can do is to balance the customer demand among the nodes as much as possible, and their efforts spent on balancing can be directly reflected in the benefits. Differing from the influence of , a large value of and a small value of can increase both the optimal relocation frequency and the maximum total profit, which means the operators can get a maximum profit and also have to carry out more frequent relocations. The change of has a greater influence on the total profit and the change of has a greater influence on the optimal relocation frequency. With the decrease of , the maximum total profit becomes less sensitive to the change of the optimal relocation frequency, which means the benefit of relocating bikes gradually reduces.
Therefore, operators can consider increasing the unit price within a customer’s acceptable range in order to make more profits. If the unit cost of each relocation can be reduced significantly, a high frequency of relocation can bring more profits and satisfy more demands. The unit cost of unmet demand is the most uncertain parameter for operators, so it is suggested that the operators should predict the value of carefully by investigation and analysis and minimize the disappointment from customers who cannot find any available bikes to ride if possible.
6. Conclusions
In short, although our work takes a dockless bike-sharing system as an example, the developed methods and models can be extended to apply in some other resource-sharing systems when necessary. The theoretical models are general, flexible and extensible. In this work, we first formulate the bike-sharing system as a Markovian queueing network with higher-demand nodes and lower-demand nodes. Thereafter, we employ an operator-based rebalance strategy and optimize the rebalance frequency at the minimum cost. The results reveal that it is possible for most of the shared bikes to gather at one low-demand node eventually in the long run under the influence of the various arrival rates at different nodes. However, the decrease in the number of bikes at the high-demand nodes is more sensitive to the unequal demands, especially when the size of the network and the number of bikes in the system are large. It may cause a significant loss for operators, to which they should pay attention. Meanwhile, different estimated values of parameters related to revenue and cost affect the optimization results differently. By analysis of some factors with practical meanings, this paper can bring real-world insights.
There are also some limitations to the study, which can be regarded as directions for further research. The influence of different arrival rates on the distribution of bikes in the dockless bike-sharing system is the focus of our research. In the optimization model for solving the relocation problems, the relocation costs can be estimated based on how many bikes are relocated, but the distance of relocating bikes from one node to another is not considered, which is also a limitation of our proposed methods. The optimization models for solving relocation problems can be extended to apply to a more general Markovian network model with multiple high-demand nodes and low-demand nodes in the future study. Additionally, the impact of COVID-19 can also be involved in the future research, for instance, high/median/low risk areas can be regarded as various types of nodes in the Markovian network. These heterogeneous types of nodes are associated with various levels of demand decrease and uncertainty, which brings new challenges on system optimization in bike-sharing systems.
Author Contributions
Conceptualization, X.M. and W.K.C.; methodology, X.M.; software, X.L.; formal analysis, X.M.; investigation, X.M.; writing—original draft preparation, X.M. and X.L.; writing—review and editing, X.M. and X.L.; visualization, X.M. and X.L.; supervision, W.K.C.; and funding acquisition, W.K.C. All authors have read and agreed to the published version of the manuscript.
Funding
This paper was partially funded by Shenzhen Municipal Development and Reform Commission, Shenzhen Environmental Science and New Energy Technology Engineering Laboratory, Grant Number: SDRC [2016]172.
Data Availability Statement
Not Applicable.
Conflicts of Interest
The authors declare no conflict of interest.
References
- Freund, D.; Henderson, S.G.; O’Mahony, E.; Shmoys, D.B. Analytics and bikes: Riding tandem with motivate to improve mobility. INFORMS J. Appl. Anal. 2019, 49, 310–323. [Google Scholar] [CrossRef]
- Mourad, A.; Puchinger, J.; Chu, C. A survey of models and algorithms for optimizing shared mobility. Transp. Res. Part B Methodol. 2019, 123, 323–346. [Google Scholar] [CrossRef]
- He, L.; Hu, Z.; Zhang, M. Robust repositioning for vehicle sharing. Manuf. Serv. Oper. Manag. 2020, 22, 241–256. [Google Scholar] [CrossRef]
- Furuhata, M.; Dessouky, M.; Ordóñez, F.; Brunet, M.E.; Wang, X.; Koenig, S. Ridesharing: The state-of-the-art and future directions. Transp. Res. Part B Methodol. 2013, 57, 28–46. [Google Scholar] [CrossRef]
- Pan, L.; Cai, Q.; Fang, Z.; Tang, P.; Huang, L. A deep reinforcement learning framework for rebalancing dockless bike sharing systems. Proc. AAAI Conf. Artif. Intell. 2019, 33, 1393–1400. [Google Scholar] [CrossRef]
- Schuijbroek, J.; Hampshire, R.C.; Van Hoeve, W.J. Inventory rebalancing and vehicle routing in bike sharing systems. Eur. J. Oper. Res. 2017, 257, 992–1004. [Google Scholar] [CrossRef] [Green Version]
- Pal, A.; Zhang, Y. Free-floating bike-sharing: Solving real-life large-scale static rebalancing problems. Transp. Res. Part C Emerg. Technol. 2020, 80, 92–116. [Google Scholar] [CrossRef]
- O’Mahony, E.; Shmoys, D.B. Data analysis and optimization for (citi) bike sharing. Proc. Aaai Conf. Artif. Intell. 2015, 29, 687–694. [Google Scholar]
- Liu, J.; Sun, L.; Chen, W.; Xiong, H. Rebalancing bike sharing systems: A multi-source data smart optimization. In Proceedings of the 22nd ACM SIGKDD International Conference on Knowledge Discovery and Data Mining, San Francisco, CA, USA, 13–17 August 2016; pp. 1005–1014. [Google Scholar]
- Li, Y.; Zheng, Y.; Yang, Q. Dynamic bike reposition: A spatio-temporal reinforcement learning approach. In Proceedings of the 24th ACM SIGKDD International Conference on Knowledge Discovery & Data Mining, London, UK, 19–23 August 2018; pp. 1724–1733. [Google Scholar]
- Parkes, S.D.; Marsden, G.; Shaheen, S.A.; Cohen, A.P. Understanding the Diffusion of Public Bikesharing Systems: Evidence from Europe and North America. J. Transp. Geogr. 2013, 31, 94–103. [Google Scholar] [CrossRef]
- Wang, M.; Zhou, X. bike-sharing systems and congestion: Evidence from US cities. J. Transp. Geogr. 2017, 65, 147–154. [Google Scholar] [CrossRef]
- Ma, Y.; Lan, J.; Thornton, T.; Mangalagiu, D.; Zhu, D. Challenges of collaborative governance in the sharing economy: The case of free-floating bike-sharing in Shanghai. J. Clean. Prod. 2018, 197, 356–365. [Google Scholar] [CrossRef]
- Usama, M.; Zahoor, O.; Shen, Y.; Bao, Q. Dockless bike-sharing system: Solving the problem of faulty bikes with simultaneous rebalancing operation. J. Transp. Land Use 2020, 13, 491–515. [Google Scholar] [CrossRef]
- Du, M.; Cheng, L.; Li, X.; Tang, F. Static rebalancing optimization with considering the collection of malfunctioning bikes in free-floating bike sharing system. Transp. Res. Part E: Logist. Transp. Rev. 2020, 141, 102012. [Google Scholar] [CrossRef]
- Mátrai, T.; Tóth, J. Cluster Analysis of Public Bike Sharing Systems for Categorization? IET Intell. Transp. Syst. 2020, 12, 5501. [Google Scholar] [CrossRef]
- Chen, P.C.; Hsieh, H.Y.; Su, K.W.; Sigalingging, X.K.; Chen, Y.R.; Leu, J.S. Predicting station level demand in a bike-sharing system using recurrent neural networks? IET Intell. Transp. Syst. 2020, 14, 554–561. [Google Scholar] [CrossRef]
- Cheng, L.; Yang, J.; Chen, X.; Cao, M.; Zhou, H.; Sun, Y. How could the station-based bike sharing system and the free-floating bike sharing system be coordinated? J. Transp. Geogr. 2020, 89, 102896. [Google Scholar] [CrossRef]
- Jin, X.; Tong, D. Station-Free Bike Rebalancing Analysis: Scale, Modeling, and Computational Challenges. Isprs Int. J. Geo Inf. 2020, 9, 691. [Google Scholar] [CrossRef]
- Galatoulas, N.F.; Genikomsakis, K.N.; Ioakimidis, C.S. Analysis of potential demand and costs for the business development of an electric vehicle sharing service. Sustain. Cities Soc. 2018, 42, 148–161. [Google Scholar]
- Frade, I.; Ribeiro, A. Bicycle Sharing Systems Demand. Procedia Soc. Behav. Sci. 2014, 111, 518–527. [Google Scholar] [CrossRef] [Green Version]
- Xu, C.; Ji, J.; Liu, P. The station-free sharing bike demand forecasting with a deep learning approach and large-scale datasets. Transp. Res. Part C Emerg. Technol. 2018, 95, 47–60. [Google Scholar] [CrossRef]
- Çelebi, D.; Yörüsün, A.; Işık, H. Bicycle sharing system design with capacity allocations. Transp. Res. Part B Methodol. 2018, 114, 86–98. [Google Scholar] [CrossRef]
- Bordagaray, M.; Dell’Olio, L.; Fonzone, A.; Ibeas, Á. Capturing the conditions that introduce systematic variation in bike-sharing travel behavior using data mining techniques. Transp. Res. Part C Emerg. Technol. 2016, 71, 231–248. [Google Scholar] [CrossRef]
- Gurumurthy, K.M.; Kockelman, K.M. Analyzing the dynamic ride-sharing potential for shared autonomous vehicle fleets using cellphone data from Orlando, Florida. Comput. Environ. Urban Syst. 2018, 71, 177–185. [Google Scholar] [CrossRef]
- Yang, Y.; Heppenstall, A.; Turner, A.; Comber, A. A spatiotemporal and graph-based analysis of dockless bike-sharing patterns to understand urban flows over the last mile. Comput. Environ. Urban Syst. 2019, 77, 101361. [Google Scholar] [CrossRef]
- Ji, Y.; Ma, X.; He, M.; Jin, Y.; Yuan, Y. Comparison of usage regularity and its determinants between docked and dockless bike-sharing systems: A case study in Nanjing, China. J. Clean. Prod. 2020, 255, 120110. [Google Scholar] [CrossRef]
- Bakogiannis, E.; Siti, M.; Tsigdinos, S.; Vassi, A.; Nikitas, A. Monitoring the first dockless bike-sharing system in Greece: Understanding user perceptions, usage patterns and adoption barriers. Res. Transp. Bus. Manag. 2019, 33, 100432. [Google Scholar] [CrossRef]
- Yoon, G.; Chow, J.Y. Unlimited-ride bike-share pass pricing revenue management for casual riders using only public data. Int. J. Transp. Sci. Technol. 2020, 9, 159–169. [Google Scholar] [CrossRef]
- Estrada, A.; Romero, D.; Pinto, R.; Pezzotta, G.; Lagorio, A.; Rondini, A. A Cost-Engineering Method for Product-Service Systems Based on Stochastic Process Modelling: Bergamo’s bike-sharing PSS. Procedia CIRP 2017, 64, 417–422. [Google Scholar] [CrossRef] [Green Version]
- Chen, Y.; Zha, Y.; Wang, D.; Li, H.; Bi, G. Optimal pricing strategy of a bike-sharing firm in the presence of customers with convenience perceptions. J. Clean. Prod. 2020, 253, 119905. [Google Scholar] [CrossRef]
- Hua, M.; Chen, X.; Cheng, L.; Chen, J. Should bike sharing continue operating during the COVID-19 pandemic? Empirical findings from Nanjing, China. arXiv 2020, arXiv:2012.02946. [Google Scholar]
- Teixeira, J.F.; Lopes, M. The link between bike sharing and subway use during the COVID-19 pandemic: The case-study of New York’s Citi Bike. Transp. Res. Interdiscip. Perspect. 2020, 6, 100166. [Google Scholar]
- Nikiforiadis, A.; Ayfantopoulou, G.; Stamelou, A. Assessing the Impact of COVID-19 on Bike-Sharing Usage: The Case of Thessaloniki, Greece. Sustainability 2020, 12, 8215. [Google Scholar] [CrossRef]
- Sayarshad, H.; Tavassoli, S.; Zhao, F. A multi-periodic optimization formulation for bike planning and bike utilization. Transp. Res. Part C Emerg. Technol. 2012, 36, 4944–4951. [Google Scholar] [CrossRef]
- Singla, A.; Santoni, M.; Bartók, G.; Mukerji, P.; Meenen, M.; Krause, A. Incentivizing users for balancing bike sharing systems. Proc. Aaai Conf. Artif. Intell. 2015, 29, 723–729. [Google Scholar]
- Fricker, C.; Gast, N. Incentives and redistribution in homogeneous bike-sharing systems with stations of finite capacity. Euro J. Transp. Logist. 2016, 5, 261–291. [Google Scholar] [CrossRef] [Green Version]
- Liu, Y.; Szeto, W.Y.; Ho, S.C. A static free-floating bike repositioning problem with multiple heterogeneous vehicles, multiple depots, and multiple visits. Transp. Res. Part C Emerg. Technol. 2018, 92, 208–242. [Google Scholar] [CrossRef]
- Brinkmann, J.; Ulmer, M.W.; Mattfeld, D.C. Dynamic Lookahead Policies for Stochastic-Dynamic Inventory Routing in bike-sharing Systems. Comput. Oper. Res. 2019, 106, 260–279. [Google Scholar] [CrossRef]
- Legros, B. Dynamic repositioning strategy in a bike-sharing system; how to prioritize and how to rebalance a bike station. Eur. J. Oper. Res. 2019, 272, 740–753. [Google Scholar] [CrossRef]
- Brendel, A.B.; Lichtenberg, S.; Brauer, B.; Nastjuk, I.; Kolbe, L.M. Improving electric vehicle utilization in carsharing: A framework and simulation of an e-carsharing vehicle utilization management system. Eur. J. Oper. Res. 2018, 64, 230–245. [Google Scholar] [CrossRef]
- Reiss, S.; Bogenberger, K. A Relocation Strategy for Munich’s bike-sharing System: Combining an operator-based and a user-based Scheme. Transp. Res. Procedia 2017, 22, 104–114. [Google Scholar] [CrossRef]
- Sayarshad, H.R.; Chow, J.Y. Non-myopic relocation of idle mobility-on-demand vehicles as a dynamic location-allocation-queueing problem. Transp. Res. Part E Logist. Transp. Rev. 2017, 106, 60–77. [Google Scholar] [CrossRef]
- Samet, B.; Couffin, F.; Zolghadri, M.; Barkallah, M.; Haddar, M. Model reduction for studying a bike-sharing System as a closed queuing network. Procedia Manuf. 2018, 25, 39–46. [Google Scholar] [CrossRef]
Figure 1.
A reduced N-node network with the same probabilities and the same arrival rates at the nodes which are aggregated into a virtual node.
Figure 1.
A reduced N-node network with the same probabilities and the same arrival rates at the nodes which are aggregated into a virtual node.

Figure 2.
The state transition diagram with a high-demand node.

Figure 3.
A reduced N-node network with the same probabilities and unequal demands.

Figure 4.
The detailed state transition diagram.

Figure 5.
Probabilities with respect to the number of bikes at nodes i and j.

Figure 6.
Effect of relocation-related parameters. (a) The maximum profit after implementing the relocation strategy with respect to the optimal relocation frequency under the influence of c; (b) The maximum profit after implementing the relocation strategy with respect to the optimal relocation frequency under the influence of m.

Figure 7.
Effect of revenue- and cost-related parameters and arrival rates. (a) The maximum profit after implementing the relocation strategy with respect to the optimal relocation frequency under the influence of ; (b) The maximum profit after implementing the relocation strategy with respect to the optimal relocation frequency under the influence of ; (c) The maximum profit after implementing the relocation strategy with respect to the optimal relocation frequency under the influence of . (d) The maximum profit after implementing the relocation strategy with respect to the optimal relocation frequency under the influence of .

Table 1.
Overview of notations.
| Notation | Units | Definitions |
|---|---|---|
| N | [nodes] | Total number of nodes in a system |
| K | [bikes] | Total number of bikes in a system () |
| [bikes] | The initial number of bikes at each node in the system | |
| [people/min] | Arrival rate at node | |
| [people/min] | A certain value of the arrival rate | |
| [people/min] | Transition rate of returning one bike to node i by a customer riding from one of the other nodes except node i () | |
| [people/min] | Transition rate of renting one bike from node i to one of the other nodes except node i () | |
| [people/min] | A certain value of the transition rate | |
| [people/min] | A certain value of the transition rate | |
| - | Probability of having l bikes at node i with no relocation () | |
| [people/min] | Transition rate of renting one bike at the virtual node and returning it at node i () | |
| [people/min] | Transition rate of renting one bike at the virtual node and reurning it at node j () | |
| [people/min] | Transition rate of renting one bike at Node and returning it at the virtual node i () | |
| [people/min] | Transition rate of renting one bike at Node and returning it at the virtual node j () | |
| [people/min] | Transition rate of renting one bike at Node and returning it at node i () | |
| [people/min] | Transition rate of renting one bike at Node and returning it at node j () | |
| - | Probability of having bikes at node i () | |
| - | Probability of having bikes at node j () | |
| - | Probability of having bikes at node i and having bikes at node j with no relocation () | |
| - | Adjusted probability of having l bikes at node i with relocation () | |
| r | [times] | Relocation frequency during operation time |
| c | - | Coefficient of variation in probability of having zero bikes at node i under the influence of relocation |
| - | Index of measuring the influence of relocation on steady-state probabilities | |
| B | - | Coefficient of variation in probability of having bikes at node i under the influence of relocation |
| [RMB ·min/(bike·person)] | Unit revenue per bike per person during operation time | |
| [RMB /time] | Unit cost of one-time relocation | |
| [RMB·min/person] | Penalty per person for unmet demands during operation time | |
| [RMB] | Total profit with relocation | |
| [times] | Optimal relocation frequency which corresponds to the maximum total profit with relocation | |
| [RMB] | Maximum total profit with relocation by adopting the optimal relocation frequency |
Publisher’s Note: MDPI stays neutral with regard to jurisdictional claims in published maps and institutional affiliations. |
© 2021 by the authors. Licensee MDPI, Basel, Switzerland. This article is an open access article distributed under the terms and conditions of the Creative Commons Attribution (CC BY) license (http://creativecommons.org/licenses/by/4.0/).
Share and Cite
MDPI and ACS Style
Mo, X.; Liu, X.; Chan, W.K. Modeling and Optimization in Resource Sharing Systems: Application to Bike-Sharing with Unequal Demands. Algorithms 2021, 14, 47. https://0-doi-org.brum.beds.ac.uk/10.3390/a14020047
AMA Style
Mo X, Liu X, Chan WK. Modeling and Optimization in Resource Sharing Systems: Application to Bike-Sharing with Unequal Demands. Algorithms. 2021; 14(2):47. https://0-doi-org.brum.beds.ac.uk/10.3390/a14020047
Chicago/Turabian StyleMo, Xiaoting, Xinglu Liu, and Wai Kin (Victor) Chan. 2021. "Modeling and Optimization in Resource Sharing Systems: Application to Bike-Sharing with Unequal Demands" Algorithms 14, no. 2: 47. https://0-doi-org.brum.beds.ac.uk/10.3390/a14020047
Note that from the first issue of 2016, this journal uses article numbers instead of page numbers. See further details here.