Article

An Investigation of Alternatives to Transform Protein Sequence Databases to a Columnar Index Schema

1
Line of Business Life Science, Adesso Schweiz AG, 8048 Zürich, Switzerland
2
Bioprocess Engineering, University of Magdeburg, 39106 Magdeburg, Germany
3
Databases and Software Engineering, University of Magdeburg, 39106 Magdeburg, Germany
*
Author to whom correspondence should be addressed.
Submission received: 9 January 2021 / Revised: 5 February 2021 / Accepted: 8 February 2021 / Published: 11 February 2021
(This article belongs to the Special Issue Biological Knowledge Discovery from Big Data)

Abstract

:
Mass spectrometers enable identifying proteins in biological samples leading to biomarkers for biological process parameters and diseases. However, bioinformatic evaluation of the mass spectrometer data needs a standardized workflow and system that stores the protein sequences. Due to its standardization and maturity, relational systems are a great fit for storing protein sequences. Hence, in this work, we present a schema for distributed column-based database management systems using a column-oriented index to store sequence data. In order to achieve a high storage performance, it was necessary to choose a well-performing strategy for transforming the protein sequence data from the FASTA format to the new schema. Therefore, we applied an in-memory map, HDDmap, database engine, and extended radix tree and evaluated their performance. The results show that our proposed extended radix tree performs best regarding memory consumption and runtime. Hence, the radix tree is a suitable data structure for transforming protein sequences into the indexed schema.

1. Introduction

Mass spectrometers are widely-used devices (the mass spectrometry market will grow from $5.3 billion to $10.5 billion from 2016–2025 [1]) enabling the identification of proteins from any sample and thus to understand the ongoing biological process in the sample [2,3,4]. The identified proteins can help to optimize biochemical processes, for example those in biogas plants [5,6], or diagnose diseases such as inflammatory bowel diseases [7] or even the spike proteins of the SARS-CoV2 virus [8]. The measurement of a mass spectrometer takes up to two hours and is followed by converting the measured data into a readable format. In order to gain insights into the converted data, an analysis step is required: the protein identification [
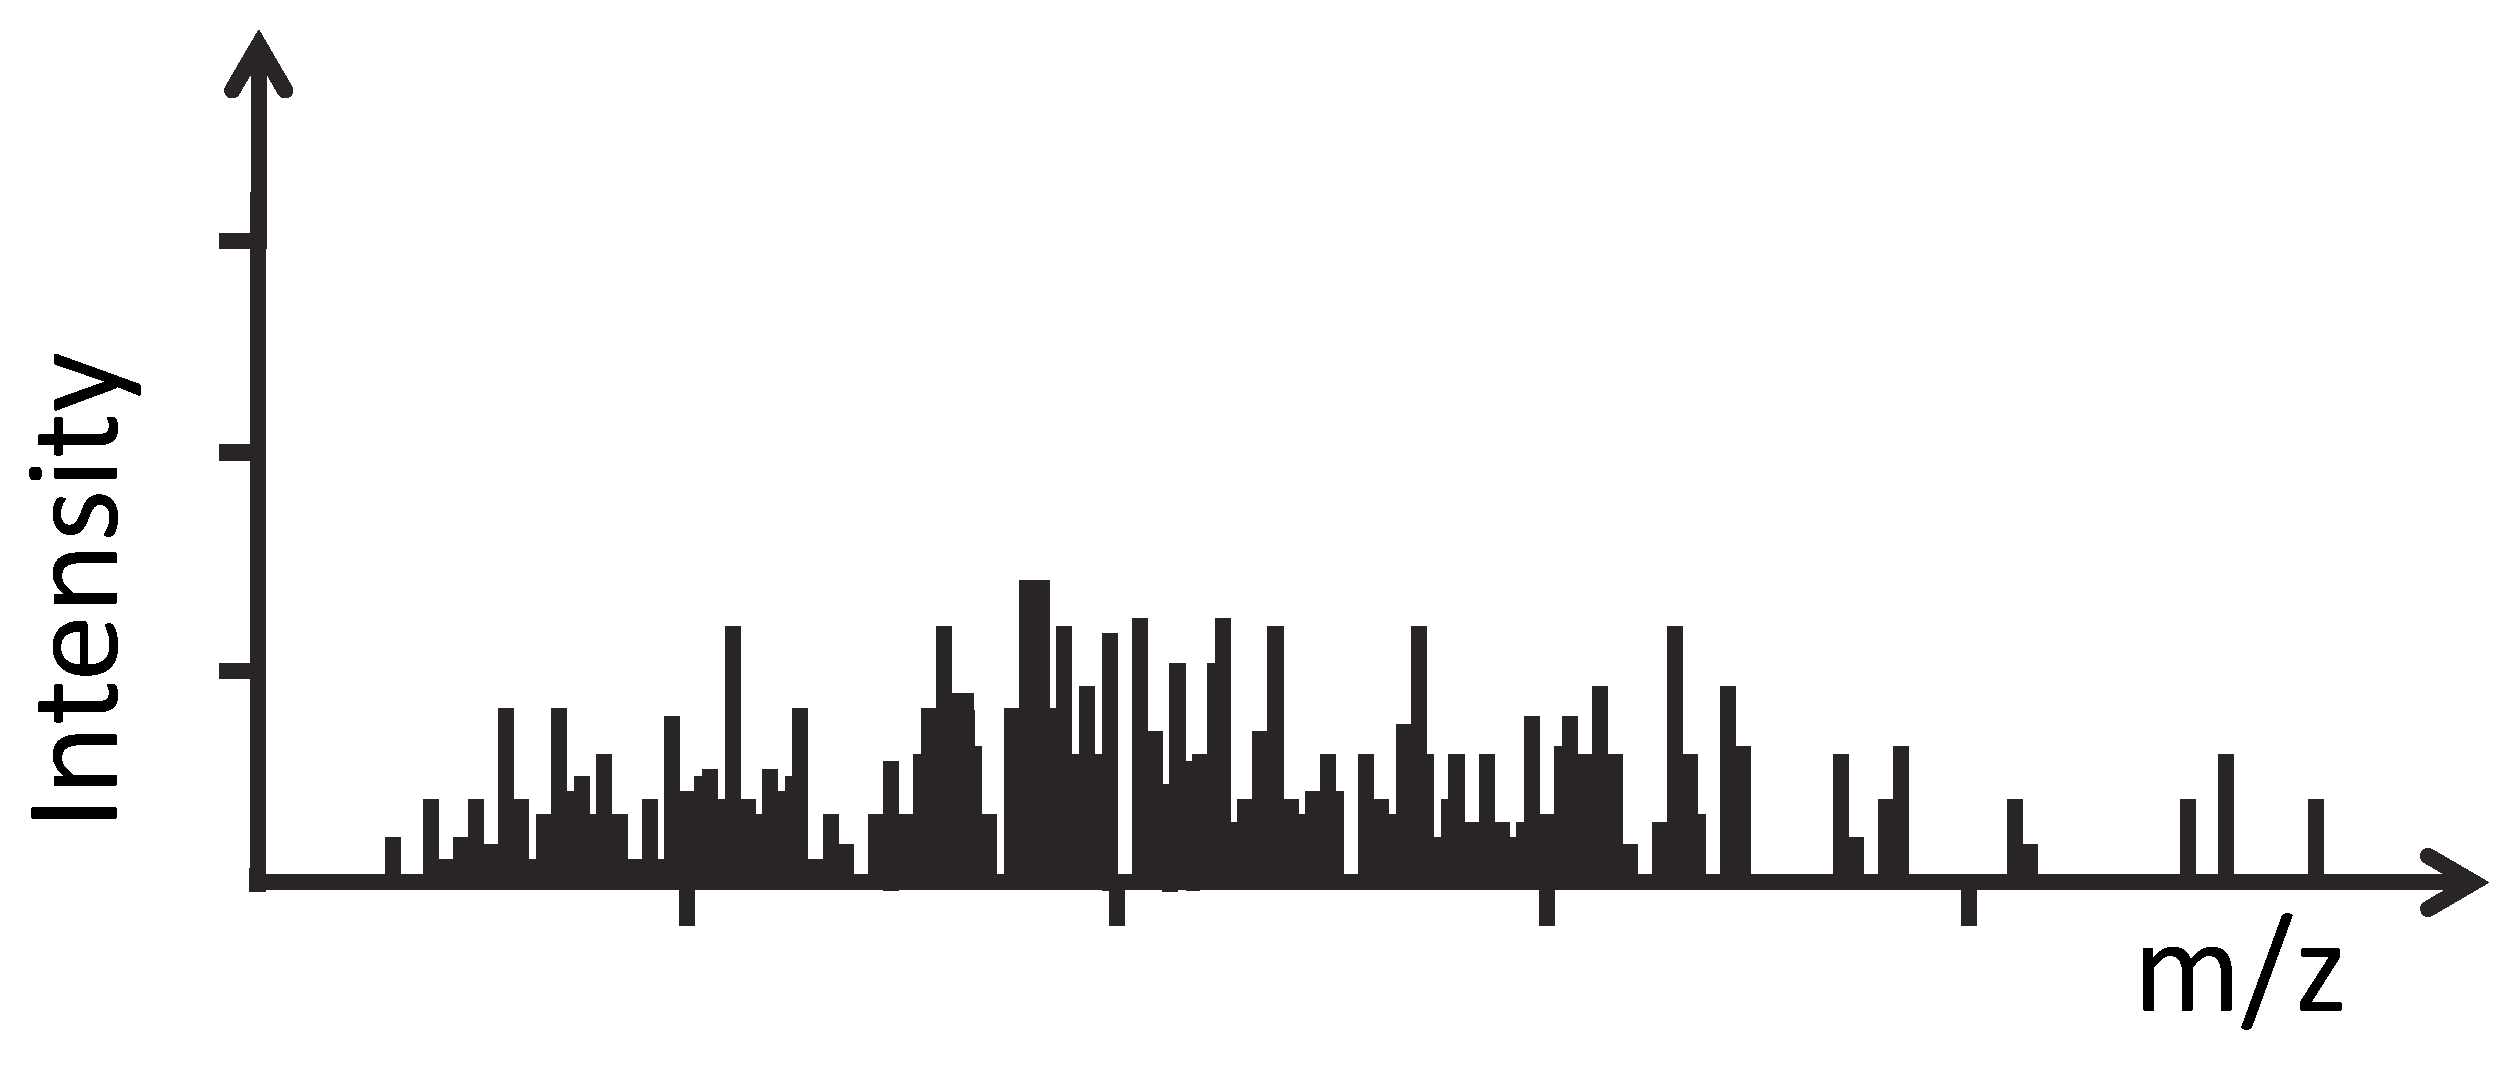
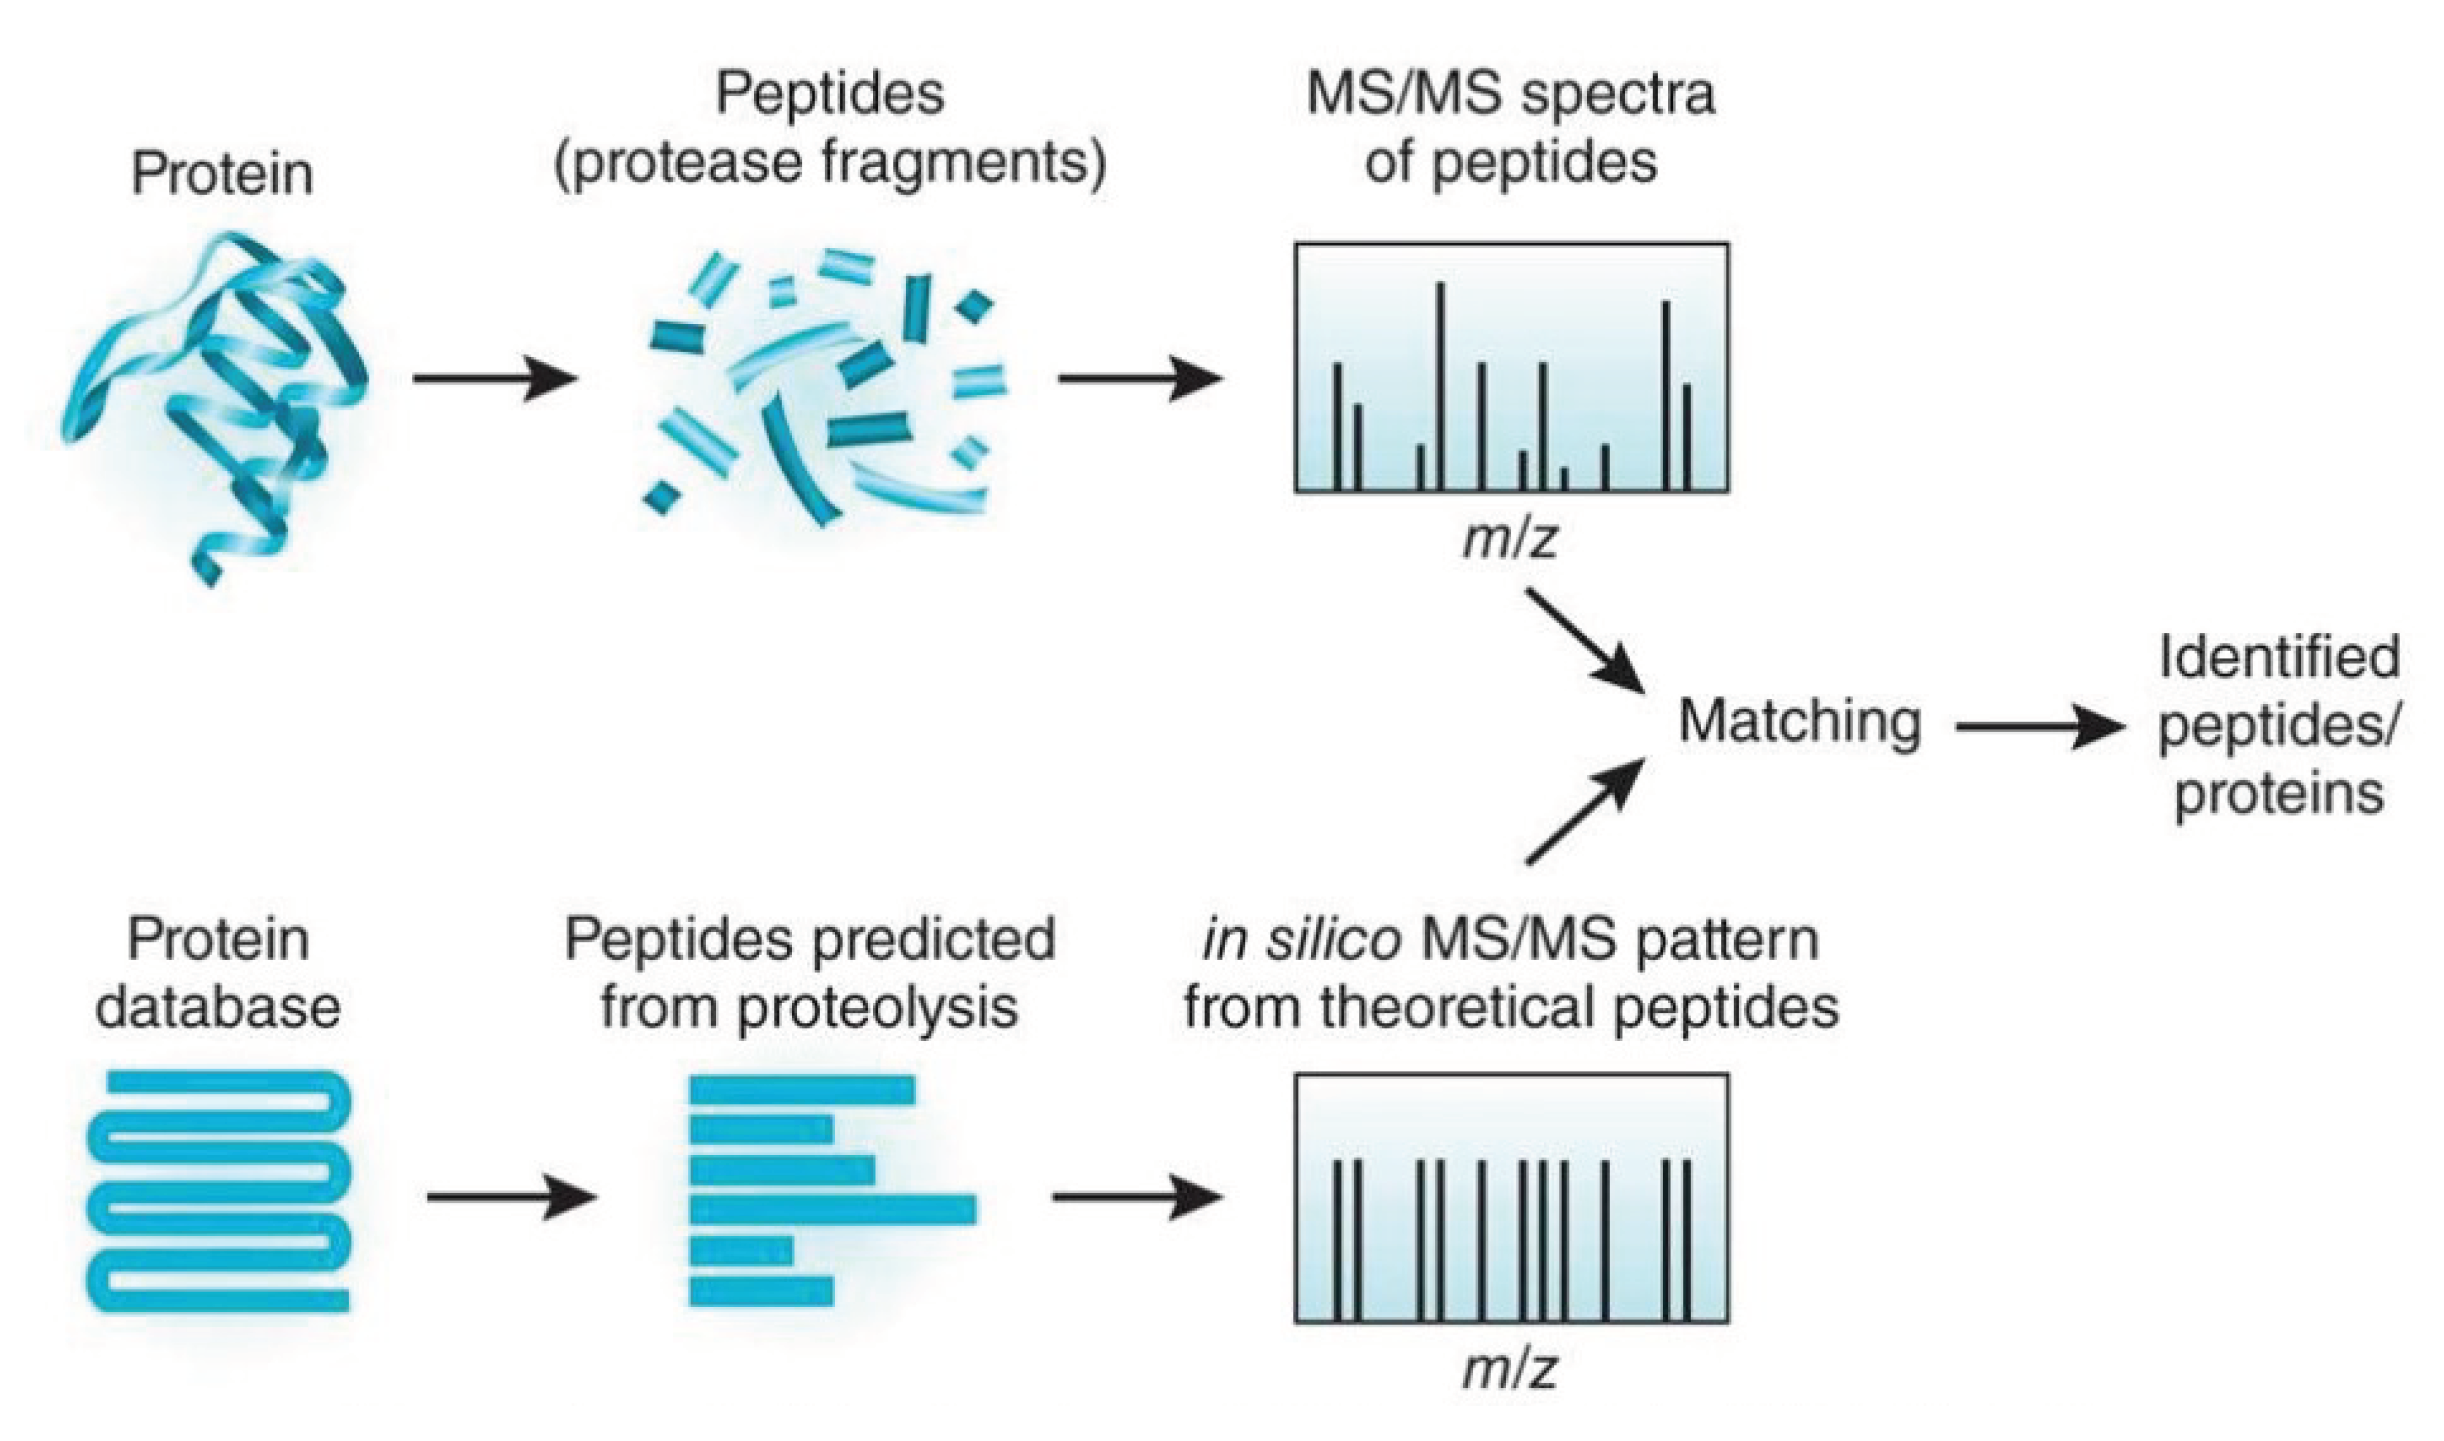
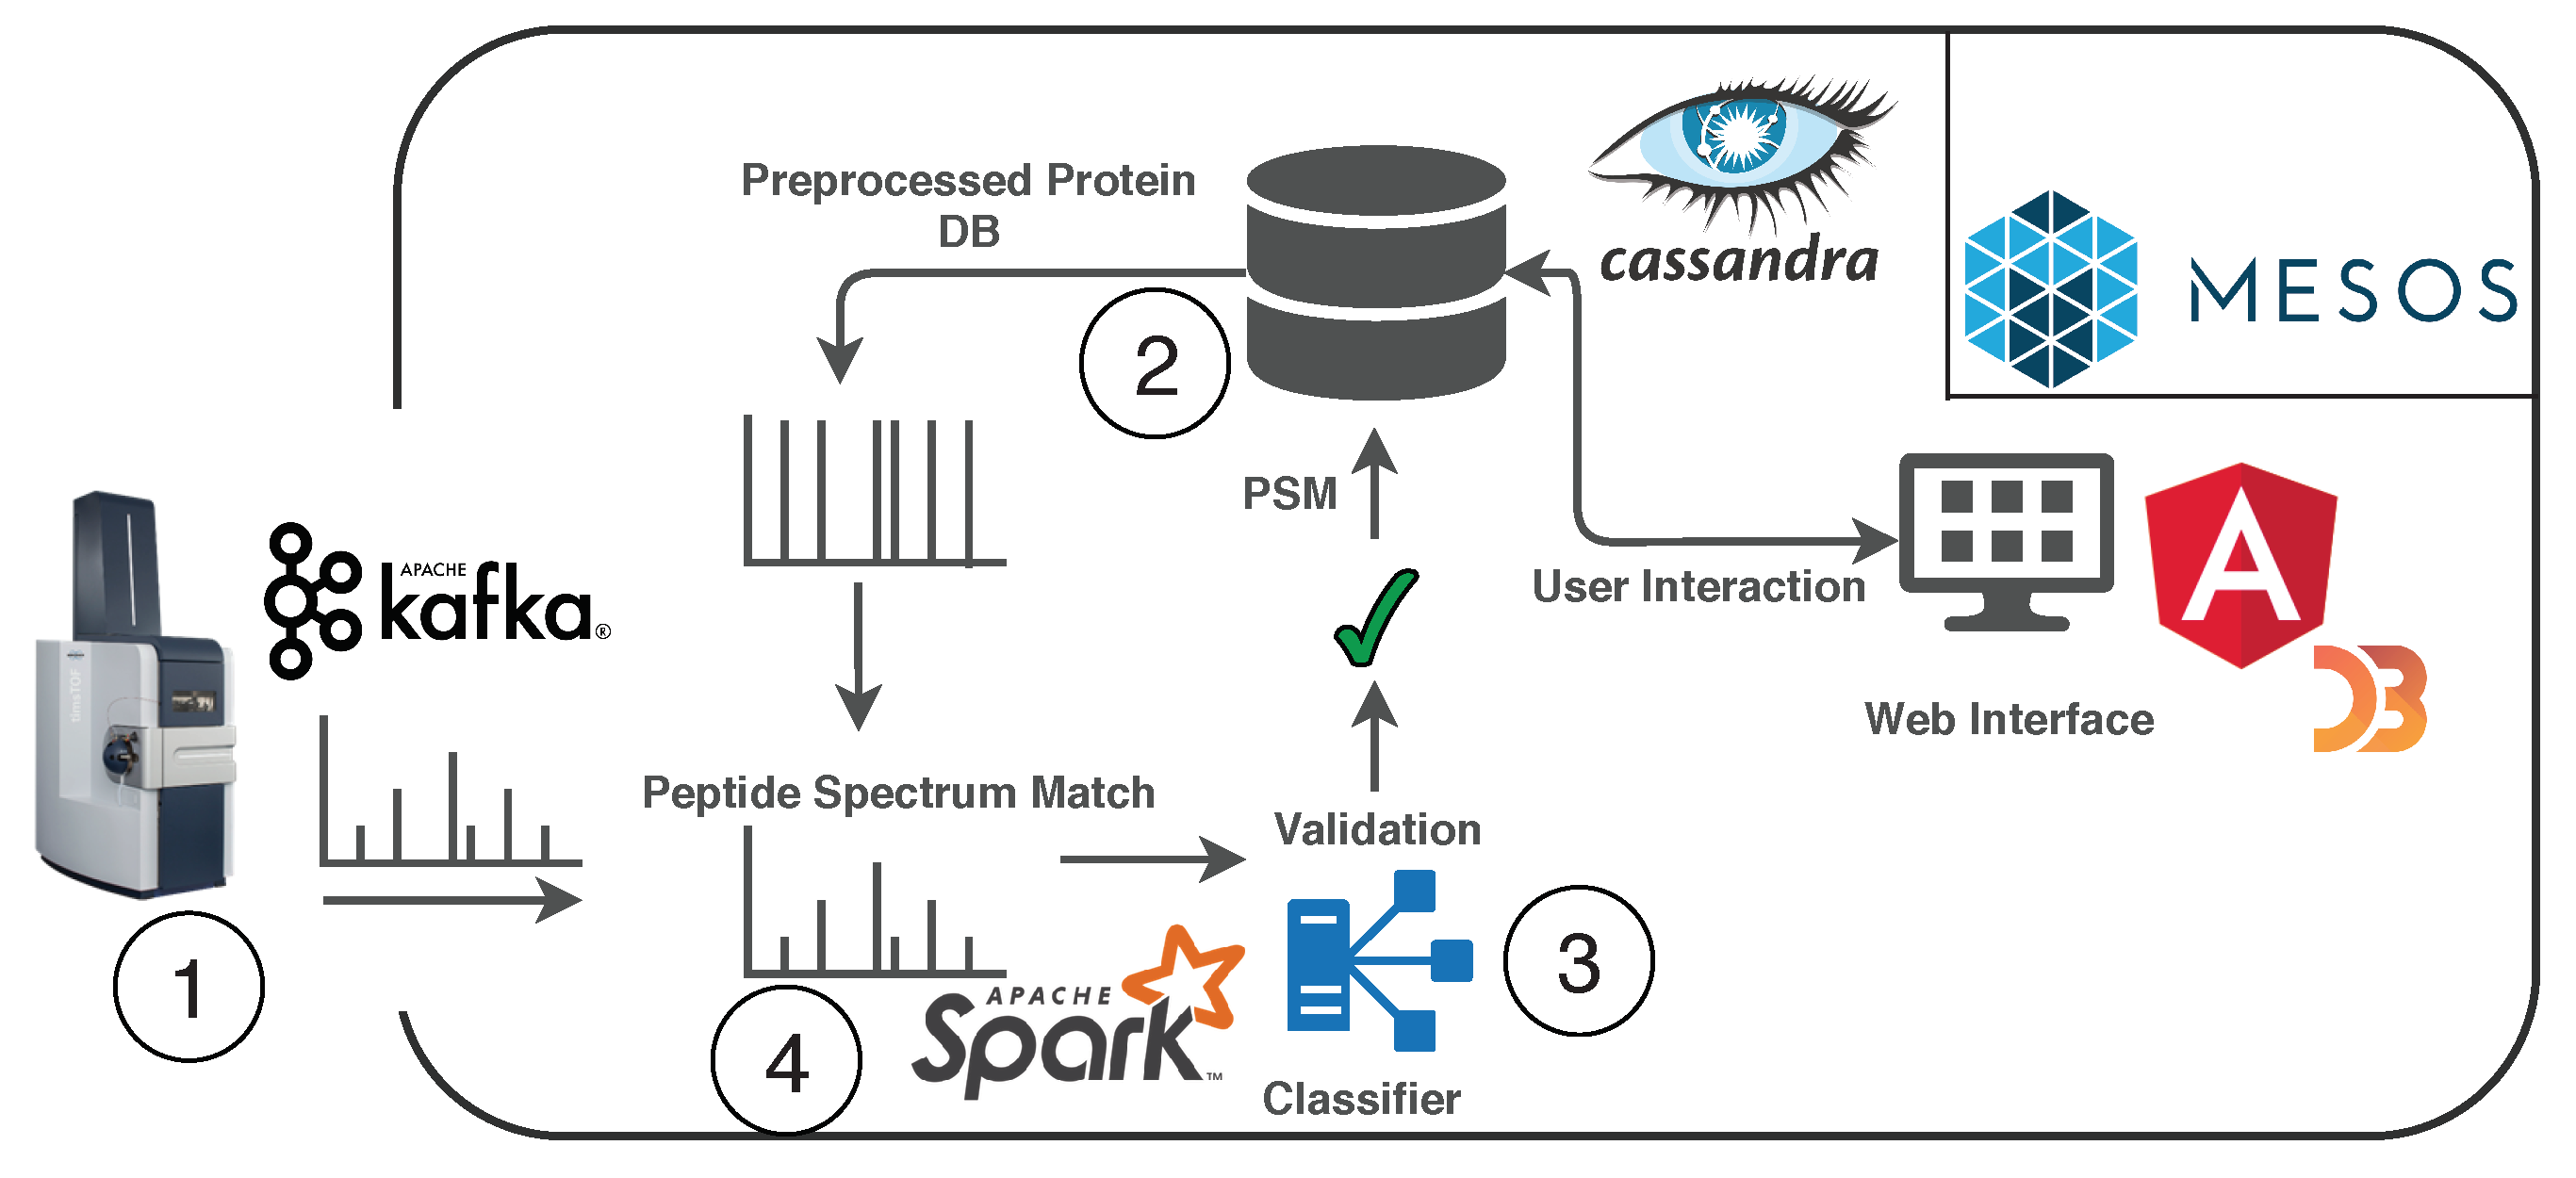
9]. The state-of-the-art protein identification approach uses a peptide-centric approach comparing the experimental (spectrum) data with theoretical spectra from a protein sequence database. For this purpose, the proteins are digested into peptides, and theoretical spectra are calculated, resulting in billions of data sets. Subsequently, protein database search algorithms compare the measured spectra with the theoretical spectra to find the highest similarity. As a consequence of all these steps, bioinformatic protein identification takes several hours to complete. In order to speed up the bioinformatic processes, we are currently developing a cloud-based pipeline for protein identification [10]. One key challenge for this pipeline is the well-performing and efficient storage and retrieval of the proteins. Therefore, we tested and evaluated an index schema to query only suitable candidates of the sequence data and reduce the search area to a minimum [11,12], using a column-based index in a distributed database management system (DBMS) that allows streamlining of the analysis step.
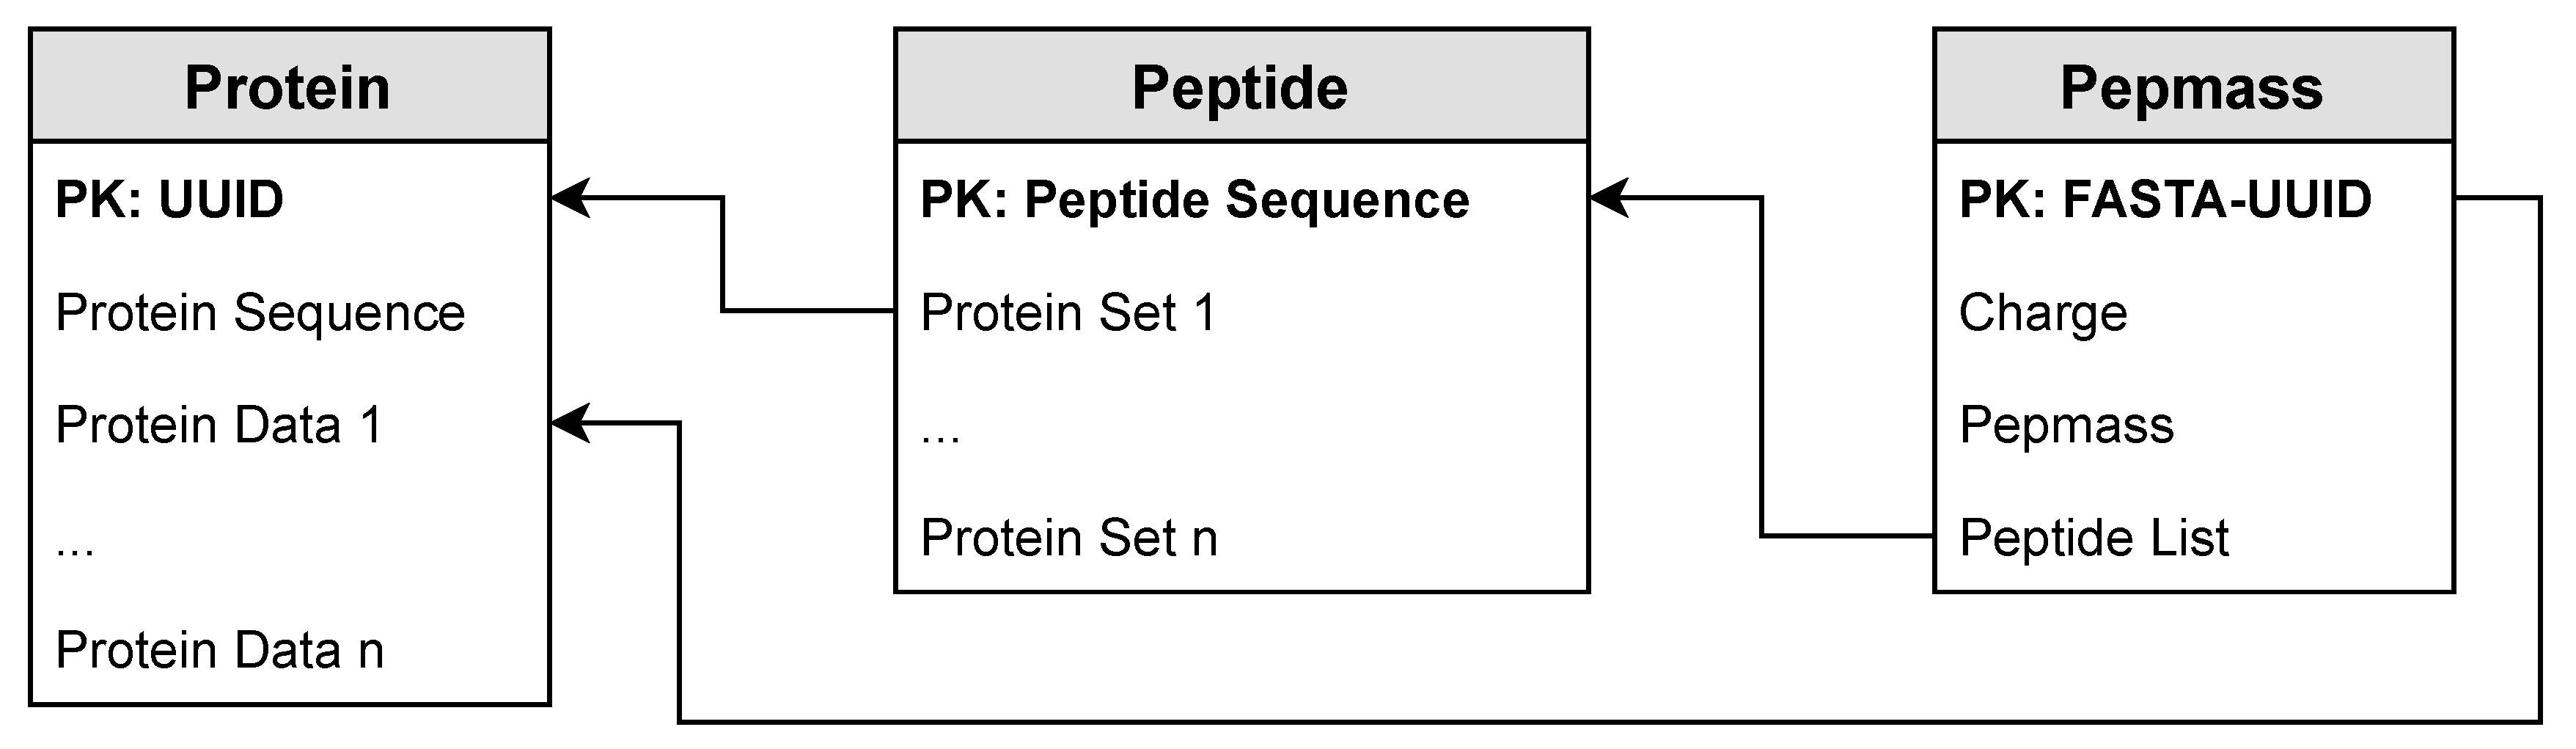
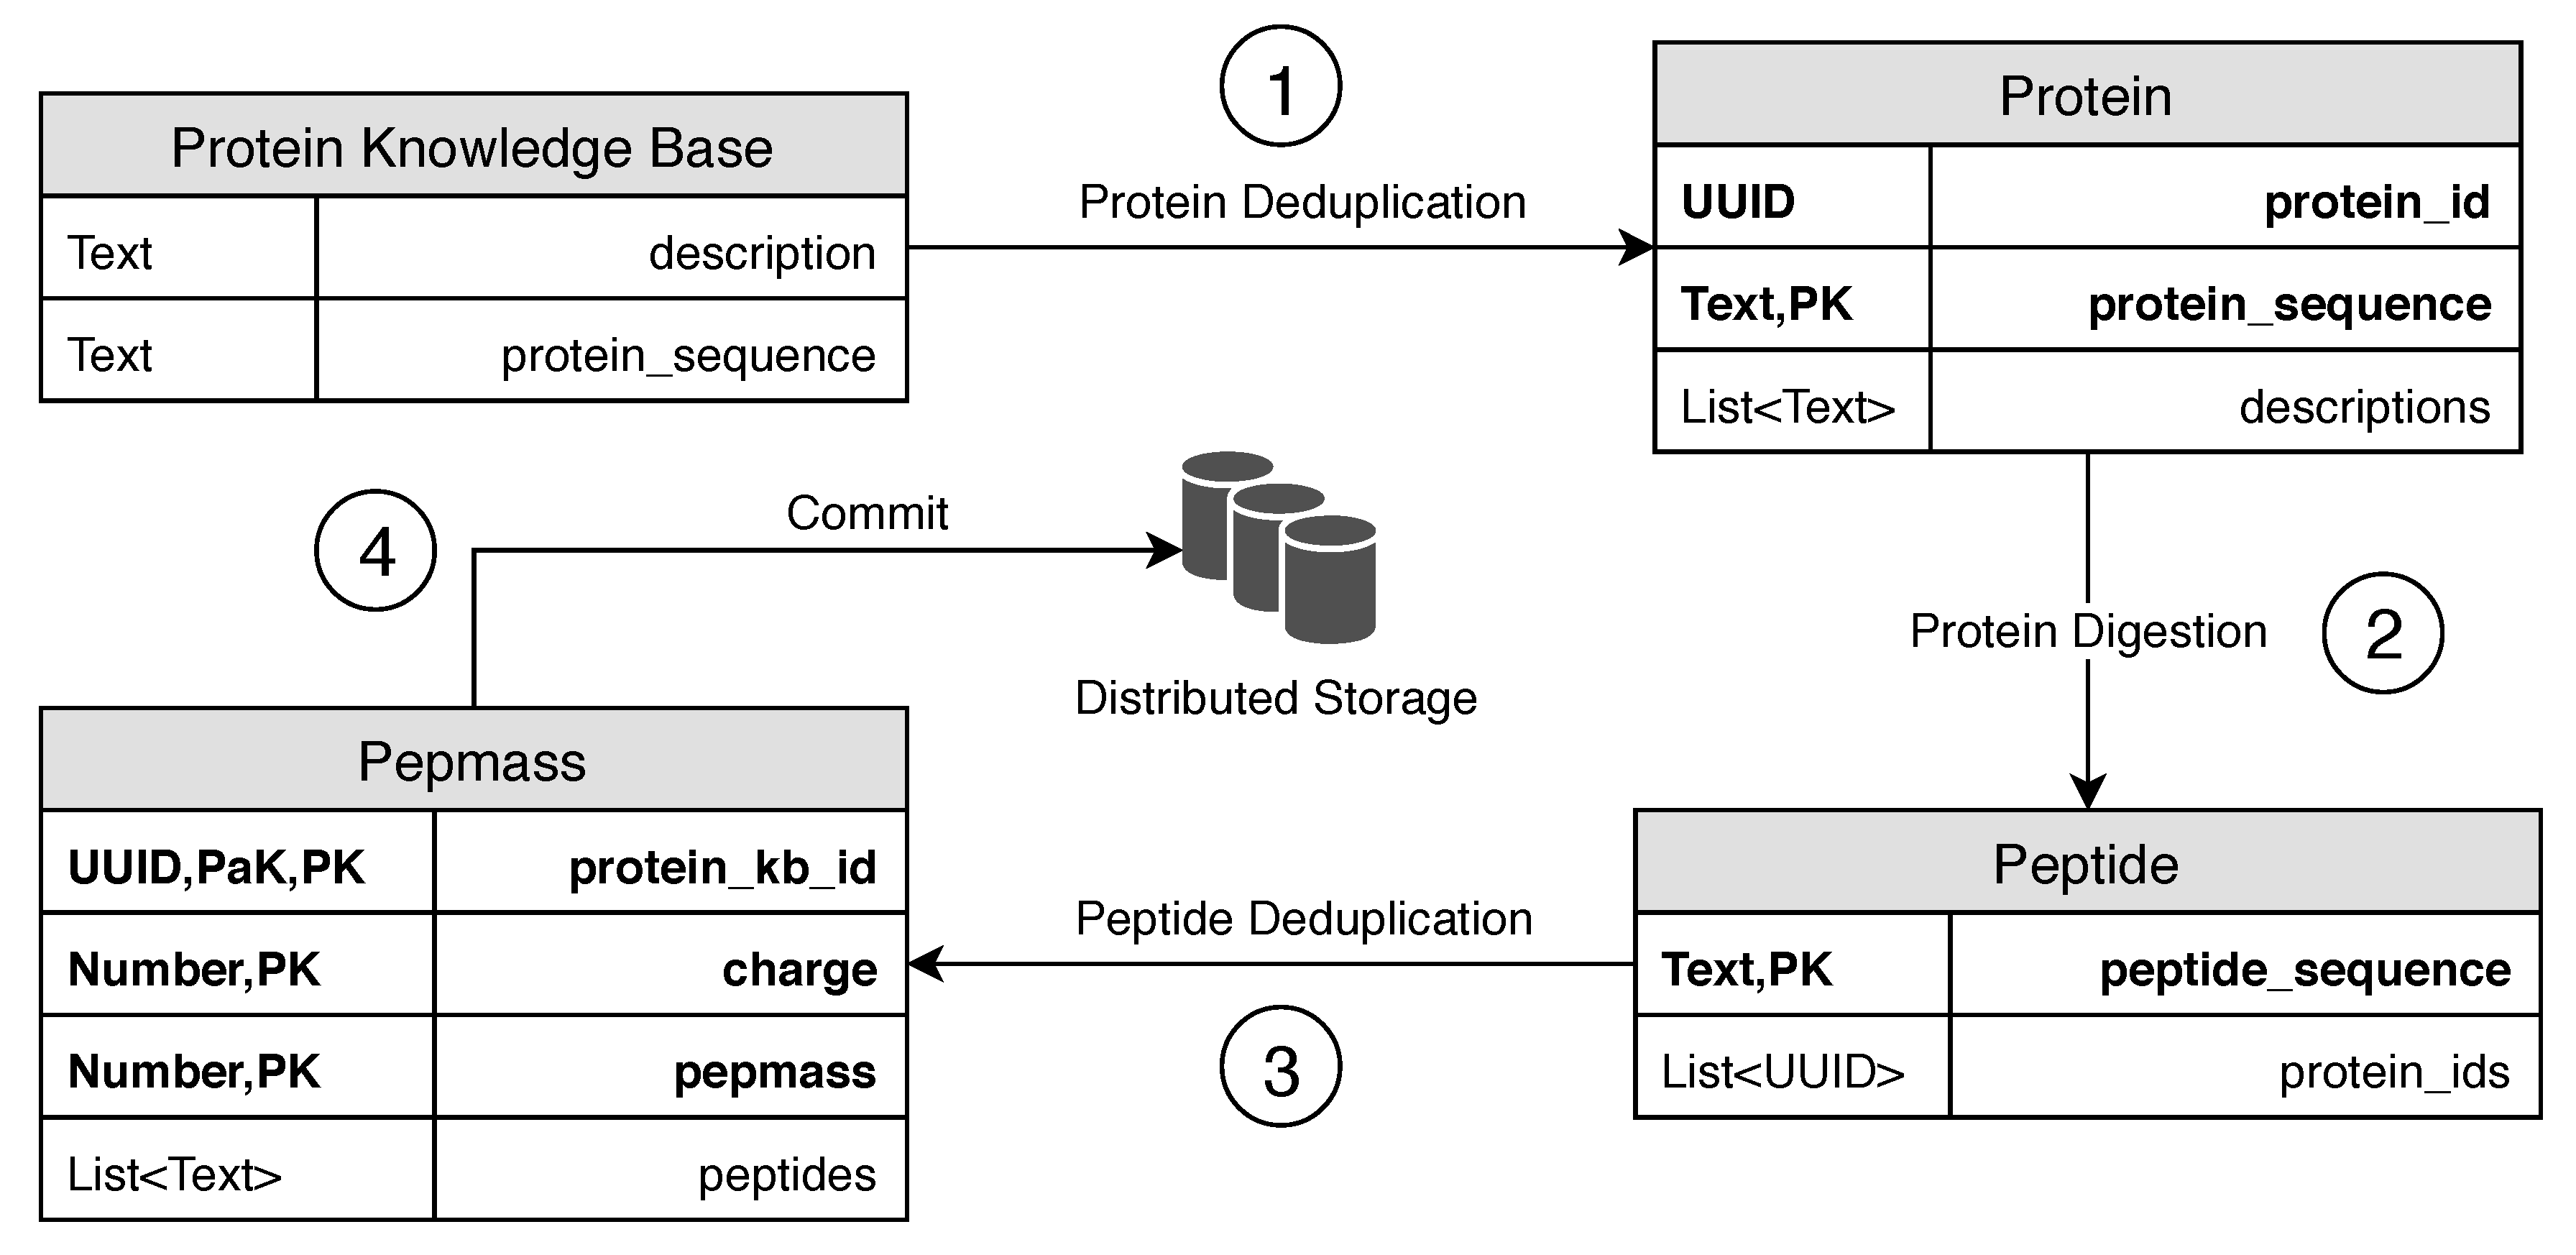
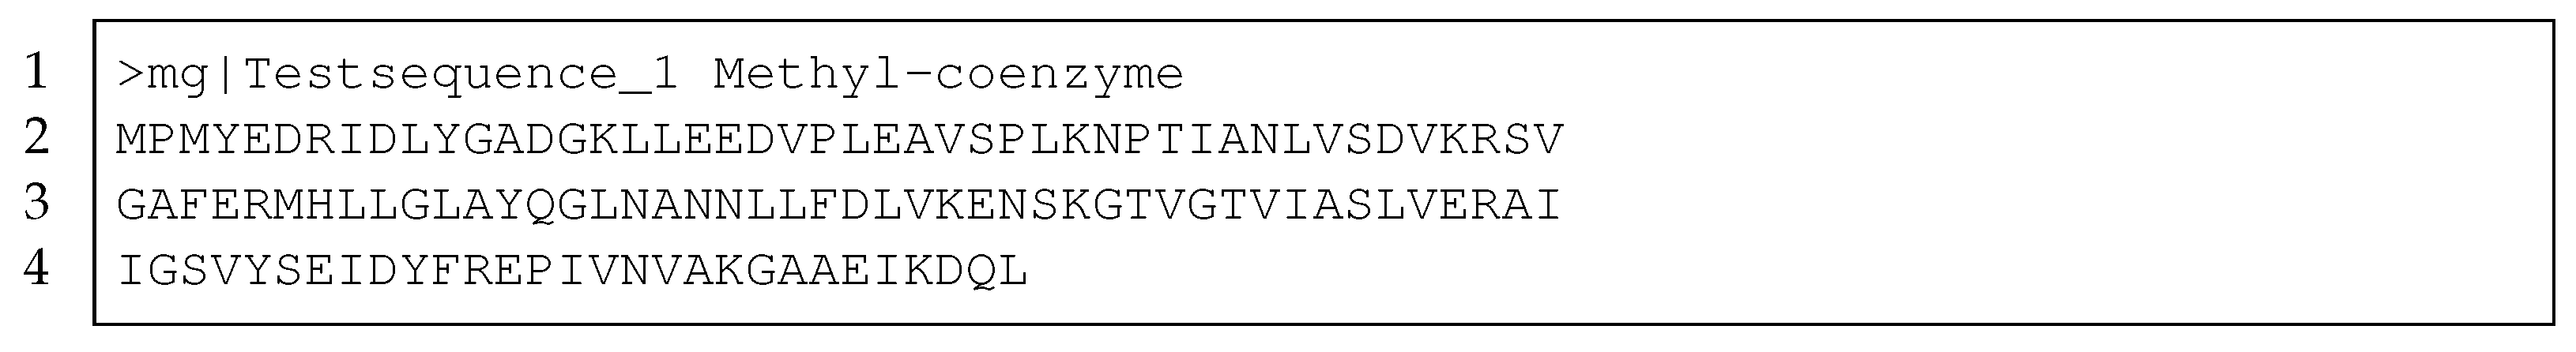
In this work, we present an indexing schema for the sequence data of a protein sequence database, using a column-based index in a distributed database management system (DBMS) that allows streamlining of the analysis step. This step’s key challenges are the memory-efficient and fast transformation of the protein sequence data from the current state-of-the-art FASTA format to the DBMS indexed schema. The transformation involves separating the sequence data, deduplication of the sequence data, and mass calculation steps, which have to be calculated before inserting into the DBMS.
After presenting the transformation process, we describe four methods to aggregate the data into the index structure. The first one is the naive in-memory approach; the second is the structured hard disk approach; the third method uses DBMS queries; and the last one is the radix tree-based method. In the end, we evaluate those methods and show that the radix tree is very efficient for the storage of sequence data and has the best overall performance of all approaches.
In summary, we make the following contributions:
  • Database schema: We propose a suitable schema for protein sequence data in a real-time cloud system as an extension to our prior paper [13].
  • Protein data transformation: We review the process of protein data transformation into the proposed database schema and detail suitable techniques for the transformation steps.
  • Indexing: We propose a radix tree for efficient deduplication (including an extended description compared to our prior paper [13]).
  • Performance comparison: We evaluate the best method to transform the protein sequence data using the four proposed approaches.
This paper is structured as follows: In Section 2, we explain the basics of the mass spectrometry workflow, the protein identification, the protein data, and the radix tree data structure. In Section 3, we describe our architecture for the real-time processing of mass spectrometer data and explain the index of the protein data and how to transform this one into an indexed structure. Next, in Section 4, we present the four methods for the data transformation. Section 5 presents the evaluation of the methods and is followed by the related work in Section 6. In the last section, Section 7, we conclude our work.

2. Background

In this section, we provide basic knowledge to understand the proposed database schema and storage alternatives. First, we clarify the protein sequence data structure. Afterward, we present the data processing steps for protein identification, followed by explaining the real-time processing platform of mass spectrometry data and the radix tree data structure.

2.1. Protein Data

The data acquired by the mass spectra are the masses of the peptides (parts of a protein) and their amino acids. The mass of the particles is represented by a mass spectrum; see Figure 1. On the x-axis, the mass-to-charge ratio can be seen, and on the y-axis, the intensity of the signal measured by the device is represented. The intensity signal represents the collisions that are detected by the digitizer of the mass spectrometer device. The mass of a peptide is a list of peaks that can be represented in a textual format or as a plot of the peaks.
Besides the XML standard mzML (XML-based textual representation of mass spectrum data), the Mascot Generic File (MGF) (lightweight textual representation of mass spectrum data) format is the standard format to store mass spectra [15,16,17]. One mass spectrometer produces around 200,000 spectra every two hours, resulting in over 40 GB files. For the further analysis of mass spectrometry data, a collection of all possible protein sequences is required. The protein sequences are usually stored in FASTA format, including a textual representation of the protein sequences and their descriptions [18]. Listing 1 shows one protein with its unstructured text description (Listing 1, Line 1) and its protein sequence (Listing 1, Lines 2–4). Each letter of the protein sequence represents one of the 22 amino acids. The uniqueness of a protein is not only given by the protein sequence, but also by the description.
Listing 1. Textual representation of one protein in FASTA format.
Algorithms 14 00059 g010
A popular protein sequence database is SwissProt from UniProtKB (numbers of UniProtKB as of the beginning of 2019; https://www.uniprot.org/, accessed on 22 January 2021) with 556,196 proteins. After the digestion of the proteins to peptides, the SwissProt proteins are divided into 37,403,696 peptides. This digestion increases the amount of data from 500 MB of proteins to over 17 GB of peptides. In our system, the peptides have to be indexed additionally by their mass and the charge to guarantee fast access. This indexing enables considering for the identification step only suitable peptide candidates fitting the mass spectrometer. In the next section, we explain the basic protein identification approach.

2.2. Protein Identification

The protein identification approach compares the experimental mass spectra from the mass spectrometer and the theoretical data calculated from a protein sequence database [9]. In Figure 2, the top shows the biological preparation of the sample until the mass spectrum data are generated. On the bottom, the procedure is mirrored theoretically on a protein sequence database (e.g., SwissProt). First, the protein sequences are split into peptides. For each of the peptides, a theoretical mass spectrum is calculated containing only perfect values and no noise. The subsequent comparison between the theoretical and the experimental spectrum results in a score representing the consensus between spectra. The match with the highest score identifies the experimental spectrum and is assigned to the proteins [9]. State-of-the-art protein identification algorithms compare the experimental spectra with all theoretical spectra. However, this results in long calculation times, which might be critical for clinical diagnosis. In order to accelerate this step, we store all protein and peptide data in a database and create an index to query only the suitable candidates of the protein sequence database instead of looping through all the peptides.

2.3. Real-Time Analysis of Mass Spectrometry Data

As introduced above, protein identification is not usually streaming-based and needs all the experimental data at once. In order to circumvent waiting hours until the measurement is finished, we need to adapt the algorithm to the FAST data architecture [19]. Figure 3 shows the general cloud architecture of the real-time diagnostic platform [20]. Each measured experimental spectrum is streamed directly from the device during the measurement (Step 1 in Figure 3). For the identification, the protein data are already digested and indexed in a distributed DBMS, using a column-oriented index on the charge and the mass of the peptides (Step 2 in Figure 3). For each incoming spectrum, the similarity with every suitable candidate from the database is calculated (Step 3 in Figure 3), and the best results get validated (Step 4 in Figure 3). For each spectrum, we need to query only suitable candidates. Since the mass spectrometer measures the peptide’s total mass (notably, the mass spectrometer produces mass-to-charge ratios, which we then use to calculate the masses of the peptides), we can use the measuring accuracy from the device specifications to generate a range query over the total mass of the peptide in the DBMS. For example, the mass of a peptide is 125.2941 Daltons (Da), and the measuring accuracy is 0.001 Da. The mass of the candidates should be between 125.2931 and 125.2951. The peptide ion charge is also known during the measurement, which should be considered in our DBMS and precalculated. This group of indices is necessary to reduce the number of candidates for each spectrum to a minimum.

2.4. Radix Tree Data Structure

Trie structures represent an efficient way to organize textual data. Rene De La Briandais used a trie for textual data with all possible letter entries on each level [21]. All redundant entries are eliminated during the filling process because the same letters are stored in one node. The adaptive radix tree by Leis et al. [22] extends the trie with the property that each parent node with only one child is merged with this exact child. This optimization is also known from prefix trees [23]. In Figure 4, we create a sample radix tree for the seven proteins presented at the bottom of the figure. The end nodes are marked bold in the figure, such that the protein MERT ends at the node with the number 1, while MERTFAI ends at Node 2. Each combination of all nodes from the root node to an end node defines one protein sequence. For our work, we want to use a radix tree with an additional relation on each end node to a protein because of the many-to-many relation between peptides and proteins. The related radix tree is used as an in-between step of the data transformation from the protein sequence database in FASTA format into our table schema.

3. Data Preparation for Real-Time Protein Identification

An index structure is needed to reduce the number of suitable candidates for each spectrum to decrease computational time. This section first explains the schema followed by the transformation methods into the indexed schema [13].

3.1. Indexed Masses of Peptides

To enable fast access to suitable candidates without losing all the information from the protein sequence database, we introduce our data structure. Our schema for the protein data consists of three tables: the protein table, the peptide table, the pepmasstable, and the relations between them (see Figure 5).

3.1.1. Protein Table

The protein table uses a UUID created from the protein sequence as a primary key, avoiding the redundant storage of protein sequences. At the beginning, the protein table consists of two columns: “UUID” and “Protein Sequence”. For each uploaded protein sequence database, a new column, “Protein Data”, is added to the table containing the protein description from the FASTA file. Hence, uploading new data brings new descriptions, but not necessarily new protein sequences. Therefore, we can save storage in the DBMS since the sequence data are much bigger than the description data (Figure 5). In Table 1, we show the sample data of a protein table. Two files are loaded into the table, creating two columns, “FILE_1” and “FILE_2”. For each new protein, the table is extended by a row.

3.1.2. Peptide Table

The peptide table consists of the peptide sequence as a primary key and has a set of protein UUIDs, which relate to the protein table. Like the protein table, each uploaded protein sequence database appends a new column, “Protein Set”, to the peptide table containing a non-redundant collection of protein UUIDs. The protein UUIDs belong to the proteins containing the peptide. Using this relation information, we can later link identified peptides (Figure 5) to the proteins. In Table 2, we show the data of the peptide table corresponding to the data from the protein table (see Table 1).

3.1.3. Pepmass Table

The pepmass table is a table that groups the peptides with the same “Charge” and “Pepmass” for each “FASTA-UUID”. Peptides with the same values for these three properties are stored as a list of strings in the column “Peptide List”. Since all proteins from one FASTA file should be present in one partition, we use “FASTA-UUID” as a partition key in the pepmass table. Peptide ions may contain a different number of charges. Therefore, we created separate entries for each charge of one, two, and three with their associated pepmasses. Additionally, peptides may be chemically modified, resulting in changed pepmasses. For example, during the sample preparation process, the amino acid methionine could be oxidated. Each modification is similar to an additional letter in the sequence and drastically increases the number of peptide sequences. In our work, we considered two typical modifications: oxidation of methionine and carbamidomethylation. The consideration of different charges and modification resulted in a high number of peptides in the pepmass table. In Table 3, we show some exemplary data of the pepmass table matching the data from the protein table and peptide table (see Table 1 and Table 2).

3.2. Data Transformation

Our proposed schema improves the performance of getting the suitable candidates for each spectrum up to a few milliseconds, which leads however to increased storage because of the precalculation of all masses. As mentioned, we have to consider more than one protein sequence database. Hence, an efficient technique is needed that allows uploading new databases and transforming their data into our schema [13]. In Figure 6, we show the four steps to transform the data from the FASTA format into our schema. The first step is to deduplicate the protein sequences and merge the descriptions of the entries with a similar protein sequence (Step 1 in Figure 6). The next step is the protein digestion, which splits the protein sequence into smaller peptides. Equal peptide sequences can be extracted from different proteins, which leads to a many-to-many relationship between proteins and peptides. Due to the high number of those relationships, the protein digestion is conducted with a list of the protein IDs in the table (Step 2 in Figure 6). The next step is the deduplication of the peptides during which only the unique peptides are left within the relation to the proteins that they came from (Step 2 in Figure 6). For each of those peptides, the mass needs to be calculated with all the possible modifications and charges. Afterwards, all the data are stored in the DBMS.
For the task of data transformation, we evaluate different approaches, which include a map structure in-memory and on-disk and the radix tree structure. In the following, we explain the steps in detail, because their understanding is necessary to follow our evaluation.

3.2.1. Protein Deduplication

The goal of this step is to map all descriptions to a unique protein sequence. The naive approach is to create a map with the protein sequence as a key and a collection of descriptions as a value. In this case, a map would only consider the currently loaded protein sequence database. However, since we want to persist the results in the database, this deduplication step needs to be executed on the DBMS side. Hence, we have to use update queries to append data to an existing protein sequence or insert the protein sequence if the data set does not exist. A sample query is shown in Listing 2. The name of the new column is “fastaID”, and the query inserts a new entry or updates the list in the new column by a new description of the protein. This is because, in Cassandra, an UPDATEstatement can INSERTdatasets if the data do not exist.
Listing 2. Query for protein deduplication in the DBMS.
Algorithms 14 00059 g011

3.2.2. Protein Digestion

After the deduplication of the protein sequences, the peptides need to be extracted using the digestion method. Hence, the sequences are divided into the specific letters of the sequence. This method simulates the digestion from a laboratory on the digital sequence. Additionally, we have to consider missed cleavages (MCs), which define the possibility of missed cut outs in the sequence. As an example, let us consider a protein sequence with a length of 300 that would be split into 23 peptide when defining the MCs as zero. Defining the MCs to the value of one would generate 56 peptides. The missed cleavage parameter increases the amount of peptides linearly [9]. In our work, we define this parameter with the value of two, which is enough for most of the mass spectrometer experiments.

3.2.3. Peptide Deduplication and Mass Calculation

The peptide deduplication is conducted only for the currently used protein sequence database and does not depend on the data from the other columns. During this step, each peptide has to be deduplicated without losing the information about the protein from which the peptide comes. The protein sequences are already mapped to an identifier in our DBMS. Hence, there are four possible approaches to deduplicate peptides: The naive approach is to create a map with the peptide sequence as a key and a collection of the protein identifiers as a value. The map approach can be divided into (1) an in-memory map approach and (2) a file-based map approach. (3) The next approach is to update the list of protein identifiers in the DBMS, and (4) the last approach is to use a radix tree for the sequences with relations to the protein identifiers on each end node.
Afterwards, the pepmass needs to be calculated. For each unique peptide sequence, the mass for all combinations of possible modifications and for all charges has to be calculated and stored in the DBMS. Therefore, the sequences of the peptides have to be mapped to the precalculated masses. Since each peptide generates many different masses, this peptide is stored multiple times in the pepmass table. In the last step, all the grouped and precalculated data need to be inserted into the DBMS.

3.2.4. Approaches for Data Transformation

Due to the fast data architecture and the need for fast access to the protein data, an efficient service for uploading protein sequence databases to our system is needed. In order to achieve this, the transformation was implemented using different approaches. Firstly, we implemented the naive approach using in-memory hash maps. Secondly, we implemented the steps, using a structured storage on the hard disk. In the third approach we implemented the steps using DBMS queries, and in the last one, we implemented an extended radix tree as an in-memory data structure.
In summary, the four steps of the transformation process can be implemented in different ways; see Table 4. The first and the last step are done with the database engine method. As a result, an evaluation is needed to find the best method to transform (digestion and deduplication) the data.

4. Implementation

We implemented a protein sequence database transformation as a cloud service, using the Java Jetty application server and the Cassandra DBMS on an Apache Mesos system. Additionally, SQLite was used as the storage for the local structured data. The in-memory approach, the file system approach (SQLite), and the DBMS query approach used standard methods (i.e., Cassandra Query Language (CQL) queries) and data structures (hash maps and sets) for the deduplication and other transformation steps. In this section, we give a brief description of the implementation of the naive approaches and a detailed explanation of our extensions to the radix tree approach [13].

4.1. Transformation Using a Map Structure

This approach uses a map and a key-value structure for the peptide deduplication and the protein relationship. The maps’ keys are the peptide sequences, and the values are the sets of protein identifiers. For the first implementation, we used an in-memory map and for the second implementation, an SQLite table as the key-value storage.

4.2. Transformation Using DBMS Queries

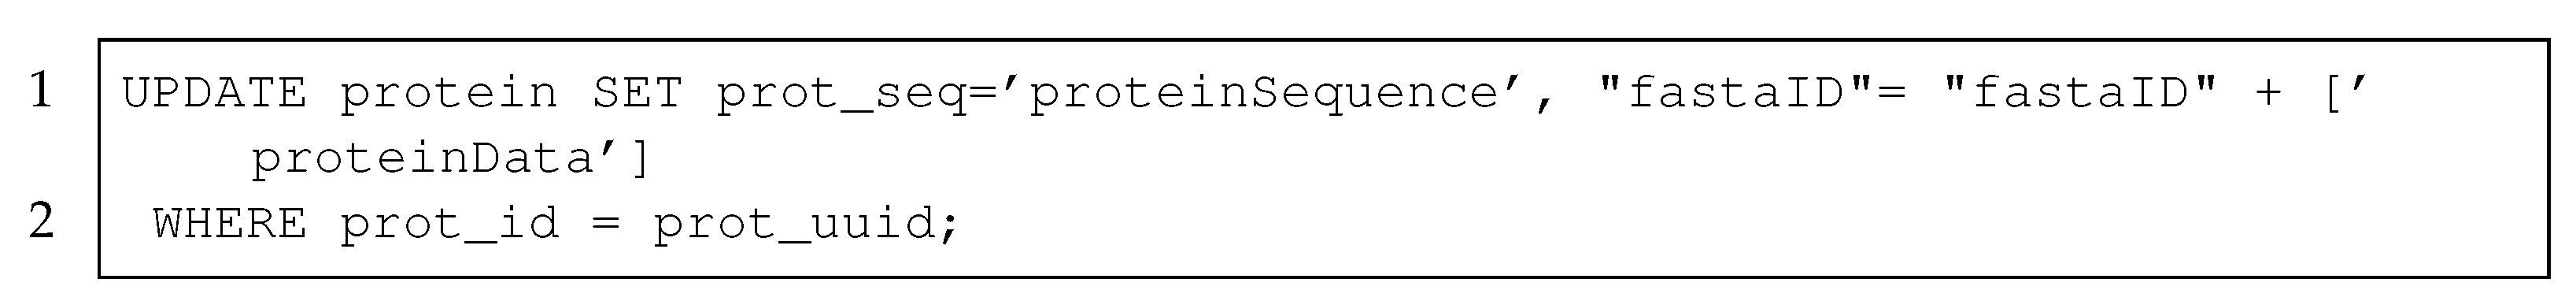
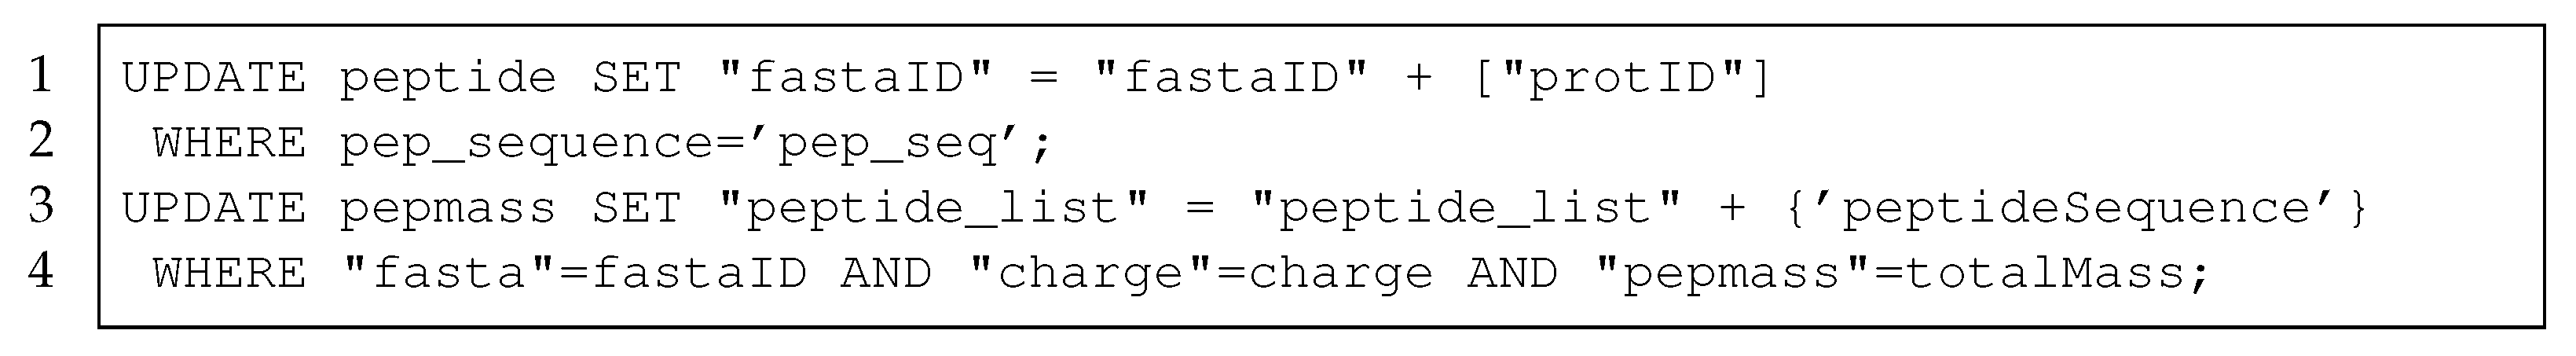
To insert the result data into the database management system (DBMS), we implemented queries to transform the data directly in the DBMS. We used UPDATE queries, which add a new row if the key does not exist, or otherwise append a value to the list in the column. The deduplication of proteins was already implemented using UPDATE queries on the protein table. In this approach, we implemented additional UPDATE queries for the peptide table and for the pepmass table. In Listing 3, we present these UPDATE queries, which are used in this method to update the peptide table (Lines 1–2) and the pepmass table (Lines 3–4).
Listing 3. Queries to transform protein data from FASTA format to the table schema using the DBMS.
Algorithms 14 00059 g012

4.3. Transformation Using the Extended Radix Tree Structure

A radix tree [21,22,
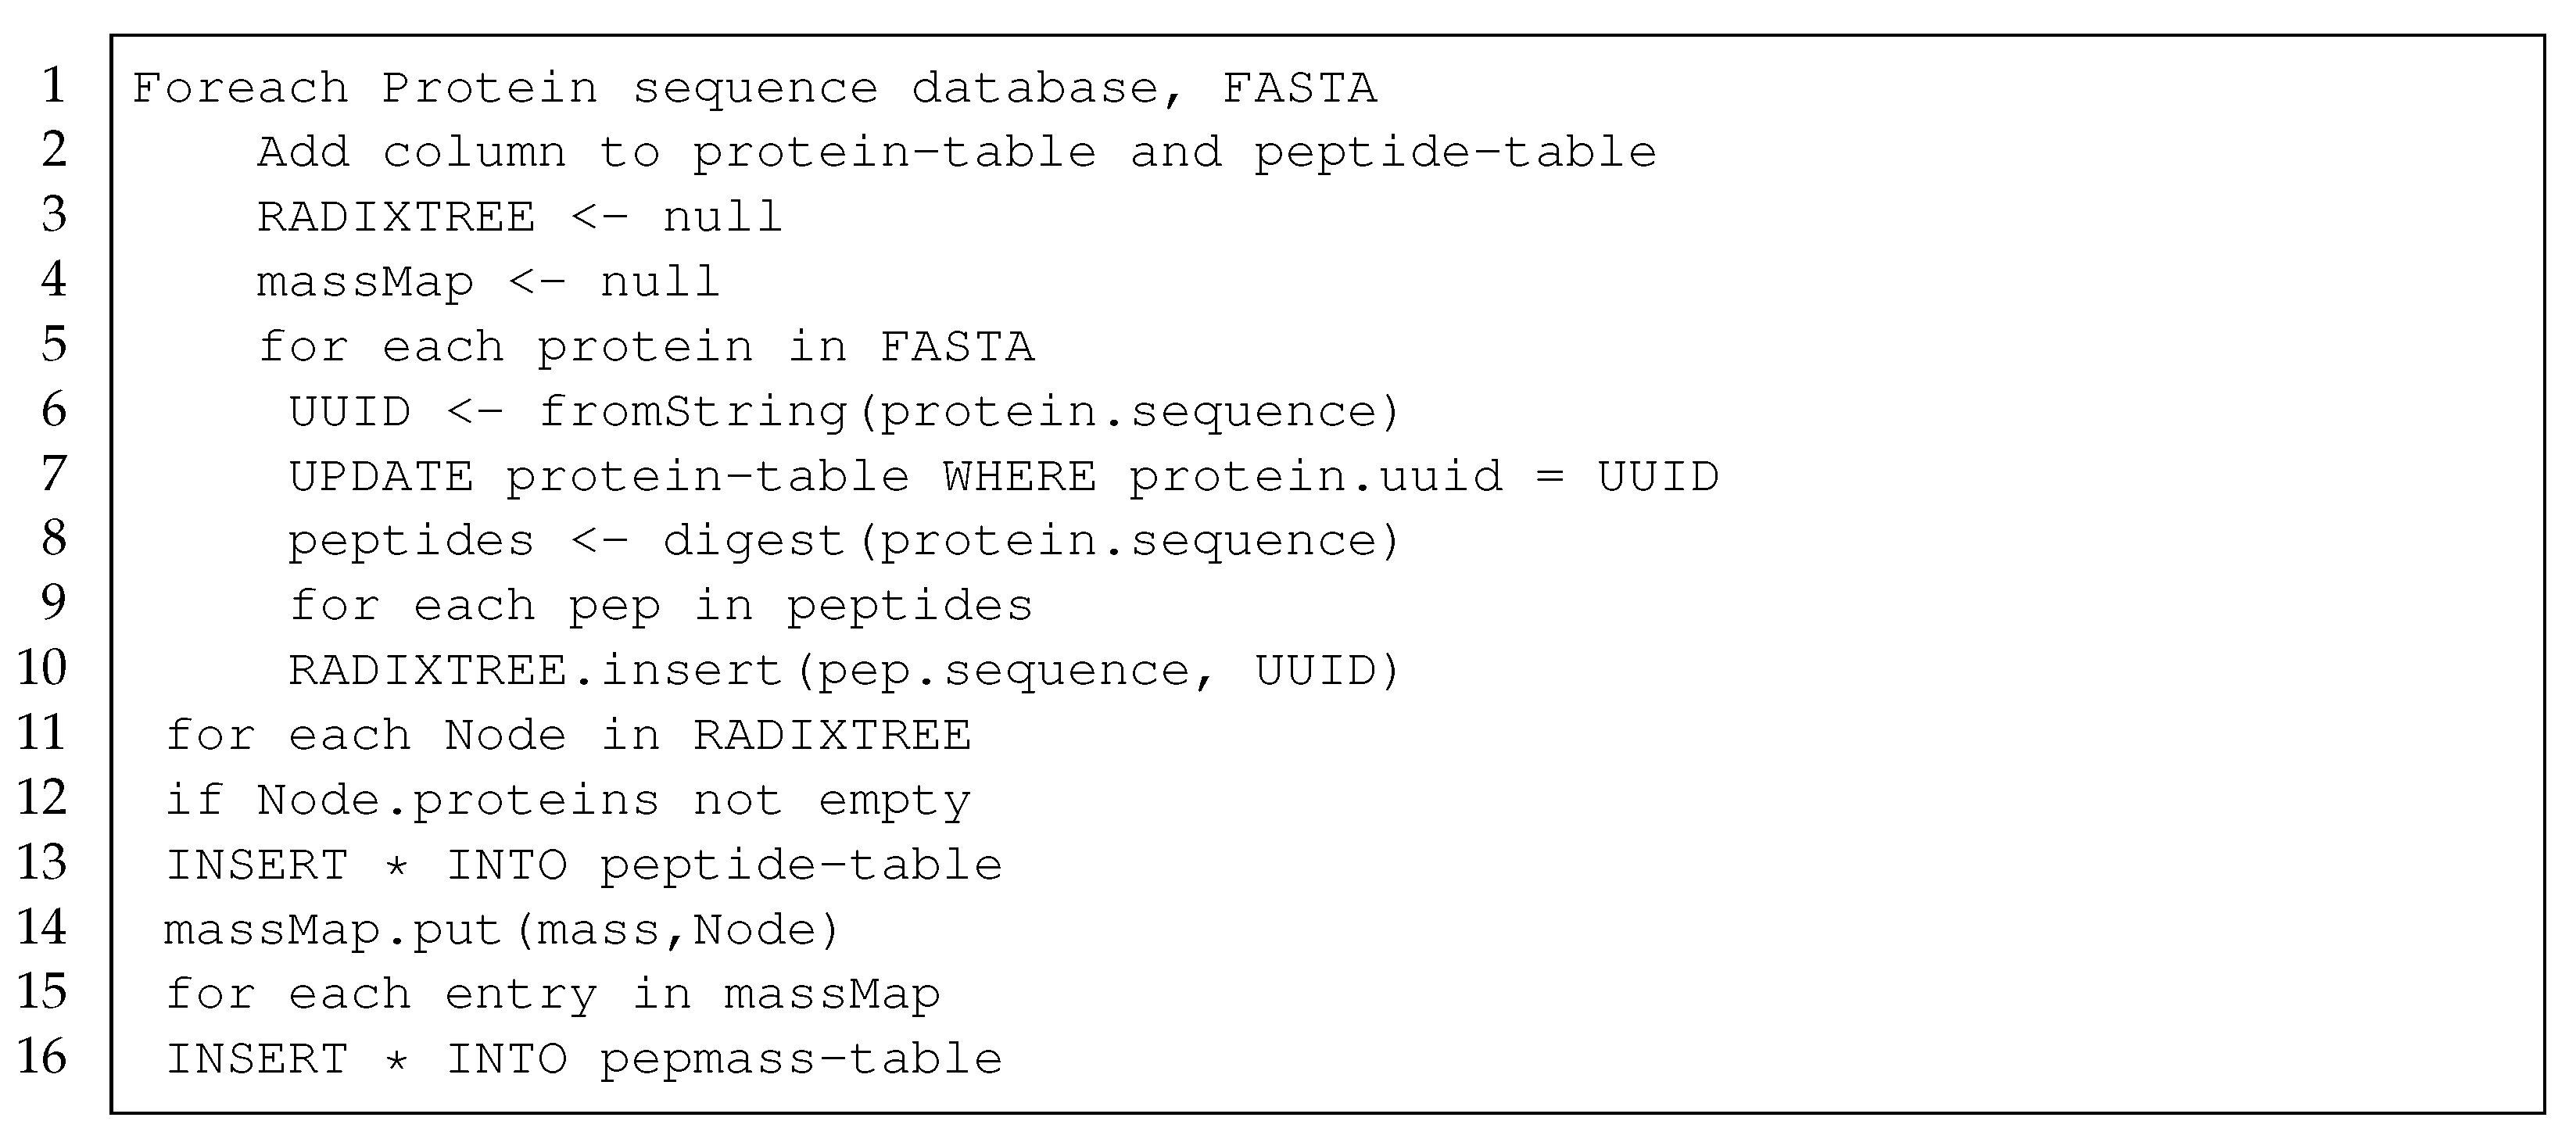
23] is more complex, and hence, we give a detailed explanation of the transformation algorithm (Listing 4) and visualize its application on an example in Figure 7. At the beginning, a new column is added to the protein table and to the 
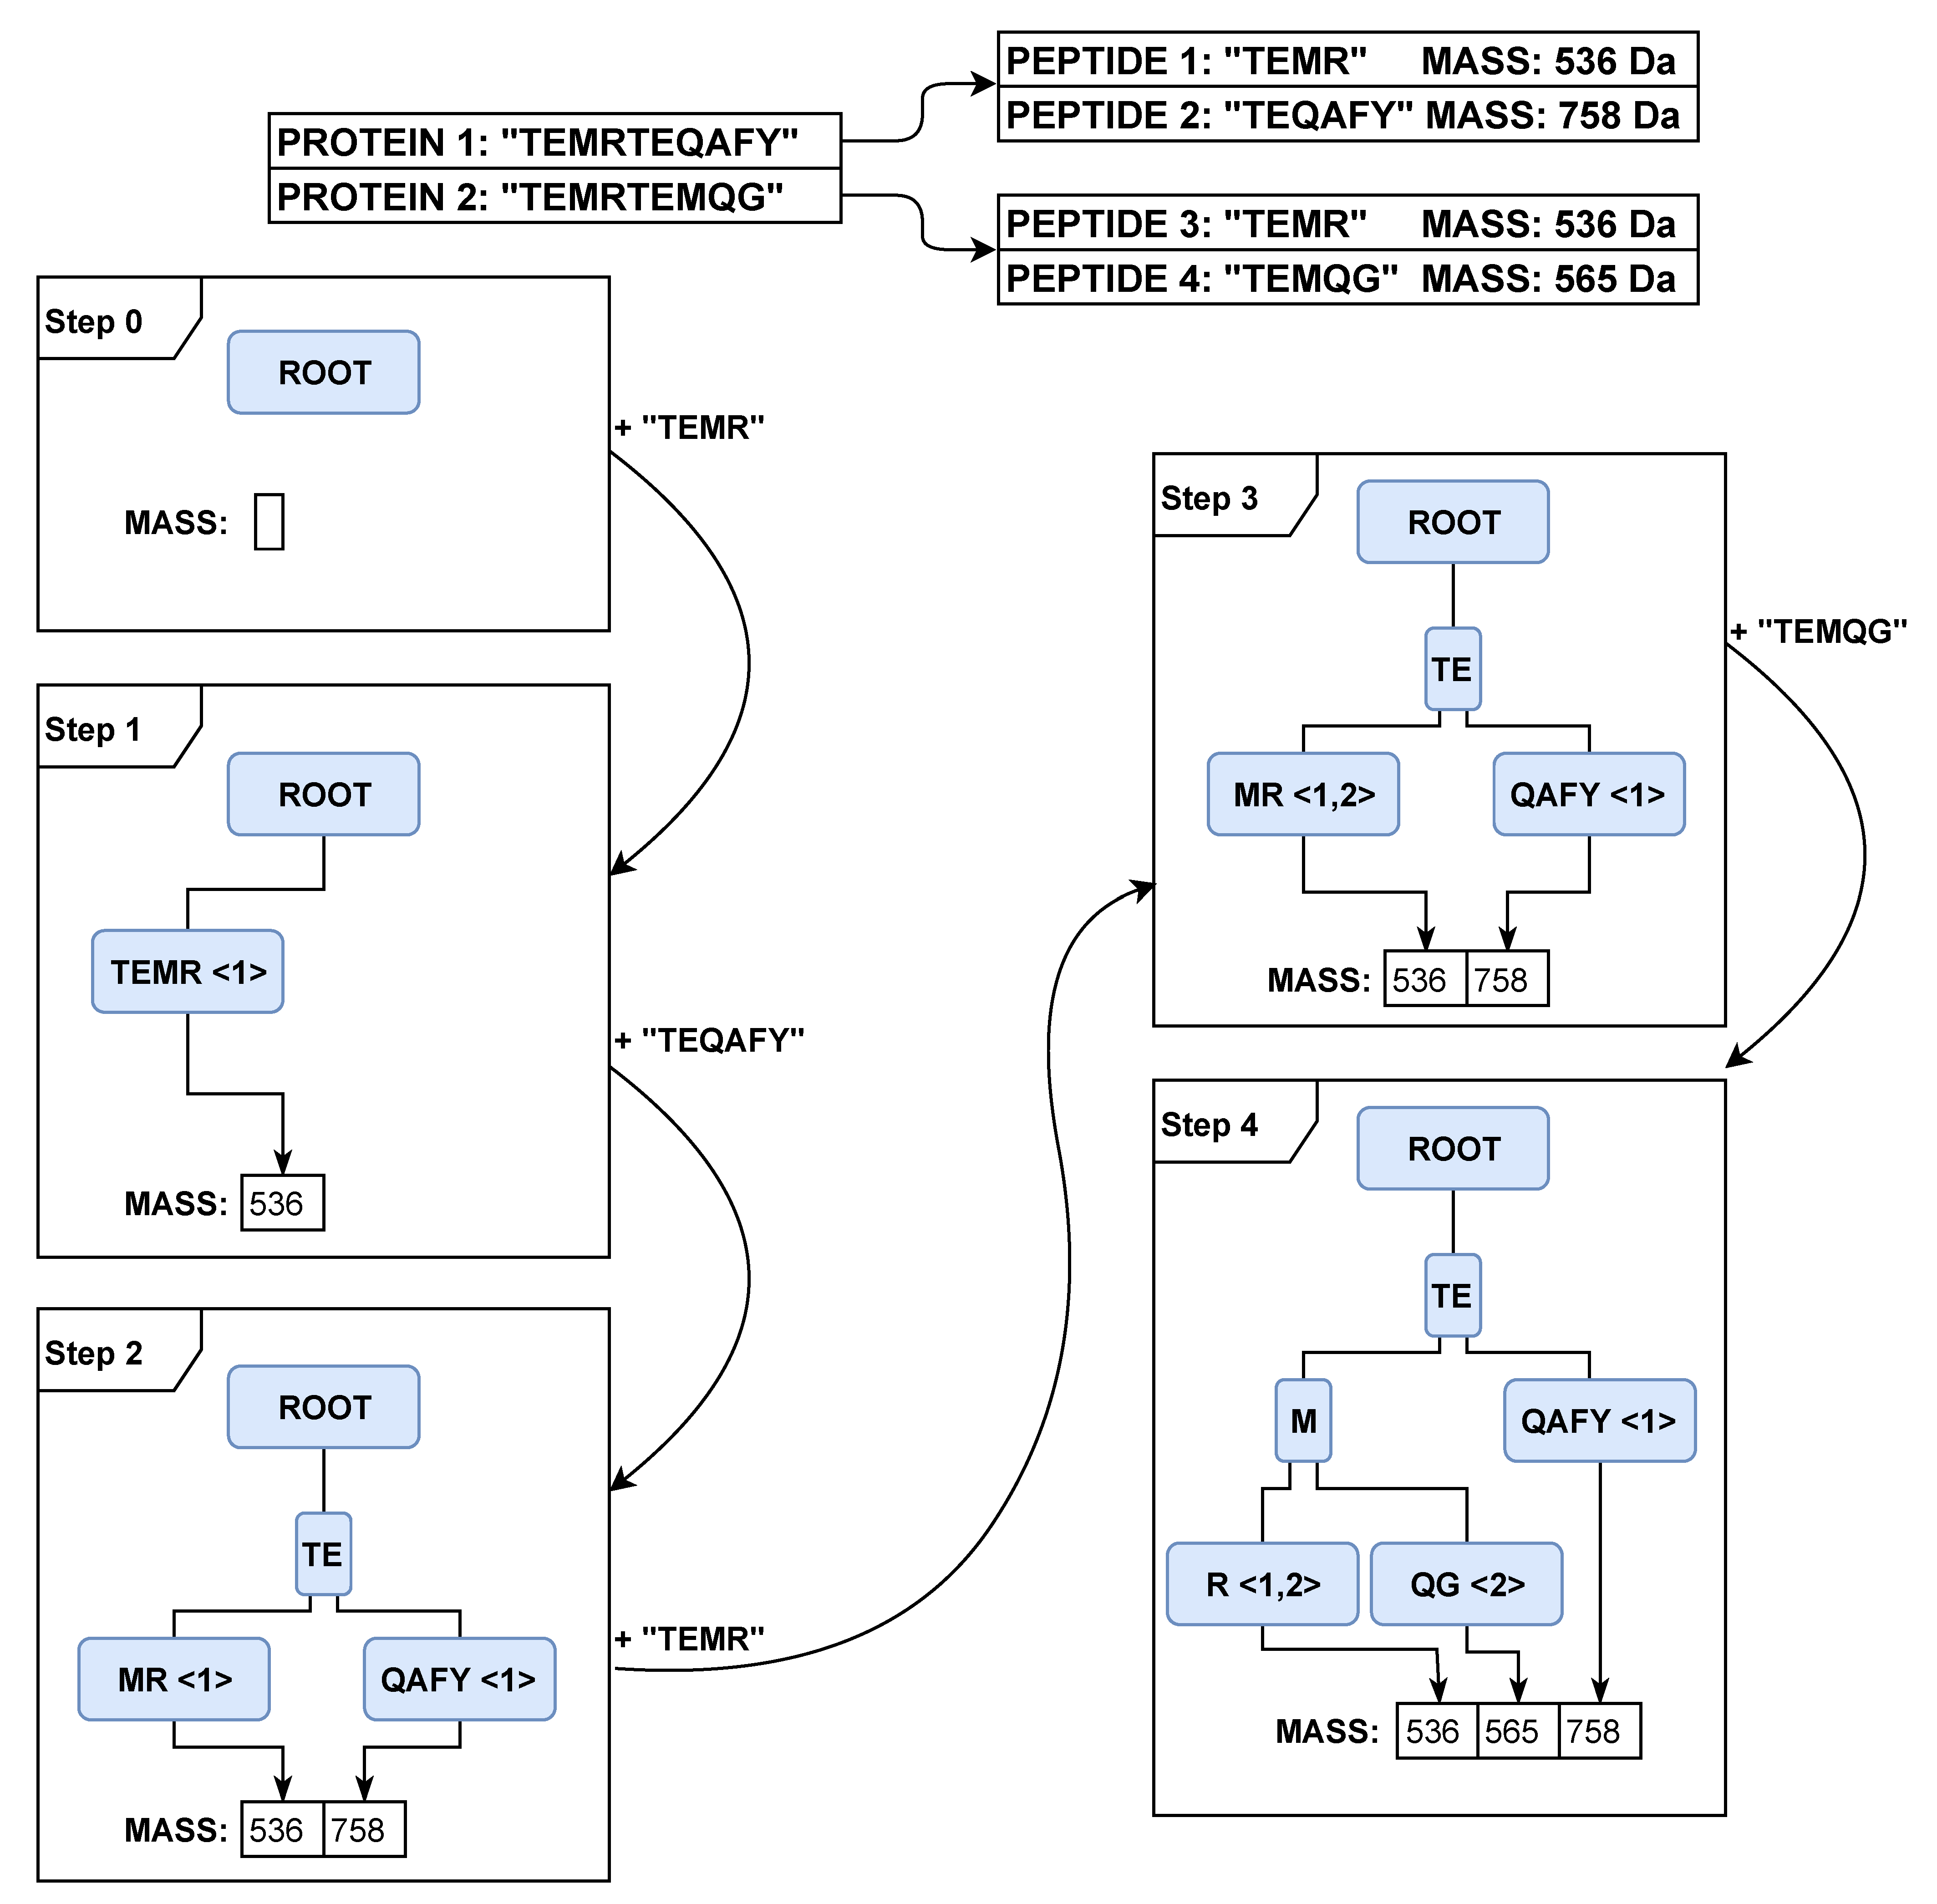
peptide table (Line 2). For each protein, an identifier is generated, and the protein descriptions in the protein table are updated (Lines 6 and 7). Next, each protein is digested into peptides, and we generate a list of peptides for each protein (Line 8). In our example, the protein “TEMRTEQAFY” is digested to the peptides “TEMR”, “TEQAFY” and the second protein “TEMRTEMQG” to the peptides “TEMR”, “TEMQG”. Subsequently, each peptide is inserted into the tree with the associated protein identifier (Line 10). At the beginning (Figure 7, Step 0), the tree and the set of pepmasses are empty. In Step 1, we add the peptide “TEMR” to the tree. The end node gets a relation to the protein to which it belongs and a pointer to the set of pepmasses. In Step 2, we add the peptide “TEQAFY” to the tree. Because both peptides share the prefix “TE”, the first node is split, and two end nodes are created. Because the mass is different from other values in the set of pepmasses, a new entry in the set of pepmasses is created. In Step 3, we add the peptide “TEMR” to the tree. The complete sequence is already available, and only a new relation to another protein is created in the last node. In the last step, we add the peptide “TEMQG” to the tree. All the shared prefixes create an additional node, and only the suffix nodes are left with the relation to the protein that the peptide comes from and a pointer to the unique pepmasses.
Listing 4. Transformation algorithm to transform protein data from FASTA format into the table schema using the radix tree data structure.
Algorithms 14 00059 g013

4.4. Our Radix Tree Adaptation

The difference from the original radix tree by De La Briandais [21] is our usage of the pessimistic path compression and lazy expansion of tree nodes that we adapted from Leis et al. [22]. However, we do not use special adaptive node types and rely on the node16 design by Leis et al. [22], because it matches our fan-out. Furthermore, our main use case is the efficient deduplication of proteins, which has a high priority on insertion, while the tree is traversed only once at the end of the process.
Another difference to other radix trees is that we are not indexing the peptides (i.e., adding a reference to the storage location of the peptides on disk). Instead, we link the protein relationship to the peptides. Hence, in order to adapt the radix tree to our use case of peptide deduplication, we extend the usual radix tree using a set of protein identifiers in each node. Hence, the tree contains all information for the peptide table (Line 13). The link to the proteins is needed to identify the proteins, based on the peptide identification. As a positive side effect, the peptide sequences are automatically deduplicated.
The next step is to calculate the masses for each peptide. Therefore, an additional map with the pepmass as the key and a list of the pointers to the end nodes in the radix tree as the value are created. For each of the end nodes, the pepmasses are calculated (Line 14), focusing first on the different modifications and second on the three charges. For each mass, the peptide sequences are calculated from the end node recursively. Beginning with the end node, which represents the end of a peptide sequence, one needs to traverse over all nodes to the top of the tree to get the sequence completely. The last step is to insert the data from the map with masses and the peptide sequences into the pepmass table (Line 16). As we show in the example in Figure 7, the radix tree needs only a few nodes to store multiple peptide sequences, while the map approach adds a new entry for each different sequence. If only one letter is different, only one additional node in the radix tree structure is added, which is more compressed than a whole additional entry in the map.

5. Evaluation

The evaluation compares resource consumption and the runtime of all four approaches for the peptide deduplication step. As test datasets, we used the entire UniProt/SwissProt protein database and a subset containing only proteins from the species Homo sapiens.
The Homo sapiens data set (Table 5) comprises 4794 proteins and requires a storage size of 2.88 MB. It results in 484,479 overall peptides and 248,996 non-redundant peptides. Finally, these peptides result in a radix tree structure with 295,602 nodes. UniProt/SwissProt has a 255 MB storage size and contains 556,196 proteins and 37,403,696 peptides. After deduplication, only 23,254,068 peptides are left using 28,481,207 nodes in the radix tree.

5.1. Time Evaluation

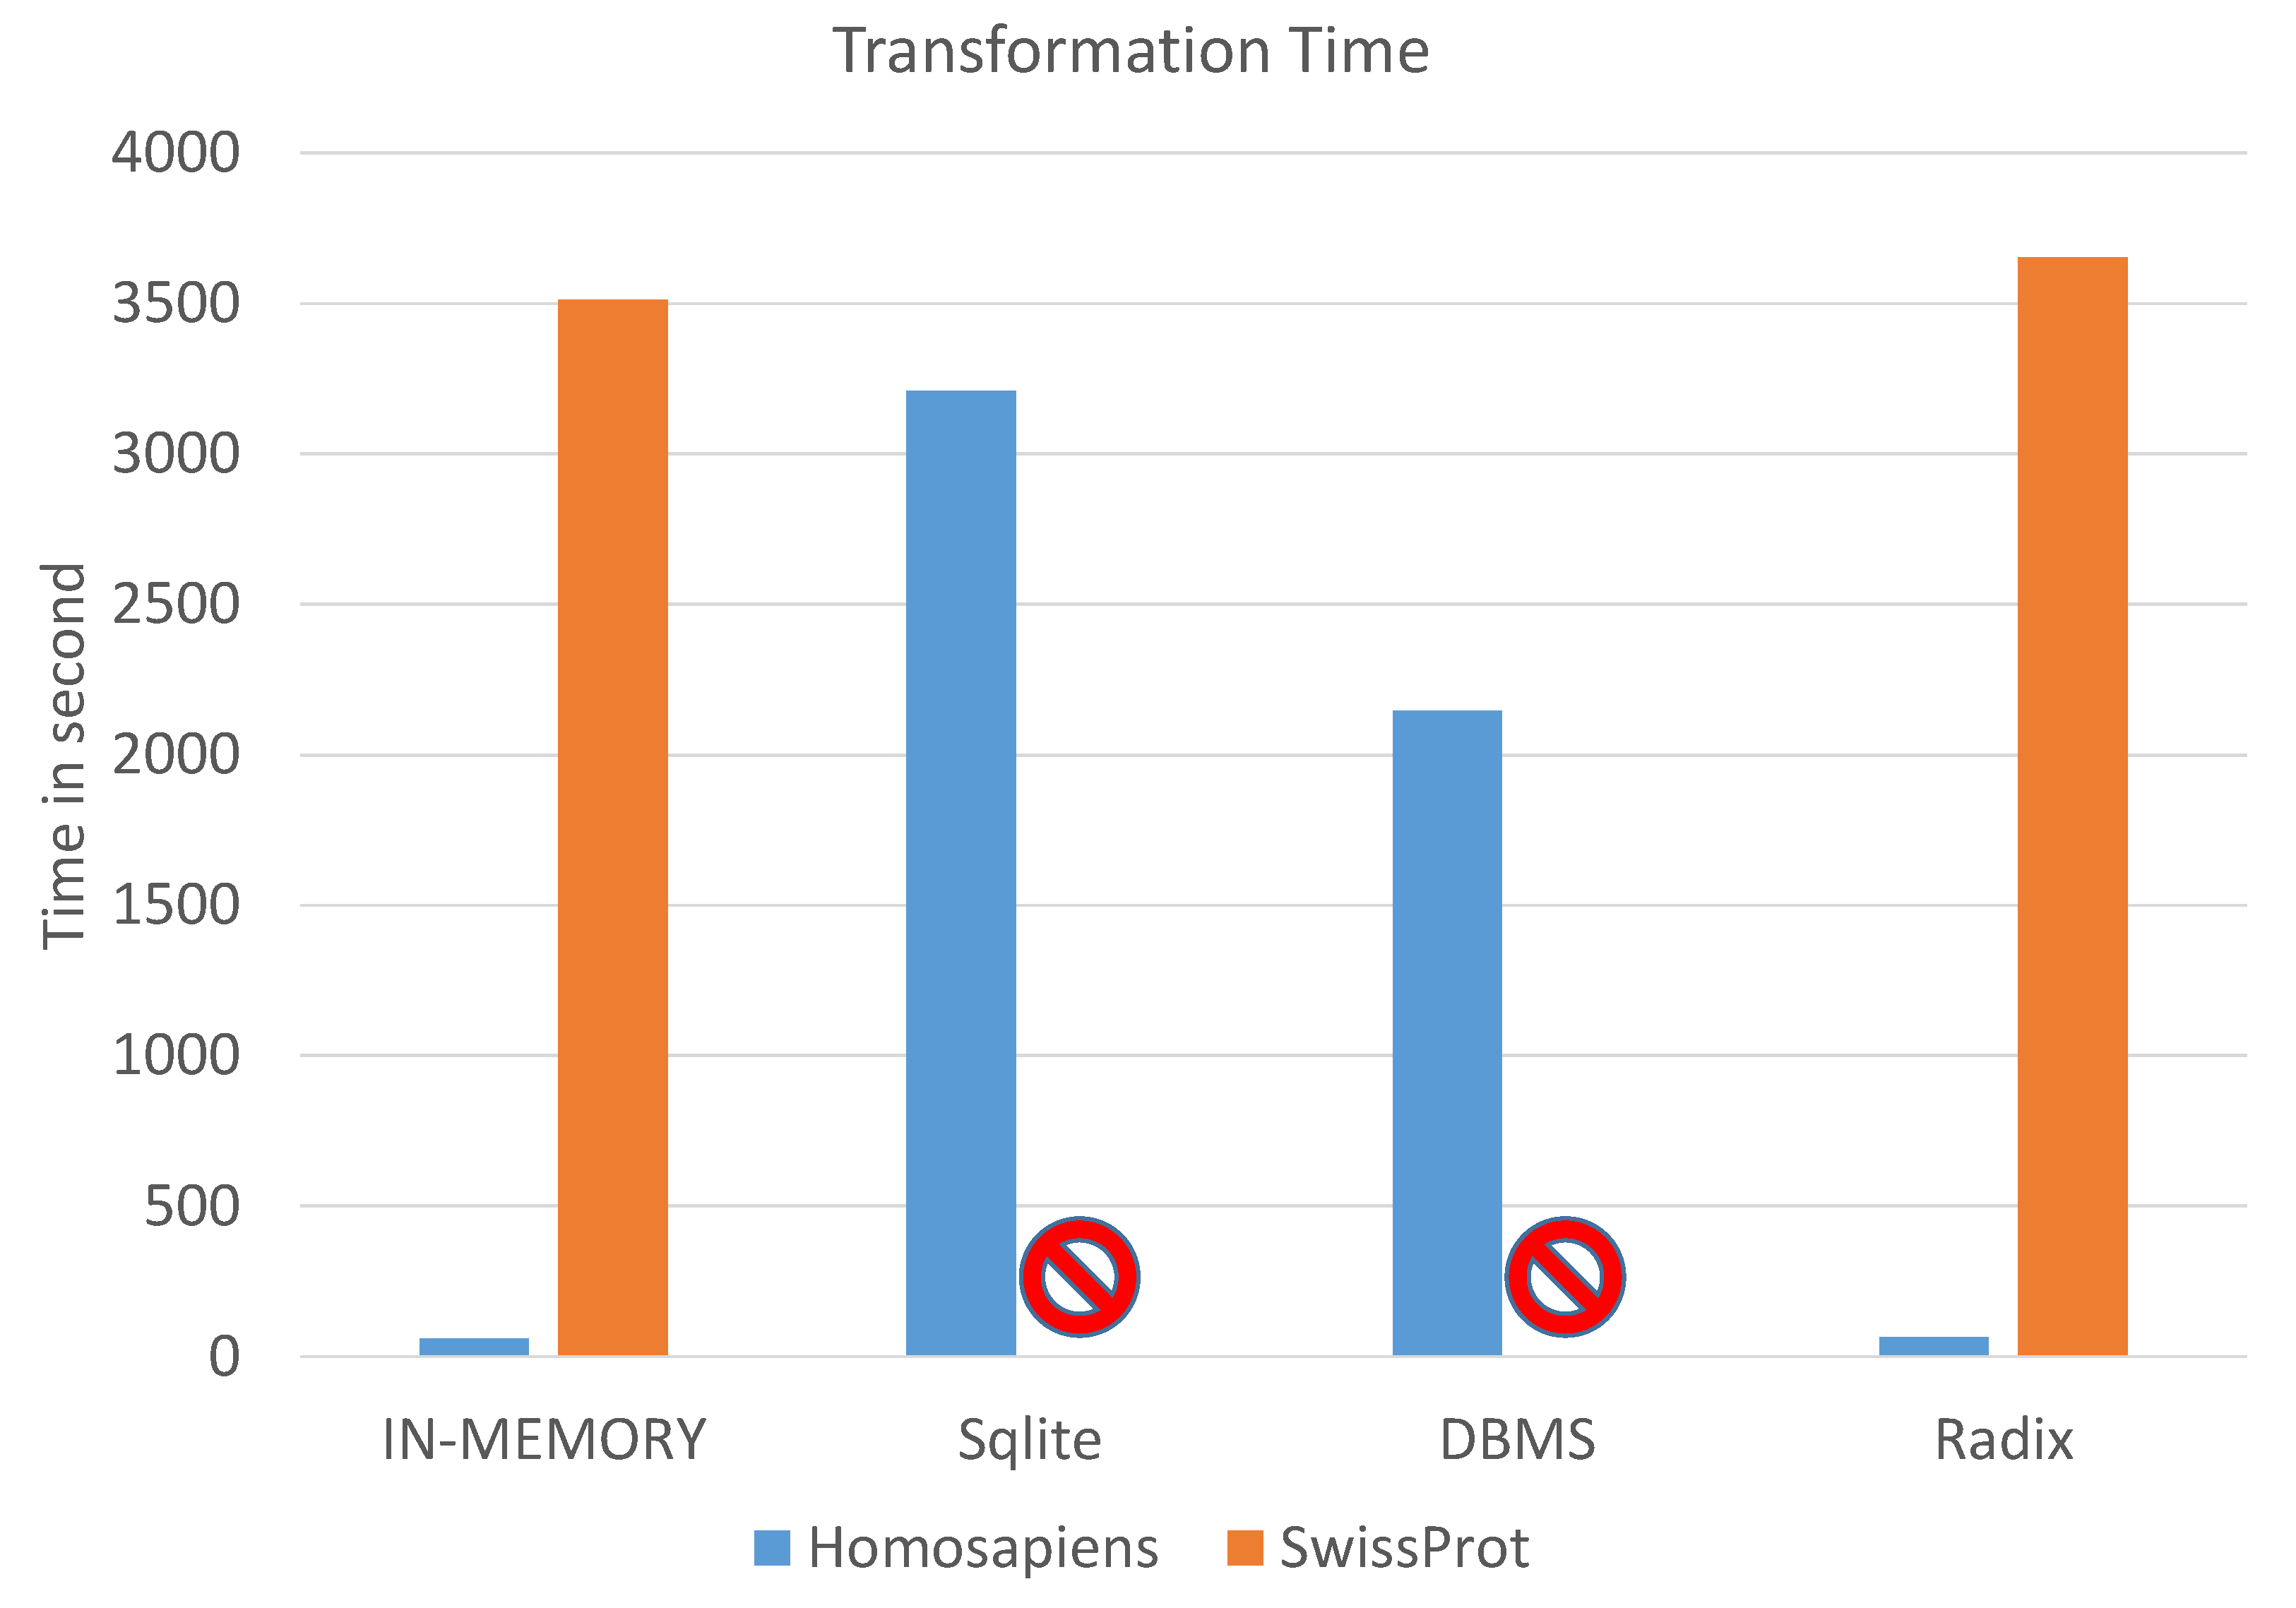
In order to identify the fastest indexing strategy, we repeated each measurement 50 times and averaged the runtimes. We visualize the runtimes for each strategy on each of the two protein databases in Figure 8.

5.1.1. Homo sapiens Data Set

For the Homo sapiens protein database (represented by the blue bars in Figure 8), the naive in-memory approach was five seconds faster than the radix tree method. Furthermore, we observed that the SQLite and the DBMS approach are very slow, requiring one half to one hour of runtime. This was caused by the high number of writes on the slow hard disk.

5.1.2. UniProtKB/SwissProt Data Set

The naive approach required for the indexing of the UniProtKB/SwissProt protein database (represented by the orange bars in Figure 8) 58 min and the radix tree 60 min. The differences come from the calculation of the sequence recursively from the end node. In the radix tree structure, the mass is calculated traversing over the nodes, while in the naive approach, the whole sequence is accessible. This is not needed in the naive approach. The SQLite and the DBMS approaches took days on the UniProtKB/SwissProt data and are not applicable for such big protein sequence databases. Hence, only the naive in-memory approach and the radix tree approach seem to be promising.

5.2. Memory Consumption

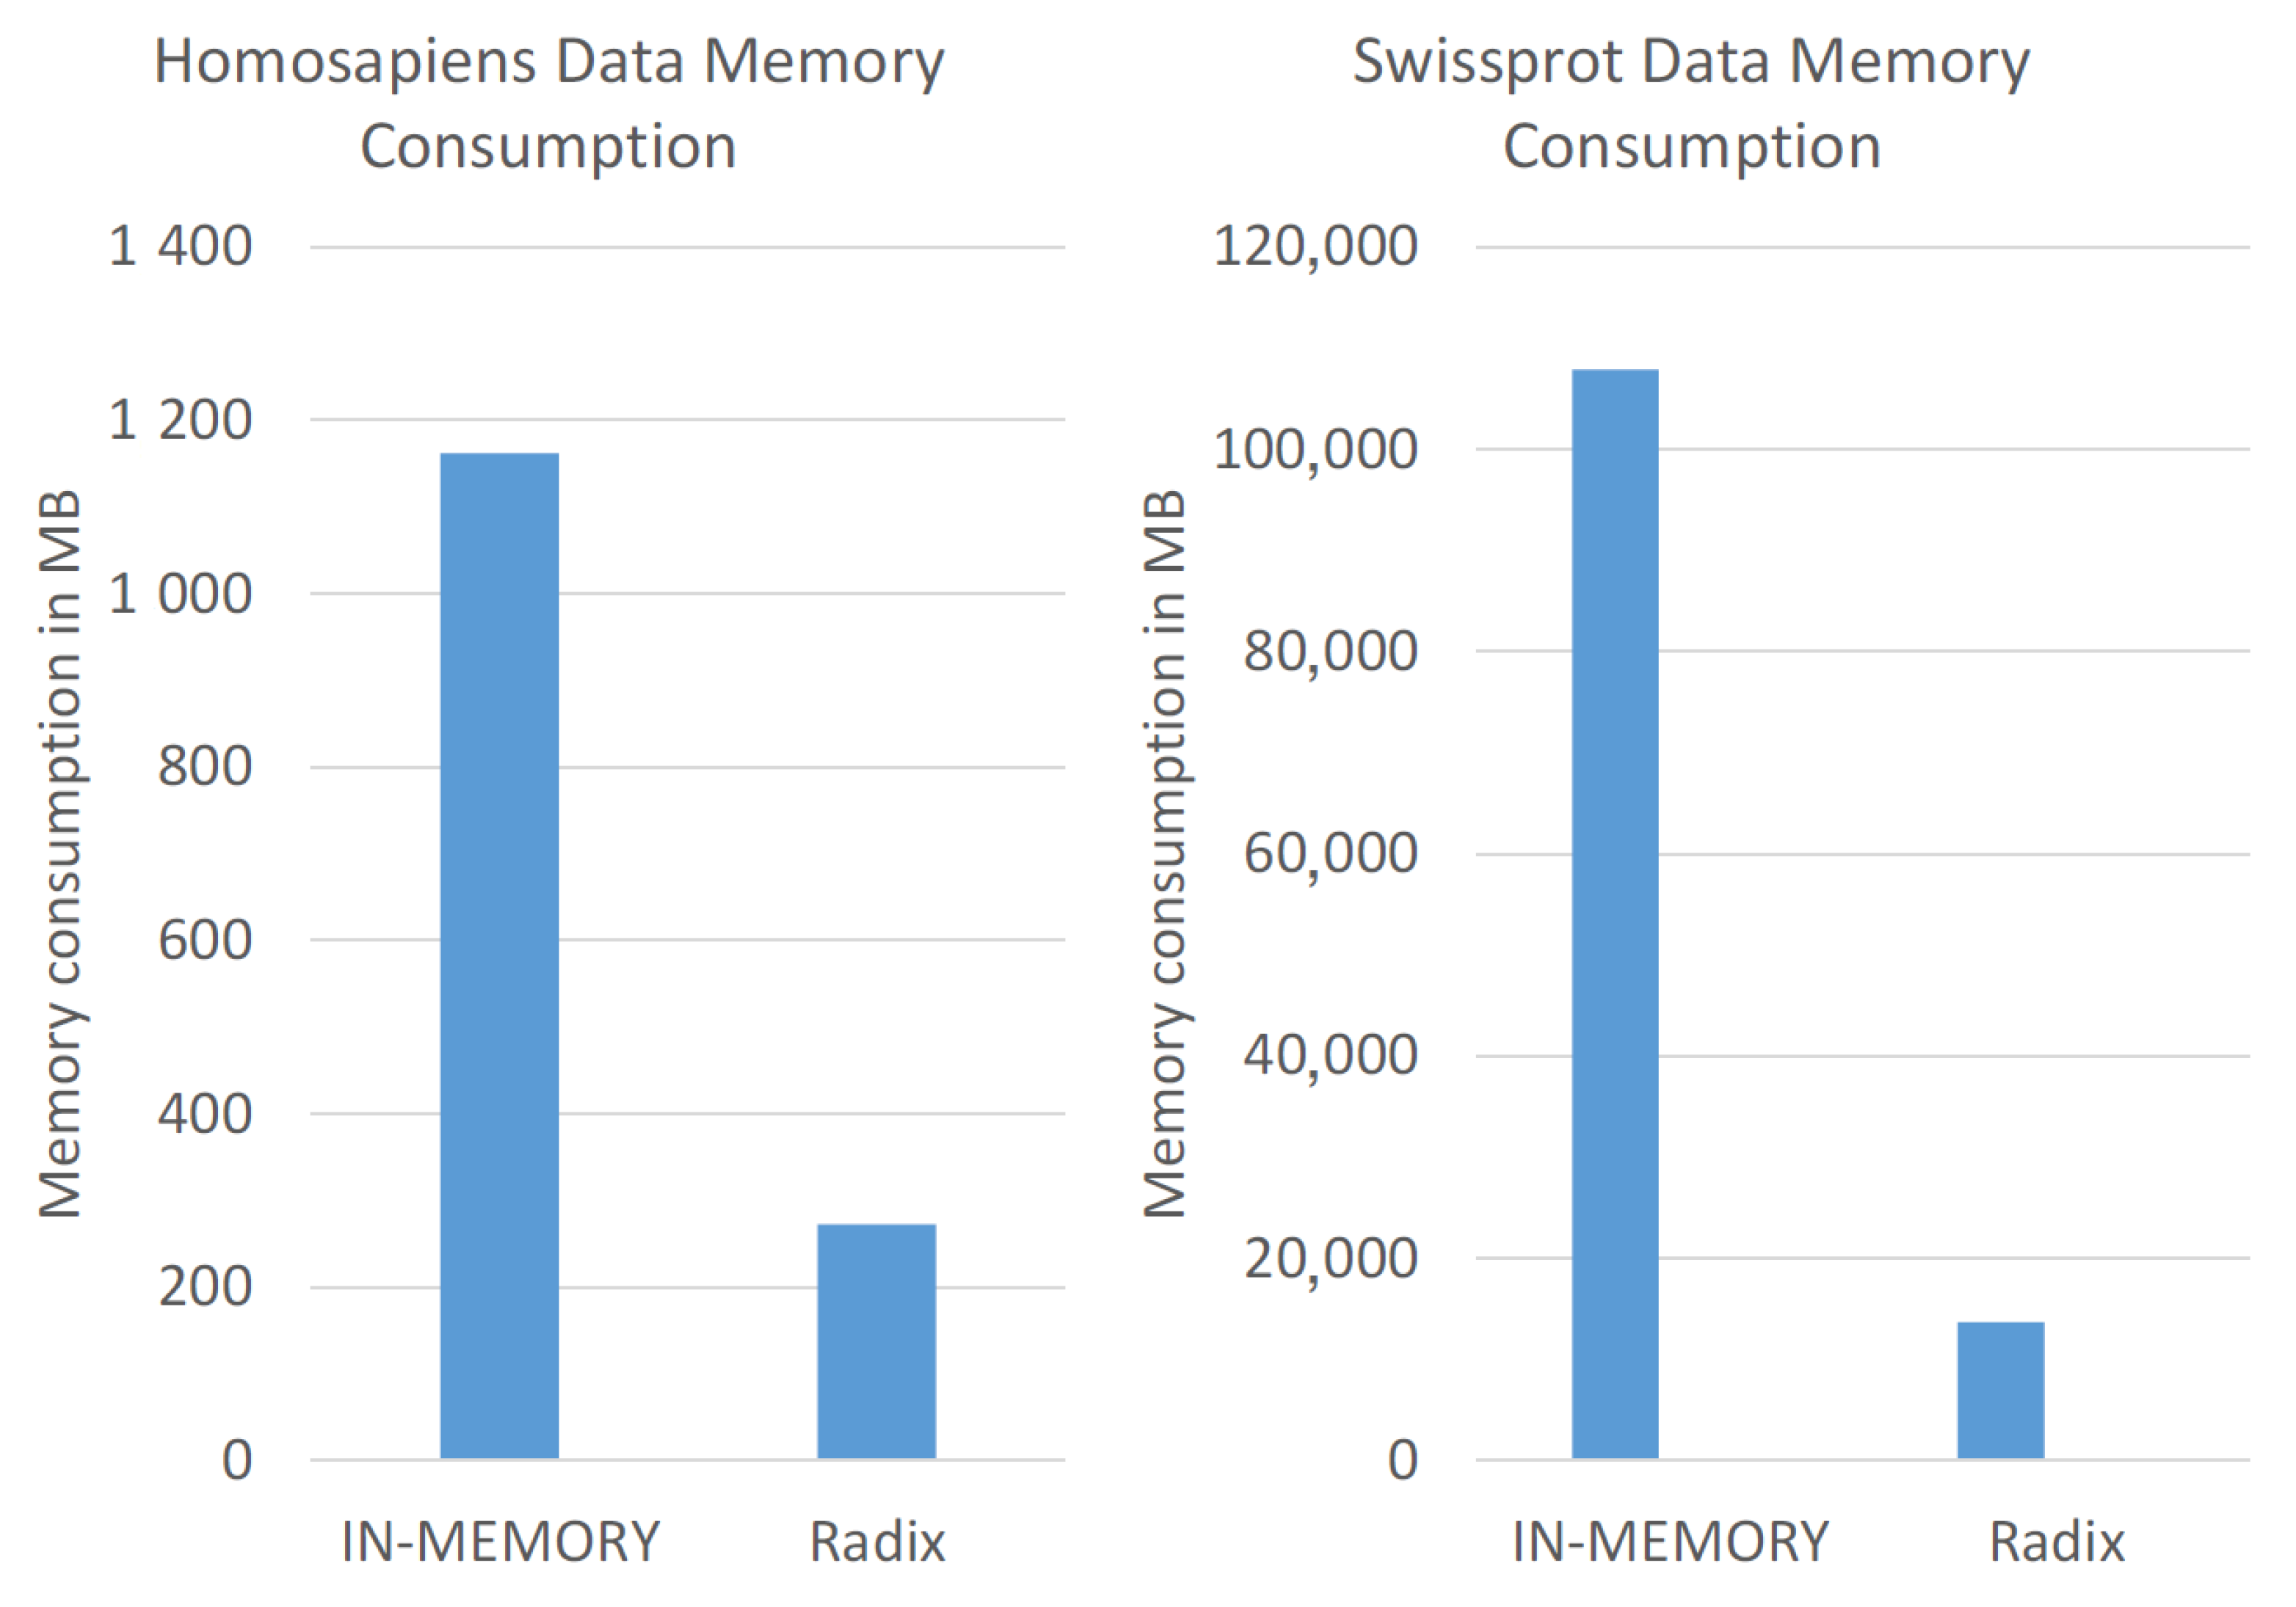
We only consider the in-memory approach and the radix tree method for the memory consumption evaluation in Figure 9, because the other two approaches required too long computation times. The in-memory approach required around 1 GB for the Homo sapiens data set and over 100 GB for the UniProtKB/SwissProt data set. In contrast, the radix tree approach consumed less than 300 MB for the Homo sapiens data set and around 14 GB for the UniProtKB/SwissProt data set. Moreover, the memory consumption of the radix tree increased between the data sets by a factor of 50, while the naive in-memory approach by a factor of 92. Hence, the radix tree method combines in-memory speed and efficient data compression for sequence data and is, therefore, beneficial for storing the peptide sequence data.

5.3. Result Summary

The evaluation shows that radix trees are beneficial for peptide sequence data and could be transformed into our system. In our in-depth investigation, we could identify three benefits of the radix tree structure for peptide sequences. Firstly, most of the differences between peptides are in the first amino acid position. Hence, in higher levels of the tree, the sequences end up in an end node. Due to this fact, the tree consumes less memory. Secondly, many of the differences are only due to one letter. A single-letter difference results in only one additional node in the tree compared to two separate peptide sequences being stored in the naive approach. Thirdly, the insertion of new data into the tree automatically resolves redundancy, which is needed for further processing. Due to its minimized memory consumption, it is even possible to process the data in the RAM, reaching a considerable performance boost compared to its competitors.

6. Related Work

This section presents related work: the protein data indexing approach of Andromeda and the use case of the radix tree structure as a storage structure for sequence data. The protein search engine Andromeda, part of the MaxQuant Software suite, uses an indexing method on pepmasses to reduce the search space during the identification. This approach points to proteins in the protein sequence database files [24]. Nevertheless, the data are still in a FASTA file. In contrast, we structure and transform them completely. Furthermore, we remove redundancies over all the protein databases uploaded into our system.
The software MetaProteomeAnalyzer proposes a relational structure to store the results in a relational database management system [25]. In order to process the data, the MetaProteomeAnalyzer loads the whole data in a map structure into the memory, which required many resources of the system and corresponded to our in-memory map approach.
Enrico Siragusa proposed the radix tree as a structure to store DNA sequences as a preprocessing step in his thesis [26], which is similar to our approach. In our work, however, we use the radix tree firstly to store the peptide sequences, and secondly, we extend the end nodes with the relationship to the proteins.

7. Conclusions

In our work, we investigate how to transform protein sequence databases into the final index schema. Therefore, we implemented the four approaches, in-memory map, HDD map, database engine, and radix tree, evaluated their performance, and summed up the results in Table 6. The extended radix tree is the best structure for the peptide sequence data to transform the protein data into the index schema. The radix tree for peptide sequences combines the almost best performance with a minimal memory consumption across all competitors.
In the future, we will apply the radix tree as a storage system for protein databases and build a query engine around it. Consequently, we assume that we can speed up the current processes based on the FASTA file by using this tree structure. For the application as a cloud service, the protein data need to be uploaded before the later identification process can start.

Author Contributions

The contributions of the authors were distributed in the following way: Conceptualization, R.Z., I.T., X.C., R.H.; methodology, R.Z., X.C., R.H.; software, X.C.; validation, K.S.; data curation, K.S.; writing—original draft preparation, R.Z. and I.T.; writing—review and editing, D.B. (Dirk Benndorf), D.B. (David Broneske) and G.S.; visualization, X.C.; supervision, D.B. (David Broneske); project administration, R.H.; funding acquisition, D.B. (Dirk Benndorf) and G.S. All authors have read and agreed to the published version of the manuscript.

Funding

This work is partly funded by the de.NBI Network (031L0103), the European Regional Development Fund (No. 11.000sz00.00.0 17 114347 0), and by the German Federal Ministry of Food and Agriculture (Grant No. 22404015).

Data Availability Statement

Further results can be found in the thesis of Roman Zoun [20].

Acknowledgments

The authors sincerely thank Niya Zoun, Gabriel Campero Durand, Marcus Pinnecke, Sebastian Krieter, Sven Helmer, Sven Brehmer, and Andreas Meister for their support and advice. This work was a cooperation with Bruker Daltonik GmbH and is dedicated to the memory of Mikhail Zoun.

Conflicts of Interest

The authors declare no conflict of interest.

References

  1. Global Mass Spectrometry Market Size, Market Share, Application Analysis, Regional Outlook, Growth Trends, Key Players, Competitive Strategies and Forecasts, 2015 to 2025. 2017. Available online: https://www.researchandmarkets.com/reports/4313373/global-mass-spectrometry-market-size-market (accessed on 10 February 2021).
  2. Aebersold, R.; Mann, M. Mass spectrometry-based proteomics. Nature 2003, 422, 198. [Google Scholar] [CrossRef]
  3. Ashcroft, A.E. An Introduction to Mass Spectrometry; The University of Leeds: Leeds, UK, 2011. [Google Scholar]
  4. Heyer, R.; Kohrs, F.; Reichl, U.; Benndorf, D. Metaproteomics of complex microbial communities in biogas plants. Microb. Technol. 2015, 8, 749–763. [Google Scholar] [CrossRef] [PubMed]
  5. Heyer, R.; Schallert, K.; Siewert, C.; Kohrs, F.; Greve, J.; Maus, I.; Klang, J.; Klocke, M.; Heiermann, M.; Hoffmann, M.; et al. Metaproteome analysis reveals that syntrophy, competition, and phage-host interaction shape microbial communities in biogas plants. Microbiome 2019, 7, 69. [Google Scholar] [CrossRef]
  6. Petriz, B.A.; Franco, O.L. Metaproteomics as a Complementary Approach to Gut Microbiota in Health and Disease. Front. Chem. 2017, 5, 4. [Google Scholar] [CrossRef] [Green Version]
  7. Lehmann, T.; Schallert, K.; Vilchez-Vargas, R.; Benndorf, D.; Püttker, S.; Sydor, S.; Schulz, C.; Bechmann, L.; Canbay, A.; Heidrich, B.; et al. Metaproteomics of fecal samples of Crohn’s disease and Ulcerative Colitis. J. Proteom. 2019, 201, 93–103. [Google Scholar] [CrossRef] [PubMed]
  8. D’Angelo, G.; Palmieri, F. Discovering genomic patterns in SARS-CoV-2 variants. Int. J. Intell. Syst. 2020, 35, 1680–1698. [Google Scholar] [CrossRef]
  9. Millioni, R.; Franchin, C.; Tessari, P.; Polati, R.; Cecconi, D.; Arrigoni, G. Pros and cons of peptide isolectric focusing in shotgun proteomics. J. Chromatogr. A 2013, 1293, 1–9. [Google Scholar] [CrossRef] [PubMed]
  10. Zoun, R.; Schallert, K.; Janki, A.; Ravindran, R.; Durand, G.C.; Fenske, W.; Broneske, D.; Heyer, R.; Benndorf, D.; Saake, G. Streaming FDR Calculation for Protein Identication. In Advances in Databases and Information Systems; Springer: Budapest, Hungary, 2018; pp. 80–87. [Google Scholar]
  11. Zoun, R.; Durand, G.C.; Schallert, K.; Patrikar, A.; Broneske, D.; Fenske, W.; Heyer, R.; Benndorf, D.; Saake, G. Protein Identification as a Suitable Application for Fast Data Architecture. In Proceedings of the DEXA 2018 International Workshops, BDMICS, BIOKDD, and TIR, Regensburg, Germany, 3–6 September 2018; pp. 168–178. [Google Scholar]
  12. Zoun, R.; Schallert, K.; Broneske, D.; Fenske, W.; Pinnecke, M.; Heyer, R.; Brehmer, S.; Benndorf, D.; Saake, G. MSDataStream-Connecting a Bruker Mass Spectrometer to the Internet. Available online: https://new-dl.gi.de/handle/20.500.12116/21719 (accessed on 10 February 2021).
  13. Zoun, R.; Schallert, K.; Broneske, D.; Trifonova, I.; Chen, X.; Heyer, R.; Benndorf, D.; Saake, G. Efficient Transformation of Protein Sequence Databases to Columnar Index Schema; Database and Expert Systems Applications; Springer International Publishing: Cham, Switzerland, 2019; pp. 67–72. [Google Scholar]
  14. Banerjee, S.; Mazumdar, S. Electrospray Ionization Mass Spectrometry: A Technique to Access the Information beyond the Molecular Weight of the Analyte. Int. J. Anal. Chem. 2012, 2012, 282574. [Google Scholar] [CrossRef] [PubMed] [Green Version]
  15. Deutsch, E.W. File formats commonly used in mass spectrometry proteomics. Mol. Cell. Proteom. 2012, 11, 1612–1621. [Google Scholar] [CrossRef] [PubMed] [Green Version]
  16. McDonald, W.H.; Tabb, D.L.; Sadygov, R.G.; MacCoss, M.J.; Venable, J.; Graumann, J.; Johnson, J.R.; Cociorva, D.; Yates, J.R., III. MS1, MS2, and SQT—three unified, compact, and easily parsed file formats for the storage of shotgun proteomic spectra and identifications. Rapid Commun. Mass Spectrom. 2004, 18, 2162–2168. [Google Scholar] [CrossRef]
  17. Matrix Science. Data File Format. 2016. Available online: http://www.matrixscience.com/help/data_\file_help.html (accessed on 10 February 2021).
  18. FASTA Format. 2002. Available online: https://blast.ncbi.nlm.nih.gov/Blast.cgi?CMD=Web&PAGE_TYPE=BlastDocs&\DOC_TYPE=BlastHelp (accessed on 10 February 2021).
  19. Wampler, D. Fast Data Architectures for Streaming Applications, 1st ed.; O’Reilly Media: Sebastopol, CA, USA, 2016. [Google Scholar]
  20. Zoun, R. Analytic Cloud Platform for Near Real-Time Mass Spectrometry Processing on the Fast Data Architecture. Ph.D. Thesis, University of Magdeburg, Magdeburg, Germany, 2020. [Google Scholar]
  21. De La Briandais, R. File Searching Using Variable Length Keys. In Proceedings of the Western Joint Computer Conference, San Francisco, CA, USA, 3–5 March 1959. [Google Scholar]
  22. Leis, V.; Kemper, A.; Neumann, T. The Adaptive Radix Tree: ARTful Indexing for Main-memory Databases. In Proceedings of the 2013 IEEE International Conference on Data Engineering (ICDE 2013), Brisbane, Australia, 8–11 April 2013; pp. 38–49. [Google Scholar]
  23. Shishibori, M.; Okuno, M.; Ando, K.; Aoe, J.I. An efficient compression method for Patricia tries. In Proceedings of the 1997 IEEE International Conference on Systems, Man, and Cybernetics, Computational Cybernetics and Simulation, Orlando, FL, USA, 12–15 October 1997; Volume 1, pp. 415–420. [Google Scholar] [CrossRef]
  24. Cox, J.; Neuhauser, N.; Michalski, A.; Scheltema, R.A.; Olsen, J.V.; Mann, M. Andromeda: A Peptide Search Engine Integrated into the MaxQuant Environment. J. Proteome Res. 2011, 10, 1794–1805. [Google Scholar] [CrossRef] [PubMed]
  25. Muth, T.; Behne, A.; Heyer, R.; Kohrs, F.; Benndorf, D.; Hoffmann, M.; Lehtevä, M.; Reichl, U.; Martens, L.; Rapp, E. The MetaProteomeAnalyzer: A Powerful Open-Source Software Suite for Metaproteomics Data Analysis and Interpretation. J. Proteome Res. 2015, 14, 1557–1565. [Google Scholar] [CrossRef] [PubMed]
  26. Siragusa, E. Approximate String Matching for High-Throughput Sequencing. Ph.D. Thesis, Freie Universität Berlin, Berlin, Germany, 2015. [Google Scholar]
Figure 1. A plot of a mass spectrum [14].
Algorithms 14 00059 g001
Figure 2. A general peptide-centric protein identification method, which compares the experimental spectra and the theoretical ones [9].
Algorithms 14 00059 g002
Figure 3. Architecture of the analytic platform for real-time diagnostics of mass spectrometry data.
Algorithms 14 00059 g003
Figure 4. A sample radix tree with peptide sequences [23].
Algorithms 14 00059 g004
Figure 5. General schema of preprocessed protein data in the mass spectrometry analytic cloud system.
Algorithms 14 00059 g005
Figure 6. Transformation steps from FASTA format to our indexed schema.
Algorithms 14 00059 g006
Figure 7. Sample of a radix tree as the peptide storage in the data transformation process.
Algorithms 14 00059 g007
Figure 8. Evaluation of the runtime of the transformation process on the data sets Homo sapiens (blue) and SwissProt (orange).
Algorithms 14 00059 g008
Figure 9. Evaluation of the memory consumption during the transformation process on the data sets Homo sapiens and SwissProt.
Algorithms 14 00059 g009
Table 1. Sample data of a protein table.
prot_idFILE_1FILE_2prot_seq
PROTEIN_1null[’json-data’]TEMRTEQAFY
PROTEIN_2[’json-data’][’json-data’]TEMRTEMQG
Table 2. Sample data of a peptide table.
pep_seqFILE_1FILE_2
TEMR[PROTEIN_2][PROTEIN_1, PROTEIN_2]
TEQAFYnull[PROTEIN_1]
TEMQG[PROTEIN_2][PROTEIN_2]
Table 3. Sample data of a pepmass table.
FastaChargePepmassPeptide_List
FILE_11536[’TEMR’]
FILE_11565[’TEMQG’]
FILE_21536[’TEMR’]
FILE_21768[’TEQAFY’]
FILE_21565[’TEMQG’]
Table 4. An overview of protein data transformation step approaches.
MethodProtein DeduplicationProtein DigestionPeptide DeduplicationCommit
In-Memory MapNoYesYesNo
HDD-resident MapNoYesYesNo
Database EngineYesYesYesYes
Radix TreeNoYesYesNo
Table 5. Statistical data about our used protein database for the evaluation.
Homo SapiensSwissProt
Size in MB2.88255
Number of proteins4794556,196
Number of peptides484,47937,403,696
Number of unique peptides248,99623,254,068
Number of radix nodes295,60228,481,207
Table 6. An overview of approaches for the protein data transformation steps. The best method is written in bold.
MethodProtein DeduplicationProtein DigestionPeptide DeduplicationCommit
In-Memory MapNoYesYesNo
HDD MapNoYesYesNo
Database EngineYesYesYesYes
Radix TreeNoYesYesNo
Publisher’s Note: MDPI stays neutral with regard to jurisdictional claims in published maps and institutional affiliations.

