
Molecular Subtyping and Outlier Detection in Human Disease Using the Paraclique Algorithm


Department of Electrical Engineering and Computer Science, University of Tennessee, Knoxville, TN 37996, USA
*
Author to whom correspondence should be addressed.
Algorithms 2021, 14(2), 63; https://0-doi-org.brum.beds.ac.uk/10.3390/a14020063
Submission received: 22 October 2020
/
Revised: 9 February 2021
/
Accepted: 13 February 2021
/
Published: 19 February 2021
(This article belongs to the Special Issue Biological Knowledge Discovery from Big Data)
Abstract
:Recent discoveries of distinct molecular subtypes have led to remarkable advances in treatment for a variety of diseases. While subtyping via unsupervised clustering has received a great deal of interest, most methods rely on basic statistical or machine learning methods. At the same time, techniques based on graph clustering, particularly clique-based strategies, have been successfully used to identify disease biomarkers and gene networks. A graph theoretical approach based on the paraclique algorithm is described that can easily be employed to identify putative disease subtypes and serve as an aid in outlier detection as well. The feasibility and potential effectiveness of this method is demonstrated on publicly available gene co-expression data derived from patient samples covering twelve different disease families.
1. Introduction
It has long been established that many disease families exhibit a wide range of heterogeneity. This is especially true in cancer. Lung cancers, for example, fall into two overall types based on histological characteristics: small cell lung cancer (SCLC) and non-small cell lung cancer (NSCLC). Although histological classification remains crucial, significant advances in the treatment of NSCLC over the last decade have centered around the development of therapies targeting subtypes at the molecular level, such as those defined by genetic mutations [1]. In particular, therapies targeting alterations in the epidermal growth factor receptor (EGFR) and anaplastic lymphoma kinase (ALK) genes have produced dramatic improvements in outcomes for patients in the underlying subgroups [2,3]. In addition to providing new paths for treatment, advances in molecular subtyping allow practitioners to avoid needless high-risk therapies. For example, studies have identified transcriptomic signatures for chemo-resistance in both acute myeloid leukemia and breast cancer [4,5]. Recent research has made positive steps towards targeted care for a variety of diseases, including Asthma, Alzheimer’s, and Crohn’s disease [6,7,8]. A key development driving these advances is the successful identification of molecular subtypes.
Given the potential impact of disease subtype identification, it is not surprising therefore, that the search for effective clustering methods has become an intense area of interest. Traditional approaches, such as k-means and hierarchical clustering, have long been used to identify sets of genes or samples that exhibit similar expression patterns [9,10,11]. Machine learning techniques based on neural networks have been investigated as well [12,13,14]. Latent variable and mixture models have also been used [15,16,17]. Meanwhile, a graph theoretical approach is to model a set of genes or samples as vertices in a graph, with edges connecting them based on thresholding some similarity metric. A systematic comparison of clustering methods over well-annotated S. cerevisiae (baker’s yeast) gene co-expression data can be found in [18], where it was shown that clique-centric graph theoretical algorithms generally outperform other approaches. Moreover, the top-down paraclique algorithm (see Supplementary Materials) introduced in [19] was found to possess considerable computational advantages over other clique-based tools. Maximal clique [20], for example, is output bound, while k-clique communities [21] are hobbled by bottom-up inefficiencies. Paraclique has seen prior application in transcriptomics [22], proteomics [23], epigenetics [24] and the exposome [25], as well as in the study of specific diseases including lung cancer [26], diabetes [27], allergic rhinitis [28] and community-acquired pneumonia [29], and even in investigations of the effects of radiation on living organisms [30]. Nevertheless, to the best of our knowledge, this paper represents the first attempt to gauge paraclique’s potential merit in the context of molecular disease subtyping.
To address this gap, we describe an initial study of putative subtypes based on molecular signatures using the paraclique method. Our technique is general and applies easily to other types of data such as protein interaction, metabolite abundance, or DNA methylation profiles, but we focus our experimentation on gene co-expression data thanks to its relative quality and ubiquity. In addition to subtype discovery, we will show how our techniques can be used to help pinpoint potential outliers, providing an automatic means for the identification of suspected data collection errors such as mislabeled samples or misdiagnosed patients. We hasten to observe, however, that biological variation can be inscrutable, inconsistent, and unpredictable. No method is therefore likely to be extraordinarily accurate. We will address this and related issues in the sequel.
This paper is organized as follows. In the next section, we provide a brief review of the paraclique algorithm and discuss details of our workflow for subtyping in gene co-expression data. In Section 3, we outline our testing procedures, provide GO enrichment results that indicate functional biological relevance of the subtypes we identify, and describe additional testing with labeled data over known subtypes that demonstrate the fidelity of further stratification using this approach. In Section 4, we consider outlier detection and discuss how methods such as these can help address this problem. In a final section, we summarize results, place them in context, and consider avenues for future work. A preliminary version of a portion of this paper was presented at the International Workshop on Biological Knowledge Discovery from Big Data, held in Linz, Austria, in August, 2019.
2. Methodology
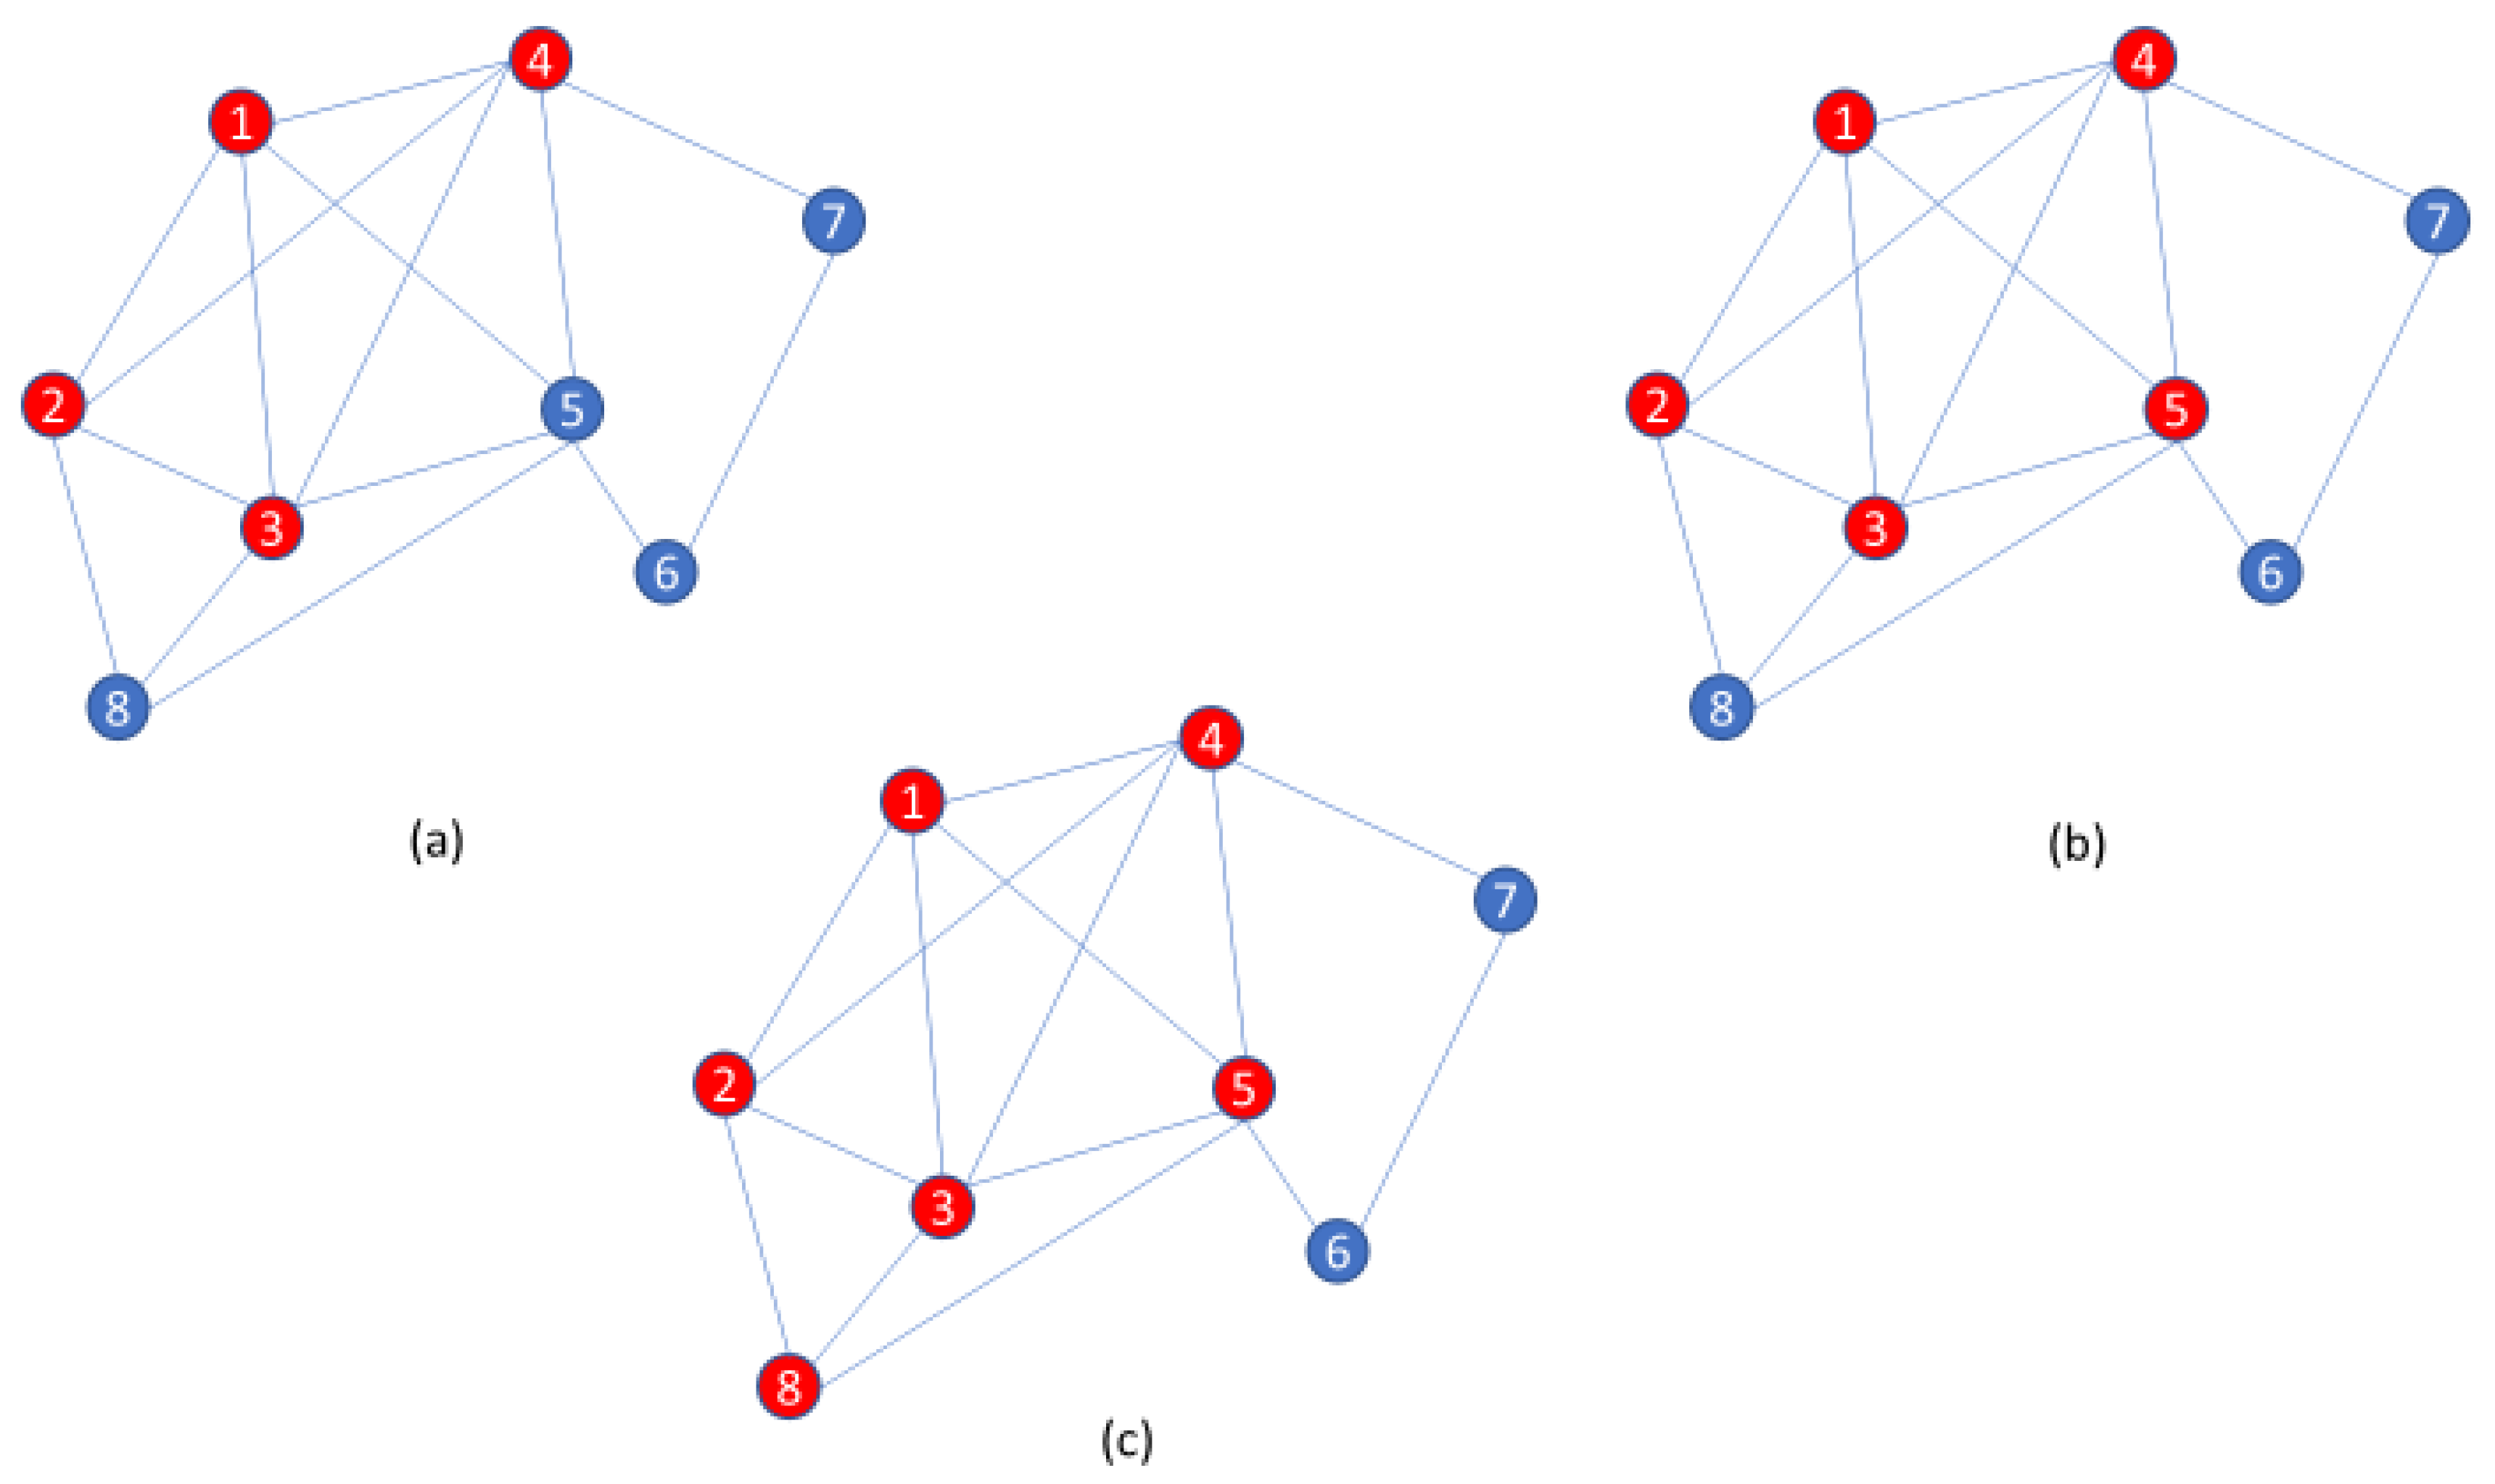
Clique-centric methods have long been used in a wide variety of applications [31]. On real and noisy data, however, clique finders may be inherently prone to high false negative rates. Indeed, an entire clique may be missed if even a single edge is lost. Thus, the paraclique algorithm is an effort to ameliorate difficulties posed by noise. Its essential strategy is first to isolate a maximum clique, and then expand it by glomming onto any new vertex that is adjacent to all but some predefined number of vertices already in this clique. This number is termed the glom term, g. An illustration of paraclique construction with g = 2 is provided in Figure 1. Paraclique details and a thorough discussion of clique selection, edge weights, densities, and other important algorithmic features can be found in [32,33]. Web-based versions of paraclique and related tools are available to the community via GrAPPA [34].
In this effort, we were mainly concerned with case-control transcriptomic data, for which we applied an initial filtering step to limit the effects of confounding factors. False discovery rate adjusted p-values for the differential expression of genes between case data and control data were calculated using the Benjamini–Hochberg method [35] accessed via the EntropyExplorer R package [36]. Only those genes with p-values less than or equal to 0.1 were retained. The motivation for such a filter was to restrict attention to genes of potential interest in the differential diagnosis of disease. After all, we wanted to concentrate on potential disease subtypes and not be distracted by irrelevant subgroups such as age, ethnicity, or hair color. Once filtering was complete, we focused our attention only on case data, and reversed the roles of variables and correlations. We therefore calculated pairwise Pearson correlation coefficients between samples (not genes), and across their corresponding lists of expression levels (not patients). We then thresholded the resultant correlation matrix using spectral methods as in [37] and constructed an unweighted graph with vertices representing samples and edges between highly correlated sample pairs. Once this graph had been created, we invoked the paraclique algorithm to extract dense, noise resilient subgraphs. Thus, each such subgraph represented a putative subtype or outlier.
For consistency, and because this work mainly represents a proof of concept, we set the glom term to g = 1 throughout this effort. Depending on the data under study, however, crisper results may naturally be anticipated with fine tuning. In [27], for example, a glom term of g = 5 was found to produce superior ontological enrichments when studying non-obese diabetic mice as a model of type 1 diabetes mellitus.
3. Experimental Results
3.1. Discussion
We applied this novel analytical approach to a dozen sets of publicly available gene co-expression data obtained from the Gene Expression Omnibus (GEO). These data were selected because they provide a wide cross-section of human disease, and because each has both a case and a control group for the aforementioned filtering task. Table 1 provides an overview of the datasets we studied.
Our investigation into the effectiveness of this proposed new methodology was focused on two guiding questions: (1) Are these tools capable of reliably and robustly identifying putative subtypes? (2) Are these subtypes appropriate to the associated disease as supported by biological evidence from clinical, published, analytical or other orthogonal information source(s)?
The answer to the first question seems to be an unequivocal yes. As summarized in Table 2, our methods decomposed raw data into putative subtypes in ten of our datasets. In the case of asthma, for example, every patient sample fell into some paraclique. In other cases, patients were sometimes left unclassified, which is hardly surprising given the limitations on dataset sizes coupled with possible extremes in disease as well as sample heterogeneity. Only for Parkinson’s disease and type 2 diabetes were no subtypes identified. It is probably no coincidence then that these two diseases also have by far the smallest datasets, especially in light of clinical subtyping evidence to the contrary [38,39].
The second question is considerably more difficult to answer because it depends on the availability of alternate, non-transcriptomic data sources. We therefore followed a two-pronged approach in putative subtype comparisons. First, we calculated GO enrichments and their associated p-values for the top 100 differentially expressed genes in each paraclique. These results and their corresponding GO categories are summarized in Table 3. In every case, we found statistical evidence for biological significance among the genes separating samples into subgroups, with enrichment p-values ranging from 1.1 × 10⁻⁴ for asthma to 4.92 × 10−46 for prostate cancer. Next, we performed a literature search to check the top scoring genes for involvement in known subtypes. As such, this is at best a hit-or-miss proposition, and one depending for each disease on whether the research community has studied subtyping issues, found results, and published them in venues that we were able to search. Despite these obstacles, however, we found strong evidence in print to support our putative subtype decompositions for four of the diseases we studied. These are asthma, breast cancer, chronic lymphocytic leukemia, and colorectal cancer.
3.2. A Search for Unrecognized Subtypes
3.2.1. Asthma
The incidence of asthma in the U.S. has been on the rise for two decades. It is currently estimated that nearly one in ten children under 18 are asthmatic. The risk for some groups is based largely on ethnicity (particularly African American and Puerto Rican), with incidence among those with lower socioeconomic status rising as high as one in six [40].
GEO series GSE4302 data were derived from the Affymetrix Human Genome U133 Plus 2.0 Array, and are designed to identify genes associated with response to corticosteroid treatment in asthmatics [41]. They consist of transcriptomic data taken from the epithelial airway brushings of 42 asthmatics, 28 healthy subjects and 16 smokers. To avoid potential confounds, we discarded data taken from smokers and used only the healthy subjects as controls.
Filtering reduced the number of probes from 54,676 to 2322. Our method produced three paracliques with respective sizes 31, 8 and 3 that were stable until they began to merge as the threshold was lowered below 0.93. The 100 most differentially expressed genes across the two larger putative subtypes included CLCA1, periostin, and ovalbumin, which are all known to serve as markers of a Th2-high endotype of asthma [42].
3.2.2. Breast Cancer
Genetic factors have long been known to play a significant role in breast cancer. Studies have shown that in families with at least four breast cancer cases, most can be linked to mutations in either BRCA1 or BRCA2 genes [43,44]. Moreover, breast cancer has a variety of known subtypes that significantly impact prognosis and treatment. For example, tumors negative for estrogen receptors, progesterone receptors, and the expression of HER2 are indicative of triple-negative breast cancer, a subtype identified with higher risk of recurrence and a five-year mortality rate [45].
GEO series GSE10810 data were also derived from the Affymetrix Human Genome U133 Plus 2.0 Array, although values for only 18,382 probes were provided. This study was designed to investigate links between gene co-expression and phenotypic breast cancer differences [46], and contains data for 31 tumor samples and 27 healthy tissues.
Filtering reduced the number of probes to 11,531. Our tools produced two paracliques of size 22 and 5 that persisted to a threshold of 0.8 and left four tumor samples unclassified. The 100 most differentially expressed genes between these putative subtypes include SLC39A6, S100a4, AGR3, Cd24, and epcam, all of which have been reported in the literature as biomarkers for distinct breast cancer phenotypes [47,48,49,50,51].
3.2.3. Chronic Lymphocytic Leukemia
Chronic lymphocytic leukemia is one of the most common types of leukemia, with pathogenesis characterized by an overproduction of neoplastic B cells in the bloodstream. The current median age at diagnosis is 65, with males affected more often than females [52]. Chronic lymphocytic leukemia typically presents with a slow progression in which patients are able to enjoy a more or less normal life expectancy. In some cases, however, chronic lymphocytic leukemia can be aggressive, with death occurring less than five years after the onset of symptoms.
GEO series GSE8835 data were instead derived from the Affymetrix Human Genome U133A Array with 22,283 probes, and were designed to study the effects of chronic lymphocytic leukemia on T cells in peripheral blood [53]. The study comprised 24 CD4 cell samples from chronic lymphocytic leukemia patients and 12 CD4 cell samples from healthy, age-matched donors.
Filtering reduced the number of probes to 1338. At a threshold of 0.8, our tools produced two paracliques of size 4 and 18, leaving two samples unclassified. The most differentially expressed genes across these two putative subtypes included ZAP-70, previously identified as the best discriminator of Ig-mutated and Ig-unmutated chronic lymphocytic leukemia [54].
3.2.4. Colorectal Cancer
The incidence of colorectal cancer has been in decline since the mid 1980s [55]. Despite this significant drop in prevalence, it still accounts for both the third highest number of new cases of cancer, and the third highest number of cancer deaths each year [56]. As with breast cancer, there are known hereditary links to this disease. For example, a mutation of the gene APC is responsible for two syndromes, Familial Adenomatous Polyposis and Hereditary Nonpolyposis Colorectal Cancer, that each carry a significant increase in the risk of developing colorectal cancer [57].
GEO series GSE9348 data were again derived from the Affymetrix U133 Plus 2 array, and were intended to search for transcriptomic signatures of early stage colorectal cancer that is prone to metastasis [58]. The study contains gene co-expression data that were taken from 70 colorectal cancer patient tumors, as well as tissues from 12 healthy subjects who were matched by age and ethnicity.
Filtering reduced the number of probes from 54,675 to 22,968. At a threshold of 0.87, our tools produced two paracliques of size 63 and 5, covering all but two of the case samples. The list of 100 genes most differentially expressed between these two putative subtypes include Cd24, identified as a prognostic marker for colorectal cancer [59] as well as OLFM4, indicated in as a marker for tumor differentiation and progression [60,61].
3.3. Alignment with Previously Known Subtypes
The experimental effort just described suggests that our methods have the potential to identify both known and novel subtypes, as based on biologically relevant genetic signatures. The lack of any widespread established ground truth, however, places a limitation on any in-depth interpretation of these results. In an effort to address this shortcoming, we identified two sets of publicly available data on GEO that include metadata labeling in the form of known subtyping information. These are based on gastric cancer and non-small cell lung cancer. As our intent is to identify and contrast novel subtypes in disease, our metric of interest is patient stratification.
3.3.1. Gastric Cancer
GEO series GSE35809 data, from the Affymetrix Human Genome U133 Plus 2.0 Array, were derived from 70 primary gastric tumors intended for use as a validation set for subtype classifier testing [62,63,64]. The data contain values for 54,675 probes. Arrays are subdivided into a collection of 29 identified as coming from proliferative tumors, 26 from invasive, and 15 from metabolic.
Filtering was irrelevant, because no healthy tissues were studied that could be used as controls. At a threshold of 0.955, paraclique produced subsets of size 29 and 16 and performed admirably. All but one of the invasive samples it classified were placed in the first paraclique, while all but one of the proliferative samples it classified were placed in the second. Metabolic samples proved only slightly more challenging, with 75% of those classified placed in the first paraclique. See Table 4.
3.3.2. Non-Small Cell Lung Cancer
GEO series GSE10245 data, also from the Affymetrix Human Genome U133 Plus 2.0 Array with 54,675 probes, were derived from 40 adenocarcinoma tumors and 18 squamous cell carcinoma tumors, NSCLC’s two most prevalent subtypes. These data were intended to provide a basis for studying co-expression differences between these two cancers [65].
Filtering was again irrelevant. Paraclique performed quite well on these data too. At a threshold of 0.94, it produced three subsets of size 26, 12 and 8. Roughly 74% of the adenocarcinoma samples were placed in the first paraclique while the second contained none, and 80% of the squamous cell carcinoma samples were placed in the second paraclique while the third had none. Again, see Table 4.
3.3.3. Comparison with Other Methods
We sought to compare this basic and untuned version of the paraclique algorithm with well-known strategies such as k-means and hierarchical clustering, as implemented in core-R through the functions kmeans ( ) and hclust ( ).
Results for the k-means method were mixed. It proved extremely successful on the gastric cancer data. There it divided samples into two subsets of size 26 and 44. All but one of the invasive samples were placed in the first cluster, while all of the proliferative and all but one of the metabolic samples were placed in the second. However, k-means failed completely on the non-small cell lung cancer data. Samples were divided into subsets of size 28 and 30, with both the adenocarcinoma and the squamous cell carcinoma samples spread almost evenly across these two clusters. The hierarchical approach was also a rather uneven performer. On the gastric cancer data, it divided samples into two subsets of size 33 and 37. While all of the proliferative samples found their way to the second cluster, the first contained 84% of the invasive and about 73% of the metabolic. On the non-small cell lung cancer data, it divided samples into subsets of size 9 and 49. All the adenocarcinoma samples were admirably grouped in the second cluster, but the squamous cell carcinoma samples were not convincingly stratified at all, with exactly half placed in each cluster. These results are also summarized in Table 4.
As demonstrated by these experiments, the paraclique methodology can provide excellent patient stratification, further motivating the use of graph theoretical methods to differentiate samples based on their underlying genetic signatures. Such stratification is not perfect, of course, nor should we expect it to be given data limitations and biological variability. Moreover, unlike techniques such as k-means and hierarchical clustering, patients are not forced into a cluster under paraclique, as is evidenced by the 25 samples it left unclassified in the gastric cancer data. We suggest therefore that the tools we have described here may be best suited to fast screening tasks, for example, when transcriptomic data are relatively easy to obtain. Once clinical and/or additional forms of data have been collected, histological and other more laborious techniques will likely help provide more comprehensive subtyping of entire patient populations.
4. Outlier Detection
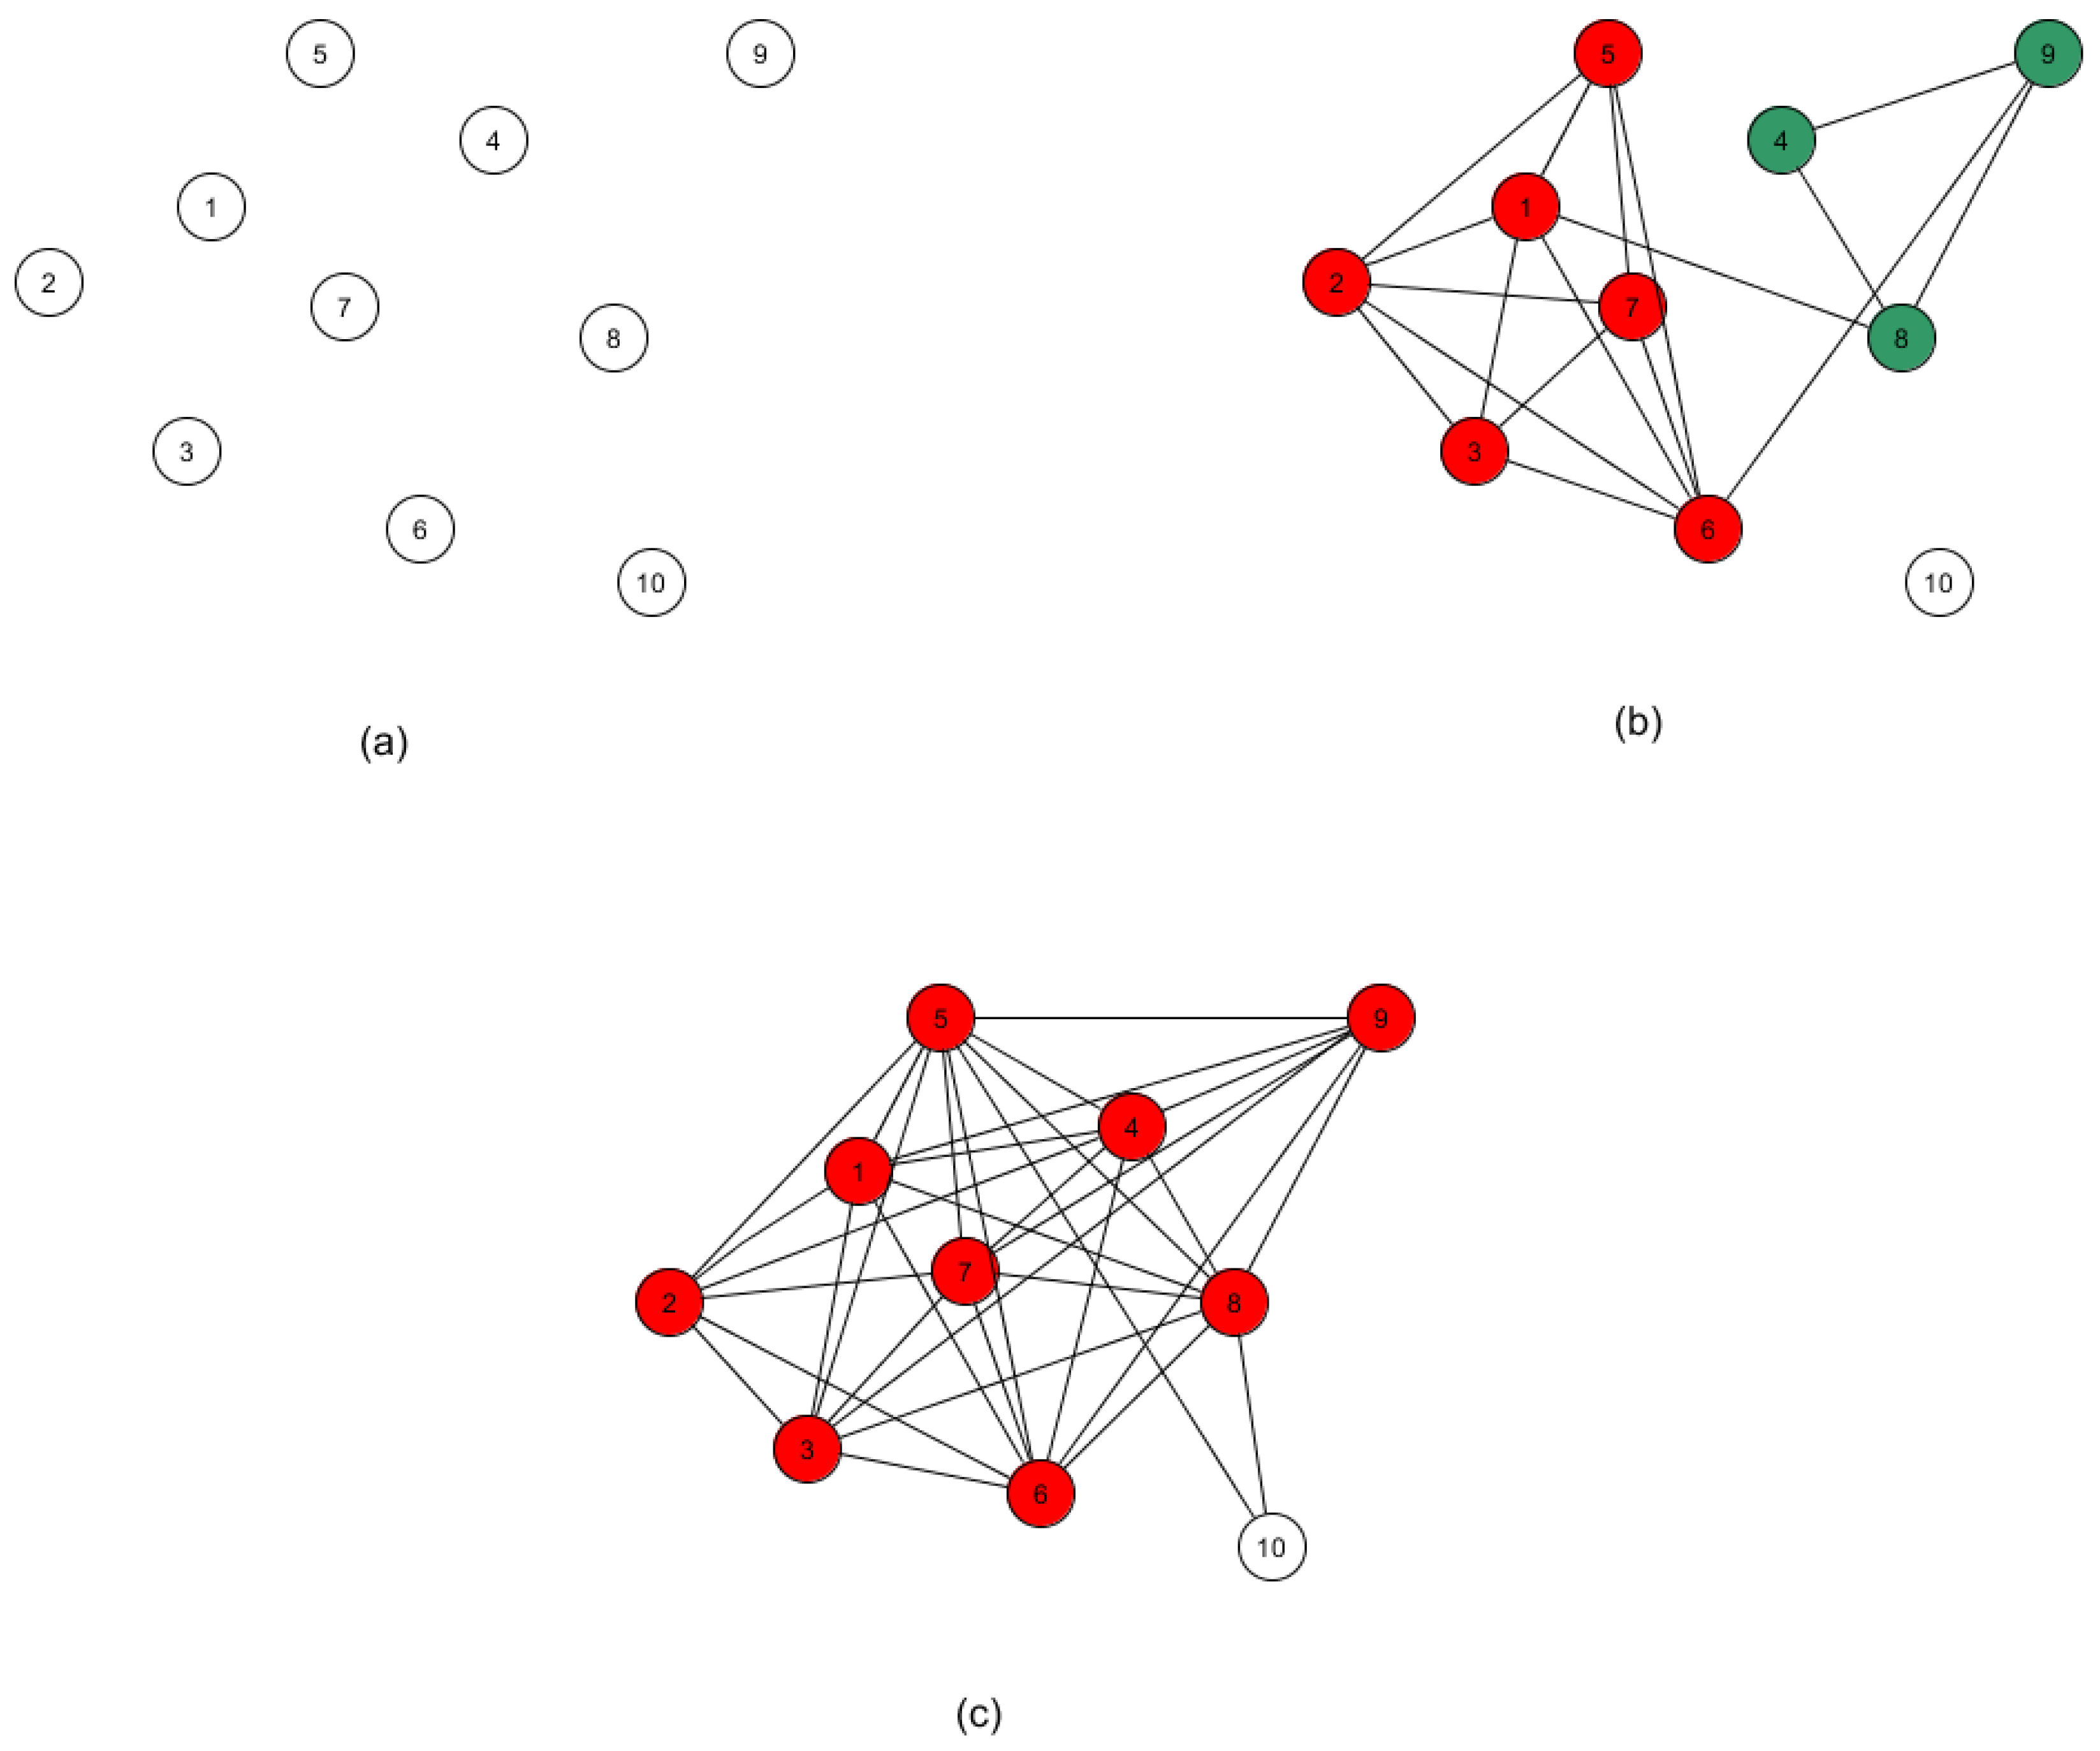
The methodology just described is readily extensible to automating the task of outlier detection. This follows from the observation that an outlier would be expected to appear as its own distinct subtype, and not reside in a paraclique of even modest size. Although detection may be accomplished with our algorithms in several ways, we endorse the use of thresholding, as follows. A normalized threshold of 0.0 will of course produce a single large clique, and a threshold of 1.0 will generally yield an edgeless graph, under the assumption that no two samples are perfectly correlated. As the threshold value is lowered from 1.0, the effect on cliques and paracliques is slightly nuanced. As more and more edges are added, cliques and paracliques will get larger but also begin to merge. If a vertex consistently fails to join any of these dense subgraphs, then the sample it represents is flagged as a potential outlier. The process is illustrated in Figure 2. At this point, it may be tempting simply to single out isolated vertices, but at any given threshold a vertex may of course have a variety of neighbors and yet still be a member of no paraclique.
While this approach has intuitive appeal, we conducted a series of six experiments using known misclassifications to test its limitations. We formed test instances by introducing data from one randomly chosen healthy sample into data from the case samples for breast cancer (GSE10810), chronic lymphocytic leukemia (GSE8835), colorectal cancer (GSE9348), lung cancer (GSE7670), pancreatic cancer (GDS4102), and prostate cancer (GSE6919). For the breast, colorectal, lung, and pancreatic cancer sets, we observed that the normal sample was either the last or the next to last vertex to be drawn into the final paraclique. For the chronic lymphocytic leukemia and prostate cancer sets, we found instead that the healthy sample fell into a large paraclique early on and stayed there. From our previous experience with outlier detection [24], these observations suggest to us that although paraclique has a pronounced potential to serve as an automated outlier screening tool, feature selection [66] should probably first be performed to reduce any positive bias that results from whole genome correlations. We will revisit this topic in the next section.
5. Summary, Discussion and Directions for Future Research
We have developed and described a disease classification strategy based on the paraclique algorithm that can identify putative subtypes, segregating samples based on signatures in their molecular profiles. Although our tools are easily applicable to many types of biological data, we have focused on gene co-expression data largely thanks to their overall quality and availability. We have analyzed high throughput data taken from a dozen different disease samples obtained from the Gene Expression Omnibus and sought to validate the significance of our findings by reviewing the literature and examining ontological enrichment for the biological relevance of genes differentially expressed across putative subtypes. We also performed testing over data augmented with phenotypic information for known subtypes. Overall, the results of this study indicate a strong utility for this approach in the confirmation of known, and the discovery of novel, disease subtypes. Additionally, we described the extension of our methodology to the task of outlier identification. By iteratively lowering the threshold and re-running the paraclique algorithm, we can detect samples resistant to subtype coalescence. Such a finding can point to critical clinical errors such as tissue misclassifications and/or patient misdiagnoses. Throughout, our aim has been to employ scalable, cutting edge graph theoretical methods that can help automate the disease subtyping process, which can in turn accelerate the pace of discovery and lead to improvements in targeted therapies.
We emphasize that this exploratory effort has focused exclusively on unsupervised techniques and tools that require no prior knowledge. To keep things simple, we even refrained from fine tuning the glom term for each dataset. This, therefore, bolsters the argument that the methods we have espoused are really quite effective. In large-scale clinical applications, however, techniques such as feature selection and paraclique anchoring will almost surely prove helpful to narrow the focus on genes or other variables of interest and their disease-associated relationships. In the context of community-acquired pneumonia, for example, we have previously found it advantageous to anchor paraclique analytics at the interleukin genes IL-6 and IL-10. See [29].
To place these results in proper context, we note that any subtyping method based on tissue morphology or molecular signatures is almost certain to be highly imperfect. In addition, this holds true whether it be implemented in silico or conducted manually by a human pathologist. A 2015 study [38] underscores this problem. There, an expert panel of pathologists created a baseline diagnosis based on consensus of opinion for 240 breast tissue biopsies with samples that included malignancy, pre-cancerous cells and benign tumors. Pathologists from eight states with at least one year of experience in diagnosing cancer were then invited to examine these samples. In total, 115 of them completed their analysis and provided their best diagnoses. Although findings showed that 96% of the invasive breast cancer samples had been diagnosed in concordance with expert consensus, 13% of the diagnoses underreported the severity of stage I breast cancer, while 48% (17%) underreported (overreported) the severity of precancerous samples. False negatives and false positives, such as these, can have devastating effects on patients. They may also lead to a wide spectrum of poor outcomes that include excessive delay, unnecessary treatment, additional expense, needless worry, and even premature morbidity and death.
Finally, we wish to emphasize that this work represents but a first step in determining the utility of paraclique in the molecular subtyping of disease. Although clique-based methods have been used as a basis for tasks such as biomarker detection and gene network elucidation, disease subtyping has received surprisingly little attention. In future work, it would thus be interesting to see systematic comparisons of this and other emergent subtyping technologies. Numerous other research directions beckon. For example, we would like to gain a better understanding of the impacts of improved feature selection, and see extensions of the basic method to multiple heterogeneous data types, an area that has attracted a flurry of recent attention [67,68,69]. Collaborative opportunities to partner with disease specialists may of course also help in subtyping verification via graph theoretical methods at large. Better thresholding and filtering methods may be studied as well, in hopes of increasing the accuracy of subtyping and, in turn, reducing the likelihood of confounding factors. In conclusion, we observe that the overall approach we have described can be applied to numerous other sorts of biological data, as well as data from application domains as diverse as cyberattack detection and social network analysis.
Supplementary Materials
The following are available online at https://0-www-mdpi-com.brum.beds.ac.uk/1999-4893/14/2/63/s1.
Author Contributions
Conceptualization, R.D.H. and M.A.L.; methodology, R.D.H. and M.A.L.; formal analysis, R.D.H. and M.A.L.; data curation, R.D.H.; writing—original draft preparation, R.D.H. and M.A.L.; funding acquisition, M.A.L. All authors have read and agreed to the published version of the manuscript.
Funding
This research has been supported in part by the National Institute of Alcohol Abuse and Alcoholism and the National Institute on Drug Abuse under grant R01AA018776, by the National Institute of Diabetes and Digestive and Kidney Diseases under grant R01DK125586, and by the Department of Veterans Affairs under grant HX002680.
Data Availability Statement
All data used in this study is available for public download from the Gene Expression Omnibus (GEO) website at https://0-www-ncbi-nlm-nih-gov.brum.beds.ac.uk/geo/ (accessed on 15 October 2020).
Acknowledgments
We thank the anonymous reviewers for their careful reading, thoughtful critiques, and helpful comments.
Conflicts of Interest
The authors declare no conflict of interest.
References
- Savas, P.; Hughes, B.; Solomon, B. Targeted Therapy in Lung Cancer: IPASS and Beyond, Keeping Abreast of the Explosion of Targeted Therapies for Lung Cancer. J. Thorac. Dis. 2013, 5 (Suppl. 5), S579. [Google Scholar]
- Mok, T.S.; Wu, Y.-L.; Thongprasert, S.; Yang, C.-H.; Chu, D.-T.; Saijo, N.; Sunpaweravong, P.; Han, B.; Margono, B.; Ichinose, Y. Gefitinib or carboplatin–paclitaxel in pulmonary adenocarcinoma. N. Engl. J. Med. 2009, 361, 947–957. [Google Scholar] [CrossRef] [PubMed]
- Shaw, A.T.; Kim, D.-W.; Nakagawa, K.; Seto, T.; Crinó, L.; Ahn, M.-J.; de Pas, T.; Besse, B.; Solomon, B.J.; Blackhall, F. Crizotinib versus chemotherapy in advanced ALK-positive lung cancer. N. Engl. J. Med. 2013, 368, 2385–2394. [Google Scholar] [CrossRef] [PubMed] [Green Version]
- Leith, C.P.; Kopecky, K.J.; Godwin, J.; McConnell, T.; Slovak, M.L.; Chen, I.-M.; Head, D.R.; Appelbaum, F.R.; Willman, C.L. Acute myeloid leukemia in the elderly: Assessment of multidrug resistance (MDR1) and cytogenetics distinguishes biologic subgroups with remarkably distinct responses to standard chemotherapy. A Southwest Oncology Group study. Blood J. Am. Soc. Hematol. 1997, 89, 3323–3329. [Google Scholar] [CrossRef]
- Balko, J.M.; Cook, R.S.; Vaught, D.B.; Kuba, M.G.; Miller, T.W.; Bhola, N.E.; Sanders, M.E.; Granja-Ingram, N.M.; Smith, J.J.; Meszoely, I.M.J.N.M. Profiling of residual breast cancers after neoadjuvant chemotherapy identifies DUSP4 deficiency as a mechanism of drug resistance. Nat. Med. 2012, 18, 1052–1059. [Google Scholar] [CrossRef] [Green Version]
- Kuruvilla, M.E.; Lee, F.E.-H.; Lee, G.B. Understanding asthma phenotypes, endotypes, and mechanisms of disease. Clin. Rev. Allergy Immunol. 2019, 56, 219–233. [Google Scholar] [CrossRef]
- Di Fede, G.; Catania, M.; Maderna, E.; Ghidoni, R.; Benussi, L.; Tonoli, E.; Giaccone, G.; Moda, F.; Paterlini, A.; Campagnani, I. Molecular subtypes of Alzheimer’s disease. Sci. Rep. 2018, 8, 1–14. [Google Scholar] [CrossRef] [PubMed]
- Weiser, M.; Simon, J.M.; Kochar, B.; Tovar, A.; Israel, J.W.; Robinson, A.; Gipson, G.R.; Schaner, M.S.; Herfarth, H.H.; Sartor, R.B. Molecular classification of Crohn’s disease reveals two clinically relevant subtypes. Gut 2018, 67, 36–42. [Google Scholar] [CrossRef] [Green Version]
- Alizadeh, A.A.; Eisen, M.B.; Davis, R.E.; Ma, C.; Lossos, I.S.; Rosenwald, A.; Boldrick, J.C.; Sabet, H.; Tran, T.; Yu, X. Distinct types of diffuse large B-cell lymphoma identified by gene expression profiling. Nature 2000, 403, 503–511. [Google Scholar] [CrossRef]
- Eisen, M.B.; Spellman, P.T.; Brown, P.O.; Botstein, D. Cluster analysis and display of genome-wide expression patterns. Proc. Natl. Acad. Sci. USA 1998, 95, 14863–14868. [Google Scholar] [CrossRef] [Green Version]
- Perou, C.M.; Sørlie, T.; Eisen, M.B.; van de Rijn, M.; Jeffrey, S.S.; Rees, C.A.; Pollack, J.R.; Ross, D.T.; Johnsen, H.; Akslen, L.A. Molecular portraits of human breast tumours. Nature 2000, 406, 747–752. [Google Scholar] [CrossRef] [PubMed]
- Kohonen, T. The self-organizing map. Proc. IEEE 1990, 78, 1464–1480. [Google Scholar] [CrossRef]
- Luo, F.; Khan, L.; Bastani, F.; Yen, I.-L.; Zhou, J. A dynamically growing self-organizing tree (DGSOT) for hierarchical clustering gene expression profiles. Bioinformatics 2004, 20, 2605–2617. [Google Scholar] [CrossRef] [Green Version]
- Tamayo, P.; Slonim, D.; Mesirov, J.; Zhu, Q.; Kitareewan, S.; Dmitrovsky, E.; Lander, E.S.; Golub, T.R. Interpreting patterns of gene expression with self-organizing maps: Methods and application to hematopoietic differentiation. Proc. Natl. Acad. Sci. USA 1999, 96, 2907–2912. [Google Scholar] [CrossRef] [PubMed] [Green Version]
- Shen, R.; Olshen, A.B.; Ladanyi, M. Integrative clustering of multiple genomic data types using a joint latent variable model with application to breast and lung cancer subtype analysis. Bioinformatics 2009, 25, 2906–2912. [Google Scholar] [CrossRef] [PubMed]
- Ambrogi, F.; Biganzoli, E.; Querzoli, P.; Ferretti, S.; Boracchi, P.; Alberti, S.; Marubini, E.; Nenci, I. Molecular subtyping of breast cancer from traditional tumor marker profiles using parallel clustering methods. Clin. Cancer Res. 2006, 12, 781–790. [Google Scholar] [CrossRef] [PubMed] [Green Version]
- Wessman, J.; Paunio, T.; Tuulio-Henriksson, A.; Koivisto, M.; Partonen, T.; Suvisaari, J.; Turunen, J.A.; Wedenoja, J.; Hennah, W.; Pietiläinen, O.P. Mixture model clustering of phenotype features reveals evidence for association of DTNBP1 to a specific subtype of schizophrenia. Biol. Psychiatry 2009, 66, 990–996. [Google Scholar] [CrossRef] [PubMed]
- Jay, J.J.; Eblen, J.D.; Zhang, Y.; Benson, M.; Perkins, A.D.; Saxton, A.M.; Voy, B.H.; Chesler, E.J.; Langston, M.A. A systematic comparison of genome-scale clustering algorithms. BMC Bioinform. 2012, 13, S7. [Google Scholar] [CrossRef] [Green Version]
- Chesler, E.J.; Langston, M.A. Combinatorial Genetic Regulatory Network Analysis Tools for High Throughput Transcriptomic Data. In Systems Biology and Regulatory Genomics; Eskin, E., Ed.; Springer: Berlin, Germany, 2006; pp. 150–165. [Google Scholar]
- Bron, C.; Kerbosch, J. Algorithm 457: Finding all cliques of an undirected graph. Commun. ACM 1973, 16, 575–577. [Google Scholar] [CrossRef]
- Palla, G.; Derényi, I.; Farkas, I.; Vicsek, T. Uncovering the overlapping community structure of complex networks in nature and society. Nature 2005, 435, 814–818. [Google Scholar] [CrossRef] [Green Version]
- Langston, M.A.; Perkins, A.D.; Saxton, A.M.; Scharff, J.A.; Voy, B.H. Innovative Computational Methods for Transcriptomic Data Analysis: A Case Study in the Use of FPT for Practical Algorithm Design and Implementation. Comput. J. 2008, 51, 26–38. [Google Scholar] [CrossRef]
- Schoenrock, A.; Samanfar, B.; Pitre, S.; Hooshyar, M.; Jin, K.; Phillips, C.A.; Wang, H.; Phanse, S.; Omidi, K.; Gui, Y.; et al. Efficient prediction of human protein-protein interactions at a global scale. BMC Bioinform. 2014, 15, 383. [Google Scholar] [CrossRef] [Green Version]
- Macartney-Coxson, D.; Benton, M.C.; Blick, R.; Stubbs, R.S.; Hagan, R.D.; Langston, M.A. Genome-wide DNA methylation analysis reveals loci that distinguish different types of adipose tissue in obese individuals. Clin. Epigenet. 2017, 9, 48. [Google Scholar] [CrossRef] [PubMed] [Green Version]
- Langston, M.A.; Levine, R.S.; Kilbourne, B.J.; Rogers, G.L.; Kershenbaum, A.D.; Baktash, S.H.; Coughlin, S.S.; Saxton, A.M.; Agboto, V.K.; Hood, D.B.; et al. Scalable combinatorial tools for health disparities research. Int. J. Environ. Res. Public Health 2014, 11, 10419–10443. [Google Scholar] [CrossRef] [Green Version]
- Grubb, M.C.; Kilbourne, B.J.; Kilbourne, C. Socioeconomic, Environmental and Geographic Factors and United States Lung Cancer Mortality, 1999–2009. Fam. Med. Community Health 2017, 5, 3–12. [Google Scholar] [CrossRef]
- Eblen, J.D.; Gerling, I.C.; Saxton, A.M.; Wu, J.; Snoddy, J.R.; Langston, M.A. Graph Algorithms for Integrated Biological Analysis, with Applications to Type 1 Diabetes Data; World Scientific: Singapore, 2009; pp. 207–222. [Google Scholar]
- Bruhn, S.; Barrenas, F.; Mobini, R.; Andersson, B.A.; Chavali, S.; Egan, B.S.; Hovig, E.; Sandve, G.K.; Langston, M.A.; Rogers, G.; et al. Increased expression of IRF4 and ETS1 in CD4+ cells from patients with intermittent allergic rhinitis. Allergy 2012, 67, 33–40. [Google Scholar] [CrossRef] [PubMed] [Green Version]
- Palmer, O.M.P.; Rogers, G.; Yende, S.; Angus, D.C.; Clermont, G.; Langston, M.A. Graph Theoretical Analysis of Genome-Scale Data: Examination of Gene Activation Occurring in the Setting of Community-Acquired Pneumonia. Shock 2018, 50, 53–59. [Google Scholar] [CrossRef] [PubMed]
- Voy, B.H.; Scharff, J.A.; Perkins, A.D.; Saxton, A.M.; Borate, B.; Chesler, E.J.; Branstetter, L.K.; Langston, M.A. Extracting Gene Networks for Low-Dose Radiation using Graph Theoretical Algorithms. PLoS Comput. Biol. 2006, 2, e89. [Google Scholar] [CrossRef]
- Bomze, I.; Budinich, M.; Pardalos, P.; Pelillo, M. The Maximum Clique Problem. In Handbook of Combinatorial Optimization; Du, D.-Z., Pardalos, P.M., Eds.; Kluwer Academic Publishers: Amsterdam, The Netherlands, 1999. [Google Scholar]
- Hagan, R.D.; Langston, M.A.; Wang, K. Lower Bounds on Paraclique Density. Discret. Appl. Math. 2016, 204, 208–212. [Google Scholar] [CrossRef] [Green Version]
- Lu, Y.; Phillips, C.A.; Chesler, E.J.; Langston, M.A. Clique Selection and its Effect on Paraclique Enrichment: An Experimental Study. In Proceedings of the International Conference on Bioinformatics and Computational Biology, San Francisco, CA, USA, 23–25 March 2020. [Google Scholar]
- Graph Algorithms Pipeline for Pathway Analysis. Available online: https://grappa.eecs.utk.edu (accessed on 20 October 2020).
- Benjamini, Y.; Hochberg, Y. Controlling the false discovery rate: A practical and powerful approach to multiple testing. J. R. Stat. Soc. Ser. B (Methodol.) 1995, 57, 289–300. [Google Scholar] [CrossRef]
- Wang, K.; Phillips, C.A.; Saxton, A.M.; Langston, M.A. EntropyExplorer: An R package for computing and comparing differential Shannon entropy, differential coefficient of variation and differential expression. BMC Res. Notes 2015, 8, 832. [Google Scholar] [CrossRef] [Green Version]
- Perkins, A.D.; Langston, M.A. Threshold Selection in Gene Co-Expression Networks Using Spectral Graph Theory Techniques. BMC Bioinform. 2009, 10, S4. [Google Scholar] [CrossRef] [Green Version]
- Pablo-Fernández, E.D.; Lees, A.J.; Holton, J.L.; Warner, T.T. Prognosis and Neuropathologic Correlation of Clinical Subtypes of Parkinson Disease. JAMA Neurol. 2019, 76, 470–479. [Google Scholar] [CrossRef] [PubMed]
- Pearson, E.R. Type 2 Diabetes: A Multifaceted Disease. Diabetologia 2019, 62, 1107–1112. [Google Scholar] [CrossRef] [PubMed] [Green Version]
- Bope, E.T.; Kellerman, R.D. Conn’s Current Therapy 2016; Elsevier Health Sciences: Amsterdam, The Netherlands, 2015. [Google Scholar]
- Woodruff, P.G.; Boushey, H.A.; Dolganov, G.M.; Barker, C.S.; Yang, Y.H.; Donnelly, S.; Ellwanger, A.; Sidhu, S.S.; Dao-Pick, T.P.; Pantoja, C. Genome-wide profiling identifies epithelial cell genes associated with asthma and with treatment response to corticosteroids. Proc. Natl. Acad. Sci. USA 2007, 104, 15858–15863. [Google Scholar] [CrossRef] [PubMed] [Green Version]
- Woodruff, P.G. Subtypes of asthma defined by epithelial cell expression of messenger RNA and microRNA. Ann. Am. Thorac. Soc. 2013, 10, S186–S189. [Google Scholar] [CrossRef] [PubMed] [Green Version]
- Ford, D.; Easton, D.; Stratton, M.; Narod, S.; Goldgar, D.; Devilee, P.; Bishop, D.; Weber, B.; Lenoir, G.; Chang-Claude, J. Genetic heterogeneity and penetrance analysis of the BRCA1 and BRCA2 genes in breast cancer families. Am. J. Hum. Genet. 1998, 62, 676–689. [Google Scholar] [CrossRef] [Green Version]
- Easton, D.; Bishop, D.; Ford, D.; Crockford, G. Genetic linkage analysis in familial breast and ovarian cancer: Results from 214 families. The Breast Cancer Linkage Consortium. Am. J. Hum. Genet. 1993, 52, 678. [Google Scholar]
- Dent, R.; Trudeau, M.; Pritchard, K.I.; Hanna, W.M.; Kahn, H.K.; Sawka, C.A.; Lickley, L.A.; Rawlinson, E.; Sun, P.; Narod, S.A. Triple-negative breast cancer: Clinical features and patterns of recurrence. Clin. Cancer Res. 2007, 13, 4429–4434. [Google Scholar] [CrossRef] [Green Version]
- Pedraza, V.; Gomez-Capilla, J.A.; Escaramis, G.; Gomez, C.; Torné, P.; Rivera, J.M.; Gil, A.; Araque, P.; Olea, N.; Estivill, X. Gene expression signatures in breast cancer distinguish phenotype characteristics, histologic subtypes, and tumor invasiveness. Cancer 2010, 116, 486–496. [Google Scholar] [CrossRef]
- Srour, N.; Reymond, M.A.; Steinert, R. Lost in translation? A systematic database of gene expression in breast cancer. Pathobiology 2008, 75, 112–118. [Google Scholar] [CrossRef]
- Rudland, S.D.; Martin, L.; Roshanlall, C.; Winstanley, J.; Leinster, S.; Platt-Higgins, A.; Carroll, J.; West, C.; Barraclough, R.; Rudland, P. Association of S100A4 and osteopontin with specific prognostic factors and survival of patients with minimally invasive breast cancer. Clin. Cancer Res. 2006, 12, 1192–1200. [Google Scholar] [CrossRef] [Green Version]
- King, E.R.; Tung, C.S.; Tsang, Y.T.; Zu, Z.; Lok, G.T.; Deavers, M.T.; Malpica, A.; Wolf, J.K.; Lu, K.H.; Birrer, M.J. The anterior gradient homolog 3 (AGR3) gene is associated with differentiation and survival in ovarian cancer. Am. J. Surg. Pathol. 2011, 35, 904. [Google Scholar] [CrossRef] [Green Version]
- Ricardo, S.; Vieira, A.F.; Gerhard, R.; Leitão, D.; Pinto, R.; Cameselle-Teijeiro, J.F.; Milanezi, F.; Schmitt, F.; Paredes, J. Breast cancer stem cell markers CD44, CD24 and ALDH1: Expression distribution within intrinsic molecular subtype. J. Clin. Pathol. 2011. [Google Scholar] [CrossRef]
- Yamashita, T.; Forgues, M.; Wang, W.; Kim, J.W.; Ye, Q.; Jia, H.; Budhu, A.; Zanetti, K.A.; Chen, Y.; Qin, L.-X. EpCAM and α-fetoprotein expression defines novel prognostic subtypes of hepatocellular carcinoma. Cancer Res. 2008, 68, 1451–1461. [Google Scholar] [CrossRef] [Green Version]
- Rozman, C.; Montserrat, E. Chronic lymphocytic leukemia. N. Engl. J. Med. 1995, 333, 1052–1057. [Google Scholar] [CrossRef] [Green Version]
- Görgün, G.; Holderried, T.A.; Zahrieh, D.; Neuberg, D.; Gribben, J.G. Chronic lymphocytic leukemia cells induce changes in gene expression of CD4 and CD8 T cells. J. Clin. Investig. 2005, 115, 1797–1805. [Google Scholar] [CrossRef]
- Wiestner, A.; Rosenwald, A.; Barry, T.S.; Wright, G.; Davis, R.E.; Henrickson, S.E.; Zhao, H.; Ibbotson, R.E.; Orchard, J.A.; Davis, Z. ZAP-70 expression identifies a chronic lymphocytic leukemia subtype with unmutated immunoglobulin genes, inferior clinical outcome, and distinct gene expression profile. Blood 2003, 101, 4944–4951. [Google Scholar] [CrossRef] [PubMed] [Green Version]
- Edwards, B.K.; Ward, E.; Kohler, B.A.; Eheman, C.; Zauber, A.G.; Anderson, R.N.; Jemal, A.; Schymura, M.J.; Lansdorp-Vogelaar, I.; Seeff, L.C. Annual report to the nation on the status of cancer, 1975–2006, featuring colorectal cancer trends and impact of interventions (risk factors, screening, and treatment) to reduce future rates. Cancer 2010, 116, 544–573. [Google Scholar] [CrossRef] [PubMed] [Green Version]
- Siegel, R.L.; Miller, K.D.; Jemal, A. Cancer statistics, 2016. CA Cancer J. Clin. 2016, 66, 7–30. [Google Scholar] [CrossRef] [PubMed] [Green Version]
- Kinzler, K.W.; Vogelstein, B. Lessons from hereditary colorectal cancer. Cell 1996, 87, 159–170. [Google Scholar] [CrossRef] [Green Version]
- Hong, Y.; Downey, T.; Eu, K.W.; Koh, P.K.; Cheah, P.Y. A ‘metastasis-prone’signature for early-stage mismatch-repair proficient sporadic colorectal cancer patients and its implications for possible therapeutics. Clin. Exp. Metastasis 2010, 27, 83–90. [Google Scholar] [CrossRef] [PubMed]
- Belov, L.; Zhou, J.; Christopherson, R.I. Cell surface markers in colorectal cancer prognosis. Int. J. Mol. Sci. 2010, 12, 78–113. [Google Scholar] [CrossRef] [PubMed] [Green Version]
- Besson, D.; Pavageau, A.-H.; Valo, I.; Bourreau, A.; Bélanger, A.; Eymerit-Morin, C.; Moulière, A.; Chassevent, A.; Boisdron-Celle, M.; Morel, A. A quantitative proteomic approach of the different stages of colorectal cancer establishes OLFM4 as a new nonmetastatic tumor marker. Mol. Cell. Proteom. 2011, 10, M111-009712. [Google Scholar] [CrossRef] [Green Version]
- Huang, M.-Y.; Wang, H.-M.; Chang, H.-J.; Hsiao, C.-P.; Wang, J.-Y.; Lin, S.-R. Overexpression of S100B, TM4SF4, and OLFM4 genes is correlated with liver metastasis in Taiwanese colorectal cancer patients. DNA Cell Biol. 2012, 31, 43–49. [Google Scholar] [CrossRef] [Green Version]
- Chia, N.-Y.; Deng, N.; Das, K.; Huang, D.; Hu, L.; Zhu, Y.; Lim, K.H.; Lee, M.-H.; Wu, J.; Sam, X.X. Regulatory crosstalk between lineage-survival oncogenes KLF5, GATA4 and GATA6 cooperatively promotes gastric cancer development. Gut 2015, 64, 707–719. [Google Scholar] [CrossRef] [PubMed]
- Lei, Z.; Tan, I.B.; Das, K.; Deng, N.; Zouridis, H.; Pattison, S.; Chua, C.; Feng, Z.; Guan, Y.K.; Ooi, C.H. Identification of molecular subtypes of gastric cancer with different responses to PI3-kinase inhibitors and 5-fluorouracil. Gastroenterology 2013, 145, 554–565. [Google Scholar] [CrossRef]
- Wu, Y.; Grabsch, H.; Ivanova, T.; Tan, I.B.; Murray, J.; Ooi, C.H.; Wright, A.I.; West, N.P.; Hutchins, G.G.; Wu, J. Comprehensive genomic meta-analysis identifies intra-tumoural stroma as a predictor of survival in patients with gastric cancer. Gut 2013, 62, 1100–1111. [Google Scholar] [CrossRef]
- Kuner, R.; Muley, T.; Meister, M.; Ruschhaupt, M.; Buness, A.; Xu, E.C.; Schnabel, P.; Warth, A.; Poustka, A.; Sültmann, H. Global gene expression analysis reveals specific patterns of cell junctions in non-small cell lung cancer subtypes. Lung Cancer 2009, 63, 32–38. [Google Scholar] [CrossRef] [PubMed]
- Lazar, C.; Taminau, J.; Meganck, S.; Steenhoff, D.; Coletta, A.; Molter, C.; Schaetzen, V.D.; Duque, R.; Bersini, H.; Nowé, A. A Survey on Filter Techniques for Feature Selection in Gene Expression Microarray Analysis. IEEE/ACM Trans. Comput. Biol. Bioinform. 2012, 30, 1106–1119. [Google Scholar] [CrossRef]
- Nguyen, T.; Tagett, R.; Diaz, D.; Draghici, S. A novel approach for data integration and disease subtyping. Genome Res. 2017, 27, 2025–2039. [Google Scholar] [CrossRef]
- Krishnagopal, S.; Coelln, R.V.; Shulman, L.M.; Girvan, M. Identifying and predicting Parkinson’s disease subtypes through trajectory clustering via bipartite networks. PLoS ONE 2020, 15, e0233296. [Google Scholar] [CrossRef]
- Wang, B.; Mezlini, A.M.; Demir, F.; Fiume, M.; Tu, Z.; Brudno, M.; Haibe-Kains, B.; Goldenberg, A. Similarity network fusion for aggregating data types on a genomic scale. Nat. Methods 2014, 11, 333. [Google Scholar] [CrossRef]
Figure 1.
An illustration of the paraclique algorithm with glom term g = 2. (a) Starting with a maximum clique of size 4 as shown by red vertices, (b) paraclique first gloms onto vertex 5, (c) and then it gloms onto vertex 8 to form a paraclique of size 6.
Figure 1.
An illustration of the paraclique algorithm with glom term g = 2. (a) Starting with a maximum clique of size 4 as shown by red vertices, (b) paraclique first gloms onto vertex 5, (c) and then it gloms onto vertex 8 to form a paraclique of size 6.

Figure 2.
Outlier detection using paracliques. (a) A normalized threshold of 1.0 usually produces an empty graph. (b) As the threshold is lowered, more edges are added and paracliques begin to form and merge. (c) If a vertex consistently joins no paraclique, then it is flagged as a potential outlier.


Table 1.
Subtyping datasets. A profile of the datasets used in this study.
| Disease | GEO Accession | Patients | Probes | ||
|---|---|---|---|---|---|
| Case | Control | Initial | Filtered | ||
| Asthma | GSE4302 | 42 | 28 | 54,675 | 2322 |
| Breast Cancer | GSE10810 | 31 | 27 | 18,382 | 11,531 |
| Chronic Lymphocytic Leukemia | GSE8835 | 24 | 12 | 22,283 | 1338 |
| Colorectal Cancer | GSE9348 | 70 | 12 | 54,675 | 22,968 |
| Lung Cancer | GSE7670 | 27 | 27 | 22,283 | 7458 |
| Multiple Sclerosis | GDS3920 | 14 | 15 | 54,674 | 9844 |
| Pancreatic Cancer | GDS4102 | 36 | 16 | 54,613 | 23,711 |
| Parkinson’s Disease | GSE20141 | 10 | 8 | 54,674 | 6625 |
| Prostate Cancer | GSE6919 | 61 | 63 | 12,625 | 1531 |
| Psoriasis | GSE13355 | 58 | 58 | 54,675 | 29,407 |
| Schizophrenia | GSE17612 | 28 | 23 | 54,675 | 4250 |
| Type 2 Diabetes | GSE20966 | 10 | 10 | 61,294 | 93 |
Table 2.
Subgroups identified. Summary of the numbers and sizes of putative subgroups identified by our methods in testing data.
Table 2.
Subgroups identified. Summary of the numbers and sizes of putative subgroups identified by our methods in testing data.
| Disease | Subgroups Identified | Subgroup Sizes |
|---|---|---|
| Asthma | 3 | 31, 8, 3 |
| Breast Cancer | 2 | 22, 5 |
| Chronic Lymphocytic Leukemia | 2 | 4, 18 |
| Colorectal Cancer | 2 | 63, 5 |
| Lung Cancer | 2 | 21, 5 |
| Multiple Sclerosis | 2 | 11, 3 |
| Pancreatic Cancer | 2 | 31, 5 |
| Parkinson’s Disease | 1 | 8 |
| Prostate Cancer | 2 | 56, 3 |
| Psoriasis | 2 | 49, 5 |
| Schizophrenia | 2 | 19, 6 |
| Type 2 Diabetes | 1 | 9 |
Table 3.
GO enrichments. Listed is the GO term category with the lowest enrichment p-value of the 100 most differentially expressed genes for each disease in this study.
Table 3.
GO enrichments. Listed is the GO term category with the lowest enrichment p-value of the 100 most differentially expressed genes for each disease in this study.
| Dataset | GO Category | p-Value |
|---|---|---|
| Asthma GSE4302 | Oxireductase | 1.1 × 10⁻⁴ |
| Breast Cancer GSE10810 | Secreted | 1.0 × 10⁻¹³ |
| Chronic Lymphocytic Leukemia GSE8835 | Mhc ii | 2.4 × 10⁻¹⁵ |
| Colorectal Cancer GSE9348 | Translational elongation | 2.8 × 10⁻²⁸ |
| Lung Cancer GSE7670 | Secreted | 7.7 × 10⁻¹⁰ |
| Multiple Sclerosis GDS3920 | Translational elongation | 1.9 × 10⁻³⁴ |
| Pancreatic Cancer GDS4102 | Signal | 4.59 × 10⁻¹⁵ |
| Prostate Cancer GSE6919 | Translational elongation | 4.92 × 10−46 |
| Psoriasis GSE13355 | Immune response | 3.5 × 10⁻¹⁵ |
| Schizophrenia GSE17612 | Organelle membrane | 5.24 × 10⁻⁴ |
Table 4.
Cluster compositions based on known subtypes. Shown is a breakdown of the subtypes obtained from datasets with best available ground truth for paraclique, k-means, and hierarchical clustering.
Table 4.
Cluster compositions based on known subtypes. Shown is a breakdown of the subtypes obtained from datasets with best available ground truth for paraclique, k-means, and hierarchical clustering.
| Paraclique Results | ||||||
|---|---|---|---|---|---|---|
| Gastric Cancer | NSCLC | |||||
| Paraclique Sizes | Paraclique Sizes | |||||
| 29 | 16 | 26 | 12 | 8 | ||
| Subtype | Subtype | |||||
| proliferative | 1 | 12 | AC | 23 | 0 | 8 |
| invasive | 19 | 1 | SCC | 3 | 12 | 0 |
| metabolic | 9 | 3 | ||||
| k-Means Results | ||||||
| Gastric Cancer | NSCLC | |||||
| Cluster Sizes | Cluster Sizes | |||||
| 26 | 44 | 28 | 30 | |||
| Subtype | Subtype | |||||
| proliferative | 0 | 29 | AC | 18 | 22 | |
| invasive | 25 | 1 | SCC | 10 | 8 | |
| metabolic | 1 | 14 | ||||
| Hierarchical Clustering Results | ||||||
| Gastric Cancer | NSCLC | |||||
| Cluster Sizes | Cluster Sizes | |||||
| 33 | 37 | 9 | 49 | |||
| Subtype | Subtype | |||||
| proliferative | 0 | 29 | AC | 0 | 40 | |
| invasive | 22 | 4 | SCC | 9 | 9 | |
| metabolic | 11 | 4 | ||||
Publisher’s Note: MDPI stays neutral with regard to jurisdictional claims in published maps and institutional affiliations. |
© 2021 by the authors. Licensee MDPI, Basel, Switzerland. This article is an open access article distributed under the terms and conditions of the Creative Commons Attribution (CC BY) license (http://creativecommons.org/licenses/by/4.0/).
Share and Cite
MDPI and ACS Style
Hagan, R.D.; Langston, M.A. Molecular Subtyping and Outlier Detection in Human Disease Using the Paraclique Algorithm. Algorithms 2021, 14, 63. https://0-doi-org.brum.beds.ac.uk/10.3390/a14020063
AMA Style
Hagan RD, Langston MA. Molecular Subtyping and Outlier Detection in Human Disease Using the Paraclique Algorithm. Algorithms. 2021; 14(2):63. https://0-doi-org.brum.beds.ac.uk/10.3390/a14020063
Chicago/Turabian StyleHagan, Ronald D., and Michael A. Langston. 2021. "Molecular Subtyping and Outlier Detection in Human Disease Using the Paraclique Algorithm" Algorithms 14, no. 2: 63. https://0-doi-org.brum.beds.ac.uk/10.3390/a14020063
Note that from the first issue of 2016, this journal uses article numbers instead of page numbers. See further details here.