
Typhoon Intensity Forecasting Based on LSTM Using the Rolling Forecast Method


1
School of Software Engineering, Tongji University, Shanghai 201804, China
2
Institute of Atmospheric Physics, Chinese Academy of Sciences, Beijing 100029, China
*
Author to whom correspondence should be addressed.
†
These authors contributed equally to this work.
Algorithms 2021, 14(3), 83; https://0-doi-org.brum.beds.ac.uk/10.3390/a14030083
Submission received: 14 January 2021
/
Revised: 23 February 2021
/
Accepted: 26 February 2021
/
Published: 4 March 2021
(This article belongs to the Special Issue Algorithms and Applications of Time Series Analysis)
Abstract
:A typhoon is an extreme weather event with strong destructive force, which can bring huge losses of life and economic damage to people. Thus, it is meaningful to reduce the prediction errors of typhoon intensity forecasting. Artificial and deep neural networks have recently become widely used for typhoon forecasting in order to ensure typhoon intensity forecasting is accurate and timely. Typhoon intensity forecasting models based on long short-term memory (LSTM) are proposed herein, which forecast typhoon intensity as a time series problem based on historical typhoon data. First, the typhoon intensity forecasting models are trained and tested with processed typhoon data from 2000 to 2014 to find the optimal prediction factors. Then, the models are validated using the optimal prediction factors compared to a feed-forward neural network (FNN). As per the results of the model applied for typhoons Chan-hom and Soudelor in 2015, the model based on LSTM using the optimal prediction factors shows the best performance and lowest prediction errors. Thus, the model based on LSTM is practical and meaningful for predicting typhoon intensity within 120 h.
1. Introduction
Tropical cyclones are low-pressure cyclones that occur in tropical or subtropical oceans and have a great impact on the surrounding environmental systems. Tropical cyclones can grow into tropical depressions (TDs), tropical storms (TSs), strong tropical storms (STSs), typhoons (TYs), strong typhoons (STYs), and super typhoons (super TYs) (defined by the China Meteorological Administration). When the maximum wind speed near the center of a tropical cyclone reaches Level 12 (32.7 m/s or more), it is called a typhoon. A typhoon is a kind of disastrous weather system with strong destructive force. When a typhoon arrives, it causes a storm surge, heavy rainfall, a tide change, and other disasters, which bring huge losses to the lives and property of people. Based on the data recorded by the China Meteorological Administration (CMA), on average, no less than seven typhoons hit the southeast coastal region of China every year, which is the most highly developed and populated region in China. Therefore, it is of great practical significance to forecast typhoons in an accurate and timely manner.
Several methods for typhoon forecasting exist. At present, most researchers use numerical prediction methods based on dynamics theory [1,2,3,4]. However, these methods are expensive and complex [5], and it is difficult to gain internal skills using them [6]. In recent years, with the rise of artificial neural networks (ANNs), especially feed-forward neural network (FNNs), some researchers have tried to forecast typhoons based on an FNN. This method, based on statistical theory and big data, does not require knowledge of the detailed physical processes during the development of typhoons, which shows the positive meaning for typhoon forecasting.
However, for typhoon forecasting, there are too many prediction factors that influence the prediction results. Sooyoul Kom et al. [7] applied some forecasting models based on FNNs with different prediction factors to predict the storm surges caused by typhoons. Ying Huang et al. [8] combined a neural network with the locally linear embedding (LLE) algorithm to predict the precipitation caused by typhoons. Shao Limin et al. [9] applied a prediction model based on an FNN using the prediction factors selected by multivariate stepwise regression analysis to predict typhoon tracks. The above prediction results show the effective and suitable prediction factors for making the prediction results better for typhoon forecasting.
In recent years, Ruyun Wang et al. [6] studied typhoon intensity forecasting using a prediction model based on an FNN and applied the model for typhoons Nakri (2014) and Molave (2015), which achieved better results than the National Meteorological Center (NMC), the Joint Typhoon Warning Center (JTWC), the Japan Meteorological Agency (JMA), and the Korea Meteorological Agency (KMA) in 48 h using the minimum pressure and the maximum wind speed near the typhoon’s center, as well as the position data of the typhoon center for the current time and for every 6 h in the previous 18 h. However, they did not obtain ideal results for more than 48 h. On the contrary, for the regional forecasting of wind speed during a typhoon landfall, the results could be worse with more uncertainty [10]. These results show the limit of the abilities of prediction models based on an FNN to predict a typhoon. Therefore, it is very necessary to find a practical method to forecast typhoon intensity in a more timely and accurate manner, especially with a longer lead time of more than 48 h.
In general, typhoon intensity is measured by the minimum pressure and the maximum wind speed near the typhoon’s center, so typhoon intensity forecasting is actually pressure and wind speed forecasting. For wind speed forecasting, some researchers have tried to reduce prediction errors by using a hybrid of the population particle algorithm and a multi-quantile robust extreme learning machine [11], wavelet decomposition and wavelet neural networks optimized by the Cuckoo search algorithm [12], and an ANN combined with the discrete wavelet transform method [13]. In terms of the results, all of the hybrid methods improved the prediction results of wind speed forecasting with few prediction steps (no more than five steps) and a short lead time generally. Moreover, the prediction factor of these studies was only wind speed. Thus, for typhoon intensity forecasting, it is still necessary to find a practical method with more prediction steps and a long lead time.
With the development of a neural network, especially a deep neural network (DNN), some researchers have tried to study the problem of typhoons based on a DNN, such as a convolution neural network (CNN) [2,14] and long short-term memory (LSTM) [15,16], but not a simple ANN. Wei Yuzhou and Xu Xining [17] applied LSTM to forecast wind speed for the next 10 min and achieved a high prediction accuracy rate of more than 98%. Yin Hao et al. [18] designed a wind speed prediction model based on the fuzzy information granulation method and LSTM optimized by the Adam algorithm, for which the prediction results of wind speed for the next 1 h were better than the models based on a support vector machine (SVM) and an ANN using the back-propagation algorithm (BPNN). Gholamreza Memarzadeh and Farshid Keynia [19] proposed a wind speed prediction model based on LSTM using the wavelet transform, feature selection, and crow search algorithms, which showed the best performance for the wind speed in the future 1 h compared to other models based on LSTM not using these algorithms. Xuechao Liao et al. [20] proposed a wind speed prediction model based on LSTM using the attention mechanism, wavelet decomposition, and variational mode decomposition methods. Compared to models based on the autoregressive moving average and support vector regression, the proposed prediction model was stable and had cumulative errors within the next 5 h every 1 h. These studies aimed to predict short-term wind speed and to show that prediction models based on LSTM are better for wind speed prediction problems, but they all only used wind speed data for the experiments and were not in the field of typhoon intensity forecasting. Because of the complexity of typhoon forecasting and the recent improvements of LSTM, only a few papers have used prediction models based on LSTM to predict typhoon intensity. Additionally, the study of typhoon intensity forecasting based on LSTM is only applicable to the next 24 h [21], which shows that there is an important problem with forecasting typhoon intensity for a longer period of time.
Based on the above problems regarding typhoon intensity forecasting and prediction models based on neural networks, typhoon intensity forecasting models based on LSTM are proposed. In addition, considering the development processes of typhoon cases, in this experiment, typhoon intensity is forecast as a time series problem. During the training and test phases, optimal prediction factors are selected for typhoon intensity forecasting. After determining the optimal prediction factors for typhoon intensity forecasting, prediction models based on LSTM using the optimal prediction factors are applied for typhoons Chan-hom and Soudelor in 2015. Finally, these models are validated against a model based on an FNN.
The remainder of this paper is organized as follows: Section 2 introduces the study area and processed data of the experiment. Section 3 describes the methods to develop the typhoon intensity forecasting models based on LSTM and FNN and the evaluation indicators to validate these models. The forecasting models based on LSTM are presented in Section 4. Section 5 shows the method for selecting the optimal prediction factors and the analysis of the results of the experiment. Section 5 concludes this paper.
2. Study Area and Data
In the experiment, typhoons that occurred in the Northwest Pacific were studied. Typhoons that occurred in other areas were outside the scope of this study. The data for the experiment were from the best tropical cyclone track data set every 6 h [22] from the Tropical Cyclone Data Center of the CMA (tcdata.typhoon.org.cn, accessed on 14 January 2021). These typhoon data include the intensity and position information of typhoons occurring in the Northwest Pacific every 6 h from 1949. Data of the samples of each typhoon case can be seen in Table 1. In Table 1, the latitude (a positive value indicates north latitude) and longitude (a value smaller than 1800 indicates east longitude, a value bigger than 1800 west longitude) are 10 times that of the real values. For example, if the latitude is 95, the real value is 9.5.
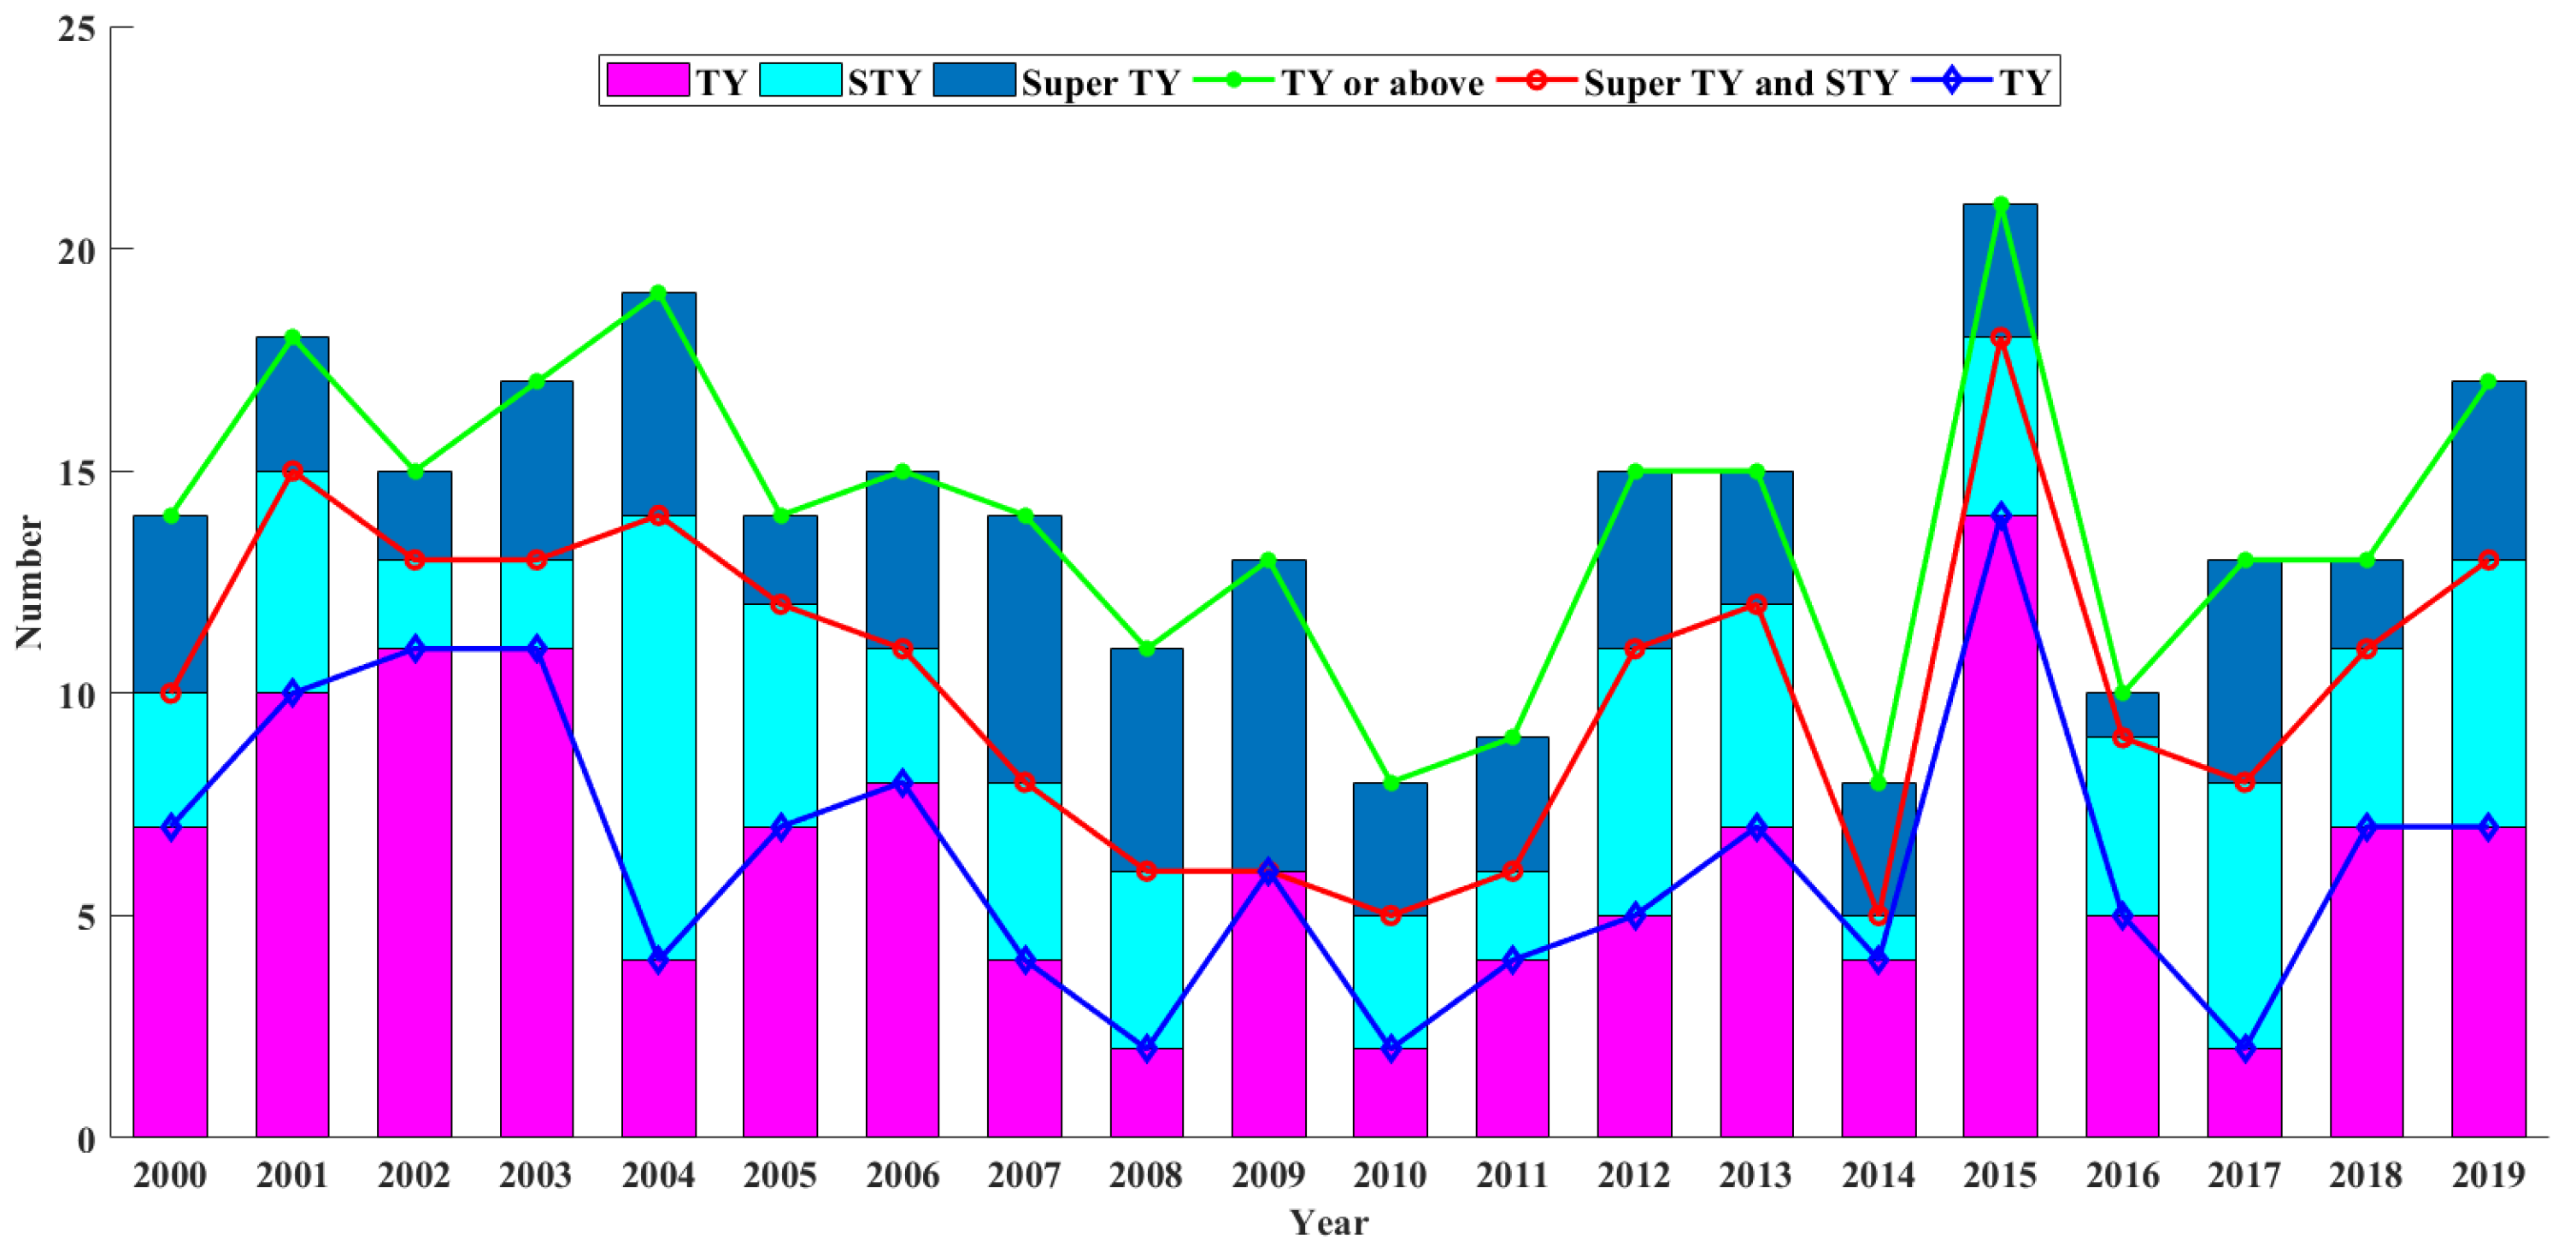
Because the number of typhoons in 2015 (Figure 1) was higher than in other years, as well as the number of typhoons that reached the strong typhoon and super typhoon levels, the data from 2000 to 2014 were used to train and test the prediction models; for the former, seventy percent of the data were used to train the models, while the remainder were used to test them, and typhoons Chan-hom and Soudelor (2015) were used to validate the models. Additionally, the typhoon cases that did not reach the typhoon level were not used in the experiment so as to avoid the negative effects for typhoon intensity forecasting and to achieve better prediction results.
The maximum wind speed (WS) and the minimum pressure (P) near the typhoon’s center, as well as the latitude (Lat) and the longitude (Lon) of the typhoon’s center were included in the data source. Additionally, the moving speed (MS) of the typhoon was also considered in the experiment. According to the theory of the cosine function and triangle function, the moving speed of a typhoon can be calculated as follows:
where and are the latitude and longitude in the previous 6 h, respectively; and are the latitude and longitude at the current time, respectively; t is the interval time between two adjacent samples (the value of t was six in the experiments). In addition, an MS of zero indicates a typhoon case that is motionless during the previous 6 h. The descriptive statistics of these variables of the processed typhoon data are shown in Table 2.
The variables and prediction factors in this experiment can be seen in Table 3. In Table 3, P(t), P(t-1), P(t-2), P(t-3), and P(t-4) refer to the data of minimum pressure at the current time, in the previous 6 h, in the previous 12 h, and in the previous 18 and 24 h, respectively, which can be seen as the prediction factors based on the minimum pressure. Similarly, the following four rows of Table 3 display the data of the maximum wind speed, the latitude, the longitude, and the moving speed, respectively, which can be seen as the prediction factors based on the variables WS, Lat, Lon, and MS, respectively.
3. Methodologies
3.1. Model Settings
A recurrent neural network (RNN) is a type of DNN with a special internal structure, which can easily deal with the problems of sequence to sequence (also called time series problems), but finds it hard to deal with long-term nonlinear problems. LSTM, a type of RNN, has a special internal structure to solve long-term nonlinear problems better. There are many papers about the application and improvement of LSTM, as well as the introduction of the structure of LSTM [16,23,24,25]. According to the results of the existing studies about the application of LSTM, models based on LSTM can better solve long-term prediction problems, which may be more beneficial for forecasting typhoon intensity with longer lead times, such as 96 and 120 h.
A feed-forward neural network with one hidden layer can fit any function [26], and the prediction problems can be seen as a process to fit the universal function from the input prediction factors to the prediction values; so in the experiment, prediction models based on LSTM with an input layer, an LSTM hidden layer, and a dense output layer are proposed. According to the actual results of the experiment, the prediction results would be worse influenced by the internal hyperparameters of neural networks such as the number of hidden layers, the number of neurons in the hidden layers, the learning rate, and the activation functions. Bahareh Nakisa et al. [27] used the differential evolution method to optimize the hyperparameters of LSTM and achieved results with higher accuracy. Mehdi Neshat et al. [28] optimized the LSTM hyperparameters using evolutionary algorithms, and the results showed that the optimized model was better than the models combined with the Sydney, Perth, Adelaide, and Tasmania method. Hossein Abbasimehr et al. [29] proposed a demand forecasting method to select the best hyperparameters of multilayer LSTM networks. Compared to the time series forecasting methods based on the autoregressive integrated moving average, exponential smoothing, ANN, K-nearest neighbors, RNN, SVM, or single-layer LSTM, the multilayer LSTM network with the best hyperparameters selected using the demand forecasting method showed the best prediction results. Generally, the prediction results would be different using different prediction models, different data, and other parameters of the model. In theory, even with all the same conditions except the method to find the optimal number of neurons, the results can be also different, because the uncertainty of the prediction model. Therefore, there are still no general methods for designing models based on neural networks, but there are for optimizing them based on the results of prediction experiments. In this experiment, prediction models were enough to forecast typhoon intensity, with the linear activation function in the dense layer, the tanh activation function in the LSTM layer, the Adam optimizer, the mean squared error (MSE) loss function, 300 iteration steps, and the hidden layer neurons as four times as predictors of the models. To validate the models based on LSTM using the optimal prediction factors, a model based on an FNN is proposed. The settings of the model based on an FNN are similar to those of the models based based on LSTM; however, for the FNN model, the activation function of the hidden layer is sigmoid, and the maximum iteration step is 5000. The hyperparameters of the models based on LSTM and an FNN are shown in Table 4.
3.2. Forecasting Method
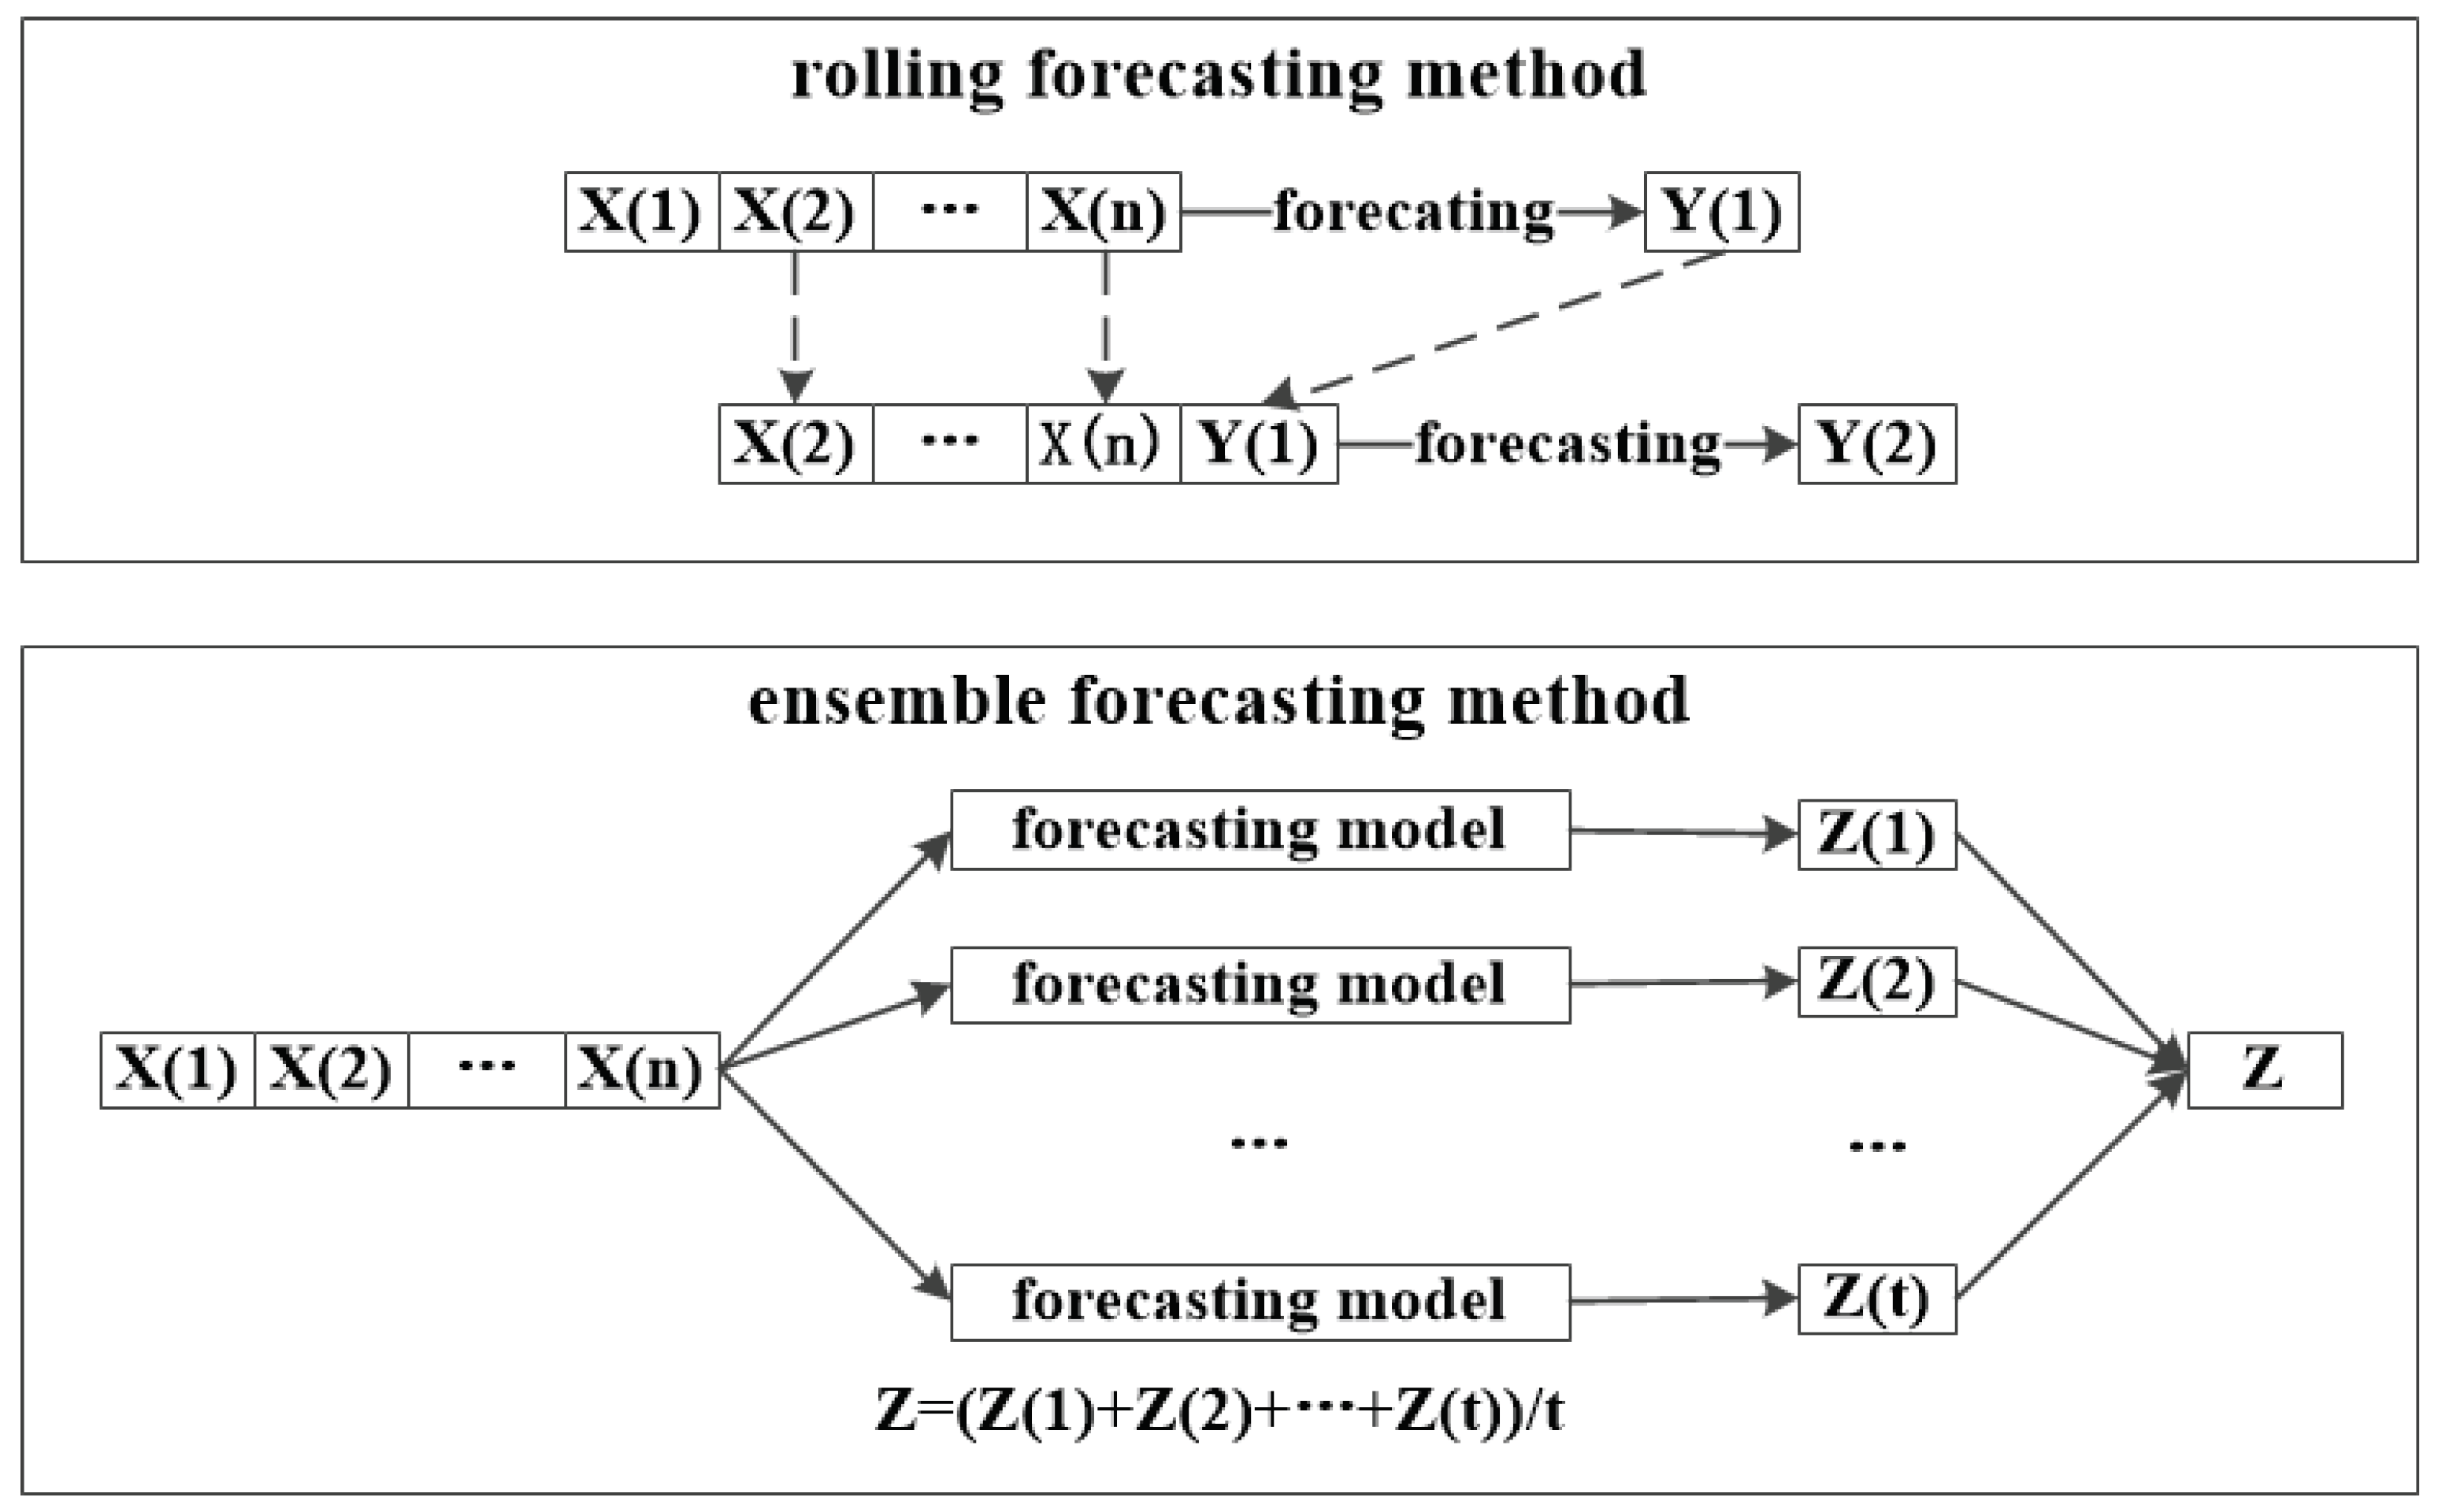
To forecast typhoon intensity for a longer time, it is necessary to consider the rolling forecasting method [23,24,25]. Based on this method, the LSTM models used the typhoon intensity data, typhoon position data, and typhoon moving speed data at the current time and in the previous 6 h for typhoon intensity forecasting of the next time point, so that the data could be obtained with a lead time of 6 h, and then, the output data were used to predict the typhoon intensity at the next time point, so that the data could be known in the future 12 h. Through the above process, the typhoon intensity data could be obtained based on the LSTM models with lead times of 6, 12, 24, 48, 72, 96, and 120 h. In order to better reflect the forecasting effect of the LSTM models, the typhoon intensity forecast experiments were repeated 20 times (also called 20 ensemble members in numerical model methods) for the next 6, 12, 24, 48, 72, 96, and 120 h.
To study the performance of the forecasting models accurately, the ensemble forecasting method based on the LSTM models was used to forecast typhoon intensity. For example, in the experiment, it was able to obtain the prediction value Z(1) based on the model at the first time point and then obtained the prediction value Z(2) at the second time point based on the models, so the prediction value based on the ensemble forecasting method is (Z(1)+Z(2))/2. The processes of the rolling forecasting and ensemble forecasting methods can be seen in Figure 2.
3.3. Data Processing and Evaluation Indicators
Before training the models, because of the different prediction factors with different dimensions and size ranges, it is very necessary to normalize the data to make the typhoon intensity forecast models easy to train and to achieve reasonable prediction results. The data normalization method used is as follows:
where is the value before normalization, is the value after normalization, is the minimum value in the group, including , and is the maximum value in the group, including .
In addition, typhoons change during their life cycle, and considering the limited samples of one typhoon case, typhoon intensity can be forecasted as a time series problem based on historical typhoon cases and LSTM. For example, the time series of one typhoon case is X(1), X(2), …, X(n), and the time series of another typhoon case is Y(1), Y(2), …, Y(m); thus, the processed time series of these typhoon cases is X(1), X(2), …, X(n), Y(1), Y(2), …, Y(m).
After training the models, the data need inverse normalization as follows:
where is the value before normalization, is the value after normalization, is the minimum value in the group, including , and is the maximum value in the group, including .
After typhoon intensity forecasting based on the LSTM models with lead times of 6, 12, 24, 48, 72, 96, and 120 h, the prediction results of the LSTM models measured the mean absolute error (MAE).
The MAE between the observation and prediction values of typhoon intensity forecast models is defined as follows:
where is the observation value, is the prediction value, and n is the length of x. The results will be better with smaller MAE values.
The root mean squared error (RMSE) between the observation and prediction values of typhoon intensity forecast models is defined as follows:
where is the observation value, is the prediction value, and n is the length of x. The results will be better with smaller RMSE values.
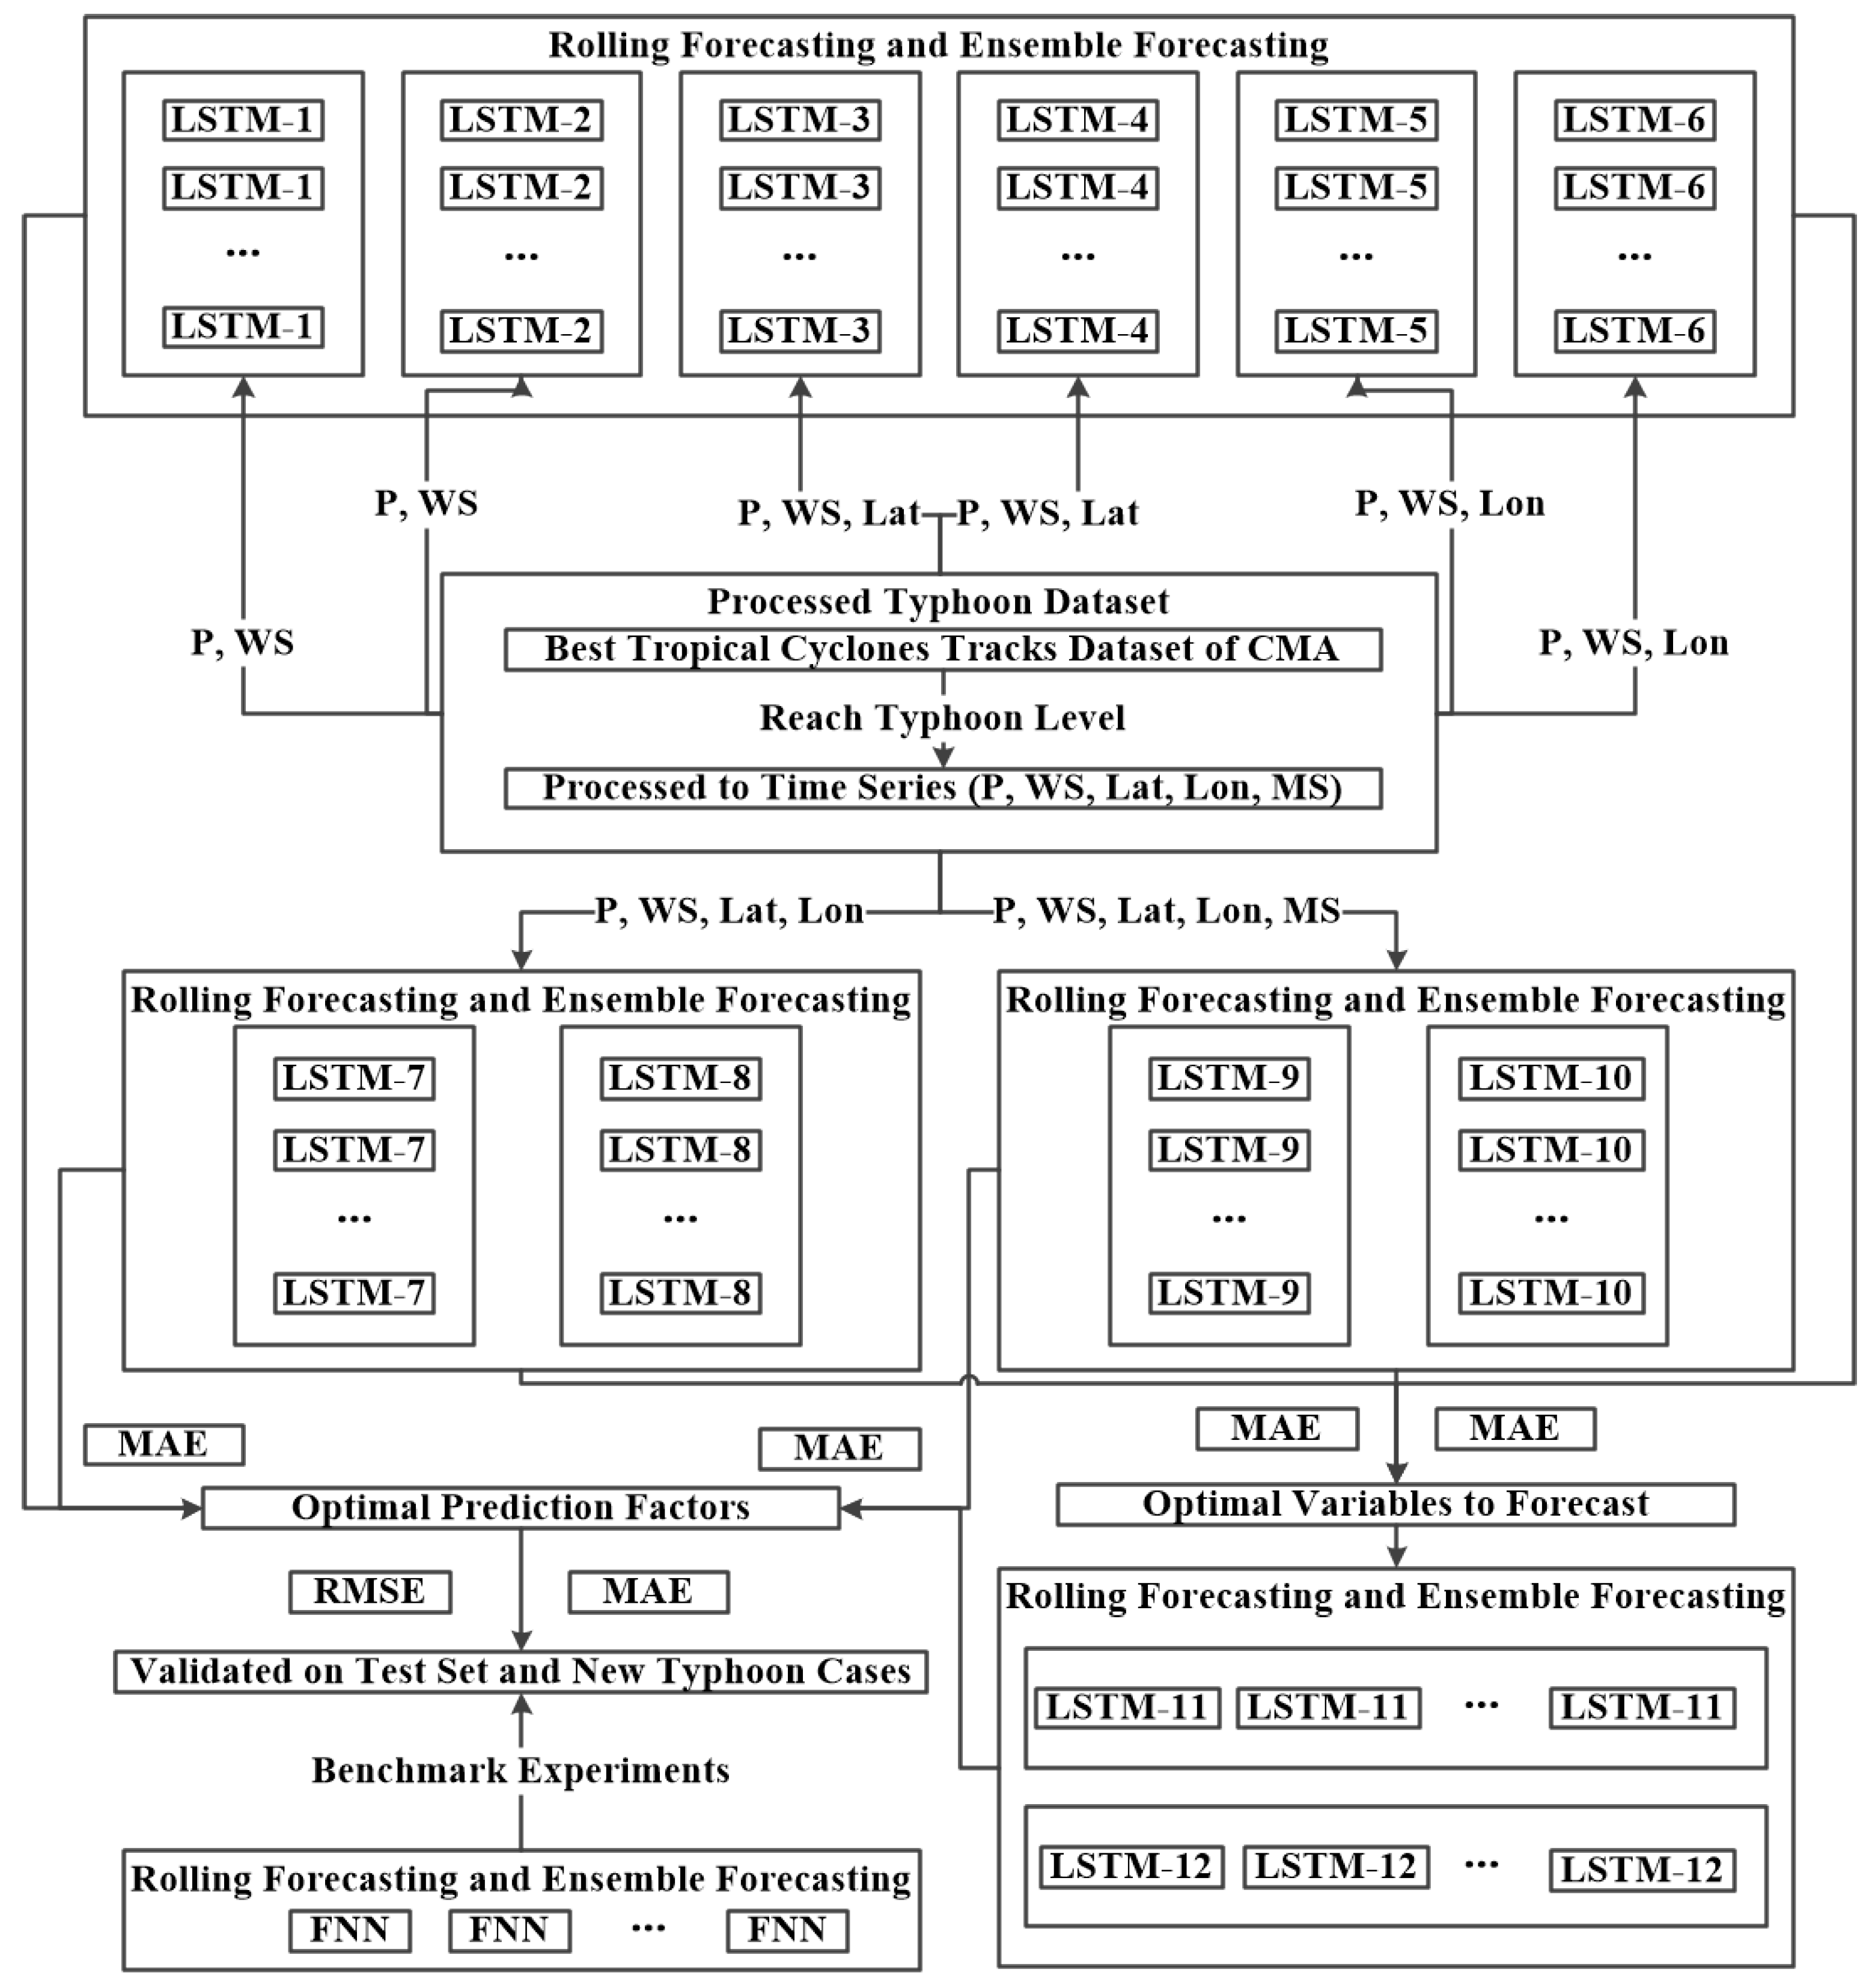
As regards the above processes, the typhoon intensity forecasting models based on LSTM and an FNN can be seen in Figure 3.
4. LSTM Models
Considering the influence of different prediction factors to forecast typhoon intensity, models based on LSTM using different prediction factors are proposed. Based on the above processed data (Section 2) and the model development (Section 3), the models based on LSTM are proposed. Their rolling forecasting processes are shown as the function expression in Table 5. The value of i in Table 5 is from 1 to 20. The models based on LSTM can obtain the latitude and longitude of the typhoon’s center and the moving speed of the typhoon, but only the minimum pressure and the maximum wind speed near the typhoon’s center were used to analyze the prediction results and the performance of the prediction models. In addition, the models based on LSTM were developed based on the Tensorflow framework using Keras API (keras.io) and Python 3.6.3, while the model based on FNN was developed with MATLAB 2017b. Therefore, the structure of this experiments and the models based on LSTM are shown in Figure 4.
5. Experimental Results
5.1. Determining the Optimal Prediction Factors
Based on the proposed models mentioned in the above sections, the models based on LSTM were trained and tested. It can be seen that LSTM-8 achieved the best results of the minimum pressure forecasting near the typhoon’s center, as well as the maximum wind speed near the typhoon’s center, compared to the other LSTM models (Table 6). The results show that the intensity and position data of the typhoon at the current time and in the previous 6 h effectively improved the performance of the typhoon intensity forecasting. More or fewer prediction factors would make the prediction results of the typhoon intensity worse.
To ensure the optimal prediction factors for typhoon intensity forecasting, the prediction factors in the previous 12 and 18 h were also considered to validate the optimal prediction factors. The prediction models can be seen in Table 7. The LSTM-11 and LSTM-12 models also used the hyperparameters of the LSTM-8 mentioned in Section 4. The rolling forecasting and ensemble forecasting methods were used for the typhoon intensity forecasting based on the LSTM-11 and LSTM-12 models. In other words, these LSTM models have the same structure and hyperparameters, but not the prediction factors.
As per the prediction results (Table 8), during 96 h, the LSTM-8 model also showed the best prediction results compared to the LSTM-11 and LSTM-12 models. With a lead time of 120 h, the prediction results of LSTM-8 were not the best, but the prediction values of these LSTM models were very close. In other words, generally, the prediction factors in the previous 12 and 18 h made the prediction results worse during 96 h. The maximum wind speed and the minimum pressure near the typhoon’s center and the latitude and longitude of the typhoon’s center at the current time and in the previous 6 h can be seen as the optimal prediction factors. Therefore, in the remainder of the experiment, the typhoon intensity forecasting model based on LSTM was validated on typhoons Chan-hom and Soudelor in 2015 using the optimal prediction factors (LSTM-8 model) and compared with the prediction model based on FNN.
5.2. Validation on the Test Set
As the prediction results of the models based on LSTM (Section 5.1), the optimal variables to forecast typhoon intensity are P, WS, Lat, and Lon. Besides, the optimal prediction factors are P, WS, Lat, and Lon at the current time and in the previous 6 h. Then, the model using the optimal prediction factors (LSTM-8 model) was validated on the test set compared to the FNN model using the same prediction factors. As the results (Table 9), according to the evaluation indicators MAE and RMSE, in general, the mean values of the LSTM model were smaller than those of the FNN model. The LSTM model generally showed better prediction ability for the typhoon intensity forecasting.
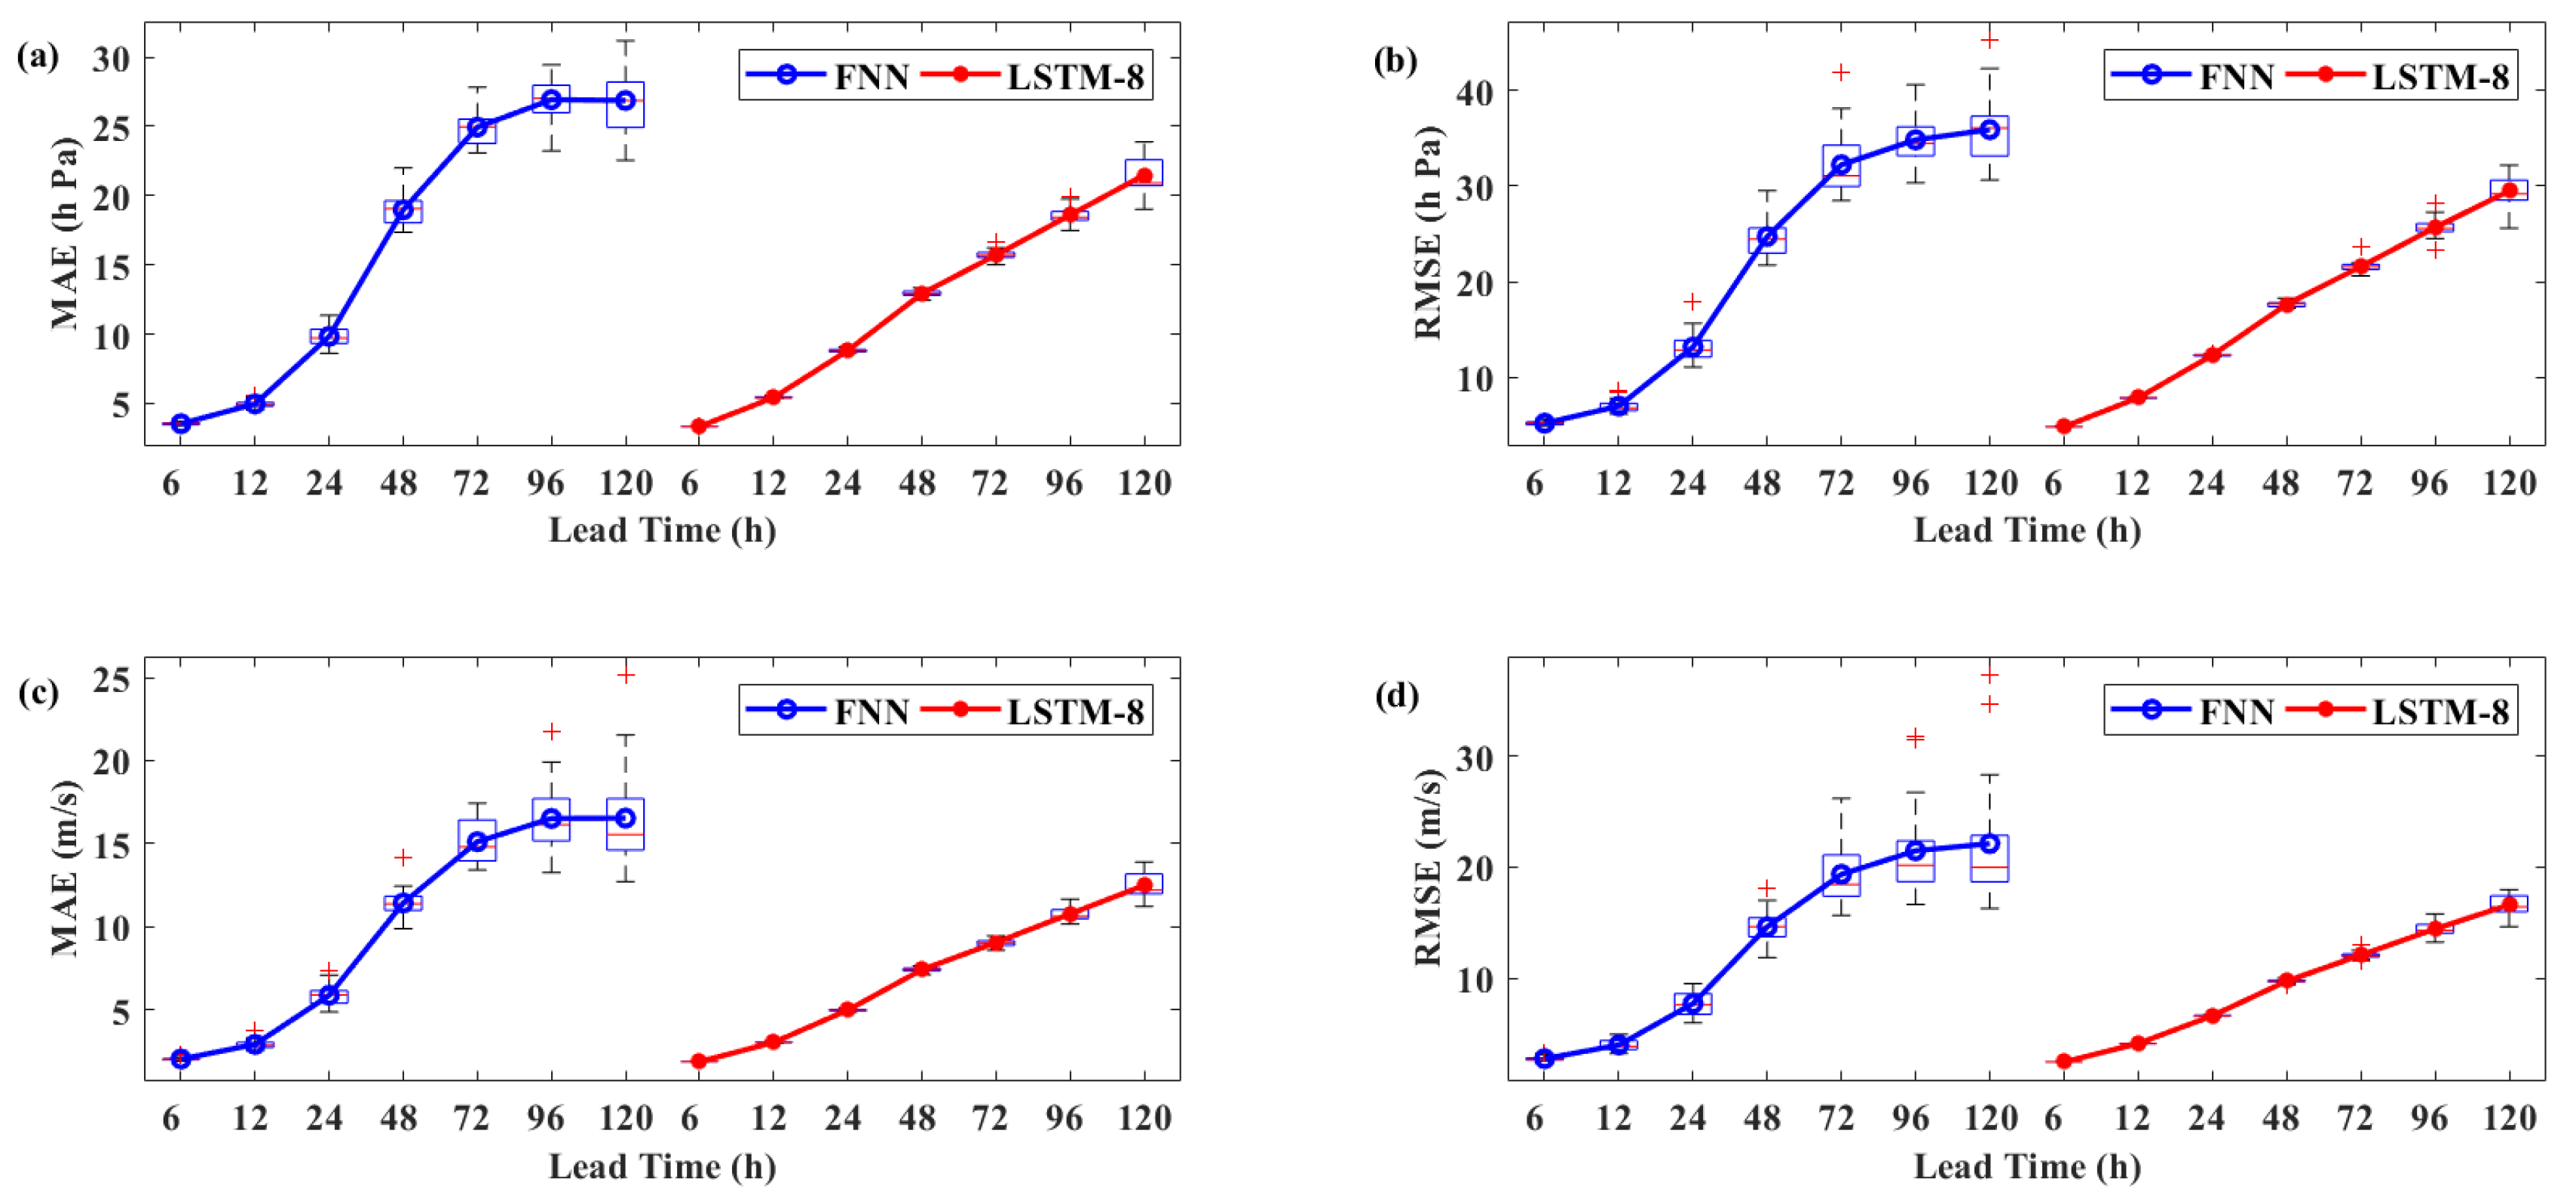
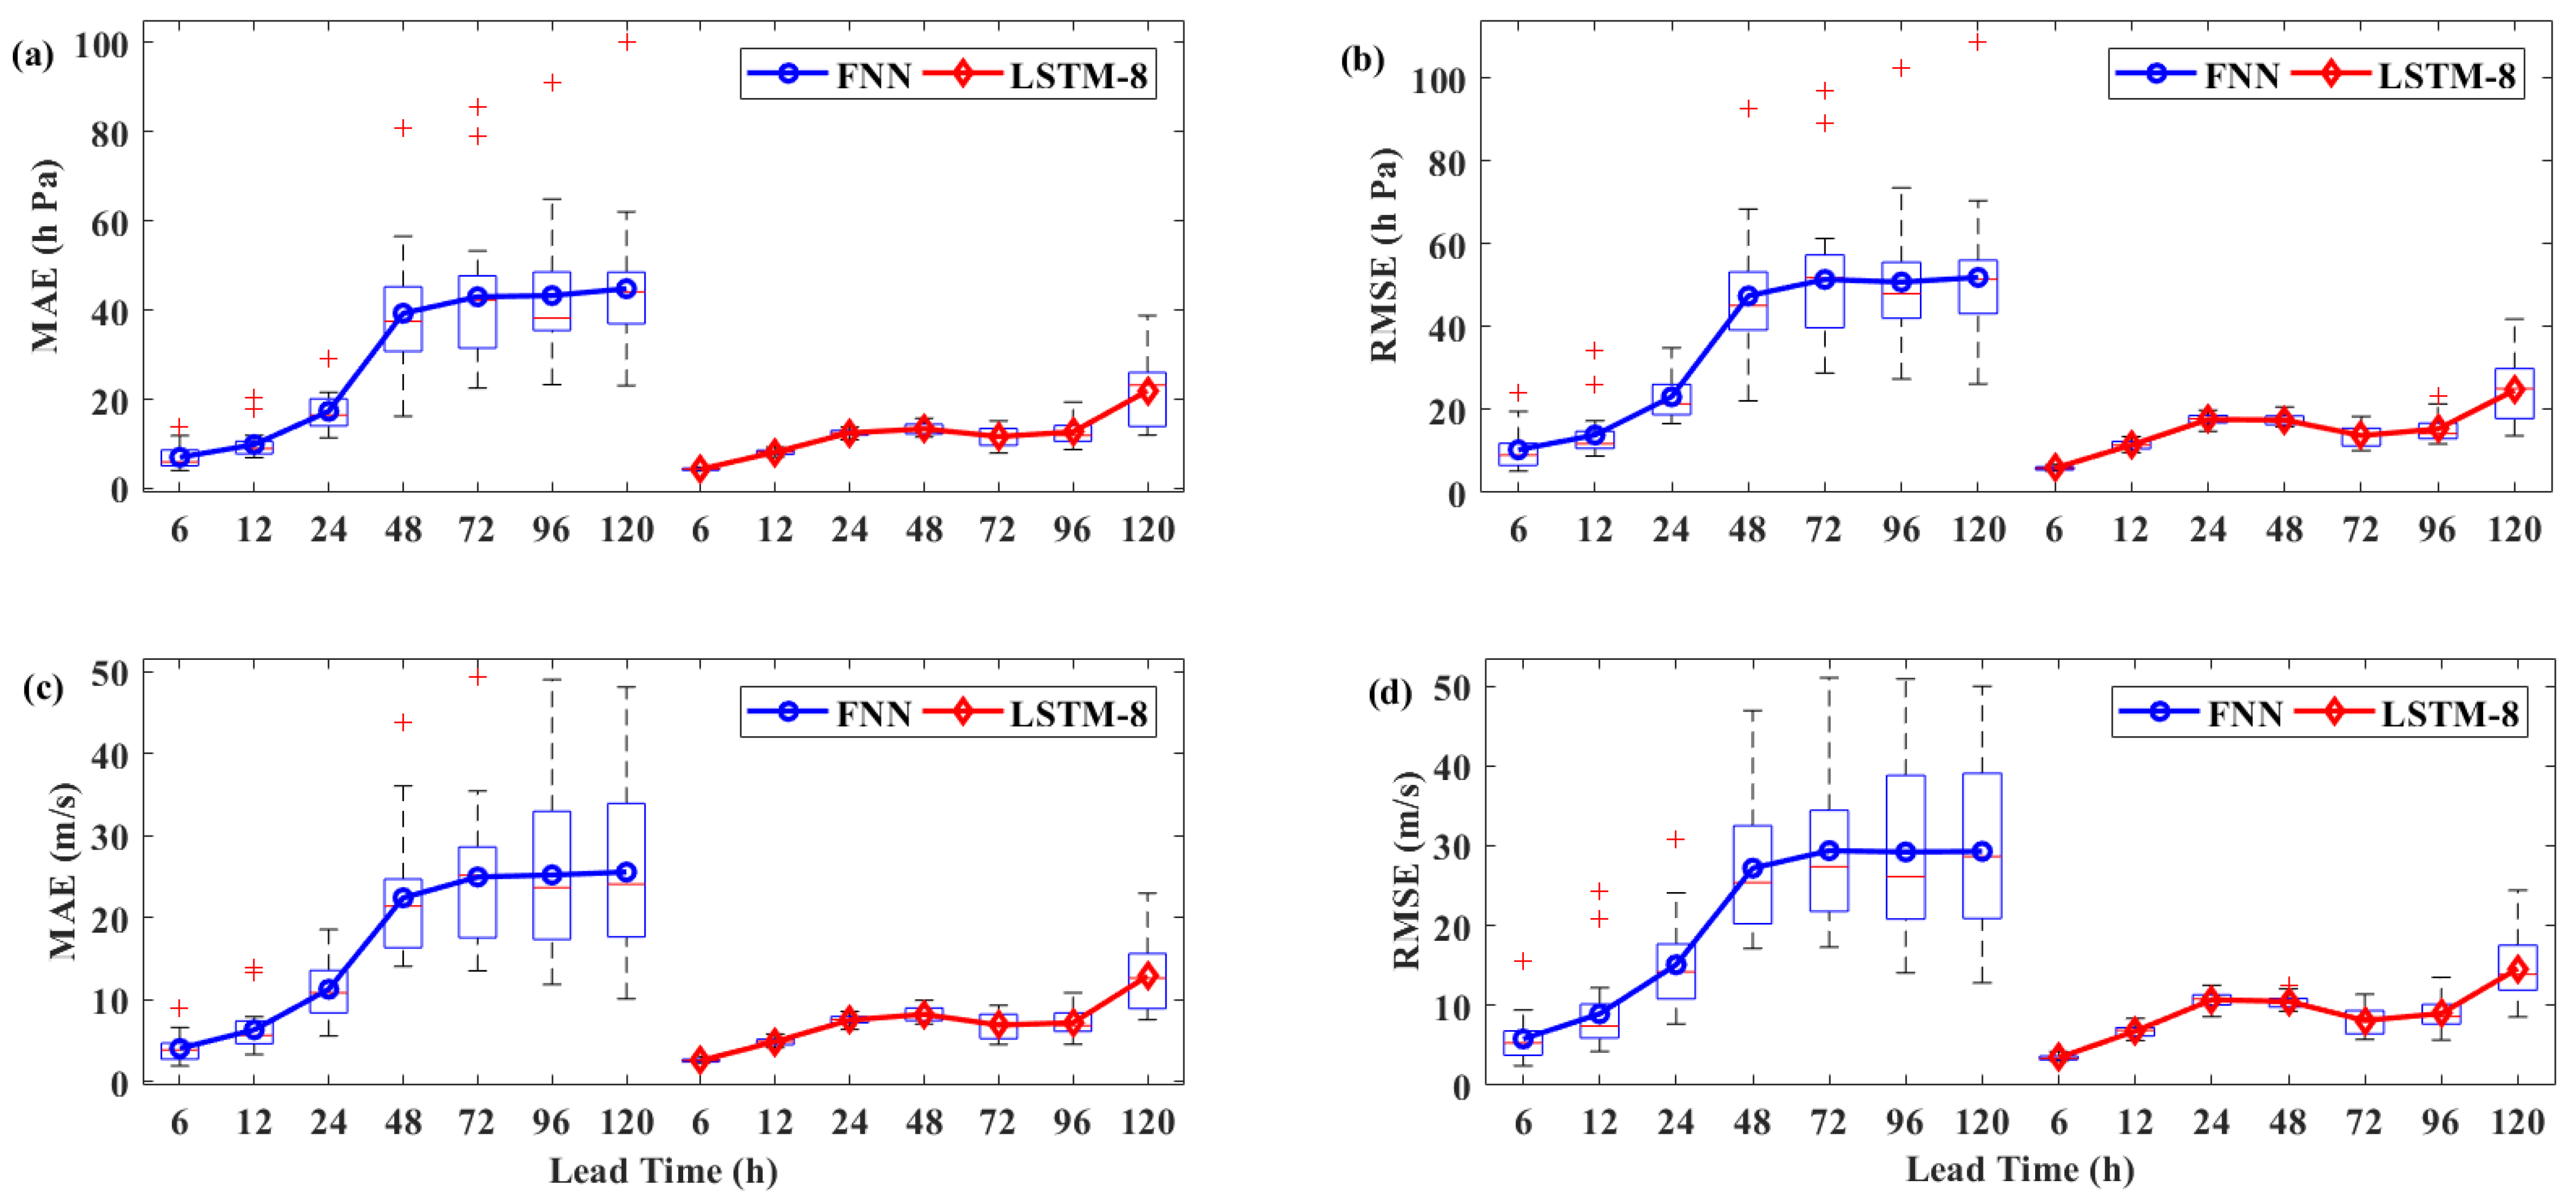
Next, according to the evaluation indicators of MAE and RMSE, the uncertainties of the model were studied to validate the performance of the prediction model based on LSTM. Figure 5a shows the MAE of the minimum pressure predicted by the models; Figure 5b shows the RMSE of the minimum pressure predicted by the models; Figure 5c shows the MAE of the maximum wind speed predicted by the models; Figure 5d shows the RMSE of the maximum wind speed predicted by the models. The model based on FNN showed higher uncertainties than the model based on LSTM with the same lead time. The evaluation indicators of the model based on FNN changed greatly with the longer lead time of more than 48 hours, but the evaluation indicators of the model based on LSTM remained stable.
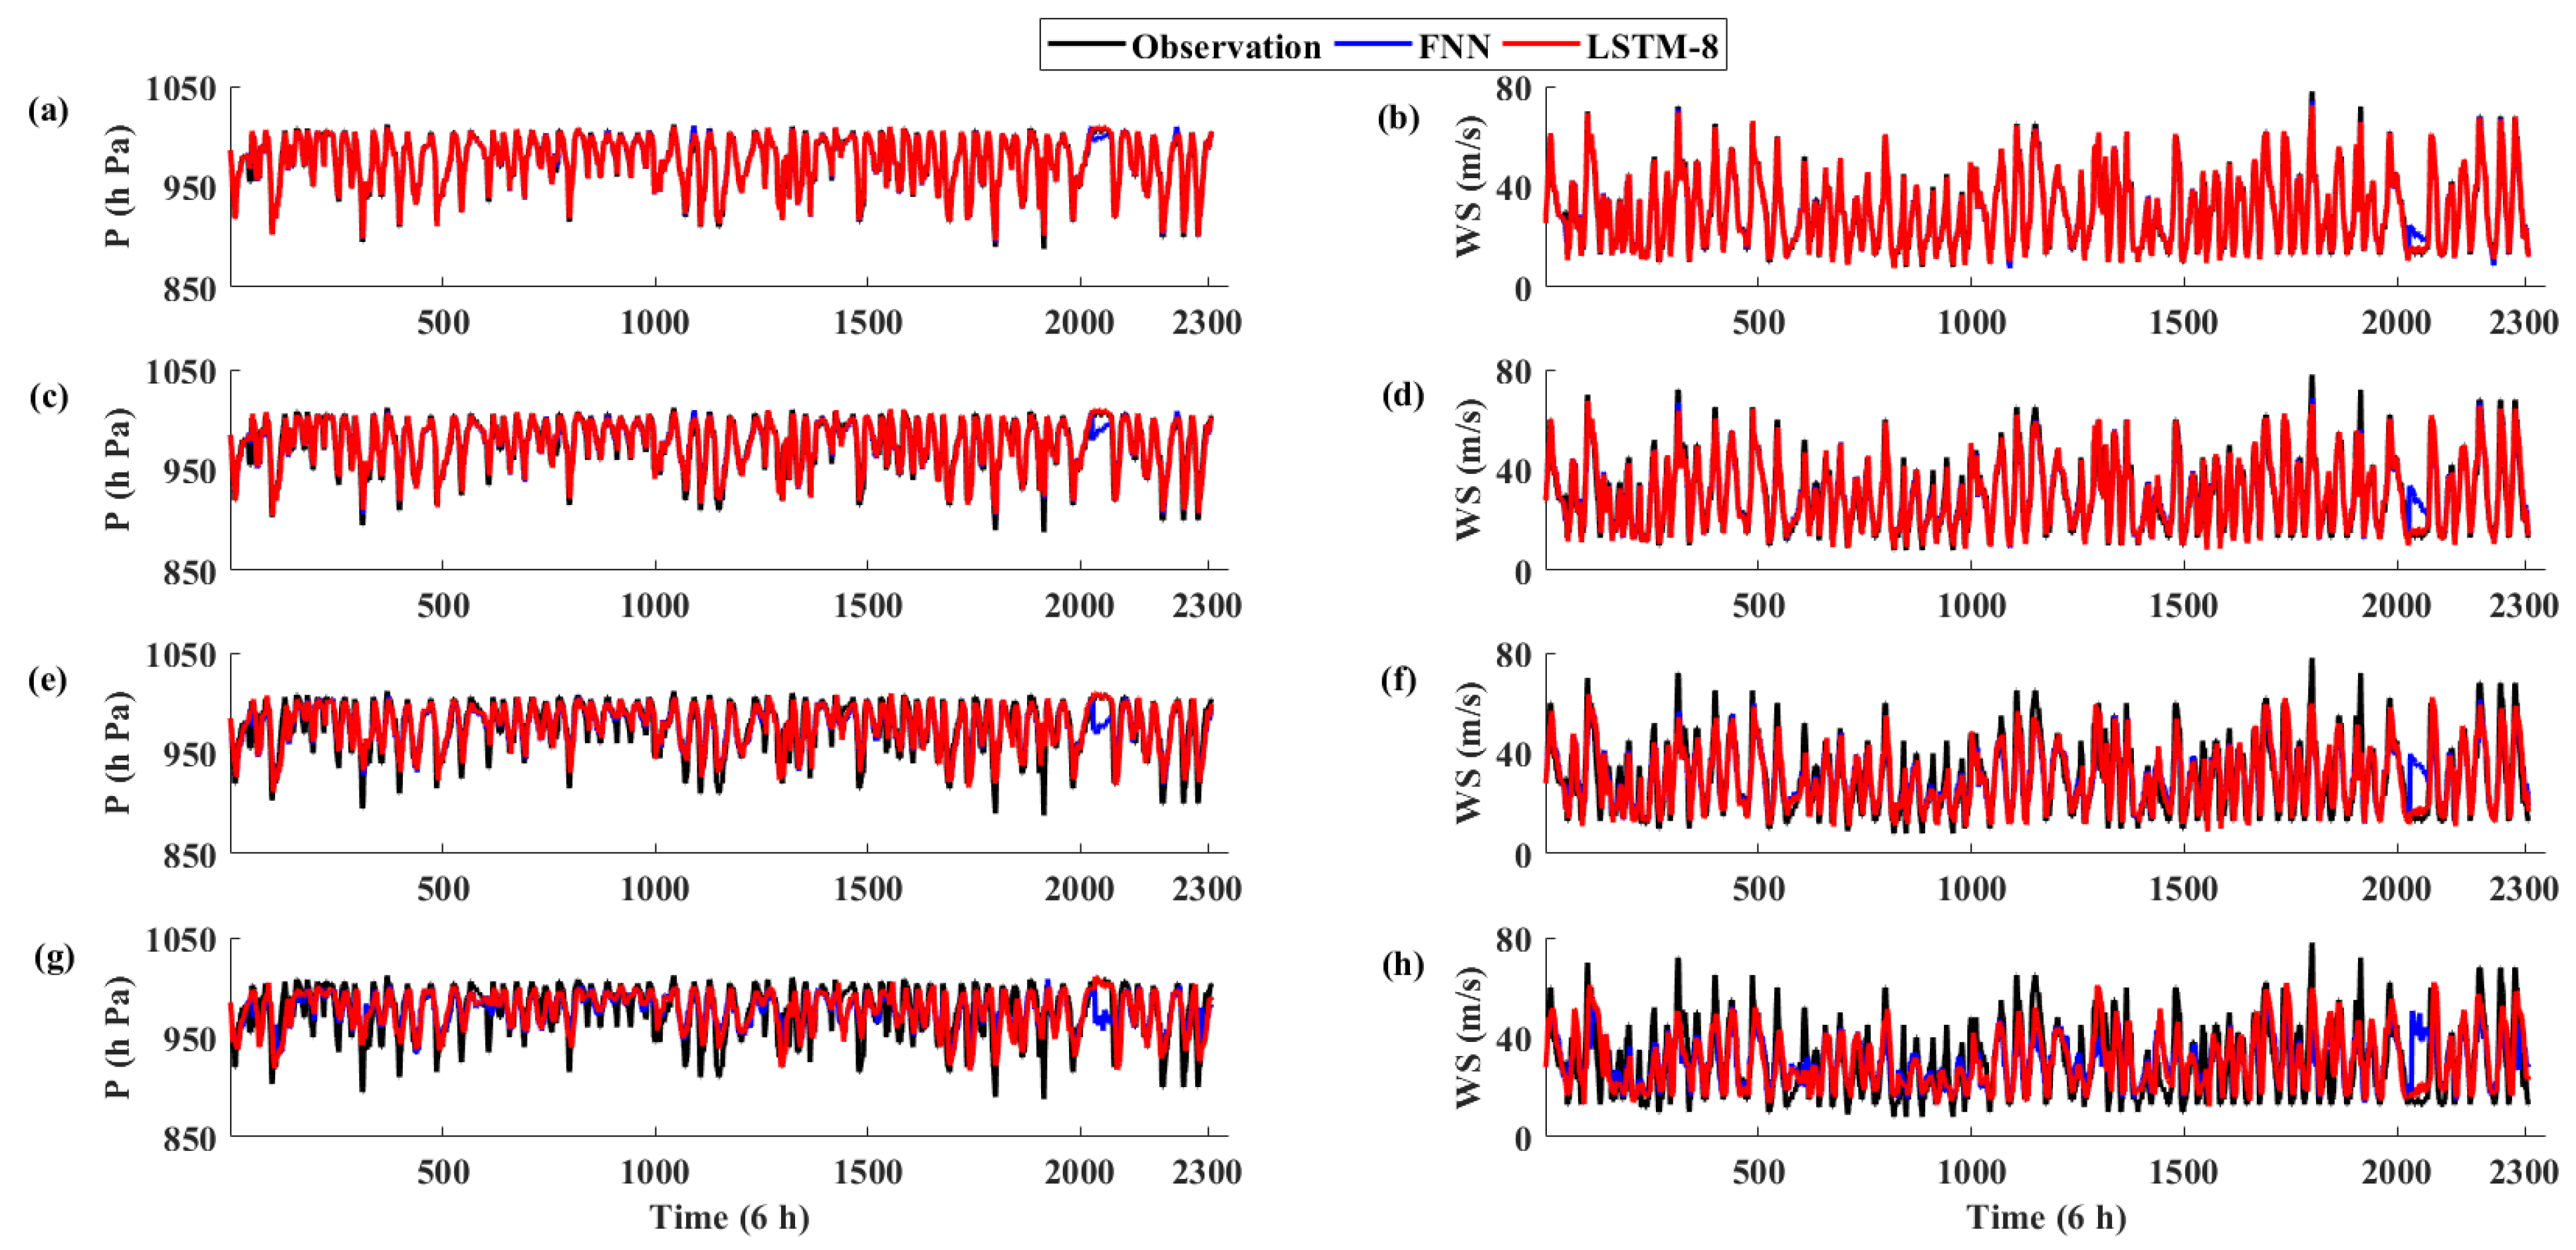
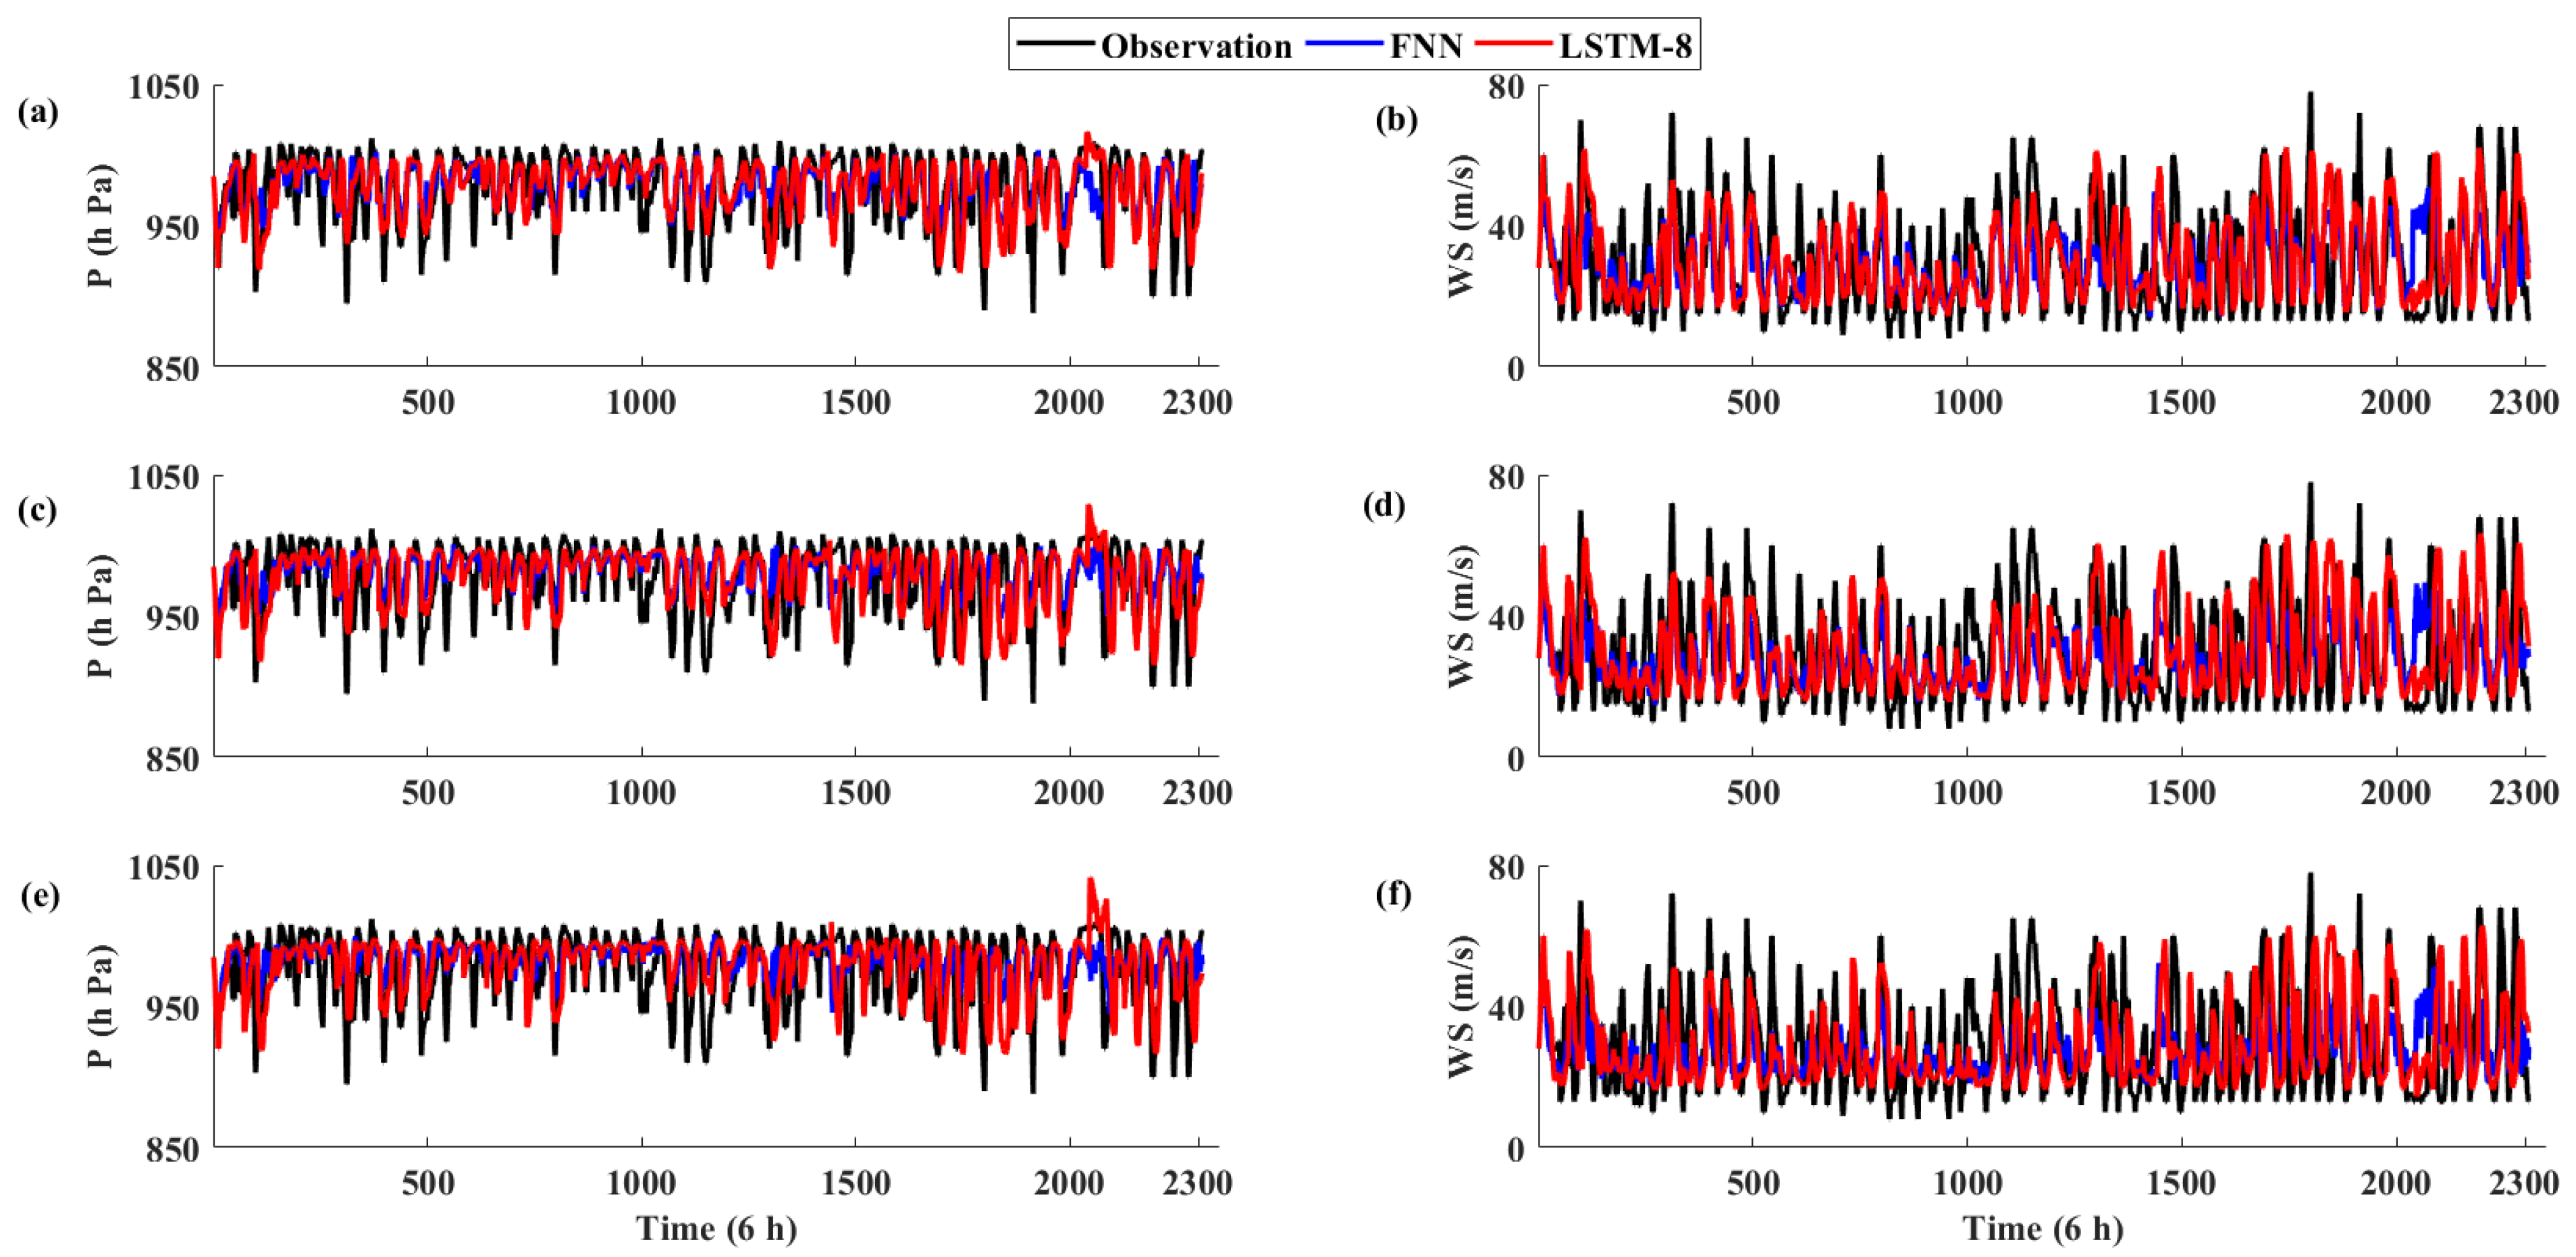
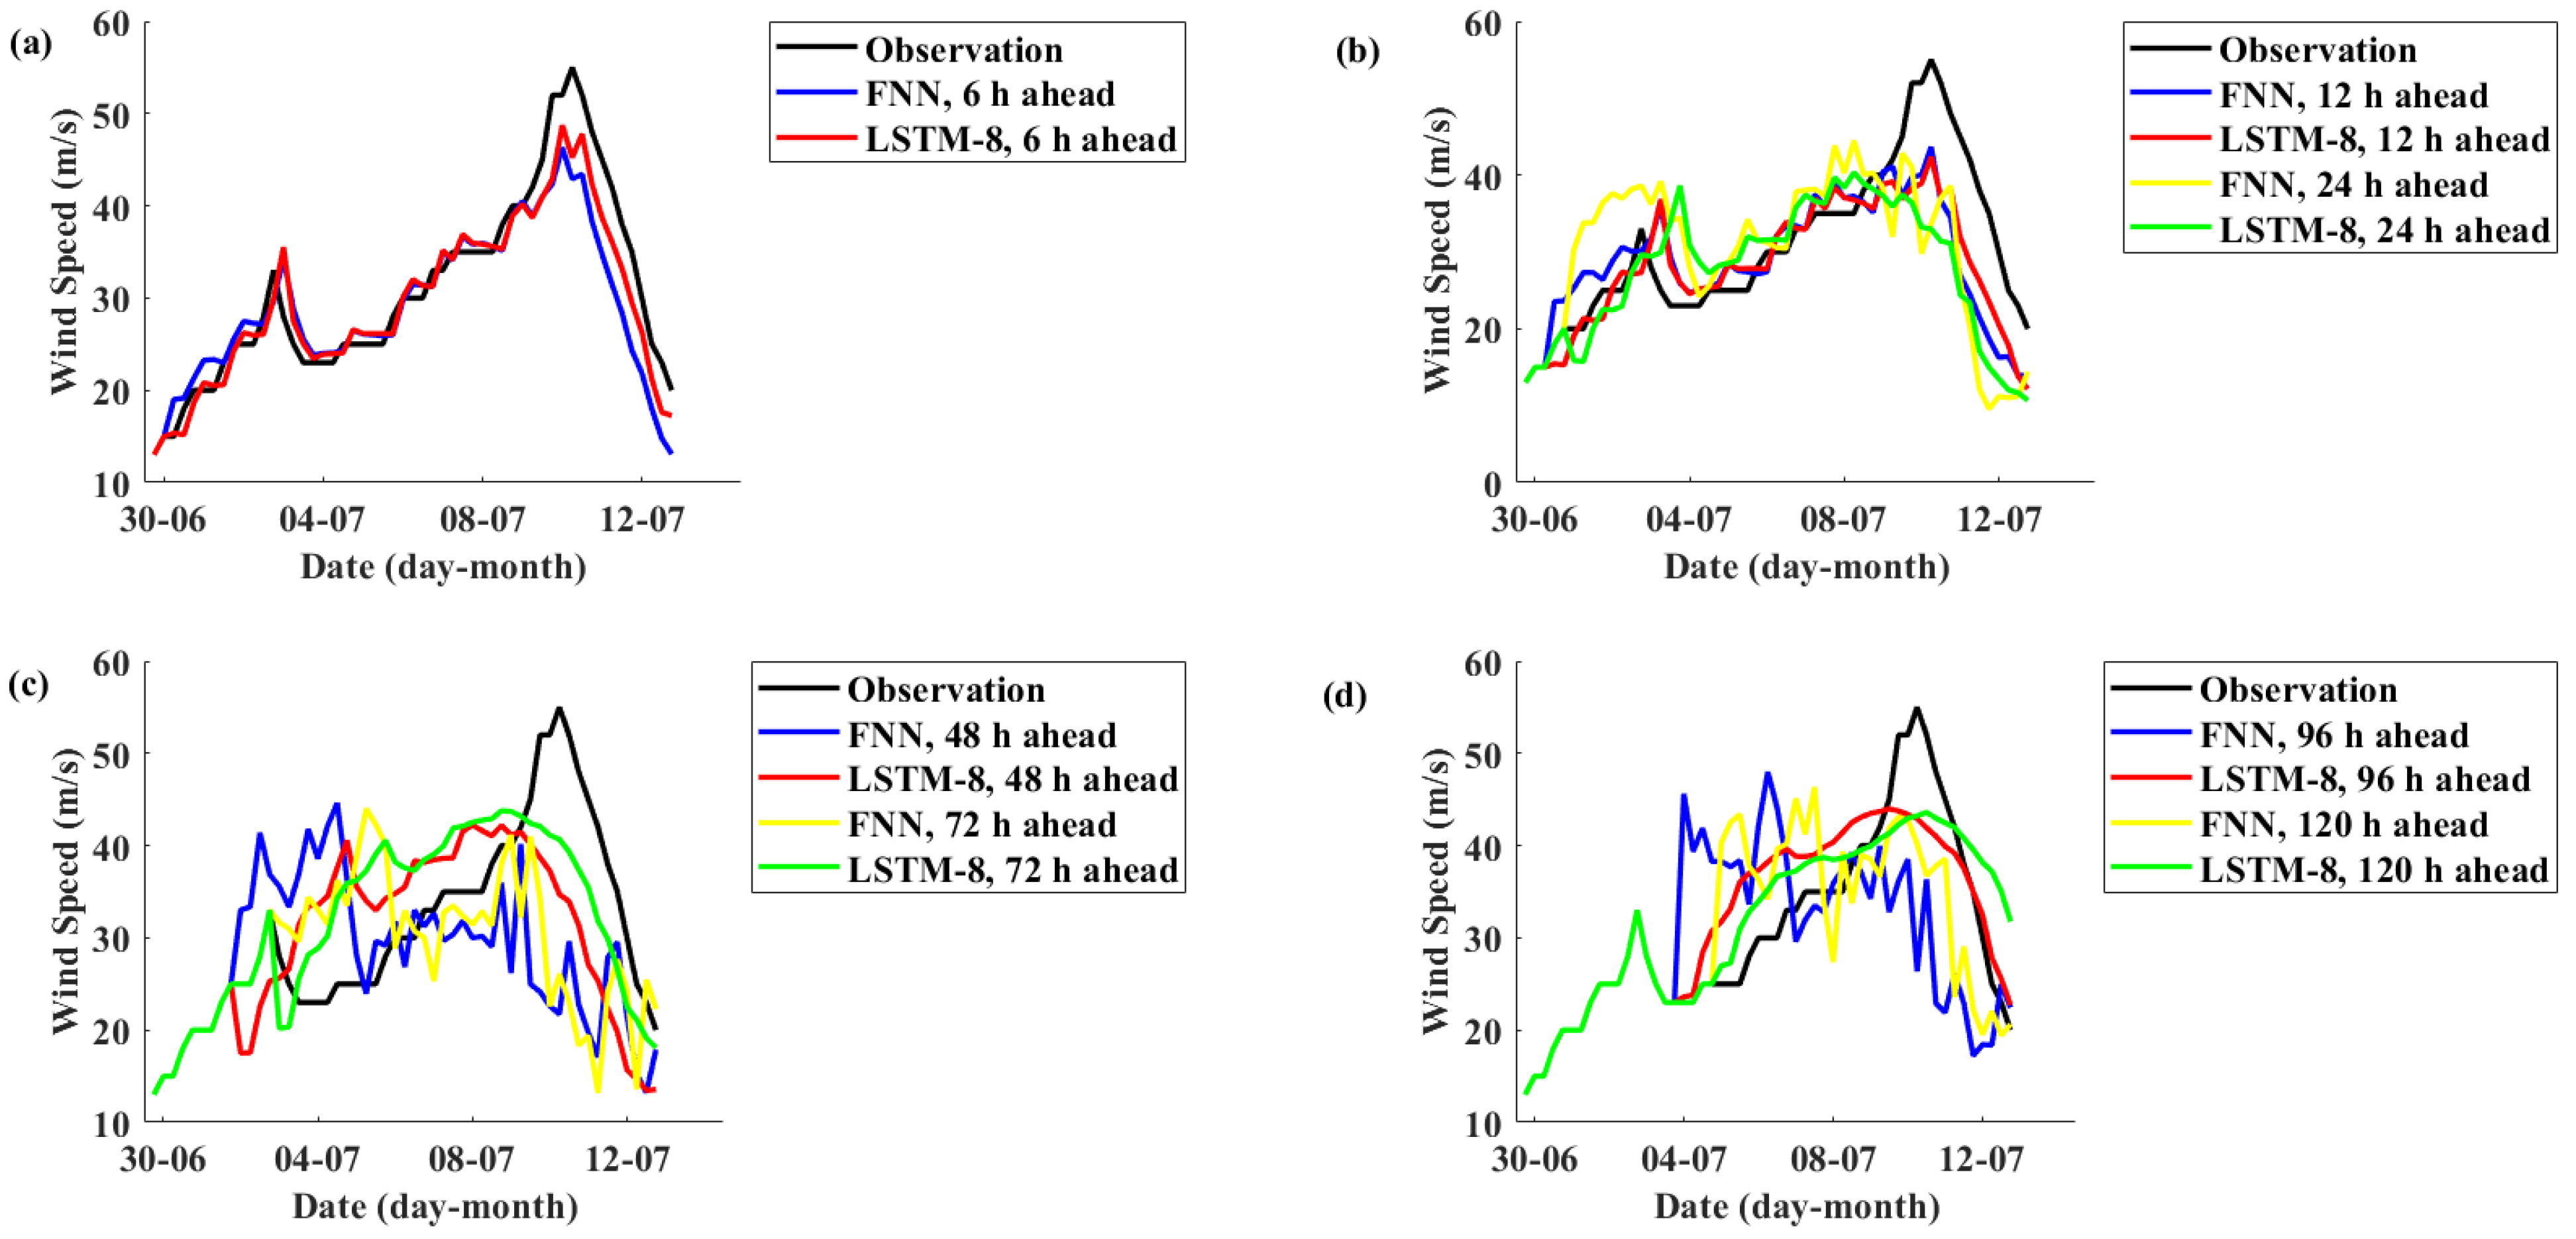
Figure 6 and Figure 7 show the prediction curves of the models based on the FNN and LSTM on the test set. Figure 6a,c,e,g, and Figure 7a,c,e are the pressure prediction curves of the models based on the FNN and LSTM, while Figure 6b,d,f,h, and Figure 7b,d,f are the wind speed prediction curves. Figure 6a,b shows the prediction curves of the models with a lead time of 6 h; Figure 6c,d shows the prediction curves of the models with a lead time of 12 h; Figure 6e,f shows the prediction curves of the models with a lead time of 24 h; Figure 6g,h shows the prediction curves of the models with a lead time 48 h; Figure 7a,b shows the prediction curves of the models with a lead time of 72 h; Figure 7c,d shows the prediction curves of the models with a lead time of 96 h; Figure 7e,f shows the prediction curves of the models with a lead time 120 h. With a lead time of no more than 48 h (Figure 6), in general, the prediction curves of the model based on LSTM are closer to the observation curve than those of the FNN model, but not significantly. With a lead time of more than 48 h (Figure 7), the prediction curves of the model based on the FNN are further from the observation curve compared with the LSTM model. According to the above results, in general, with smaller prediction errors and better performance, the model based on LSTM is more suitable to forecast typhoon intensity compared with the FNN model.
5.3. Validation on Typhoon Cases
According to the weather reports of the China Weather Typhoon Network, in 2015, super typhoons Chan-hom and Soudelor caused huge economic damage, even loss of life in China (typhoon.weather.com.cn, accessed on 14 January 2021). Therefore, in order to better test the actual prediction effect of one of the typhoon intensity forecast models (i.e., LSTM-8), the super typhoons Chan-hom (2015, No. 9) and Soudelor (2015, No. 13) were used to test the model and to compare it with the prediction model based on an FNN.
As per the results (Table 10), the prediction model based on LSTM showed the best prediction results, with lower prediction errors even an a lead time as long as 120 h. Moreover, for the performance of the prediction models (Table 11), the mean values of the LSTM model were smaller than those of the FNN model. The LSTM model showed better prediction ability for the typhoon intensity forecasting. Therefore, the typhoon intensity forecasting model based on LSTM is practical, even for the new typhoon cases and not just for the test set.
To validate the performance of the typhoon intensity model based on LSTM, according to the evaluation indicators MAE and RMSE, the uncertainties of the model are studied. Figure 8 shows the evaluation indicators of the models based on FNN and LSTM using the typhoon case Chan-hom in 2015. Figure 8a shows the MAE of the minimum pressure predicted by the models; Figure 8b shows the RMSE of the minimum pressure predicted by the models; Figure 8c shows the MAE of the maximum wind speed predicted by the models; Figure 8d shows the RMSE of the maximum wind speed predicted by the models. It can be seen that the uncertainties of the model based on an FNN are higher than the model based on LSTM with the same lead time. With a longer lead time, the evaluation indicators of the model based on an FNN changed greatly, while the evaluation indicators of the model based on LSTM remained stable.
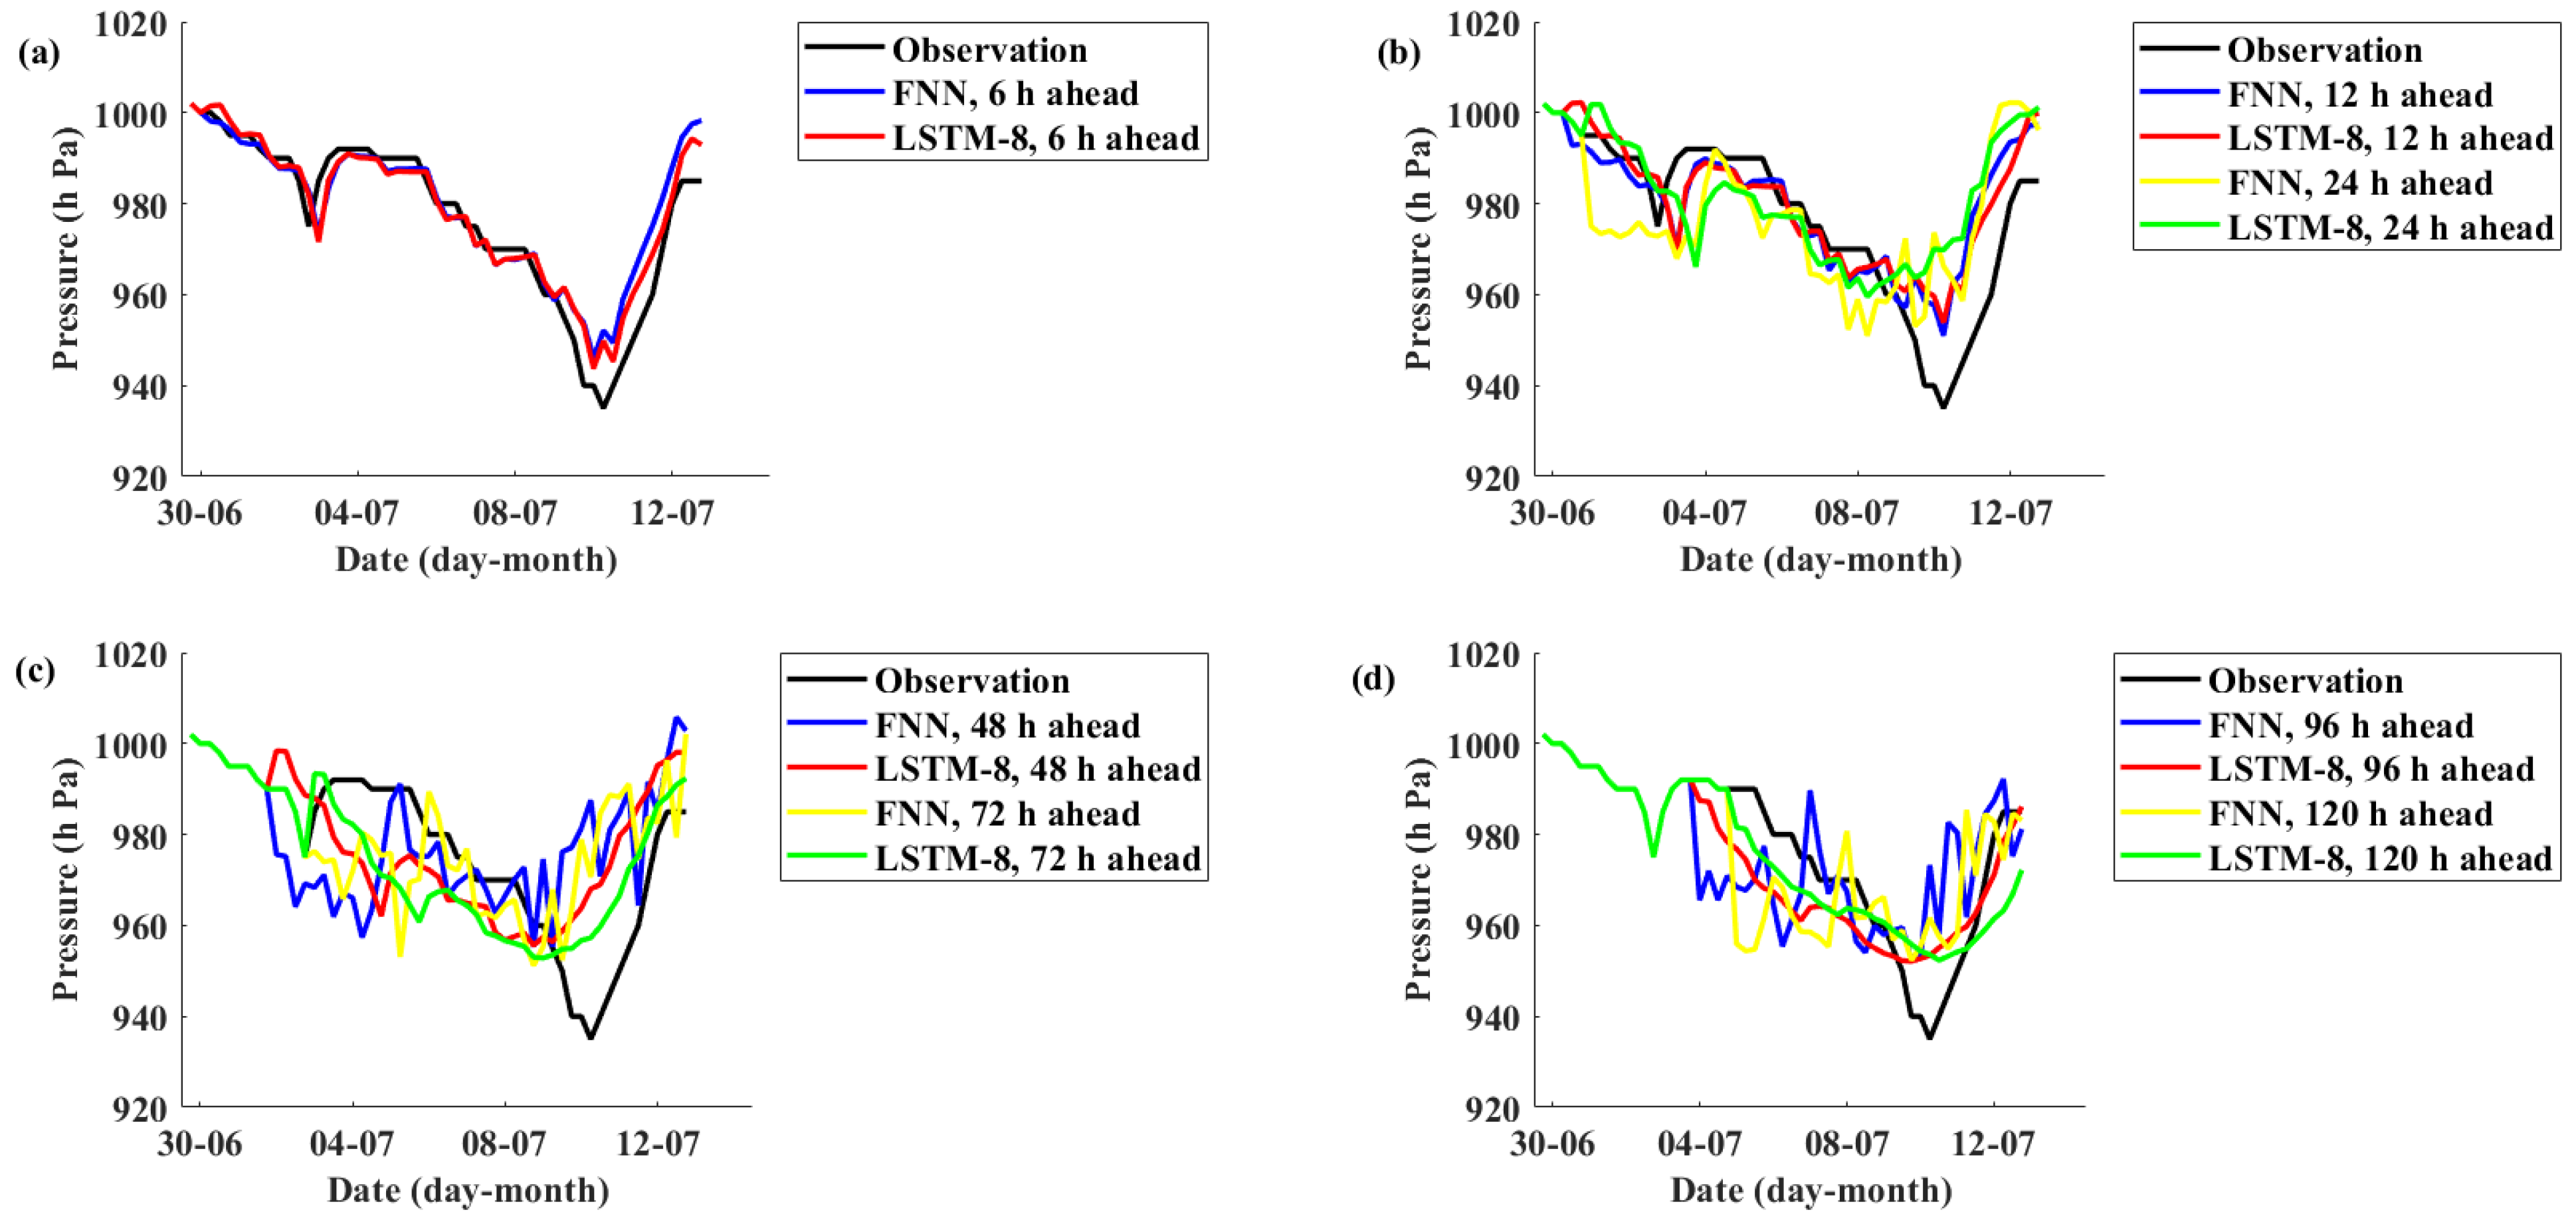
Figure 9 and Figure 10 show the pressure prediction curves and wind speed prediction curves of the models based on LSTM and the FNN on typhoon Chan-hom (2015). Figure 9a shows the pressure prediction curves of the models with a lead time of 6 h; Figure 9b shows the pressure prediction curves of the models with lead times of 12 and 24 h; Figure 9c shows the pressure prediction curves of the models with lead times of 48 and 72 h; Figure 9d shows the pressure prediction curves of the models with lead times of 96 and 120 h. Figure 10a–d shows the wind speed prediction curves of the models with lead times of 6 h, 12 and 24 h, 48 and 72 h, and 96 and 120 h, respectively. In general, the prediction curves of the LSTM model are closer to the observation curve than those of the FNN model, especially with a lead time of more than 48 h. The uncertainties and prediction curves of the models based on LSTM and FNN on typhoon Soudelor (2015) are similar as these models on Chan-hom (2015), so the discussions about Soudelor (2015) are not shown. As per the results, the model based on LSTM is more stable and has lower uncertainties, so the performance of the model based on LSTM is better.
6. Conclusions
When a typhoon arrives, it can bring with it huge losses to the lives and property of people. Improving the prediction results of typhoon intensity, such as accurate and timely typhoon intensity forecasting for as long as 120 h, remains a challenge. As shown by existing studies, suitable prediction factors can improve the prediction results, while more or fewer prediction factors could lead to worse prediction results. Moreover, the prediction model based on an FNN shows a limited ability for typhoon forecasting with a longer lead time of more than 48 h. Therefore, some prediction models based on LSTM are designed to determine the optimal prediction factors. Then, with the optimal prediction factors, one of the models based on LSTM is validated using the typhoon cases Chan-hom and Soudelor in 2015, compared to the FNN model using the same prediction factors. During all of the experiments, the typhoon intensity forecasting was studied as a time series problem based on historical typhoon data and LSTM.
As per the results, for typhoon intensity forecasting, the suitable and effective prediction factors can easily obtain better prediction results. The prediction factors containing the maximum wind speed and the minimum pressure near the typhoon’s center, as well as the latitude and longitude of the typhoon’s center at the current time and in the previous 6 h are enough to forecast typhoon intensity with lead times of 6, 12, 24, 48, 72, 96, and 120 h. Compared to the FNN model, the LSTM model shows better prediction ability, has lower uncertainties and smaller prediction errors, and is practical and more stable even for newer typhoon cases. It is very meaningful and practical to study typhoon intensity forecasting as a time series problem, as well as with a long lead time of more than 48 h. The application and findings of this study may be helpful and meaningful for engineering modeling, typhoon forecasting, and research of numerical models. In future work, more experiments and methods will be considered to make the future experiments of typhoon intensity forecasting better in terms of being more timely and accurate.
Author Contributions
C.W. wrote the original manuscript, designed the typhoon intensity forecasting models, and performed the experiments and validation; B.M. and S.Y. supported the project and reviewed and edited the manuscript; F.Z. and W.D. provided help and support as experts in the area of atmosphere, including the research of typhoon predictability. All authors read and agreed to the published version of the manuscript.
Funding
This study was supported by the National Key Research and Development Program of China (Grant Number 2020YFA0608002; 2018YFC1506402), the Shanghai 2020 “Science and Technology Innovation Action Plan” for Social Development (Grant Number 20dz1200702), the National Natural Science Foundation of China (Grant Number 42075141), and the Fundamental Research Funds for the Central Universities (Grant Number 22120190207).
Institutional Review Board Statement
Not applicable. Any human or animals were not used for the experiments of this paper.
Informed Consent Statement
Informed consent was obtained from all subjects involved in the study.
Data Availability Statement
The data used to support the findings of this study are available from the corresponding author upon request.
Conflicts of Interest
The authors declare no conflict of interest.
References
- Huo, Z.; Duan, W.; Zhou, F. Ensemble Forecastings of Tropical Cyclone Track with Orthogonal Conditional Nonlinear Optimal Perturbations. Adv. Atmos. Sci. 2019, 36, 231–247. [Google Scholar] [CrossRef]
- Jiang, G.; Xu, J.; Wei, J. A Deep Learning Algorithm of Neural Network for the Parameterization of Typhoon-Ocean Feedback in Typhoon Forecast Models. Geophys. Res. Lett. 2018, 45. [Google Scholar] [CrossRef] [Green Version]
- Japan Meteorological Agency. Available online: http://www.jma.go.jp/jma/en/NMHS/indexe_nmhs.html (accessed on 14 January 2021).
- National Hurricane Center. Available online: https://www.nhc.noaa.gov/modelsummary.shtml (accessed on 14 January 2021).
- Sobrevilla, K.L.M.D.; Reyes, E.O.; Hendrickx, C.A.; Yao, S.S. Typhoon Forecasting in the Philippines Using an Optimal Multilayer Feedforward Artificial Neural Network Model Trained in Resilient Propagation Algorithm. In Proceedings of the 2016 IEEE Region 10 Conference (TENCON), Singapore, 22–25 November 2016. [Google Scholar] [CrossRef]
- Wang, R.; Wang, T.; Zhang, X.; Fang, Q.; Wu, C.; Zhang, B. An Artificial Neural Network Model for Predicting Typhoon Intensity and Its Application. In LSMS/ICSEE 2017, Part III, CCIS 763; Li, K., Xue, Y., Cui, S., Niu, Q., Yang, Z., Luk, P., Eds.; Springer Nature Singapore Pte Ltd.: Singapore, 2017; pp. 762–770. [Google Scholar] [CrossRef]
- Kim, S.; Matsumi, Y.; Pan, S.; Mase, H. A real-time forecast model using artificial neural network for after-runner storm surges on the Tottori coast, Japan. Ocean. Eng. 2016, 122, 44–53. [Google Scholar] [CrossRef]
- Huang, Y.; Jin, L.; Zhao, H.; Huang, X. Fuzzy neural network and LLE Algorithm for forecasting precipitation in tropical cyclones: Comparisons with interpolation method by ECMWF and stepwise regression method. Nat. Hazards 2018, 91, 201–220. [Google Scholar] [CrossRef]
- Shao, L.; Fu, G.; Chao, X.; Zhou, J. Application of BP neural network to forecasting typhoon tracks. J. Nat. Disasters 2009, 18. (In Chinese) [Google Scholar] [CrossRef]
- Wei, C.-C.; Peng, P.-C.; Tsai, C.-H.; Huang, C.-L. Regional Forecasting of Wind Speeds during Typhoon Landfall in Taiwan: A Case Study of Westward-Moving Typhoons. Atmosphere 2018, 9, 141. [Google Scholar] [CrossRef] [Green Version]
- Lu, D.; Wang, X.; He, X. Hybrid population particle algorithm and multi-quantile robust extreme learning machine based short-term wind speed forecasting. Power Syst. Prot. Control. 2019, 47. (In Chinese) [Google Scholar] [CrossRef]
- Zhang, Y.; Yang, S.; Guo, Z.; Guo, Y.; Zhao, J. Wind speed forecasting based on wavelet decomposition and wavelet neural networks optimized by the Cuckoo search algorithm. Atmos. Ocean. Sci. Lett. 2019, 12, 107–115. [Google Scholar] [CrossRef] [Green Version]
- Khelil, K.; Berrezzek, F.; Bouadjila, T. GA-based design of optimal discrete wavelet filters for efficient wind speed forecasting. Neural Comput. Appl. 2020, 1–14. [Google Scholar] [CrossRef]
- Li, Y.; Yang, R.; Yang, C.; Yu, M.; Hu, F.; Jiang, Y. Leveraging LSTM for rapid intensifications prediction of tropical cyclones. In Proceedings of the 2nd International Symposium on Spatiotemporal Computing, Cambridge, MA, USA, 7–9 August 2017. [Google Scholar] [CrossRef] [Green Version]
- Xu, G.; Liu, Y. Application of LSTM in Typhoon Path Prediction. Jisuanji Yu Xiandaihua 2019, 5. (In Chinese) [Google Scholar] [CrossRef]
- Gao, S.; Zhao, P.; Pan, B.; Li, Y.; Zhou, M.; Xu, J.; Zhong, S. A nowcasting model for the prediction of typhoon tracks based on a long short term memory neural network. Acta Oceanol. Sin. 2018, 37, 8–12. [Google Scholar] [CrossRef]
- Wei, Y.; Xu, X. Ultra-short-term wind speed prediction model using LSTM networks. J. Electron. Meas. Instrum. 2019, 33. (In Chinese) [Google Scholar] [CrossRef]
- Yin, H.; Huang, S.Q.; Liu, Z.; Meng, A.B.; Yang, L. Short-term wind speed prediction based on fuzzy information granulation and LSTM. Electr. Meas. Instrum. 2019, 56. (In Chinese) [Google Scholar] [CrossRef]
- Memarzadeh, G.; Keynia, F. A new short-term wind speed forecasting method based on fine-tuned LSTM neural network and optimal input sets. Energy Convers. Manag. 2020, 213. [Google Scholar] [CrossRef]
- Liao, X.; Liu, Z.; Deng, W. Short-term wind speed multistep combined forecasting model based on two-stage decomposition and LSTM. Wind Energy 2021, 1–22. [Google Scholar] [CrossRef]
- Chen, R.; Wang, X.; Zhang, W.; Zhu, X.; Li, A.; Yang, C. A hybrid CNN-LSTM model for typhoon formation forecasting. Geoinformatica 2019, 23, 375–396. [Google Scholar] [CrossRef]
- Ying, M.; Zhang, W.; Yu, H.; Lu, X.; Feng, J.; Fan, Y.; Zhu, Y.; Chen, D. An overview of the china meteorological administration tropical cyclone database. J. Atmos. Oceanic Technol. 2014, 31, 287–301. [Google Scholar] [CrossRef] [Green Version]
- Yuan, S.; Luo, X.; Mu, B.; Li, J.; Dai, G. Prediction of North Atlantic Oscillation Index with Convolutional LSTM Based on Ensemble Empirical Mode Decomposition. Atmosphere 2019, 10, 252. [Google Scholar] [CrossRef] [Green Version]
- Mu, B.; Peng, C.; Yuan, S.; Chen, L. ENSO Forecasting over Multiple Time Horizons Using ConvLSTM Network and Rolling Mechanism. In Proceedings of the IJCNN, Budapest, Hungary, 14–19 July 2019. [Google Scholar]
- Mu, B.; Li, J.; Yuan, S.; Luo, X.; Dai, G. NAO Index Prediction using LSTM and ConvLSTM Networks Coupled with Discrete Wavelet Transform. In Proceedings of the IJCNN, Budapest, Hungary, 14–19 July 2019. [Google Scholar]
- Horinik, K.; Stinchcombe, M.; White, H. Multilayer Feedforward Networks are Universal Approximators. Neural Netw. 1989, 2, 359–366. [Google Scholar] [CrossRef]
- Nakisa, B.; Rastgoo, M.N.; Rakotonirainy, A.; Maire, F.; Chandran, V. Long Short Term Memory Hyperparameter Optimization for a Neural Network Based Emotion Recognition Framework. IEEE Access 2018, 6, 49325–49338. [Google Scholar] [CrossRef]
- Neshat, M.; Abbasnejad, E.; Shi, Q.; Alexander, B.; Wagner, M. Adaptive Neuro-Surrogate-Based Optimisation Method for Wave Energy Converters Placement Optimisation. In Proceedings of the International Conference on Neural Information Processing (ICONIP), Sydney, Australia, 12–15 December 2019. [Google Scholar] [CrossRef] [Green Version]
- Abbasimehr, H.; Shabani, M.; Yoousefi, M. An optimized model using LSTM network for demand forecasting. Comput. Ind. Eng. 2020, 143. [Google Scholar] [CrossRef]
Figure 1.
The number of typhoons recorded from 2000 to 2019. TY, typhoon; STY, strong typhoon; super TY, super typhoon.
Figure 1.
The number of typhoons recorded from 2000 to 2019. TY, typhoon; STY, strong typhoon; super TY, super typhoon.

Figure 2.
The processes of the rolling forecasting and ensemble forecasting methods.

Figure 3.
The typhoon intensity forecasting models based on LSTM and the feed-forward neural network (FNN).
Figure 3.
The typhoon intensity forecasting models based on LSTM and the feed-forward neural network (FNN).

Figure 4.
The structure of typhoon intensity forecasting experiments.

Figure 5.
The evaluation indicators of the model based on an FNN and LSTM on the test set.

Figure 6.
The prediction curves of the models based on LSTM and the FNN on test sets of 6, 12, 24 and 48 h ahead.
Figure 6.
The prediction curves of the models based on LSTM and the FNN on test sets of 6, 12, 24 and 48 h ahead.

Figure 7.
The prediction curves of the models based on LSTM and the FNN on test sets of 72, 96 and 120 h ahead.
Figure 7.
The prediction curves of the models based on LSTM and the FNN on test sets of 72, 96 and 120 h ahead.

Figure 8.
The evaluation indicators of the model based on an FNN and LSTM using the typhoon Chan-hom (2015).
Figure 8.
The evaluation indicators of the model based on an FNN and LSTM using the typhoon Chan-hom (2015).

Figure 9.
The pressure prediction curves of the models based on an FNN and LSTM on typhoon Chan-hom (2015).
Figure 9.
The pressure prediction curves of the models based on an FNN and LSTM on typhoon Chan-hom (2015).

Figure 10.
The wind speed prediction curves of the models based on an FNN and LSTM on typhoon Chan-hom (2015).
Figure 10.
The wind speed prediction curves of the models based on an FNN and LSTM on typhoon Chan-hom (2015).


Table 1.
The data of each typhoon case.
| Date (YYYYMMDDHH) | Intensity Level | Latitude | Longitude | Minimum Pressure (h Pa) | Maximum Wind Speed (m/s) |
|---|---|---|---|---|---|
| 2015063000 | 1 | 95 | 1607 | 1000 | 15 |
| 2015063006 | 1 | 98 | 1601 | 1000 | 15 |
| 2015063012 | 2 | 100 | 1595 | 998 | 18 |
| 2015063018 | 2 | 101 | 1587 | 995 | 20 |
| 2015070100 | 2 | 105 | 1575 | 995 | 20 |
| 2015070106 | 2 | 110 | 1566 | 995 | 20 |
| 2015070112 | 2 | 113 | 1556 | 992 | 23 |
| 2015070118 | 3 | 113 | 1543 | 990 | 25 |
| 2015070200 | 3 | 111 | 1528 | 990 | 25 |
Table 2.
Descriptive statistics of the variables based on the processed typhoon data for training and testing. P, minimum pressure of the typhoon’s center; WS, maximum wind speed of the typhoon’s center; Lat, latitude of the of the typhoon’s center; Lon, longitude of the typhoon’s center; MS, moving speed of the typhoon.
| Statistics | P (h Pa) | WS (m/s) | Lat | Lon | MS (km/h) | |||||
|---|---|---|---|---|---|---|---|---|---|---|
| Train | Test | Train | Test | Train | Test | Train | Test | Train | Test | |
| No. | 5394 | 2308 | 5394 | 2308 | 5394 | 2308 | 5394 | 2308 | 5258 | 2251 |
| Max | 1010 | 1012 | 65 | 78 | 519 | 537 | 2029 | 2260 | 81.54 | 80.64 |
| Min | 910 | 888 | 10 | 8 | 48 | 28 | 1008 | 1023 | 0 | 0 |
| Mean | 977.77 | 975.91 | 29.31 | 30.26 | 212.1 | 206.24 | 1356.11 | 1345.11 | 12.28 | 12.39 |
Table 3.
The variables and predictors of the typhoon data set, where t is the current time, t-1 is the previous 6 h, t-2 is the previous 12 h, t-3 is the previous 18 h, and t-4 is the previous 24 h.
Table 3.
The variables and predictors of the typhoon data set, where t is the current time, t-1 is the previous 6 h, t-2 is the previous 12 h, t-3 is the previous 18 h, and t-4 is the previous 24 h.
| Variables | Time | ||||
|---|---|---|---|---|---|
| t | t-1 | t-2 | t-3 | t-4 | |
| P | P (t) | P (t-1) | P (t-2) | P (t-3) | P (t-4) |
| WS | WS (t) | WS (t-1) | WS (t-2) | WS (t-3) | WS (t-4) |
| Lat | Lat (t) | Lat (t-1) | Lat (t-2) | Lat (t-3) | Lat (t-4) |
| Lon | Lon (t) | Lon (t-1) | Lon (t-2) | Lon (t-3) | Lon (t-4) |
| MS | MS (t) | MS (t-1) | MS (t-2) | MS (t-3) | MS (t-4) |
Table 4.
The hyperparameters of the typhoon intensity forecasting models. MSE, mean squared error; LSTM, long short-term memory; FNN, feed-forward neural network.
Table 4.
The hyperparameters of the typhoon intensity forecasting models. MSE, mean squared error; LSTM, long short-term memory; FNN, feed-forward neural network.
| Hyperparameters | LSTM Models | FNN Model |
|---|---|---|
| Number of hidden layers | 1 | 1 |
| Number of prediction factors | n | n |
| Number of hidden layer neurons | 4*n | 4*n |
| Activation function of the hidden layer | Tanh | Sigmoid |
| Loss function | MSE | MSE |
| Maximum iteration step | 300 | 5000 |
| Optimizer | Adam | Default |
| Learning rate | 0.01 | 0.001 |
| Goal learning rate | Default | 0.0001 |
Table 5.
The typhoon intensity forecasting models and the function expression of it using the different prediction factors’ combination: minimum pressure of the typhoon center (P), maximum wind speed of the typhoon center (WS), latitude (Lat) and longitude (Lon) of the typhoon center, and moving speed of the typhoon (MS).
| Model | Function Expression |
|---|---|
| LSTM-1 | P(i+1), WS(t+i) = f[P(t+i-1), WS(t+i-1)] |
| LSTM-2 | P(t+i), WS(t+i) = f[P(t+i-1), WS(t+i-1), P(t+i-2), WS(t+i-2)] |
| LSTM-3 | P(t+i), WS(t+i), Lat(t+i) = f[P(t+i-1), WS(t+i-1), Lat(t+i-1)] |
| LSTM-4 | P(t+i), WS(t+i), Lat(t+i) = f[P(t+i-1), WS(t+i-1), Lat(t+i-1), P(t+i-2), WS(t+i-2), LAT(t+i-2)] |
| LSTM-5 | P(t+i), WS(t+i), Lon(t+i) = f[P(t+i-1), WS(t+i-1), Lon(t+i-1)] |
| LSTM-6 | P(t+i), WS(t+i), Lon(t+i) = f[P(t+i-1), WS(t+i-1), Lon(t+i-1), P(t+i-2), WS(t+i-2), Lon(t+i-2)] |
| LSTM-7 | P(t+i), WS(t+i), Lat(t+i), Lon(t+i) = f[P(t+i-1), WS(t+i-1), Lat(t+i-1), Lon(t+i-1)] |
| LSTM-8 | P(t+i), WS(t+i), Lat(t+i), Lon(t+i) = f[P(t+i-1), WS(t+i-1), Lat(t+i-1), Lon(t+i-1), |
| P(t+i-2), WS(t+i-2), Lat(t+i-2), Lon(t+i-2)] | |
| LSTM-9 | P(t+i), WS(t+i), Lat(t+i), Lon(t+i), MS(t+i) = f[P(t+i-1), WS(t+i-1), Lat(t+i-1), |
| Lon(t+i-1), MS(t+i-1)] | |
| LSTM-10 | P(t+i), WS(t+i), Lat(t+i), Lon(t+i), MS(t+i) = f[P(t+i-1), WS(t+i-1), Lat(t+i-1), |
| Lon(t+i-1), MS(t+i-1), P(t+i-2), WS(t+i-2), Lat(t+i-2), Lon(t+i-2), MS(t+i-2)] |
Table 6.
The MAE mean values of the LSTM models.
| Models | Pressure (Lead Time, h) | Wind Speed (Lead Time, h) | ||||||||||||
|---|---|---|---|---|---|---|---|---|---|---|---|---|---|---|
| 6 | 12 | 24 | 48 | 72 | 96 | 120 | 6 | 12 | 24 | 48 | 72 | 96 | 120 | |
| LSTM-1 | 4.02 | 7.14 | 12.24 | 19.65 | 24.18 | 26.23 | 26.04 | 2.26 | 4.11 | 7.17 | 11.71 | 14.43 | 15.53 | 15.3 |
| LSTM-2 | 3.44 | 6.07 | 11 | 18.15 | 22.44 | 24.64 | 25.09 | 1.95 | 3.43 | 6.31 | 10.62 | 13.1 | 14.3 | 14.52 |
| LSTM-3 | 3.85 | 6.46 | 10.59 | 16.45 | 20.4 | 23.02 | 24.17 | 2.16 | 3.61 | 6.01 | 9.44 | 11.65 | 13.03 | 13.79 |
| LSTM-4 | 3.42 | 5.74 | 9.87 | 15.49 | 18.9 | 21.42 | 23.6 | 1.89 | 3.15 | 5.45 | 8.81 | 10.82 | 12.34 | 13.7 |
| LSTM-5 | 4.02 | 7.04 | 11.75 | 18.02 | 21.49 | 22.78 | 22.41 | 2.28 | 4.06 | 6.92 | 10.78 | 12.76 | 13.39 | 13.12 |
| LSTM-6 | 3.35 | 5.73 | 10.09 | 16.1 | 19.6 | 21.23 | 21.38 | 1.9 | 3.3 | 5.9 | 9.56 | 11.5 | 12.31 | 12.38 |
| LSTM-7 | 3.72 | 6.11 | 9.84 | 14.76 | 17.68 | 19.57 | 22.54 | 2.06 | 3.37 | 5.52 | 8.36 | 9.95 | 11.13 | 12.42 |
| LSTM-8 | 3.33 | 5.38 | 8.67 | 12.46 | 14.78 | 17.35 | 20 | 1.84 | 2.98 | 4.87 | 7.12 | 8.5 | 9.99 | 11.57 |
| LSTM-9 | 3.79 | 6.27 | 10.1 | 15.19 | 17.94 | 19.28 | 23.74 | 2.09 | 3.46 | 5.67 | 8.71 | 10.34 | 11.27 | 12.49 |
| LSTM-10 | 3.42 | 5.55 | 8.93 | 12.71 | 15.19 | 18.08 | 20.85 | 1.9 | 3.09 | 5.03 | 7.32 | 8.78 | 10.41 | 11.91 |
Table 7.
The LSTM models using the prediction factors at the current time and in the previous 6, 12, and 18 h.
Table 7.
The LSTM models using the prediction factors at the current time and in the previous 6, 12, and 18 h.
| Model | Function Expression |
|---|---|
| LSTM-11 | P(t+i), WS(t+i), Lat(t+i), Lon(t+i)=f[P(t+i-1), WS(t+i-1), Lat(t+i-1), Lon(t+i-1), P(t+i-2), WS(t+i-2), Lat(t+i-2), Lon(t+i-2), |
| P(t+i-3), WS(t+i-3), Lat(t+i-3), Lon(t+i-3)] | |
| LSTM-12 | P(t+i), WS(t+i), Lat(t+i), Lon(t+i)=f[P(t+i-1), WS(t+i-1), Lat(t+i-1), Lon(t+i-1), P(t+i-2), WS(t+i-2), Lat(t+i-2), Lon(t+i-2), |
| P(t+i-3), WS(t+i-3), Lat(t+i-3), Lon(t+i-3), P(t+i-4), WS(t+i-4), Lat(t+i-4), Lon(t+i-4)] |
Table 8.
The MAE mean values of the LSTM models.
| Models | Pressure (Lead Time, h) | Wind Speed (Lead Time, h) | ||||||||||||
|---|---|---|---|---|---|---|---|---|---|---|---|---|---|---|
| 6 | 12 | 24 | 48 | 72 | 96 | 120 | 6 | 12 | 24 | 48 | 72 | 96 | 120 | |
| LSTM-8 | 3.33 | 5.38 | 8.67 | 12.46 | 14.78 | 17.35 | 20 | 1.84 | 2.98 | 4.87 | 7.12 | 8.5 | 9.99 | 11.57 |
| LSTM-11 | 3.4 | 5.52 | 9.14 | 14 | 16.63 | 18.48 | 19.64 | 1.96 | 3.16 | 5.32 | 8.14 | 9.53 | 10.47 | 11.14 |
| LSTM-12 | 3.41 | 5.46 | 8.93 | 14.07 | 16.88 | 18.16 | 18.83 | 1.95 | 3.13 | 5.29 | 8.41 | 9.94 | 10.58 | 10.89 |
Table 9.
The MAE and RMSE mean values of the LSTM model compared to the FNN model.
| Evaluation Indicators | Models | Pressure (Lead Time, h) | Wind Speed (Lead Time, h) | ||||||||||||
|---|---|---|---|---|---|---|---|---|---|---|---|---|---|---|---|
| 6 | 12 | 24 | 48 | 72 | 96 | 120 | 6 | 12 | 24 | 48 | 72 | 96 | 120 | ||
| MAE | FNN | 3.45 | 5.67 | 9.17 | 13.35 | 15.41 | 16.61 | 18.29 | 1.96 | 3.19 | 5.17 | 7.69 | 8.94 | 9.79 | 10.85 |
| LSTM-8 | 3.33 | 5.38 | 8.67 | 12.46 | 14.78 | 17.35 | 20 | 1.84 | 2.98 | 4.87 | 7.12 | 8.5 | 9.99 | 11.57 | |
| RMSE | FNN | 5.21 | 6.99 | 13.17 | 24.71 | 32.21 | 34.81 | 35.87 | 2.79 | 4.02 | 7.74 | 14.65 | 19.36 | 21.48 | 22.12 |
| LSTM-8 | 4.84 | 7.86 | 12.32 | 17.62 | 21.57 | 25.65 | 29.47 | 2.5 | 4.15 | 6.65 | 9.76 | 12.1 | 14.45 | 16.62 | |
Table 10.
The MAE mean values of the LSTM model compared to the FNN model.
| Typhoon Cases | Models | Pressure (Lead Time, h) | Wind Speed (Lead Time, h) | ||||||||||||
|---|---|---|---|---|---|---|---|---|---|---|---|---|---|---|---|
| 6 | 12 | 24 | 48 | 72 | 96 | 120 | 6 | 12 | 24 | 48 | 72 | 96 | 120 | ||
| Chan-hom | FNN | 7.17 | 9.99 | 14.29 | 20.83 | 18.98 | 17.18 | 19.31 | 4.25 | 6.24 | 8.05 | 11.37 | 8.89 | 8.11 | 8.44 |
| LSTM-8 | 4.04 | 8.21 | 13.02 | 13.73 | 9.99 | 7.54 | 15.47 | 2.59 | 4.97 | 7.86 | 8.46 | 5.86 | 3.79 | 8.94 | |
| Soudelor | FNN | 8.37 | 12.17 | 17.69 | 34.14 | 46.35 | 44.45 | 39.55 | 5.09 | 7.87 | 13.92 | 19.15 | 33 | 45.47 | 43.77 |
| LSTM-8 | 3.85 | 6.79 | 11.07 | 19.67 | 27.58 | 30.79 | 30.69 | 2.08 | 3.48 | 5.13 | 9.48 | 14.19 | 16.69 | 16.89 | |
Table 11.
The RMSE mean values of the LSTM model compared with the FNN model.
| Typhoon Cases | Models | Pressure (Lead Time, h) | Wind Speed (Lead Time, h) | ||||||||||||
|---|---|---|---|---|---|---|---|---|---|---|---|---|---|---|---|
| 6 | 12 | 24 | 48 | 72 | 96 | 120 | 6 | 12 | 24 | 48 | 72 | 96 | 120 | ||
| Chan-hom | FNN | 7.24 | 11.54 | 17.03 | 21.11 | 19.6 | 16.28 | 15.31 | 5.11 | 7.92 | 11.79 | 14 | 13.42 | 12.63 | 9.02 |
| LSTM-8 | 5.61 | 10.72 | 16.19 | 16.58 | 13.47 | 10.07 | 9.69 | 3.5 | 6.82 | 10.42 | 10.33 | 8.05 | 5.73 | 5.63 | |
| Soudelor | FNN | 11.25 | 16.75 | 24.33 | 43.24 | 52.81 | 51.67 | 47.53 | 7.63 | 11.84 | 22.67 | 27.72 | 40.48 | 50.21 | 49.06 |
| LSTM-8 | 5.33 | 9.33 | 15.29 | 25.59 | 33.68 | 36.28 | 33.55 | 2.84 | 4.62 | 7.13 | 12.6 | 17.58 | 19.71 | 18.89 | |
Publisher’s Note: MDPI stays neutral with regard to jurisdictional claims in published maps and institutional affiliations. |
© 2021 by the authors. Licensee MDPI, Basel, Switzerland. This article is an open access article distributed under the terms and conditions of the Creative Commons Attribution (CC BY) license (http://creativecommons.org/licenses/by/4.0/).
Share and Cite
MDPI and ACS Style
Yuan, S.; Wang, C.; Mu, B.; Zhou, F.; Duan, W. Typhoon Intensity Forecasting Based on LSTM Using the Rolling Forecast Method. Algorithms 2021, 14, 83. https://0-doi-org.brum.beds.ac.uk/10.3390/a14030083
AMA Style
Yuan S, Wang C, Mu B, Zhou F, Duan W. Typhoon Intensity Forecasting Based on LSTM Using the Rolling Forecast Method. Algorithms. 2021; 14(3):83. https://0-doi-org.brum.beds.ac.uk/10.3390/a14030083
Chicago/Turabian StyleYuan, Shijin, Cheng Wang, Bin Mu, Feifan Zhou, and Wansuo Duan. 2021. "Typhoon Intensity Forecasting Based on LSTM Using the Rolling Forecast Method" Algorithms 14, no. 3: 83. https://0-doi-org.brum.beds.ac.uk/10.3390/a14030083
Note that from the first issue of 2016, this journal uses article numbers instead of page numbers. See further details here.