
Short Communication: Detecting Heavy Goods Vehicles in Rest Areas in Winter Conditions Using YOLOv5

 ,
,
Abstract
:1. Introduction
2. Materials and Methods
2.1. Selection of Algorithm
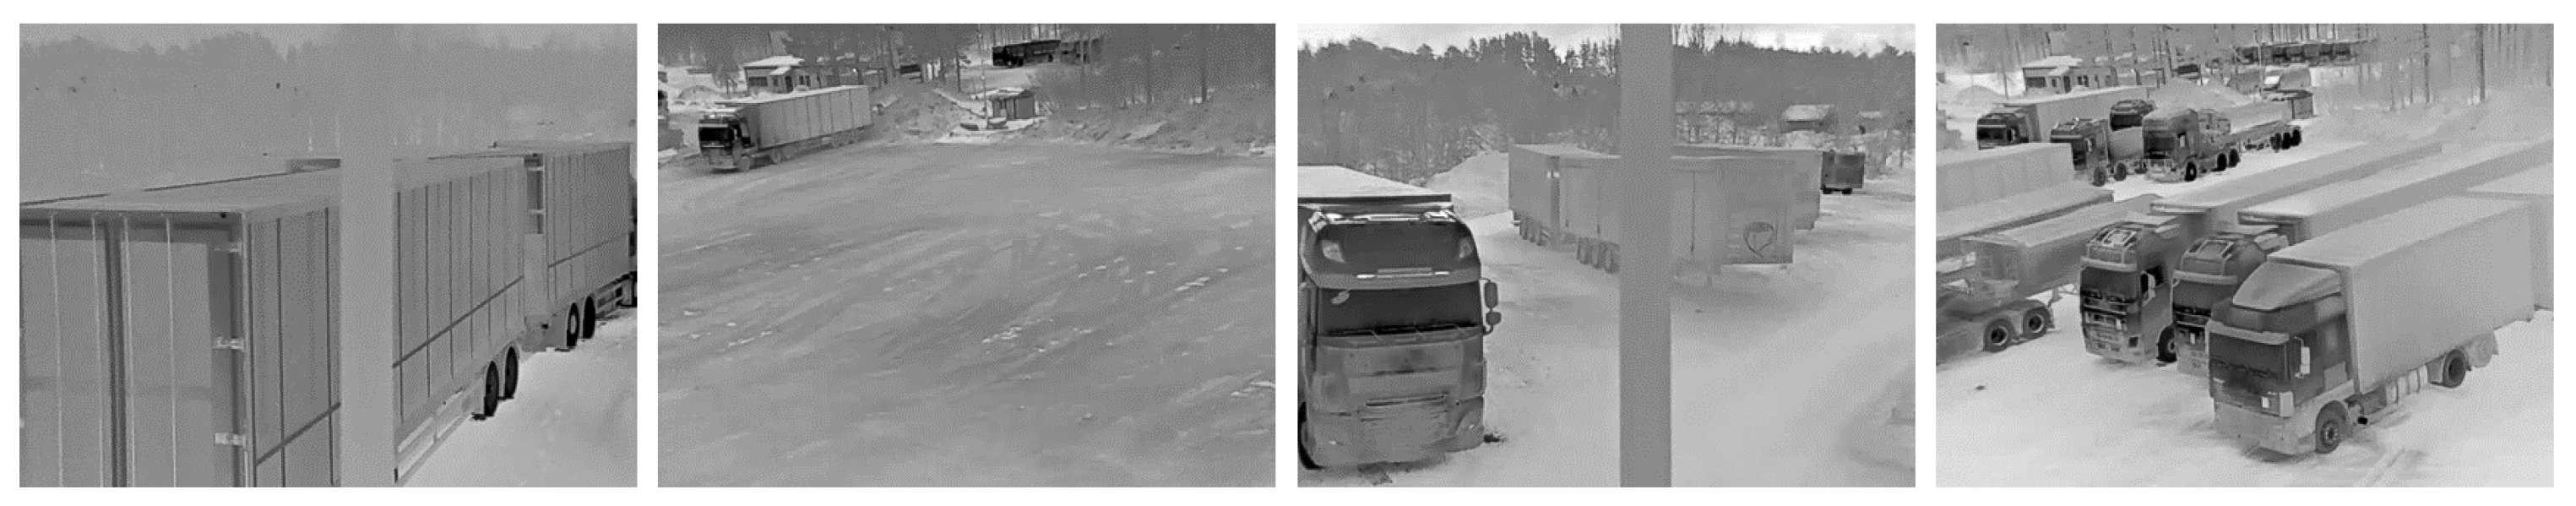
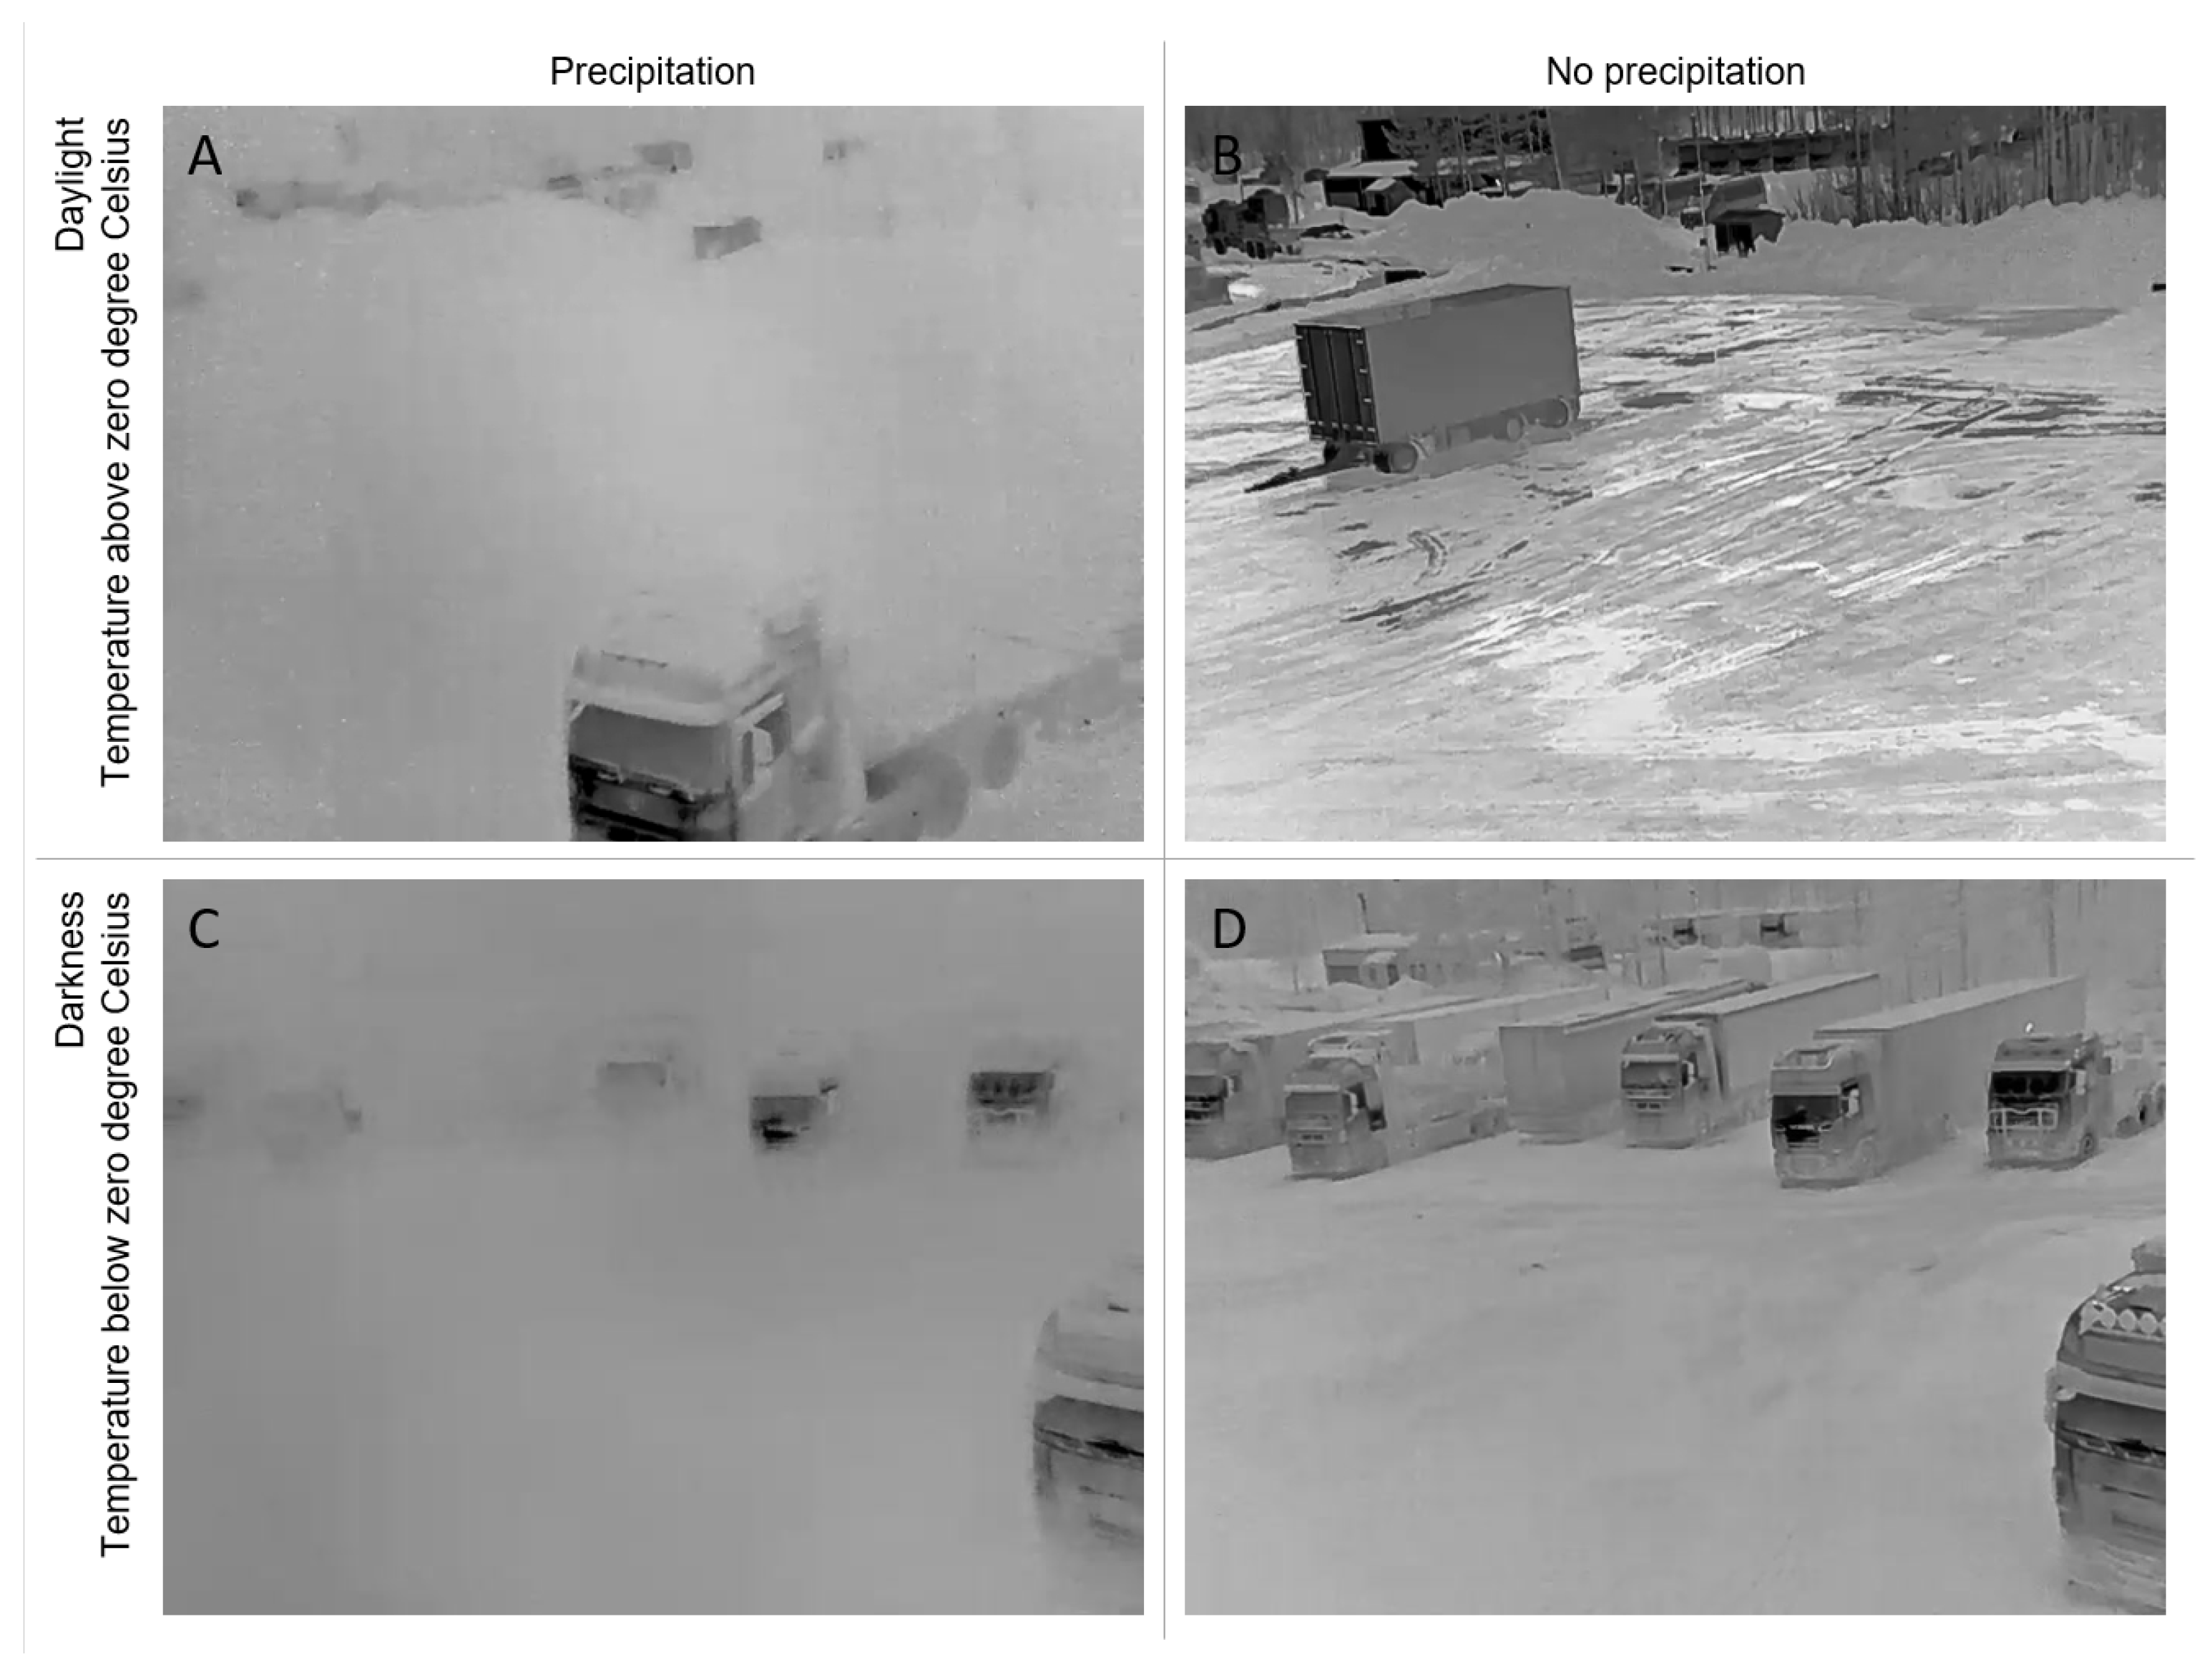
2.2. The Rest Area Dataset
3. Experiments
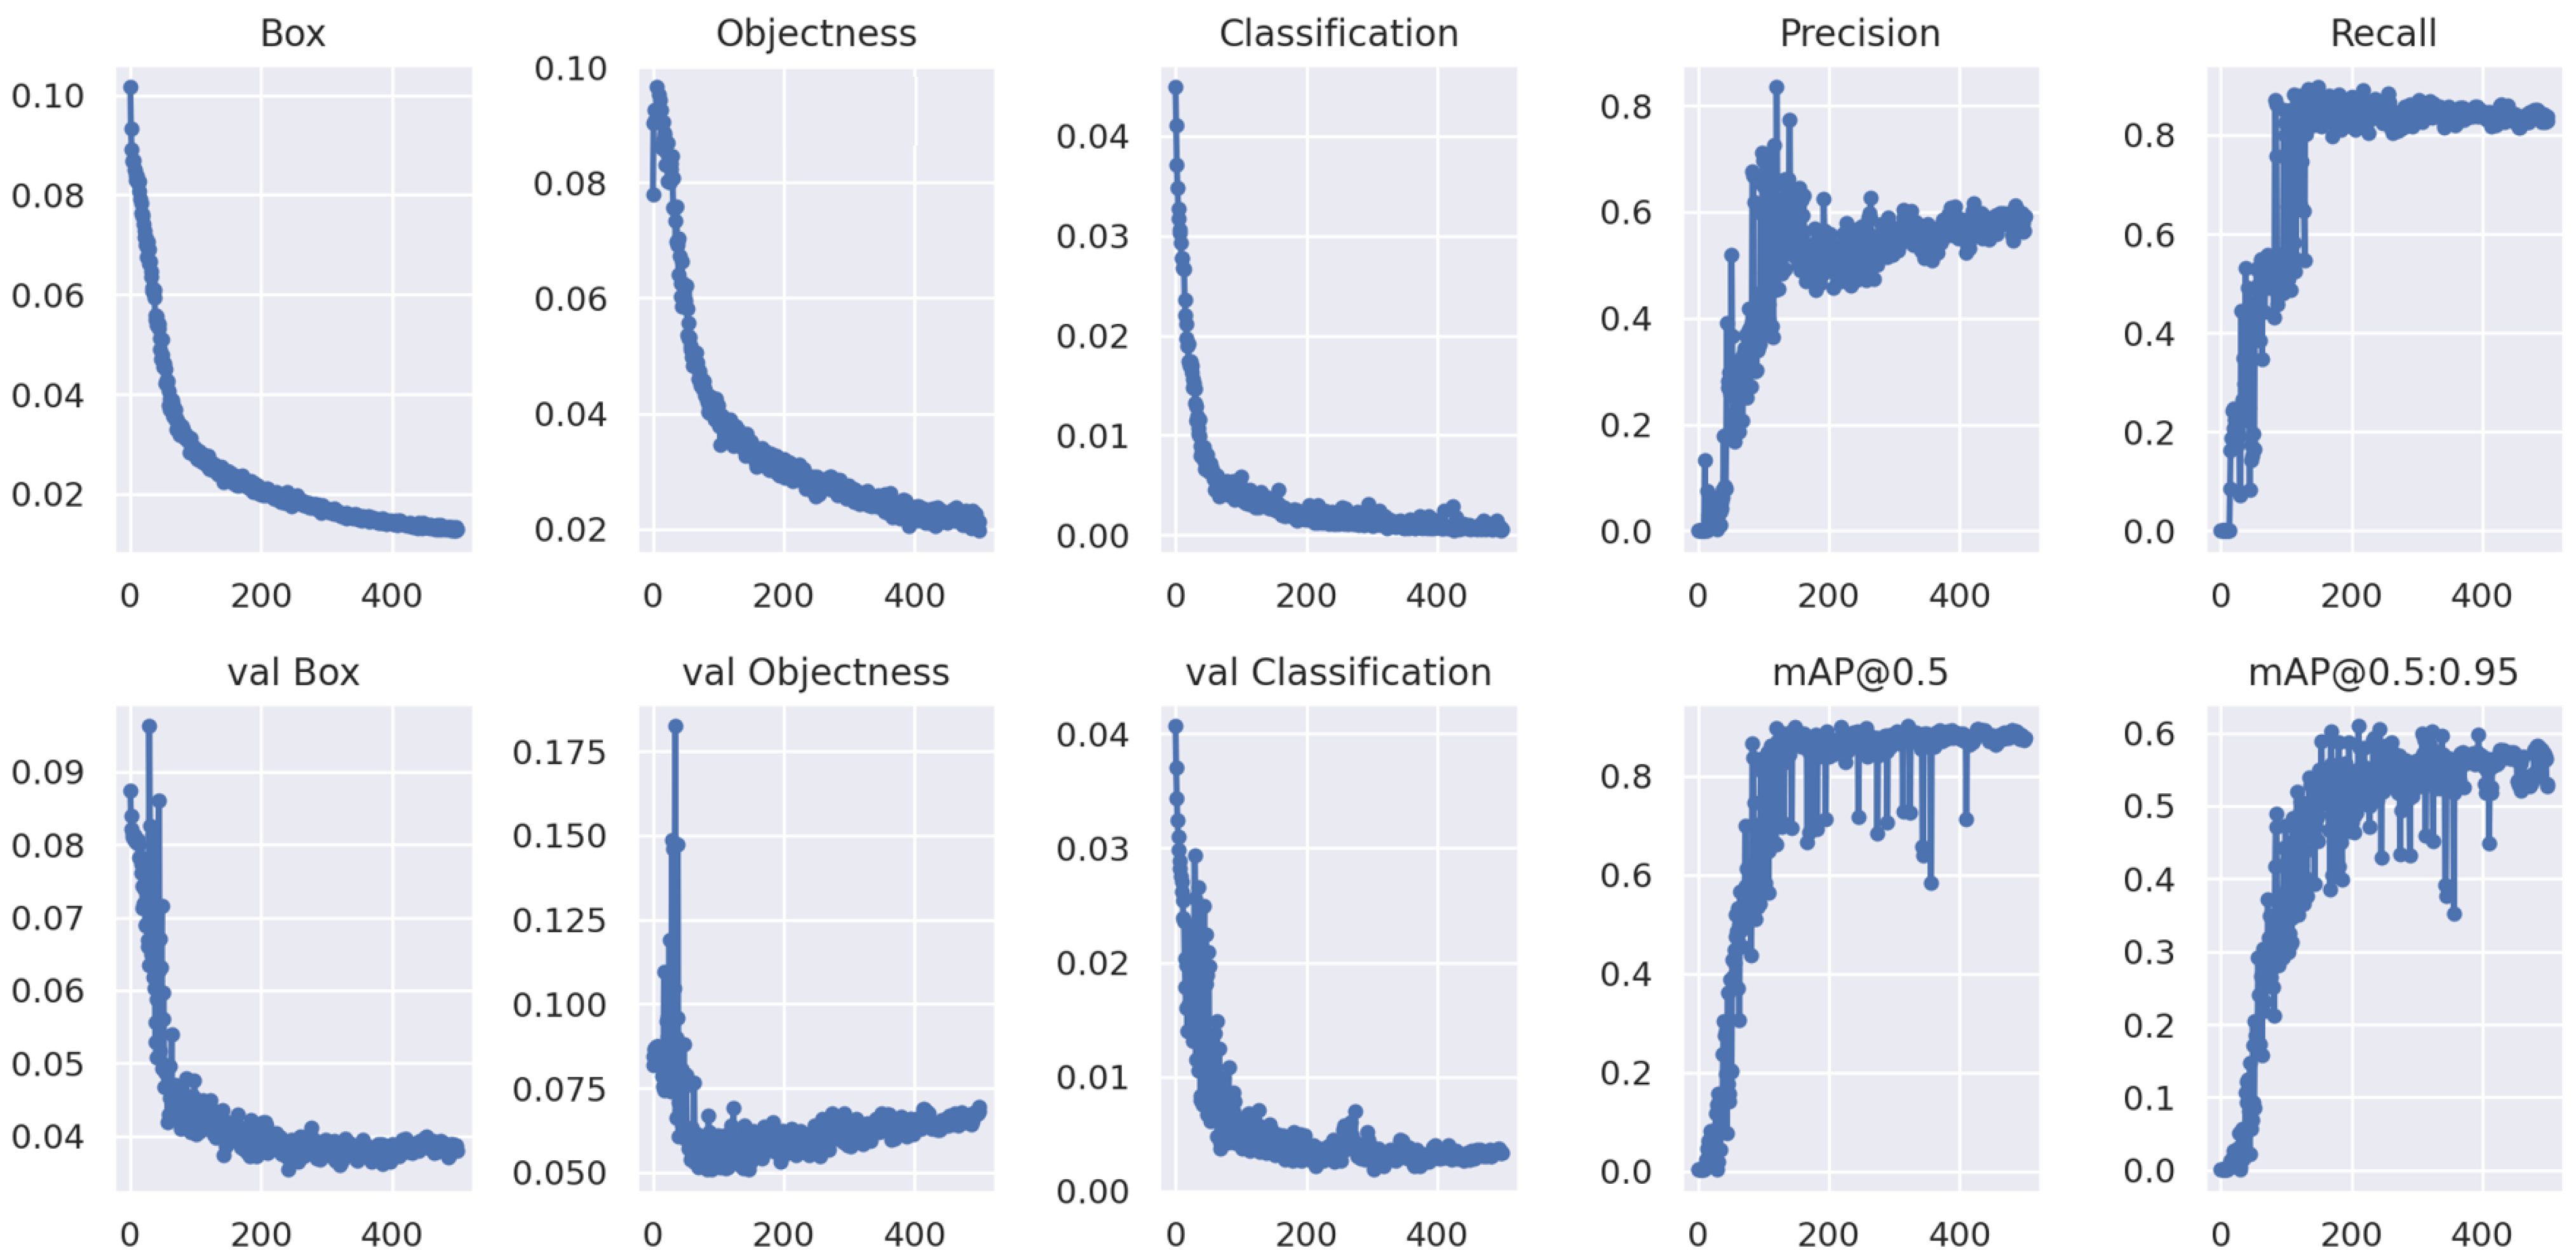
3.1. Training
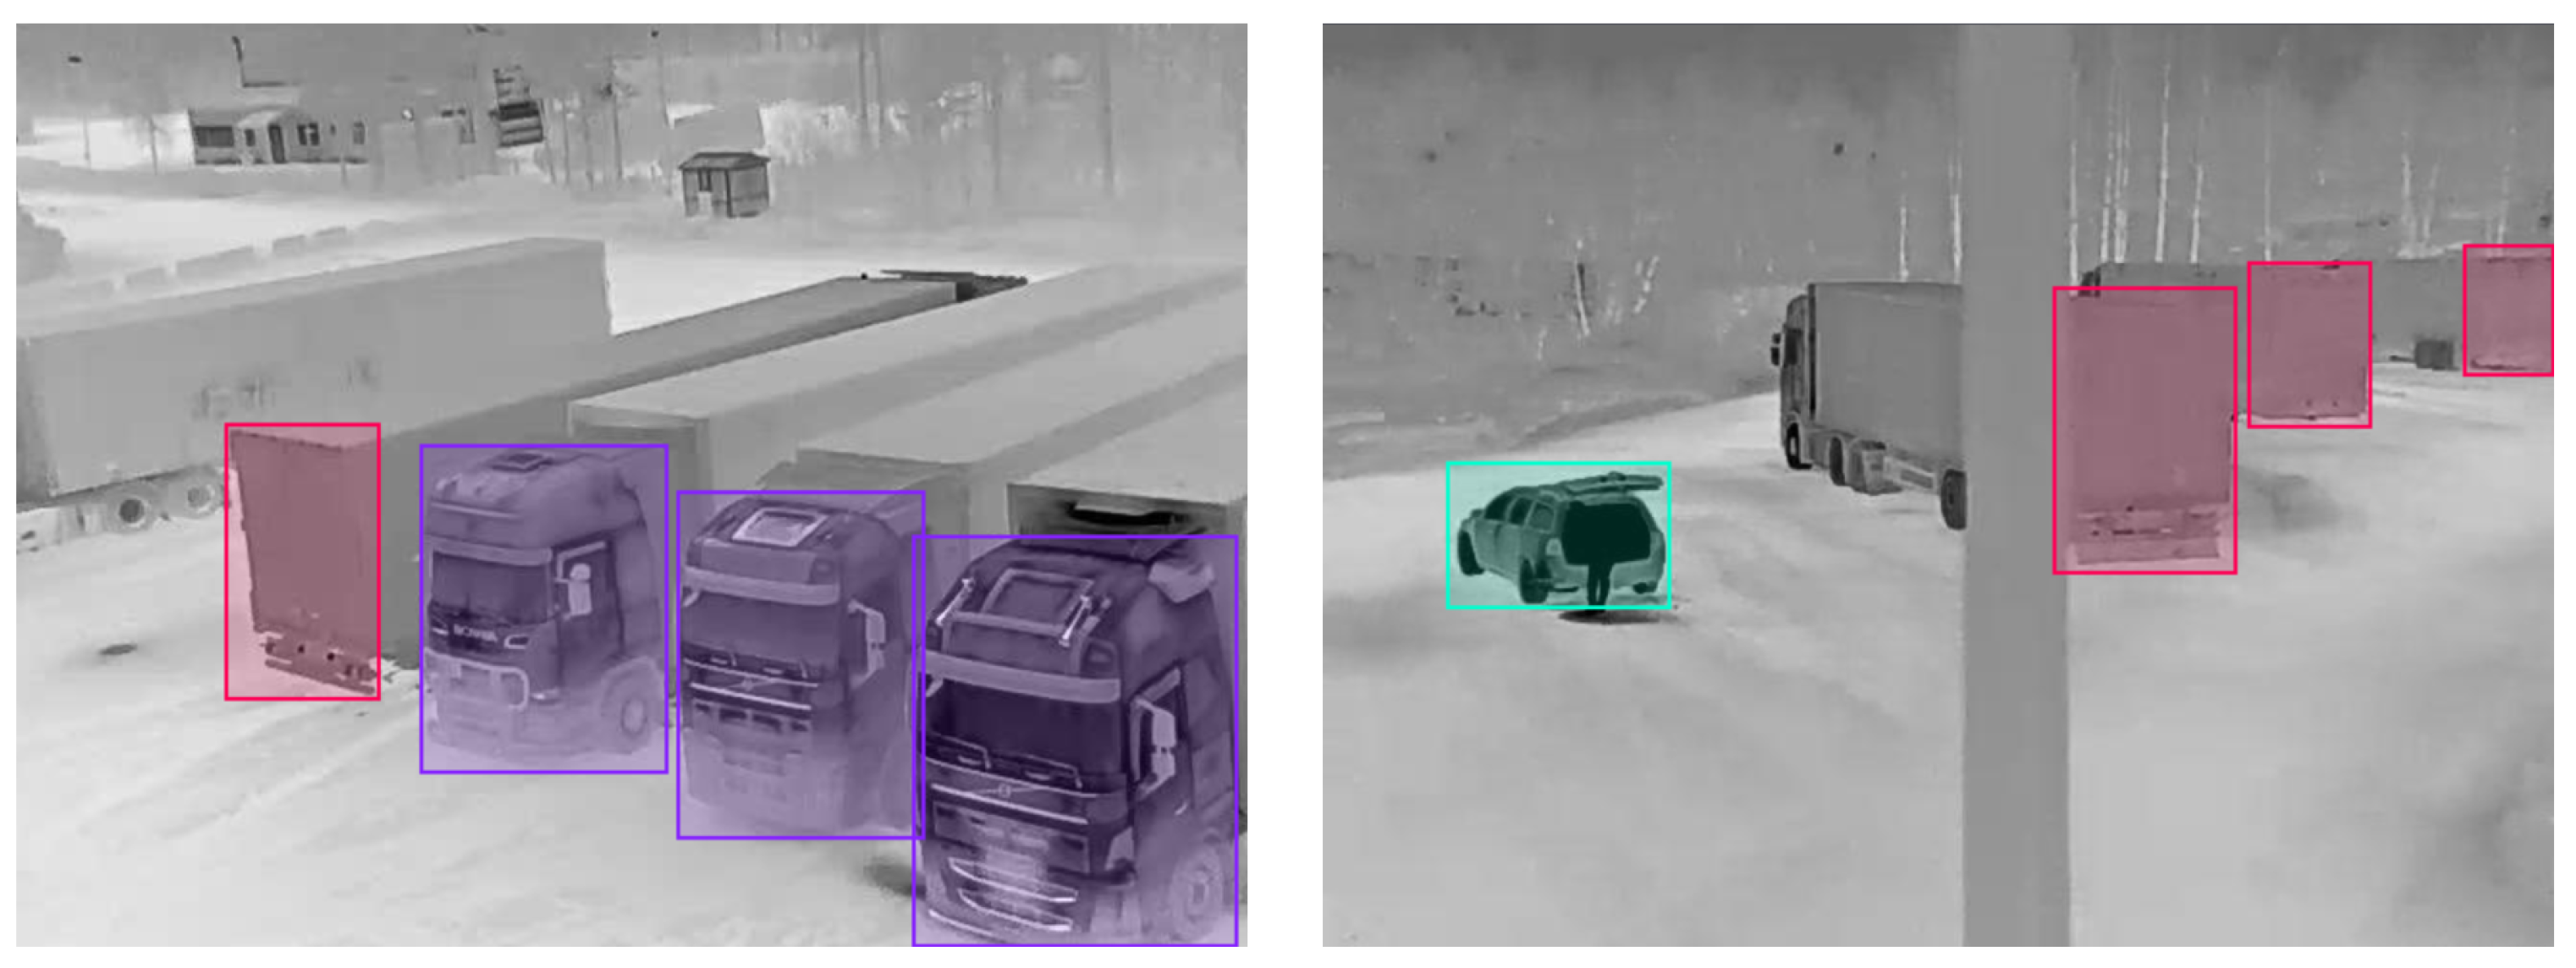
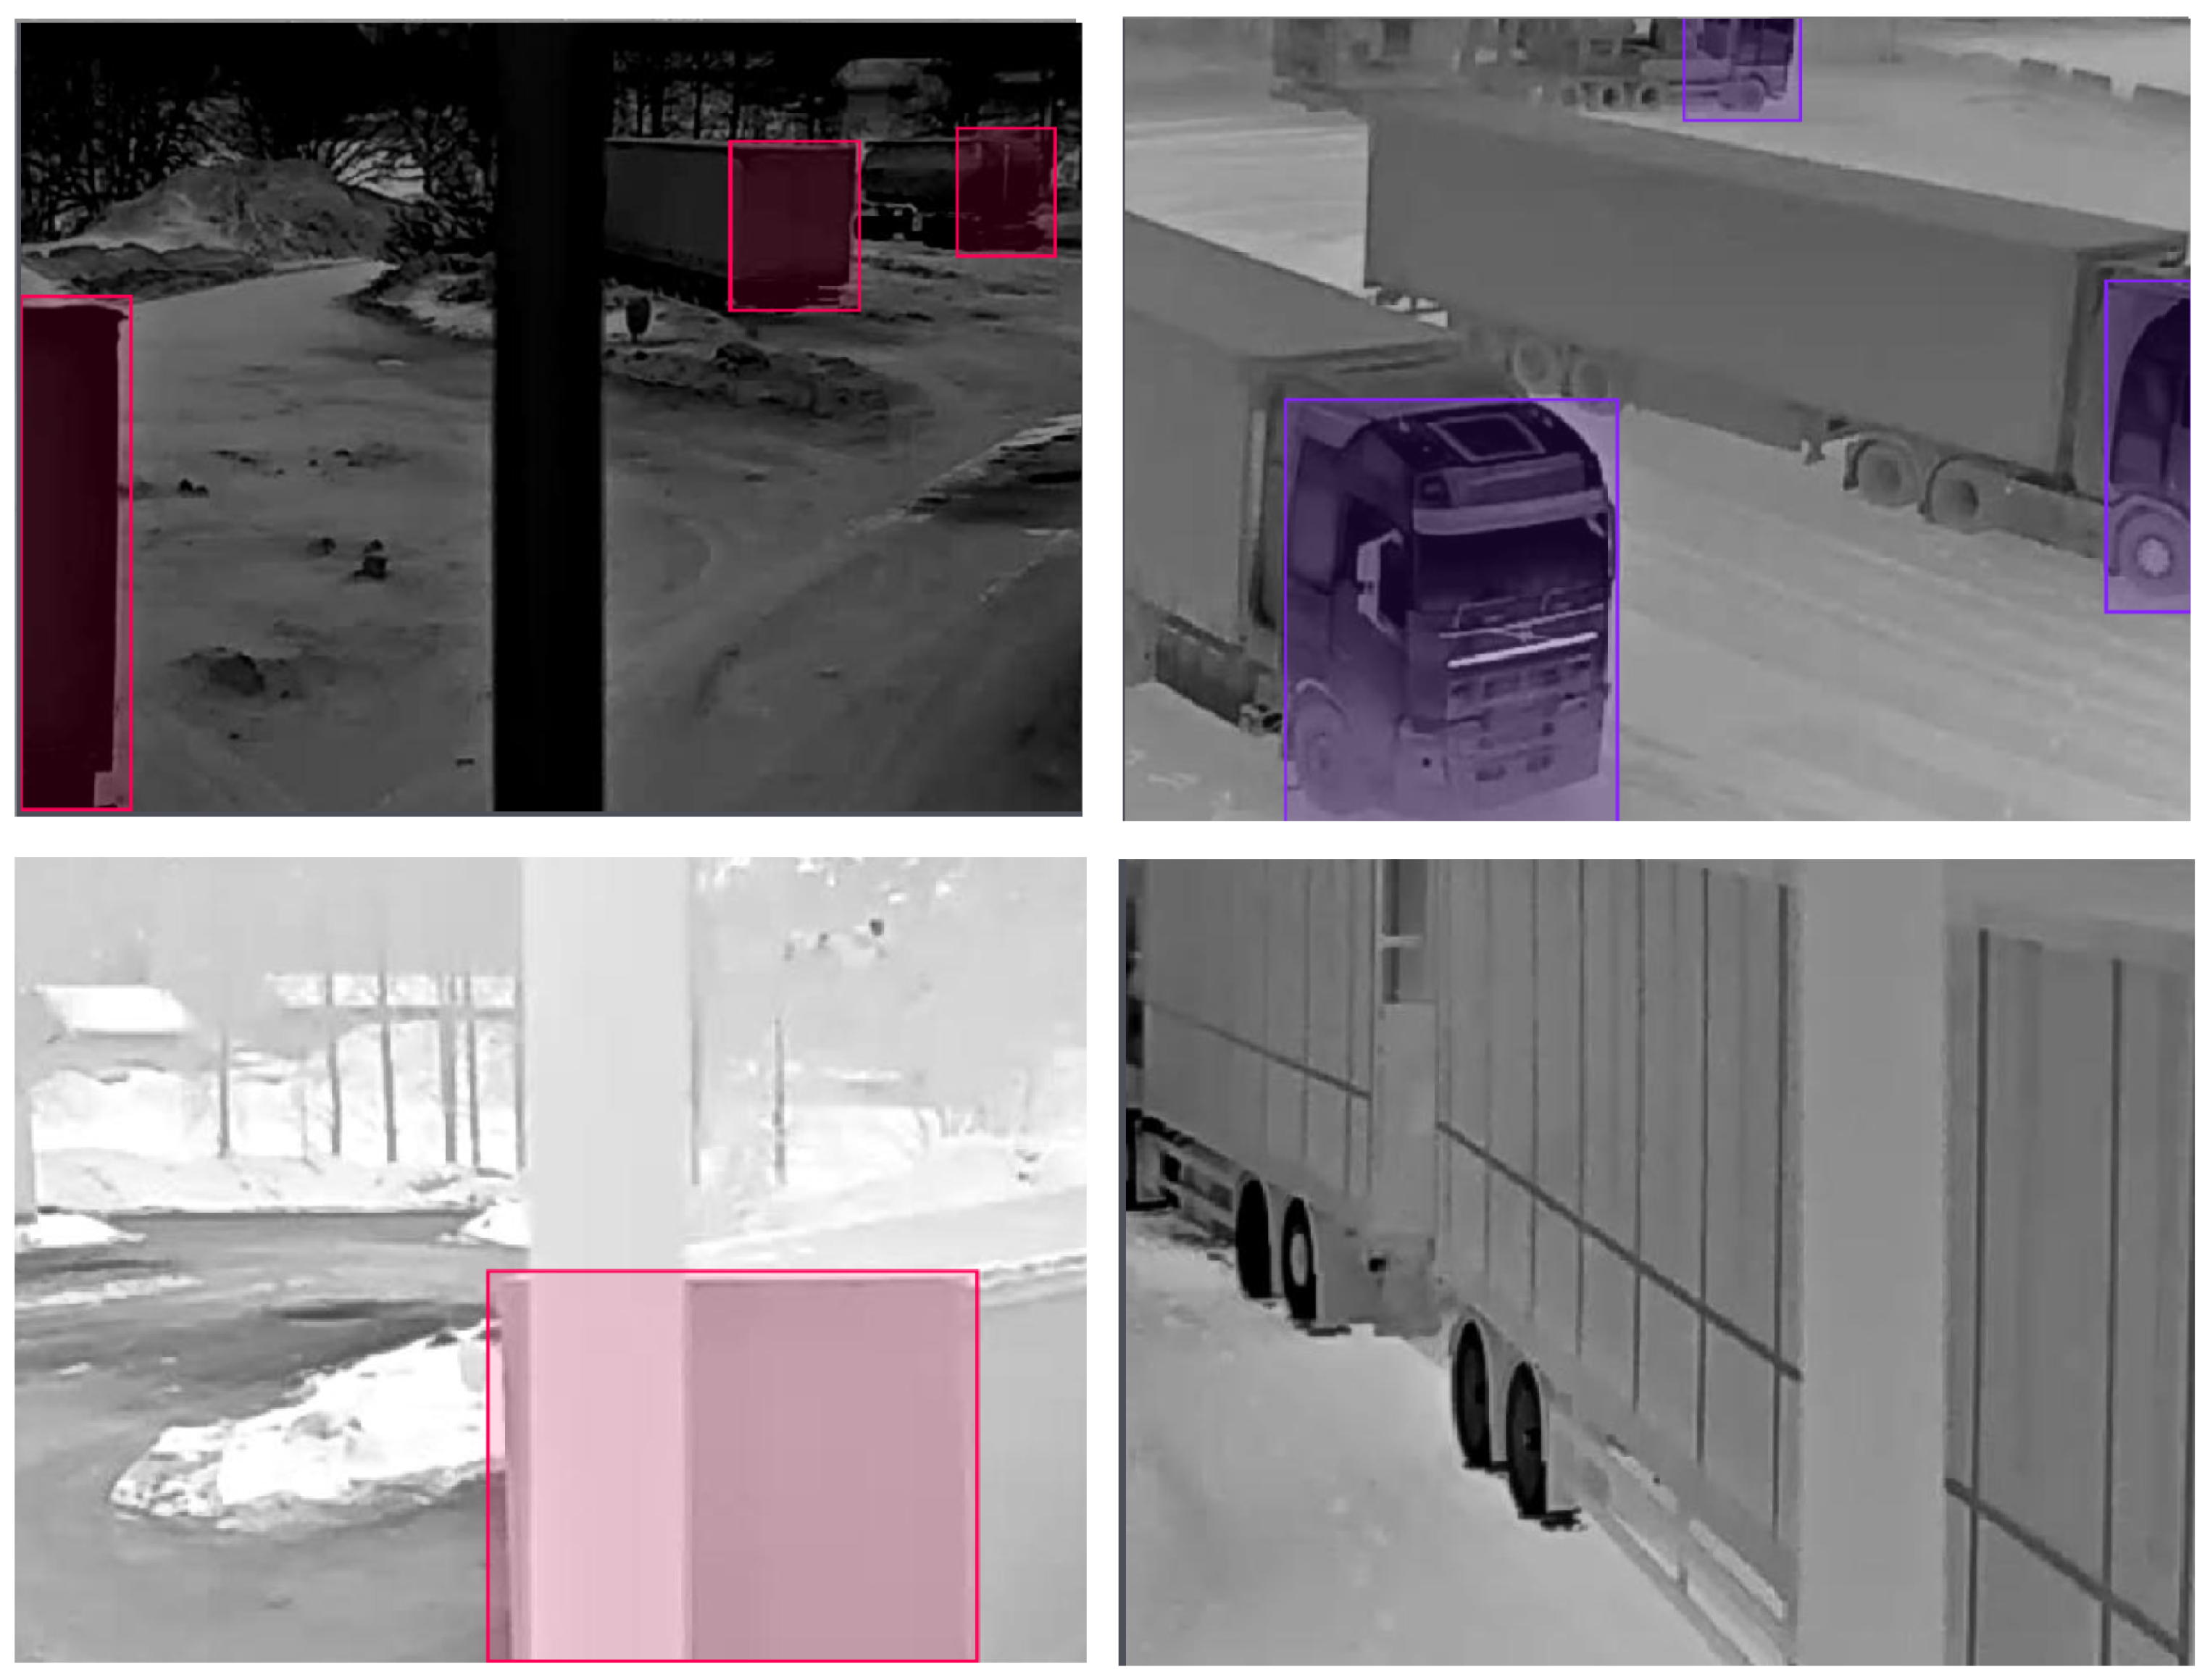
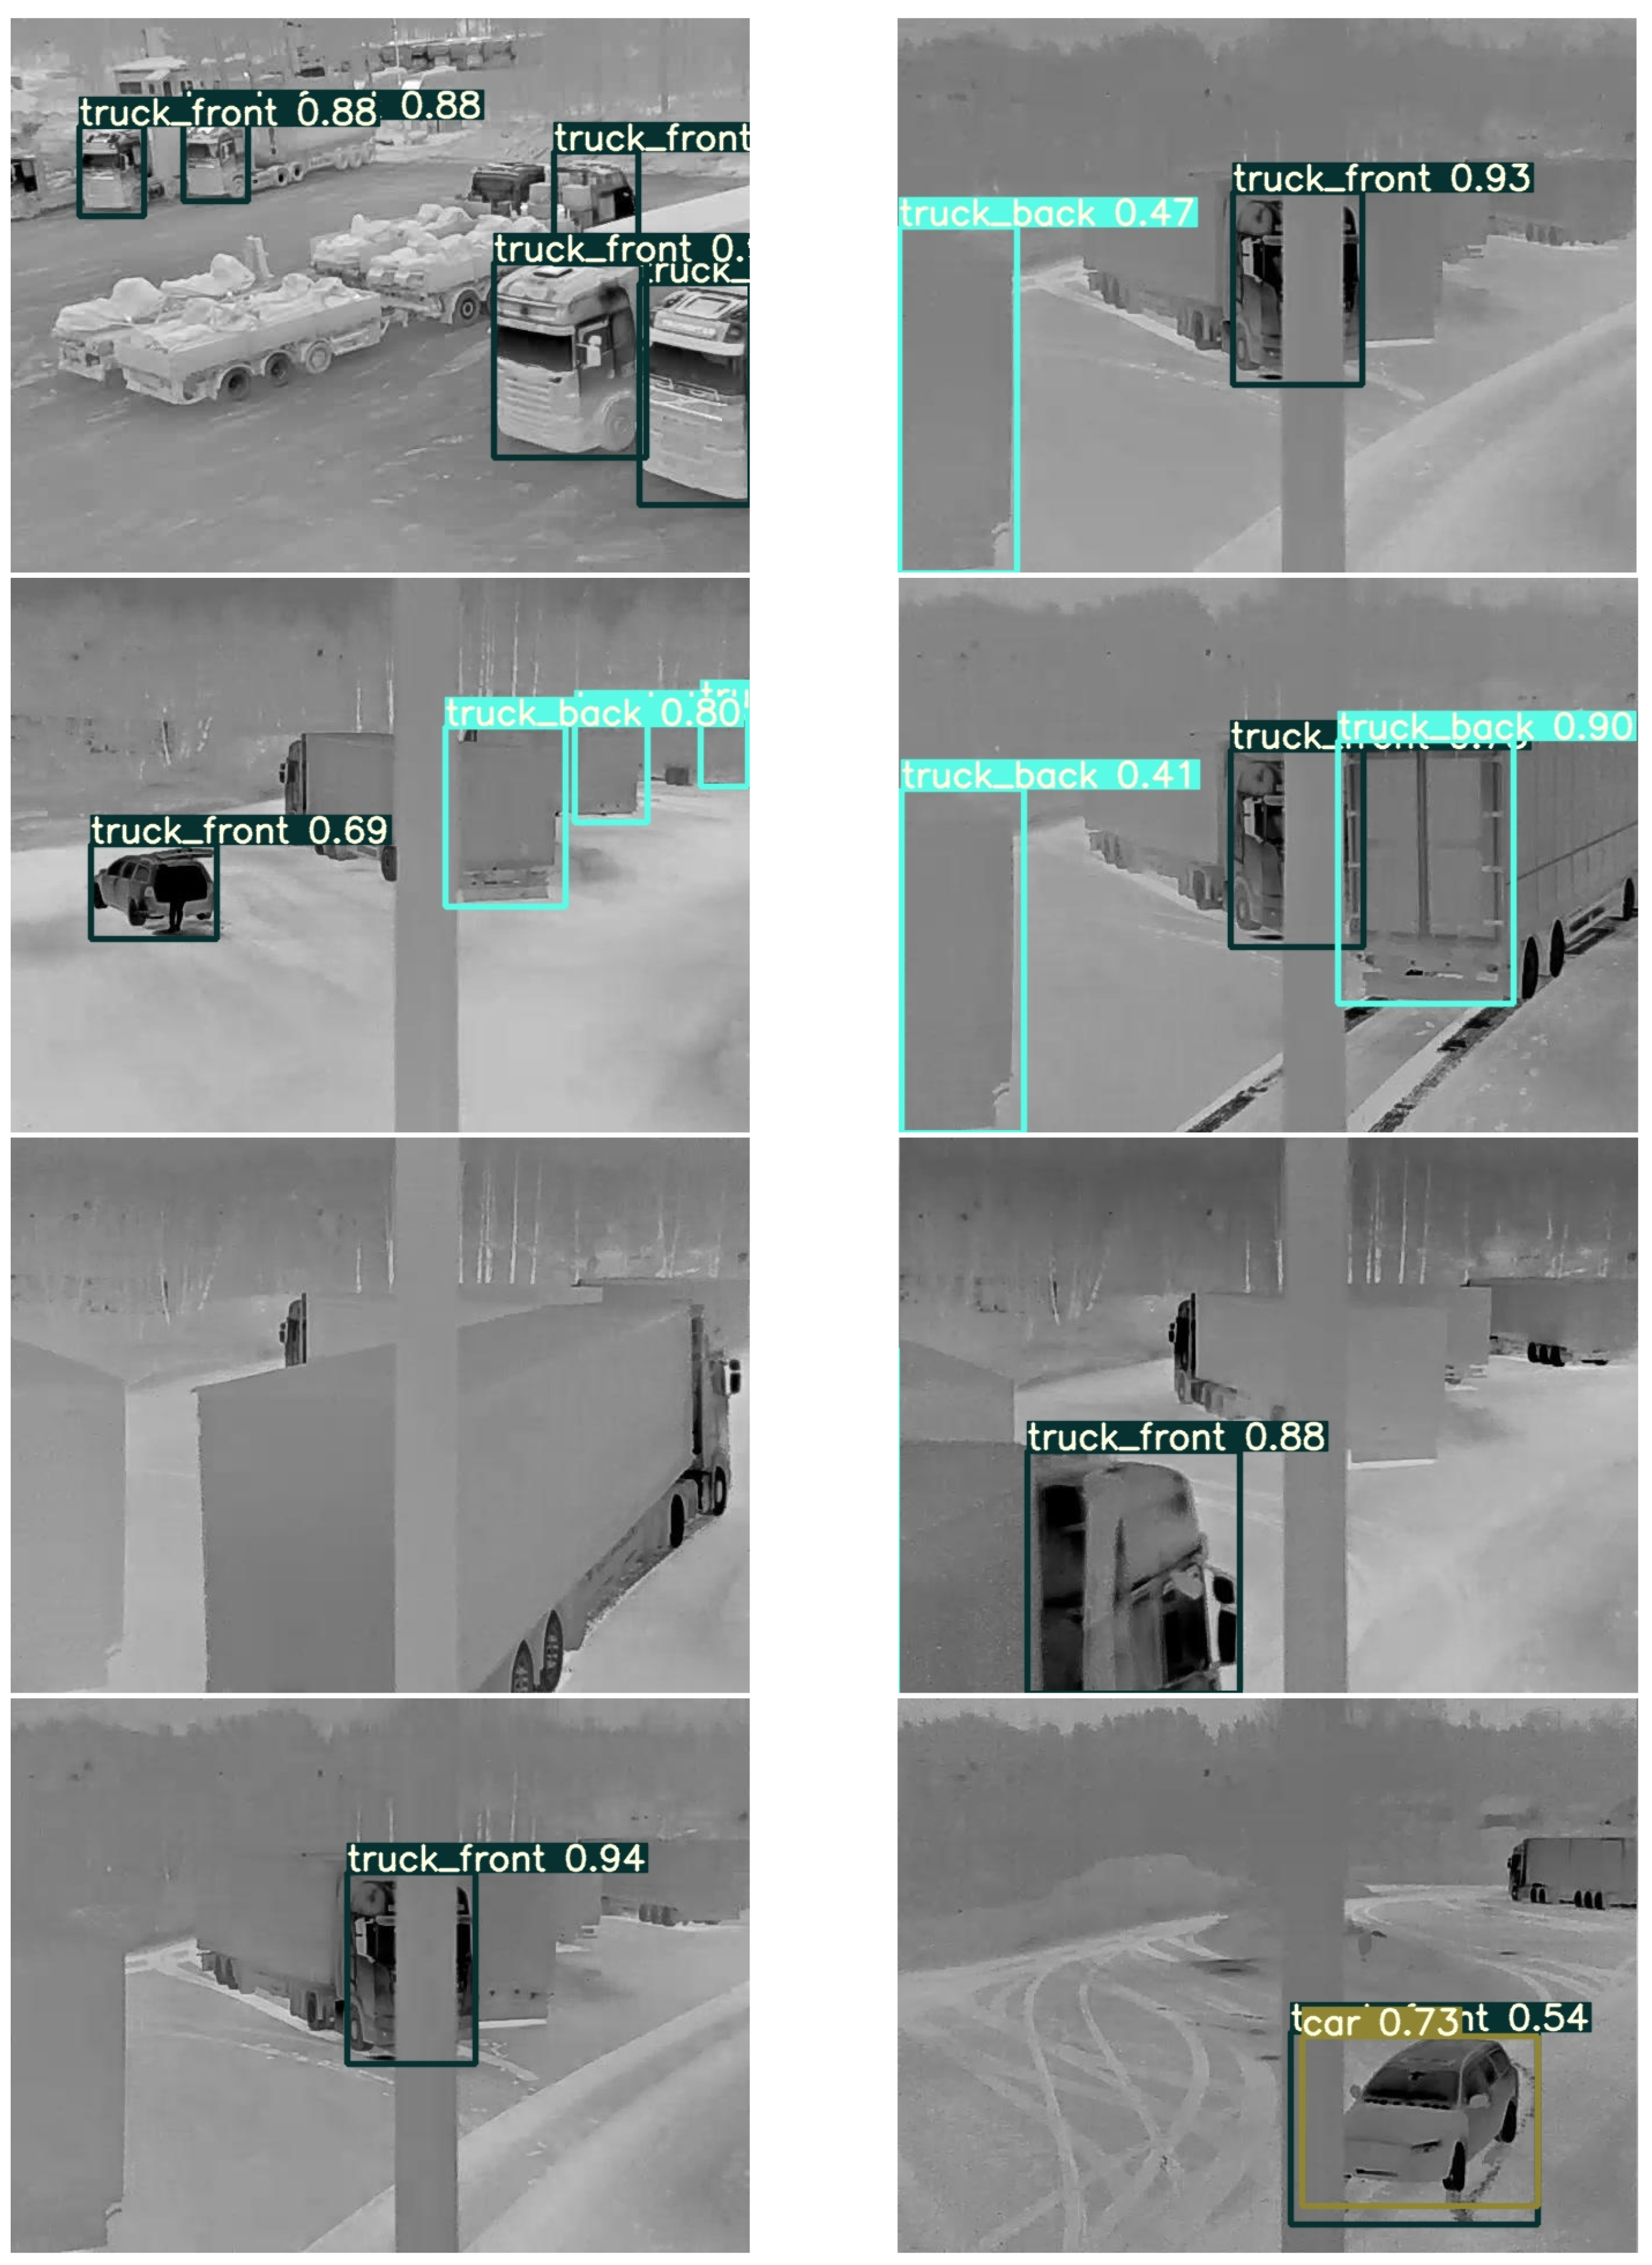
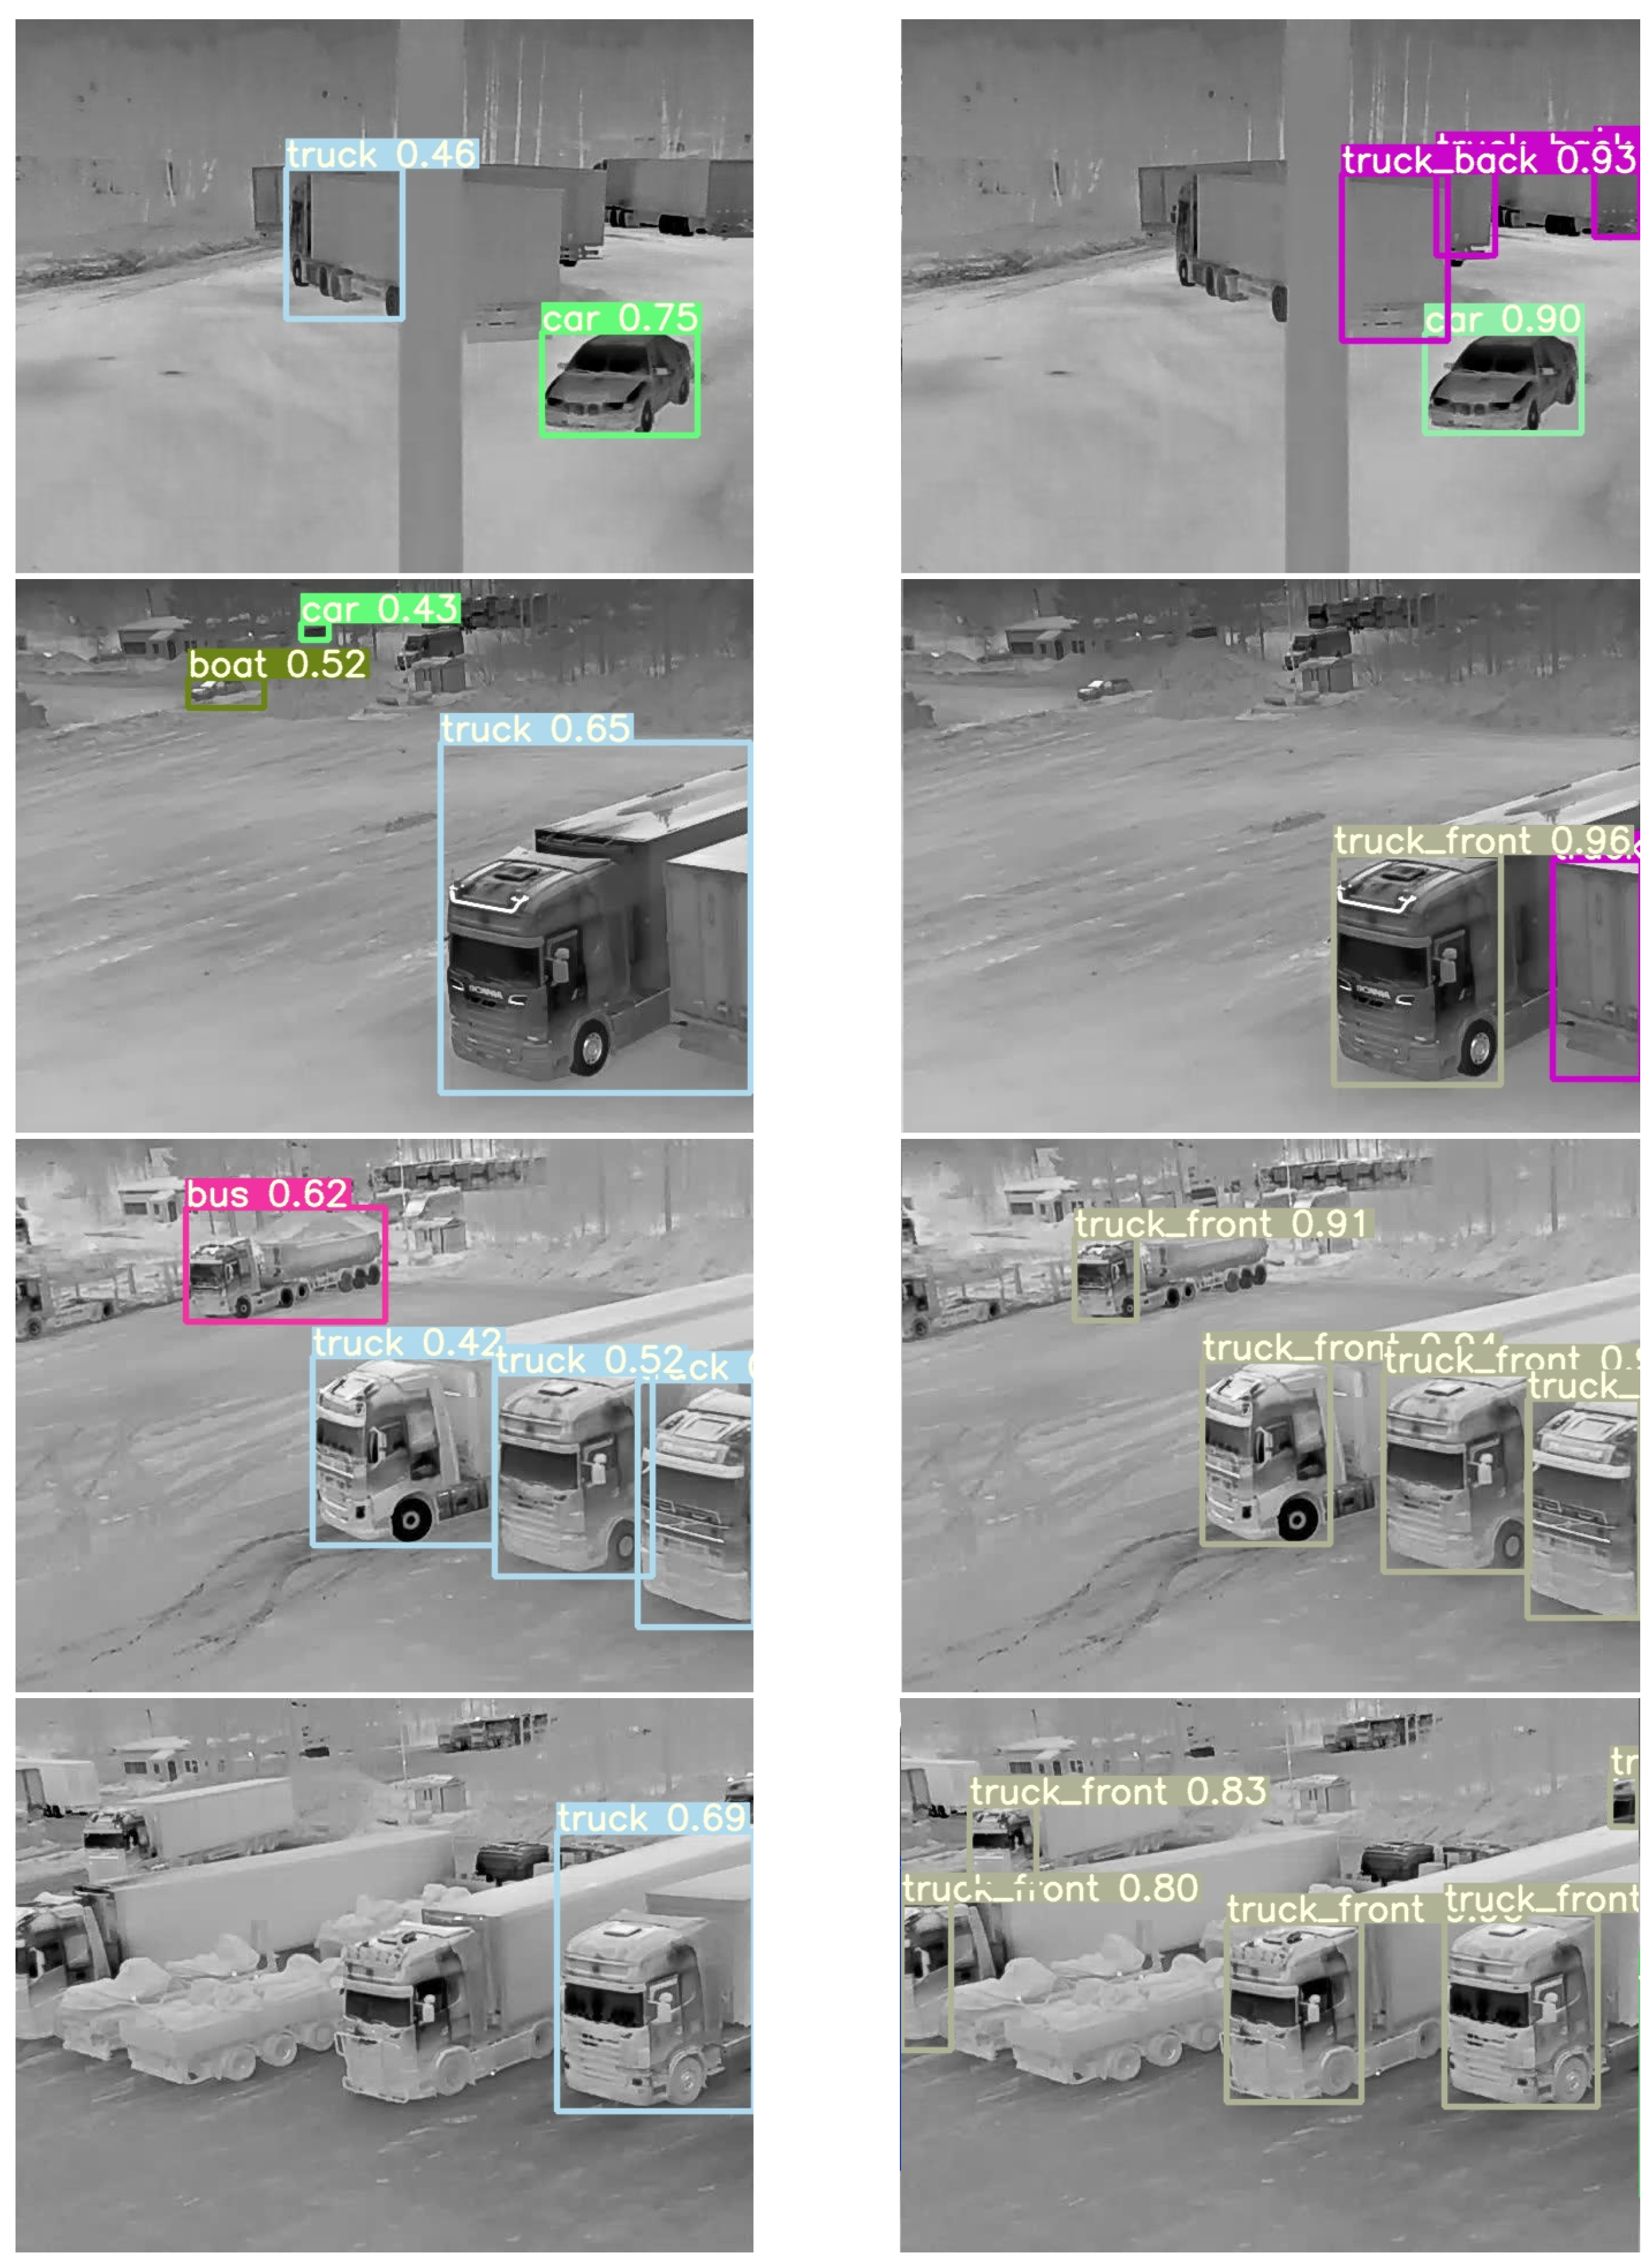
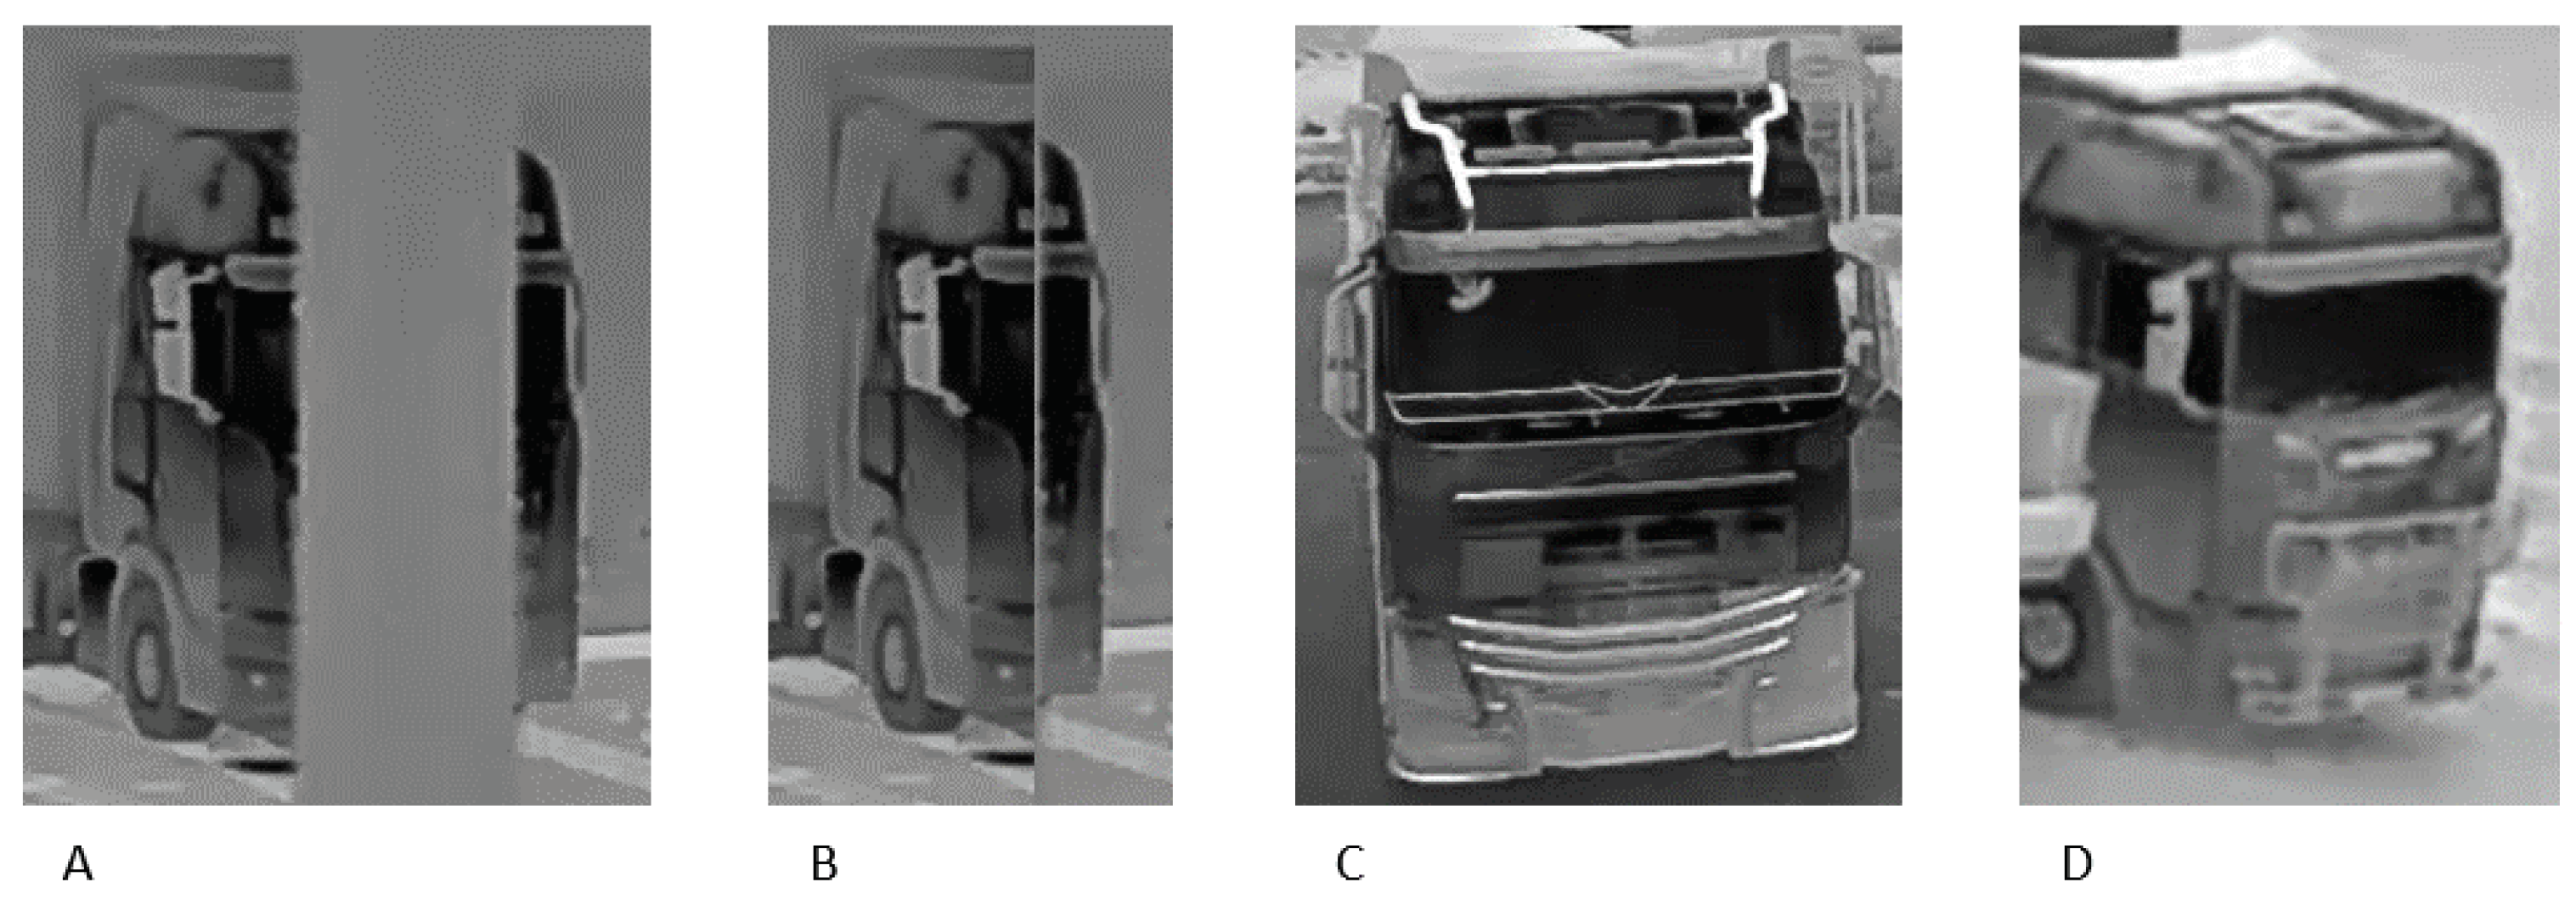
3.2. Experimental Analysis
4. Discussion
5. Conclusions
Author Contributions
Funding
Institutional Review Board Statement
Informed Consent Statement
Data Availability Statement
Acknowledgments
Conflicts of Interest
References
- Zhang, J.; Huang, M.; Jin, X.; Li, X. A Real-Time Chinese Traffic Sign Detection Algorithm Based on Modified YOLOv2. Algorithms 2017, 10, 127. [Google Scholar] [CrossRef] [Green Version]
- Haque, W.A.; Arefin, S.; Shihavuddin, A.; Hasan, M.A. DeepThin: A novel lightweight CNN architecture for traffic sign recognition without GPU requirements. Expert Syst. Appl. 2021, 168, 114481. [Google Scholar] [CrossRef]
- Zhang, B.; Wang, G.; Wang, H.; Xu, C.; Li, Y.; Xu, L. Detecting Small Chinese Traffic Signs via Improved YOLOv3 Method. Math. Probl. Eng. 2021, 2021. [Google Scholar] [CrossRef]
- Zhou, K.; Zhan, Y.; Fu, D. Learning Region-Based Attention Network for Traffic Sign Recognition. Sensors 2021, 21, 686. [Google Scholar] [CrossRef] [PubMed]
- Sun, C.; Ai, Y.; Wang, S.; Zhang, W. Dense-RefineDet for Traffic Sign Detection and Classification. Sensors 2020, 20, 6570. [Google Scholar] [CrossRef]
- Du, L.; Ji, J.; Pei, Z.; Zheng, H.; Fu, S.; Kong, H.; Chen, W. Improved detection method for traffic signs in real scenes applied in intelligent and connected vehicles. IET Intell. Transp. Syst. 2020, 14, 1555–1564. [Google Scholar] [CrossRef]
- Yazdan, R.; Varshosaz, M. Improving traffic sign recognition results in urban areas by overcoming the impact of scale and rotation. ISPRS J. Photogramm. Remote Sens. 2021, 171, 18–35. [Google Scholar] [CrossRef]
- Nodado, J.T.G.; Morales, H.C.P.; Abugan, M.A.P.; Olisea, J.L.; Aralar, A.C.; Loresco, P.J.M. Intelligent Traffic Light System Using Computer Vision with Android Monitoring and Control. In Proceedings of the TENCON 2018—2018 IEEE Region 10 Conference, Jeju, Korea, 28–31 October 2018; pp. 2461–2466. [Google Scholar] [CrossRef]
- Poddar, M.; Giridhar, M.K.; Prabhu, A.S.; Umadevi, V. Automated traffic monitoring system using computer vision. In Proceedings of the 2016 International Conference on ICT in Business Industry & Government (ICTBIG), Indore, India, 18–19 November 2016; pp. 1–5. [Google Scholar]
- Wu, W.; Bulan, O.; Bernal, E.A.; Loce, R.P. Detection of Moving Violations. In Computer Vision and Imaging in Intelligent Transportation Systems; Loce, R.P., Bala, R., Trivedi, M., Eds.; Wiley-IEEE Press: Hoboken, NJ, USA, 2017; Chapter 5; pp. 101–130. [Google Scholar]
- Al-qaness, M.A.A.; Abbasi, A.A.; Fan, H.; Ibrahim, R.A.; Alsamhi, S.H.; Hawbani, A. An improved YOLO-based road traffic monitoring system. Computing 2021, 103, 211–230. [Google Scholar] [CrossRef]
- Xu, T.; Zhang, Z.; Wu, X.; Qi, L.; Han, Y. Recognition of lane-changing behaviour with machine learning methods at freeway off-ramps. Phys. A Stat. Mech. Appl. 2021, 567. [Google Scholar] [CrossRef]
- Rosenbaum, D.; Kurz, F.; Thomas, U.; Suri, S.; Reinartz, P. Towards automatic near real-time traffic monitoring with an airborne wide angle camera system. Eur. Transp. Res. Rev. 2009, 1, 11–21. [Google Scholar] [CrossRef] [Green Version]
- Zhu, E.; Xu, M.; Pi, D.C. Vehicle Type Recognition Algorithm Based on Improved Network in Network. Complexity 2021, 2021. [Google Scholar] [CrossRef]
- Awang, S.; Azmi, N.M.A.N.; Rahman, M.A. Vehicle Type Classification Using an Enhanced Sparse-Filtered Convolutional Neural Network With Layer-Skipping Strategy. IEEE Access 2020, 8, 14265–14277. [Google Scholar] [CrossRef]
- Sun, W.; Zhang, X.; Shi, S.; He, X. Vehicle classification approach based on the combined texture and shape features with a compressive DL. IET Intell. Transp. Syst. 2019, 13, 1069–1077. [Google Scholar] [CrossRef]
- Kang, Q.; Zhao, H.; Yang, D.; Ahmed, H.S.; Ma, J. Lightweight convolutional neural network for vehicle recognition in thermal infrared images. Infrared Phys. Technol. 2020, 104. [Google Scholar] [CrossRef]
- Sun, W.; Zhang, X.; He, X.; Jin, Y.; Zhang, X. A Two-Stage Vehicle Type Recognition Method Combining the Most Effective Gabor Features. CMC-Comput. Mater. Contin. 2020, 65, 2489–2510. [Google Scholar] [CrossRef]
- Uus, J.; Krilavičius, T. Detection of Different Types of Vehicles from Aerial Imagery. 2019. Available online: https://www.vdu.lt/cris/handle/20.500.12259/102060 (accessed on 28 March 2021).
- Adu-Gyamfi, Y.O.; Asare, S.K.; Sharma, A.; Titus, T. Automated Vehicle Recognition with Deep Convolutional Neural Networks. Transp. Res. Rec. 2017, 2645, 113–122. [Google Scholar] [CrossRef] [Green Version]
- Huttunen, H.; Yancheshmeh, F.S.; Chen, K. Car type recognition with Deep Neural Networks. In Proceedings of the 2016 IEEE Intelligent Vehicles Symposium (IV), Gothenburg, Sweden, 19–22 June 2016. [Google Scholar] [CrossRef] [Green Version]
- Zhou, Y.; Cheung, N.M. Vehicle classification using transferable deep neural network features. arXiv 2016, arXiv:1601.01145. [Google Scholar]
- Moussa, G. Vehicle Type Classification with Geometric and Appearance Attributes. World Acad. Sci. Eng. Technol. Int. J. Civ. Environ. Struct. Constr. Archit. Eng. 2014, 8, 277–282. [Google Scholar]
- Asaidi, H.; Aarab, A.; Bellouki, M. Shadow Elimination and Vehicles Classification Approaches in Traffic Video Surveillance Context. J. Vis. Lang. Comput. 2014, 25, 333–345. [Google Scholar] [CrossRef]
- Han, D.; Leotta, M.J.; Cooper, D.B.; Mundy, J.L. Vehicle Class Recognition from Video-Based on 3D Curve Probes. In Proceedings of the 2005 IEEE International Workshop on Visual Surveillance and Performance Evaluation of Tracking and Surveillance, Beijing, China, 15–16 October 2005; pp. 285–292. [Google Scholar] [CrossRef] [Green Version]
- Ferryman, J.M.; Worrall, A.D.; Sullivan, G.D.; Baker, K.D. A Generic Deformable Model for Vehicle Recognition. In BMVC; Citeseer: Princeton, NJ, USA, 1995; Volume 1, p. 2. [Google Scholar]
- Fachrie, M. A Simple Vehicle Counting System Using Deep Learning with YOLOv3 Model. Jurnal RESTI (Rekayasa Sistem Dan Teknologi Informasi) 2020, 4, 462–468. [Google Scholar] [CrossRef]
- Song, H.; Liang, H.; Li, H.; Dai, Z.; Yun, X. Vision-based vehicle detection and counting system using deep learning in highway scenes. Eur. Transp. Res. Rev. 2019, 11. [Google Scholar] [CrossRef] [Green Version]
- Alghyaline, S.; El-Omari, N.; Al-Khatib, R.M.; Al-Kharbshh, H. RT-VC: An Efficient Real-Time Vehicle Counting Approach. J. Theor. Appl. Inf. Technol. 2019, 97, 2062–2075. [Google Scholar]
- Iftikhar, Z.; Dissanayake, P.; Vial, P. Computer Vision Based Traffic Monitoring System for Multi-track Freeways. In Intelligent Computing Methodologies; Huang, D.S., Jo, K.H., Wang, L., Eds.; Springer International Publishing: Cham, Switzerland, 2014; pp. 339–349. [Google Scholar]
- Kun, A.J.; Vamossy, Z. Traffic monitoring with computer vision. In Proceedings of the 2009 7th International Symposium on Applied Machine Intelligence and Informatics, Herlany, Slovakia, 30–31 January 2009; pp. 131–134. [Google Scholar] [CrossRef]
- Jiang, S.; Jiang, H.; Ma, S.; Jiang, Z. Detection of Parking Slots Based on Mask R-CNN. Appl. Sci. 2020, 10, 4295. [Google Scholar] [CrossRef]
- Kim, S.; Kim, J.; Ra, M.; Kim, W.Y. Vacant Parking Slot Recognition Method for Practical Autonomous Valet Parking System Using around View Image. Symmetry 2020, 12, 1725. [Google Scholar] [CrossRef]
- Zhang, C.; Du, B. Image-Based Approach for Parking-Spot Detection with Occlusion Handling. J. Transp. Eng. Part Syst. 2020, 146. [Google Scholar] [CrossRef]
- Tătulea, P.; Călin, F.; Brad, R.; Brâncovean, L.; Greavu, M. An Image Feature-Based Method for Parking Lot Occupancy. Future Internet 2019, 11, 169. [Google Scholar] [CrossRef] [Green Version]
- Cai, B.Y.; Alvarez, R.; Sit, M.; Duarte, F.; Ratti, C. Deep Learning-Based Video System for Accurate and Real-Time Parking Measurement. IEEE Internet Things J. 2019, 6, 7693–7701. [Google Scholar] [CrossRef] [Green Version]
- Ding, X.; Yang, R. Vehicle and Parking Space Detection Based on Improved YOLO Network Model. J. Phys. Conf. Ser. 2019, 1325, 012084. [Google Scholar] [CrossRef]
- Acharya, D.; Yan, W.; Khoshelham, K. Real-Time Image-Based Parking OCCUPANCY detection Using Deep Learning. Research@ Locate. 2018, pp. 33–40. Available online: https://www.researchgate.net/publication/323796590 (accessed on 28 March 2021).
- Amato, G.; Carrara, F.; Falchi, F.; Gennaro, C.; Meghini, C.; Vairo, C. Deep Learning for Decentralized Parking Lot Occupancy Detection. Expert Syst. Appl. 2016, 72. [Google Scholar] [CrossRef]
- Masmoudi, I.; Wali, A.; Jamoussi, A.; Alimi, M.A. Trajectory analysis for parking lot vacancy detection system. IET Intell. Transp. Syst. 2016, 10, 461–468. [Google Scholar] [CrossRef]
- Valipour, S.; Siam, M.; Stroulia, E.; Jagersand, M. Parking-stall vacancy indicator system, based on deep convolutional neural networks. In Proceedings of the 2016 IEEE 3rd World Forum on Internet of Things (WF-IoT), Reston, VA, USA, 12–14 December 2016; pp. 655–660. [Google Scholar] [CrossRef] [Green Version]
- Menéndez, J.M.; Postigo, C.; Torres, J. Vacant parking area estimation through background subtraction and transience map analysis. IET Intell. Transp. Syst. 2015, 9. [Google Scholar] [CrossRef] [Green Version]
- De Almeida, P.R.; Oliveira, L.S.; Britto, A.S., Jr.; Silva, E.J., Jr.; Koerich, A.L. PKLot—A Robust Dataset for Parking Lot Classification. Expert Syst. Appl. 2015, 42. [Google Scholar] [CrossRef] [Green Version]
- Jermsurawong, J.; Ahsan, U.; Haidar, A.; Dong, H.; Mavridis, N. One-Day Long Statistical Analysis of Parking Demand by Using Single-Camera Vacancy Detection. J. Transp. Syst. Eng. Inf. Technol. 2014, 14, 33–44. [Google Scholar] [CrossRef]
- Fabian, T. A Vision-Based Algorithm for Parking Lot Utilization Evaluation Using Conditional Random Fields. In Proceedings of the International Symposium on Visual Computing, Crete, Greece, 29–31 July 2013; Springer: Berlin/Heidelberg, Germany, 2013; pp. 222–233. [Google Scholar]
- Huang, C.; Tai, Y.; Wang, S. Vacant Parking Space Detection Based on Plane-Based Bayesian Hierarchical Framework. IEEE Trans. Circuits Syst. Video Technol. 2013, 23, 1598–1610. [Google Scholar] [CrossRef]
- Ichihashi, H.; Notsu, A.; Honda, K.; Katada, T.; Fujiyoshi, M. Vacant parking space detector for outdoor parking lot by using surveillance camera and FCM classifier. In Proceedings of the 2009 IEEE International Conference on Fuzzy Systems, Jeju, Korea, 20–24 August 2009; pp. 127–134. [Google Scholar] [CrossRef]
- Bong, D.; Ting, K.C.; Lai, K.C. Integrated Approach in the Design of Car Park Occupancy Information System (COINS). IAENG Int. J. Comput. Sci. 2008, 35, 1. [Google Scholar]
- Funck, S.; Mohler, N.; Oertel, W. Determining car-park occupancy from single images. In Proceedings of the IEEE Intelligent Vehicles Symposium, Parma, Italy, 14–17 June 2004; pp. 325–328. [Google Scholar] [CrossRef]
- Jocher, G.; Stoken, A.; Borovec, J.; NanoCode012; ChristopherSTAN; Changyu, L.; Laughing; tkianai; yxNONG; Hogan, A.; et al. Ultralytics/yolov5: v4.0—nn.SiLU() Activations, Weights & Biases Logging, PyTorch Hub Integration. 2021. Available online: https://0-doi-org.brum.beds.ac.uk/10.5281/zenodo.4418161 (accessed on 28 March 2021).
- Redmon, J.; Divvala, S.; Girshick, R.; Farhadi, A. You Only Look Once: Unified, Real-Time Object Detection. 2016, pp. 779–788. Available online: https://0-doi-org.brum.beds.ac.uk/10.1109/CVPR.2016.91 (accessed on 3 February 2021).
- Joseph, R.; Santosh, D.; Ross, G.; Ali, F. YOLO: Real-Time Object Detection. 2016. Available online: https://pjreddie.com/darknet/yolo/ (accessed on 3 March 2021).
- Benjdira, B.; Khursheed, T.; Koubaa, A.; Ammar, A.; Ouni, K. Car Detection using Unmanned Aerial Vehicles: Comparison between Faster R-CNN and YOLOv3. 2018. Available online: http://xxx.lanl.gov/abs/1812.10968 (accessed on 3 February 2021).
- Ouyang, L.; Wang, H. Vehicle target detection in complex scenes based on YOLOv3 algorithm. IOP Conf. Ser. Mater. Sci. Eng. 2019, 569, 052018. [Google Scholar] [CrossRef]
- Lin, T.; Maire, M.; Belongie, S.J.; Bourdev, L.D.; Girshick, R.B.; Hays, J.; Perona, P.; Ramanan, D.; Dollár, P.; Zitnick, C.L. Microsoft COCO: Common Objects in Context. CoRR 2014. Available online: http://xxx.lanl.gov/abs/1405.0312 (accessed on 3 February 2021).
- Fabrice, B. FFmpeg. Available online: https://ffmpeg.org/ (accessed on 3 February 2021).
- Fabrice, B. FFmpeg Filters Documentation Select, Aselect. Available online: https://ffmpeg.org/ffmpeg-filters.html#select_002c-aselect (accessed on 3 February 2021).
- Roboflow. How to Train YOLOv5 on Custom Objects. 2016. Available online: https://colab.research.google.com/drive/1gDZ2xcTOgR39tGGs-EZ6i3RTs16wmzZQ (accessed on 3 February 2021).
- Zoph, B.; Cubuk, E.D.; Ghiasi, G.; Lin, T.Y.; Shlens, J.; Le, Q.V. Learning Data Augmentation Strategies for Object Detection. arXiv 2019, arXiv:1906.11172. [Google Scholar]


| Dataset | Rest Area | Augmentation | #Images | Period |
|---|---|---|---|---|
| Training | A | yes | 329 | 25 January 2021 to 15 January 2021 |
| B | yes | 251 | 17 February 2021 to 2 February 2021 | |
| Validation | A | no | 64 | 16 February 2021 to 25 January 2021 |
| B | no | 39 | 17 February 2021 to 18 February 2021 | |
| Test | A | no | 30 | 16 February 2021 to 22 February 2021 |
| B | no | 30 | 18 February 2021 to 22 February 2021 |
| Class | YOLOv5 | YOLOv5 + Rest Area Data |
|---|---|---|
| truck | 0.42 | - |
| truck_front | - | 0.63 |
| truck_back | - | 0.52 |
| car | 0.78 | 0.93 |
Publisher’s Note: MDPI stays neutral with regard to jurisdictional claims in published maps and institutional affiliations. |
© 2021 by the authors. Licensee MDPI, Basel, Switzerland. This article is an open access article distributed under the terms and conditions of the Creative Commons Attribution (CC BY) license (https://creativecommons.org/licenses/by/4.0/).
Share and Cite
Kasper-Eulaers, M.; Hahn, N.; Berger, S.; Sebulonsen, T.; Myrland, Ø.; Kummervold, P.E. Short Communication: Detecting Heavy Goods Vehicles in Rest Areas in Winter Conditions Using YOLOv5. Algorithms 2021, 14, 114. https://0-doi-org.brum.beds.ac.uk/10.3390/a14040114
Kasper-Eulaers M, Hahn N, Berger S, Sebulonsen T, Myrland Ø, Kummervold PE. Short Communication: Detecting Heavy Goods Vehicles in Rest Areas in Winter Conditions Using YOLOv5. Algorithms. 2021; 14(4):114. https://0-doi-org.brum.beds.ac.uk/10.3390/a14040114
Chicago/Turabian StyleKasper-Eulaers, Margrit, Nico Hahn, Stian Berger, Tom Sebulonsen, Øystein Myrland, and Per Egil Kummervold. 2021. "Short Communication: Detecting Heavy Goods Vehicles in Rest Areas in Winter Conditions Using YOLOv5" Algorithms 14, no. 4: 114. https://0-doi-org.brum.beds.ac.uk/10.3390/a14040114