2.2. Data Processing
To process the dataset, the authors used the WEKA machine learning software’s Explorer and Knowledge Flow applications, and the main page of WEKA is presented in
Figure 2.
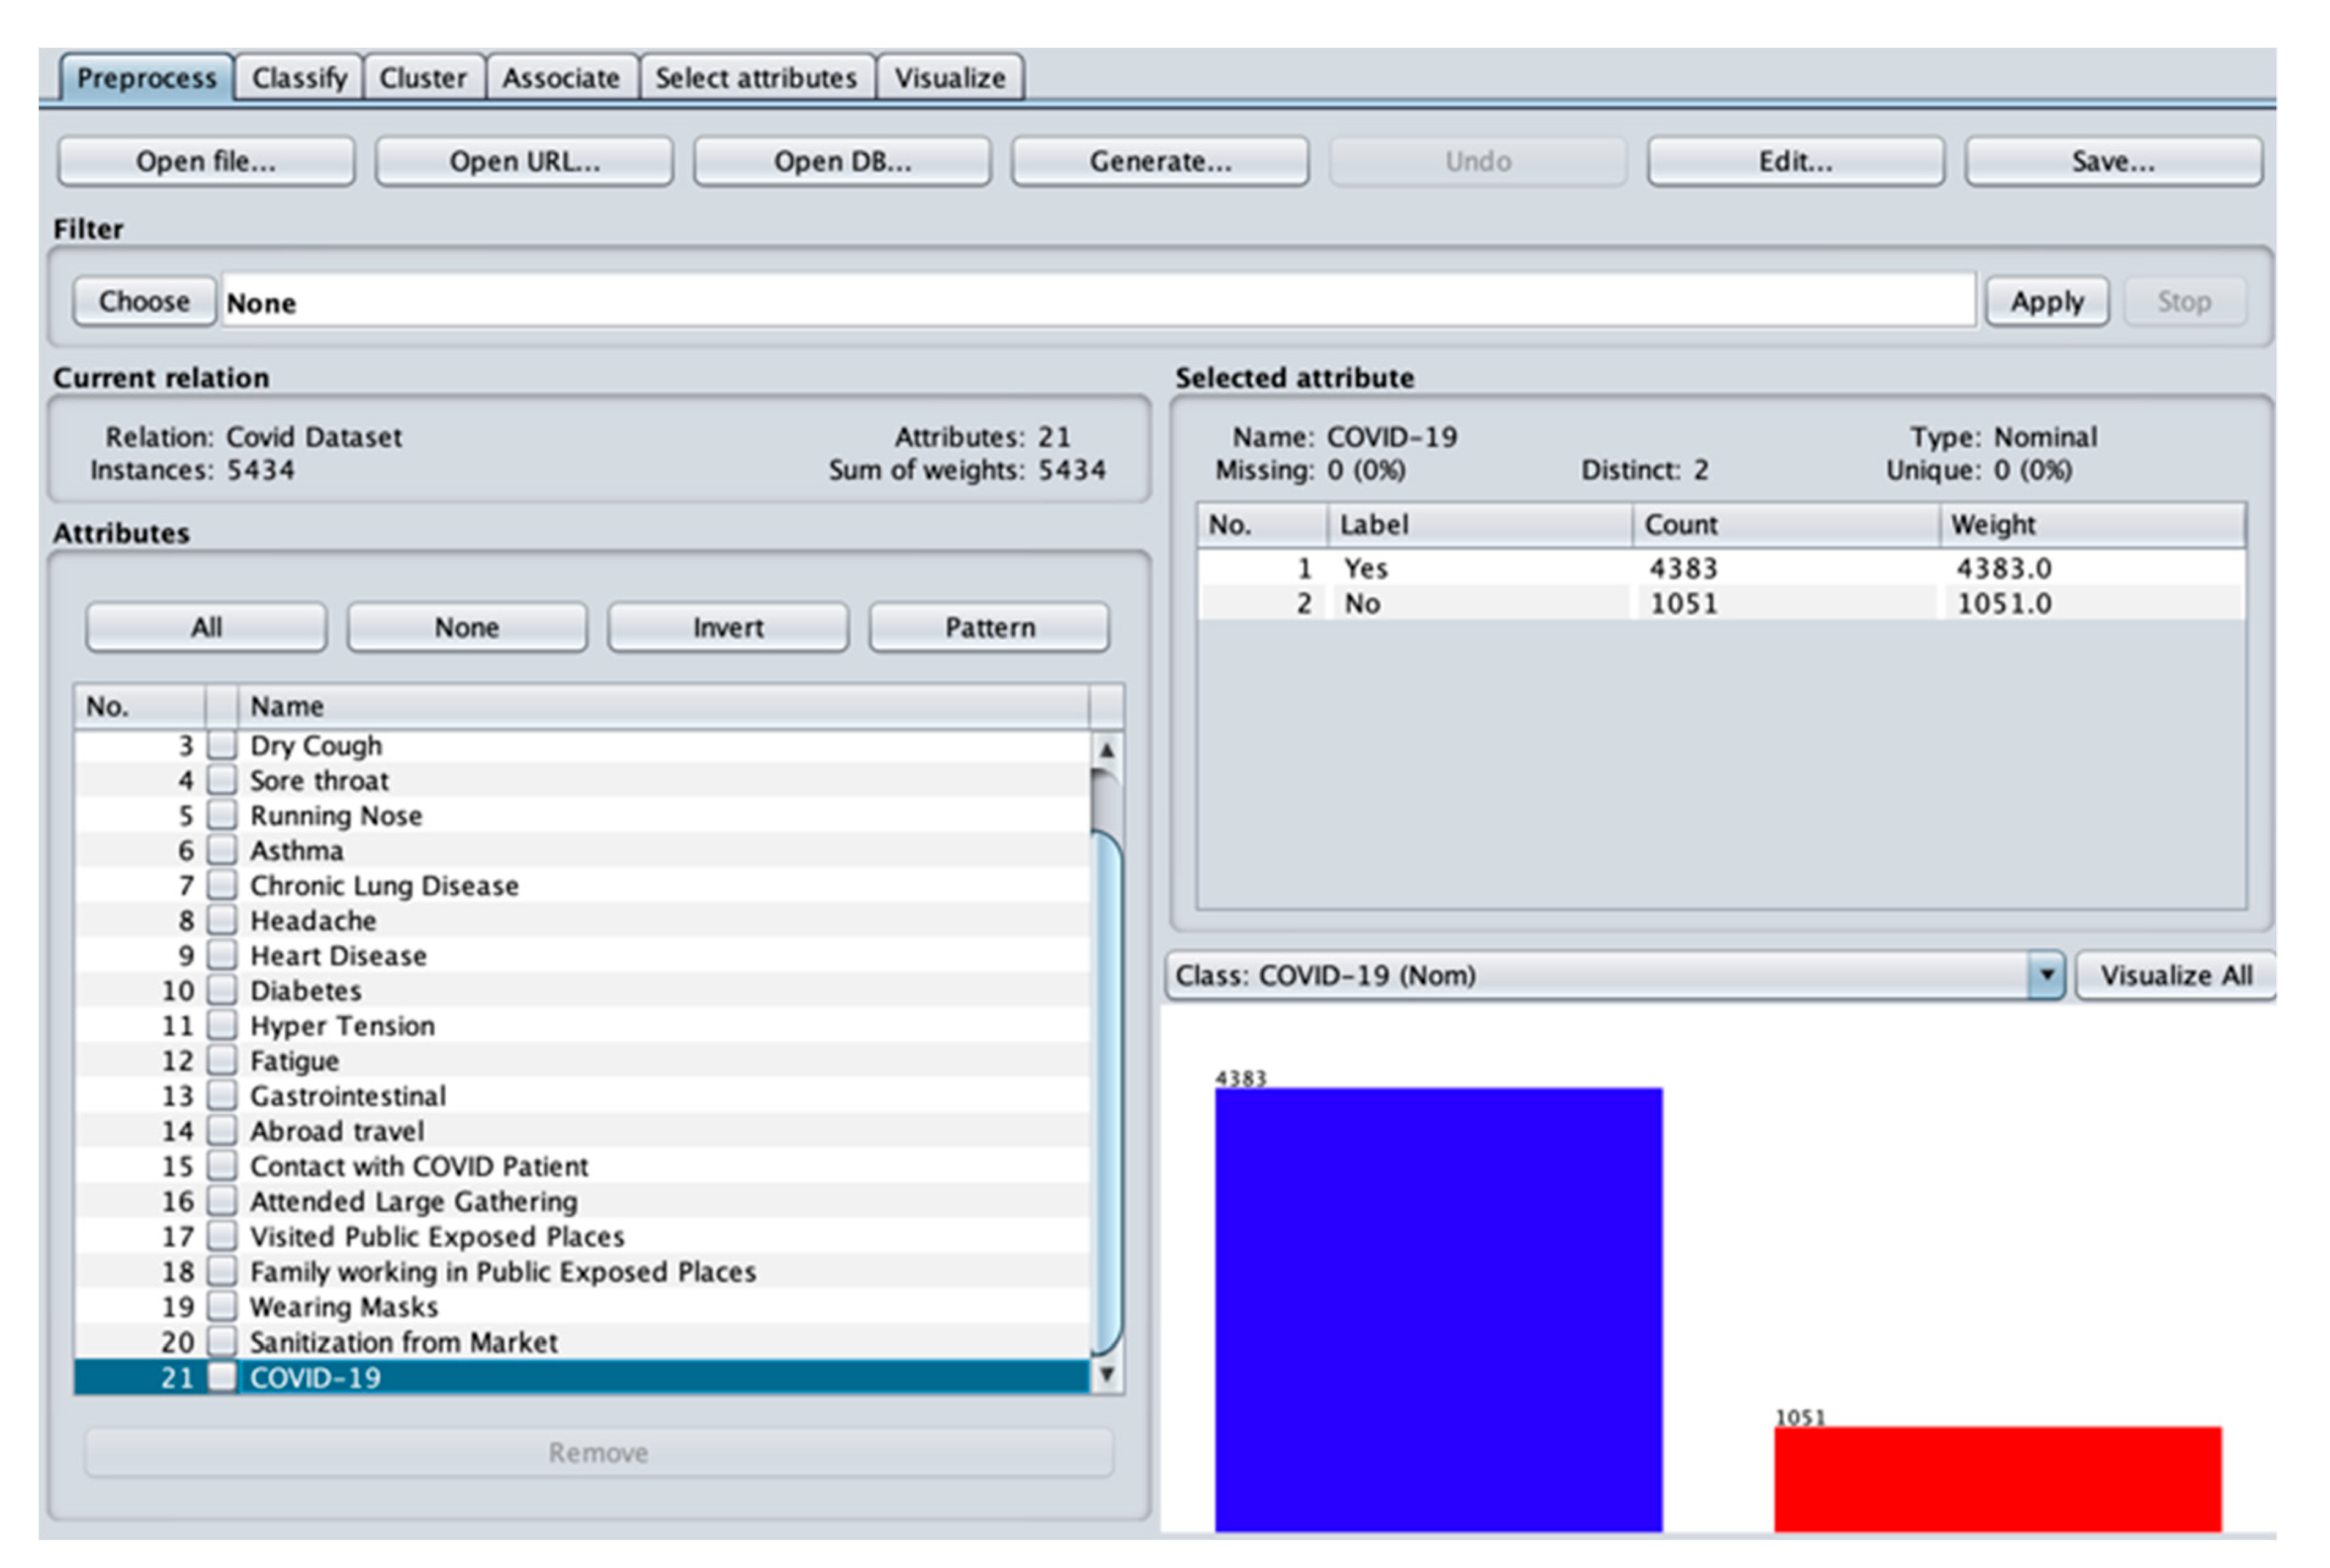
There are various document formats accepted in WEKA, such as arff, C4.5, csv, JSON file, etc., and the COVID-19 Symptoms and Presence dataset is in csv format, which makes it easy to be imported and analyzed in the software. Data preprocessing can be started by clicking the open file and browsing for the location of the dataset. Once the dataset is imported in WEKA, the current relation, attributes, instances and the sum of weights and visualizations pertaining to the dataset will be displayed. The Preprocess tab in the WEKA Explorer application is displayed in
Figure 3.
Once an attribute is selected, values such as name; missing, distinct and unique values; data type; labels; count, and weights will be visible. Distribution between the class labels is also displayed in a bar chart by clicking the COVID-19 attribute seen on the left side of the form. For the COVID-19 Symptoms and Presence dataset, the classes have a 4:1 class imbalance. The researchers used the synthetic minority oversampling technique (SMOTE) to generate additional instances for the minority group, which is the class labeled “No”. SMOTE oversamples the minority class by generating additional synthetic samples, and in this way, the class with fewer samples will be increased. Combining the method of oversampling the minority class and undersampling the majority class, or cutting off some samples in the class containing more samples, will yield better classifier performance than just undersampling the majority class [
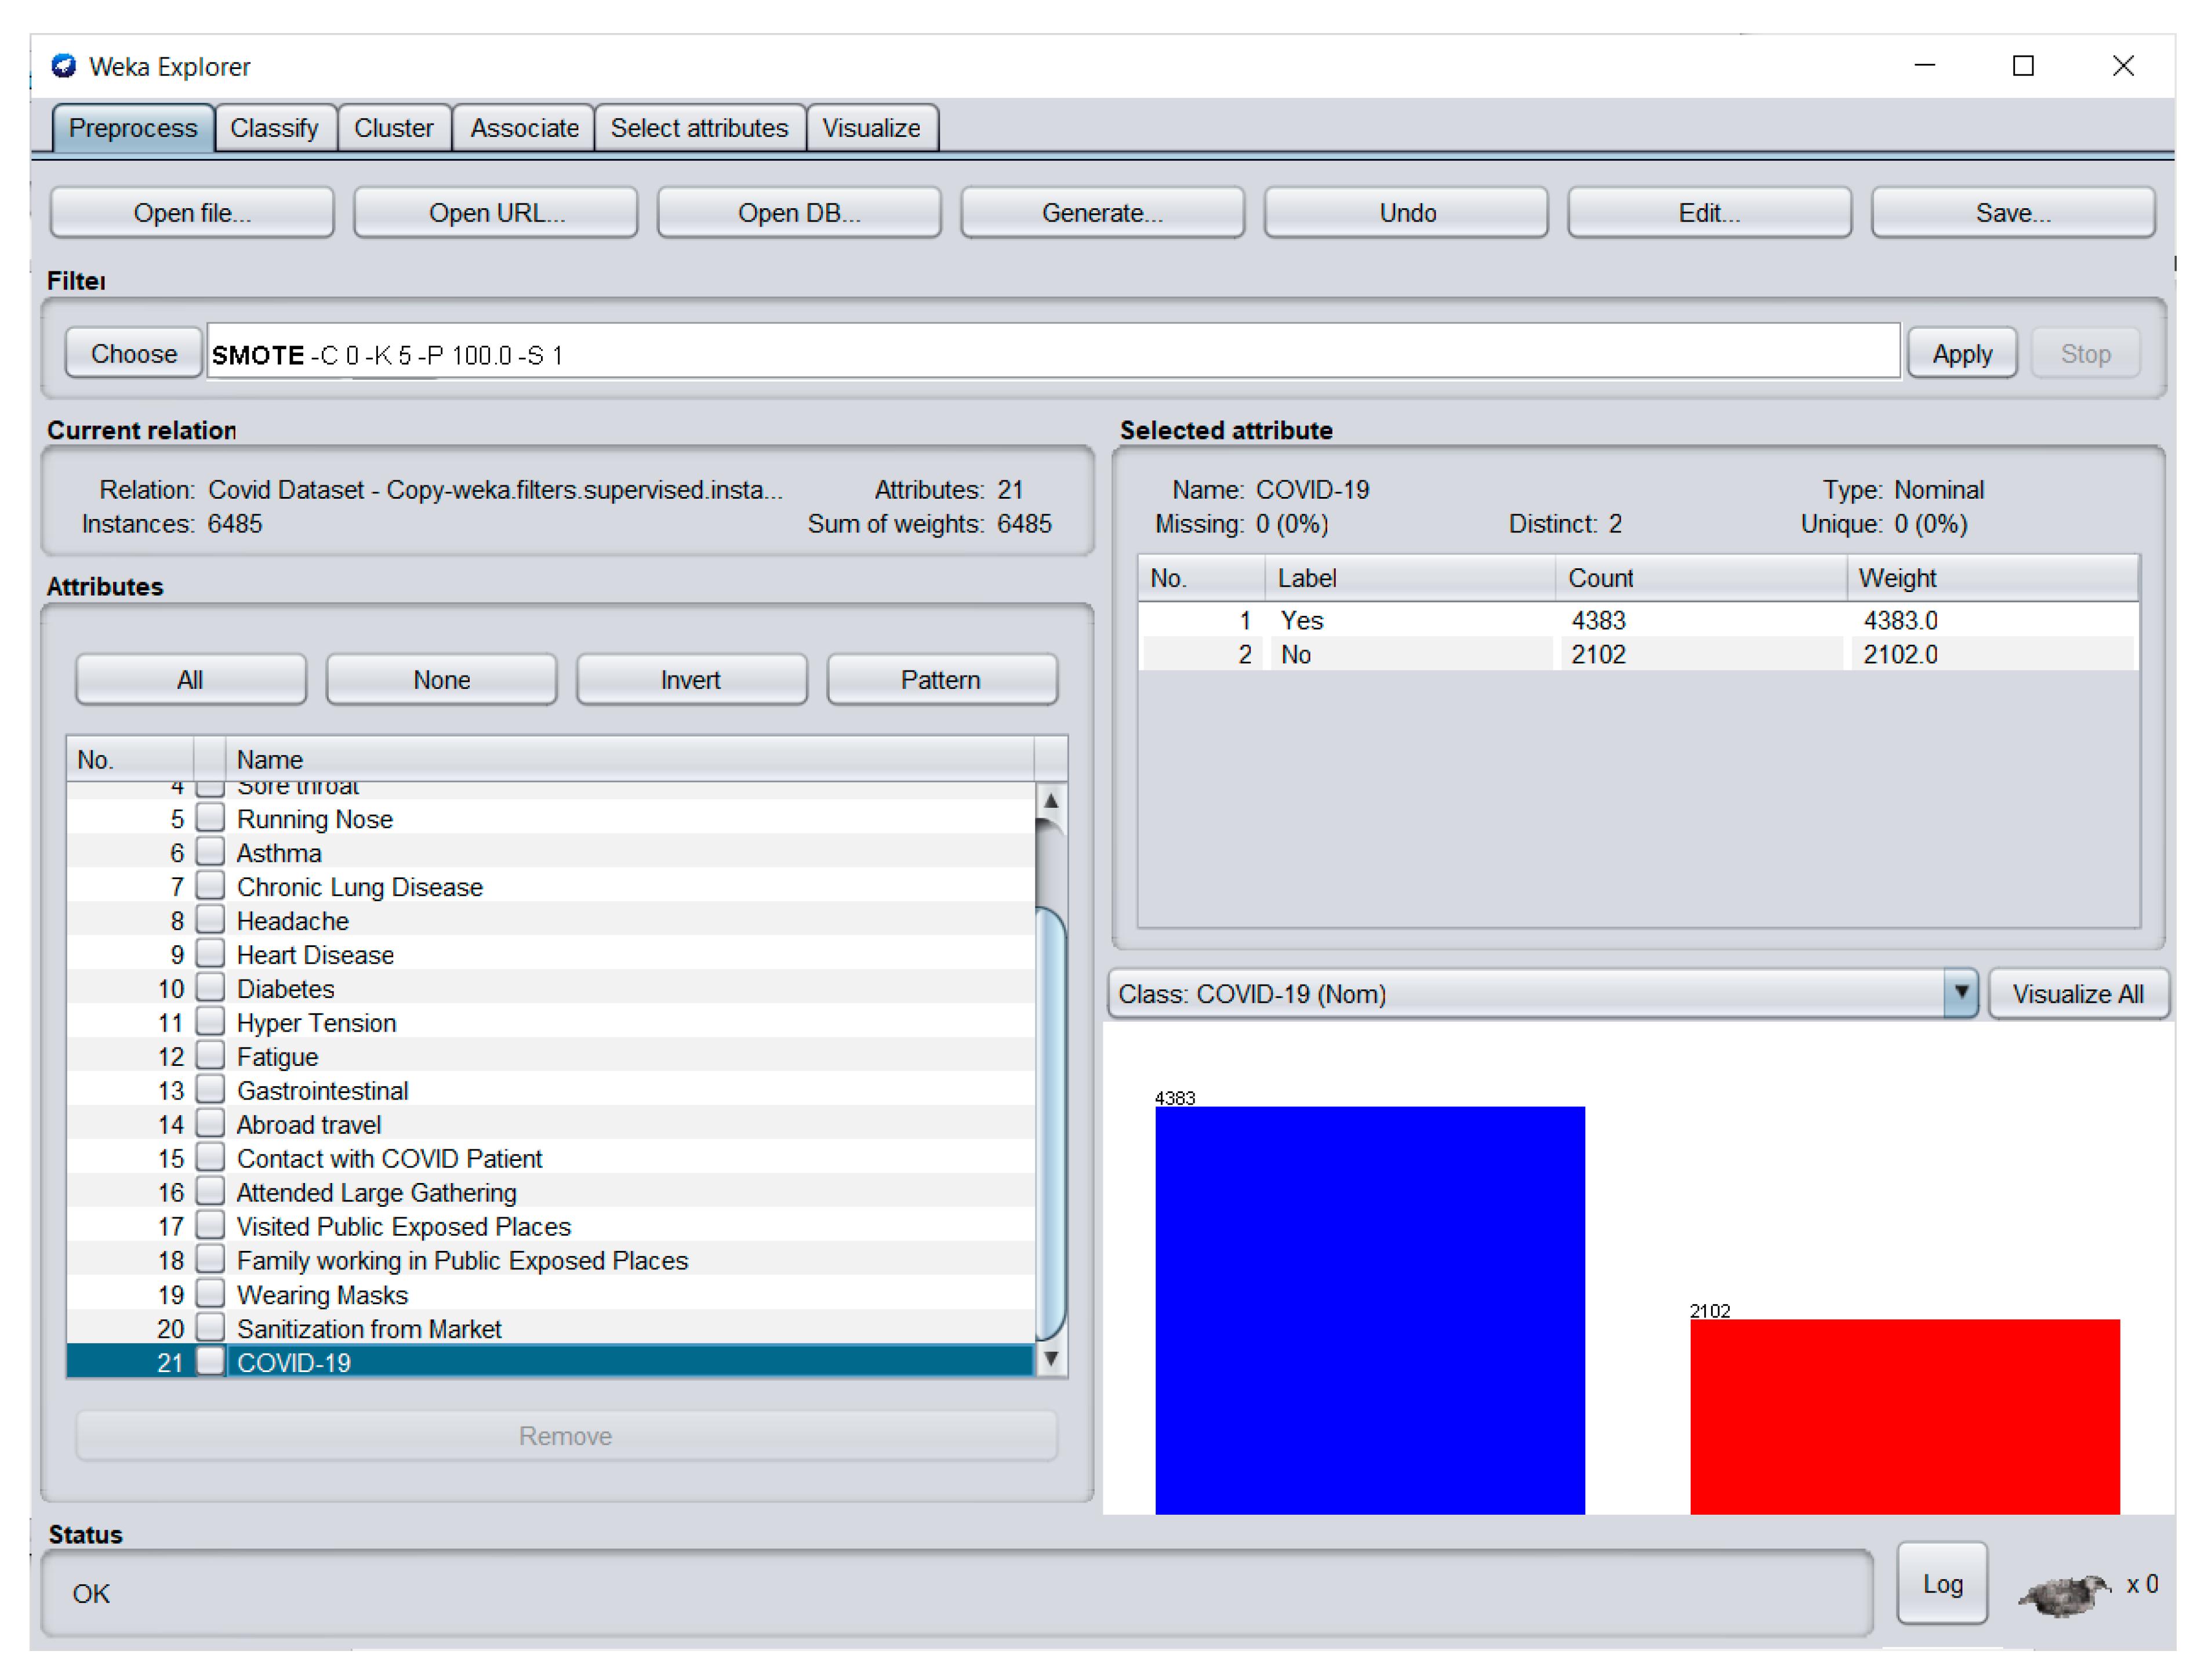
24]. The SMOTE can be used in WEKA by installing it using the Package Manager under the Tools menu of the WEKA GUI Chooser. After installation, the package can be found by opening the Filters folder, then the Supervised folder, and the Instance folder. The details of the updated dataset can be seen in
Figure 4.
In
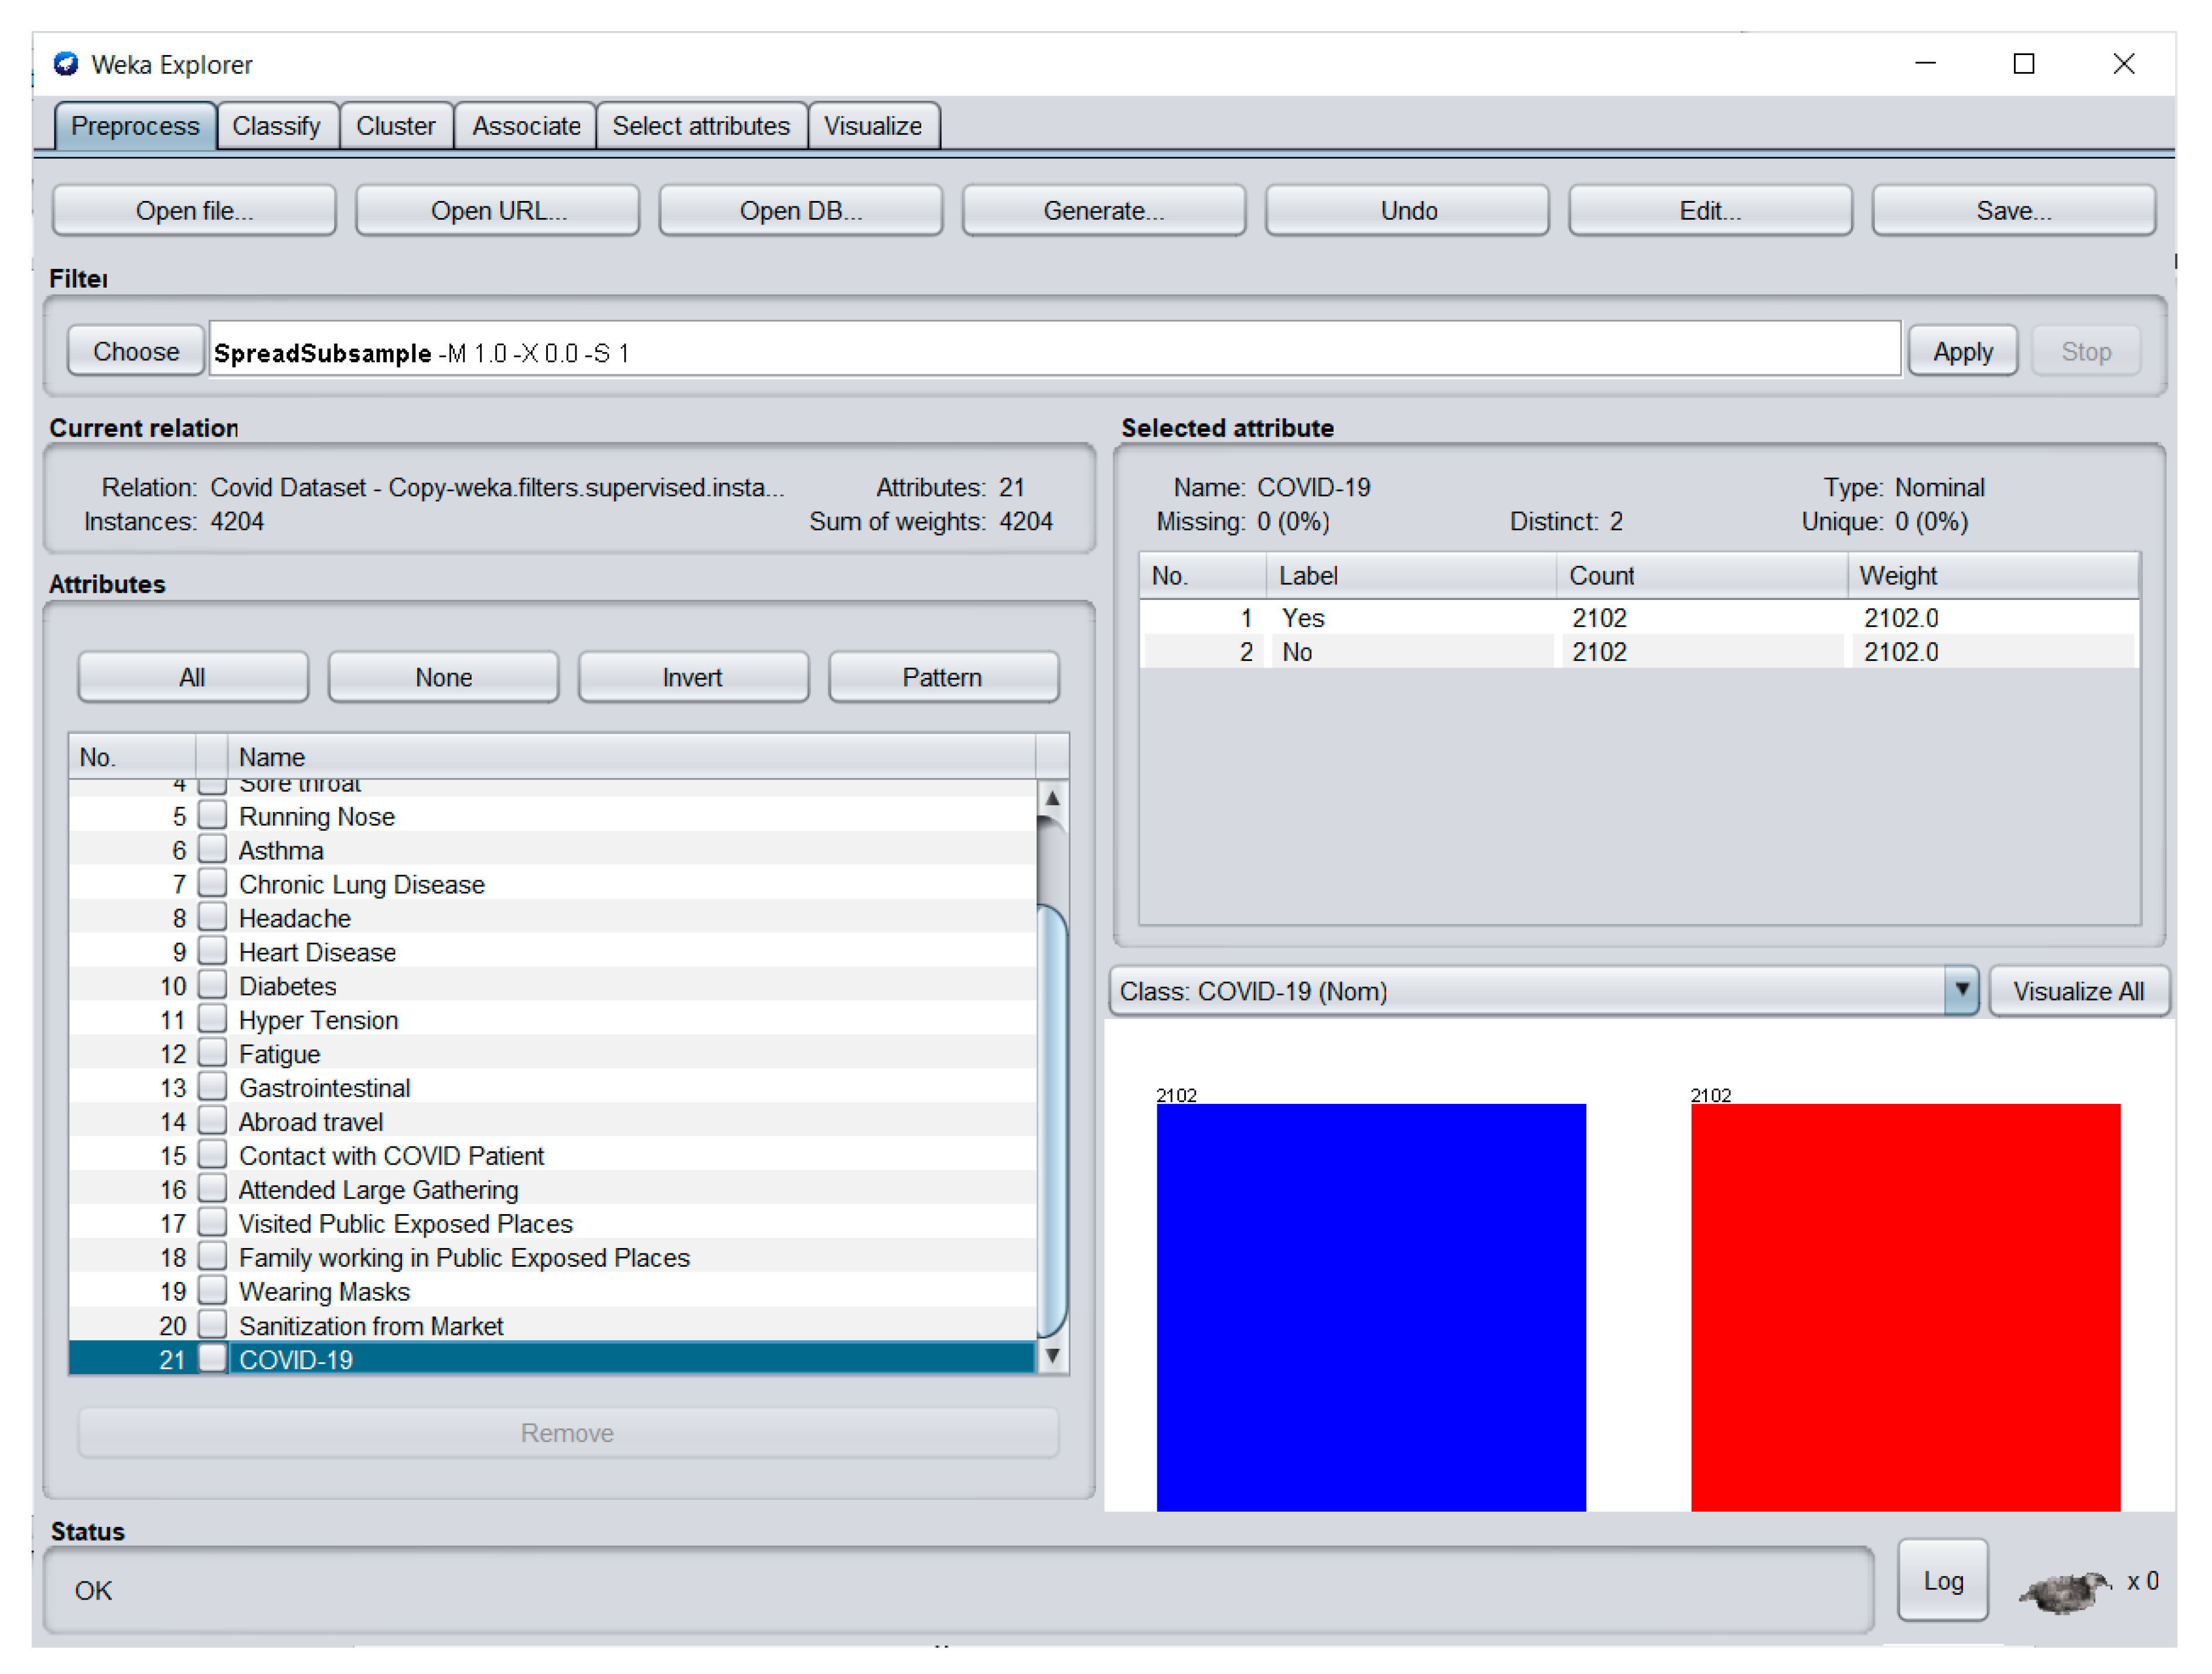
Figure 4, it can be seen that the red bar has been increased, indicating that there are additional samples added into the “No” class. Now that the minority class has gained its number, the dataset is still imbalanced. To address this, the researchers used the Spread Subsample to reduce the number in the majority class and make it even with the minority class. The updated numbers of the classes in the dataset can be seen in
Figure 5.
In
Figure 5, it can be noted that the heights of the blue and red bars are now equal, indicating that both classes have the same values. This is the dataset that has been utilized in this study after implementing both the SMOTE and the Spread Subsample techniques. It is important to use a balanced dataset so that the classifier is well informed on both classes to be predicted, as well as to avoid distribution bias [
25].
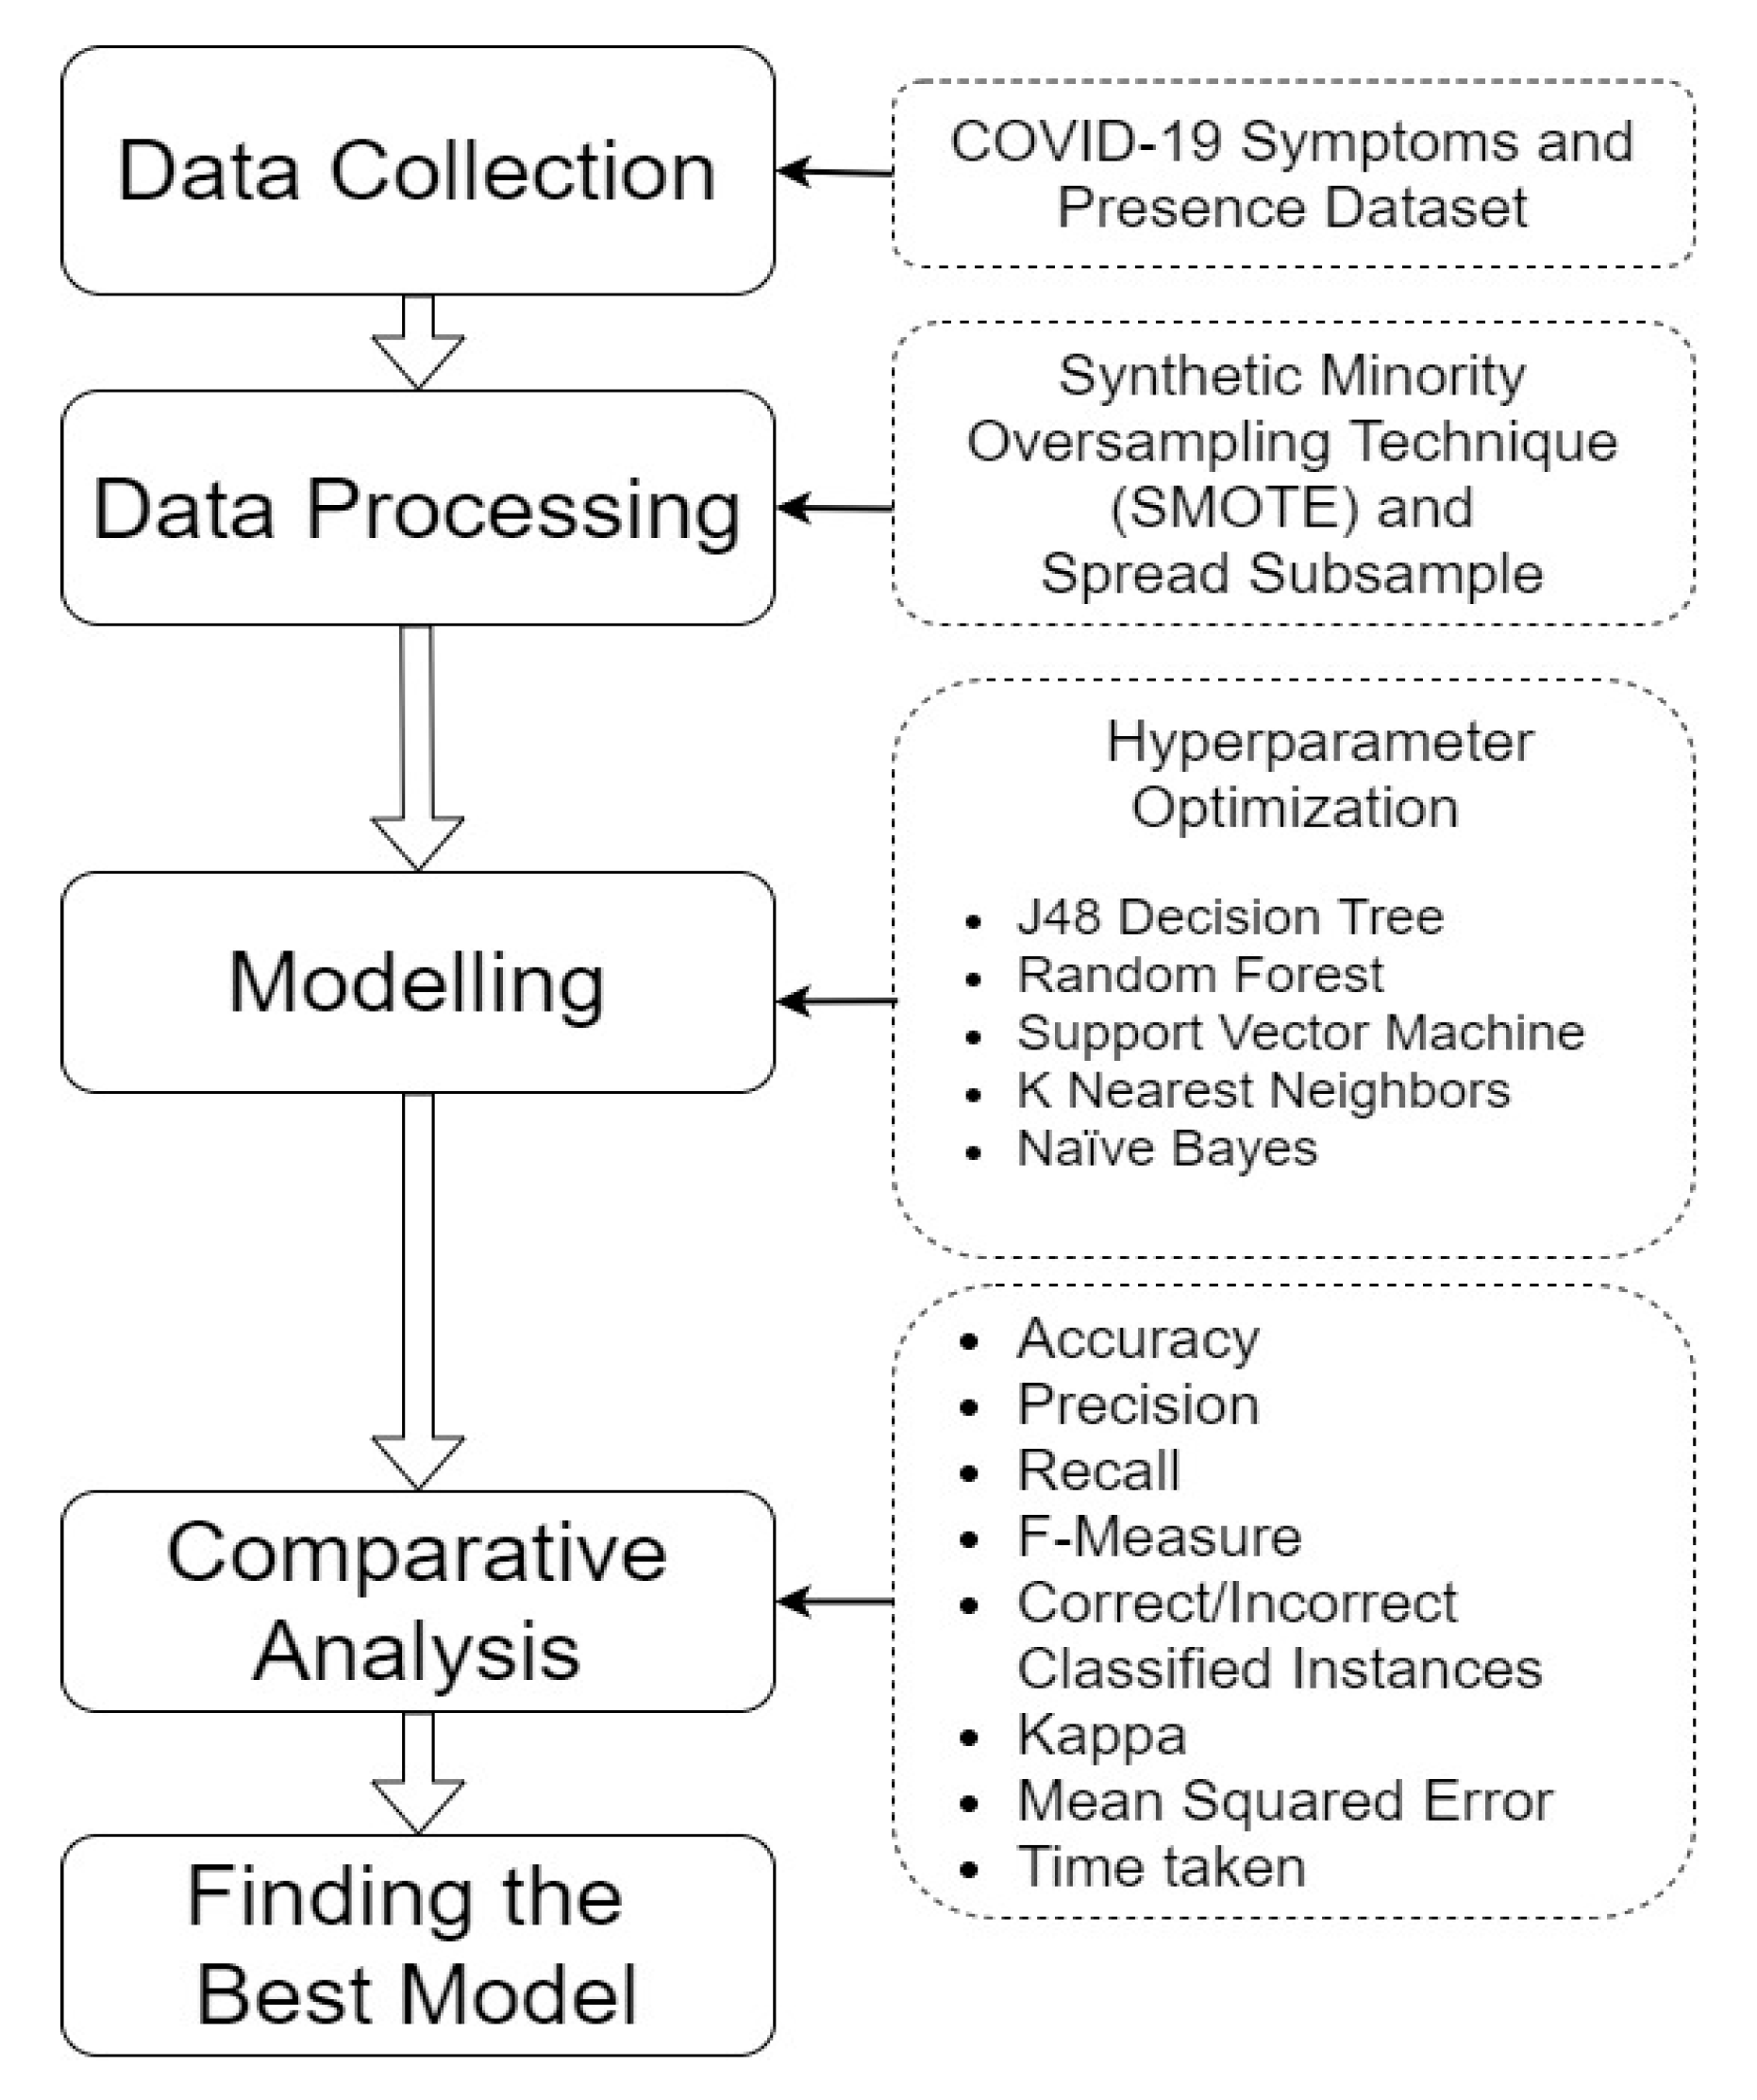
2.3. Modelling
After data processing using the SMOTE and Spread Subsample techniques, several models were built using the WEKA Explorer module utilizing different supervised machine learning algorithms, namely, J48 DT, RF, SVM, k-NN, and NB. In the Classify tab of the WEKA Explorer, the researchers chose the classifier name, and selected 10-fold cross-validation. To determine the best configuration for each algorithm, the researchers performed hyperparameter optimization by performing several trainings with the same dataset for each algorithm. The researchers used 10-fold cross-validation testing and a batch size of 100 for all the experiments.
For the J48 DT, the researchers used two as the minimum number of instances per leaf for all the training processes. The researchers also used a confidence factor for pruning, and unpruned either true or false as the parameters to be tuned. For the RF, the researchers set the maximum depth to zero, which means unlimited depth, and the number of iterations to 100, which is the number of trees in the forest. Bagsize is the parameter that the researchers tuned to determine the best bag size that will yield good results. For the SVM, the C and Kernel hyperparameters were used. The C is the complexity parameter, which determines how flexible the process is in determining the line that separates the classes, and the Kernel determines how the data will be separated, either by a straight line, a curved line, a polygonal or a shape similar to that used in [
26]. In building the model using the k-NN algorithm, the distance function used was Euclidean distance, and the hyperparameters tuned were the KNN or the number of neighbors to use and the Cross-Validate parameter, which indicates whether a cross-validation will be used in determining the best k value. Lastly, for the NB algorithm, the hyperparameters used were whether the process would use Kernel Estimator and Supervised Discretization rather than the normal distribution of numeric attributes.
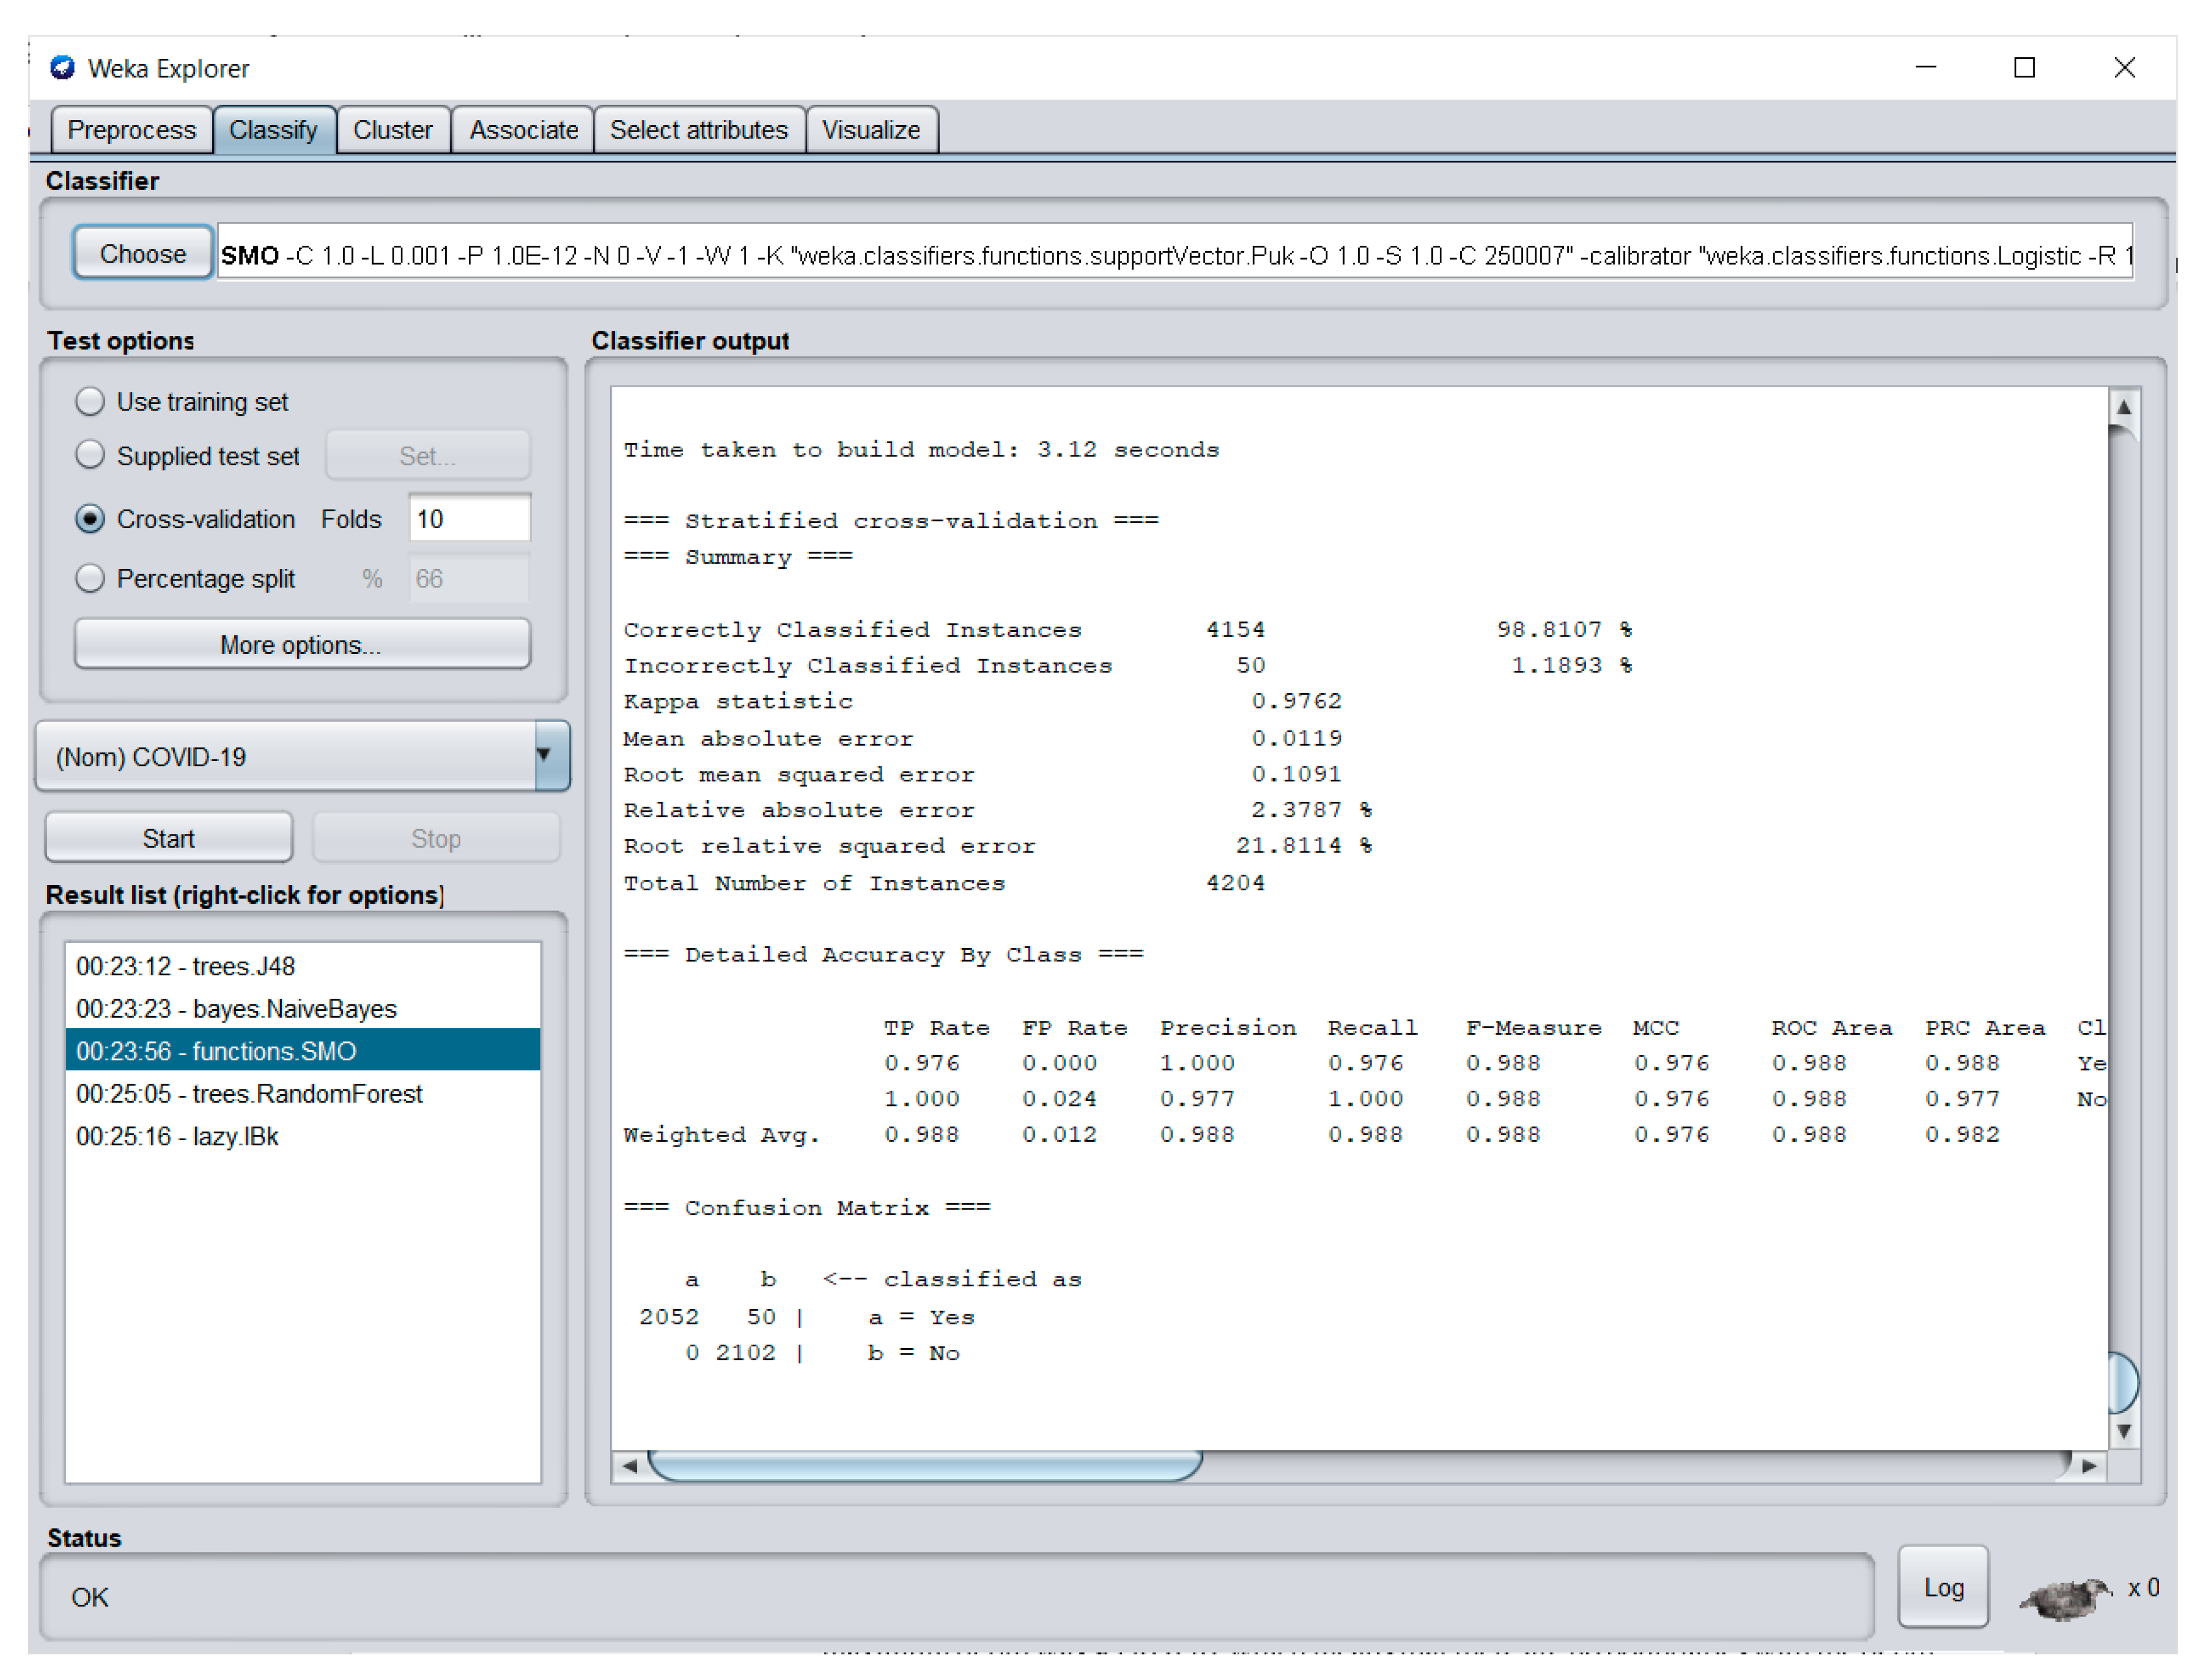
Each algorithm underwent several experimental trainings using the WEKA Explorer Classify tab. For each training, the performance of the developed model was displayed in the classifier output section. An example of the classifier tab with the details of the developed models is displayed in
Figure 6.
In
Figure 6, the Classify tab is displayed. When the user clicks the choose button, the available machine learning algorithm classifiers will be displayed. Several folders with a list of algorithms to be used will be presented, and both J48 DT and RF can be found under the trees folder, while NB is under the Bayes folder, SVM belongs to the functions folder and k-NN can be seen in the lazy folder. When the desired machine learning algorithm was selected, the test option needs to be filled out; in this study the researchers utilized 10-fold cross-validation. Just below the test options section, the class attribute, or the attribute to be predicted, needs to be selected. In this case, the attribute “COVID-19” was the class attribute. To tune the hyperparameters, the label beside the choose button must be clicked to allow the users to input the desired configurations. Lastly, the start button needs to be clicked to start the training process to build the model. To provide a visual representation of building the model, a knowledge flow diagram was devised using the Knowledge Flow Module. The knowledge flow in building the model is displayed in
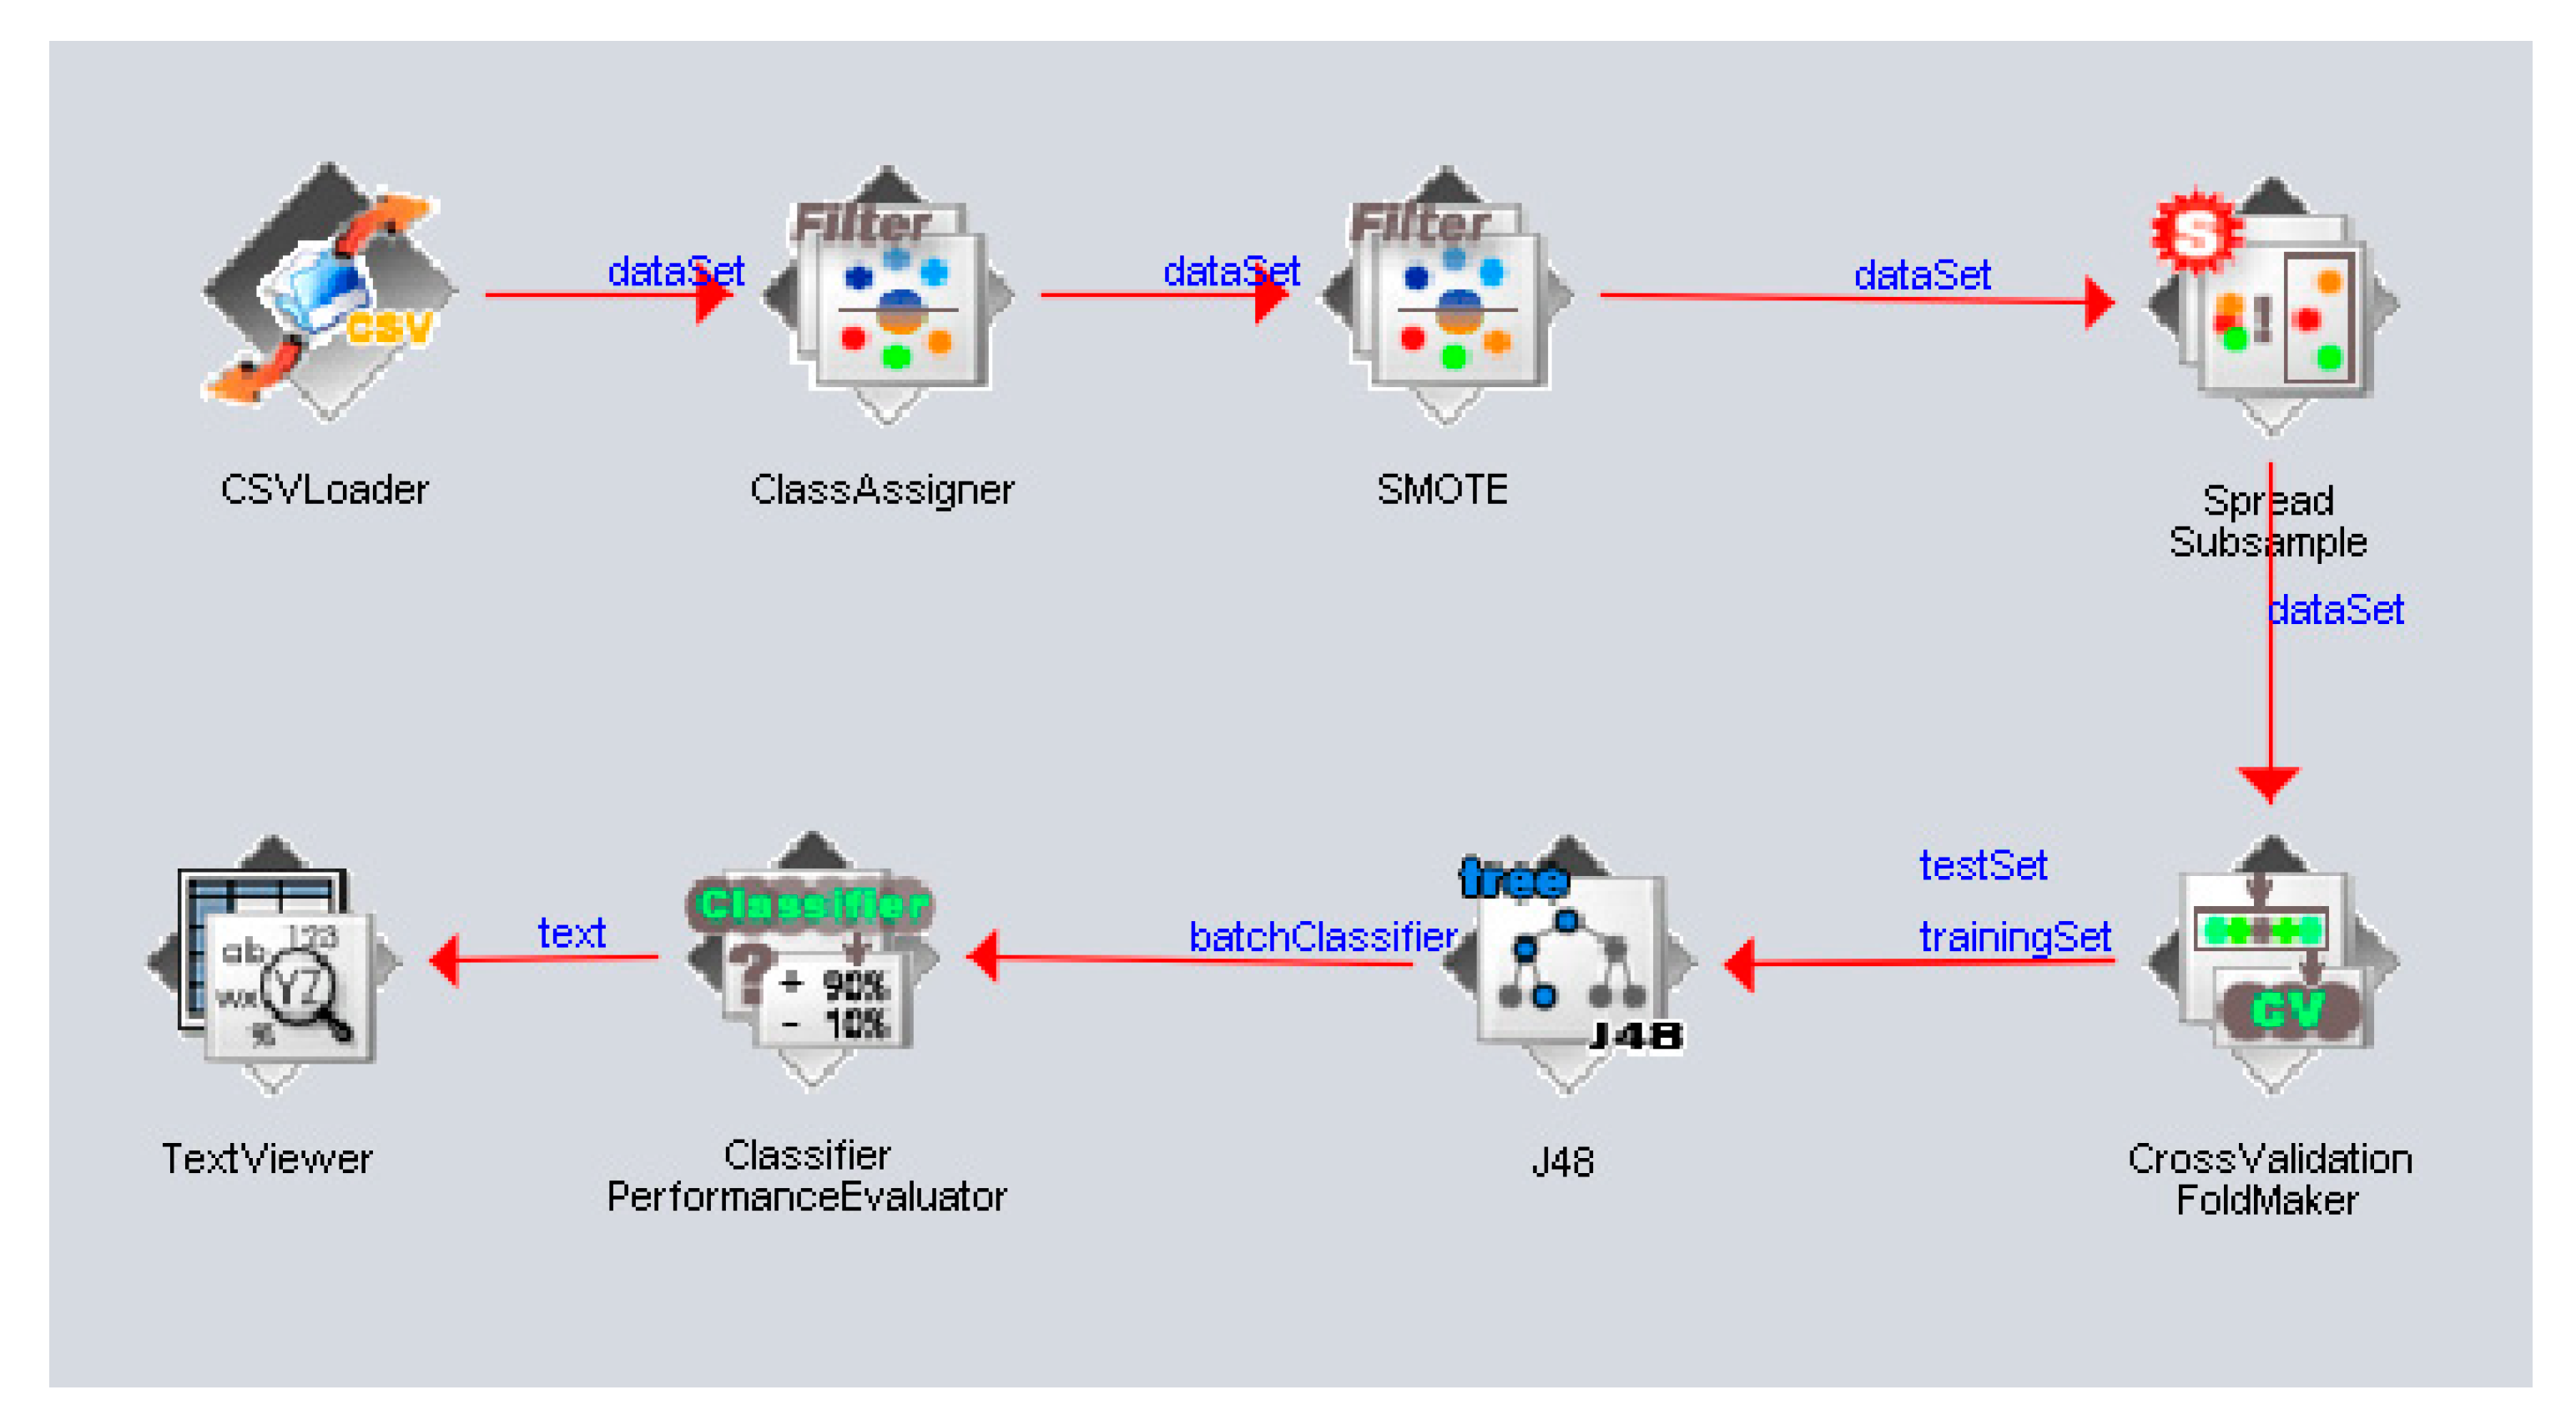
Figure 7.
In
Figure 7, the CSVLoader reads the dataset in comma-separated format, then an attribute needs to be designated as the class attribute; this can be done by using the class assigner. The SMOTE and Spread Subsample techniques were used to balance the dataset, and to perform the cross-validation on the test and training sets, the cross-validation fold maker must be used. The next process is the J48 DT, which is one of the supervised machine learning algorithms used in this study. Here, the knowledge flow proceeds to the classifier performance evaluator to evaluate the developed model, and the performance results can be checked using the Text Viewer. This knowledge flow will be used for all the algorithms used in this study, and all the performance results will be recorded in order to be utilized in the comparative analysis, which is the next phase of this study. The supervised machine learning algorithms used were the following.
A decision tree is an algorithm that produces a graphical tree-like structure, wherein instances are classified using a root node having a test condition (e.g., the person has sore throat or not) and branches that determine the answer, label, or the so-called class. J. R. Quinlan, in his paper entitled “Learning Decision Tree Classifiers”, stated that a tree is either a leaf node or a test node [
27]. A leaf node represents a class to which all the instances belong; if the instances belong to different classes, it is called a test node, which consists of a condition added to the attribute’s value, and a test node can be further represented in two or more subtrees. One kind of decision tree algorithm is J48 DT, which is a common and simple decision tree algorithm used for classification purposes; it uses a divide and conquer approach, which divides the instances into sub ranges based on the values of the attributes [
28].
Just like the DT, the RF algorithm also produces a tree, but for this algorithm, several trees will be generated from the values of random samples in the dataset, and the final result will be based on the results of the majority of the developed trees. RF delivers significant improvements in the classification accuracy of a model through building a group of trees that generate results individually, collating those results and picking up which class obtained the most votes [
29]. An example is bagging, devised by L. Breiman, which is a method of predicting carried out by generating several versions of predictors. The predictors were generated by making replicates of the dataset, then combining each generated predictor to build an aggregated predictor. Bagging also yields significant increases in a model’s accuracy when used in the subset selection for linear regression tasks, and when implemented in classification and regression trees [
30]. In [
29], a tree classifier was represented by
, where the {
} are random vectors that are equally distributed and x is the input. The group of classifiers can be represented as
h1(
x),
h2(
x), …,
hK(
x) whereby each of these classifiers gives a result for the highest probability of a class.
Naïve Bayesian classifier is a statistical supervised machine learning algorithm that predicts class membership probabilities. NB achieves high accuracy and speed when applied to a large dataset [
31], but it also works very well in small datasets [
32]. NB is based on the Bayes theorem formulated by an English mathematician named Thomas Bayes in 1763 [
33], which can be defined as follows.
where
P(
A) is called the prior probability, which denotes the probability of
A happening, and
P(
B) is called the marginal probability, which denotes the probability of
B happening. The probabilities of
A and
B were independent values that do not reference each other. Next,
P(
A|
B) is called the posterior probability, which is the probability of
A happening given that
B has occurred. Lastly,
P(
B|
A) is called the likelihood probability, which denotes the probability of
B happening given that
A is true [
34]. According to the definition given in [
34], the Bayes theorem calculates the posterior probability by dividing the product of the likelihood and prior probability by the marginal probability.
The Naïve Bayes algorithm does not depend on the presence of other parameters, and that is why it is called naïve; it can be represented as Equation (2), while Equation (3) displays another expression of the formula, and Equation (4) removes the constant denominator [
34].
To reach the highest probability amongst the calculated results, the following formula was used [
34].
The Naïve Bayes algorithm has been utilized by several disease prediction models [
11,
12,
13,
14], and achieves competitive accuracy in performing sentiment analysis [
32,
34].
The SVM is preferred by data scientists because it can achieve good performance in generalization without the need of former knowledge or experience [
35]. The SVM algorithm makes use of a hyperplane that separates the instances, putting the same classes in the same division while maximizing each group’s distance from the dividing hyperplane. V. Vapnik, in his book entitled “The Nature of Statistical Learning Theory”, stated that a hyperplane is used to minimize errors arising in separating the instances according to their respective classes [
36].
k-NN is one of the simplest and oldest supervised machine learning algorithms used in classification; it classifies a given instance via the majority of the classes among its
k-nearest neighbors found in the dataset [
37]. This algorithm relies on the distance metric used to determine the nearest neighbors of the given instance, and the most commonly used metric is the Euclidean distance, which is expressed in the following formula:
where an example is defined as a vector
x = (
a1,
a2,
a3, …,
an),
n is the number of the example’s attributes,
is
rth attribute of the example and its weight is referred to as
, and
are the two examples. To compute the class label of an example, the following formula is used [
37]:
where
is the example by which the algorithm will determine the class in which it belongs, the term
is one of the k-NNs present in dataset, and
indicates whether the
belongs to the class
. The result of Equation (7) is the class that has the most members of the k-NN, and is also the class wherein the example belongs [
37]. Euclidean distance is mostly used as a default distance in k-NN classification or k-means clustering to determine the “k closest points” of an example [
38].
2.4. Comparative Analysis
The researchers performed a comparative analysis of the performances of different supervised machine learning algorithms using 10-fold cross-validation testing, and the important criteria used in this phase are the following.
Accuracy is the measurement of all the correctly predicted instances over the total predictions made by the model [
39], and each algorithm can perform differently with regards to the correcly classified instances. Accuracy computes the ratio of the correctly classified instances that are true positives (
TP) and true negatives (
TN) over the total number of predictions, including the
TP and
TN and incorrect predictions, namely, false positives (
FP) and false negatives (
FN). Accuracy can be calculated using the following formula:
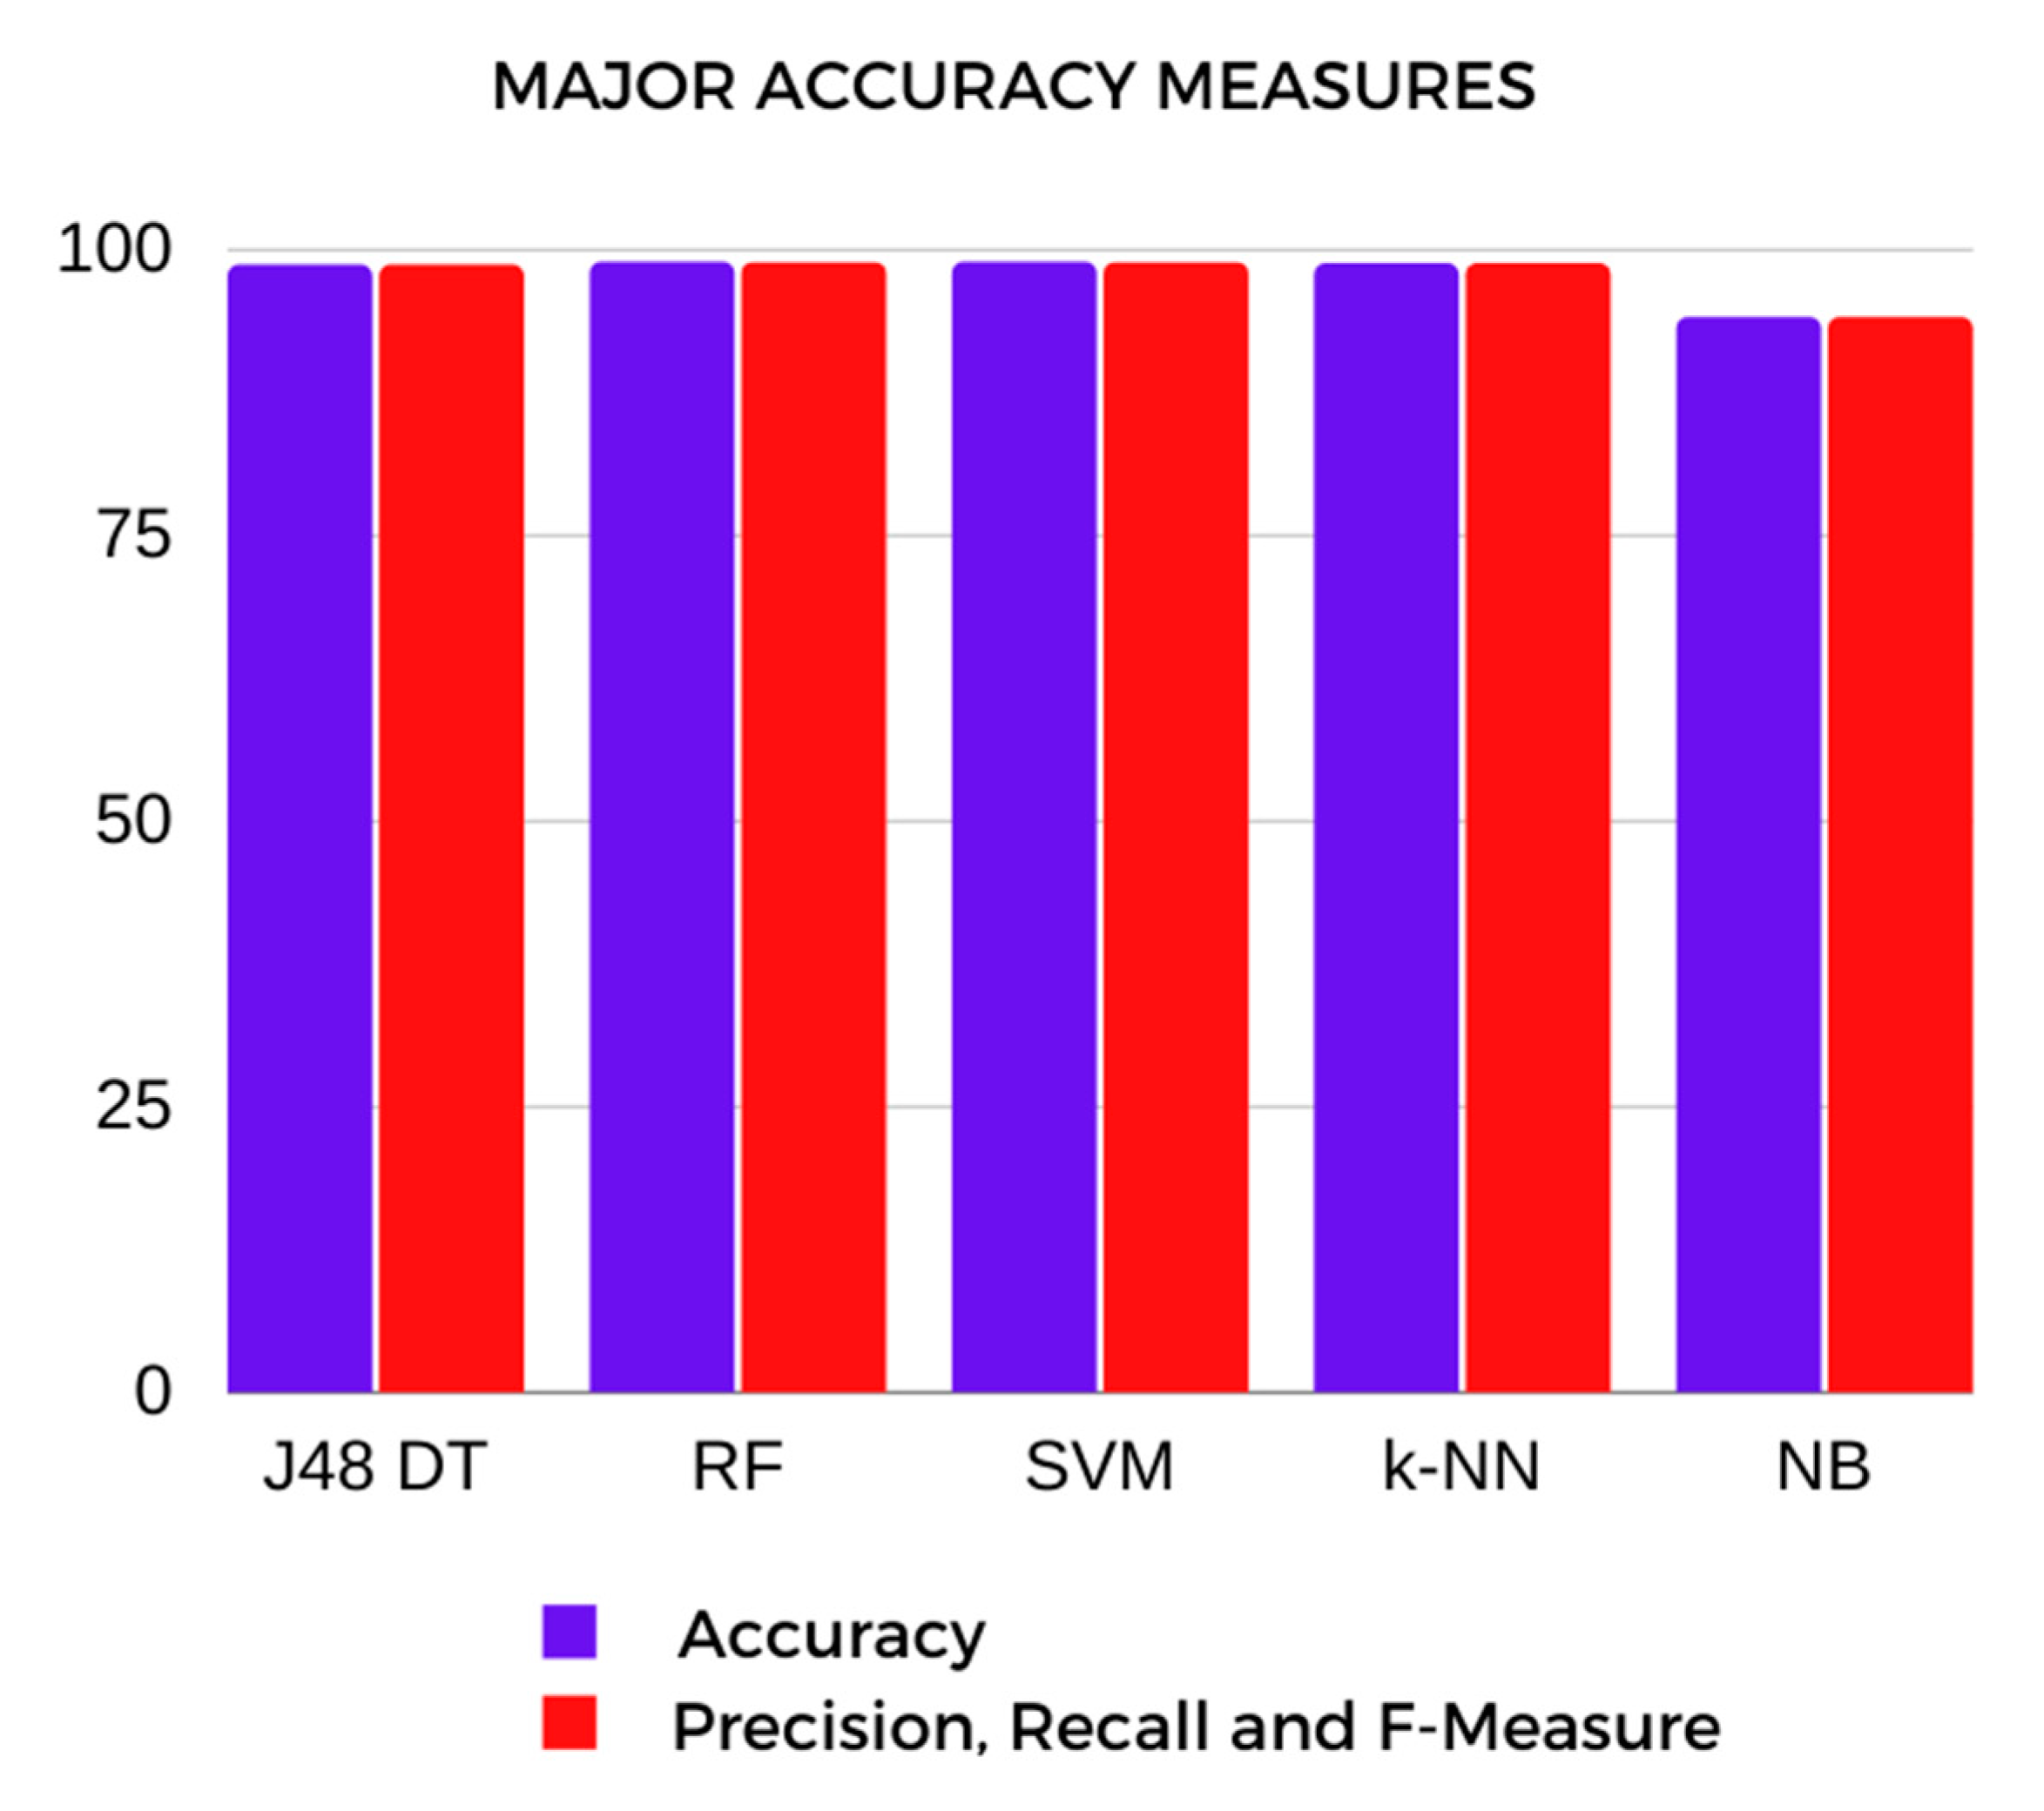
Moreover, major accuracy measures were included in the comparative analysis, such as precision, recall and F-Measure. Precision measures the accuracy of the predictions of
TP over all the predicted positives by dividing the
TP by the sum of
TP and
FP. According to the given description, precision means how many of those classified as COVID-19-positive are actually COVID-19-positive [
39], and it can be calculated using this formula:
Recall measures the accuracy of prediction of
TP over the actual positive instances in the dataset. Recall answers the question, of all the instances who are COVID-19-positive, how many were correctly predicted by the model [
39]? Recall percentage can be obtained by diving the
TP by the sum of
TP and
FN.
Since the precision and recall measure different things, the value of the F-Measure measures the harmony, the balance, of the two criteria. The F-Measure is measured using the following formula. Conversely, the F-Measure score will decline if one criteria is improved at the expense of the other [
39], and it can be calculated using this formula:
- 2.
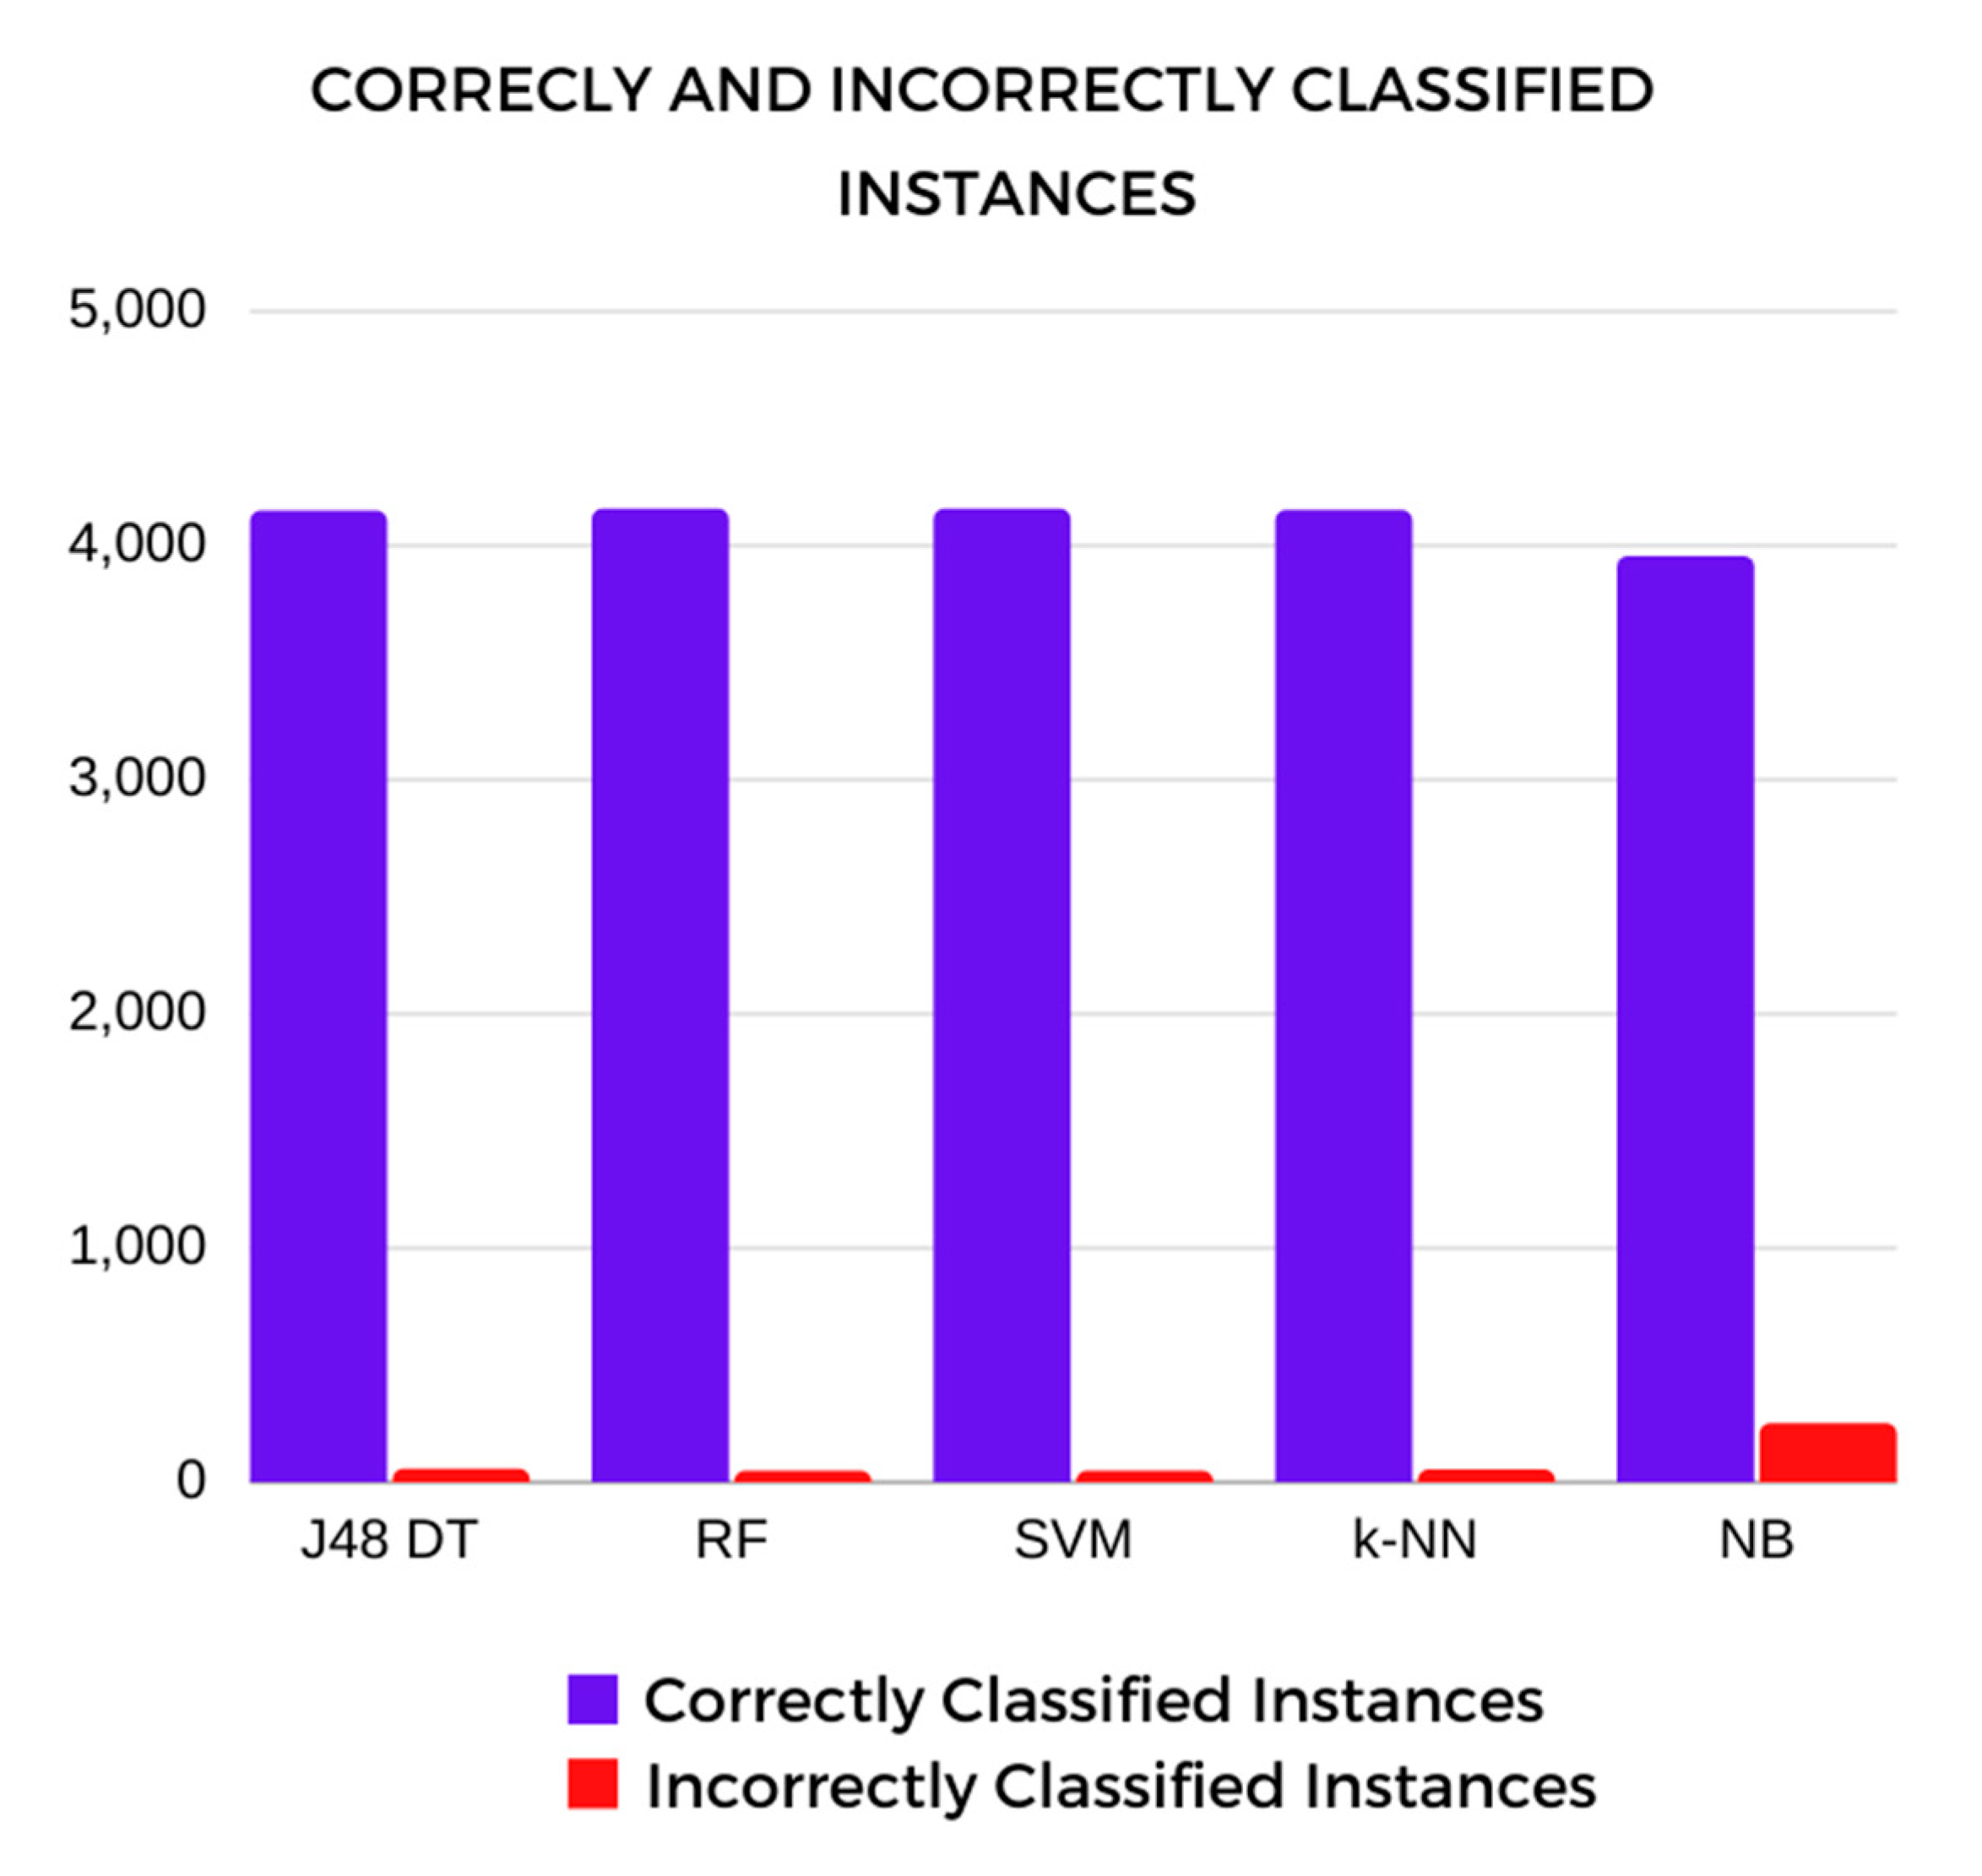
Correctly and Incorrectly Classified Instances
These values were also considered in the comparative analysis of the machine learning algorithms. The correctly classified instances result is the sum of
TP and
TN predictions; conversely, the incorrectly classified instances result is the sum of the
FP and
FN predictions of the model [
40].
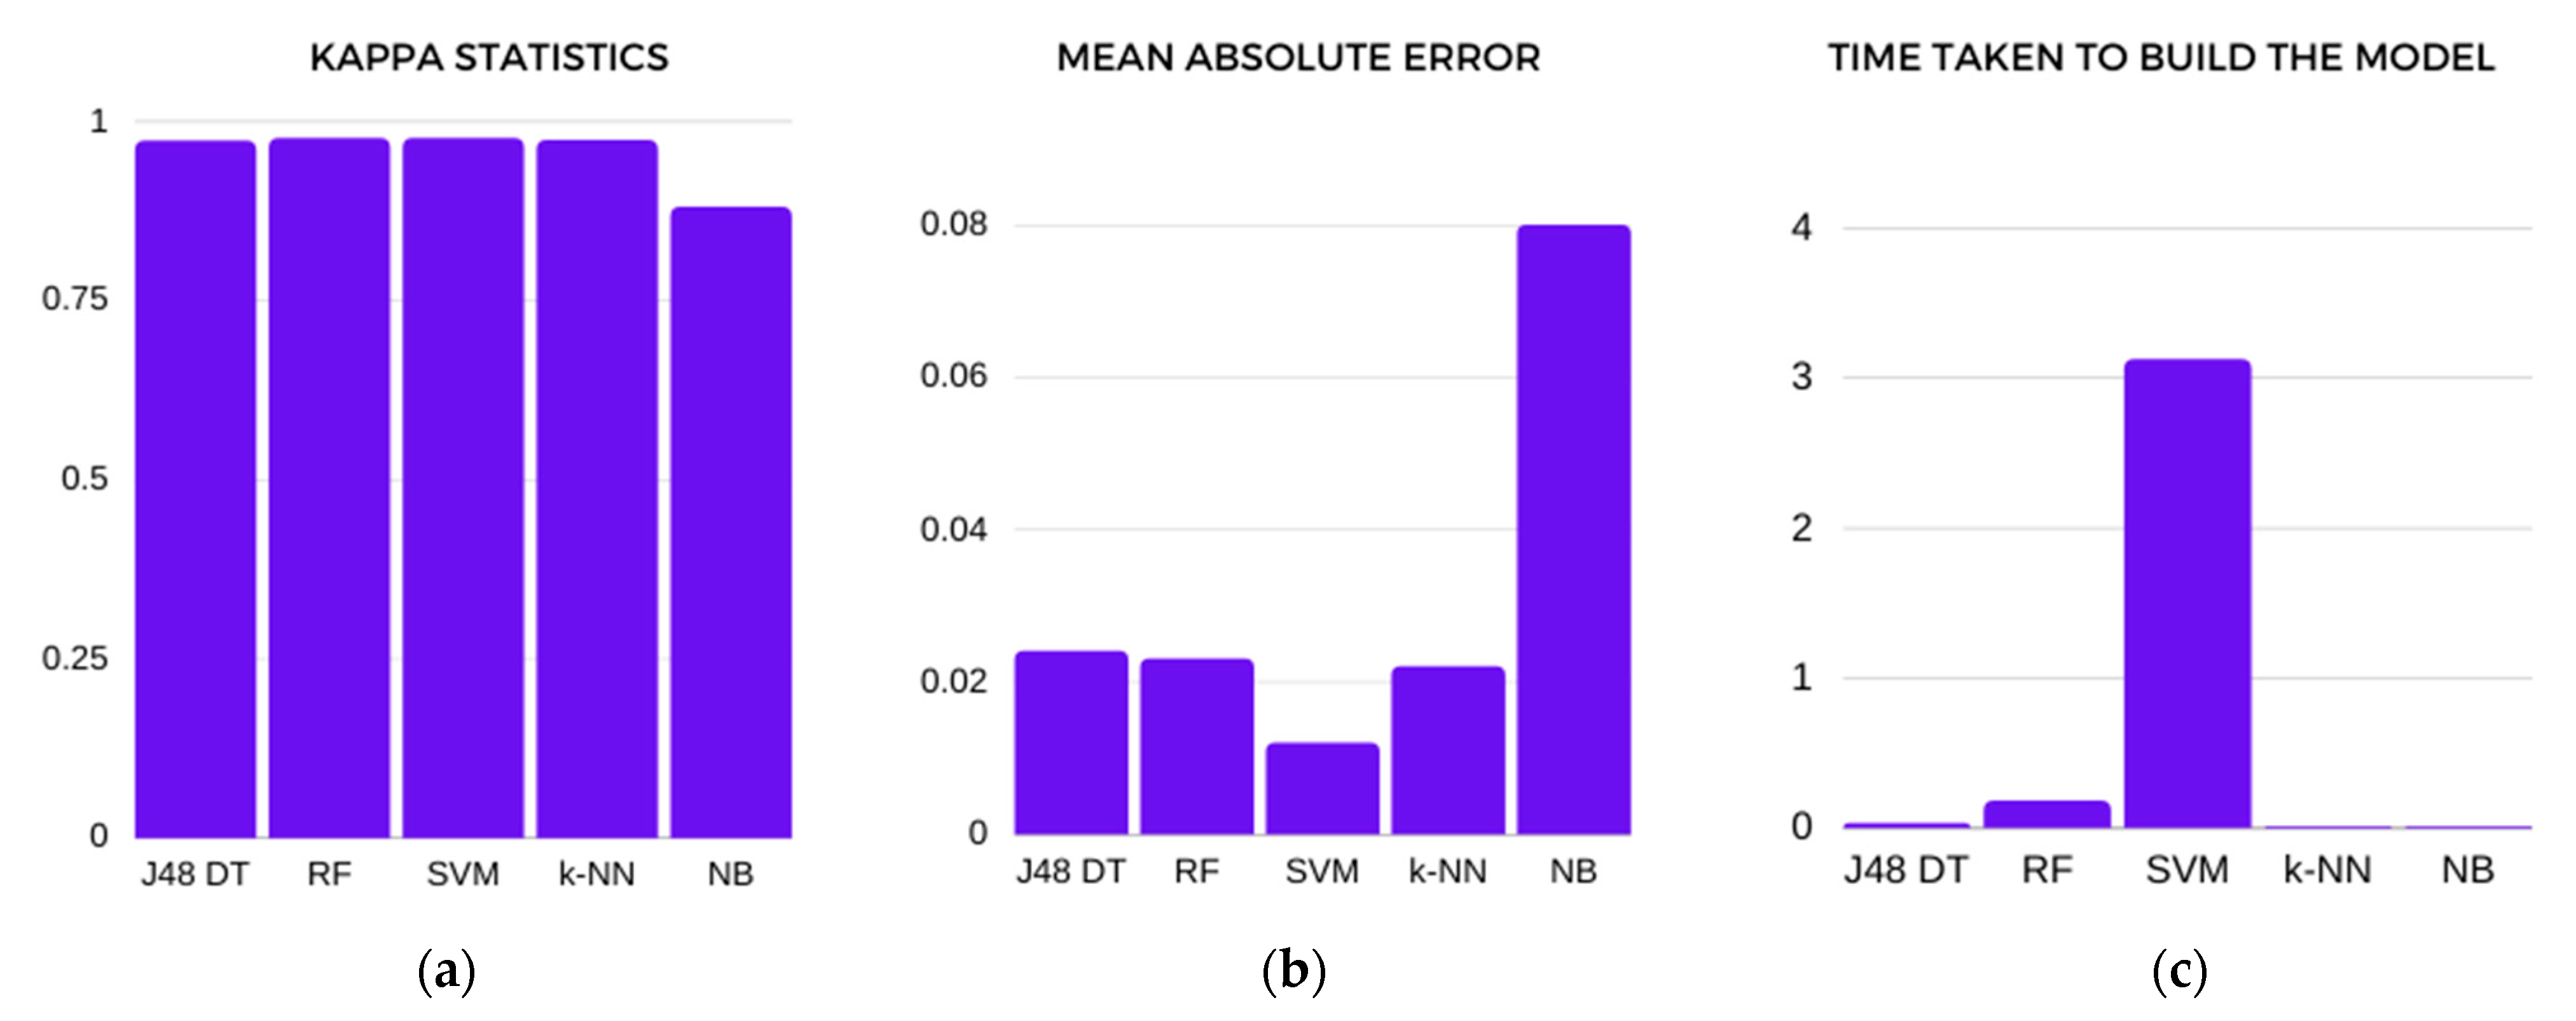
The Cohen’s kappa statistic calculates the reliability of the results between two raters of the same thing; it is how closely the raters agree by chance. A zero score means that there is random or less agreement between the two raters, and the score may be less than zero, whereas a score of 1 indicates complete agreement [
41]. It can be calculated using the following formula:
where
Po is the probability of agreement and
Pe is the probability of random agreement between the raters.
- 4.
Mean Absolute Error (MAE)
To evaluate the performance of the model,
MAE is used to measure the amount of misclassifications or errors in the model’s prediction [
42].
MAE is the average of all the absolute errors; it determines how close the predicted value is to the actual value in the dataset.
MAE can be obtained by the following formula:
where
n stands for the total number of errors, Σ is the summation symbol,
xi is the predicted value,
x is the actual value, and the vertical bars represent the absolute value [
42].
- 5.
Time taken to build the model
The researchers also considered the time taken to build the model, which is expressed in seconds. This value displays the amount of time needed to train the model, which is necessary to find out which model will perform the fastest.


 ,
, 


