
Data Mining Algorithms for Smart Cities: A Bibliometric Analysis


Department of Science and Technology, International Hellenic University, 14th km Thessaloniki-N. Moudania National Road, 57001 Thermi, Greece
*
Author to whom correspondence should be addressed.
Algorithms 2021, 14(8), 242; https://0-doi-org.brum.beds.ac.uk/10.3390/a14080242
Submission received: 16 July 2021
/
Revised: 10 August 2021
/
Accepted: 14 August 2021
/
Published: 17 August 2021
(This article belongs to the Special Issue New Algorithms for Visual Data Mining)
Abstract
:Smart cities connect people and places using innovative technologies such as Data Mining (DM), Machine Learning (ML), big data, and the Internet of Things (IoT). This paper presents a bibliometric analysis to provide a comprehensive overview of studies associated with DM technologies used in smart cities applications. The study aims to identify the main DM techniques used in the context of smart cities and how the research field of DM for smart cities evolves over time. We adopted both qualitative and quantitative methods to explore the topic. We used the Scopus database to find relative articles published in scientific journals. This study covers 197 articles published over the period from 2013 to 2021. For the bibliometric analysis, we used the Biliometrix library, developed in R. Our findings show that there is a wide range of DM technologies used in every layer of a smart city project. Several ML algorithms, supervised or unsupervised, are adopted for operating the instrumentation, middleware, and application layer. The bibliometric analysis shows that DM for smart cities is a fast-growing scientific field. Scientists from all over the world show a great interest in researching and collaborating on this interdisciplinary scientific field.
1. Introduction
The last few decades have observed an unprecedented trend of people moving to live in urban areas, as cities accelerate time by compressing space [1]. The year 2008 was a milestone when for the first time, the urban population surpassed that of rural areas; it is foreseen that until 2050, two-thirds of the global population will be metropolitan inhabitants [2,3]. This trend of people moving to cities causes immense pressure on city infrastructures [4]. Ever since the first cities were built, they have been dependent on technology to sustain life and produce ever more sophisticated technologies and tools [5]. Cities are like dynamic living organisms, and they constantly evolve [6].
The smart city is an innovation of the physical city with high integration of advanced monitoring, sensing, communication, and control technologies, aiming to provide real-time, interactive, and intelligent services to citizens [7]. In order to improve the city services, it is very important to infer patterns and analyze citizen behavior [8] because a smart city must focus on the needs of its inhabitants [9].
A city is a complex system to operate, and new methods are required to manage it and use the massive amounts of data it generates [10]. City administrations can gain knowledge that is hidden in large-scale data to provide better urban governance and management by applying Information and Communication Technologies (ICT) solutions. Such ICT solutions enable better transport planning, efficient water management, new energy efficiency strategies, improved waste management, and effective risk management policies for the city users.
Moreover, other important aspects of urban life, such as public health, air quality, and pollution, and public security, can also benefit from these ICT solutions [11,12,13,14,15]. With the fast development of ICT and ubiquitous mobile computing, large quantities of digital traces that register individual human activities at both spatial and temporal axes have become available [16]. Smart cities administrators can collect information from many sources. These include ambient and mobile device sensor data, as well as Social Media (SM) data.
Data can be tapped from city-wide sites, such as power grid status, transportation grid status, vehicular networks, locations of emergency service providers, and the size of crowds in locations throughout the region [17]. The acquired data are highly noisy and redundant, and systematic use of Data Mining (DM) and Machine Learning (ML) techniques can facilitate processing by extracting only relevant information [18]. Compared to traditional processing methods, ML techniques have some distinct advantages in the extraction and release of big data services. Moreover, with advanced manipulations, Deep Learning (DL) and Reinforcement Learning (RL) techniques could achieve high data rate and precision [7].
This study is a review of work associated with DM techniques used in the smart cities’ context by using bibliometric analysis. We present a comprehensive overview of the interdisciplinary smart cities research field. This review aims to answer the following research questions:
- Which are the main DM techniques used in the context of smart cities?
- How can the knowledge base for the interdisciplinary field of smart cities and their intellectual structure be identified?
- How does the field of DM for smart cities quantitatively evolve over time, specifically with regards to publication and citation counts?
- What is the conceptual structure of data technologies for smart cities?
- What is the social network structure of data technologies for the smart cities scientific community?
The remainder of the article is structured as follows: Section 2 presents a conceptual framework within the field of data technologies used in the smart cities’ context and some background terminology. In Section 3, we describe the methodology of the study. In Section 4, the results of the bibliometric analysis are presented and discussed. Finally, in Section 5, conclusions are outlined, along with future research directions.
2. Conceptual Framework
The smart city concept is about a friendlier, greener, safer, and more sustainable life for citizens. It lays in the explosive growth of ICT due to the advances in hardware and software designs [19]. Revolutionary technologies such as the IoT, SM, and big DM are the e-bricks for smart city development.
2.1. The Internet of Things (IoT)
The Internet changed the way we carry out many of our daily activities, which assisted with efficiently using our significant resources and thereby improving our quality of life [20]. The IoT came to transform physical objects into smart devices that can connect and communicate over the Internet [21]. Demirer et al. [22] defines IoT as “an infrastructure which can interconnect animate and inanimate objects, and communicate with them, connecting to the Internet, store data by collecting them through sensors in cloud systems and provide real-time information to people or machines”. IoT is empowered by using a few unique advances, including sensors, wireless communication, big data technologies, distributed computing, and DM techniques [23]. The main components of IoT are: (1) hardware that consists of sensors, (2) middleware that provides communication between different components, (3) data handling, and (4) data processing and visualization [24,25].
A report by Cisco [26] forecasts that until 2023, more than 14.7 billion Internet connections will occur for IoT applications. According to the IoT paradigm, everything and everyone can be part of the Internet. This vision redefines the way people interact with each other and the objects they are surrounded by [27]. The recent adaptation of different wireless technologies places IoT as the next revolutionary technology by benefiting from the opportunities offered by Internet technology [28]. Just like water, electricity, gas, and roads, IoT will become a new kind of infrastructure resource [29].
The first step toward getting to a smart city is the integration of data collection mechanisms into the system [30]. We use sensors to monitor and alert changes in environments, such as temperature, weight, pressure, light conditions, noise levels, motion, humidity, chemicals, and detect the size, position, and speed of an object [31]. Sensors are often embedded in objects, such as machines or devices [32]. All these sensors provide information that enables the detection of urban dynamic patterns [33]. Sensors can be either wired or wireless. A sensor network connects sensors with one another and transmits signals [28]. The communication between devices and the Internet can be established by technologies such as Bluetooth, ZigBee [34], Wi-Fi [35], RFID, DSL, LAN [31], LoRaWAN [36], LTE, and 5G [37]. Wireless technologies reduce installation and maintenance costs, thus playing a vital role in IoT advancement. Sensor nodes report their results to a small number of special nodes, known as data sinks [25].
In a smart city ecosystem, hard (or dedicated) sensing is the primary sensing paradigm in many applications, as it can be tailored to precisely meet application needs. On the other hand, soft sensing includes various non-dedicated sensing paradigms, such as opportunistic, participatory (i.e., crowdsensing), and social sensing, where citizens serve as sensing nodes. Soft sensing uses smartphone connection capabilities (e.g., GSM, Bluetooth, Wi-Fi) and built-in sensors, such as GPS, camera, accelerometer, gyroscope, and microphone [18].
2.2. Social Media (SM)
Cities are considered living organisms that dynamically change based on their inhabitants’ activities, and this is reflected on social networks and SM [38]. A social network can be defined as a network of interactions of relationships, where the nodes are actors or entities, and the ties (edges or links) represent relationships among them [39]. Nowadays, SM is becoming increasingly popular [40], with the ability to allow people to connect, communicate, and interact with other users [41] and share their perspectives on different areas of urban life [42]. Thus, SM can be viewed as an important real-time source of local information, where citizen opinions can be expressed. Social Media Analysis (SMA) can reveal insights on current city conditions as “reported” by people moving around the city areas [9]. The use of sensors can help identify “what” is occurring but is unable to detect “why” and “how” such an event occurs. In this case, Souza et al. [43] suggest using SM to capture the human perception of incidents, as perceptions of a city event are often described through comments on SM.
SM can change the function of urban spaces, as the diffusion of information can change the way citizens and visitors behave, act and live in the city. Cities are inclined to be increasingly controlled and influenced by top-down and bottom-up organized data platforms. Accessibility and use of such data platforms will most likely become key factors for the city’s future success [39]. As Ju et al. state in the work of [44], citizen-centered strategies that provide real-time insights into citizen behavior and public opinion, which is increasingly created by digital devices such as sensor networks and SM platforms at the individual citizen level, have significant potential value.
2.3. Smart Cities
In 2008, International Business Machines Corporation (IBM) proposed the new concept of the smart city [45] as the potential solution to the challenges posed by urbanization [21]. The term “smart city” defines the new urban environment, one that is designed for performance through ICT and other forms of physical capital [46]. The goal of a smart city is to provide citizens with a promising quality of life by using technology to improve the efficiency of services [47] and address inhabitants’ demands [48] by optimizing its resources [49]. A smart city is conceived as an idealistic city, where the quality of life for citizens is significantly improved by combining ICT, new services, and new urban infrastructures [50].
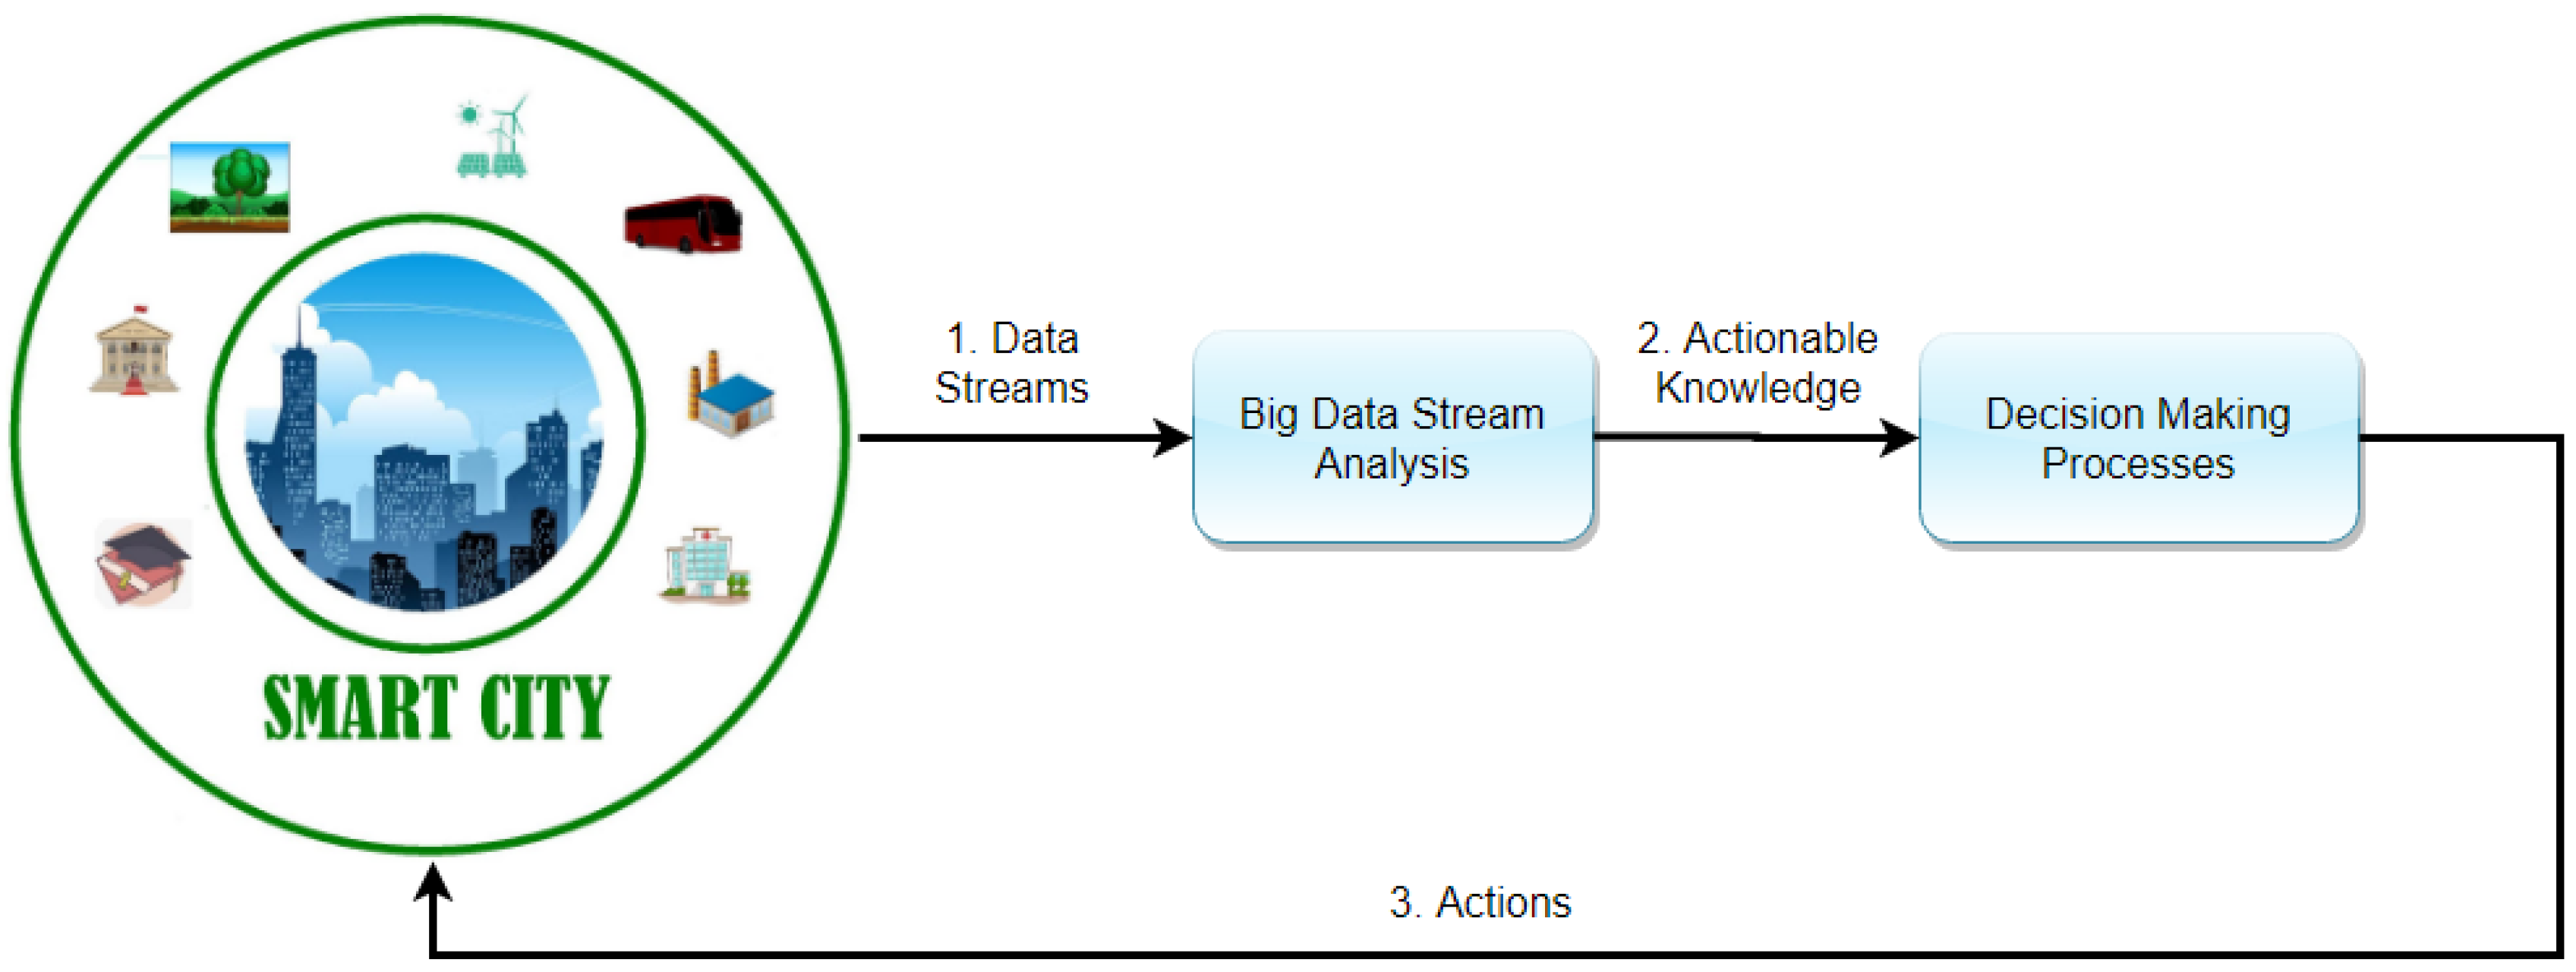
Del Casino [51] considers contemporary cities as repositories of images, movements, flows, and representations. It is important to emphasize that what ultimately makes the city “smart” is not simply data availability but the process of “closing the loop” consisting of sensing, communicating, decision making, and actuating [52]. D’ Aniello et al. [53] consider the smart city as an adaptive system that can achieve two goals: support decision making and enrich the city domain knowledge. They represent the smart city operation in three phases, shown in Figure 1. During the first phase, real-time data streams are generated by hard and soft sensing. These data should be processed in phase 2 to gain useful information able to support decision making. During the third phase, knowledge is transformed into actions in the city.
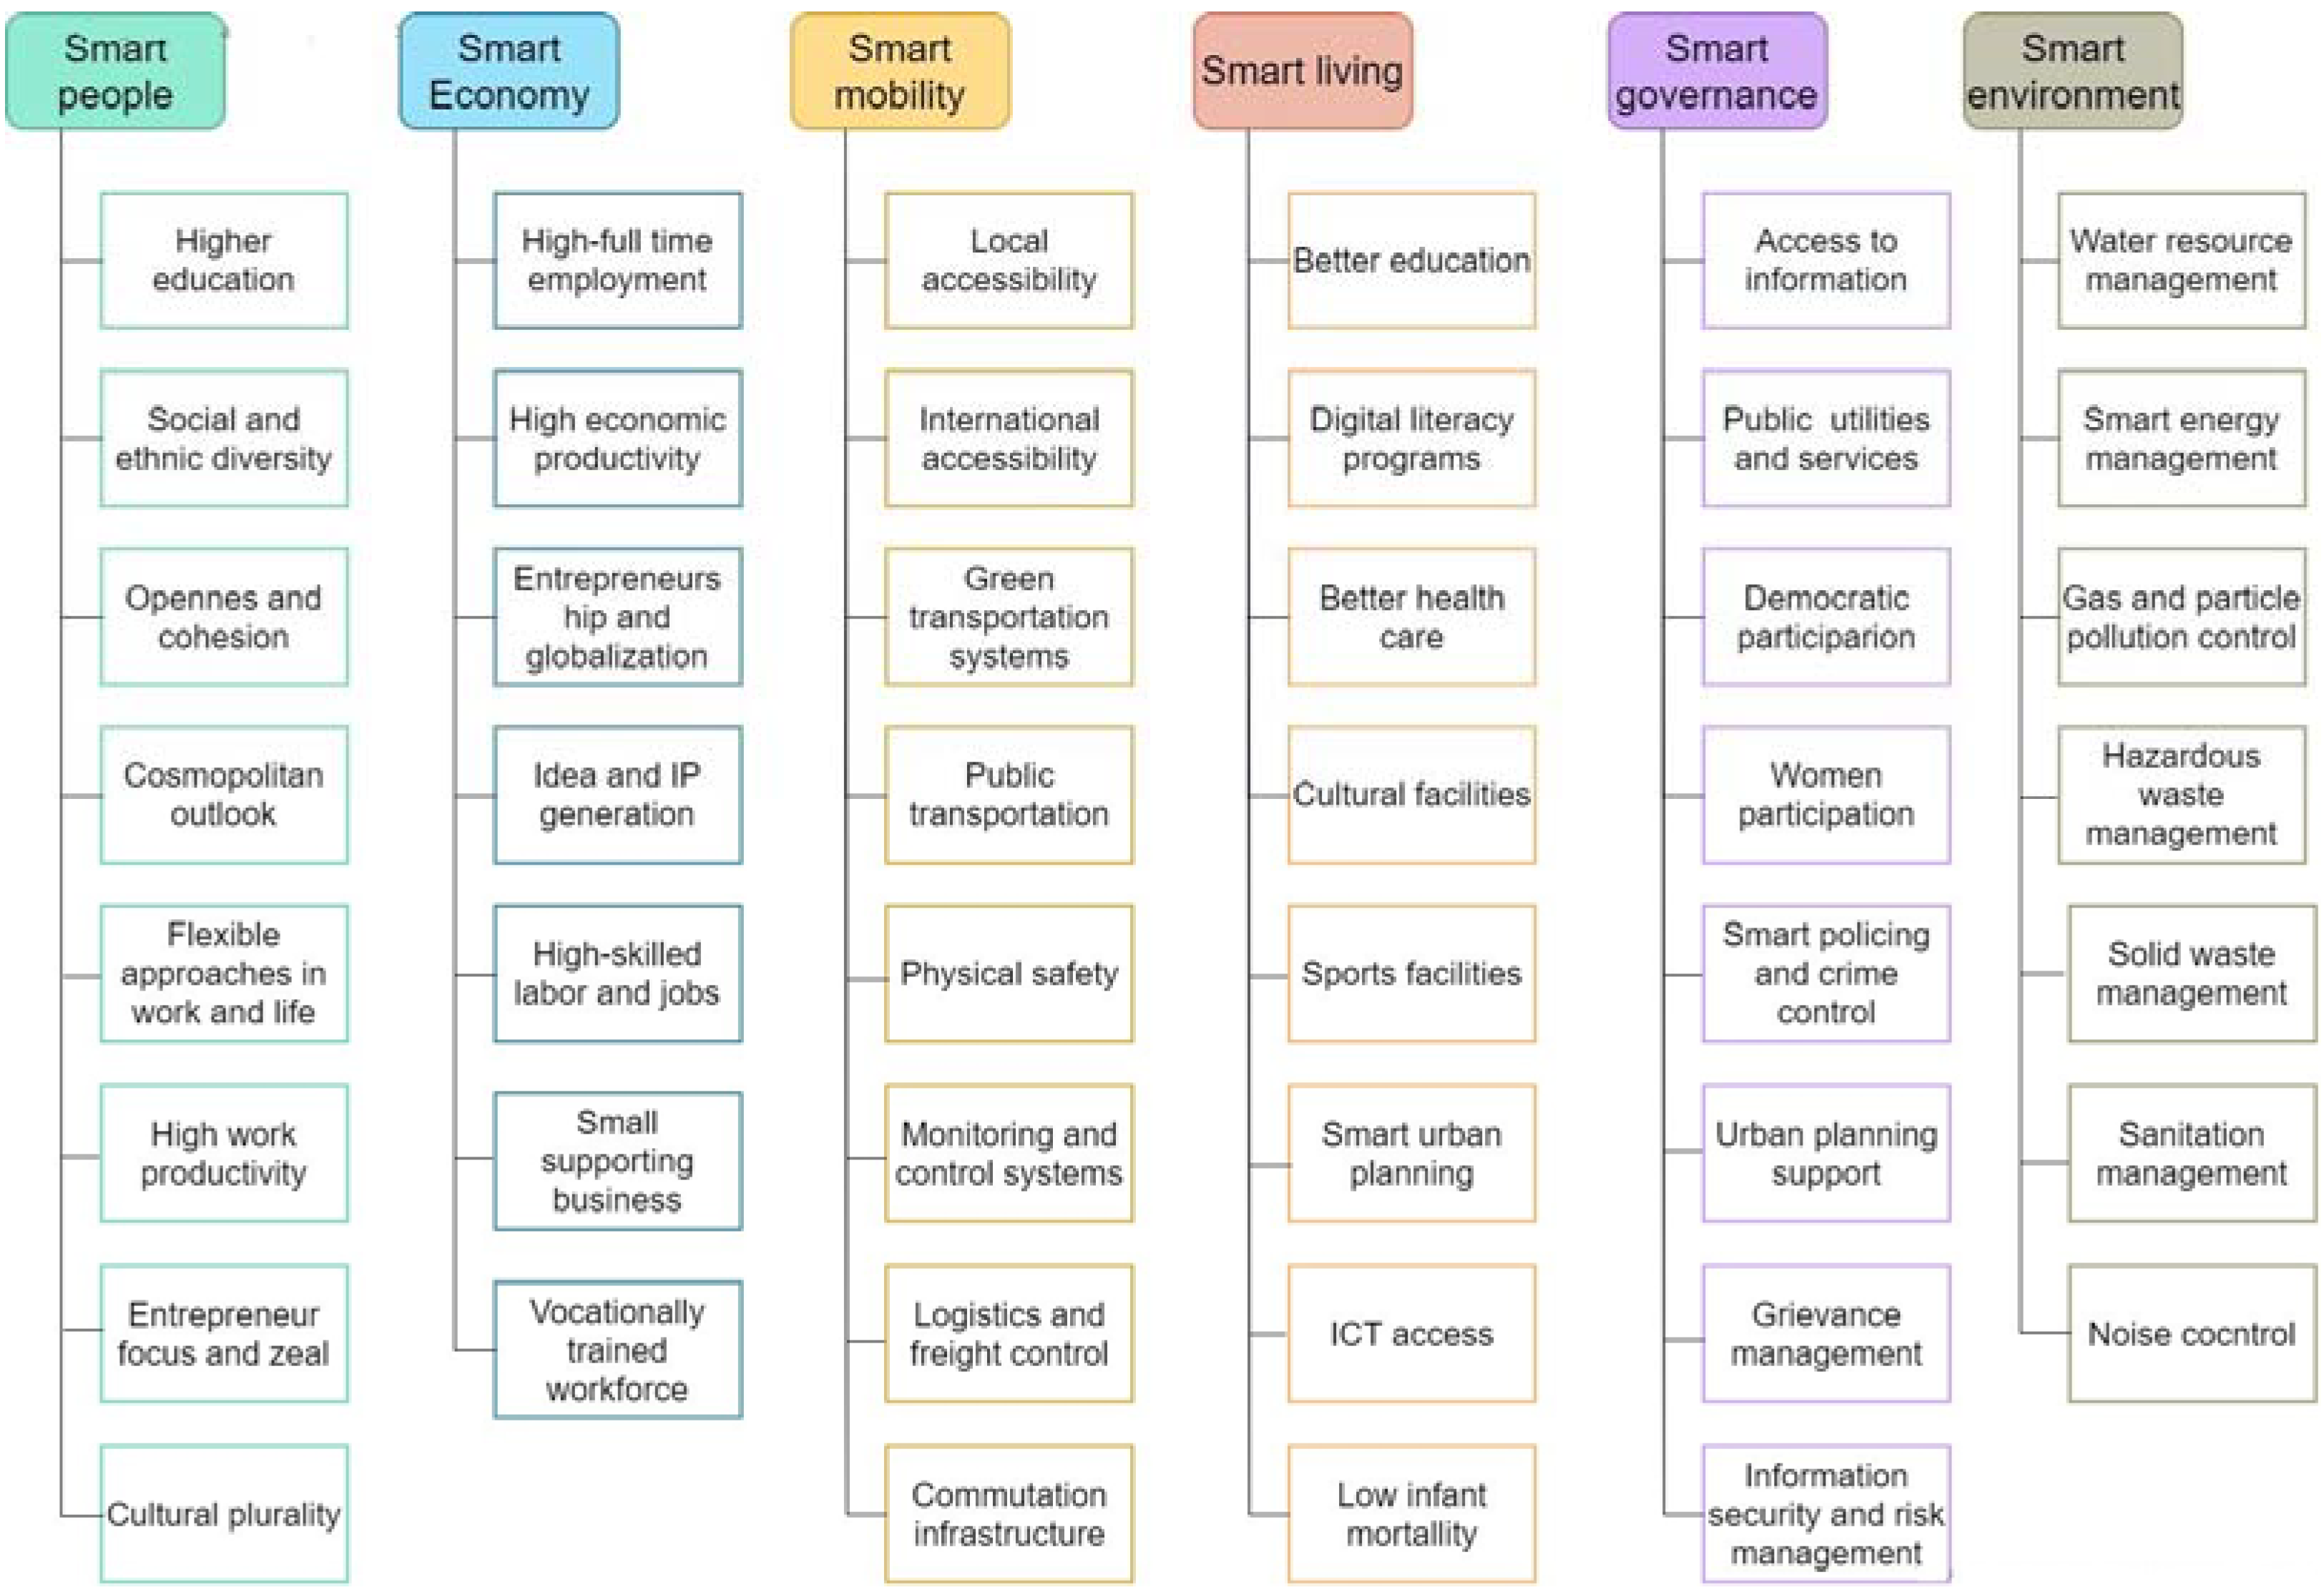
A smart city rests on people, technology, and processes and how they connect with various domains, including healthcare, education, transportation, telecom, tourism, utilities, public safety, and buildings. The characteristics of a smart city could be summarized to include six elements: Smart People, Smart Economy, Smart Mobility, Smart Living, Smart Governance, and Smart Environment (Figure 2) [50,54,55]. Li et al. [29] state that economic development, environmental issues, social equity, and sustainability for a smart city can be achieved only if all these aspects are equally considered.
The smart city is built on the infrastructure of the digital city. A digital city provides a 3D geospatial framework for cities, while the IoT embedded in the ubiquitous sensor network realizes real-time sensing, measuring, and data transmitting of still or moving objects [29]. The interaction of computational and physical components, specifically the use of cyber-physical systems, led to the advancement of such integration [30].
Williamson [56] uses the concept of “programmable city” as a prototypical code/space, where city functions are delegated to computational systems, which then renovate how they act. The term “code/space” articulates how the space phenomena translated into code that then acts recursively to alter them. The digital and physical cities are linked by IoT, thereby forming an integrated cyber-physical space. In this space, the state and changes in the real world will be sensed automatically in real-time [45]. In general, a digital city is a harmonious framework encompassing all kinds of information to ensure the city functions smoothly and orderly. Moreover, a digital city, as a considerable version of our real world, contains all the natural, social, and economic information related to the physical city [29].
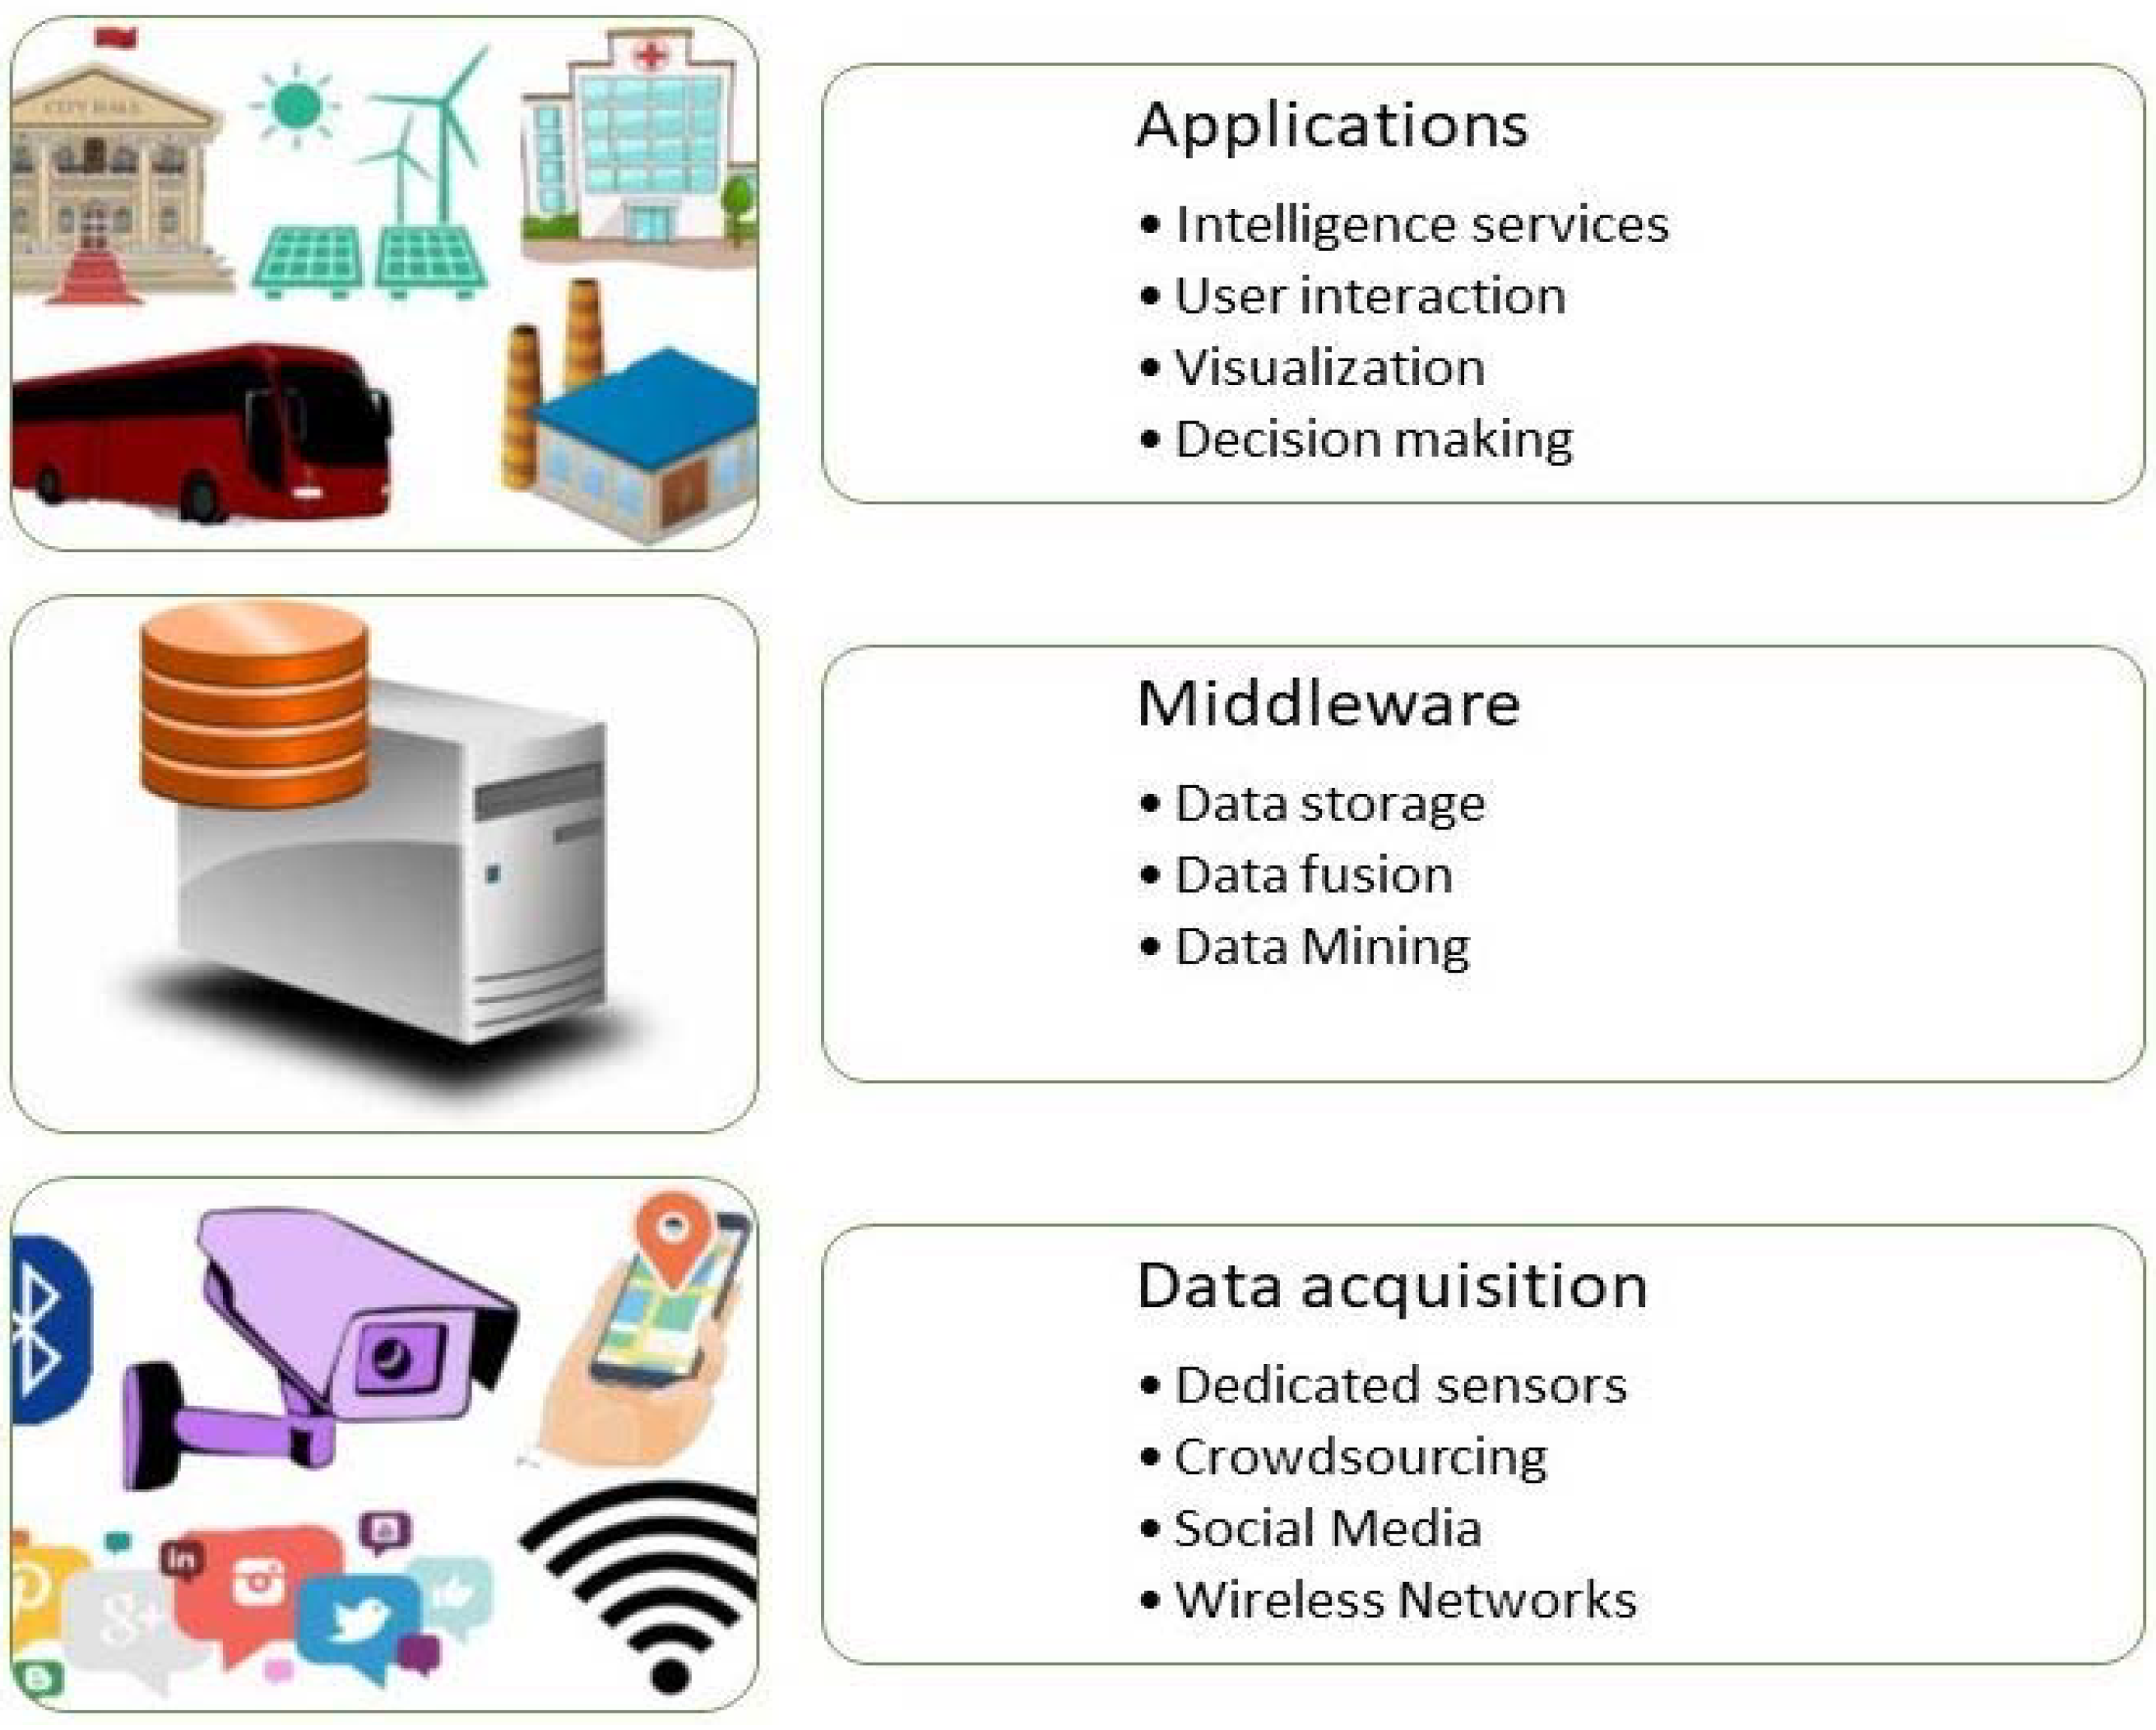
The overall architecture of a smart city has a hierarchical structure of three layers [1], as shown in Figure 3:
- The “instrumentation” layer. The distributed sensor grid is embedded in infrastructure for acquiring and transferring real-time environmental and social data. Data acquisition elements are responsible for collecting and locally storing external data. It can capture any kind of information, including images, video, sound, temperature, humidity, pressure, etc. The network elements are used for data transferring and information routing between the distributed sensor layer and the service-oriented middleware layer. In other studies [29,30,33,45], we find this layer as two separate layers, sensors and network layer.
- The service-oriented middleware layer takes charge of massive data storage, real-time analysis, and processing. It is based on cloud computing, DM, and highly efficient index services. The results can be used to support the decision making and effective operation of smart city applications.
- The application layer for end users applies tailored intelligence services to different domains, and it is responsible for interacting directly with the user. It provides the user with information in a comprehensible manner, such as graphical forms, tables, or other presentation types, and facilitates interaction with the system.
This architecture projects the trip of big data from their origin in raw structure until valuable information and knowledge being extracted for the benefit of decision makers and citizens [57].
2.4. Data Mining Technologies for Smart Cities
In a smart city application, the production of analytics can lead to advanced insights, a better understanding of city phenomena, and supports the design of evidence-based urban strategies and innovation [53,58]. Searching for interesting patterns and correlations [3] in the public-service facilities of developed cities using a DM approach has gradually become a significant area of research. The extracted patterns can be used to plan layouts or arrange new facilities in cities [59]. Advancements of big DM technologies can support, explore and discover environmental and societal changes, including how people go about their life, behavior, and preferences; social trends, and public opinion [45,60]. DM and ML are vital technologies for data-centric applications for smart cities.
DM is a broad field that includes many algorithms and techniques from statistics to ML and information theory to extract information from data [57]. DM aims to build computer programs that extract hidden, previously unknown, and potentially valuable information from data [61]. The process must be automated or, more usually, semi-automated, and the regularities or patterns discovered must be meaningful in a practical sense [62]. Big DM needs to extend the entire process to the front and back end, under the characteristics of big data. This involves processing and analysis of massive and heterogeneous data, automatically discovering and extracting implicit, hidden patterns, rules, and knowledge, and visualizing them in an easily understandable form [45].
ML is the study of how to build computer programs that improve their performance at some tasks through experience [63] to address problems in which human expertise does not exist or when it is difficult to express it [64]. With this technology, the algorithm is training computers to learn from a past experience E regarding task T and some performance measure P, if its performance improves on task T, with experience E, computed by P [62].
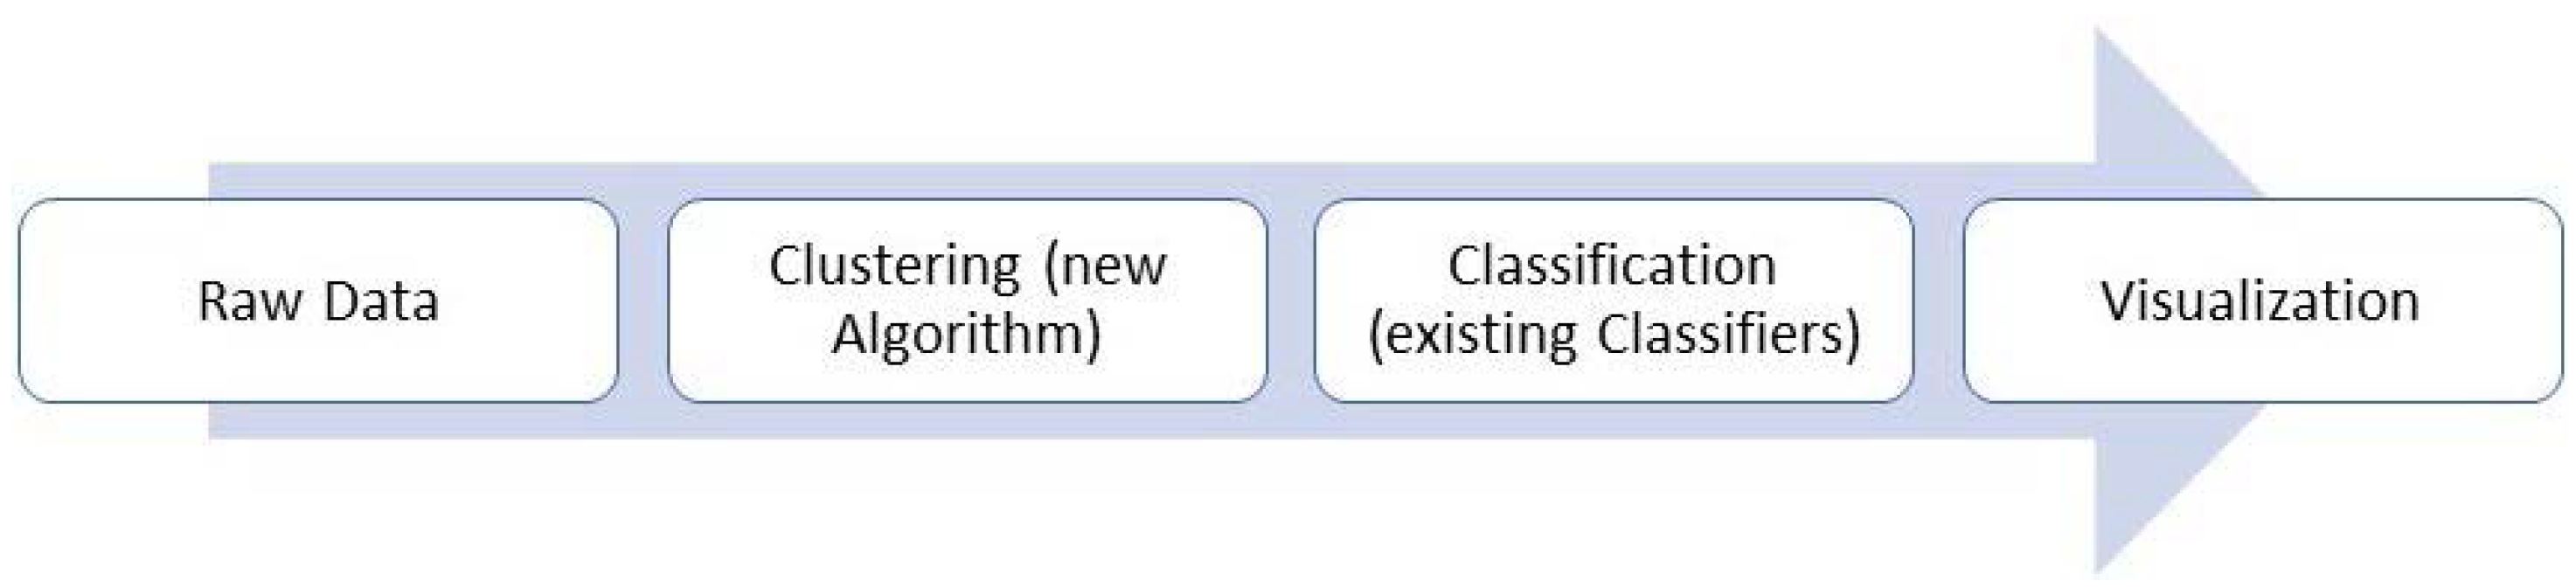
Essentially, ML is an application of AI that provides computers with the ability to learn from data and provide relevant insights that increase operational performance from experience from data without being programmed [65]. According to Din et al. [66], ML is classified into four categories: supervised learning, unsupervised learning, semi-supervised learning, and active learning [62]. Nef et al. [67] propose a typical ML pipeline (Figure 4) that starts with the raw data as input, clustering to further preprocess the data before the actual classification is performed. Finally, the computed results are displayed.
2.4.1. Data Preprocessing
Smart city applications consume data about both physical and virtual system entities. The prime goal of data collection is accurate and comprehensive data. These data obtained by heterogeneous sources, including sensors, SM, even manually submitted by users, are raw, noisy, and require processing by applications to be transformed into usable information [68]. Entering raw data into the training model will not produce a reasonable result, so data preprocessing is necessary for harnessing the data value.
In addition to dirty data, many kinds of data cannot be used directly for training, such as weather conditions, time, and so on [69]. To prepare the input for processing, the raw data must be enriched, cleansed, filtered, normalized, checked, and organized in a usable format [67,70]. Data fusion techniques combine multiple data sources to fix problematic data while improving data reliability, increasing data completeness, and extracting higher-level information from multiple data sources [71].
In recent years, several techniques have been proposed and implemented for the improvement of data preparation methods [72]. There are thousands of features available in real-world problems. The main goal of feature selection/extraction is the identification of a feature subset that is more informative or predictive of a given response variable [73]. Bag of Words (BoW) is a standard feature descriptor. M. Sajjad et al. in the work of [74] proposed a face recognition framework that uses BoW with the Oriented FAST and Rotated BRIEF (ORB) feature extraction method.
Another frequently used method for data reduction is Principal Component Analysis (PCA). PCA consists of reducing attribute overlap. This can be used to identify if some attributes can be more relevant than others [75]. Applying dimensionality reduction approaches, such as PCA, mitigates the requirement for large training data sets and reduces the number of zeros in the feature matrix [76]. In order to model sensor observations, measurements, and sensing device information and characteristics, D’Aniello et al. [53] presented an ontological scheme named Semantic Sensor Network Ontology (SSNO). SSNO allows putting together data and metadata provided by a sensing device or a virtual sensor and represent them by using interoperable statements, able to be possibly integrated with other additional domain knowledge.
2.4.2. Machine Learning (ML) Algorithms
ML algorithms are capable of handling a large amount of data, as well as providing features such as frequent pattern mining [77], anomaly detection, predictive modeling, and optimization that can lead to better situational awareness, more efficient, dynamic, and adaptive control [78]. Depending on the characteristics of the specific application and on the requirements of the use case, some algorithms perform better than others [34]. Some ML algorithms have aimed at improving matching time and accuracy, e.g., DL for information retrieval and multimodal interaction [79].
Classification
Classification is perhaps the most familiar and most popular DM technique [80]. The goal of classification algorithms is to find functions and models in order to identify to which of a set of categories (sub-populations) a new observation belongs to, based on a training set of data containing observations (or instances) whose category membership is known [58]. Classification is a paradigm of supervised learning. Supervised learning consists of two main phases: (1) the training or construction phase in which the model learns from a given set of labeled samples and (2) the classification phase, which outputs a label with the maximum likelihood for a given sample. It is shown that classifier performance typically increases as the volume of training data grows [81].
Decision Trees (DT) is a widely used technique that has been effective for regression and classification. The DT predictive model represents observations in the branches and conclusions about the target value in the leaves. In the first stage (construction), the DT breaks down a data set into subsets by DTs, and later an associated DT is incrementally developed [77]. In the second stage, pruning is carried out inside the nodes, replacing the node, if necessary, with a regression plane [62]. DT is one of the most popular learning techniques. It can naturally handle data of mixed types and missing values, which occur in most data sets in a smart city application [82]. Some of the methods for DT construction include Classification and Regression Trees (CART), ID3, C4.5 (J48), and T3 [83,84,85,86,87].
Random Forest (RF) is an ensemble learning model for classification and regression that operates by developing a batch of DT at training time [75]. The output class is the mean prediction (in regression problems) or mode of the classes (in classification) of the individual trees. To make a prediction at a new point, random forests take the majority vote among the outputs of the grown trees in the ensemble. The number of trees in the ensemble is selected through cross-validation [52]. RF runs very efficiently both on scaled and not scaled data [88,89]. It can handle data sets with unbalanced classes and generates strong predictive models, dealing well with the issue of overfitting. Two features make RF an attractive prediction technique: its ability to achieve high prediction accuracy and its usability of desired capabilities, such as daily electricity data consumed by various appliances. These two characteristics make RF a unique and desired model for analyzing smart city data [10].
Support Vector Machine (SVM) is a prominent supervised learning model that efficiently performs data classification and thereby finds its applications in many real-world scenarios, such as disease diagnosis [77], activity recognition [85], anomaly detection [34], text classification [90], face recognition [74], electricity consumption prediction [91], and finding available parking slots [92]. The SVM training algorithm seeks a separating hyperplane in the feature space that maximizes the distance of each input data point from the hyperplane. The minimum overall distance is called margin [93]. Often, in real-world data, the sample points are not linearly separable. For this reason, the original space is mapped through a kernel function into a higher-dimensional space, where presumably linear separation can be achieved [94]. Furthermore, we prefer a hyperplane that better separates much of the data, even if it ignores a few misclassified samples [52]. To bridge the gap between ideal assumptions and realistic constraints, Shen et al. [81] proposed the secure SVM, which is a privacy-preserving SVM training scheme over blockchain-based encrypted IoT data. When the classification is based on more than two classes, we can use multi-class SVM, which classifies the output into more classes. Initially, SVM was mainly proposed for binary classification, but later it tuned into multi-class classification due to a variety of methods. Two methods are mostly used for multi-classification problems: (1) by reducing it to multiple binary classification problems [47] and (2) one versus one [95]. Garcia-Font et al. in the work of [34] used One-Class SVM (OC-SVM), which is a special case of semi-supervised SVMs that do not require labeled data. OC-SVMs build a frontier to classify new samples as normal or outlier.
A Bayesian Network (BN) is a concise representation of the direct dependencies between a set of statistical variables formed in a directed acyclic graph and a set of node probability tables [10]. In data modeling, a BN creates implicit assumptions about dependencies between variables, though, in the real world, two variables are theoretically never truly and fully independent. A Naïve Bayes (NB) classifier is technically a special case of BN, using Bayes’ theorem in a naive way since it assumes every predictor variable is conditionally independent on the class (i.e., attribute) label [96]. Hence, an NB is a simple stochastic classifier based on applying Bayes’ theorem with strong independence assumptions [10]. Brisimi et al. in the work of [93] deployed the Likelihood Ratio Test (LRT), which is an NB classifier and assumes that individual features (elements) of a feature vector x = (x1, …, xn) are independent random variables.
K Nearest Neighbors (KNN) is a simple regression model that estimates the output of new samples based on the average output of its k nearest neighbors. Nearest neighbors are found in the feature space [76]. To make a prediction, this technique aggregates the values of the K “closest” examples in the training set, where K is an input parameter [97]. To compute the distance among observations, we can use the Euclidean or Manhattan distance measures. KNN is a type of instance-based learning, or lazy learning, in which the function is only approached locally, and all calculations are postponed until classification [62].
The Artificial Neural Network (ANN) is a very popular technique, which relies on supervised learning [92,98]. An ANN is a strong, nonlinear modeling tool that imitates the operation of biological neurons. Training an ANN involves the tuning of the weights and biases of the network. The objective is to maximize the network prediction performance, which corresponds to minimizing the difference between all network outputs yk and desired outputs or targets tk on validation data [94]. Using the Back Propagation (BP) algorithm [99], the NN can learn relevant statistical information from a suitable amount of training data, and the mathematical information learned can reflect the function mapping relation of the input-output data model [100]. An earlier ANN architecture is Multilayer Perceptron (MLP), a Neural Network (NN) with a fully connected architecture. Generally, MLP performs well and has been applied widely. A quicker-to-train but more memory-intensive network is the Radial Basis Function (RBF) network [101], used by Olszewski et al. in the work of [84] for building a regression model that considers many variables. At present, many new architectures have been developed for ANN [102]. ANNs tend to overfit, which means to be trained to fit the noise trend, but without producing a suitable generalization, as expected by ANN. However, Bayesian Regularized ANNs (BRANNs) tries to overcome the overfitting problem by incorporating Bayes’ modeling into the regularization scheme [91]. Convolutional Neural Network (CNN) is now gaining considerable attention leveraging its powerfulness in automatically learning the underlying patterns from the data. A basic structure of CNN generally consists of two stages, namely the feature learning stage and the classifier training stage [103,104]. The structure of a CNN is more complicated than that of a traditional NN [100]. Recurrent Neural Networks (RNNs) are feedforward NN with a recurrent loop. They are considered a powerful model for sequential data by using past history [105], and they are applied to a wide variety of problems involving time sequences of events and ordered data [92]. Long Short-Term Memory (LSTM) is a three-layer particular type of RNN proposed to identify a correlation between an input sequence and an output sequence. LSTM was used by Fenza et al. [105] for energy consumption prediction and anomaly detection in a smart grid application. To detect moving objects with maximum accuracy, [106] used a Counter-Propagation Artificial Neural Network (CP-ANN). The CP-ANN has a three-layer architecture where the first layer is an input layer, the second layer is a Kohonen layer, and the third layer is a Grossberg layer.
While ANNs are capable of extracting and modeling the general behavior of the system, Fuzzy Logic (FL) modeling can be used for approximate reasoning, modeling of qualitative data for uncertainties [103] that inherently appear in data to ensure adaptable control even in the presence of noisy, imprecise data [107]. FL also assists in easily incorporating expert domain knowledge into the control system by means of human interpretable linguistic rules. [108] used a firmly structured network, an Adaptive Neuro-Fuzzy Inference System (ANFIS) formed by the combination of ANN and fuzzy systems. In order to achieve near-optimal control, they used the Particle Swarm Optimization (POS) method. Alternatively, Evolutionary Algorithms (EA) may be used for dynamically optimizing both ANN and FL techniques as well as classical control methods. As EAs are inspired by the process of natural selection, they provide the capability of optimizing complex real-world problems [109] and converging on near-optimal results when the search space is too large to be searched exhaustively [78].
Deep Learning (DL) derives from ANNs with many hidden perceptron layers that can help to identify hidden patterns. The basic idea of DL is to replicate what the human brain does in most cases [110]. The Deep Belief Network (DBN) was proposed in 2006 by Hinton and has been widely used since then. DL not only changes traditional ML methods but also affects our understanding of human perception [100]. DL has been applied to several classification and regression problems. Part of its success is due to automatic feature extraction at different levels of abstraction. This promotes the easy reutilization of models on different domains without the intervention of a field specialist. Moreover, DL is capable of the representation of nonlinear, complex city data. DL models have been used to achieve state-of-the-art results in the field of computer vision and have also been applied to the problem of time series forecasting [111].
Reinforcement learning (RL) asks users who are already involved in sensing and actuation to reinforce and guide the system toward better accuracy and intuitive actuation [68]. The emerging Deep Reinforcement Learning (DRL) [112] can be considered as a promising technology, which takes a long-term goal into account and can generate optimal control actions to time-variant dynamic systems.
Shamshirband et al. [108] argue that ensemble and hybrid models are the future trends in ML. Ensemble meta classifiers adopt classification techniques where multiple classifiers of a different or similar type are being trained over the same or subsets of a training set [94]. Boosting is an ensemble supervised learning method that constructs a classifier as a linear combination of simpler weak classifiers. Brisimi et al. [52] used AdaBoost decision stumps as component classifiers. Moustafa et al. [113] applied three ML techniques of DT, NB, and ANN to classify normal and attack records in their intrusion detection system. The techniques are implemented as an ensemble method with the AdaBoost mechanism, where each technique is considered a weak classifier, and its findings are not high enough compared with the findings of the ensemble method. Other ensemble classifiers are bagging and random committees [62]. In order to build scalable learning systems, Zhang et al. [69] used XGBoost, a large-scale ML method. Hybrid ML models are shown to deliver higher performance in modeling and prediction due to their optimized algorithms for higher efficiency. Shamshirband et al. [108] proposed a hybrid model consisting of a neuro-fuzzy inference system and POS.
Forecasting
Forecasting algorithms facilitate the process of making statements about events whose actual outcomes (typically) have not yet been observed [58]. For instance, Fernadez-Ares et al. [35] implemented a time series forecasting analysis with the adoption of three different techniques, such as exponential smoothing state-space model (ETS), ARIMA, and Theta. They also tried a control method (Mean), but they received worse results. Badii et al. [92] used the Auto-Regressive Integrated Moving Average (ARIMA) model as a forecasting method. ARIMA model is composed of two parts: Auto-Regressive and Moving Average. The Auto-Regressive part (AR) creates the basis of the prediction and can be improved by a Moving Average (MA) modeling for errors made in previous time instants of prediction. The order of ARIMA models is defined by the parameters (p; d; q): p is the order of AR model; d is the degree of differencing, and q is the order of the MA part, respectively; and by the corresponding seasonal counterparts (P; D; Q). ARIMA can be used for planning, as well, as it poses the basis to be used as an instrument for early warning: that is, for detecting dysfunctions as unexpected patterns in the city users’ behavior [8]. The Markov forecasting model can be applied to make governance decisions according to results generated by the ontology model, and a sequential evaluation model can also be built to assess the effect of governance decisions, which effectually optimizes the Markov forecasting model [44]. As there is a need for algorithms that have low-enough computational complexity to run on the devices found in the smart city infrastructure, Venkatesh et al. [68] leverage Taylor Expanded Analog Forecasting Algorithm (TESLA), implementation a statistical learning model that can be fully generalized, as the data translation algorithm in their context engine. Tse et al. employed the Granger Causality Test (GCT) in their study [42]. GCT is a statistical hypothesis test for determining whether one time series has causal relationships with another.
One model that deals with numeric variables is Linear Regression (LinR), where a single linear formula represents the mapping from input to class values. Regression analysis aims to model the relationship between a dependent variable and one or more explanatory independent variables. Among linear regression models, Hashemi selected Least Squares (LS) in the work of [76], which fits a linear model to the data by minimizing the total squared error. Logistic regression (LogR) is a linear, fairly simple classifier widely used in many classification applications. The basic idea is that for each instance, we model the posterior probability of the actionable class as a logistic function with parameters that weigh the features f and an offset β [52]. LogR is popular in the medical literature because it predicts a probability of a sample belonging to the positive class [93]. If data have a large number of features, we can also use a nonlinear regression technique, which complements the linear regression method, the Support Vector Regression (SVR) [92]. Dynamic Time Warping (DTW) is an algorithm for comparing two given (time-dependent) sequences that may vary in speed, applied to time series analysis video, audio, and graphics data sequences [114].
Anomaly detection, also known as outlier detection or novelty detection, is an important research domain of data analysis. It aims to detect a few data patterns that do not conform to the expected data characteristics [115]. An anomaly can be defined as unusual or abnormal behavior [116]. To excavate the latent information of data and construct the compact data representation, Sun et al. proposed a generative Dictionary Learning Model (DLM) for anomaly detection [117], which jointly learns the latent representations and their recombination basis. Dictionary learning aims to learn a set of basis vectors that can encode all feature data into compact form with a linear combination. In the application of anomaly detection, the maximum reconstruction error of test samples is calculated to discriminate whether it is abnormal. The ability of this method to reveal the underlying structure of data is the key to solve the problem of anomaly discrimination. Pena et al. [118] applied a rule-based system to energy efficiency indicators and historical data to detect anomalies at the energy building consumption.
Unsupervised Learning
Clustering is an unsupervised learning technique aiming at partitioning a collection of data objects into groups (clusters), but unlike classification, the groups are not predefined [80]. The grouping is implemented in a way that intra-cluster dissimilarity is low (according to a set of metrics) and inter-cluster dissimilarity is high [58]. Clustering analysis has been extensively used in problems where there is little prior information available about the data [119], and in a wide range of applications, such as pattern recognition, market research, and image segmentation [120]. In general, the existing clustering algorithms can be broadly categorized into hierarchical clustering, partitioning clustering, model-based clustering, density-based clustering, grid-based clustering, and so on. Hierarchical Clustering (HC) techniques, used by Martinez-Espana et al. [62], define the cluster distance between two clusters to be the maximum distance between their individual components. At every stage of the clustering process, the two nearest clusters are merged into a new cluster. However, these methods are static, and data objects assigned to a cluster cannot move to a different cluster. Partitioning algorithms are dynamic, and data objects can move from one cluster to another. They can incorporate knowledge about the shape or size of clusters by using appropriate prototypes and distance measures [121].
K-means is a very popular [116] and simple partitioning clustering algorithm [105]. Because of its efficiency, the method is scalable in parallel and distributed systems for big data set handling [49]. K-means assigns n points to k clusters using distance as a similarity factor until there is no change to which point belongs to which cluster by iteratively updating cluster centers. However, traditional K-means suffer from sensitivity to the initial selection of cluster centers and difficulty in specifying the number of clusters in advance [121]. Aydin et al. in the work of [31] used K-means for clustering two-dimensional GPS position data. In [8], two clustering techniques have been adopted. The first technique was a variance of K-means, Partitioning Around Medoids (PAM), which are the most representative elements in the cluster instead of the centroid as with K-means. The second approach is the model-based Expectation-Maximization algorithm or EM algorithm (EM method). It is a generalization of K-means that uses an iterative process to find the maximum likelihood.
Arribas-Bel et al. in the work of [39] used two very distinct techniques for clustering: K-means and the more advanced Self-Organizing Map (SOM). Although their function in this context is the same (grouping observations based on attribute similarity), the underlying mechanics of both algorithms differ substantially: while K-means tries to optimize an objective function that minimizes cluster variance, SOM employs an iterative approach in which a feedforward NN learns the properties or find unknown relationships among the set of variables that describe a problem, to later assign the original observations to output neurons. The main property of SOM is that it makes a nonlinear projection from a high-dimensional data space on a regular, low-dimensional (usually 2D) grid of neurons. Fernadez-Ares et al. conducted a study for monitoring real traffic and mobility scenarios with the implementation of SOM [35].
Nesi et al. [122] adopted another technique for clustering, building a hierarchical tree, represented as a dendrogram. They consider hierarchical clustering as a suitable choice for their study in geographic localization since it does not a priori require the number of clusters.
Density-Based Spatial Clustering of Applications with Noise (DBSCAN) is used in the work of [24,123]. Yang et al. state that all existing clustering methods have the same difficulty of parameter setting [123]. DBSCAN can find arbitrary-shaped clusters with only one input parameter required and supporting the user in determining an appropriate value for this input parameter [120].
Pournaras et al. in the work of [124] illustrate a generic, unsupervised, and highly efficient collective learning algorithm designed to solve fully decentralized combinatorial optimization problems: I-EPOS1, the Iterative Economic Planning and Optimized Selections. I-EPOS is applicable in the broader context of large-scale multi-agent systems.
Association Rules
Association Rules (AR) is one of the most popular methods [125] within the context of extracting relationships among items hidden within data sets [126], as it has been used in several smart city applications [44,77,127,128]. Agrawal and Strikant [129] presented the Apriori algorithm for discovering all significant AR between items in a large database of transactions. It uses the transcendental nature of frequent itemsets, i.e., all non-empty subsets of frequent itemsets also being frequent [125]. It proceeds by identifying the frequent individual items in the database and extending them into larger itemsets as long as they appear sufficiently often in the database. The frequent itemsets can be used to determine AR that reflect general trends. Some AR could be discovered when applying DM techniques to a training set; then, the most meaningful one could be extracted from these general AR by techniques such as Bayesian Net [44]. Pattern growth is a method of frequent pattern mining that does not require candidate generation. It discovers the frequent single items, then compresses this information into a frequent pattern tree. Honavar and Sami [23] used PrefixSpan, which extends the pattern-growth approach to mine sequential patterns instead. Its general idea is to examine only the prefix subsequences and project only their corresponding postfix subsequences into projected databases.
Spatial Mining
A digital city, as a considerable representation of our real world, contains all the natural, social, and economic information related to the physical real city. Particularly, it consists of 2D digital maps, 3D digital city models as the city grows both horizontally and vertically [130], 4D spatial-temporal databases, and points of interest [29]. Spatial data are required for many smart city applications, such as to infer spatial rain fields from streaming short text messages or to model spatially continuous fields, such as noise level, air temperature, or pollution [131]. Geographic Information Systems (GIS) are used to store information related to locations on the Earth’s surface [80,132]. The typical descriptor of people flow analysis in the city is the Origin Destination (OD) matrix. It presents city zones on both axes, while the single element (at the intersection) contains the number of people (or the probability) of passing from the zone of origin to the zone of destination, in a given time window, for a given kind of user, for a given day of the week [8].
Natural Language Processing
Natural Language Processing (NLP) is a core method for mining information from human language [133]. The textual information is properly preprocessed to remove noise by using techniques such as tokenization, normalization, stemming, and stop word removal [54]. NLP techniques include lexical acquisition, word sense disambiguation, and part-of-speech (POS) tagging [107]. NLP involves translating natural language into data (numbers) that a computer can use to learn about the world. This understanding of the world is sometimes used to generate natural language text that reflects that understanding [134]. Techniques for semantic analysis of textual content coming from social networks can provide very interesting findings and improve the understanding of psycho-social dynamics in a totally new way [89]. Qiu et al. [135] used two main techniques to mine knowledge from text, the Latent Dirichlet Allocation (LDA) algorithm and the Word2vec tool. The LDA algorithm considers each document as a mixture of a small number of latent topics and that each word creates a contribution to one topic. When given all words appearing in each document of the document set, LDA can infer the implied topic distribution of documents [127]. Word2vec is a tool based on deep learning and was released by Google in 2013. This tool adopts two main model architectures, Continuous Bag-of-Words (CBoW) model and the continuous skip-gram model. Kaiser and Pozdnoukhov [131] generated the dictionary with the topic of interest based on a text corpus built from related sites, such as Wikipedia. The irrelevant tweets are generated based on some recent news from the New York Times. Twitter messages were then generated using a Markov chain trained on this corpus. Then, the incremental classification algorithm Projectron++ was trained using the bag-of-words feature representation and the known label used at the simulation stage to classify the stream into the topic of interest. Tse et al. [42] performed topic modeling on the whole data set using Non-negative Matrix Factorization (NMF). NMF is a multivariate analysis algorithm where an input matrix with non-negative elements is factorized into two other matrices with non-negative elements. Since NMF clusters the columns of the input matrix, it can be applied for topic modeling and document clustering. Costa et al. used in the work of [133] a multinomial NB classification model, which is used to determine the contextual severity of an event. In general, the NB algorithm has a high recall and precision while classifying textual data, being one of the most suitable algorithms for this task. Nesi et al. used text mining and NLP algorithms for geographical annotation [122]. They consider this technique as an important application for smart city frameworks, aiming at helping citizens by providing different services and useful information on publicly available Open Data (OD), including geographical information and spatial location of Places Of Interest (POI), real-time traffic, and parking structures, as well as any other kind of municipality resource that can be geolocated.
Sentiment Analysis
Sentiment Analysis (SA) infer the sentiment conveyed by a piece of text by relying on (external) lexical resources, which map each term to a categorical (positive, negative, neutral) sentiment score. As an example, terms such as wonderful, beautiful, and joy have a positive sentiment score, while terms such as fear and sadness have a negative one [90]. SA techniques are applied to almost every social domain because opinions are critical to almost all human behaviors [136]. Opinion mining and sentiment analysis methods can be applied to the SM comments [137] to automatically identify issues that concern citizens, as well as features they liked [138]. The task is rather unwieldy because each word has to be treated separately [139]. The fuzzy nature of human emotion provides data that contain a vast amount of uncertainty. Fuzzy systems are capable of addressing this problem while achieving a suitable tradeoff between accuracy and performance [109]. The words that someone uses are not the only source of information emotion recognition. Emotion recognition is closely related to Facial Expression Recognition (FER) [95]. FER-based systems comprise three steps. In the first step, the face is detected in a video stream and is cropped as region-of-interest for the next step. Then, it is resized into specified dimensions so that all the images given to the model become of the same size. In the next step, some low-level or high-level or both features are extracted from the cropped region. In the last step, the features are classified using a classifier.
User Interface and Visualization
As Ploennigs et al. argue, IoT applications will only be successful if it is usable by everybody [65]. The operators and dwellers of smart cities are not data scientists, so they have difficulty when applying ML techniques to their applications without experts [140]. Data analysis would be considerably simplified if one could visualize data graphically. Information visualization uses graphic techniques to help people understand and analyze data. Visual representations and interaction techniques take advantage of the human eyes’ broad bandwidth pathway into the mind to allow users to see, explore, and understand large amounts of information at once [75]. The objective of the analysis and visualization of data is to highlight useful information and support decision making with the lowest degree of human intervention [140]. A frontend component should provide users with comprehensive charts that visualize the information [9]. Therefore, interfaces should enable users to intuitively understand the behavior of the system. The interfaces should be easy to use, responsive, mobile, and abstract the complexity of the underlying processes. Once the data from the sensors has been retrieved, it may be helpful for the city operator to have tools available to create dashboards that show this data simply and intuitively [141]. Users should be able to interact with the smart city application with a smart city dashboard that represents the structure, real-time data, and key indexes on a city map [92]. The goal of the dashboard is to provide the user with a set of tools to visualize and handle the aggregated analysis results [90]. Thanks to quickly visualized data tools, identify correlations, and conceive of innovative, unanticipated uses for existing information became easier [38]. Additionally, the integration of speech interfaces shows great potential to interact in natural language with the operators. In addition, augmented reality interfaces are paving new ways to seamlessly access sensors and systems data [65].
3. Methodology
To explore the DM for smart cities research field, we review results from quantitative and qualitative methods, as follows:
- Quantitative method: a bibliometric analysis, and
- Qualitative method: a critical review of the 100 most cited articles.
3.1. Bibliometrics
As the number of publications continues to expand at increasing rates and publications develop fragmentarily, the task of accumulating knowledge becomes more complicated [142]. The term “bibliometrics” first appeared in the literature in 1969. Until then, the relevant research area was defined as the “application of mathematical and statistical methods to books and other media of communication”, and the term bibliometrics was quickly adopted and used, particularly in N. America. In contrast, at almost the same time, the term “scientometrics” was widely used in Europe. Bibliometrics are applicable in the research sub-areas of methodology research, scientific disciplines, and science policy [143]. Bibliometric studies tend to examine statistically the quantitative aspects of scientific publications within a field [144]. Bibliometrics are often used as a measure of the quality of the work produced by individual scholarly contributions, venues of production, individual authors, groups and institutions, journals, etc. As a general indicator for measuring impact across the sciences, E. Garfield invented the calculation of Impact Factor (IF), which remains over half a century later the “gold standard” for journals [145].
3.2. Bibliometric Analysis Software
For the bibliometric analysis, we used the Bibliometrix library, developed in R, by Aria and Cuccurulo [142]. Bibliometrix is an efficient tool for quantitative research in bibliometrics, distributed under GPL-3 license, performing bibliometric analysis and building networks for co-citation, coupling, scientific collaboration, and co-word analysis [146]. Bibliometrix offers a web application developed with the help of the Shiny library, named Biblioshiny. Biblioshiny supports scholars with data importing and filtering, analytics and plots for sources, authors, and documents, and analysis of the conceptual, intellectual, and social structure of the research topic.
3.3. Information Retrieval
We exported article information from the Scopus database. Roemer and Borchardt [145] consider Scopus as an authoritative and comprehensive online source for discovering citation-based connections between scholarly articles. Scopus, published by Elsevier, was established in 2004. We chose this source because it is the largest abstract and citation database since it indexes content from 24,600 active titles and 5000 publishers. Its main strength is that it offers the broadest coverage available for scientific, technical, medical, and social sciences [143].
Aiming to index journal articles in English containing the keywords “data mining” and “smart city” (or “smart cities”) in their abstracts, titles, and keywords [147], we posed the following search query in the Scopus search form:
TITLE-ABS-KEY (“data mining” AND (“smart city” OR “smart cities”)) AND (LIMIT-TO (LANGUAGE, “English”)) AND (LIMIT-TO (SRCTYPE, “j”)).
4. Results
The query was stated on 16 February 2021 and returned 197 records. The results were exported in BibTex file format, which is compatible with the Bibliometrix library. As a response to our query, Scopus returned 197 articles published within a period from January 2013 to February 2021, in 112 different journals, by 682 authors. There are 3.46 authors and 15.88 citations per document on average. Table 1 presents general information about our data.
4.1. Most Cited Articles
Table A1 in Appendix A presents the 100 most cited research documents in DM for the smart cities topic. The table is sorted by the number of total citations each article has received. When an article is cited, it can be considered to impact someone else’s work. As the simplest and most straightforward of the citation-based metrics, the number of citations an article has received is the starting point for almost all bibliometric indicators, which have become more sophisticated since the invention of advanced computing modeling [145].
4.2. Annual Scientific Production
Andres in the work of [143] states that, according to Prices’ law, science grows in a multiplicative way over time and, according to this exponential function, the growth rate will be proportional to the population size, i.e., the bigger the population is, the faster it grows. Consequently, the number of productions also grows in a multiplicative way, as shown in Table 2. It can be assumed that the exponential growth described by Price’s law is acceptable within a logistic function, so this period of accelerated growth will be followed by a stabilization phase. In the DM technologies for smart cities, we found an annual growth rate of 73.33% in the period between 2013 and 2020. The most productive year was 2019, when 54 articles were published. Articles published in 2015 and 2017 received the higher average number of total citations, but the latter achieved a higher score in the mean total citation per year index because of their fewer citable years.
4.3. Sources
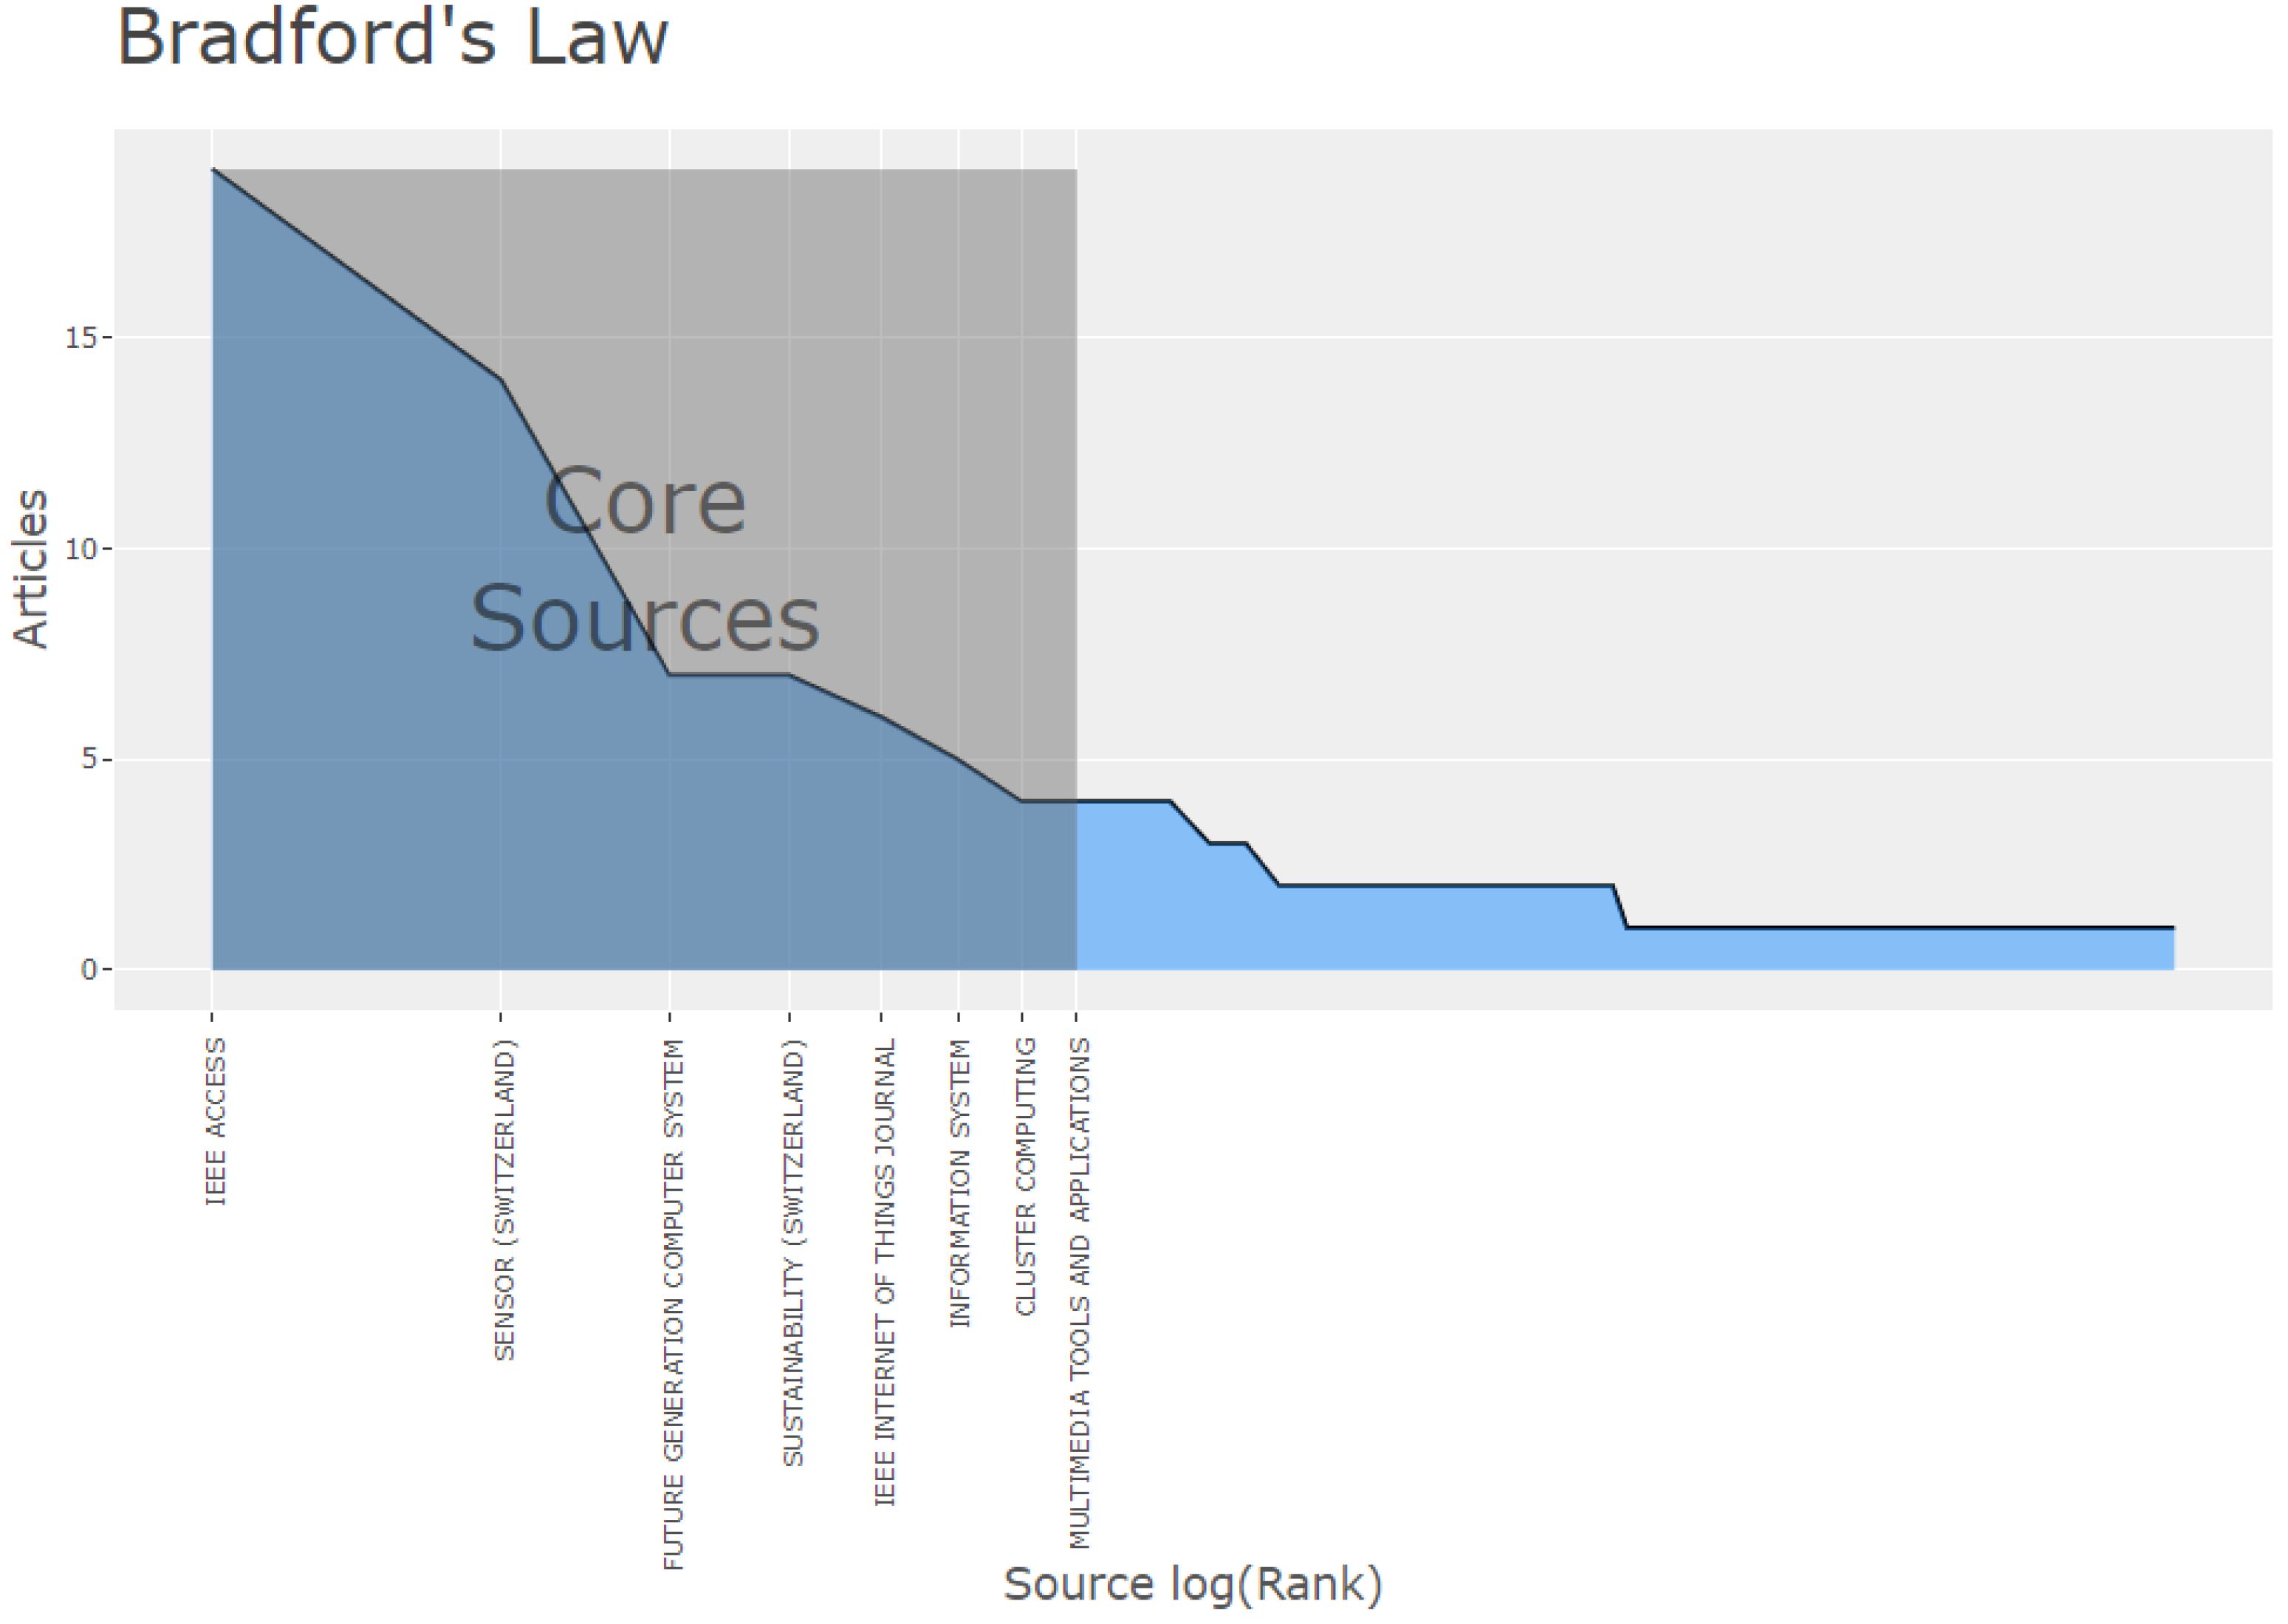
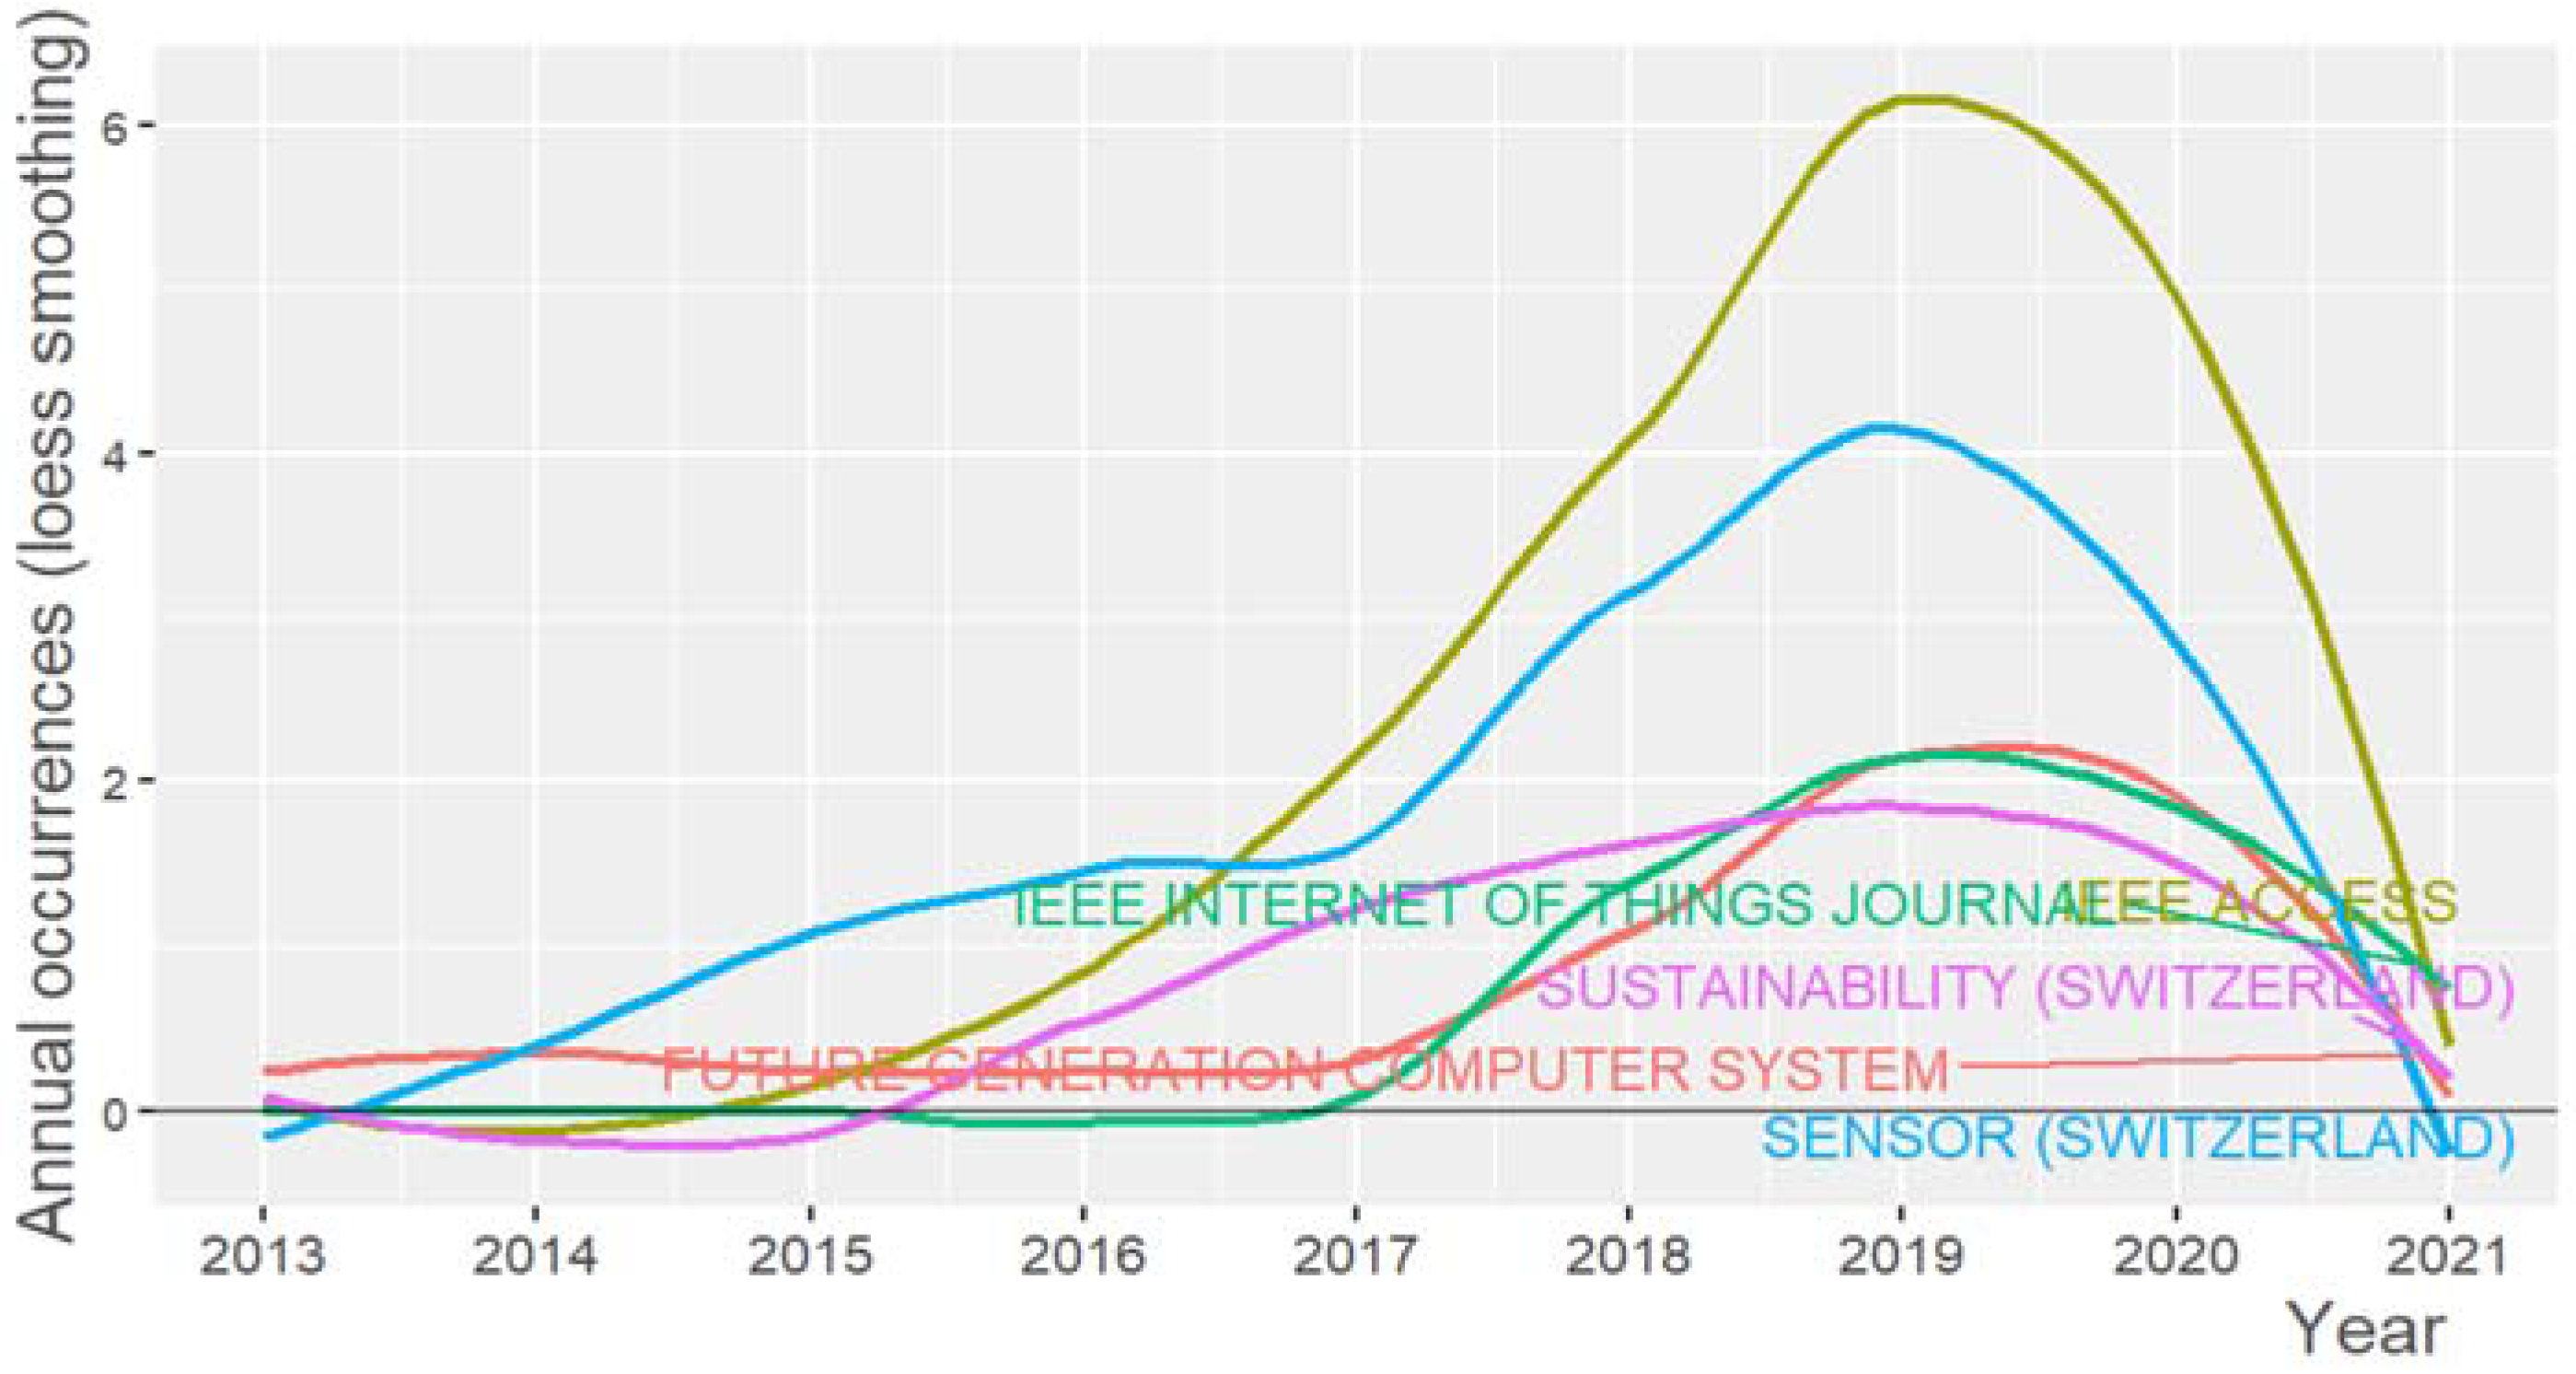
The 10 most productive sources on the topic appear in Table 3. According to Bradford’s law of scattering, “the bulk of articles on a given topic is concentrated in a small set of core journals and then scattered across other journals to such a degree that, if the set of relevant articles is subdivided into groups or zones containing the same number of items as the core, an exponentially increasing number of journals will be required to fill the succeeding zones” [148]. Thus, Bradford’s law is widely used in bibliometrics to survey journal productivity. As observed in Figure 5, a small number of journals are the core sources of the total number of publications on the topic, whereas increasing numbers of journals publish fewer articles on the topic [143]. Figure 6 illustrates the top-5 related sources’ growth for the period from 2013 to 2021 (February).
The Impact Factor (IF) of a journal is “a citation measure of its average article’s citation score over a relatively short period. It is computed for a given year through the division of the number of citations received, in the processing years by the overall number of “citable” items (research articles, reviews, and notes) issued by the journal during the same years” [148]. For instance, when we say that a journal has an impact factor of three, we mean that in the last two years, this journal averaged three citations per published article [145]. With the IF, we can identify publications that have a strong impact during a given period. The journal IF has practical importance either for libraries to decide which journals to purchase or for authors to choose where to submit their articles. As a rule, journals with high IF are seen to be more prestigious [143]. De Bellis [148] considers that the higher the IF of the journals listed in the publication records of the units under assessment, the greater the candidate’s chance of outperforming all the other applicants in a competition for promotion, tenure, or funding allocation. The Hirsch index, also known as the h-index, measures quantity and impact through a single indicator. The h-index is defined by Andres [143] as follows: “a scientist has index h if h of his or her N papers have at least h citations each and the other (N–h) papers have ≤h citations each”. One of the most popular improvements of the h-index is the g-index, which considers the weight of citations received by the top articles of a scientist, and the total number of documents does not limit the value of the index [149]. M-index is computed as the median of citations received by papers ranking smaller than or equal to the Hirsch core h [150]. Table 4 summarizes the impact measures of the 10 most relevant journals.
4.4. Authors
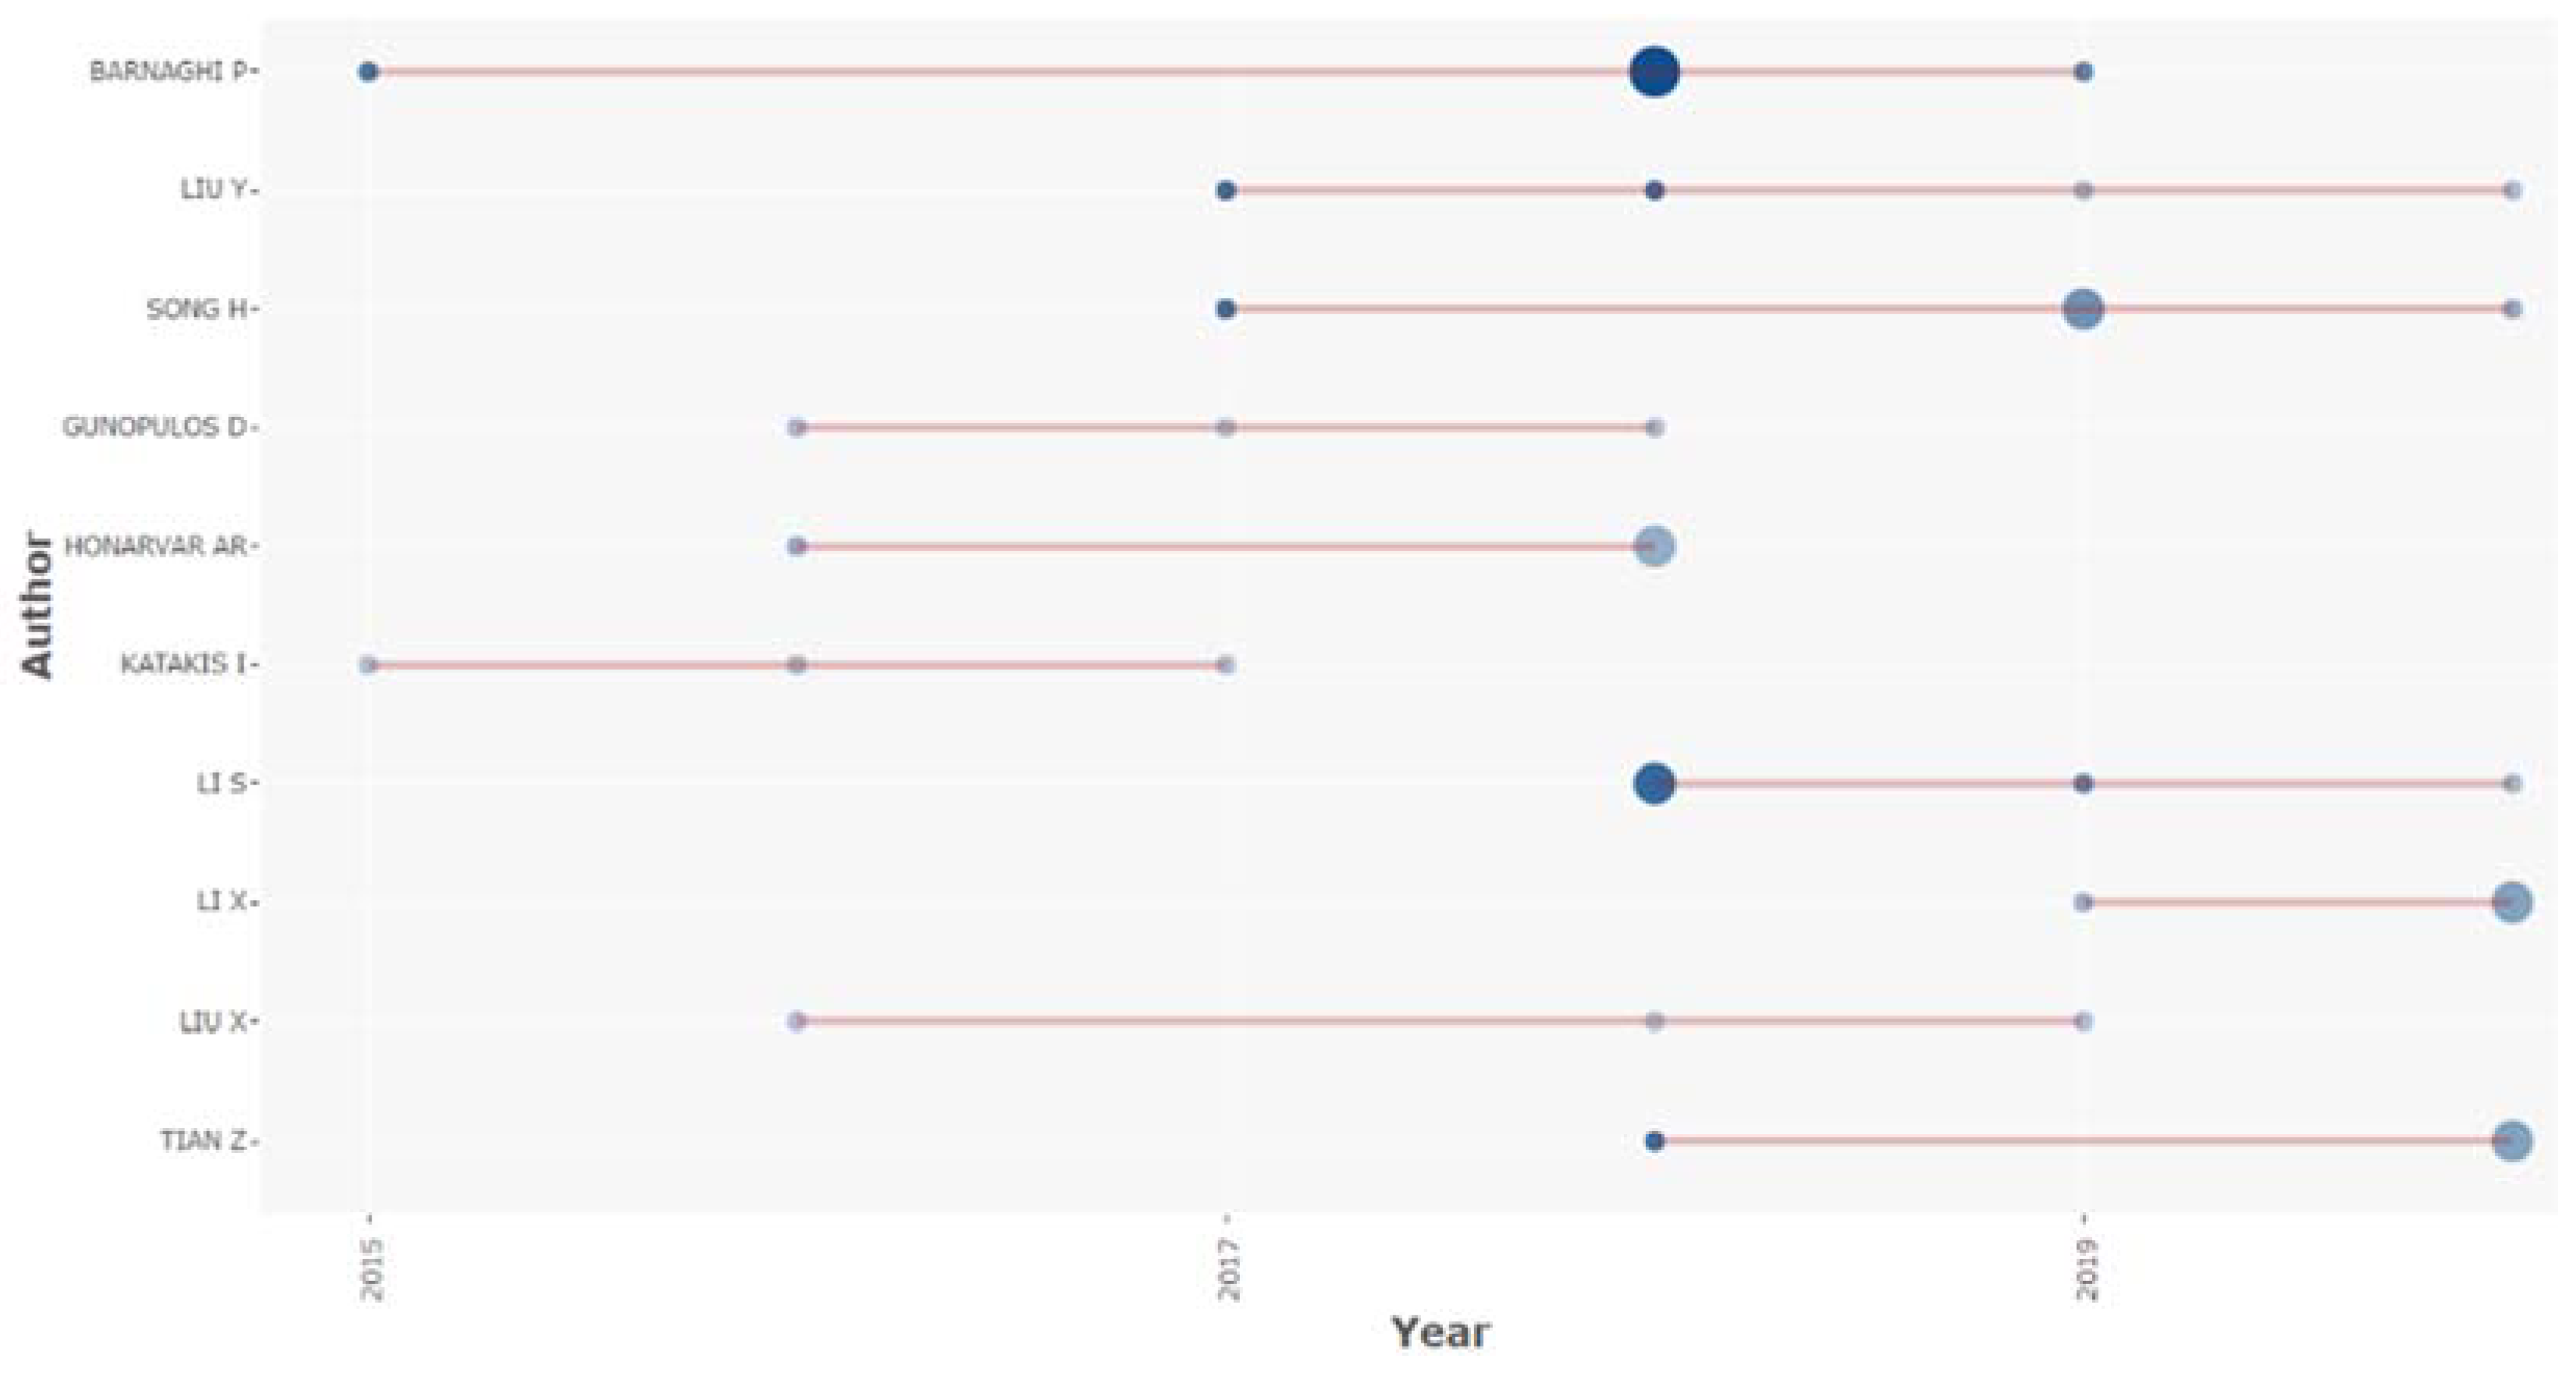
Table 5 shows the 10 most productive authors. As De Bellis states, there is a reasonably suitable correlation between the eminence of a scientist and his productivity of papers [148]. In Figure 7, top author productivity over time appears.
Lotka’s law assesses patterns in author productivity. It is also known as the inverse square law on author productivity. The law predicts how many authors would have published x studies according to the number of authors who have contributed to a single study [143]. Lotka’s law determines “the degree scientists of different caliber, involved in the struggle for life on the forefront of scientific communication, contributed to the advancement of knowledge” [148]. Figure 8 visualizes the frequency distribution of scientific productivity (Table 6) through Lotka’s law.
Citation analysis is often used to obtain information about the impact and, more often, the quality of a publication, a source, or an author [143]. Published articles are read and assessed by the community of peers, who recognize their value by citing them in their studies. The bibliographic citation, therefore, has been considered as an elementary building block of a scientific reward system [148]. Table 7 summarizes the impact measures of the 10 most productive authors.
From all the studies we examined, it is observed that China was the most productive country, followed by the USA. The productivity of the 10 most relevant countries is presented in Table 8. Table 9 includes the 10 top-cited countries. Articles from China have received 473 citations in total, while articles from the USA have received 357 and Spain 341.
4.5. Content
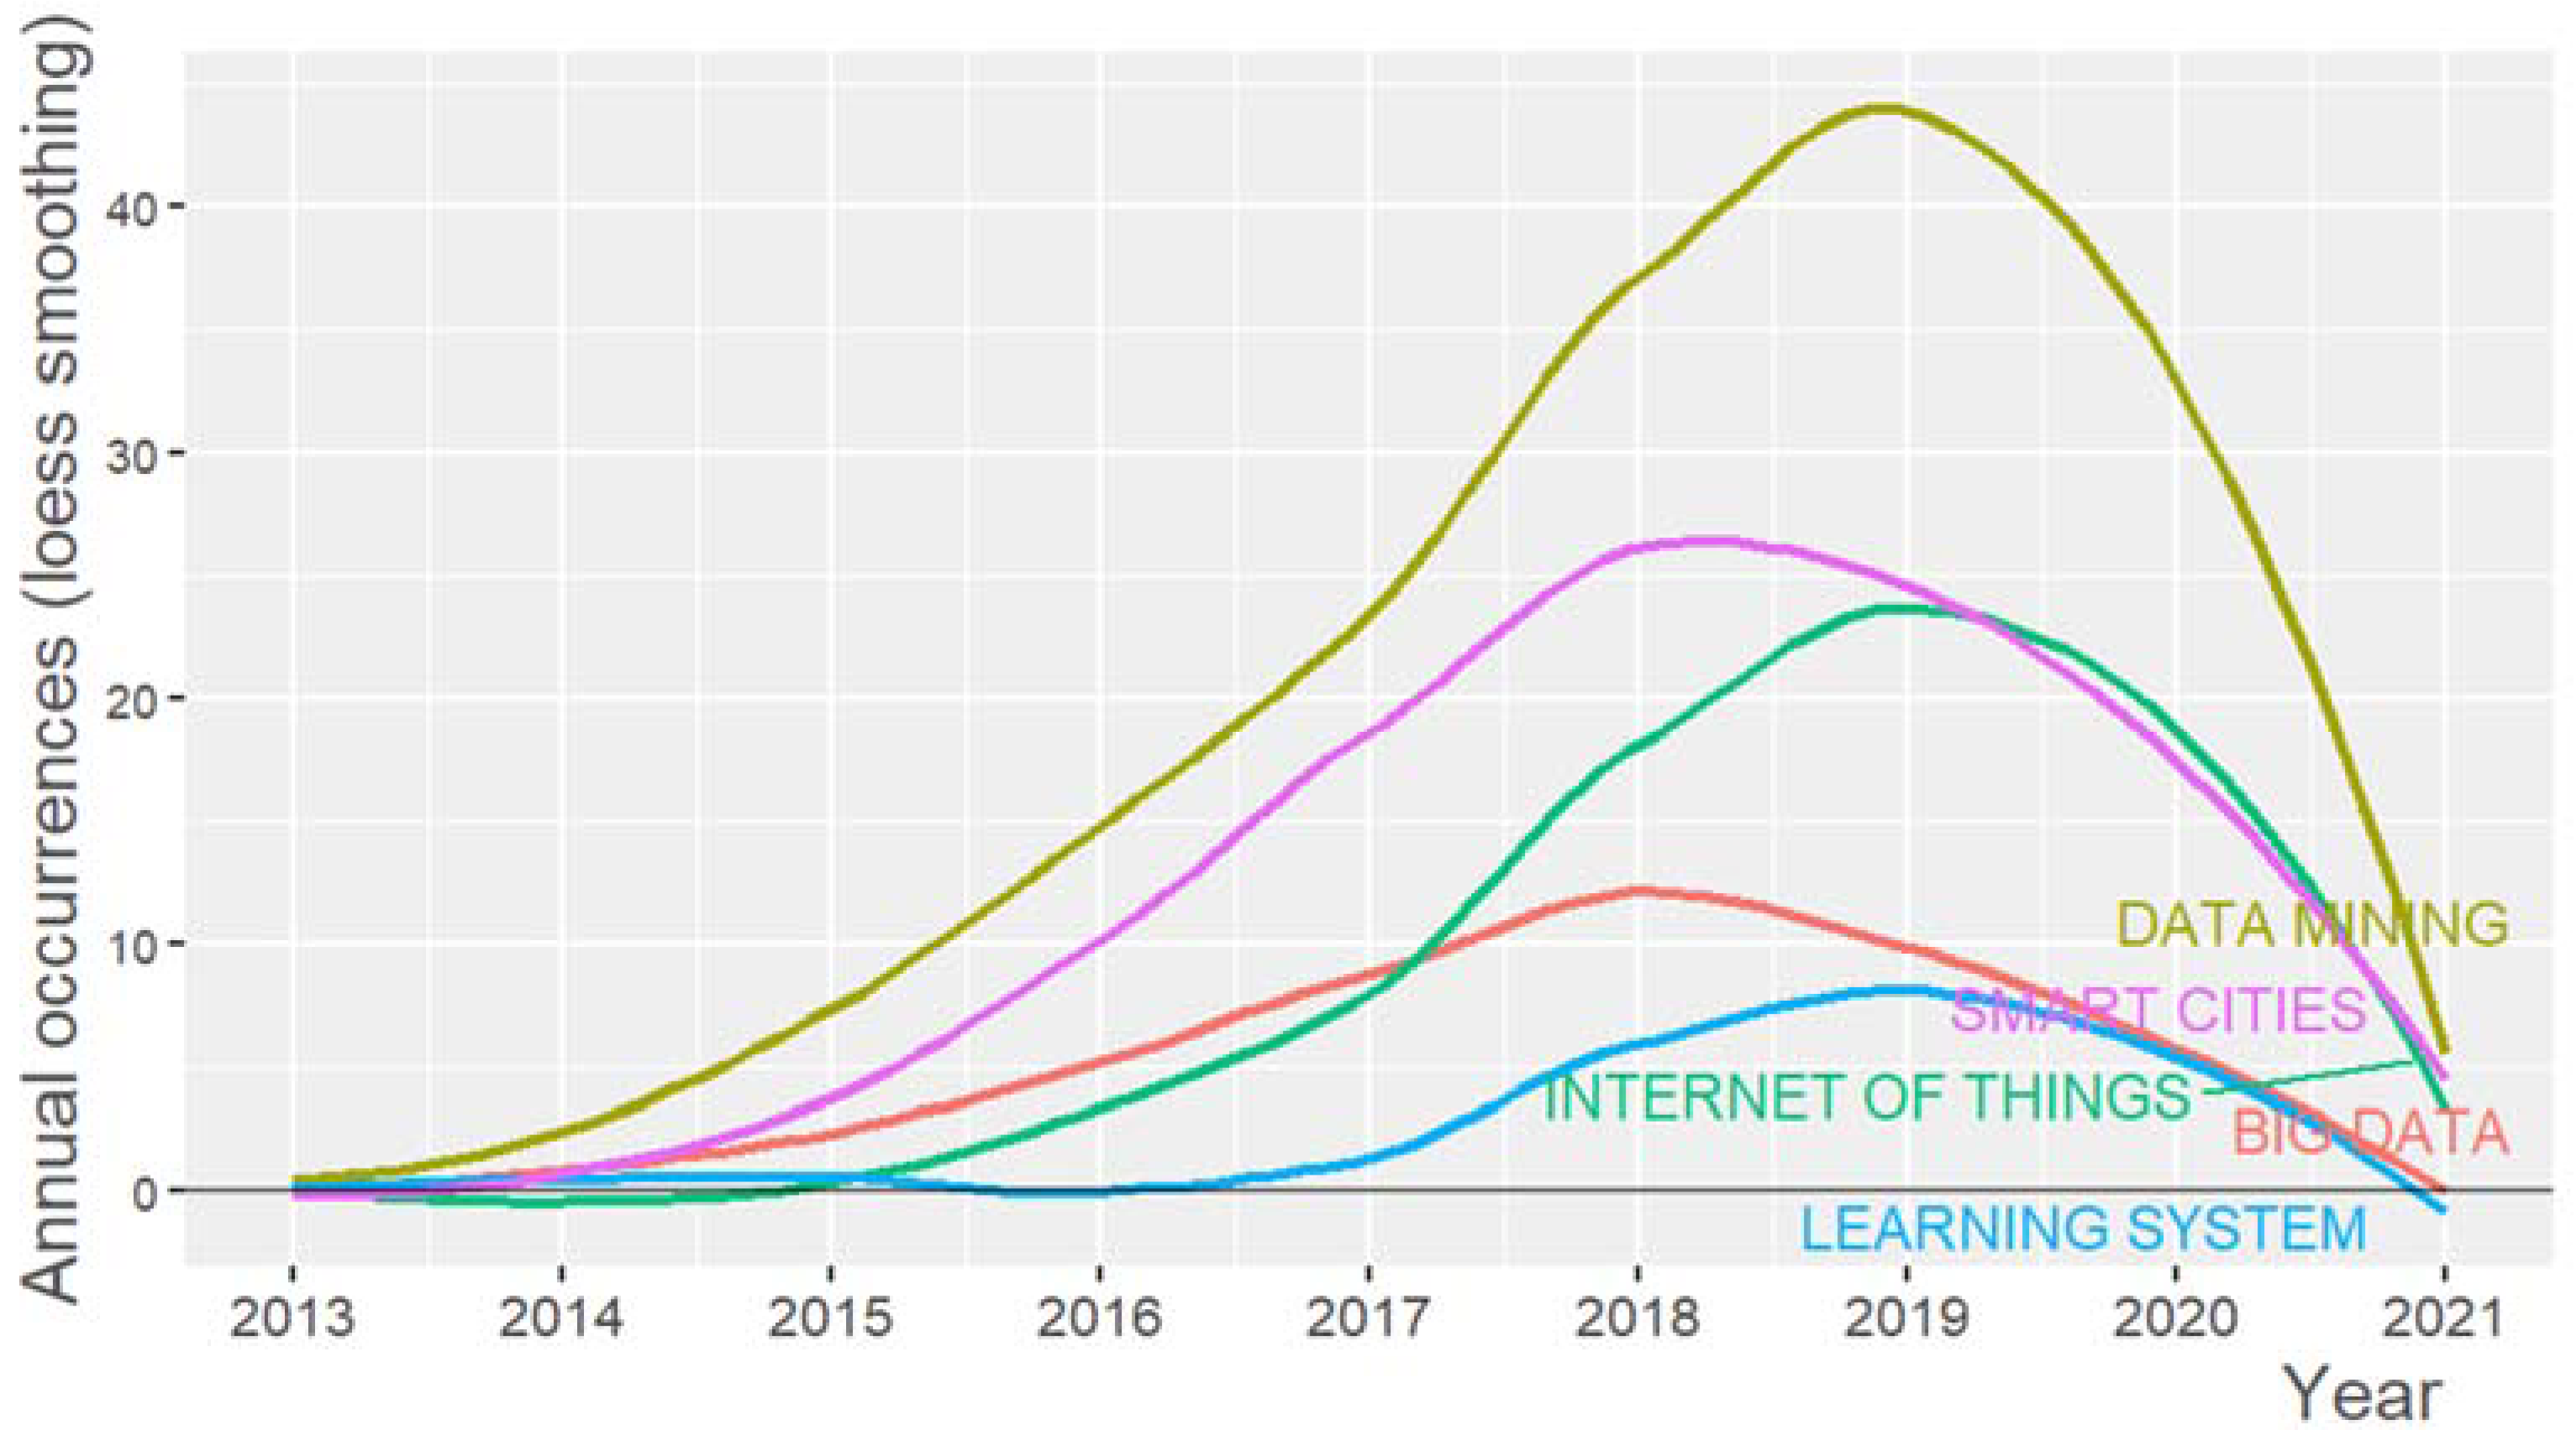
The frequency of words in a text can be studied by Zipf’s law, which has been considered as a generalization of both Lotka’s and Bradford’s laws [143]. According to Zipf’s law, at its simplest, the vast majority of text words appear only a few times, and a limited number are extremely frequent [148], as shown in Figure 9. As presented in Table 10, the most frequent terms that appeared as “keywords plus” in the articles are “data mining”, “smart cities”, “internet of things”, and “big data”. Keywords plus are words or phrases that frequently appear in the titles of an article’s references but are not included in the title of the article itself in order to augment the power of cited-reference searching [151]. At first, the text analysis we performed returned as a result various terms relating to common concepts (such as “city”—“cities” or “Internet-of-Things (IoT)”—“Internet of Things”), so after the data set retrieval from the Scopus database, we had to do some preprocessing work such as lemmatize the words, ignore numbers, and disregard case sensitivity. Figure 10 shows the word cloud constructed by the terms. Word dynamic graph (Figure 11) can help us see the trends on a research topic, as it illustrates growth or decline for each keyword [152].
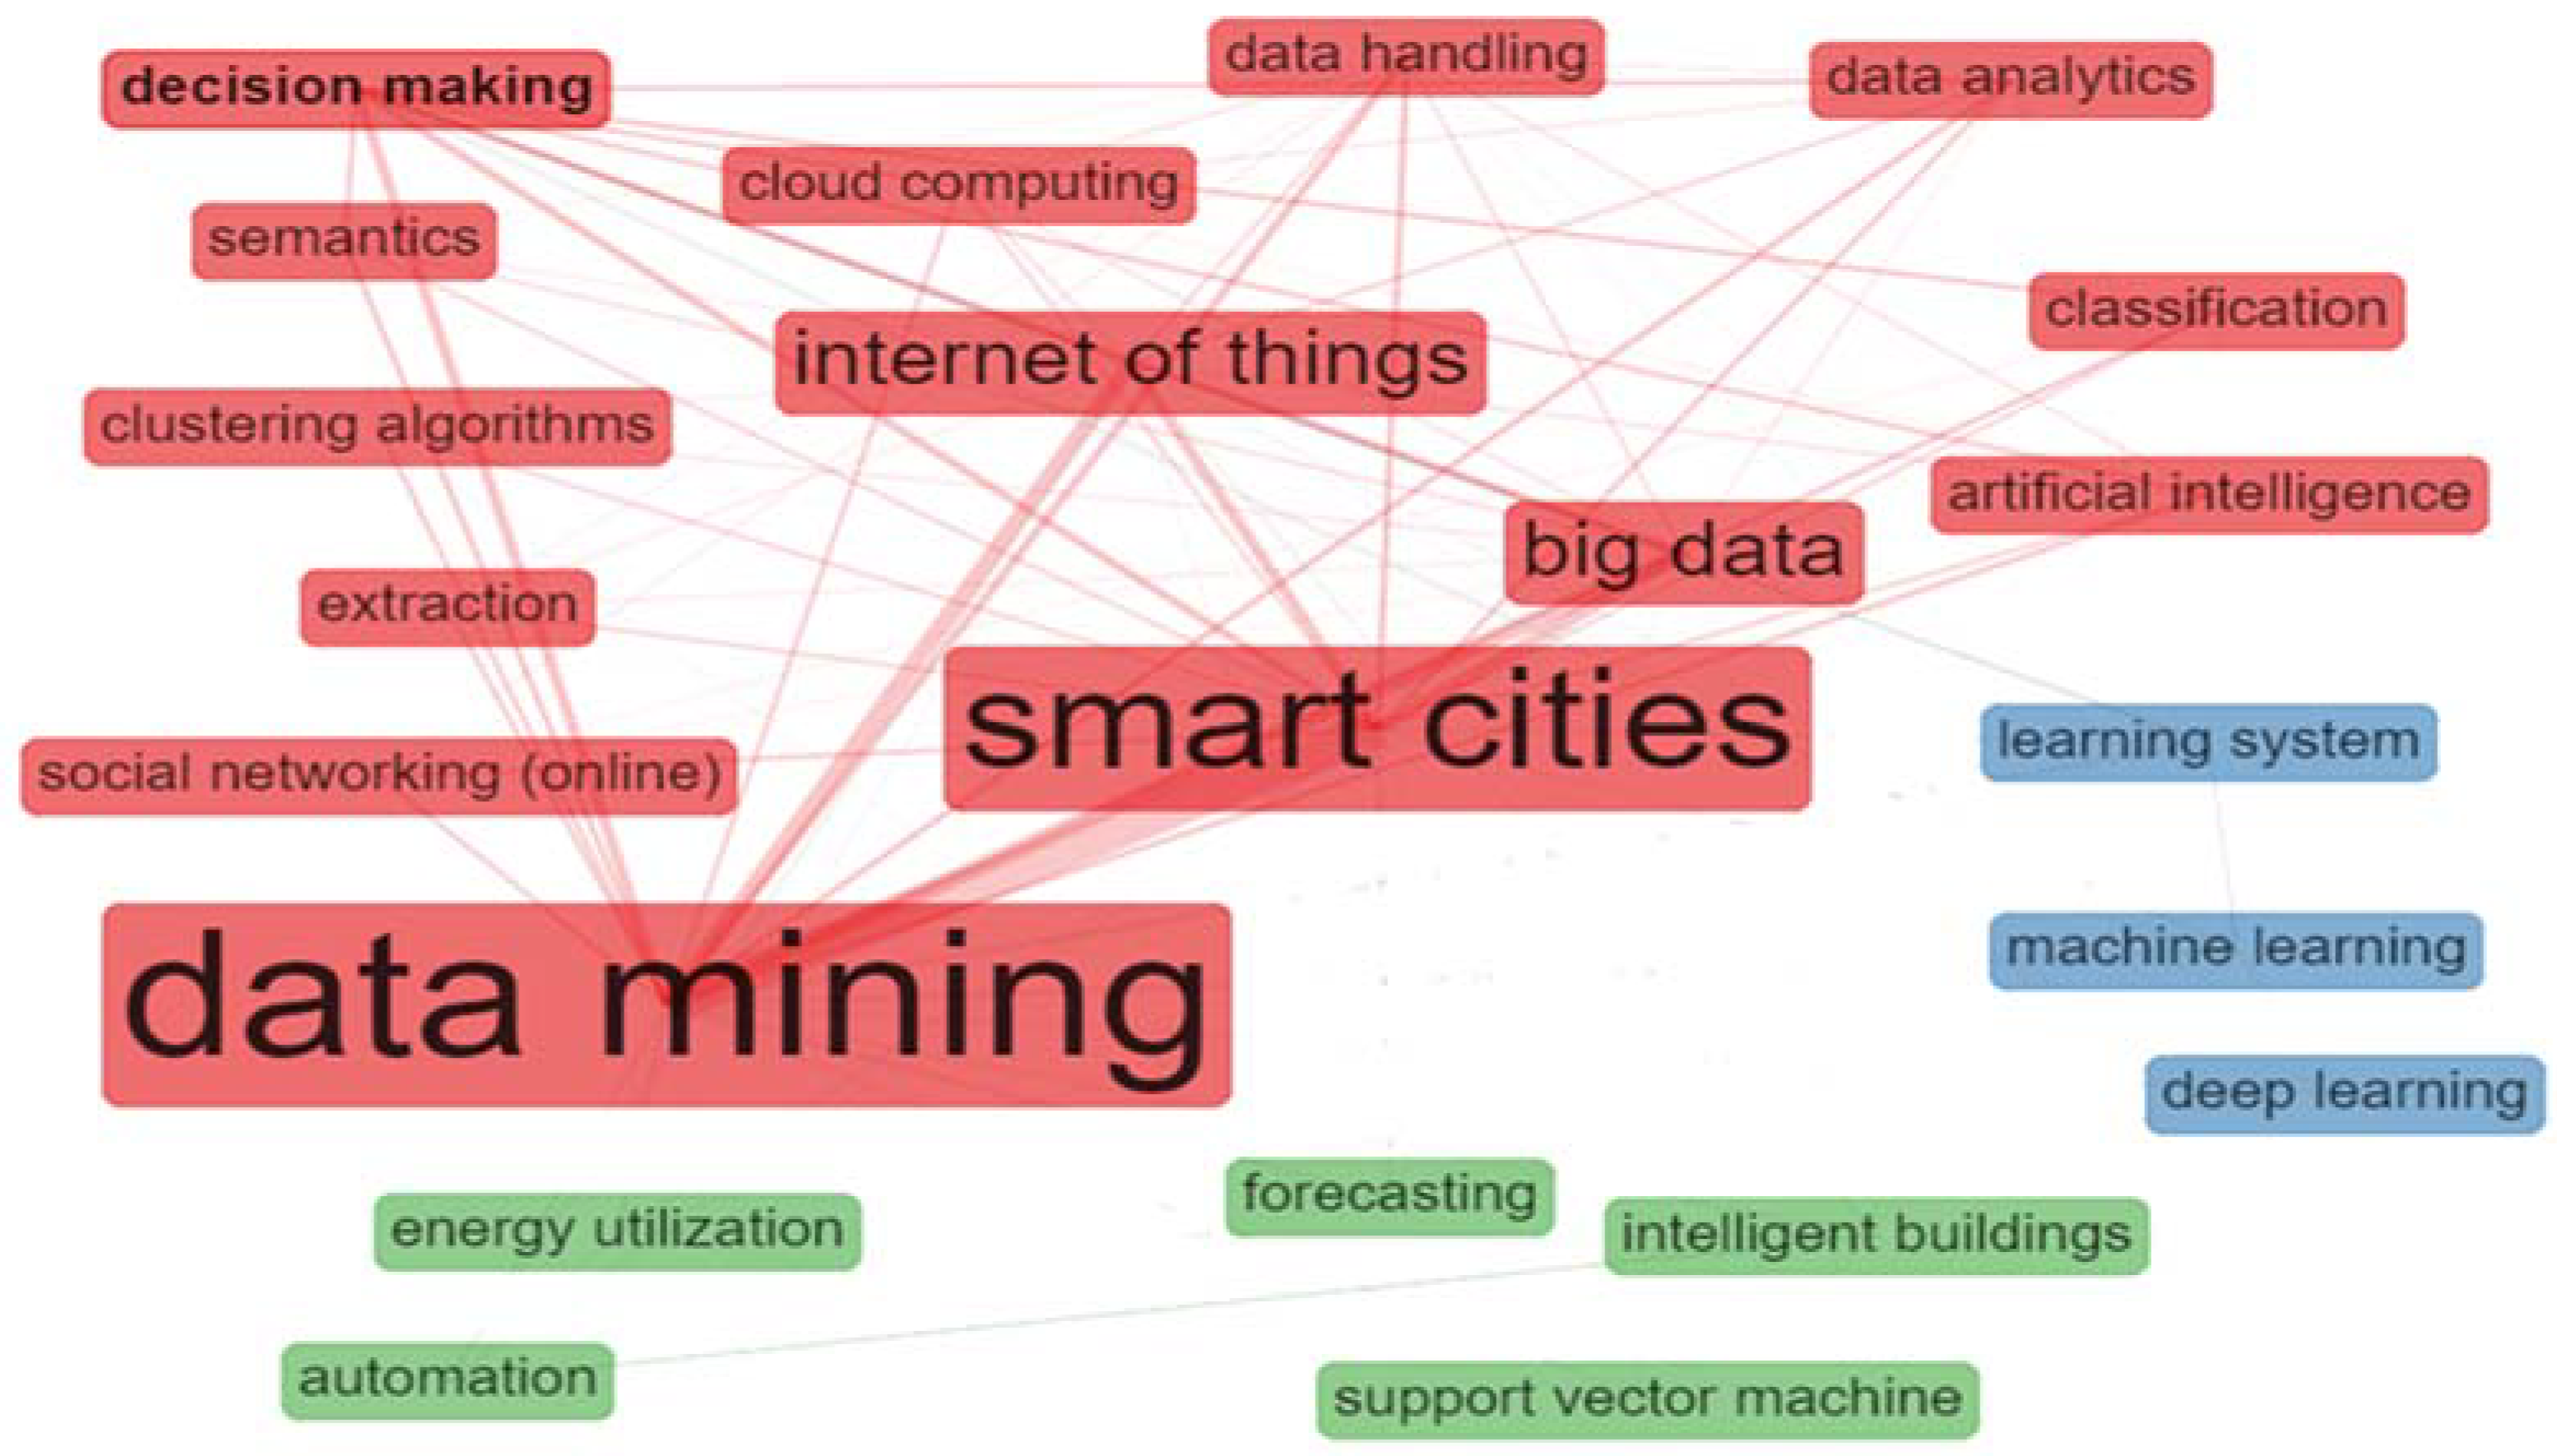
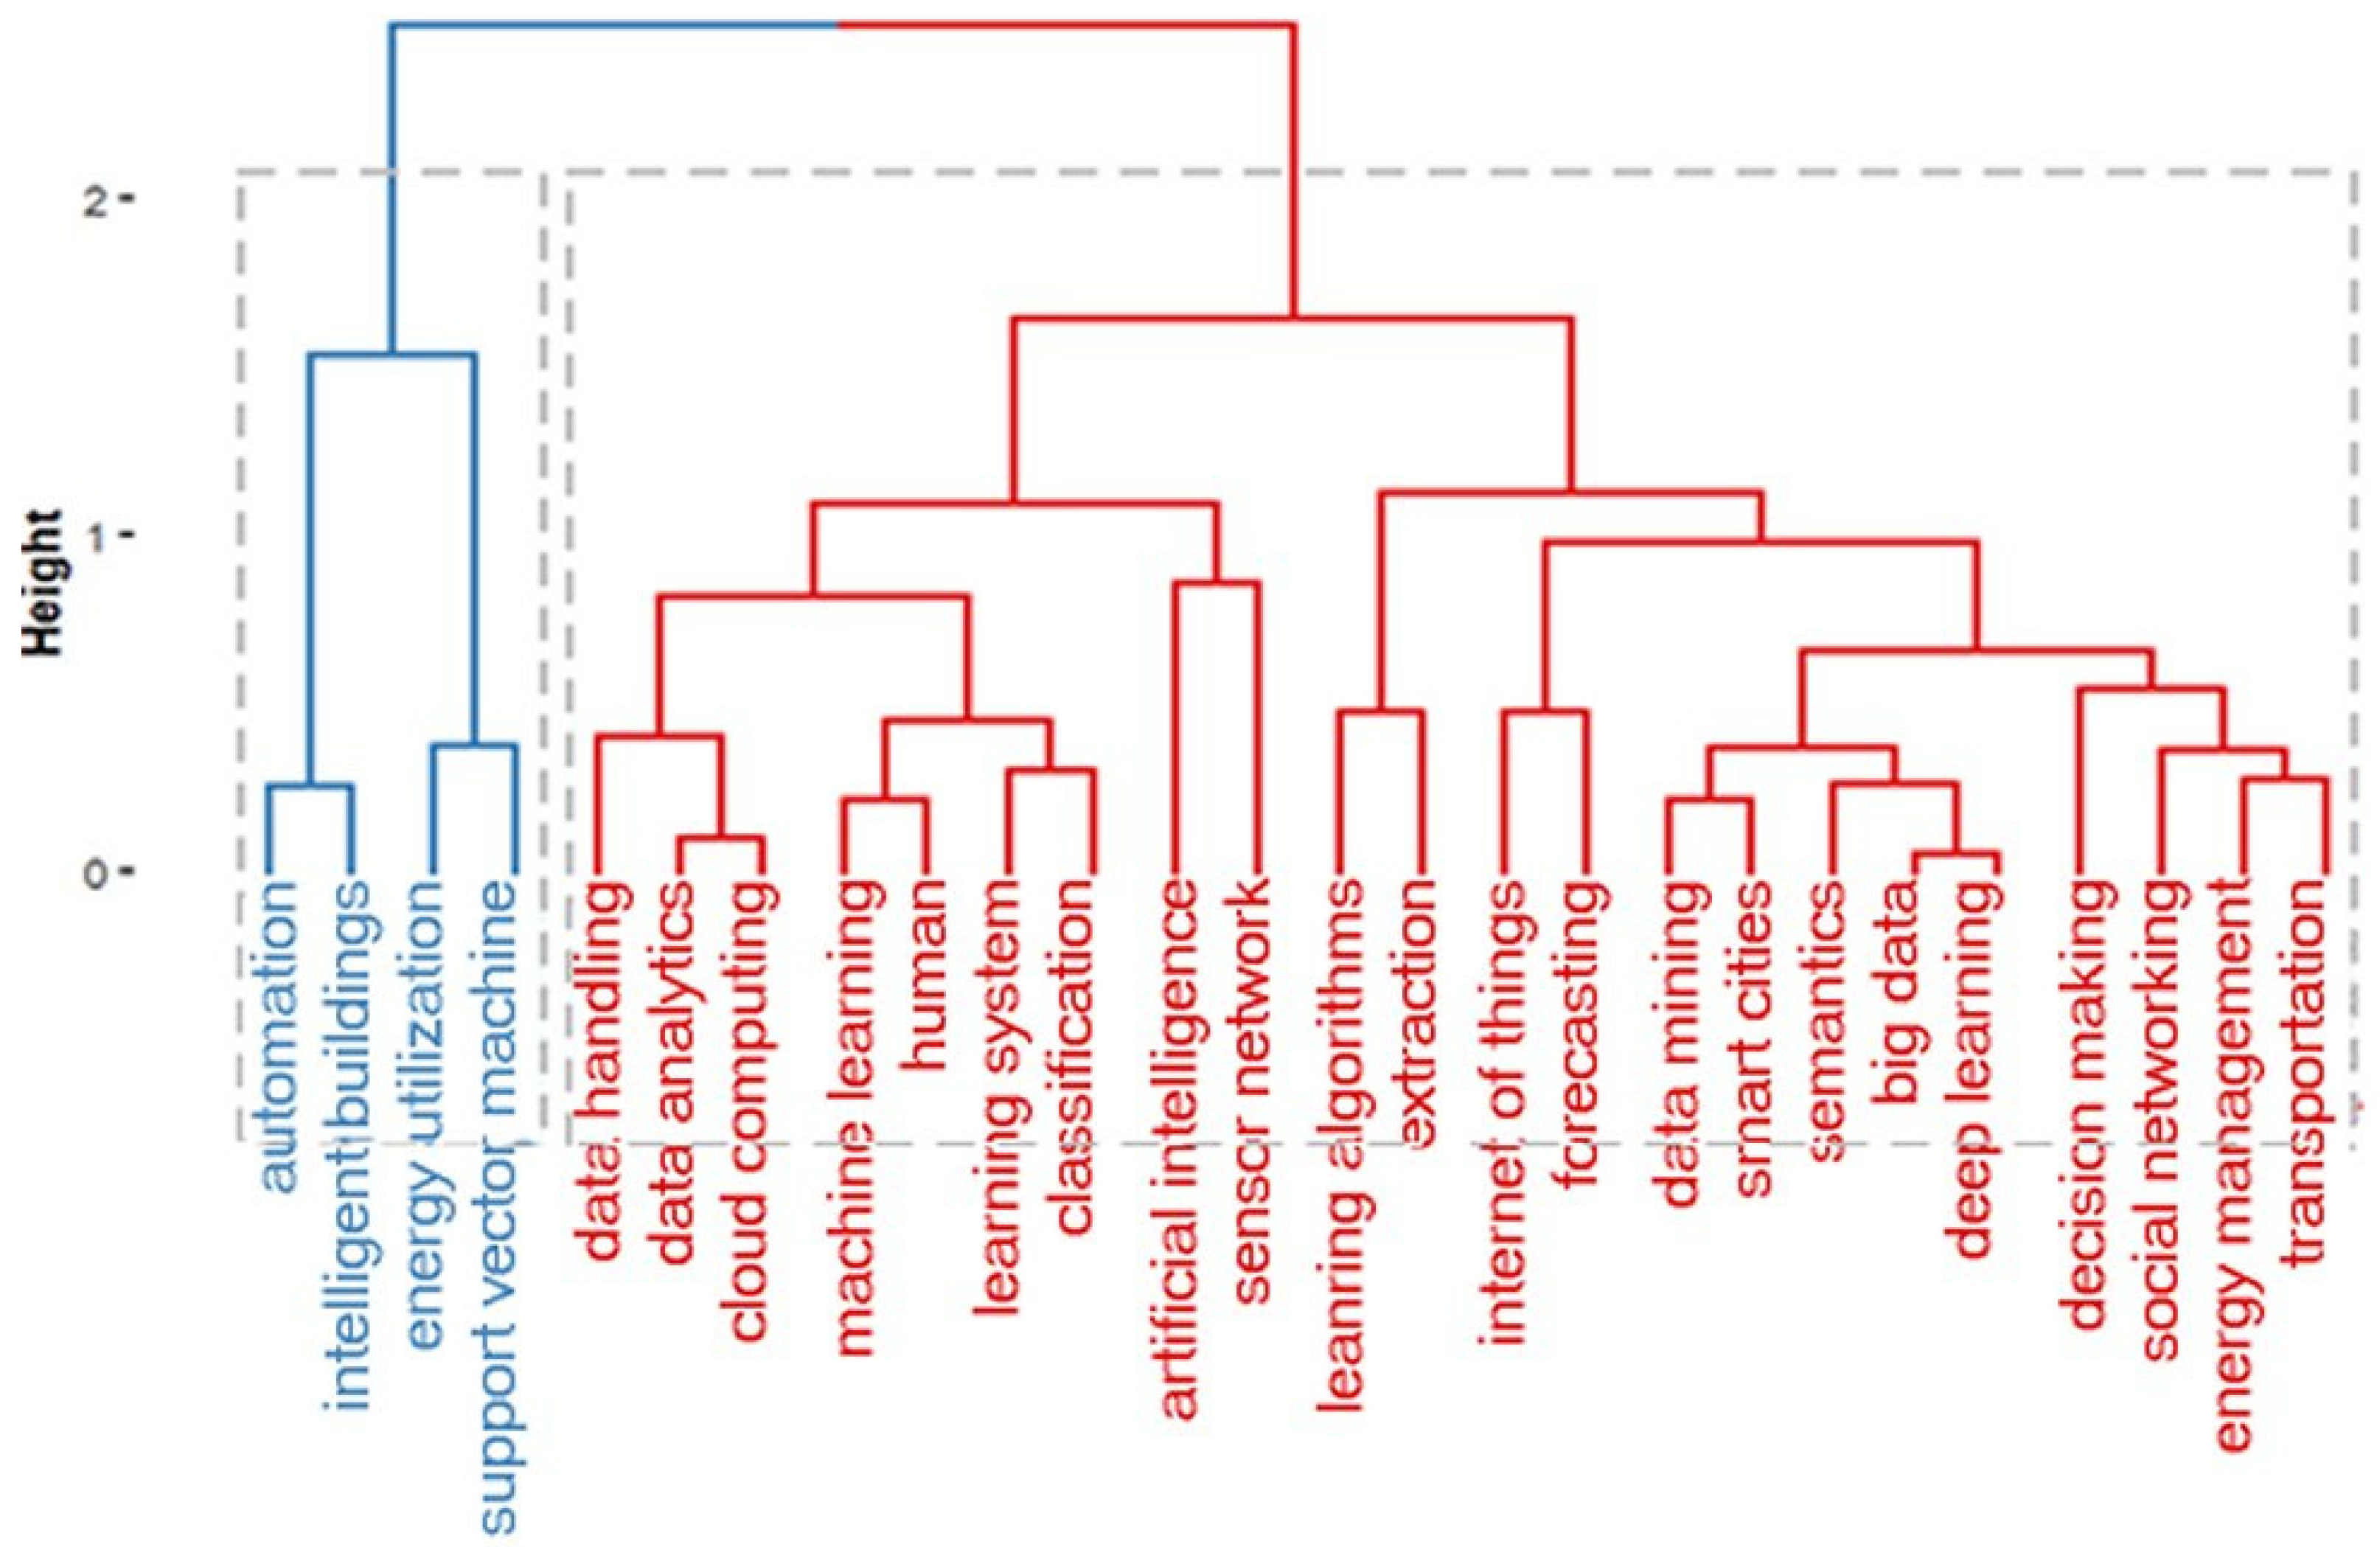
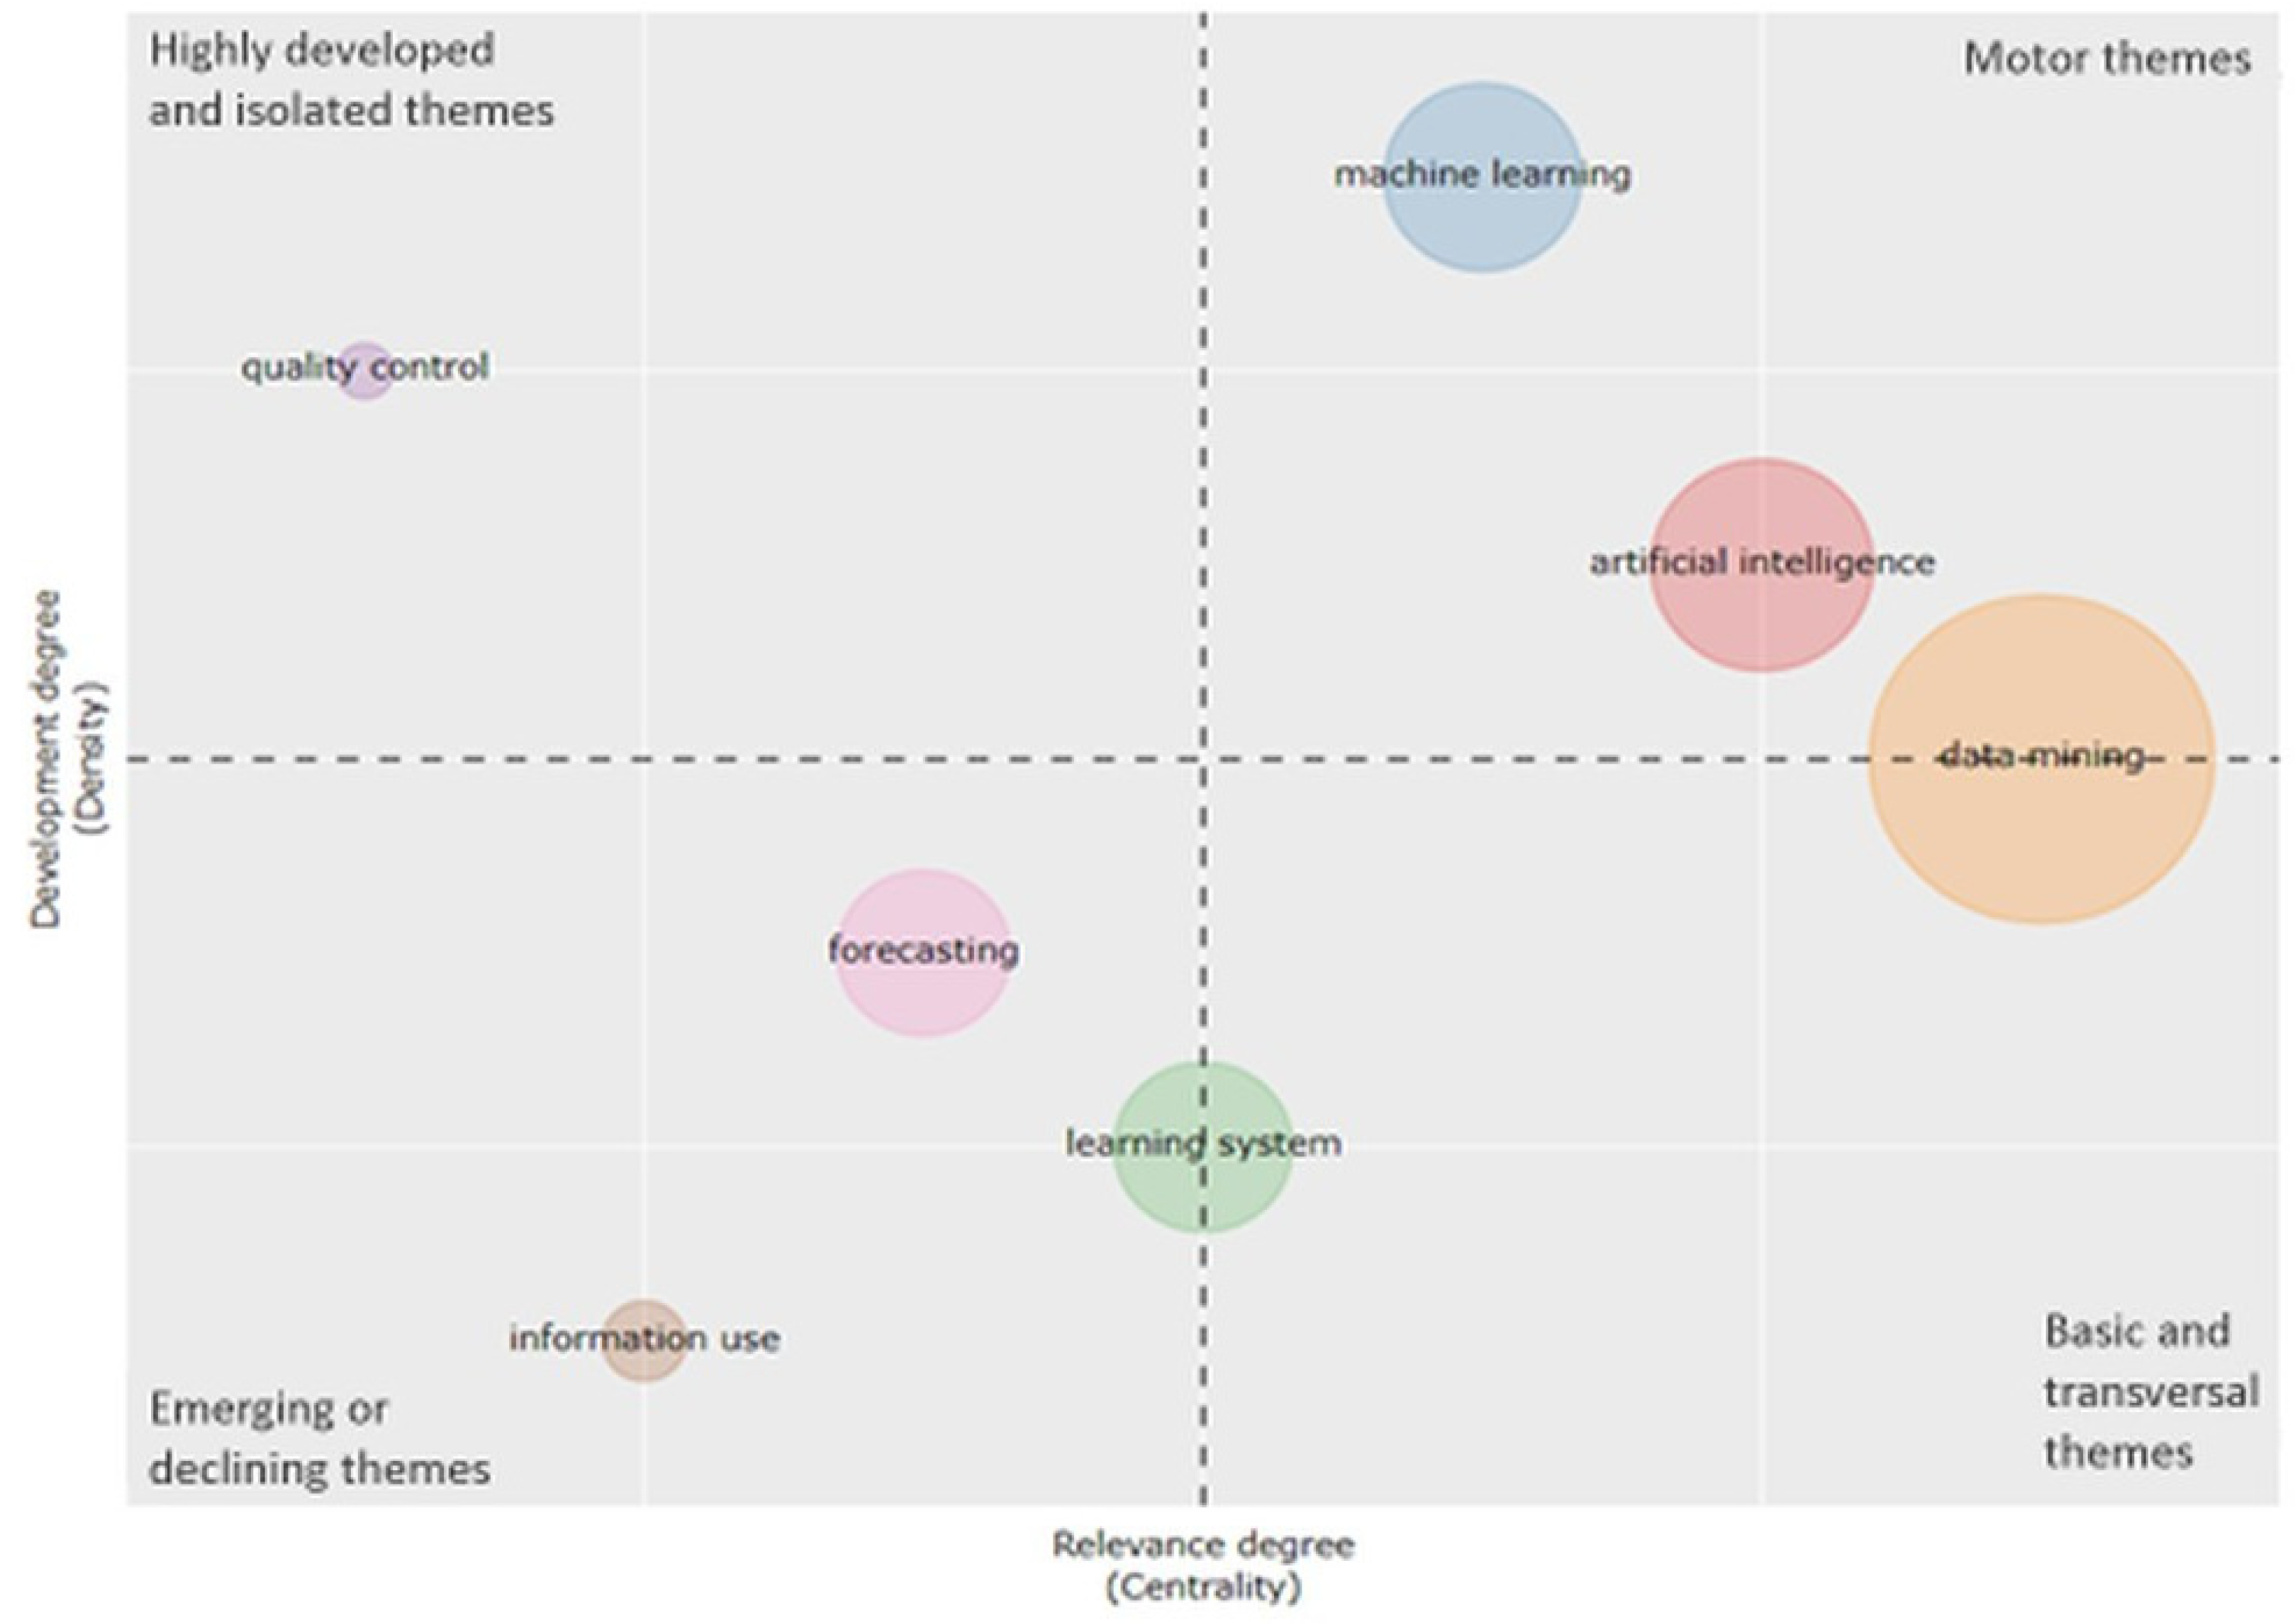
The word co-occurrences are a measure of the different poles of interests that subserve to build the structure and the dynamics of a scientific field. Two words, Wi and Wj, co-occur in the corpus if there is at least one document containing both Wi and Wj. The strength of the link between Wi and Wj is given by the number Cij of documents in which the couple (Wi, Wj) appears [148]. A word co-occurrence network (Figure 12) can be considered as a concept map [144] that facilitates the understanding of the knowledge components and cognitive structure of a research field by examining the structure of the map [152]. Each node in the network represents a semantic concept, and the size of a node shows the frequency of each concept. The weight of the edge between two nodes represents the strength of the relationship between the concepts. When word co-occurrence analysis is used for mapping a research topic, clusters of keywords, as shown in Figure 13, and their links are obtained. These clusters can be considered as themes. In a theme, the keywords and their interconnections portray a network graph called a “thematic network” (Figure 14). Each theme obtained in this process is indicated by two parameters, centrality, which represents the relevance degree in the horizontal axis, and density, which represents the development degree in the vertical axis [152].
4.6. Social Structure
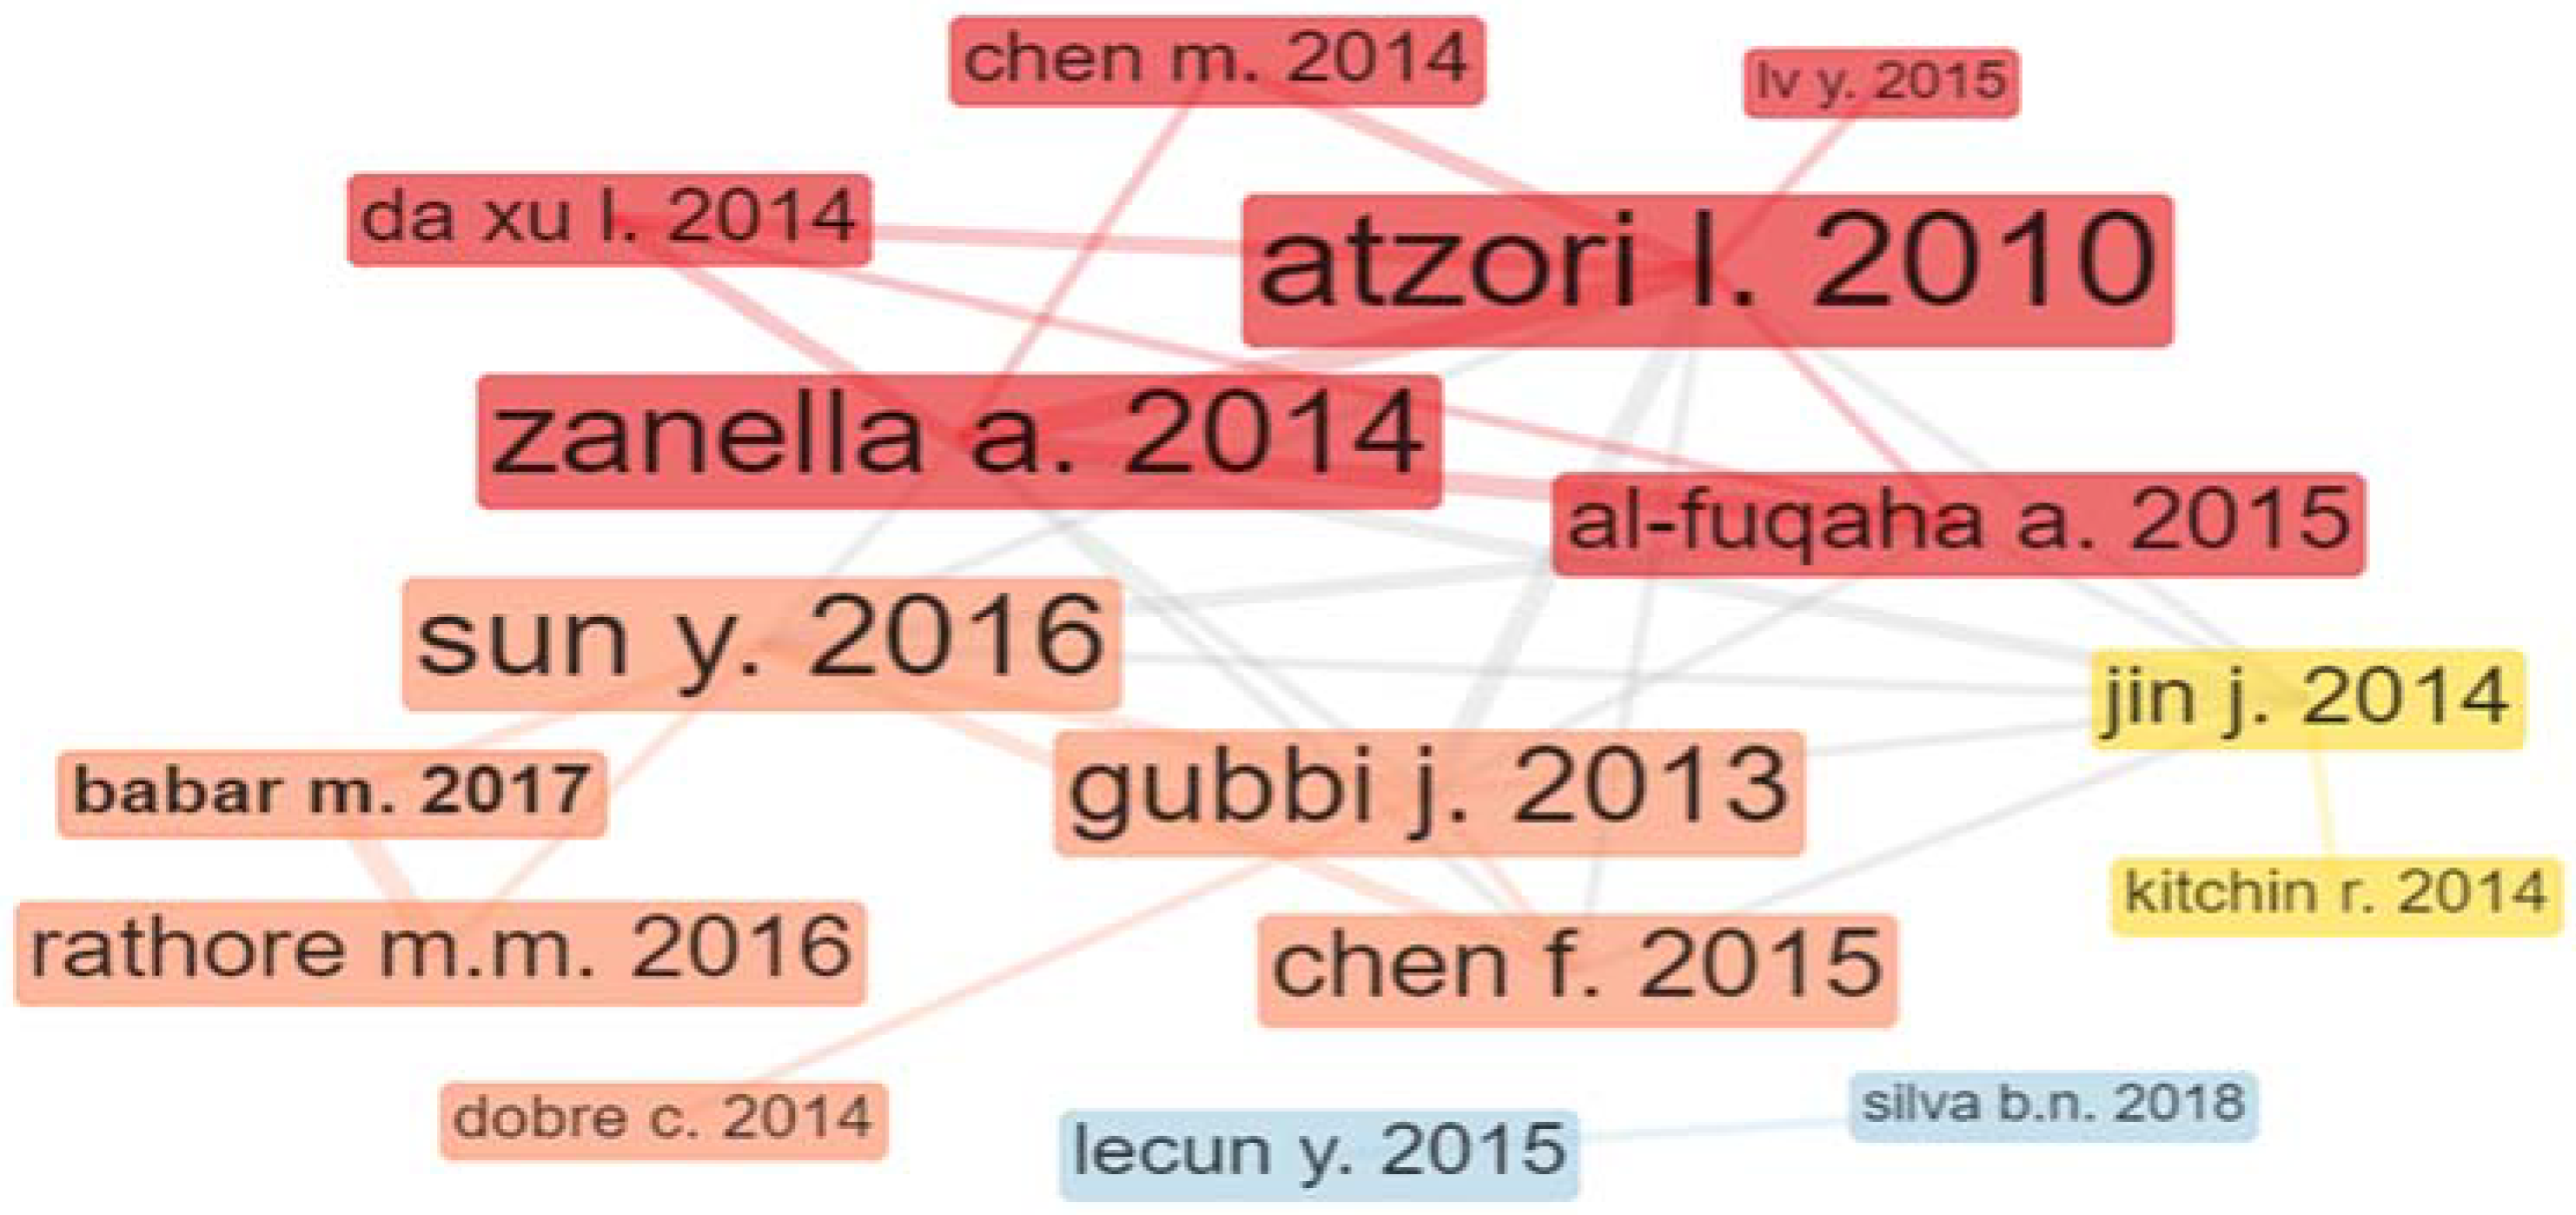
Co-citation analysis is a common analysis in bibliometrics. It employs citation counts as a measure of similarity between documents, authors, and journals [142]. As de Belis states, “Co-citation analysis rests on the premise that if two documents are cited by a third document, it is likely that some kind of structural relationship between them does exist, the strength of the relationship depending on how many times they are co-cited in a given corpus of literature. The more two documents are co-cited, the more likely it is that their repeated co-link has something to say about the sociocognitive structure of the subject area to which the papers belong. Consequently, their position is represented by nearby points on the surface of the map” [148]. These networks aim to quantify interdependencies and scholarly influence among the entities at different levels of detail, including between authors, journals, subject categories, institutions, and countries [144]. Figure 15 illustrates the co-citation network of the selected set of articles in our study.
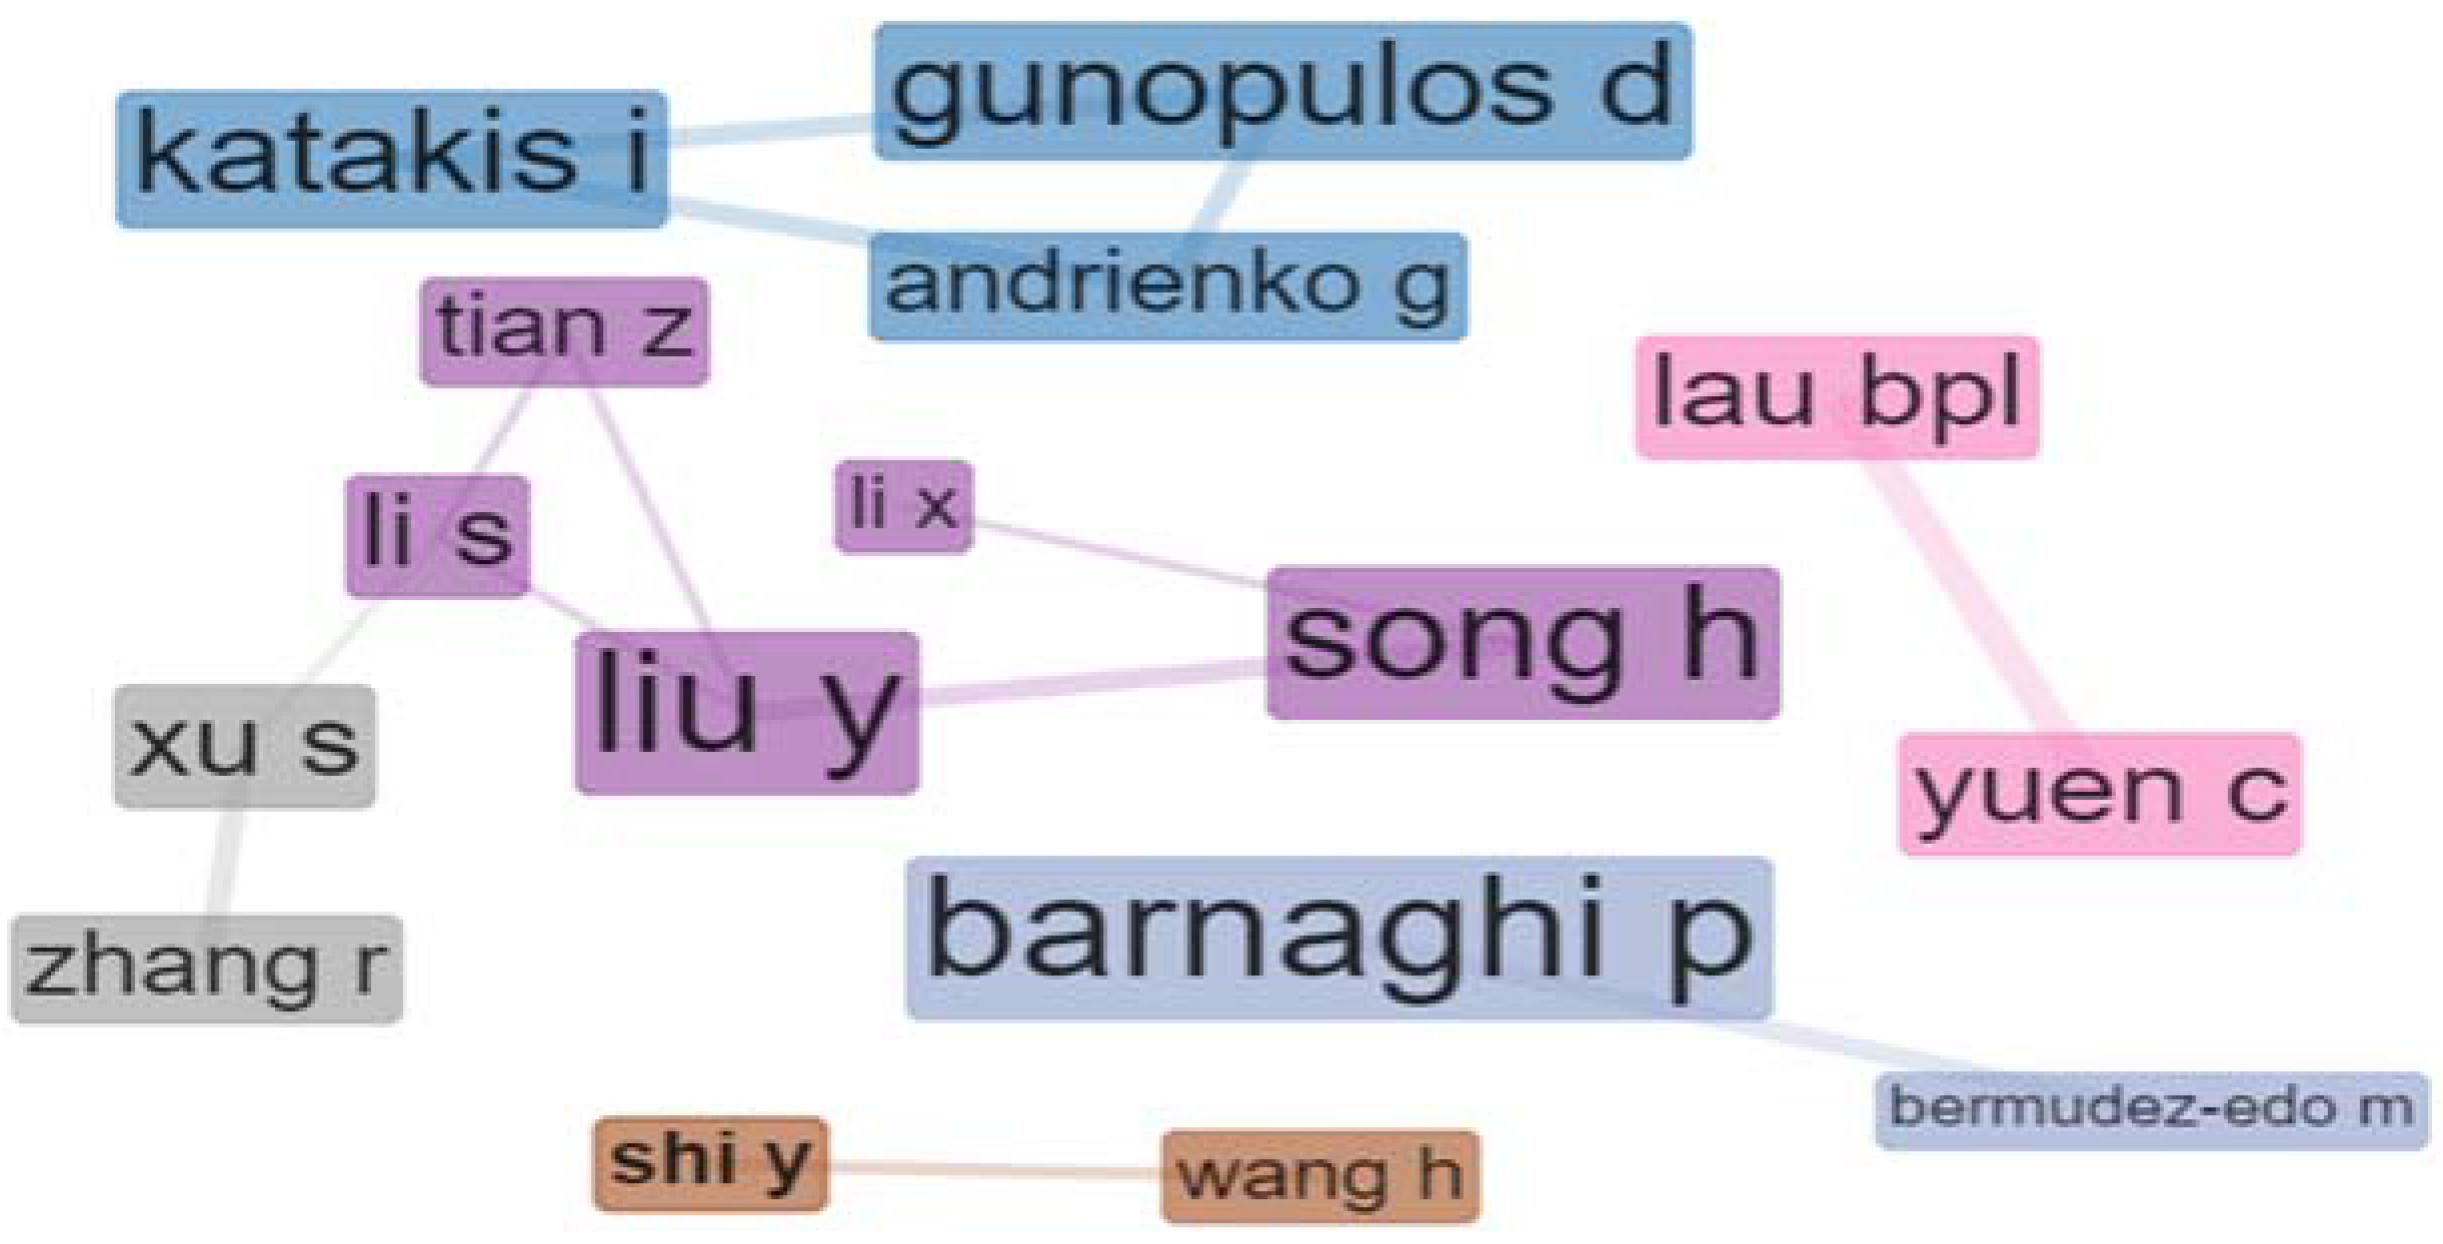
A scientific collaboration network (Figure 16) is one of the most well-documented forms of scientific collaboration. It is a network where the nodes represent the authors, and the links represent the collaboration between authors, namely co-authorships [142]. The size of each node shows the centrality of a role in a cluster, and the edge weight how strong is the relationship between them, based on the number of articles published in co-authorship [143]. Collaboration serves social networks development and knowledge building. Collaboration network analysis is mainly prevalent in interdisciplinary domains, where authors from different areas contribute to scientific development and progression growth. Such networks support interpreting the behavioral characteristics of scientists in multiple domains, presenting the phenomenon of knowledge flows [144].
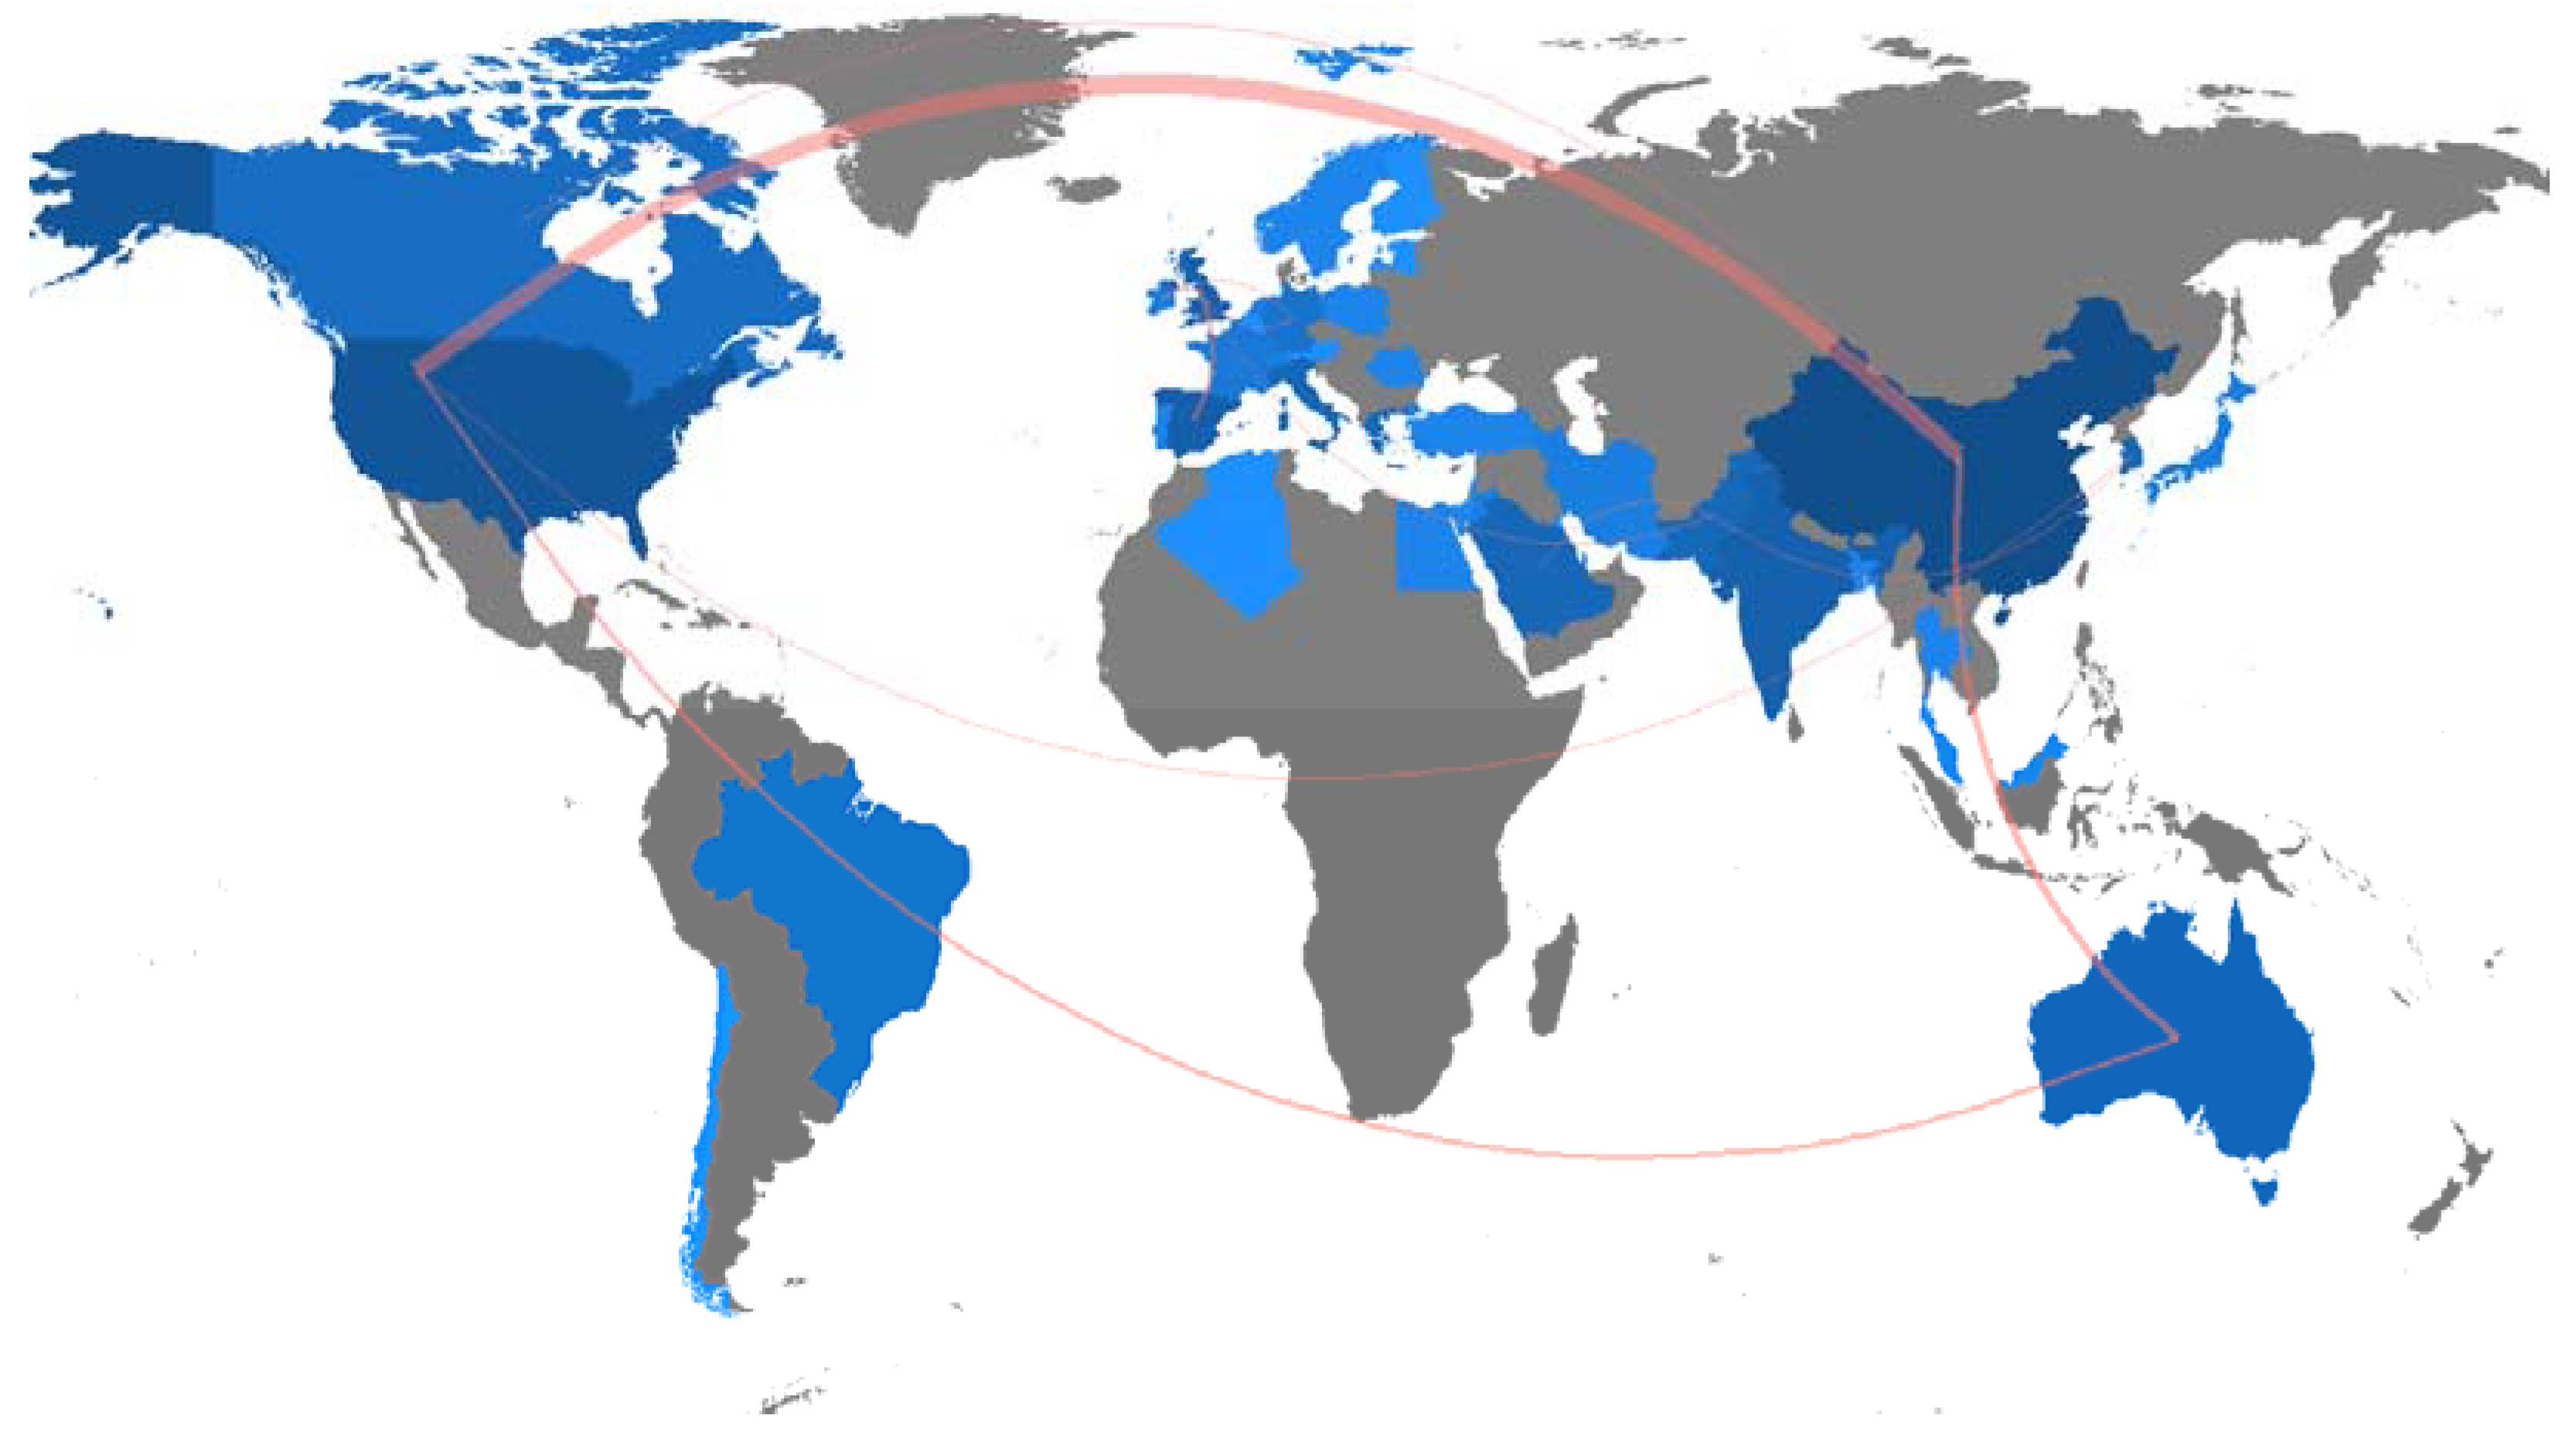
Figure 17 shows the visual representation of the collaboration network between countries. We posed the analogous query considering a threshold of two or more collaborative papers for each country relationship. We can see that the strongest edge appears between China and the USA, which are the most productive countries in the research domain. The most productive countries appear with deep blue color. The 10 strongest relationships between countries are presented in Table 11. As Waheed et al. [144] state, the number of international co-publications shared between two regions indicates the extent of collaboration between those regions, implying knowledge flows.
5. Conclusions
Constructing a smart city is a systematic process, which is conducted over time, step by step. The design and implementation of smart city applications are extremely complex actions, and the choice and use of the appropriate DM techniques and tools for the communication between real and digital worlds have a crucial role in operation success. This study aimed to provide a comprehensive view of research published in the literature associated with DM algorithms for smart cities, based on bibliometric analysis using Scopus data from 2013 to February 2021.
The study has indicated that DM algorithms for smart cities are an evolving and fast-growing research field as they grew multiplicatively in the last 8 years. The topic has been most popular among researchers in China, the USA, India, Spain, the U.K., and Greece and has emerged as a fertile field for collaboration among researchers from different countries, especially between China and the USA. The research landscape was also explored by means of bibliometric analysis, at various levels, including investigation of prominent articles, sources, and authors.
The most frequent terms that appear in the articles are “data mining”, “smart cities”, “internet of things”, and “big data”. The word dynamic graph (Figure 11) showed that the growth of the appearances of the most frequent words follows the trend of the research topic. The word co-occurrence network, the topic dendrogram, and the thematic map (Figure 12, Figure 13 and Figure 14) represent the conceptual structure of the research field, as they illustrate not only the most frequent terms of the articles but also the connections between them.
The critical review of the selected articles highlighted the wide range of DM techniques employing the development of smart cities. The integration of different technologies used in smart city applications and services remains the most challenging issue to overcome due to the volume, heterogeneity, and complexity of the collected data [153]. The development of advanced data-driven infrastructure and techniques that scale well and facilitate the interoperability of smart city applications and services can be a promising field for future work.
Funding
This research received no external funding.
Institutional Review Board Statement
Not applicable.
Informed Consent Statement
Not applicable.
Data Availability Statement
Not applicable.
Conflicts of Interest
The authors declare no conflict of interest.
Abbreviations
The following abbreviations are used in this manuscript.
| AI | Artificial Intelligence |
| ANFIS | Adaptive Neuro-Fuzzy Inference System |
| ANN | Artificial Neural Networks |
| AR | Association Rules |
| ARIMA | Auto-Regressive Integrated Moving Average |
| BN | Bayesian Network |
| BoW | Bag of Words |
| BP | Back Propagation |
| BRANN | Bayesian Regularized Artificial Neural Network |
| CBoW | Continuous Bag of Words |
| CNN | Convolutional Neural Network |
| CP-ANN | Counter-Propagation Artificial Neural Network |
| DBN | Deep Belief Network |
| DBSCAN | Density-Based Spatial Clustering of Applications with Noise |
| DL | Deep Learning |
| DLM | Dictionary Learning Model |
| DM | Data Mining |
| DRF | Deep Reinforcement Learning |
| DSL | Digital Subscriber Line |
| DT | Decision Trees |
| DTW | Dynamic Time Warping |
| EA | Evolutionary Algorithms |
| EM | Expectation—Maximization algorithm |
| ETS | Exponential Smoothing State-Space Model |
| FER | Facial Expression Recognition |
| FL | Fuzzy Logic |
| GCT | Granger Causality Test |
| GIS | Graphic Information System |
| GSM | Global System for Mobile communications |
| GPL | General Public License |
| HC | Hierarchical Clustering |
| ICT | Information and Communication Technologies |
| I-EPOS | Iterative Economic Planning and Optimized Selections |
| IF | Impact Factor |
| IoT | Internet of Things |
| KNN | K Nearest Neighbors |
| LDA | Latent Dirichlet Allocation |
| LinR | Linear Regression |
| LogR | Logistic Regression |
| LRT | Likelihood Ratio Test |
| LS | Least Squares |
| LSTM | Long Short-Term Memory |
| LTE | 3GPP Long-Term Evolution |
| ML | Machine Learning |
| MP | Multilayer Perceptron |
| NB | Naïve Bayes |
| NLP | Natural Language Processing |
| NMF | Non-Negative Matrix Factorization |
| OC-SVM | One-Class Support Vector Machines |
| OD | Open Data |
| OD matrix | Origin Destination matrix |
| PAM | Partitioning Around Medoids |
| PCA | Principal Component Analysis |
| POI | Places Of Interest |
| PY | Publication Year |
| RBF | Radial Basis Function |
| RF | Random Forest |
| RFID | Radio Frequency Identification |
| RL | Reinforcement Learning |
| RNN | Recurrent Neural Networks |
| SA | Sentiment Analysis |
| SMA | Social Media Analysis |
| SOM | Self-Organizing Map |
| SSNO | Semantic Sensor Network Ontology |
| SVM | Support Vector Machine |
| SVR | Support Vector Regression |
| TC | Total Citations |
| TESLA | Taylor Expanded Analog Forecasting Algorithm |
Appendix A

Table A1.
The 100 most cited journal articles in DM for the smart cities research topic.
| Total Citations | Author(s) | Publication Year | Title | |
|---|---|---|---|---|
| 1 | 276 | Marjani et al. | 2017 | Big IoT Data Analytics: Architecture, Opportunities, and Open Research Challenges |
| 2 | 149 | Lin et al. | 2017 | A Survey of Smart Parking Solutions |
| 3 | 129 | Khan et al. | 2015 | Towards Cloud Based Big Data Analytics for Smart Future Cities |
| 4 | 98 | Yassine et al. | 2017 | Mining Human Activity Patterns from Smart Home Big Data for Health Care Applications |
| 5 | 97 | Manic et al. | 2016 | Building Energy Management Systems: The Age of Intelligent and Adaptive Buildings |
| 6 | 93 | Yang et al. | 2017 | Utilizing Cloud Computing to Address Big Geospatial Data Challenges |
| 7 | 78 | Liang et al. | 2018 | A Survey on Big Data Market: Pricing, Trading and Protection |
| 8 | 69 | Chen et al. | 2018 | Tripimputor: Real-Time Imputing Taxi Trip Purpose Leveraging Multi-Sourced Urban Data |
| 9 | 68 | Moreno et al. | 2017 | Applicability of Big Data Techniques To Smart Cities Deployments |
| 10 | 60 | Osman | 2019 | A Novel Big Data Analytics Framework for Smart Cities |
| 11 | 60 | Din et al. | 2019 | The Internet of Things: A Review of Enabled Technologies and Future Challenges |
| 12 | 60 | Sun and Axhausen | 2016 | Understanding Urban Mobility Patterns with a Probabilistic Tensor Factorization Framework |
| 13 | 55 | Moustafa et al. | 2019 | An Ensemble Intrusion Detection Technique Based on Proposed Statistical Flow Features for Protecting Network Traffic of Internet of Things |
| 14 | 54 | Garcia-Font et al. | 2016 | A Comparative Study of Anomaly Detection Techniques for Smart City Wireless Sensor Networks |
| 15 | 52 | Li et al. | 2015 | Big Data in Smart Cities |
| 16 | 51 | Pena et al. | 2016 | Rule-Based System to Detect Energy Efficiency Anomalies in Smart Buildings, a Data Mining Approach |
| 17 | 47 | Khan et al. | 2017 | Smart City and Smart Tourism: A Case of Dubai |
| 18 | 47 | Anatharam et al. | 2015 | Extracting City Traffic Events From Social Streams |
| 19 | 47 | Li et al. | 2013 | Geomatics for Smart Cities-Concept, Key Techniques, and Applications |
| 20 | 45 | Coelho et al. | 2017 | A GPU Deep Learning Metaheuristic Based Model for Time Series Forecasting |
| 21 | 45 | Nef et al. | 2015 | Evaluation of Three State-of-the-Art Classifiers for Recognition of Activities of Daily Living from Smart Home Ambient Data |
| 22 | 37 | Liu et al. | 2017 | Exploring Data Validity in Transportation Systems for Smart Cities |
| 23 | 36 | Perez-Chacon et al. | 2018 | Big Data Analytics for Discovering Electricity Consumption Patterns in Smart Cities |
| 24 | 35 | Lau et al. | 2019 | A Survey of Data Fusion in Smart City Applications |
| 25 | 34 | Sun et al. | 2018 | Learning Sparse Representation with Variational Auto-Encoder for Anomaly Detection |
| 26 | 34 | Massana et al. | 2017 | Identifying Services for Short-Term Load Forecasting Using Data Driven Models in a Smart City Platform |
| 27 | 34 | De Gennaro et al. | 2016 | Big Data for Supporting Low-Carbon Road Transport Policies in Europe: Applications, Challenges, and Opportunities |
| 28 | 31 | Li et al. | 2019 | IoT Data Feature Extraction and Intrusion Detection System for Smart Cities Based on Deep Migration Learning |
| 29 | 31 | Chui et al. | 2017 | Disease Diagnosis in Smart Healthcare: Innovation, Technologies and Applications |
| 30 | 30 | Qiu et al. | 2018 | Automatic Non-Taxonomic Relation Extraction from Big Data in Smart City |
| 31 | 29 | Yao et al. | 2017 | A Co-Location Pattern-Mining Algorithm with A Density-Weighted Distance Thresholding Consideration |
| 32 | 29 | Xu et al. | 2017 | A Latency and Coverage Optimized Data Collection Scheme for Smart Cities Based on Vehicular Ad-Hoc Networks |
| 33 | 29 | Kim and Chung | 2017 | Depression Index Service Using Knowledge Based Crowdsourcing in Smart Health |
| 34 | 28 | Fernadez-Ares et al. | 2017 | Studying Real Traffic and Mobility Scenarios for a Smart City Using a New Monitoring and Tracking System |
| 35 | 28 | Cerrruela Garcia et al. | 2016 | State of the Art, Trends and Future of Bluetooth Low Energy, Near Field Communication and Visible Light Communication in the Development of Smart Cities |
| 36 | 26 | Musto et al. | 2015 | Crowdpulse: A Framework for Real-Time Semantic Analysis of Social Streams |
| 37 | 24 | Fotopoulou et al. | 2016 | Linked Data Analytics in Interdisciplinary Studies: The Health Impact of Air Pollution in Urban Areas |
| 38 | 23 | Moustaka et al. | 2018 | A Systematic Review for Smart City Data Analytics |
| 39 | 23 | Waheed et al. | 2018 | A Bibliometric Perspective of Learning Analytics Research Landscape |
| 40 | 23 | Ju et al. | 2018 | Citizen-Centered Big Data Analysis-Driven Governance Intelligence Framework for Smart Cities |
| 41 | 23 | Liu et al. | 2016 | A Cloud-Based Taxi Trace Mining Framework for Smart City |
| 42 | 22 | Yang et al. | 2019 | A Model of Customizing Electricity Retail Prices Based on Load Profile Clustering Analysis |
| 43 | 21 | Soomro et al. | 2019 | Smart City Big Data Analytics: An Advanced Review |
| 44 | 21 | Bermudez-Edo et al. | 2018 | Analyzing Real World Data Streams with Spatio-Temporal Correlations: Entropy vs. Pearson Correlation |
| 45 | 21 | Gomede et al. | 2018 | Application of Computational Intelligence to Improve Education in Smart Cities |
| 46 | 21 | Giatsoglou et al. | 2016 | Citypulse: A Platform Prototype for Smart City Social Data Mining |
| 47 | 20 | de Souza et al. | 2019 | Data Mining and Machine Learning to Promote Smart Cities: A Systematic Review from 2000 to 2018 |
| 48 | 20 | Semanski et al. | 2017 | Spatial Context Mining Approach For Transport Mode Recognition From Mobile Sensed Big Data |
| 49 | 19 | Huang et al. | 2016 | An Energy-Efficient Train Control Framework for Smart Railway Transportation |
| 50 | 19 | Liang et al. | 2020 | A Research on Remote Fracturing Monitoring and Decision-Making Method Supporting Smart City |
| 51 | 18 | Xhafa and Barolli | 2014 | Semantics, Intelligent Processing and Services for Big Data |
| 52 | 16 | Kolozali et al. | 2019 | Observing the Pulse of a City: A Smart City Framework for Real-Time Discovery, Federation, and Aggregation of Data Streams |
| 53 | 16 | Shirowzhan, and Sepasgozar | 2019 | Spatial Analysis Using Temporal Point Clouds in Advanced GIS: Methods for Ground Elevation Extraction in Slant Areas and Building Classifications |
| 54 | 16 | Lin et al. | 2017 | Analyzing the Relationship Between Human Behavior and Indoor Air Quality |
| 55 | 15 | Jia et al. | 2018 | Data Driven Congestion Trends Prediction of Urban Transportation |
| 56 | 15 | Lei et al. | 2016 | Robust K-Means Algorithm with Automatically Splitting and Merging Clusters and its Applications for Surveillance Data |
| 57 | 14 | Alkhatib et al. | 2019 | An Arabic Social Media Based Framework for Incidents and Events Monitoring in Smart Cities |
| 58 | 14 | Gaber et al. | 2019 | Internet of Things and Data Mining: From Applications to Techniques and Systems |
| 59 | 14 | Eirinaki et al. | 2018 | A Building Permit System for Smart Cities: A Cloud-Based Framework |
| 60 | 14 | Costa et al. | 2018 | Twittersensing: An Event-Based Approach for Wireless Sensor Networks Optimization Exploiting Social Media in Smart City Applications |
| 61 | 14 | Nesi et al. | 2016 | Geographical Localization of Web Domains and Organization Addresses Recognition by Employing Natural Language Processing, Pattern Matching and Clustering |
| 62 | 13 | Chammas et al. | 2019 | An Efficient Data Model for Energy Prediction Using Wireless Sensors |
| 63 | 13 | Leung et al. | 2019 | AI-Based Sensor Information Fusion for Supporting Deep Supervised Learning |
| 64 | 13 | D’Aniello et al. | 2018 | An Approach Based on Semantic Stream Reasoning to Support Decision Processes in Smart Cities |
| 65 | 13 | Honavar and Sami | 2016 | Extracting Usage Patterns from Power Usage Data of Homes’ Appliances in Smart Home Using Big Data Platform |
| 66 | 12 | Chen et al. | 2019 | Visualization Model of Big Data Based on Self-Organizing Feature Map Neural Network and Graphic Theory for Smart Cities |
| 67 | 12 | Khadam et al. | 2019 | Digital Watermarking Technique for Text Document Protection Using Data Mining Analysis |
| 68 | 12 | Gonzalez-Vidal et al. | 2018 | BEATS: Blocks of Eigenvalues Algorithm for Time Series Segmentation |
| 69 | 12 | Tse et al. | 2018 | Social Network Based Crowd Sensing for Intelligent Transportation and Climate Applications |
| 70 | 12 | Olszewski et al. | 2018 | Solving “Smart City” Transport Problems by Designing Carpooling Gamification Schemes with Multi-Agent Systems: The Case of the So-Called “Mordor of Warsaw” |
| 71 | 12 | Zear et al. | 2016 | Intelligent Transport System: A Progressive Review |
| 72 | 11 | Rawashdeh et al. | 2020 | A Knowledge-Driven Approach for Activity Recognition in Smart Homes Based on Activity Profiling |
| 73 | 11 | Kong et al. | 2019 | CoPFun: an Urban Co-occurrence Pattern Mining Scheme Based on Regional Function Discovery |
| 74 | 11 | Bellini et al. | 2017 | Wi-Fi Based City Users’ Behaviour Analysis for Smart City |
| 75 | 11 | Oralhan et al. | 2017 | Smart City Application: Internet of Things (IoT) Technologies Based Smart Waste Collection Using Data Mining Approach and Ant Colony Optimization |
| 76 | 11 | Wang and Li | 2016 | Traffic and Transportation Smart with Cloud Computing on Big Data |
| 77 | 10 | Ammer et al. | 2019 | Comparative Analysis of Machine Learning Techniques for Predicting Air Quality in Smart Cities |
| 78 | 10 | Zou et al. | 2018 | A Novel Network Security Algorithm Based on Improved Support Vector Machine from Smart City Perspective |
| 79 | 10 | Tausif et al. | 2017 | Towards Designing Efficient Lightweight Ciphers for Internet of Things |
| 80 | 10 | Souza et al. | 2016 | Using Big Data and Real-Time Analytics to Support Smart City Initiatives |
| 81 | 9 | Pasupa et al. | 2019 | Thai Sentiment Analysis with Deep Learning Techniques: A Comparative Study Based on Word Embedding, POS-Tag, and Sentic Features |
| 82 | 9 | Noura et al. | 2019 | Automatic Knowledge Extraction to Build Semantic Web of Things Applications |
| 83 | 9 | Qiu et al. | 2017 | A Data-Driven Robustness Algorithm for the Internet of Things in Smart Cities |
| 84 | 8 | Kumar et al. | 2020 | A Strong and Efficient Baseline for Vehicle Re-Identification Using Deep Triplet Embedding |
| 85 | 8 | Serrano and Bajo | 2019 | Deep Neural Network Architectures for Social Services Diagnosis in Smart Cities |
| 86 | 8 | Pan, Hariri, and Pacheco | 2019 | Context Aware Intrusion Detection for Building Automation Systems |
| 87 | 8 | Liang et al. | 2019 | Search Engine for the Internet of Things: Lessons from Web Search, Vision, and Opportunities |
| 88 | 8 | Puschmann et al. | 2019 | Using LDA to Uncover the Underlying Structures and Relations in Smart City Data Streams |
| 89 | 8 | Zuhairy and Al Zamil | 2018 | Energy-Efficient Load Balancing in Wireless Sensor Network: An Application of Multinomial Regression Analysis |
| 90 | 7 | Duan et al. | 2020 | Operating Efficiency-Based Data Mining on Intensive Land Use in Smart City |
| 91 | 7 | Bosse and Engel | 2019 | Real-Time Human-In-The-Loop Simulation with Mobile Agents, Chat Bots, and Crowd Sensing for Smart Cities |
| 92 | 7 | Wang et al. | 2019 | Next Location Prediction Based On An Adaboost-Markov Model of Mobile Users |
| 93 | 7 | Bracco et al. | 2018 | Advancing Climate Science with Knowledge-Discovery Through Data Mining |
| 94 | 7 | Zaree and Honarvar | 2018 | Improvement of Air Pollution Prediction in a Smart City and its Correlation with Weather Conditions Using Metrological Big Data |
| 95 | 6 | Hassib et al. | 2019 | An Imbalanced Big Data Mining Framework for Improving Optimization Algorithms Performance |
| 96 | 6 | Tsai et al. | 2018 | Data Analytics for Internet of Things: A Review |
| 97 | 6 | Chen and De Luca | 2018 | Technologies for Developing a Smart City in Computational Thinking |
| 98 | 6 | Zhang and Yuan | 2017 | The GPS Trajectory Data Research Based on the Intelligent Traffic Big Data Analysis Platform |
| 99 | 5 | Visvizi and Lytras | 2020 | Sustainable Smart Cities And Smart Villages Research: Rethinking Security, Safety, Well-Being, And Happiness |
| 100 | 5 | Anchal and Mittal | 2019 | Data Mining Techniques for IoT Enabled Smart Parking Environment: Survey |
References
- Townsend, A.M. Smart Cities: Big Data, Civic Hackers, and the Quest for a New Utopia; W.W. Norton & Company: New York, NY, USA, 2013. [Google Scholar]
- Le-Dang, Q.; Le-Ngog, T. Internet of Things (IoT) Infrastructures for Smart Cities. In Handbook of Smart Cities: Software Services and Cyber Infrastructure; Springer: Cham, Switzerland, 2018; pp. 1–30. [Google Scholar]
- Bermudez-Edo, M.; Barnaghi, P.; Moessner, K. Analysing Real World Data Streams with Spatio-temporal Correlations: Entropy vs. Pearson Correlation. Autom. Constr. 2018, 88, 87–100. [Google Scholar] [CrossRef]
- Anatharam, P.; Barnaghi, P.; Thirunarayan, K.; Sheth, A. Extracting City Traffic Events from Social Streams. ACM Trans. Intell. Syst. Technol. 2015, 6, 1–27. [Google Scholar] [CrossRef] [Green Version]
- Lisdorf, A. Demystifying Smart Cities: Practical Perspectives on How Cities Can Leverage the Potential of New Technologies; Apress: Copenhagen, Denmark, 2020. [Google Scholar]
- Lombardi, P.; Giordano, S. Evaluating the Smart and Sustainable Built Environment in Urban Planning. In Handbook of Research on Social, Economic, and Environmental Sustainability in the Development of Smart Cities; IGI Global: Hershey, PA, USA, 2015; pp. 44–59. [Google Scholar]
- He, X.; Wang, K.; Huang, H.; Liu, B. QoE-Driven Big Data Architecture for Smart City. IEEE Commun. Mag. 2018, 56, 88–93. [Google Scholar] [CrossRef]
- Bellini, P.; Cenni, D.; Nesi, P.; Paoli, I. Wi-Fi Based City Users’ Behaviour Analysis for Smart City. J. Vis. Lang. Comput. 2017, 42, 31–45. [Google Scholar] [CrossRef]
- Giatsoglou, M.; Chatzakou, D.; Gkatziaki, V.; Vakali, A.; Anthopoulos, L. CityPulse: A Platform Prototype for Smart City Social Data Mining. J. Knowl. Econ. 2016, 7, 344–372. [Google Scholar] [CrossRef]
- Siryani, J.; Tanju, B.; Eveleigh, T.J. A Machine Learning Decision-Support System Improves the Internet of Things’ Smart Meter Operations. IEEE Internet Things J. 2017, 4, 1056–1066. [Google Scholar] [CrossRef]
- Khan, Z.; Anjum, A.; Soomro, K.; Tahir, M.A. Towards cloud based big data analytics for smart future cities. J. Cloud Comput. 2015, 4, 1–11. [Google Scholar] [CrossRef] [Green Version]
- Mystakidis, A.; Stasinos, N.; Kousis, A.; Sarlis, V.; Koukaras, P.; Rousidis, D.; Kotsiopoulos, I.; Tjortjis, C. Predicting COVID-19 ICU Needs Using Deep Learning, XGBoost and Random Forest Regression with the Sliding Window Technique. Available online: https://0-smartcities-ieee-org.brum.beds.ac.uk/newsletter/july-2021/predicting-covid-19-icu-needs-using-deep-learning-xgboost-and-random-forest-regression-with-the-sliding-window-technique (accessed on 5 August 2021).
- Chatzinikolaou, T.; Vogiatzi, E.; Kousis, A.; Tjortjis, C. Smart Healthcare Support Using Data Mining and Machine Learning. IoT and WSN based Smart Cities: A Machine Learning Perspective. EAI/Springer Innov. Commun. Comput. 2021, in press. [Google Scholar]
- Nousi, C.; Belogianni, P.; Koukaras, P.; Tjortjis, C. Mining Data to Deal with Epidemics: Case Studies to Demonstrate Real World AI Applications. In Handbook of Artificial Intelligence in Healthcare; Lim, C.-P., Vaidya, A., Jain, K., Mahorkar, V.U., Jain, L.C., Eds.; Springer: Cham, Switzerland, 2021. [Google Scholar]
- Koukaras, P.; Rousidis, D.; Tjortjis, C. Forecasting and Prevention mechanisms using Social Media in Healthcare. Stud. Comput. Intell. 2020, 891, 121–137. [Google Scholar]
- Sun, L.; Axhausen, K.W. Understanding urban mobility patterns with a probabilistic tensor factorization framework. Transp. Res. Part B Methodol. 2016, 91, 511–524. [Google Scholar] [CrossRef]
- Cook, D.J.; Duncan, G.; Sprint, G.; Fritz, R. Using Smart City Technology to Make Healthcare Smarter. Proc. IEEE 2018, 106, 708–722. [Google Scholar] [CrossRef] [PubMed]
- Habibzadeh, H.; Boggio-Dandry, A.; Qin, Z.; Soyata, T.; Kantarci, B.; Mouftah, H. Soft Sensing in Smart Cities: Handling 3Vs Using Recommender Systems, Machine Intelligence, and Data Analytics. IEEE Commun. Mag. 2018, 56, 78–86. [Google Scholar] [CrossRef]
- Mohanty, S.; Choppali, U.; Kougianos, E. Everything You Wanted to Know About Smart Cities: The Internet of Things is the backbone. IEEE Consum. Electron. Mag. 2016, 5, 60–70. [Google Scholar] [CrossRef]
- Alfa, A.S.; Maharaj, B.T.; Ghazalech, H.A.; Awoyemi, B. The Role of 5G and IoT in Smart Cities. In Handbook of Smart Cities: Software Services and Cyber Infrastructure; Springer: Cham, Switzerland, 2018; pp. 31–54. [Google Scholar]
- Ejaz, W.; Anpalagan, A. Internet of Things for Smart Cities: Technologies, Big Data and Security; Springer: Cham, Switzerland, 2019. [Google Scholar]
- Demirer, V.; Aydin, B.; Celic, S.B. Exploring the Educational Potential of Internet of Things (IoT) in Seamless Learning. In The Internet of Things: Breakthroughs in Research and Practice; IGI Global: Hershey, PA, USA, 2017; pp. 1–15. [Google Scholar]
- Honavar, A.R.; Sami, A. Extracting Usage Patterns from Power Usage Data of Homes’ Appliances in Smart Home using Big Data Platform. Int. J. Inf. Technol. Web Eng. 2016, 11, 39–51. [Google Scholar] [CrossRef]
- Anjomshoa, F.; Aloqaily, M.; Kantarci, B.; Erol-Kantarci, M.; Schuckers, S. Social Behaviometrics for Personalized Devices in the Internet of Things Era. IEEE Access 2017, 5, 12199–12213. [Google Scholar] [CrossRef]
- Panda, S. (Ed.) Security Issues and Challenges in Internet of Things. In The Internet of Things: Breakthroughs in Research and Practice; IGI Global: Hersey, PA, USA, 2017; pp. 189–204. [Google Scholar]
- Cisco. Cisco Annual Internet Report (2018–2023); Cisco: San Jose, CA, USA, 2020. [Google Scholar]
- Shariatmadari, H.; Iraji, S.; Jantti, R. From Machine-to-Machine Communications to Internet of Things: Enabling Communication Technologies. In From Internet of Things to Smart Cities: Enabling Technologies; Sun, H., Wang, C., Ahmad, B.I., Eds.; CRC Press: Boca Raton, FL, USA, 2018; pp. 3–34. [Google Scholar]
- Marjani, M.; Nasaruddin, F.; Gani, A.; Karim, A.; Hashem, I.; Siddiqa, A.; Yaqoob, I. Big IoT Data Analytics: Architecture, Opportunities, and Open Research Challenges. IEEE Access 2017, 5, 5247–5261. [Google Scholar]
- Li, D.; Shan, J.; Shao, Z.; Zhou, X.; Yao, Y. Geomatics for Smart Cities—Concept, Key Techniques, and Applications. Geo-Spat. Inf. Sci. 2013, 16, 13–24. [Google Scholar] [CrossRef] [Green Version]
- Massana, J.; Pous, C.; Burgas, L.; Melendez, J.; Colomer, J. Identifying services for short-term load forecasting using data driven models in a Smart City platform. Sustain. Cities Soc. 2017, 28, 108–117. [Google Scholar] [CrossRef] [Green Version]
- Aydin, G.; Hallac, I.R.; Karakus, B. Architecture and Implementation of a Scalable Sensor Data Storage and Analysis System Using Cloud Computing and Big Data Technologies. J. Sens. 2015, 2015, 834217. [Google Scholar] [CrossRef]
- Lee, H. The Internet of Things and Assistive Technologies for People with Disabilities: Applications, Trends, and Issues. In The Internet of Things: Breakthroughs in Research and Practice; Panda, S., Ed.; IGI Global: Hershey, PA, USA, 2017; pp. 161–187. [Google Scholar]
- Moreno, M.; Terroso-Saenz, F.; Gonzalez-Vidal, A.; Valdez-Vela, M.; Skarmeta, M.; Zamora, M.A.; Chang, V. Applicability of Big Data Techniques to Smart Cities Deployments. IEEE Trans. Ind. Inform. 2017, 13, 800–809. [Google Scholar] [CrossRef] [Green Version]
- Garcia-Font, V.; Garrigues, C.; Rifa-Pous, H. A Comparative Study of Anomaly Detection Techniques for Smart City Wireless Sensor Networks. Sensors 2016, 16, 868. [Google Scholar] [CrossRef] [Green Version]
- Fernadez-Ares, A.; Mora, A.; Arenas, M.; Garcia-Sanchez, P.; Romero, G.; Rivas, V.; Castillo, P.A.; Merelo, J. Studying real traffic and mobility scenarios for a Smart City using a new monitoring and tracking system. Future Gener. Comput. Syst. 2017, 76, 163–179. [Google Scholar] [CrossRef]
- Xu, Y.; Chen, X.; Liu, A.; Hu, C. A Latency and Coverage Optimized Data Collection Scheme for Smart Cities Based on Vehicular Ad-Hoc Networks. Sensors 2017, 17, 888. [Google Scholar] [CrossRef] [PubMed] [Green Version]
- Liu, Y.; Yang, C.; Jiang, L.; Xie, S.; Zhang, Y. Intelligent Edge Computing for IoT-Based Energy Management in Smart Cities. IEEE Netw. 2019, 33, 111–117. [Google Scholar] [CrossRef]
- Wang, X.; Li, Z. Traffic and Transportation Smart with Cloud Computing on Big Data. Int. J. Adv. Comput. Sci. Appl. 2016, 13, 1–16. [Google Scholar]
- Arribas-Bel, D.; Kourtit, K.; Nijkamp, P.; Steenbruggen, J. Cyber Cities: Social Media as a Tool for Understanding Cities. Appl. Spat. Anal. Policy 2015, 8, 231–247. [Google Scholar] [CrossRef]
- Koukaras, P.; Tjortjis, C.; Roussidis, D. Social Media Types: Introducing a Data Driven Taxonomy. Computing 2020, 102, 295–340. [Google Scholar] [CrossRef]
- Roussidis, D.; Koukaras, P.; Tjortjis, C. Social Media Prediction: A Literature Review. Multimed. Tools Appl. 2020, 79, 6279–6311. [Google Scholar] [CrossRef]
- Tse, R.; Zhang, L.F.; Lei, P.; Pau, G. Social Network Based Crowd Sensing for Intelligent Transportation and Climate Applications. Mob. Netw. Appl. 2018, 23, 177–183. [Google Scholar] [CrossRef]
- Souza, A.; Figueredo, M.; Cacho, N.; Araujo, D.; Prolo, C.A. Using Big Data and Real-Time Analytics to Support Smart City Initiatives. IFAC Pap. 2016, 49, 257–262. [Google Scholar] [CrossRef]
- Ju, J.; Liu, L.; Feng, Y. Citizen-Centered Big Data Analysis-Driven Governance Intelligence Framework for Smart Cities. Telecommun. Policy 2018, 42, 881–896. [Google Scholar] [CrossRef]
- Li, D.; JianJun, C.; Yuan, Y. Big data in smart cities. Sci. China Inf. Sci. 2015, 58, 108101. [Google Scholar] [CrossRef]
- Stimmel, C.L. Building Smart Cities: Analytics, ICT, and Design Thinking; CRC Press: Boca Raton, FL, USA, 2016. [Google Scholar]
- Christantonis, K.; Tjortjis, C. Data Mining for Smart Cities: Predicting Electricity Consumption by Classification. In Proceedings of the IEEE 10th International Conference on Information, Intelligence, Systems and Applications (IISA 2019), Patras, Greece, 15–17 July 2019. [Google Scholar]
- Liu, Y.; Weng, X.; Wan, J.; Yue, X.; Song, H.; Vasilakos, A.V. Exploring Data Validity in Transportation Systems for Smart Cities. IEEE Commun. Mag. 2017, 55, 26–33. [Google Scholar] [CrossRef]
- Perez-Chacon, R.; Luna-Romera, J.M.; Troncoso, A.; Martinez-Alvarez, F.; Riquelme, J.C. Big Data Analytics for Discovering Electricity Consumption Patterns in Smart Cities. Energies 2018, 11, 683. [Google Scholar] [CrossRef] [Green Version]
- Pieroni, A.; Scarpato, N.; Di Nunzio, L.; Fallucchi, F.; Raso, M. Smarter City: Smart Energy Grid based on Blockchain Technology. Int. J. Adv. Sci. Eng. Inf. Technol. 2018, 8, 298–306. [Google Scholar] [CrossRef]
- Del Casino, V.J., Jr. Social Geographies II: Robots. Prog. Hum. Geogr. 2016, 40, 846–855. [Google Scholar] [CrossRef]
- Brisismi, T.S.; Cassandras, C.G.; Osgood, C.; Paschalidis, I.C.; Zhang, A.Y. Sensing and Classifying Roadway Obstacles in Smart Cities: The Street Bump System. IEEE Access 2016, 4, 1301–1312. [Google Scholar] [CrossRef]
- D’Aniello, G.; Gaeta, M.; Orciuoli, F. An Approach Based on Semantic Stream Reasoning to Support Decision Processes in Smart Cities. Telemat. Inform. 2018, 35, 68–81. [Google Scholar] [CrossRef]
- Khan, S.M.; Woo, M.; Nam, K.; Chathoth, P.K. Smart City and Smart Tourism: A Case of Dubai. Sustainability 2017, 9, 2279. [Google Scholar] [CrossRef] [Green Version]
- Kar, A.; Mustafa, S.; Gupta, M.; Ilavarasan, P.; Dwivedi, Y. Understanding Smart Cities: Inputs for Research and Practice. In Advances in Smart Cities: Smarter People, Governance, and Solutions; Kar, A.K., Gupta, M.P., Ilavarasan, P.V., Dwivedi, Y.K., Eds.; CRC Press: Boca Raton, FL, USA, 2017; pp. 1–8. [Google Scholar]
- Williamson, B. Computing brains: Learning algorithms and neurocomputation in the smart city. Inf. Commun. Soc. 2017, 20, 81–99. [Google Scholar] [CrossRef] [Green Version]
- Osman, A. A Novel Big Data Analytics Framework for Smart Cities. Future Gener. Comput. Syst. 2019, 91, 620–633. [Google Scholar] [CrossRef]
- Fotopoulou, E.; Zafeiropoulos, A.; Papaspyros, D.; Hasapis, P.; Tsiolis, G.; Bouras, T.; Mouzakitis, S.; Zanetti, N. Linked Data Analytics in Interdisciplinary Studies: The Health Impact of Air Pollution in Urban Areas. IEEE Access 2016, 4, 149–164. [Google Scholar] [CrossRef]
- Yao, X.; Chen, L.; Peng, L.; Chi, T. A co-location pattern-mining algorithm with a density-weighted distance thresholding consideration. Inf. Sci. 2017, 396, 144–161. [Google Scholar] [CrossRef]
- Yassine, A.; Singh, S.; Alamri, A. Mining Human Activity Patterns from Smart Home Big Data for Health Care Applications. IEEE Access 2017, 5, 13131–13141. [Google Scholar] [CrossRef]
- Witten, I.H.; Frank, E. Data Mining: Practical Machine Learning Tools and Techniques, 2nd ed.; Morgan Kaufmann Publishers: San Francisco, CA, USA, 2005. [Google Scholar]
- Martinez-Espana, R.; Bueno-Crespo, A.; Timon, I.; Soto, J.; Munoz, A.; Cecilia, J.M. Air-Pollution Prediction in Smart Cities through Machine Learning Methods: A Case Study in Murcia, Spain. J. Univers. Comput. Sci. 2018, 24, 261–276. [Google Scholar]
- Zhang, D.; Tsai, J.J. Advances in Machine Learning Applications in Software Engineering; Idea Group Publishing: Hersey, PA, USA, 2007. [Google Scholar]
- Djenouri, D.; Laidi, R.; Djenouri, Y.; Balasingham, I. Machine Learning for Smart Building Applications: Review and Taxonomy. ACM Comput. Surv. 2019, 52, 1–36. [Google Scholar] [CrossRef]
- Ploennigs, J.; Ba, A.; Barry, M. Materializing the Promises of Cognitive IoT: How Cognitive Buildings are Shaping the Way. IEEE Internet Things J. 2018, 5, 2367–2374. [Google Scholar] [CrossRef]
- Din, I.U.; Guizani, M.; Rodrigues, J.; Hassan, S.; Korotaev, V. Machine Learning in the Internet of Things: Designed Techniques for Smart Cities. Future Gener. Comput. Syst. 2019, 100, 826–843. [Google Scholar] [CrossRef]
- Nef, T.; Urwuler, P.; Buchler, M.; Tarnanas, I.; Stucki, R.; Cazzoli, D.; Muri, R.; Mosimann, U. Evaluation of Three State-of-the-Art Classifiers for Recognition of Activities of Daily Living from Smart Home Ambient Data. Sensors 2015, 15, 11725–11740. [Google Scholar] [CrossRef] [PubMed] [Green Version]
- Venkatesh, J.; Aksani, B.; Chan, C.; Akyurek, A.; Simunic, T. Modular and Personalized Smart Health Application Design in a Smart City Environment. IEEE Internet Things J. 2018, 5, 614–623. [Google Scholar] [CrossRef]
- Zhang, N.; Chen, H.; Chen, X.; Chen, J. Forecasting Public Transit Use by Crowdsensing and Semantic Trajectory Mining: Case Studies. Int. J. Geo-Inf. 2016, 5, 180. [Google Scholar] [CrossRef] [Green Version]
- De Gennaro, M.; Paffumi, E.; Martini, G. Big Data for Supporting Low-Carbon Road Transport Policies in Europe: Applications, Challenges, and Opportunities. Big Data Res. 2016, 6, 11–25. [Google Scholar] [CrossRef]
- Lau, B.P.; Marakkalage, S.; Zhou, Y.; Hasan, N.; Yuen, C.; Zhang, M.; Tan, U. A Survey of Data Fusion in Smart City Applications. Inf. Fusion 2019, 52, 357–374. [Google Scholar] [CrossRef]
- Zear, A.; Singh, P.K.; Singh, Y. Intelligent Transport System: A Progressive Review. Indian J. Sci. Technol. 2016, 9, 1–8. [Google Scholar] [CrossRef]
- Wang, J. Encyclopedia of Data Warehousing and Mining; Information Science Reference: Hersey, PA, USA, 2009. [Google Scholar]
- Sajjad, M.; Nasir, M.; Muhammad, K.; Khan, S.; Jan, Z.; Kumar Sangaiah, A.; Elhoseny, M.; Wook Baik, S. Raspberry Pi Assisted Face Recognition Framework for Enhanced Law-Enforcement Services in Smart Cities. Future Gener. Comput. Syst. 2020, 108, 995–1007. [Google Scholar] [CrossRef]
- Gomede, E.; Gaffo, F.H.; Brigano, G.; de Barros, R.; Mendes, L. Application of Computational Intelligence to Improve Education in Smart Cities. Sensors 2018, 18, 267. [Google Scholar] [CrossRef] [PubMed] [Green Version]
- Hashemi, M. Reusability of the Output of Map-Matching Algorithms Across Space and Time Through Machine Learning. IEEE Trans. Intell. Transp. 2017, 18, 3017–3026. [Google Scholar] [CrossRef]
- Huang, J.; Deng, Y.; Yang, Q.; Sun, J. An Energy-Efficient Train Control Framework for Smart Railway Transportation. IEEE Trans. Comput. 2016, 65, 1407–1417. [Google Scholar] [CrossRef]
- Manic, M.; Wijayasekara, D.; Amarisnghe, K.; Rodriguez-Andina, J. Building Energy Management Systems: The Age of Intelligent and Adaptive Buildings. IEEE Ind. Electron. Mag. 2016, 10, 25–39. [Google Scholar] [CrossRef]
- Lin, T.; Rivano, H.; Le Mouel, F. A Survey of Smart Parking Solutions. IEEE Trans. Intell. Transp. Syst. 2017, 18, 3229–3253. [Google Scholar] [CrossRef] [Green Version]
- Dunham, M.H.; Sridhar, S. Data Mining: Introductory and Advanced Topics; Pearson Education: New Delhi, India, 2006. [Google Scholar]
- Shen, M.; Tang, X.; Zhu, L.; Du, X.; Guizani, M. Privacy-Preserving Support Vector Machine Training Over Blockchain-Based Encrypted IoT Data in Smart Cities. IEEE Internet Things J. 2019, 6, 7702–7712. [Google Scholar] [CrossRef]
- Lin, B.; Huangfu, Y.; Lima, N.; Lobson, B.; Kirk, M.; O’Keeffe, P.; Pressley, S.; Walden, V.; Lamb, B.; Cook, D. Analyzing the Relationship between Human Behavior and Indoor Air Quality. J. Sens. Actuator Netw. 2017, 6, 13. [Google Scholar] [CrossRef] [Green Version]
- Aggarwal, C.C. Data Classification: Algorithms and Applications; CRC Press: Boca Raton, FL, USA, 2015. [Google Scholar]
- Olszewski, R.; Palka, P.; Turek, A. Solving “Smart City” Transport Problems by Designing Carpooling Gamification Schemes with Multi-Agent Systems: The Case of the So-Called “Mordor of Warsaw”. Sensors 2018, 18, 141. [Google Scholar] [CrossRef] [Green Version]
- Rawashdeh, M.; Al Zamil, M.G.; Samarah, S.; Hossain, M.S.; Muhammad, G. A Knowledge-Driven Approach for Activity Recognition in Smart Homes Based on Activity Profiling. Future Gener. Comput. Syst. 2020, 107, 924–941. [Google Scholar] [CrossRef]
- Tzirakis, P.; Tjortjis, C. T3C: Improving a Decision Tree Classification Algorithm’s Interval Splits on Continuous Attributes. Adv. Data Anal. Classif. 2017, 11, 353–370. [Google Scholar] [CrossRef]
- Tjortjis, C.; Keane, J. T3: An Improved Classification Algorithm for Data Mining. Lect. Notes Comp. Sc. 2002, 2412, 50–55. [Google Scholar]
- Christantonis, K.; Tjortjis, C.; Manos, A.; Filippidou, D.; Mougiakou, E.; Christelis, E. Using Classification for Traffic Prediction in Smart Cities. In Proceedings of the 16th International Conference on Artificial Intelligence Applications and Innovations (AIAI 20), Halkidiki, Greece, 5–7 June 2020. [Google Scholar]
- Liapis, S.; Christantonis, K.; Chazan-Pantzalis, V.; Manos, A.; Filippidou, D.; Tjortjis, C. A Methodology Using Classification for Traffic Prediction: Featuring the Impact of COVID-19. Integr. Comput. Aided Eng. (ICAE) 2021, in press. [Google Scholar] [CrossRef]
- Musto, C.; Semeraro, G.; Lops, P.; de Gemmis, M. CrowdPulse: A framework for real-time semantic analysis of social streams. Inf. Syst. 2015, 54, 127–146. [Google Scholar] [CrossRef]
- Christantonis, K.; Tjortjis, C.; Manos, A.; Filippidou, D.; Christelis, E. Smart Cities Data Classification for Electricity Consumption & Traffic Prediction. Autom. Softw. Enginery 2020, 31, 49–69. [Google Scholar]
- Badii, C.; Nesi, P.; Paoli, I. Predicting Available Parking Slots in Critical and Regular Services by Exploiting a Range of Open Data. IEEE Access 2018, 6, 44059–44071. [Google Scholar] [CrossRef]
- Brisimi, T.S.; Xu, T.; Wang, T.; Dai, W.; Adams, W.G.; Paschalidis, I.C. Predicting Chronic Disease Hospitalizations from Electronic Health Records: An Interpretable Classification Approach. Proc. IEEE 2018, 106, 690–707. [Google Scholar] [CrossRef]
- El-Wakeel, A.S.; Li, J.; Noureldin, A.; Hassanein, H.S.; Zorba, N. Towards a Practical Crowdsensing System for Road Surface Conditions Monitoring. IEEE Internet Things J. 2018, 5, 4672–4685. [Google Scholar] [CrossRef]
- Sajjad, M.; Nasir, M.; Ullah, F.; Muhammad, K.; Sangaiah, A.; Baik, S.W. Raspberry Pi Assisted Facial Expression Recognition Framework for Smart Security in Law-Enforcement Services. Inf. Sci. 2019, 479, 416–431. [Google Scholar] [CrossRef]
- Li, F.; Lehtomaki, M.; Elbernik, S.O.; Vosselman, G.; Kukko, A.; Puttonen, E.; Chen, Y.; Hyyppa, J. Semantic Segmentation of Road Furniture in Mobile Laser Scanning Data. ISPRS J. Photogramm. Remote Sens. 2019, 154, 98–113. [Google Scholar] [CrossRef]
- Kwoczek, S.; Di Martino, S.; Nejdl, W. Predicting and visualizing traffic congestion in the presence of planned special events. J. Vis. Lang. Comput. 2014, 25, 973–980. [Google Scholar] [CrossRef]
- Jiang, J.; Claudel, C. A High Performance, Low Power Computational Platform for Complex Sensing Operations in Smart Cities. HardwareX 2017, 1, 22–37. [Google Scholar] [CrossRef] [Green Version]
- Rumelhart, D.E.; Hinton, G.E.; Williams, R.J. Learning Representations by Back-Propagating Errors. Nature 1986, 323, 533–536. [Google Scholar] [CrossRef]
- Li, D.; Deng, L.; Gupta, B.B.; Wang, H.; Choi, C. A Novel CNN Based Security Guaranteed Image Watermarking Generation Scenario for Smart City Applications. Inf. Sci. 2019, 479, 432–447. [Google Scholar] [CrossRef]
- Ghosh, J.; Nag, A. An Overview of Radial Basis Function Networks. In Radial Basis Function Networks 2: New Advances in Design; Howlett, R.J., Jain, L.C., Eds.; Springer: Berlin, Germany, 2001; pp. 1–36. [Google Scholar]
- Huang, C.J.; Kuo, P.H. A Deep CNN-LSTM Model for Particulate Matter Forecasting in Smart Cities. Sensors 2018, 18, 2220. [Google Scholar] [CrossRef] [Green Version]
- Cao, J.; Cao, M.; Wang, J.; Yin, C.; Wang, D.; Vidal, P. Urban Noise Recognition with Convolutional Neural Network. Multimed. Tools Appl. 2019, 78, 29031–29041. [Google Scholar] [CrossRef]
- Zhang, Q.; Zhou, D.; Zeng, A.X. HeartID: A Multiresolution Convolutional Neural Network for ECG-Based Biometric Human Identification in Smart Health Applications. IEEE Access 2017, 5, 11805–11816. [Google Scholar] [CrossRef]
- Fenza, G.; Gallo, M.; Loia, V. Drift-Aware Methodology for Anomaly Detection in Smart Grid. IEEE Access 2019, 7, 9645–9657. [Google Scholar] [CrossRef]
- Usman, M.; Jan, A.; He, X.; Chen, J. P2DCA: A Privacy-Preserving-Based Data Collection and Analysis Framework for IoMT Applications. IEEE J. Sel. Areas Commun. 2019, 37, 1222–1230. [Google Scholar] [CrossRef]
- Hariri, R.; Fredericks, E.M.; Bowers, K.M. Uncertainty in Big Data Analytics: Survey, Opportunities, and Challenges. J. Big Data 2016, 6, 1–16. [Google Scholar] [CrossRef] [Green Version]
- Shamshirband, S.; Hadipoor, M.; Baghban, A.; Mosavi, A.; Bukor, J.; Varkonyi-Koczy, A.R. Developing an ANFIS-PSO Model to Predict Mercury Emissions in Combustion Flue Gases. Mathematics 2019, 7, 965. [Google Scholar] [CrossRef] [Green Version]
- Iqbal, R.; Doctor, F.; More, B.; Mahmud, S.; Yousuf, U. Big Data Analytics: Computational Intelligence Techniques and Application Areas. Technol. Forecast. Soc. Chang. 2020, 153, 119253. [Google Scholar] [CrossRef] [Green Version]
- Obinikpo, A.A.; Kantarci, B. Big Sensed Data Meets Deep Learning for Smarter Health Care in Smart Cities. J. Sens. Actuator Netw. 2017, 6, 26. [Google Scholar] [CrossRef] [Green Version]
- Coelho, I.M.; Coelho, V.N.; Luz, E.J.D.S.; Ochi, L.; Guimaraes, F.; Rios, E. A GPU deep learning metaheuristic based model for time series forecasting. Appl. Energy 2017, 201, 412–418. [Google Scholar] [CrossRef]
- Vazquez-Canteli, J.R.; Ulyanin, S.; Kampf, J.; Nagy, Z. Fusing TensorFlow with building energy simulation for intelligent energy management in smart cities. Sustain. Cities Soc. 2019, 45, 243–257. [Google Scholar] [CrossRef]
- Moustafa, N.; Turnbull, B.; Choo, K. An Ensemble Intrusion Detection Technique Based on Proposed Statistical Flow Features for Protecting Network Traffic of Internet of Things. IEEE Internet Things J. 2019, 6, 4815–4830. [Google Scholar] [CrossRef]
- Singh, G.; Bansal, D.; Sofat, S. A Smartphone Based Technique to Monitor Driving Behavior Using DTW and Crowdsensing. Pervasive Mob. Comput. 2017, 40, 56–70. [Google Scholar] [CrossRef]
- Zou, X.; Cao, J.; Guo, Q.; Wen, T. A Novel Network Security Algorithm Based on Improved Support Vector Machine from Smart City Perspective. Comput. Electron. Eng. 2018, 65, 67–78. [Google Scholar] [CrossRef]
- Ta-Shma, P.; Akbar, A.; Gerson-Golan, G.; Hadash, G.; Carrez, F.; Moessner, K. An Ingestion and Analytics Architecture for IoT Applied to Smart City Use Cases. IEEE Internet Things J. 2018, 5, 765–774. [Google Scholar] [CrossRef] [Green Version]
- Sun, J.; Wang, X.; Xiong, N.; Shao, J. Learning Sparse Representation with Variational Auto-Encoder for Anomaly Detection. IEEE Access 2018, 6, 33353–33361. [Google Scholar] [CrossRef]
- Pena, M.; Biscarri, F.; Guerrero, J.I.; Monedero, I.; Leon, C. Rule-based system to detect energy efficiency anomalies in smart buildings, a data mining approach. Expert Syst. Appl. 2016, 56, 242–255. [Google Scholar] [CrossRef]
- Kanellopoulos, Y.; Antonellis, P.; Tjortjis, C.; Makris, C.; Tsirakis, N. K-Attractors: A Partitional Clustering Algorithm for Numeric Data Analysis. Appl. Artif. Intell. 2011, 25, 97–115. [Google Scholar] [CrossRef]
- Gan, G.; Ma, C.; Wu, J. Data Clustering: Theory, Algorithms and Applications; American Statistical Association: Alexandria, VA, USA, 2007. [Google Scholar]
- Lei, J.; Jiang, T.; Wu, K.; Du, H.; Zhu, G.; Wang, Z. Robust K-means Algorithm with Automatically Splitting and Merging Clusters and its Applications for Surveillance Data. Multimed. Tools Appl. 2016, 75, 12043–12059. [Google Scholar] [CrossRef]
- Nesi, P.; Pantaleo, G.; Tenti, M. Geographical Localization of Web Domains and Organization Addresses Recognition by Employing Natural Language Processing, Pattern Matching and Clustering. Eng. Appl. Artif. Intell. 2016, 51, 202–211. [Google Scholar] [CrossRef]
- Yang, J.; Zhao, J.; Wen, F.; Dong, Z. A Model of Customizing Electricity Retail Prices Based on Load Profile Clustering Analysis. IEEE Trans. Smart Grid 2019, 10, 3374–3386. [Google Scholar] [CrossRef]
- Pournaras, E.; Pilgerstorfer, P.; Asikis, T. Decentralized Collective Learning for Self-managed Sharing Economies. ACM Trans. Auton. Adap. Syst. 2018, 13, 1–33. [Google Scholar] [CrossRef] [Green Version]
- Ghafari, S.M.; Tjortjis, C. A Survey on Association Rules Mining Using Heuristics. WIREs Data Min. Knowl. Discov. 2019, 9, e1307. [Google Scholar] [CrossRef]
- Dong, D.; Tjortjis, C. Experiences of Using a Quantitative Approach for Mining Association Rules. In Proceedings of the 4th International Conference Intelligent Data Engineering and Automated Learning, Hong Kong, China, 21–23 March 2003. [Google Scholar]
- Kong, X.; Li, M.; Li, J.; Tian, K.; Hu, X.; Xia, F. CoPFun: An Urban Co-Occurrence Pattern Mining Scheme Based on Regional Function Discovery. World Wide Web 2019, 22, 1029–1054. [Google Scholar] [CrossRef]
- Yakhchi, S.; Ghafari, S.; Tjortjis, C.; Fazeli, M. ARMICA-Improved: A New Approach for Association Rule Mining. Lect. Notes Artif. Int. 2017, 10412, 296–306. [Google Scholar]
- Agrawal, R.; Strikant, R. Fast Algorithms for Mining Association Rules. In Proceedings of the 20th VLDB Conference, Santiago, Chile, 12–15 September 1994. [Google Scholar]
- Shirowzhan, S.; Sepasgozar, S. Spatial Analysis Using Temporal Point Clouds in Advanced GIS: Methods for Ground Elevation Extraction in Slant Areas and Building Classification. Int. J. Geo-Inf. 2019, 8, 120. [Google Scholar] [CrossRef] [Green Version]
- Kaiser, C.; Pozdnoukhov, A. Enabling real-time city sensing with kernel stream oracles and MapReduce. Pervasive Mob. Comput. 2013, 9, 708–721. [Google Scholar] [CrossRef]
- Mystakidis, A.; Tjortjis, C. Big Data Mining for Smart Cities: Predicting Traffic Congestion using Classification. In Proceedings of the 11th International Conference on Information, Intelligence, Systems and Applications, Piraeus, Greece, 15–17 July 2020. [Google Scholar]
- Costa, G.D.; Duran-Faundez, C.; Andrade, D.C.; Rocha-Junior, J.B.; Peixoto, J.P.J. TwitterSensing: An Event-Based Approach for Wireless Sensor Networks Optimization Exploiting Social Media in Smart City Applications. Sensors 2018, 18, 1080. [Google Scholar] [CrossRef] [PubMed] [Green Version]
- Lane, H.; Howard, C.; Hapke, H.M. Natural Language Processing in Action: Understanding, Analyzing and Generating Text with Python; Manning Publications: Shelter Island, NY, USA, 2019. [Google Scholar]
- Qiu, J.; Chai, Y.; Liu, Y.; Gu, Z.; Li, S.; Tian, Z. Automatic Non-Taxonomic Relation Extraction from Big Data in Smart City. IEEE Access 2018, 6, 74854–74864. [Google Scholar] [CrossRef]
- Beleveslis, D.; Tjortjis, C.; Psaradelis, D.; Nikoglou, D. A Hybrid Method for Sentiment Analysis of Election Related Tweets. In Proceedings of the 4th IEEE SE Europe Design Automation, Computer Engineering, Computer Networks, and Social Media Conference (SEEDA-CECNSM), Piraeus, Greece, 20–22 September 2019. [Google Scholar]
- Oikonomou, L.; Tjortjis, C. A Method for Predicting the Winner of the USA Presidential Elections Using Data Extracted from Twitter. In Proceedings of the 3rd SE European Design Automation, Computer Engineering, Computer Networks and Society Media Conference (SEEDA_CECNSM18), Kastoria, Greece, 22–24 September 2018. [Google Scholar]
- Eirinaki, M.; Dhar, S.; Mathur, S.; Kaley, A.; Patel, A.; Joshi, A.; Shah, D. A Building Permit System for Smart Cities: A Cloud-Based Framework. Comput. Environ. Urban 2018, 70, 175–188. [Google Scholar] [CrossRef]
- Tsiara, E.; Tjortjis, C. Using Twitter to predict Chart Position for Songs. In Proceedings of the 16th International Conference on Artificial Intelligence and Innovations (AIAI 20), Halkidiki, Greece, 5–7 June 2020. [Google Scholar]
- Lee, K.M.; Yoo, J.; Kim, S.; Lee, J.; Hong, J. Autonomic Machine Learning Platform. Int. J. Inf. Manag. 2019, 49, 491–501. [Google Scholar] [CrossRef]
- Badii, C.; Bellini, P.; Difino, A.; Nesi, P. Sii-Mobility: An IoT/IoE Architecture to Enhance Smart City Mobility and Transportation Services. Sensors 2019, 19, 1. [Google Scholar] [CrossRef] [Green Version]
- Aria, M.; Cuccurullo, C. Bibliometrix: An R-tool for comprehensive science mapping analysis. J. Informetr. 2017, 11, 959–975. [Google Scholar] [CrossRef]
- Andres, A. Measuring Academic Research; Chandos Publishing: Oxford, UK, 2009. [Google Scholar]
- Waheed, H.; Hassan, S.; Aljohani, N.R.; Wasif, M. A Bibliometric Perspective of Learning Analytics Research Landscape. Behav. Inf. Technol. 2018, 37, 941–957. [Google Scholar] [CrossRef]
- Roemer, R.C.; Borchardt, R. Meaningful Metrics; Association of College and Research Libraries: Chicago, IL, USA, 2015. [Google Scholar]
- Aria, M.; Cuccurullo, C. Bibliometrix R Package. Available online: http://www.bibliometrix.org (accessed on 23 November 2019).
- Gilani, E.; Salimi, D.; Jouyandeh, M.; Tavasoli, K.; Wong, W. A trend study on the impact of social media in decision making. Int. J. Data Netw. 2019, 3, 201–222. [Google Scholar] [CrossRef]
- De Bellis, N. Bibliometrics and Citation Analysis: From the Science Citation Index to Cybermetrics; The Scarecrow Press Inc.: Lanham, ML, USA, 2009. [Google Scholar]
- Costas, R.; Bordons, M. Is G-index Better than H-index? An Exploratory Study at the Individual Level. Scientometrics 2008, 77, 267–288. [Google Scholar] [CrossRef] [Green Version]
- Yaminfirooz, M.; Gholinia, H. Multiple h-index: A new scientometric indicator. Electron. Libr. 2015, 33, 547–556. [Google Scholar] [CrossRef]
- Clarivate. Key Words Plus Generation, Creation, and Changes. Available online: https://support.clarivate.com/ScientificandAcademicResearch/s/article/KeyWords-Plus-generation-creation-and-changes?language=en_US (accessed on 20 February 2021).
- Esfahani, H.J.; Tavasoli, K.; Jabbarzadeh, A. Big data and social media: A scientometrics analysis. Int. J. Data Netw. 2019, 3, 145–164. [Google Scholar] [CrossRef]
- Avramidou, A.; Tjortjis, C. Predicting CO2 Emissions for Buildings Using Regression and Classification. In Proceedings of the IFIP International Conference on Artificial Intelligence Applications and Innovations, Halkidiki, Greece, 25–27 June 2021; pp. 543–554. [Google Scholar]
Figure 1.
The three phases of smart city operation.

Figure 2.
The smart city pillars.

Figure 3.
The three layers of smart city architecture.

Figure 4.
A typical ML pipeline.

Figure 5.
Bradford’s law.

Figure 6.
Source growth.

Figure 7.
Author production over time.

Figure 8.
The frequency distribution of scientific productivity through Lotka’s law.

Figure 9.
Zipf’s law.

Figure 10.
Word cloud.

Figure 11.
Word dynamic graph.

Figure 12.
Co-occurrence word network.

Figure 13.
Topic dendrogram.

Figure 14.
Thematic map.

Figure 15.
Co-citation network.

Figure 16.
Collaboration network.

Figure 17.
County collaboration map.

Table 1.
General information about our data.
| Description | Results |
|---|---|
| Timespan | 2013–2021 (February) |
| Sources (Journals) | 112 |
| Documents | 197 |
| Average years from publication | 2.61 |
| Average citations per document | 15.88 |
| Average citations per year per doc | 3.648 |
| References | 9761 |
| DOCUMENT TYPES | |
| Article | 177 |
| Conference paper | 1 |
| Editorial | 6 |
| Review | 13 |
| DOCUMENT CONTENTS | |
| Keywords Plus (ID) | 1537 |
| Author’s Keywords (DE) | 664 |
| AUTHORS | |
| Authors | 682 |
| Author Appearances | 778 |
| Authors of single-authored documents | 10 |
| Authors of multi-authored documents | 672 |
| AUTHORS COLLABORATION | |
| Single-authored documents | 10 |
| Documents per Author | 0.289 |
| Authors per Document | 3.46 |
| Co-Authors per Document | 3.95 |
| Collaboration Index | 3.59 |
Table 2.
Number of articles and means of citations per article and year.
| Year | Number of Articles | Mean TC Per Article | Mean TC Per Year | Citable Years |
|---|---|---|---|---|
| 2013 | 1 | 47 | 5.87 | 8 |
| 2014 | 1 | 18 | 2.57 | 7 |
| 2015 | 7 | 43.14 | 7.19 | 6 |
| 2016 | 19 | 25.05 | 5.01 | 5 |
| 2017 | 25 | 44.32 | 11.08 | 4 |
| 2018 | 36 | 13.81 | 4.60 | 3 |
| 2019 | 54 | 10.91 | 5.45 | 2 |
| 2020 | 47 | 1.89 | 1.89 | 1 |
| 2021 | 7 | 0.29 | - | 0 |
Table 3.
Most relevant sources.
| Sources | Articles |
|---|---|
| IEEE Access | 19 |
| Sensors | 14 |
| Future Generation Computer Systems | 7 |
| Sustainability | 7 |
| IEEE Internet of Things Journal | 6 |
| Information Systems | 5 |
| Cluster Computing | 4 |
| Multimedia Tools and Applications | 4 |
| Sustainable Cities and Society | 4 |
| Wiley Interdisciplinary Reviews: Data Mining and Knowledge Discovery | 4 |
Table 4.
Source impact.
| Source | h-Index | g-Index | m-Index | Total Citations | Articles | PY Start |
|---|---|---|---|---|---|---|
| IEEE Access | 9 | 19 | 1.5 | 652 | 19 | 2016 |
| Sensors | 8 | 14 | 1.14 | 239 | 14 | 2015 |
| Future Generation Computer System | 5 | 7 | 0.62 | 134 | 7 | 2014 |
| Sustainability | 4 | 7 | 0.8 | 107 | 7 | 2017 |
| IEEE Internet of Things Journal | 4 | 6 | 1 | 95 | 6 | 2018 |
| Information Systems | 3 | 5 | 0.43 | 39 | 5 | 2015 |
| Cluster Computing | 2 | 4 | 0.67 | 16 | 4 | 2019 |
| Multimedia Tools and Applications | 2 | 4 | 0.33 | 21 | 4 | 2016 |
| Sustainable Cities and Society | 4 | 4 | 0.8 | 65 | 4 | 2017 |
| Wiley Interdisciplinary Reviews: Data Mining and Knowledge Discovery | 3 | 4 | 0.75 | 43 | 4 | 2018 |
Table 5.
Most productive authors.
| Authors | Articles | Articles Fractionalized |
|---|---|---|
| Barnaghi P. | 5 | 1.34 |
| Liu Y. | 4 | 0.75 |
| Song H. | 4 | 0.64 |
| Gunopulos D. | 3 | 0.45 |
| Honarvar Ar. | 3 | 1.50 |
| Katakis I. | 3 | 1.29 |
| Li S. | 3 | 0.70 |
| Li X. | 3 | 0.83 |
| Liu X. | 3 | 1.00 |
| Tian Z. | 3 | 0.57 |
Table 6.
Author productivity through Lotka’s law.
| Documents Written | No. of Authors | Proportion of Authors |
|---|---|---|
| 1 | 607 | 0.890 |
| 2 | 58 | 0.085 |
| 3 | 14 | 0.021 |
| 4 | 2 | 0.003 |
| 5 | 1 | 0.001 |
Table 7.
Author impact.
| Author | h_Index | g_Index | m_Index | TC | NP | PY_Start |
|---|---|---|---|---|---|---|
| Barnaghi P. | 5 | 5 | 0.714 | 104 | 5 | 2015 |
| Liu Y. | 3 | 4 | 0.600 | 71 | 4 | 2017 |
| Song H. | 3 | 4 | 0.600 | 54 | 4 | 2017 |
| Gunopulos D. | 2 | 3 | 0.333 | 10 | 3 | 2016 |
| Honarvar Ar. | 2 | 3 | 0.333 | 21 | 3 | 2016 |
| Katakis I. | 2 | 3 | 0.286 | 10 | 3 | 2015 |
| Li S. | 2 | 3 | 0.500 | 34 | 3 | 2018 |
| Li X. | 2 | 3 | 0.667 | 11 | 3 | 2019 |
| Liu X. | 1 | 2 | 0.167 | 4 | 3 | 2016 |
| Tian Z. | 2 | 3 | 0.500 | 36 | 3 | 2018 |
Table 8.
Country scientific production.
| Country | Frequency |
|---|---|
| China | 129 |
| USA | 55 |
| India | 27 |
| Spain | 23 |
| U.K. | 22 |
| Greece | 19 |
| Brazil | 17 |
| Italy | 17 |
| Pakistan | 17 |
| Saudi Arabia | 17 |
Table 9.
The most cited countries.
| Country | Total Citations | Average Article Citations |
|---|---|---|
| China | 473 | 11.26 |
| USA | 357 | 25.50 |
| Spain | 341 | 26.23 |
| Malaysia | 276 | 276.00 |
| Korea | 184 | 20.44 |
| Canada | 113 | 37.67 |
| Brazil | 62 | 12.40 |
| United Kingdom | 59 | 11.80 |
| Greece | 55 | 9.17 |
| Singapore | 40 | 13.33 |
Table 10.
Most frequent words.
| Words | Occurrences |
|---|---|
| data mining | 168 |
| smart cities | 106 |
| internet of things | 76 |
| big data | 45 |
| learning system | 21 |
| data handling | 20 |
| decision making | 19 |
| machine learning | 18 |
| forecasting | 17 |
| data analytics | 16 |
| artificial intelligence | 15 |
| semantics | 15 |
| automation | 13 |
| classification | 13 |
| clustering algorithms | 13 |
| energy use | 13 |
| intelligent buildings | 12 |
| extraction | 11 |
| social networking (online) | 11 |
| support vector machine | 11 |
| cloud computing | 10 |
| deep learning | 10 |
| information management | 10 |
| urban transportation | 10 |
| human | 9 |
Table 11.
Country collaboration frequency.
| From | To | Frequency |
|---|---|---|
| China | USA | 15 |
| China | Australia | 5 |
| Spain | United Kingdom | 4 |
| USA | Australia | 4 |
| China | Canada | 3 |
| Germany | Ireland | 3 |
| Pakistan | Korea | 3 |
| Pakistan | Saudi Arabia | 3 |
| United Kingdom | Germany | 3 |
| United Kingdom | Ireland | 3 |
Publisher’s Note: MDPI stays neutral with regard to jurisdictional claims in published maps and institutional affiliations. |
© 2021 by the authors. Licensee MDPI, Basel, Switzerland. This article is an open access article distributed under the terms and conditions of the Creative Commons Attribution (CC BY) license (https://creativecommons.org/licenses/by/4.0/).
Share and Cite
MDPI and ACS Style
Kousis, A.; Tjortjis, C. Data Mining Algorithms for Smart Cities: A Bibliometric Analysis. Algorithms 2021, 14, 242. https://0-doi-org.brum.beds.ac.uk/10.3390/a14080242
AMA Style
Kousis A, Tjortjis C. Data Mining Algorithms for Smart Cities: A Bibliometric Analysis. Algorithms. 2021; 14(8):242. https://0-doi-org.brum.beds.ac.uk/10.3390/a14080242
Chicago/Turabian StyleKousis, Anestis, and Christos Tjortjis. 2021. "Data Mining Algorithms for Smart Cities: A Bibliometric Analysis" Algorithms 14, no. 8: 242. https://0-doi-org.brum.beds.ac.uk/10.3390/a14080242
Note that from the first issue of 2016, this journal uses article numbers instead of page numbers. See further details here.