
Metal Surface Defect Detection Using Modified YOLO


College of Electrical Engineering, Nantong University, Nantong 226019, China
*
Author to whom correspondence should be addressed.
Algorithms 2021, 14(9), 257; https://0-doi-org.brum.beds.ac.uk/10.3390/a14090257
Submission received: 3 August 2021
/
Revised: 22 August 2021
/
Accepted: 27 August 2021
/
Published: 28 August 2021
Abstract
:Aiming at the problems of inefficient detection caused by traditional manual inspection and unclear features in metal surface defect detection, an improved metal surface defect detection technology based on the You Only Look Once (YOLO) model is presented. The shallow features of the 11th layer in the Darknet-53 are combined with the deep features of the neural network to generate a new scale feature layer using the basis of the network structure of YOLOv3. Its goal is to extract more features of small defects. Furthermore, then, K-Means++ is used to reduce the sensitivity to the initial cluster center when analyzing the size information of the anchor box. The optimal anchor box is selected to make the positioning more accurate. The performance of the modified metal surface defect detection technology is compared with other detection methods on the Tianchi dataset. The results show that the average detection accuracy of the modified YOLO model is 75.1%, which ia higher than that of YOLOv3. Furthermore, it also has a great detection speed advantage, compared with faster region-based convolutional neural network (Faster R-CNN) and other detection algorithms. The improved YOLO model can make the highly accurate location information of the small defect target and has strong real-time performance.
1. Introduction
As one of the main raw materials of industrial products, metal will inevitably be damaged on its surface during processing, such as scratches and deformations. The damage of the metal surface will seriously affect the quality and appearance of products, so it is crucial to detect defects on the metal surface during the production process. However, in traditional manual inspection, there will be problems such as missed detection and low efficiency under the influence of human subjective factors. Therefore, how to conduct efficient and accurate detection of metal surface defects is one of the key research directions in target detection.
The defect detection proposed in machine vision is a non-contact detection without manual intervention. It only needs to select the appropriate camera and light source to collect the surface images of the metal, and then uses the related defect detection algorithm to locate and classify the defects. This method has high detection efficiency and can greatly improve the level of the manufacturing industry [1].
Recent advances in image processing technology, in the field of machine vision, in particular, have led to the development of automated defect detection methods. Many scholars have made contributions to improve the technology of surface defect detection. Reference [2] used Ground Penetrating Radars (GPR) to survey moisture damages on pavement bridges. It created three datasets with different resolutions and proposed mixed deep convolutional neural networks (CNNs) for feature extraction. In reference [3], the deep learning technology and structured light composed of vision and two laser sensors have been applied to detect and quantify cracks on surfaces of concrete structures. It used the laser alignment correction algorithm with a specially designed fixture module and a distance sensor to increase the accuracy of the size measurement.
In contrast to the combination of external devices, a large number of digital image processing algorithms are also applied to detection. Reference [4] analyzed image filtering and smoothing techniques, which were used as a basis to develop a background-weakening algorithm. The new model was validated under a complex background and it has good robustness. Reference [5] presented a new detection method based on the image morphology and Hough transform. According to the principle of a binocular stereo system, the position and pose of the reactors will be detected. The results indicated that the proposed location method is effective. The GrabCut algorithm was also used for skin lesion segmentation [6] combined with the deep convolutional neural network. The study in reference [7] proposed an approach combining YOLO-based object detection architecture with image processing algorithms. It can exhibit the same high performance on complex images, like overexposed and tilted ones.
To reduce labor costs for manual extract image features of defects, the improved deep convolutional neural network is tested for defect detection [8]. Reference [9] just used a single neural network to the full image, enabling real-time performance. To improve the accuracy of defect inspection, reference [10] presented a new classification network, a multi-group convolutional neural network (MG-CNN), to extract the feature map groups of different types of defects. The study [11] optimized the feature layer of the YOLO model by using an image pyramid to achieve multi-scale feature detection. It also improved the detection accuracy and speed. Reference [12] designed a new feature pyramid network layer and a proper frame and scale with a clustering algorithm. Meanwhile, the activation function was verified and optimized.
Deep learning neural networks always need a large dataset when they are trained. Reference [13] collected a large number of images acquired from mobile cameras. The detection and classification accuracy was measured using the average F1 score obtained from the precision and recall values. An active learning method [14] was proposed to reduce the labeling workload when a large labeled training database is not easily available because it requires domain-specified knowledge. Reference [15] trained YOLOv3 on a dataset of 2000 images with corresponding labels. Then logistic regression was used for performing class probabilities and label predictions. Reference [16] prepared a large-scale dataset to explore the applicability of the model under various illumination conditions. As is commonly known, training a deep learning model needs a large amount of exactly labeled samples, which is expensive and time-consuming. Based on this, reference [17] proposed a novel weakly supervised method based on deep active learning. It iteratively adjusted the last few layers of the YOLOv3 model with the most valuable samples, which is selected by a less confident strategy. Results showed that the method can reduce the labeled samples without decreasing the detection accuracy. On the other hand, reference [18] proposed a simple yet efficient weakly supervised processing pipeline. The proposed pipeline only needs image-level-labeled data without bounding-box-labeled data. Reference [19] introduced a labeled dataset approach. The dataset consists of images captured from two camera views of an identical pavement segment. The wide-view images were used to classify the distresses and to train the deep learning frameworks, while the top-down-view images allowed calculation of distress density. Combining the defect size and K-means algorithm, reference [20] carried out the dimension clustering of target frames. This effectively reduces the error detection rate. In addition, double K-means [21] was also used to generate an anchor box to improve the localization accuracy. What is refreshing is that reference [22] proposed an unprecedented cascaded model. The located region that contains the target was set to be an region of interest (RoI) region, which validated that the proposed method was more efficient and robust than some previous works.
There are many state-of-the-art models at present. Reference [23] evaluated single-shot detector (SSD), YOLO, and Faster R-CNN for speed and precision in detecting defects. Furthermore, it demonstrated the viability of real-time automated defect detection. The YOLO network performed at relatively high speed and accuracy. Experiments in the study [16] showed that YOLOv3 is nine times faster than R-CNN. Furthermore, the precision of YOLO is higher. Even with small sample data, the paper [24] showed that the YOLOv3 still worked well. In reference [25], a comparative analysis was done in terms of precision, recall, accuracy, and F1 score. The results indicated the usefulness of auto-detecting convolutional networks. Reference [26] improved the YOLO network and made it all convolutional, which consists of 27 convolution layers. It provided an end-to-end solution for surface defects detection. Reference [27] modified the framework of Faster R-CNN by introducing multi-scale feature extraction and multi-resolution candidate bound extraction into the network, which improved the detection effectively. Reference [28] improved the YOLO model replacing the margin style with proportion style. Compared to the old loss function, the new is more flexible and more reasonable in optimizing the network error. Reference [29] developed a hybrid model by integrating the YOLO and U-net models. It helped to make valid decisions at the right time. Furthermore, due to the small size, the large number, and complex background, reference [30] proposed a two-layer detection algorithm. Furthermore, it selected different feature extraction networks for each layer. The test results showed that the detection results of the two-layer detection algorithm were significantly better than those of the single-layer detection algorithm.
In this paper, a modified YOLOv3 model based on machine vision is proposed to detect metal surface defects. By making datasets of three kinds of defects, the model weights are trained after manually labeling the defective images. A new scale feature layer has been generated from the shallow features of the 11th layer combined with the deep features in the YOLOv3 model. Furthermore, the improved detection model uses K-Means++ to analyze the size information of the anchor box on the datasets. It can extract more features of small defects on the metal surface.
The rest of the paper is organized as follows. Section 2 presents a brief review of the YOLOv3 neural network model and its classification prediction. Section 3 describes the improvement of the proposed system and Section 4 outlines the process of defect detection experiments. The detection results of the surface defects are given meanwhile. In Section 5, the conclusions of the proposed method are drawn finally.
2. Related Work
2.1. Conventional CNN Models
Basic convolutional neural network (CNN) consists of three structures: convolution, activation, and pooling. The output result of CNN is the specific feature space of each image. When processing image classification tasks, the output feature space is generally taken as the input of fully connected neural network (FCN). Furthermore, the fully connected layer is used to complete the mapping from input image to label set, namely classification. The most important work in the whole process is how to adjust the weight of the network iteratively through the training data, that is, the back propagation algorithm. At present, mainstream CNNs are all adjusted and combined by simple CNN.
The CNN is one of the most used deep learning models for image detection and classification [31], due to its high accuracy when compared to other machine learning algorithms. The inference of CNNs is usually done in centralized high-performance platforms. The CNN model is therefore known to be faster than other types of deep learning models without degrading effectiveness. In [32], a new efficient model was proposed for text detection. The model used MobileNetV2 as a backbone and a balanced decoder. The balanced decoder is a stack of inverted residual block (IRB) and standard convolutional layers. It turns out that the proposed compact and accurate scene text detector (CAST) is efficient and effective.
2.2. YOLOv3 Model
YOLOv3 is a target detection model based on deep learning, provided by Joseph Redmon and Ali Farhadi, which can achieve high reasoning speed on the premise of ensuring certain accuracy. Therefore, the YOLOv3 model has been selected for the experiments in this article.
YOLOv3 essentially implements a deep convolutional network with a regression function. It predicts an objective score for each bounding box using logistic regression. As the first step of a deep convolutional network, image feature information is extracted. Compared with the two-stage detection algorithm in which the candidate box is used to extract features, the YOLOv3 algorithm directly conducts end-to-end training and reasoning for all areas of the entire image, which speeds up the operation speed and has a better distinguishing effect between foreground and background. In addition, this model fuses features of different scales, which leads to the fact that this algorithm is more conducive to identify small targets and suitable for defect detection. The second step of target detection is to classify the extracted features and divide the whole picture into several regions. If the center of the target to be detected falls within this region, the region will be classified by the classification model.
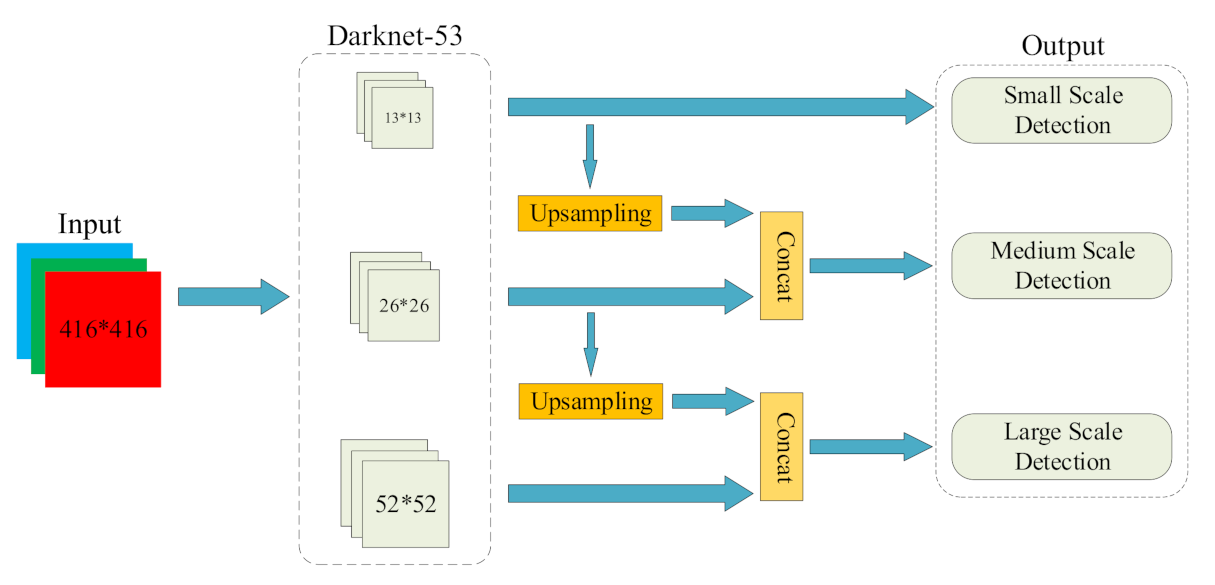
Each network corresponds to a bounding box. Each bounding box consists of five predictions: x, y, w, h, and confidence. The (x, y) coordinates represent the upper left corner of the box relative to the bounds of the grid cell. The width and height are predicted relative to the whole image. Finally, the confidence prediction based on logistic regression will judge if there contains the target. A high confidence level suggests that there is a target in the bounding box, and then target classification will be done. The YOLOv3 network structure is shown in Figure 1.
The YOLOv3 model has 53 convolutional layers and extracts target features at three convolutional layers using different scales. Furthermore, then, the features of these three scales are integrated to conduct target classification.
2.3. Multi-Label Classification
In classification prediction, YOLOv3 uses multiple independent logistic classifiers to replace the original softmax classifier. Softmax selects the maximum probability as the correct category so that it determines that a target can only belong to one category. However, in many cases, a target may belong to more than one category, and logistic can just solve this problem. It performs two classifications for each category and uses the sigmoid function to normalize the input value between [0,1]. The sigmoid function formula is as follows:
Among them, z is the function of the classification boundary. Assuming that the boundary function is linear, the formula is as follows:
Substituting it into the sigmoid function to get the prediction function, the formula is as follows:
When the sigmoid value exceeds 0.5, it is determined that the target belongs to this category. Logistic directly judge whether the target belongs to this category, using multiple logistic can achieve the purpose of multi-label classification.
In the loss function of the YOLOv3 neural network, the binary cross-entropy loss is used for classification, and the formula is as follows:
The advantage of cross-entropy as a loss function is that the use of the sigmoid function can avoid the problem of learning rate declined in the mean square error loss function during gradient descent process, because the learning rate can be controlled by the output error.
3. The Proposed Method
3.1. Network Architecture
YOLOv3 divides the input image into grids of different sizes by adding feature layers of different scales to improve the detection ability of targets of different sizes. However, there are a large number of small-sized targets for defects on the metal surface, and YOLOv3 is not sensitive to small target detection, and it is easy to cause missed detection. Therefore, targeted improvements to YOLOv3 are needed to improve the detection accuracy of small defect targets.
Based on the YOLOv3 network structure, this paper incorporates a new scale feature layer to improve the detection of small defect targets. The improved network model is shown in Figure 2, and concat is a tensor splicing operation to expand the tensor dimension. The res-n represents a residual block containing n residual units, each consisting of two DBL units and a shortcut link. Among them, DBL consists of the convolution layer, the Batch Normalization layer, and the Leaky ReLu activation function.
As is shown in the red box, the shallow output of the second residual block is merged with the deep output of the network after 2 times of upsampling in Darknet-53. Furthermore, then a new feature layer is formed through a convolutional layer with a convolution kernel size of , making the network more capable of extracting features. The size of the newly added feature layer is 1/4 the size of the input image, and the input image is divided into smaller grids, that is, the number of grids is . A smaller grid makes the network more sensitive to small targets. The shallow features are merged with the deeper features output by Darknet-53 to generate a feature layer that is conducive to the detection of small targets. It not only inherits the deep features but also makes full use of the shallow features of the network to enhance the model’s ability to extract small target features, reduce the probability of missed small defect targets and improve detection accuracy.
The number of anchor boxes for each feature layer in the network is still 3, after adding a feature layer, the total number is increased from 9 to 12 to strengthen the detection density. The superposition of the number of feature layers can divide the size levels of defect targets, and enhance the network’s comprehensive detection capabilities for different sizes of targets.
3.2. K-Means++
YOLOv3 uses K-Means cluster analysis to obtain anchor boxes, but it has certain limitations. K-Means is sensitive to the selection of initial clustering centers, and the clustering results of different initial clustering centers are very different. Since the K value is not easy to determine in the clustering process, resulting in inaccurate positioning, it is extremely important to select the appropriate K cluster centers.
Aiming at the problems of K-Means selecting initial clustering centers, K-Means++ is used to solve the shortcomings. Randomly select a sample as the current first cluster center. Then calculate the shortest distance between each sample and the existing cluster center, and classify the sample into the category corresponding to the cluster center with the smallest distance. At the same time, the probability of each sample being identified as the next cluster center is calculated, and the sample with the highest probability is selected as the next center. The formula for calculating the probability is:
is the shortest distance from each sample point to the current center. Each time an object is allocated, the cluster center will be recalculated based on the objects in the existing cluster, and this process will be repeated until no objects are reassigned to other clusters. Finally, K cluster centers are screened out. As a benefit from the difference between the acquired 12 anchor boxes, the effect of detecting the target is significantly improved.
The process of selecting cluster centers by K-Means++ greatly reduces the dependence of the clustering results on the K value and makes the distance between the initial cluster centers as far as possible, which effectively solves the defects of K-Means.
4. Experiments and Results
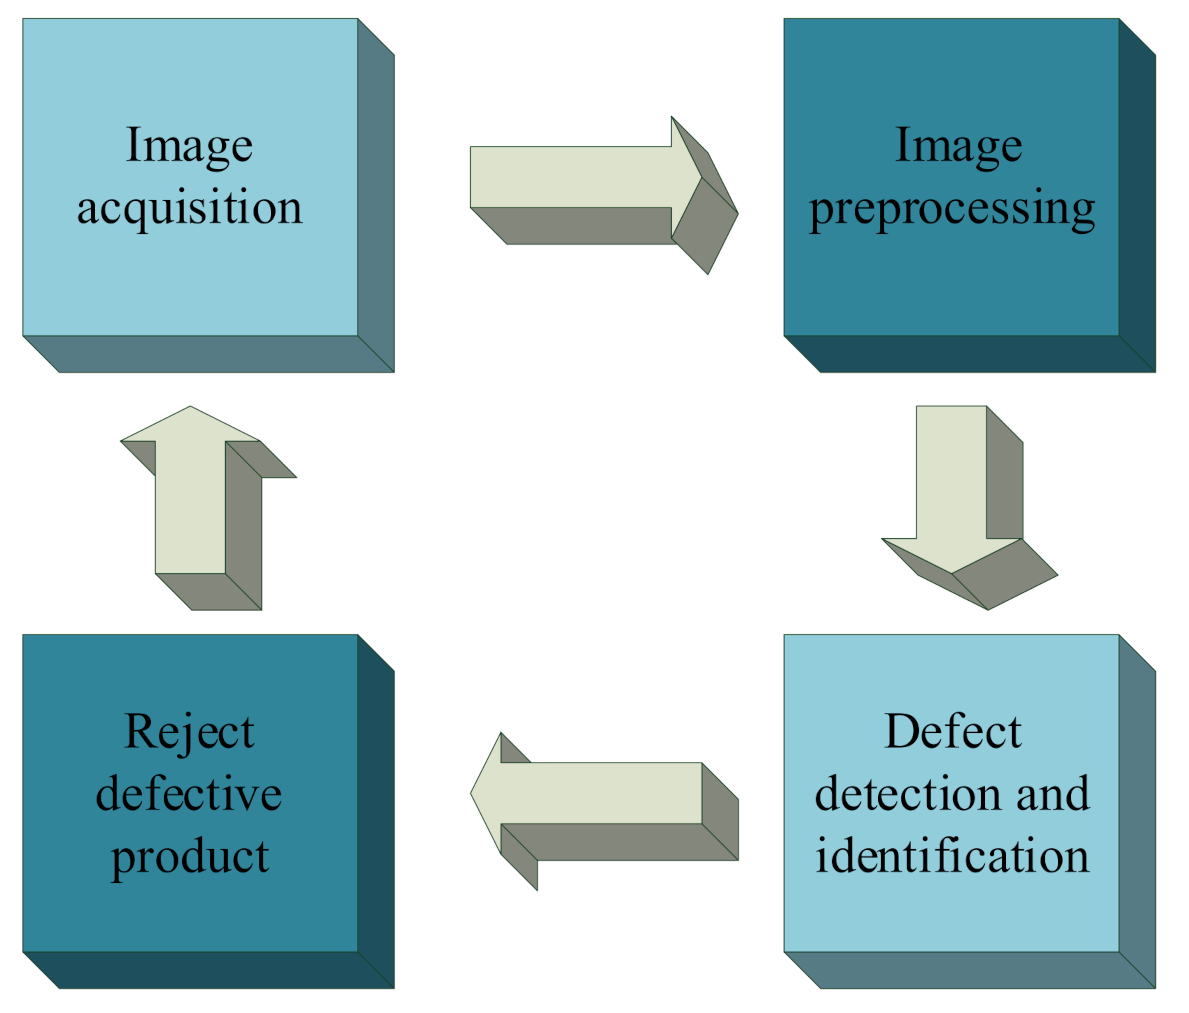
The metal surface defect detection technology using the YOLOv3, proposed in this paper, is used to detect three kinds of defects including scratches, deformations, and wrinkles. The entire process is shown in Figure 3.
The quality of images has a significant impact on the effect of detection. Therefore, this paper makes a detailed comparison and analysis of the camera and light source involved in the image acquisition module. Eventually, the model of equipment used in this system is determined.
4.1. Hardware Using for Detection
The experimental platform of this paper uses Ubuntu 20.04 operating system, equipped with CPU [email protected] Ghz, GPU NVIDIA RTX3090 and 64 GB running memory, installed CUDA 10.0 and CUDNN 8.0.5 to speed up the GPU computing.
Camera Selection. The defect detection based on machine vision has a high requirement on image quality. Generally, the image quality collected by a common camera is poor, the detection effect may not be very ideal. A series of issues such as resolution, frame rate, transmission speed, and economic cost should be taken into consideration in the selection of the camera used in this experimental platform.
Compared with complementary metal oxide semiconductor (CMOS) cameras of the same size, charge coupled device (CCD) cameras have higher resolution and much less noise. Based on the above factors, this paper finally chooses MV-EM series CCD industrial cameras. The highest pixel of this series camera can reach 14 million. The image information is transmitted by stable gigabit Ethernet, and the transmission function is not affected even if the network is disconnected. In addition, MV-EM series CCD industrial cameras are widely used in industrial manufacturing, workpiece measurement, target detection, agricultural machine vision detection, medical imaging, scientific research, and many other machine vision applications. They all have good performance.
Two CCD industrial cameras, MV-EM120C and MV-EM200C, are preselected in the experiment. The specific parameters are shown in Table 1.
The choice of CCD camera should be based on the accuracy of the object, which needs to be observed, to determine the resolution. In a dynamic capturing detection target, the field of vision in one direction should be slightly larger than the size of the detection target, to avoid incomplete image information. In static target acquisition, the closer to the detection target size is better under the condition that the light source is adjusted. In this way, the image acquired has higher accuracy and less postprocessing. The real object of defect detection is 80 mm and the maximum width is 50 mm, which requires us to put forward requirements in the selection of industrial cameras. To achieve a better detection effect, the detection accuracy is considered to be 0.5 mm. In addition, MV-EM200C CCD industrial camera adopts the mode of frame exposure and belongs to the plane array camera. Its frame rate, pixel size, optical size, and other performances can meet the requirements of target detection on the general industry 4.0 assembly line. Finally, this paper selects the MV-EM200C camera, as shown in Figure 4.
Light Source Selection. The choice of the light source is also very important in defect detection based on machine vision. Table 2 shows the characteristics of various common light sources.
Among them, in addition to the advantages described in Table 2, LED lights can also be combined into various shapes. Through the comparison test of the actual light source, the image acquisition effect is better when the LED ring light is used to illuminate the front side. The LED ring light source is shown in Figure 4.
Through the overall design of the system described above and the selection and analysis of related equipment used in the image acquisition module, this paper deploys the whole system and carries out experiments on the system.
4.2. Dataset
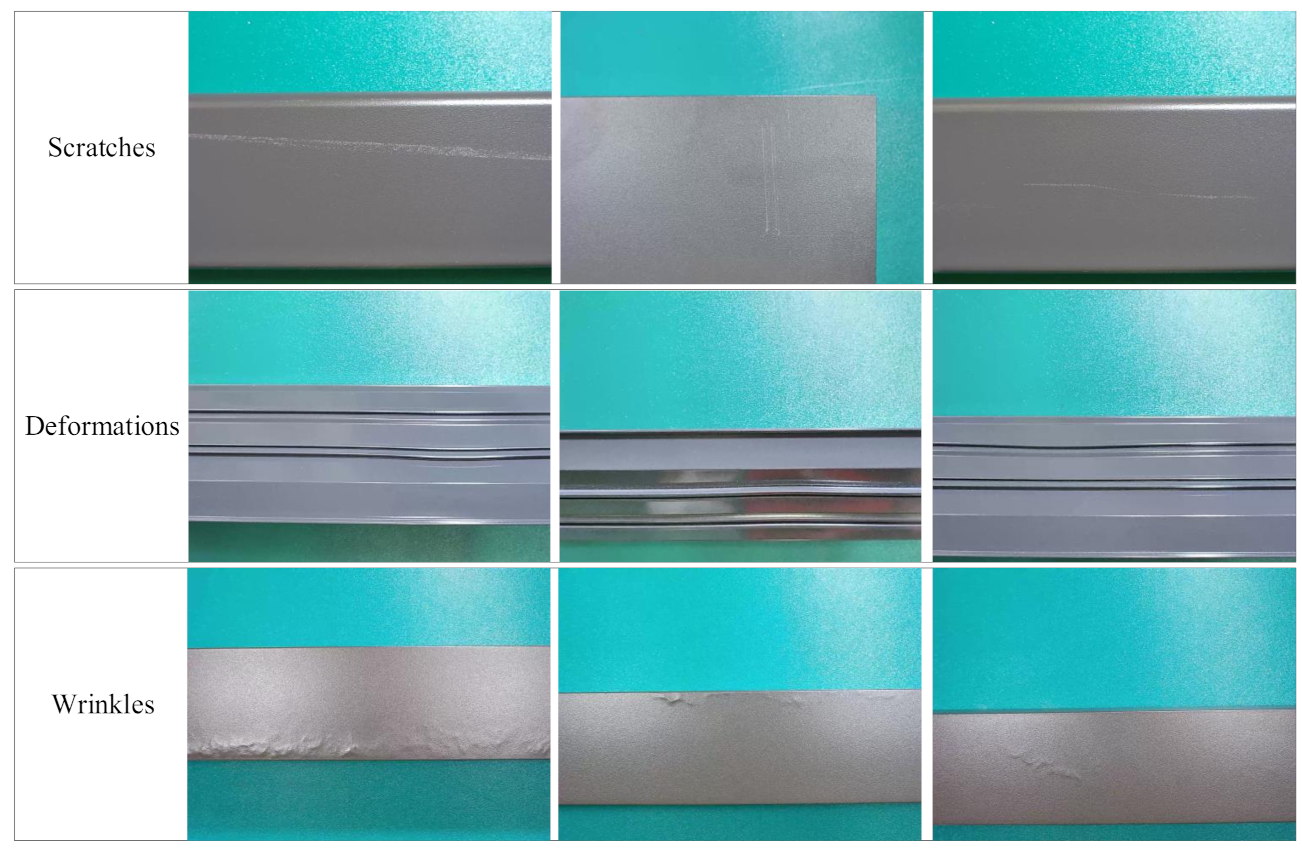
In order to better compare experiments with past advances, the experiment uses the Tianchi metal surface defect dataset collected by Alibaba Cloud [33]. There are three types of defects, scratches, deformations, and wrinkles. There are 30 images of each type of defect, totaling 90. In order to strengthen the model training effect, this study performs data enhancement operations on the dataset, flips all the images horizontally and vertically, adjusts the saturation and contrast of the images, and adds some defect-free metal images to improve the robustness of the data. Finally, a new dataset is formed, a total of 300 sheets. The classification diagram is shown in Figure 5.
This study uses Yolo_Mark to locate and classify the defect location. The dataset is randomly divided into a train dataset and a test dataset at a ratio of 4:1, that is, 240 sheets in the train dataset and 60 sheets in the test dataset.
4.3. Performance Evaluation
The precision rate and the recall rate are used to calculate the mean average precision (mAP) as the network model performance evaluation standard. The mAP is the value of the average detection accuracy of all categories, which is used to evaluate the overall performance of the detection model. The calculation formulas are as follows:
Among them, true positive () is a positive example that is correctly predicted, false positive () is a negative example that is incorrectly predicted as a positive example, false negative () is a positive example that is incorrectly predicted as a negative example, N is the number of detection categories, is the detection accuracy of various types, and the calculation formula is:
4.4. Train the Improved Model
The neural network model training process mainly includes the following steps. Firstly, the relevant dataset needs to be loaded according to the configuration file. Secondly, the dataset should be preprocessed to meet the input requirements of the neural network model. After inputting the processed data into the model, it starts iterative training and updates the parameter values. At the end, when the training number reaches the end of the count, the network weights will be outputted.
This study implements the improved YOLOv3 model based on PyTorch, a deep learning framework. First of all, it pretrains on the COCO dataset, and then uses the result of pretraining to train the custom dataset. The image size of the model input is . During the training, batch size is set to 16, the learning rate is set to 0.01, and the Adam optimization algorithm is used for iterative optimization. It lasts 1000 epochs in total.
4.5. Performance for Real-Time Operation
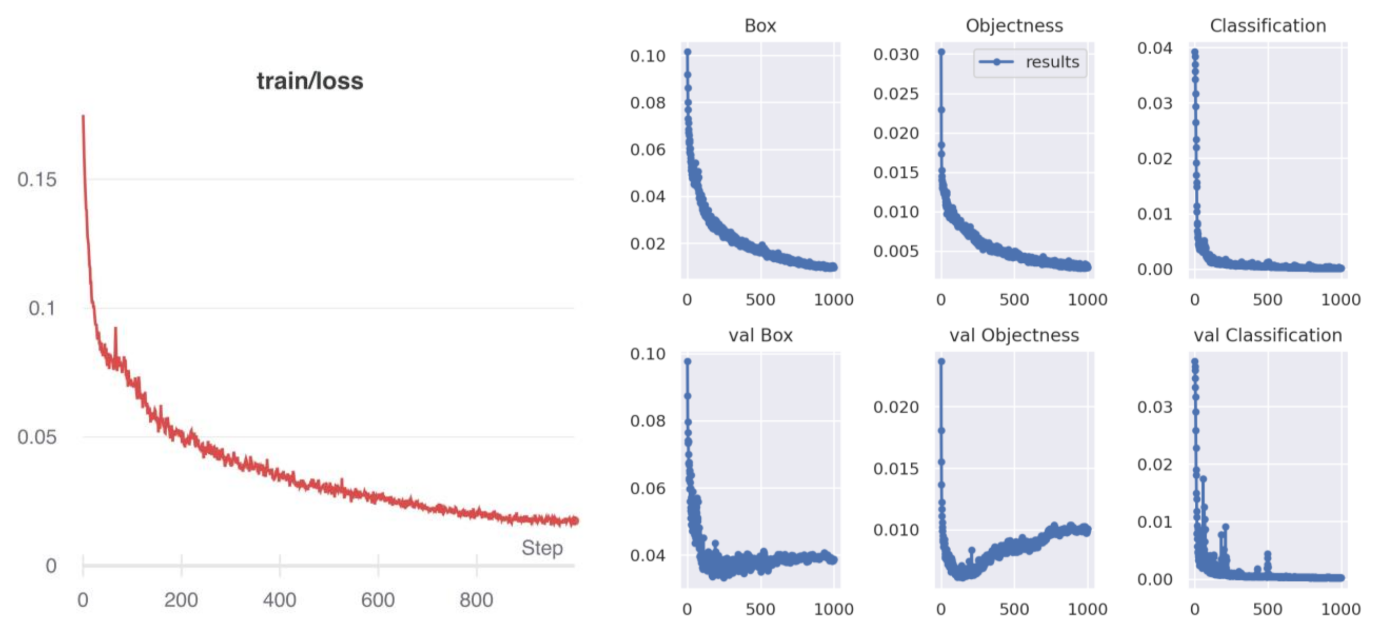
The training loss function is shown in Figure 8. As can be seen from the figure, with the increase of iteration times, the loss function value gradually decreases and tends to converge.
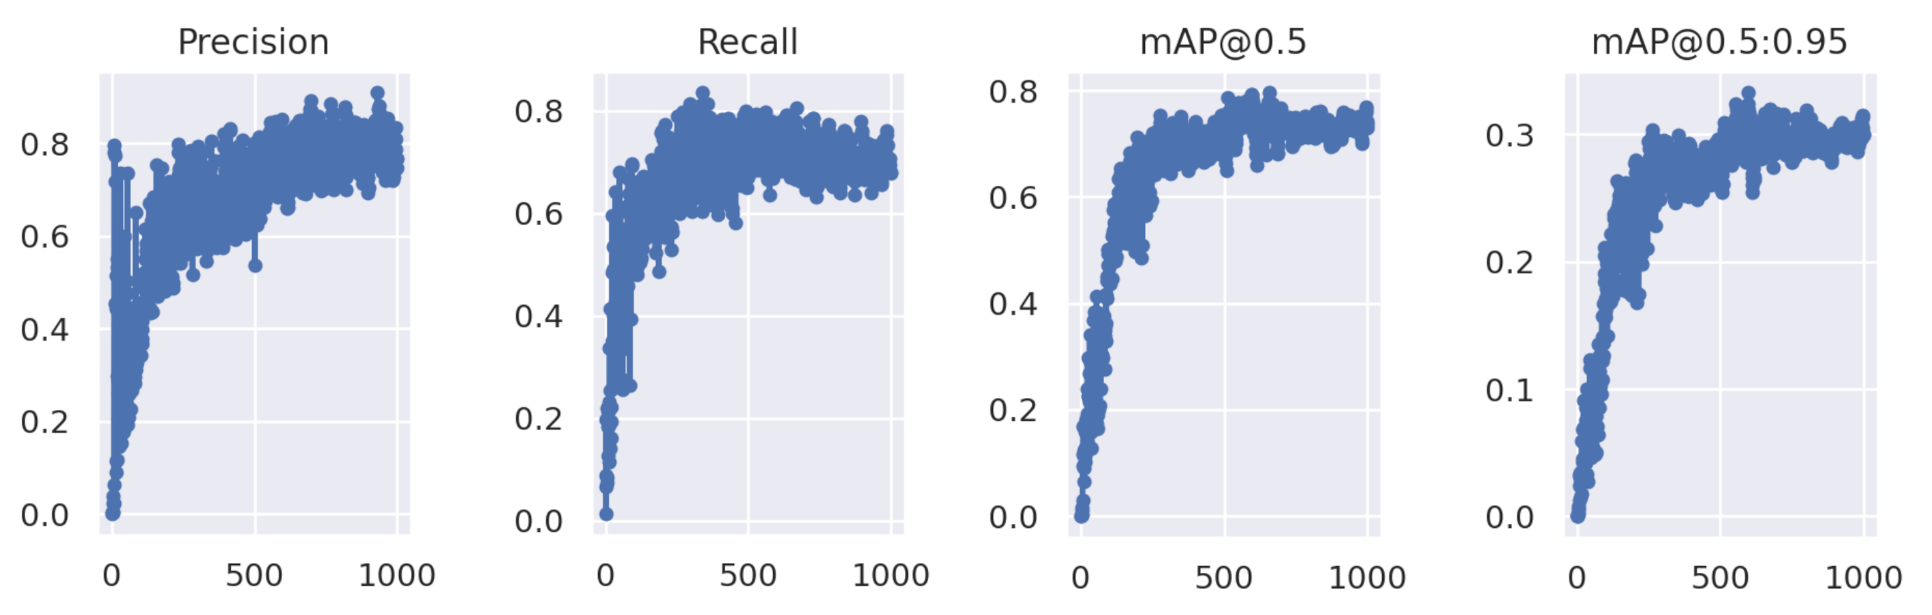
Figure 9 is the mAP graph. The mAP is a comprehensive measurement index commonly used in the field of target detection. It measures the overall detection accuracy of the detection box under different IOUs. The higher the value, the higher the accuracy of the model.
4.6. Comparison of the Improved Model with the YOLOv3 Model
In order to demonstrate the feasibility of the proposed method, this paper compares and analyzes the improvement points one by one. In terms of speed, the two neural network models are very similar. In terms of accuracy, the improved YOLOv3 model turns out to be slightly superior.
K-Means++ and K-Means are used to cluster the dataset, respectively. As shown in Table 3, the mAP using K-Means++ clustering is 75.1%, which is 3.02% higher than that of YOLOv3 using K-Means. The results show that K-Means++ can play a role in optimizing clustering centers, strengthening positioning, and improving the detection accuracy of the algorithm.
Table 4 shows the comparison of the detection accuracy of various types of defects on the dataset of YOLOv3 before and after the improved network structure. The K-Means++ clustering algorithm is used to cluster the generated Anchor Box. According to the analysis of Table 3, the mAP after the improvement of the network structure is 75.1%, which is 1.03 times of that before the improvement. The modified network structure has significantly improved the accuracy of various detections, especially the detection of small defect targets. For example, the detection accuracy of deformation is 62.8%, which is 11.8% higher than that of YOLOv3 before the improvement. In Table 4, the classification accuracy of the scratches detected by the proposed model is worse than the original one. The reason is that the improved model can detect small targets more accurately. However, the metal surface texture is very clear after image preprocessing, so that some metal surfaces are wrongly detected as scratches resulting in a decrease in accuracy.
The precision is also called the accuracy rate. It shows how many samples of the predicted results are correct. The precision represents the generalization ability of a model. The recall refers to how many positive samples of the predicted results are correctly detected. When , there are no missed tests. The AP curve is calculated by the area enclosed under the curve of precision and recall. As shown in Table 4, the value of the precision increased by 6.2% while the value of the recall increased by 5.6%. This indicates that the improved model reduces the false negative error rate, so that the additional costs in the next stage of the production line can also be reduced.
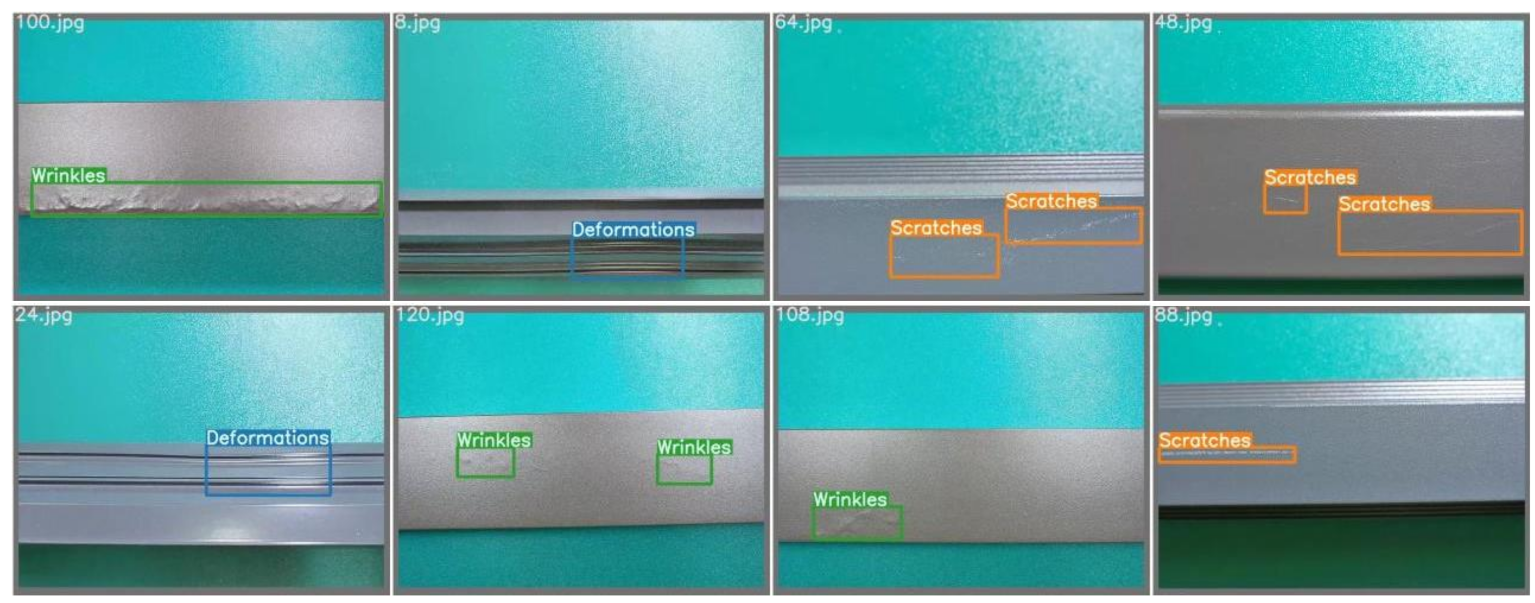
Using the YOLOv3 and the modified model detect metal surface defects, respectively, as shown in Figure 10. Comparing the YOLOv3 and the improved model in this paper, it can be clearly seen that the improved model in this study detects all the small defect targets. In the detection of the three types of defects, the detection effect of the improved model in this paper is better than that of the YOLOv3, indicating that the improved model can effectively reduce the probability of missed detection.
Therefore, the comprehensive performance of the proposed model is optimal and meets the requirement of higher precision of metal defect detection.
5. Conclusions
In this paper, a surface defect detection system based on the improved YOLOv3 model is designed and deployed. To ensure the collection of high-quality images in the actual production environment, this study compares and analyzes in detail a variety of main image acquisition equipment, taking into account the cost and performance factors of equipment. The modified model proposed in this paper reaches 75.1% mAP by using K-Means++, and the reasoning speed reaches 83 FPS.
The improved model can achieve real-time detection while ensuring high accuracy. It provides a feasible scheme for eliminating products with surface defects on the assembly line.
Author Contributions
The authors of this article all had a significant contribution to the work performed, including the following: Conceptualization, L.W. and Y.X.; Data curation, K.Z.; Formal analysis, L.W. and K.Z.; Methodology, L.W. and K.Z.; Supervision, Y.X.; Validation, L.W. and K.Z.; Writing—original draft, L.W. and K.Z.; Writing—review and editing, K.Z. and L.W. All authors have read and agreed to the published version of the manuscript.
Funding
This research was funded by the National Natural Science Foundation of China General Project: 61973178, National Natural Science Foundation-Smart Grid Joint Fund Key Project: U2066203, National Natural Science Foundation of China project number 6210020040 and the Nantong University talent introduction project: Research on high precision and strong robust machine vision detection technology.
Institutional Review Board Statement
Not applicable.
Informed Consent Statement
Not applicable.
Data Availability Statement
Not applicable.
Conflicts of Interest
The authors declare no conflict of interest.
Abbreviations
The following abbreviations are used in this manuscript:
| YOLO | You Only Look Once |
| CNN | Convolutional Neural Network |
| CNNs | Convolutional Neural Networks |
| CMOS | Complementary Metal Oxide Semiconductor |
| CCD | Charge Coupled Device |
| TP | True Positive |
| FP | False Positive |
| FN | False Negative |
| mAP | mean Average Precision |
| AP | Average Precision |
References
- Wheeler, B.J.; Karimi, H.A. Deep Learning-Enabled Semantic Inference of Individual Building Damage Magnitude from Satellite Images. Algorithms 2020, 13, 195. [Google Scholar] [CrossRef]
- Zhang, J.; Yang, X.; Li, W.; Zhang, S.; Jia, Y. Automatic detection of moisture damages in asphalt pavements from GPR data with deep CNN and IRS method. Autom. Constr. 2020, 113, 103119. [Google Scholar] [CrossRef]
- Song, E.P.; Eem, S.H.; Jeon, H. Concrete crack detection and quantification using deep learning and structured light. Constr. Build. Mater. 2020, 252, 119096. [Google Scholar]
- Yu, L.; Wang, Z.; Duan, Z. Detecting Gear Surface Defects Using Background-Weakening Method and Convolutional Neural Network. J. Sens. 2019, 2019, 3140980. [Google Scholar] [CrossRef] [Green Version]
- Cao, C.; Ouyang, Q.; Hou, J.; Zhao, L. Visual Locating of Reactor in an Industrial Environment Using the Composite Method. Sensors 2020, 20, 504. [Google Scholar] [CrossRef] [PubMed] [Green Version]
- Nver, H.M.; Ayan, E. Skin Lesion Segmentation in Dermoscopic Images with Combination of YOLO and GrabCut Algorithm. Diagnostics 2019, 9, 72. [Google Scholar]
- Tao, T.; Dong, D.; Huang, S.; Chen, W. Gap Detection of Switch Machines in Complex Environment Based on Object Detection and Image Processing. J. Transp. Eng. Part A Syst. 2020, 146, 04020083. [Google Scholar] [CrossRef]
- Zhang, H.W.; Zhang, L.J.; Li, P.F.; Gu, D. Yarn-dyed Fabric Defect Detection with YOLOV2 Based on Deep Convolution Neural Networks. In Proceedings of the 2018 IEEE 7th Data Driven Control and Learning Systems Conference (DDCLS), Enshi, China, 25–27 May 2018. [Google Scholar]
- Roy, S.S.; Haque, A.U.; Neubert, J. Automatic diagnosis of melanoma from dermoscopic image using real-time object detection. In Proceedings of the 2018 52nd Annual Conference on Information Sciences and Systems (CISS), Princeton, NJ, USA, 21–23 March 2018. [Google Scholar]
- He, D.; Xu, K.; Zhou, P. Defect detection of hot rolled steels with a new object detection framework called classification priority network. Comput. Ind. Eng. 2019, 128, 290–297. [Google Scholar] [CrossRef]
- Liu, J.; Wang, X. Tomato Diseases and Pests Detection Based on Improved Yolo V3 Convolutional Neural Network. Front. Plant Sci. 2020, 11, 898. [Google Scholar] [CrossRef]
- Huang, Z.; Sui, B.; Wen, J.; Jiang, G. An Intelligent Ship Image/Video Detection and Classification Method with Improved Regressive Deep Convolutional Neural Network. Complexity 2020, 2020, 1520872. [Google Scholar] [CrossRef]
- Mandal, V.; Uong, L.; Adu-Gyamfi, Y. Automated Road Crack Detection Using Deep Convolutional Neural Networks. In Proceedings of the 2018 IEEE International Conference on Big Data (Big Data), Seattle, WA, USA, 10–13 December 2018. [Google Scholar]
- Dai, W.; Mujeeb, A.; Erdt, M.; Sourin, A. Soldering defect detection in automatic optical inspection. Adv. Eng. Inform. 2020, 43, 101004. [Google Scholar] [CrossRef]
- Adou, M.W.; Xu, H.; Chen, G. Insulator Faults Detection Based on Deep Learning. In Proceedings of the 2019 IEEE 13th International Conference on Anti-Counterfeiting, Security, and Identification (ASID), Xiamen, China, 25–27 October 2019. [Google Scholar]
- Du, Y.; Pan, N.; Xu, Z.; Deng, F.; Shen, Y.; Kang, H. Pavement distress detection and classification based on YOLO network. Int. J. Pavement Eng. 2020, 2020, 1714047. [Google Scholar] [CrossRef]
- Huang, Z.; Li, F.; Luan, X.; Cai, Z. A Weakly Supervised Method for Mud Detection in Ores Based on Deep Active Learning. Math. Probl. Eng. 2020, 2020, 1714047. [Google Scholar] [CrossRef]
- Qiao, R.; Ghodsi, A.; Wu, H.; Chang, Y.; Wang, C. Simple weakly supervised deep learning pipeline for detecting individual red-attacked trees in VHR remote sensing images. Remote Sens. Lett. 2020, 11, 650–658. [Google Scholar] [CrossRef]
- Majidifard, H.; Jin, P.; Adu-Gyamfi, Y.; Buttlar, W.G. Pavement Image Datasets: A New Benchmark Dataset to Classify and Densify Pavement Distresses. Transp. Res. Rec. J. Transp. Res. Board 2020, 2674, 328–339. [Google Scholar] [CrossRef] [Green Version]
- Jing, J.; Zhuo, D.; Zhang, H.; Liang, Y.; Zheng, M. Fabric defect detection using the improved YOLOv3 model. J. Eng. Fibers Fabr. 2020, 15, 155892502090826. [Google Scholar] [CrossRef] [Green Version]
- Yao, S.; Chen, Y.; Tian, X.; Jiang, R.; Ma, S. An Improved Algorithm for Detecting Pneumonia Based on YOLOv3. Appl. Sci. 2020, 10, 1818. [Google Scholar] [CrossRef] [Green Version]
- Han, J.; Yang, Z.; Xu, H.; Hu, G.; Zhang, C.; Li, H.; Zeng, H. Search Like an Eagle: A Cascaded Model for Insulator Missing Faults Detection in Aerial Images. Energies 2020, 13, 713. [Google Scholar] [CrossRef] [Green Version]
- Kumar, S.S.; Wang, M.; Abraham, D.M.; Jahanshahi, M.R.; Iseley, T.; Cheng, J.C. Deep Learning–Based Automated Detection of Sewer Defects in CCTV Videos. J. Comput. Civ. Eng. 2020, 34, 04019047. [Google Scholar] [CrossRef]
- Pang, L.; Liu, H.; Chen, Y.; Miao, J. Real-time Concealed Object Detection from Passive Millimeter Wave Images Based on the YOLOv3 Algorithm. Sensors 2020, 20, 1678. [Google Scholar] [CrossRef] [Green Version]
- Yang, H.; Jo, E.; Kim, H.J.; Cha, I.H.; Jung, Y.S.; Nam, W.; Kim, D. Deep Learning for Automated Detection of Cyst and Tumors of the Jaw in Panoramic Radiographs. J. Clin. Med. 2020, 9, 1839. [Google Scholar] [CrossRef]
- Li, J.; Su, Z.; Geng, J.; Yin, Y. Real-time Detection of Steel Strip Surface Defects Based on Improved YOLO Detection Network-ScienceDirect. IFAC-PapersOnLine 2018, 51, 76–81. [Google Scholar] [CrossRef]
- Zhang, Z.; Zhang, X.; Lin, X.; Dong, L.; Zhang, S.; Zhang, X.; Yuan, K. Ultrasonic Diagnosis of Breast Nodules Using Modified Faster R-CNN. Ultrason. Imaging 2019, 41, 353–367. [Google Scholar] [CrossRef]
- Ahmad, T.; Ma, Y.; Yahya, M.; Ahmad, B.; Nazir, S. Object Detection through Modified YOLO Neural Network. Sci. Program. 2020, 2020, 8403262. [Google Scholar] [CrossRef]
- Majidifard, H.; Adu-Gyamfi, Y.; Buttlar, W.G. Deep machine learning approach to develop a new asphalt pavement condition index. Constr. Build. Mater. 2020, 247, 118513. [Google Scholar] [CrossRef]
- He, Y.; Zhou, Z.; Tian, L.; Liu, Y.; Luo, X. Brown rice planthopper (Nilaparvata lugens Stal) detection based on deep learning. Precis. Agric. 2020, 21, 1385–1402. [Google Scholar] [CrossRef]
- Véstias, M.P. A Survey of Convolutional Neural Networks on Edge with Reconfigurable Computing. Algorithms 2019, 12, 154. [Google Scholar] [CrossRef] [Green Version]
- Jeon, M.; Jeong, Y.-S. Compact and Accurate Scene Text Detector. Appl. Sci. 2020, 10, 2096. [Google Scholar] [CrossRef] [Green Version]
- Tianchi Data Sets. Alibaba Cloud. Available online: https://tianchi.aliyun.com/dataset (accessed on 20 June 2021).
Figure 1.
The structure of YOLOv3 network.

Figure 2.
The improved YOLOv3 model.

Figure 3.
The process of the defect detection.

Figure 4.
Image acquisition platform.

Figure 5.
Tianchi dataset.

Figure 6.
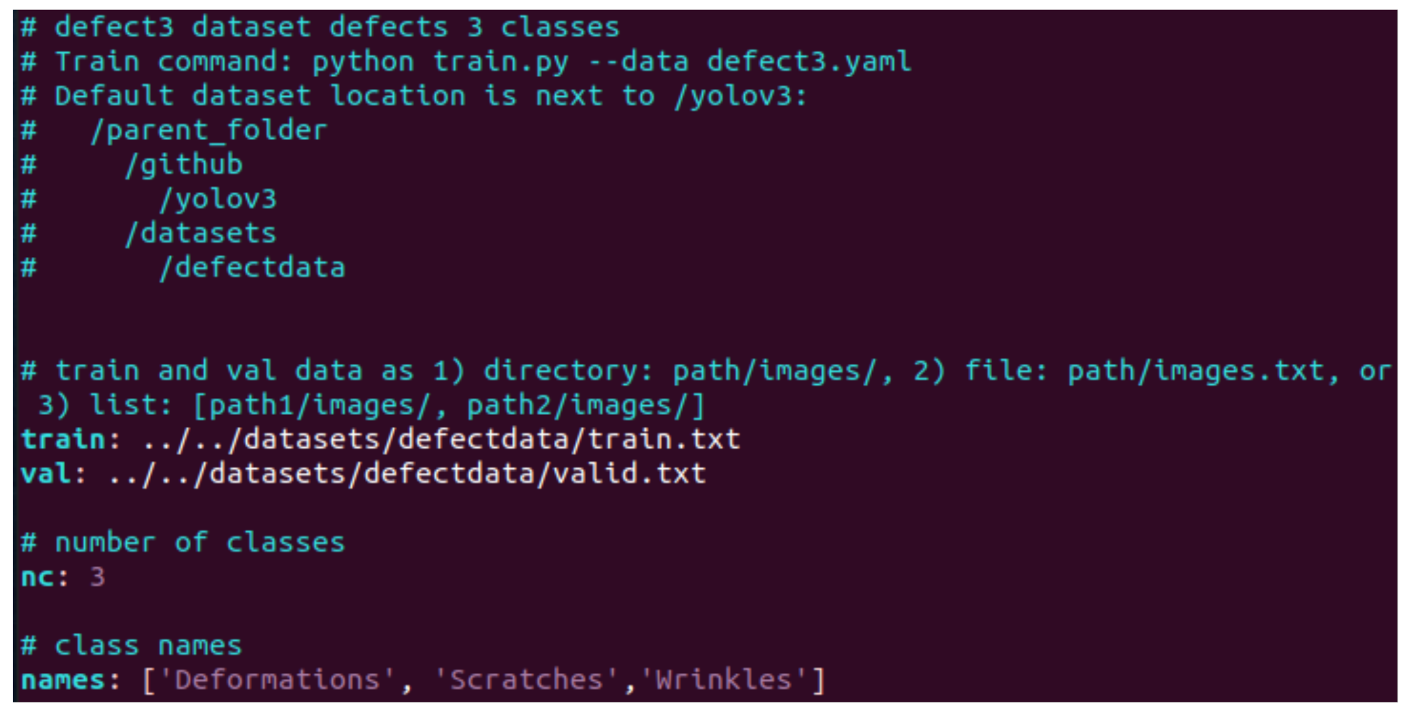
The yaml file.

Figure 7.
Image labeling.

Figure 8.
The curve of loss function. Training loss is measured during each epoch while validation loss is measured after each epoch.
Figure 8.
The curve of loss function. Training loss is measured during each epoch while validation loss is measured after each epoch.

Figure 9.
The curve of the mAP. The abscissa is the number of the iterations. Furthermore, the y-axis is the value of the prediction, recall, [email protected], and [email protected]:0.95.
Figure 9.
The curve of the mAP. The abscissa is the number of the iterations. Furthermore, the y-axis is the value of the prediction, recall, [email protected], and [email protected]:0.95.

Figure 10.
Detection effect of the algorithm in this paper.


Table 1.
Compared with MV-EM120C and MV-EM200C.
| Model | MV-EM120C | MV-EM200C |
|---|---|---|
| Highest Resolution | ||
| Pixel Size | ||
| Sensor Type | CCD | CCD |
| Frame Rate | 30 FPS | 20 FPS |
| Memory | 128 M | 128 M |
| Time of Exposure | 10 us–0.2 s | 10 us–0.2 s |
| Output Color | Color | Color |
| Data Bits | 12 | 14 |
| Exposure Method | Frame Exposure | Frame Exposure |
| Weight | 65 g | 65 g |
Table 2.
The characteristics of light sources.
| Type | Lighting Effect (Im/W) | Feature |
|---|---|---|
| Halogen Lamp | 12–24 | High Calorific Value |
| Fluorescent Lamp | 50–120 | Large Area Exposure |
| LED Light | 110–250 | Low Power Consumption |
| High Intensity Discharge Lamp | 150–330 | High Light Intensity |
Table 3.
Comparison of two clustering algorithms.
| Cluster | mAP/% | FPS (f/s) |
|---|---|---|
| K-Means | 72.9 | 83 |
| K-Means++ | 75.1 | 83 |
Table 4.
Results before and after network improvement.
| Defects/AP(%) | The Original Model | The Improved Model |
|---|---|---|
| Deformations | 55.4 | 62.8 |
| Scratches | 68.1 | 66.0 |
| Wrinkles | 95.1 | 96.4 |
| Precision | 0.746 | 0.792 |
| Recall | 0.677 | 0.715 |
Publisher’s Note: MDPI stays neutral with regard to jurisdictional claims in published maps and institutional affiliations. |
© 2021 by the authors. Licensee MDPI, Basel, Switzerland. This article is an open access article distributed under the terms and conditions of the Creative Commons Attribution (CC BY) license (https://creativecommons.org/licenses/by/4.0/).
Share and Cite
MDPI and ACS Style
Xu, Y.; Zhang, K.; Wang, L. Metal Surface Defect Detection Using Modified YOLO. Algorithms 2021, 14, 257. https://0-doi-org.brum.beds.ac.uk/10.3390/a14090257
AMA Style
Xu Y, Zhang K, Wang L. Metal Surface Defect Detection Using Modified YOLO. Algorithms. 2021; 14(9):257. https://0-doi-org.brum.beds.ac.uk/10.3390/a14090257
Chicago/Turabian StyleXu, Yiming, Kai Zhang, and Li Wang. 2021. "Metal Surface Defect Detection Using Modified YOLO" Algorithms 14, no. 9: 257. https://0-doi-org.brum.beds.ac.uk/10.3390/a14090257
Note that from the first issue of 2016, this journal uses article numbers instead of page numbers. See further details here.