
Large-Scale Multimodal Piano Music Identification Using Marketplace Fingerprinting †


Department of Engineering, Harvey Mudd College, 301 Platt Blvd, Claremont, CA 91711, USA
*
Author to whom correspondence should be addressed.
†
This paper is an extended version of our paper published in International Society for Music Information Retrieval Conference (ISMIR 2021), Online, 7–12 November 2021.
Algorithms 2022, 15(5), 146; https://0-doi-org.brum.beds.ac.uk/10.3390/a15050146
Submission received: 25 March 2022
/
Revised: 20 April 2022
/
Accepted: 24 April 2022
/
Published: 26 April 2022
(This article belongs to the Special Issue Machine Understanding of Music and Sound)
Abstract
:This paper studies the problem of identifying piano music in various modalities using a single, unified approach called marketplace fingerprinting. The key defining characteristic of marketplace fingerprinting is choice: we consider a broad range of fingerprint designs based on a generalization of standard n-grams, and then select the fingerprint designs at runtime that are best for a specific query. We show that the large-scale retrieval problem can be framed as an economics problem in which a consumer and a store interact. In our analogy, the runtime search is like a consumer shopping in the store, the items for sale correspond to fingerprints, and purchasing an item corresponds to doing a fingerprint lookup in the database. Using basic principles of economics, we design an efficient marketplace in which the consumer has many options and adopts a rational buying strategy that explicitly considers the cost and expected utility of each item. We evaluate our marketplace fingerprinting approach on four different sheet music retrieval tasks involving sheet music images, MIDI files, and audio recordings. Using a database containing approximately 375,000 pages of sheet music, our method is able to achieve mean reciprocal rank with sub-second average runtime on cell phone image queries. On all four retrieval tasks, the marketplace method substantially outperforms previous methods while simultaneously reducing average runtime. We present comprehensive experimental results, as well as detailed analyses to provide deeper intuition into system behavior.
1. Introduction
One of the longstanding problems of interest in the multimedia community is large-scale retrieval from databases of multimedia data. One area of focus in the last decade has been on building scalable retrieval systems that can handle the ever-increasing amount of data that is available. Much of this work has revolved around retrieval of natural images (e.g., [1,2,3,4]), spurred on by standardized retrieval benchmarks such as the Oxford Buildings [5] and Paris [6] datasets. A second area that has drawn significant interest in recent years is cross-modal retrieval, in which a query in one modality is used to retrieve an item in a different modality. Many works have focused on image-text retrieval (e.g., [7,8,9,10]), again spurred on by standardized benchmarks such as MIR Flickr [11] and NUS-WIDE [12].
This article studies a large-scale multimodal retrieval problem in the domain of music. Specifically, we investigate the problem of finding the matching sheet music for a short excerpt of piano music, where the excerpt may be in the form of an audio recording, MIDI file, digital scan of sheet music, or cell phone picture of sheet music. In our study, we consider all solo piano sheet music in the International Music Score Library Project (IMSLP) database, which contains a large collection of sheet music in the public domain along with corresponding metadata. This is the large-scale multimodal piano music identification task.
Previous work on sheet music retrieval falls into three areas. The first area of related works is audio-sheet image retrieval. The earliest works use optical music recognition (OMR) to first convert sheet music images into a symbolic music representation such as MIDI, extract chromatic features from both the audio and estimated MIDI representation, and then use dynamic time warping to perform alignment or retrieval. This approach has been used on a variety of audio-image retrieval and alignment tasks [13,14,15,16]. More recent approaches use convolutional neural networks (CNNs) to embed small fragments of sheet music and audio into a shared latent space that captures semantic similarity. This approach has been similarly applied to a variety of audio-image alignment and retrieval tasks [17,18,19,20]. This approach has since been extended in a number of ways, including using deep reinforcement learning to perform online audio-image score following [21,22] or performing position estimation on full page images [23,24].
The second area of related works is MIDI-sheet image retrieval. Several works bridge the modality gap by using a mid-level feature representation called a bootleg score that describes the positions of noteheads relative to staff lines in sheet music [25]. This approach has been used for retrieval of MIDI passages using images of sheet music [25,26] as well as large-scale retrieval between datasets of sheet music and MIDI [27,28]. Other works use statistical models or OMR to estimate the sequence of symbols in sheet music, and then perform retrieval through string matching [29], keyword spotting [30], or n-gram lookups [31,32].
The third area of related works is image-image retrieval of sheet music. Because sheet music images are very high-dimensional, the general approach is to first extract a sequence of low-dimensional features, and then use dynamic time warping or fingerprinting methods to perform alignment or retrieval. Recent works have explored image-image retrieval tasks using the bootleg score representation [28,33], the predicted outputs of an OMR system [34], and CNN features extracted from sheet music images and trained with triplet loss [35].
Our problem of interest differs from previous work in three ways. First, we consider the piano music identification problem across multiple input modalities, not just one. Whereas previous works have generally focused on a single unimodal or cross-modal retrieval task (e.g., audio-audio retrieval [36,37], audio-image retrieval [18,19], image-MIDI retrieval [26,27]), we study the problem across a range of input modalities, including audio recordings, MIDI files, digital scans of sheet music, and cell phone pictures of sheet music. Second, we study the piano music identification problem using a searchable database of sheet music. This has a very practical implication: whereas large databases of audio recordings are expensive to assemble and necessarily private due to copyright restrictions, there are large databases of sheet music that are publicly available and open to the research community. Third, we study the piano music identification problem at a very large scale, using all solo piano sheet music in the International Music Score Library Project (IMSLP), a database containing more than 600,000 sheet music scores in the public domain. Whereas most previous works have studied the piano music identification problem using only hundreds of searchable items in the database, we use the largest available dataset that is available to the research community.
Our approach is based on a novel fingerprinting scheme, which we call marketplace fingerprinting. The key defining characteristic of marketplace fingerprinting is choice: rather than trying to find the single best global fingerprint design and processing all queries with the same fingerprint design, we instead consider a range of different fingerprint designs and select the fingerprint designs at runtime that are best for a specific query. We show that this setup is equivalent to an economics scenario in which a consumer is given multiple options in a store and needs to decide which items to purchase. As in many economics scenarios, the consumer and the store have competing interests, which leads to a type of minimax optimization problem. By framing the fingerprinting problem in this manner, we are able to design a system that corresponds to a very efficient marketplace.
This paper has three main contributions. First, we propose a novel fingerprinting scheme called marketplace fingerprinting that operates on a generalization of standard n-grams. This approach frames the fingerprinting problem as an economics problem, and it yields a solution which corresponds to an efficient marketplace. This approach provides a way to design a fingerprint database and select fingerprint designs at runtime in order to maximize performance. Second, we provide experimental validation of the marketplace approach on four different sheet music retrieval tasks involving multiple input modalities, including sheet music, audio, and MIDI. Across all four retrieval tasks, our results show that the marketplace approach substantially outperforms previous methods in retrieval accuracy while simultaneously reducing average runtime. Third, we present extensive analyses to provide deeper insight and intuition into system behavior.
We note that this article is a journal extension to an earlier conference paper [38]. It extends the conference paper by (a) proposing modifications to the original image-image retrieval system to enable cross-modal retrieval (Section 2.5); (b) presenting experimental results on four different retrieval tasks involving multiple input modalities (Section 3.2, Section 3.3, Section 3.4 and Section 3.5), whereas the conference paper only considers a single input modality; and (c) conducting new or expanded analyses to provide deeper intuition into system behavior (Section 4.1, Section 4.2, Section 4.3 and Section 4.4). Code for this project can be found at https://github.com/HMC-MIR/Marketplace (accessed on 23 April 2022).
2. Materials and Methods
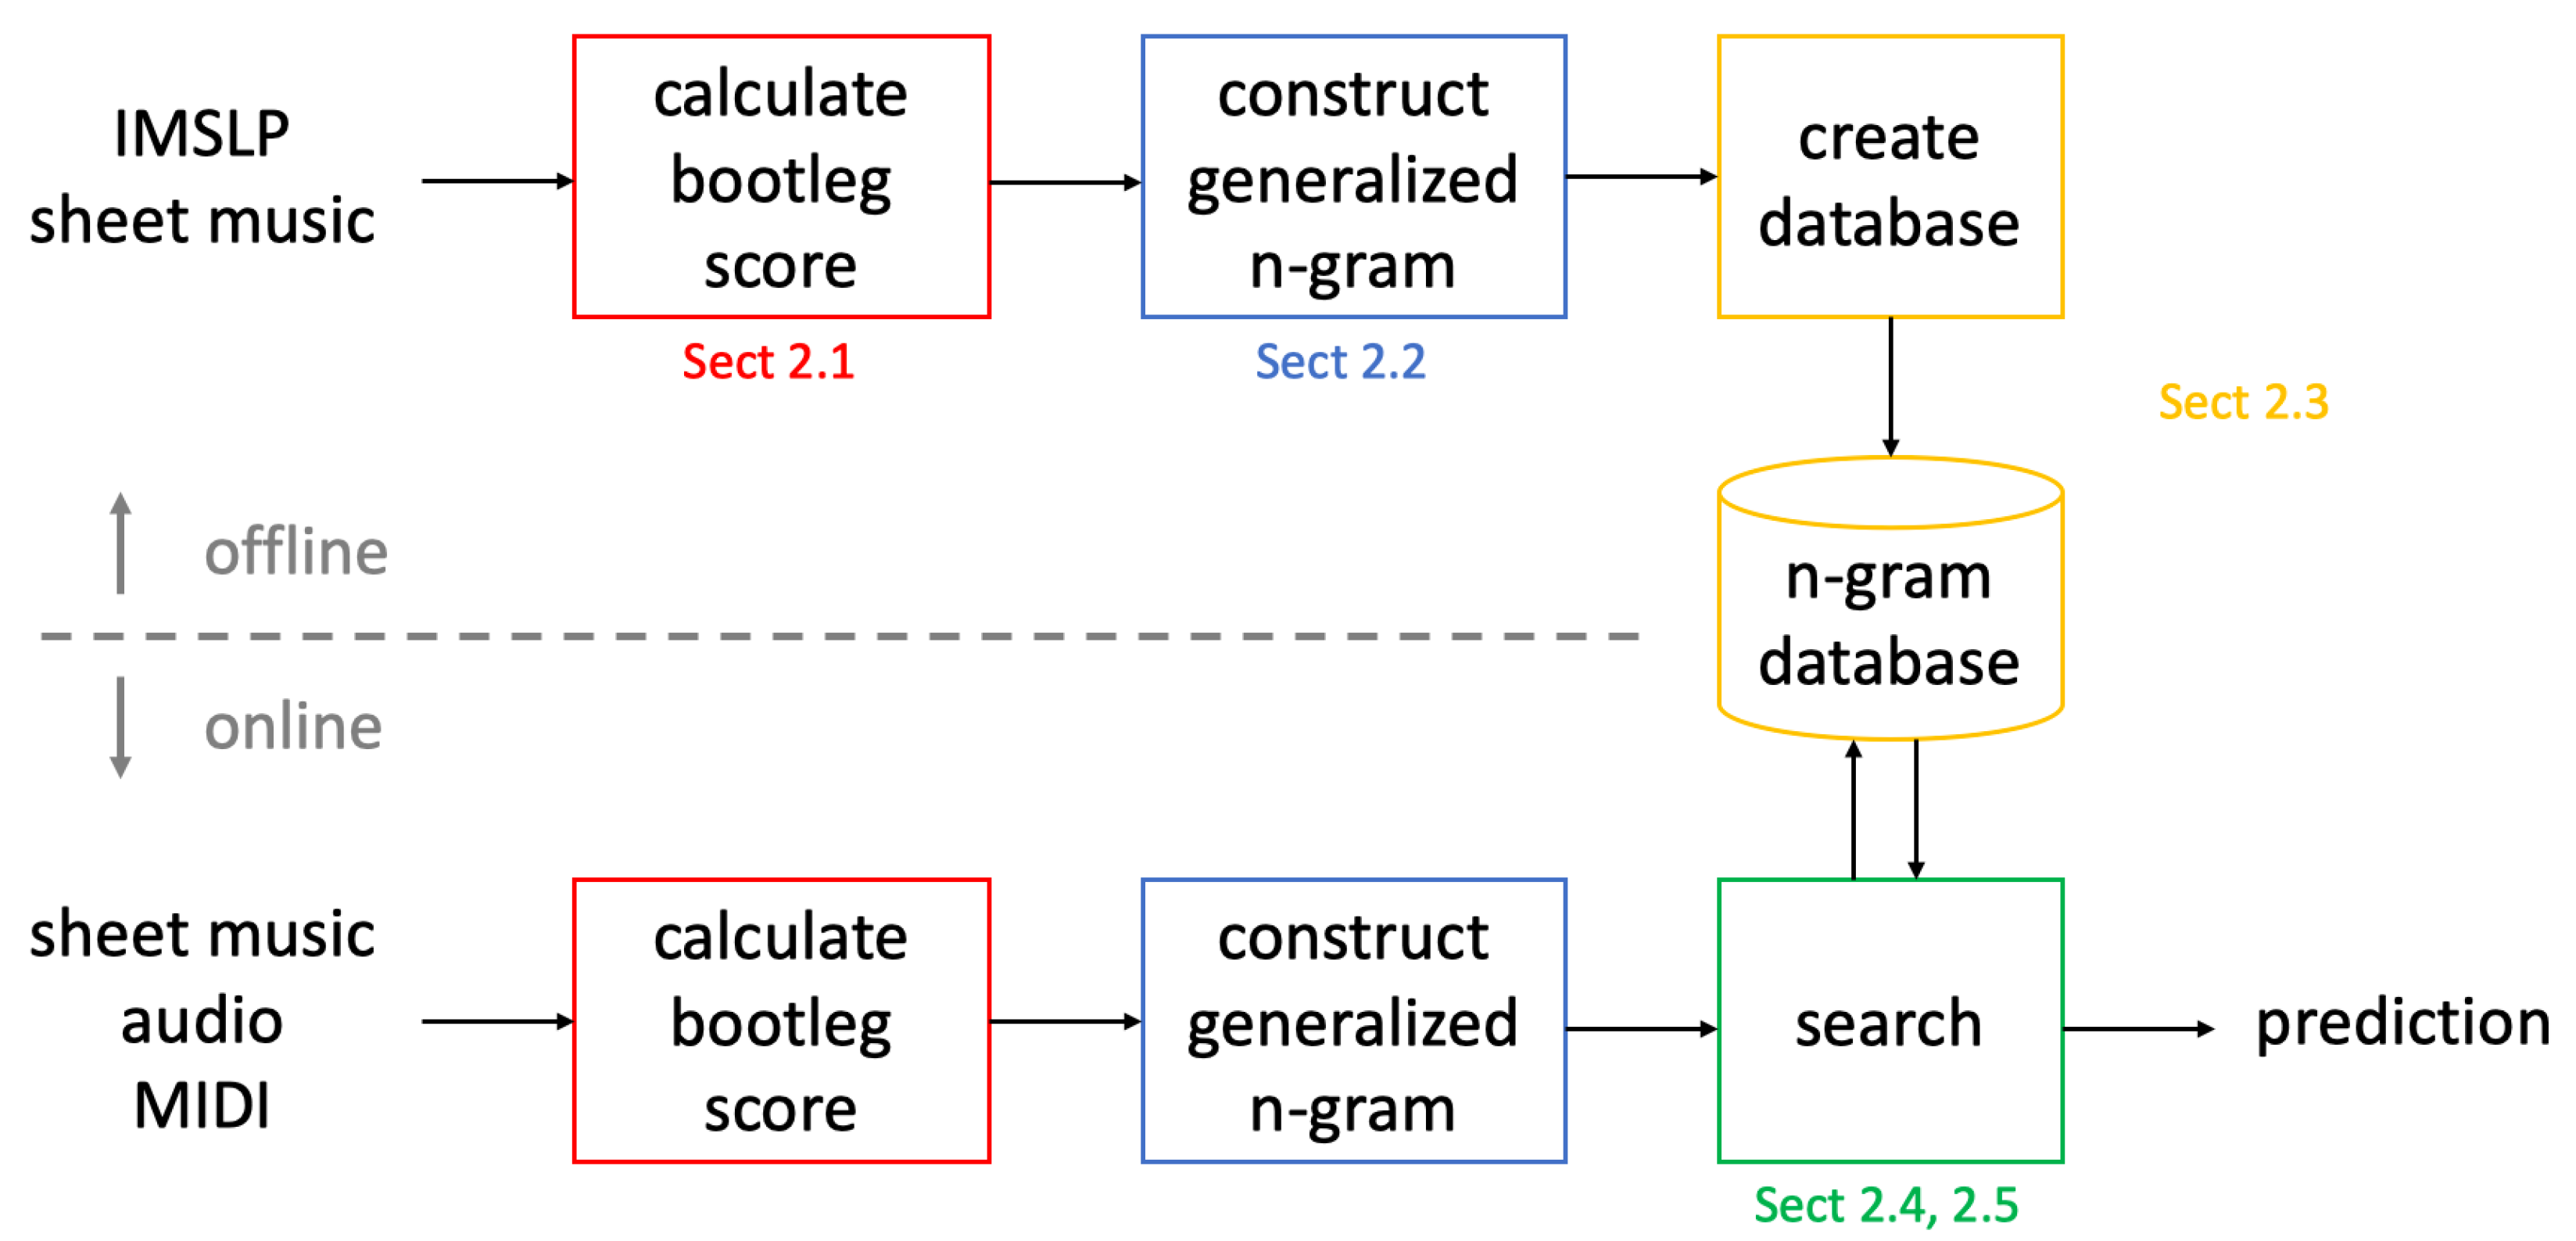
Figure 1 shows an overview of our proposed marketplace fingerprinting system for piano music identification. There are four main components: calculating a bootleg score (Section 2.1), constructing generalized n-gram fingerprints (Section 2.2), creating the marketplace database (Section 2.3), and performing a runtime search (Section 2.4). We first describe the system in its entirety assuming that the input is a sheet music image (Section 2.1–Section 2.4), and then we describe ways to modify the system to handle cross-modal searches (Section 2.5). We point out that the bootleg score representation is adopted from previous work, but the remaining parts of the proposed system are novel contributions.
2.1. Bootleg Score
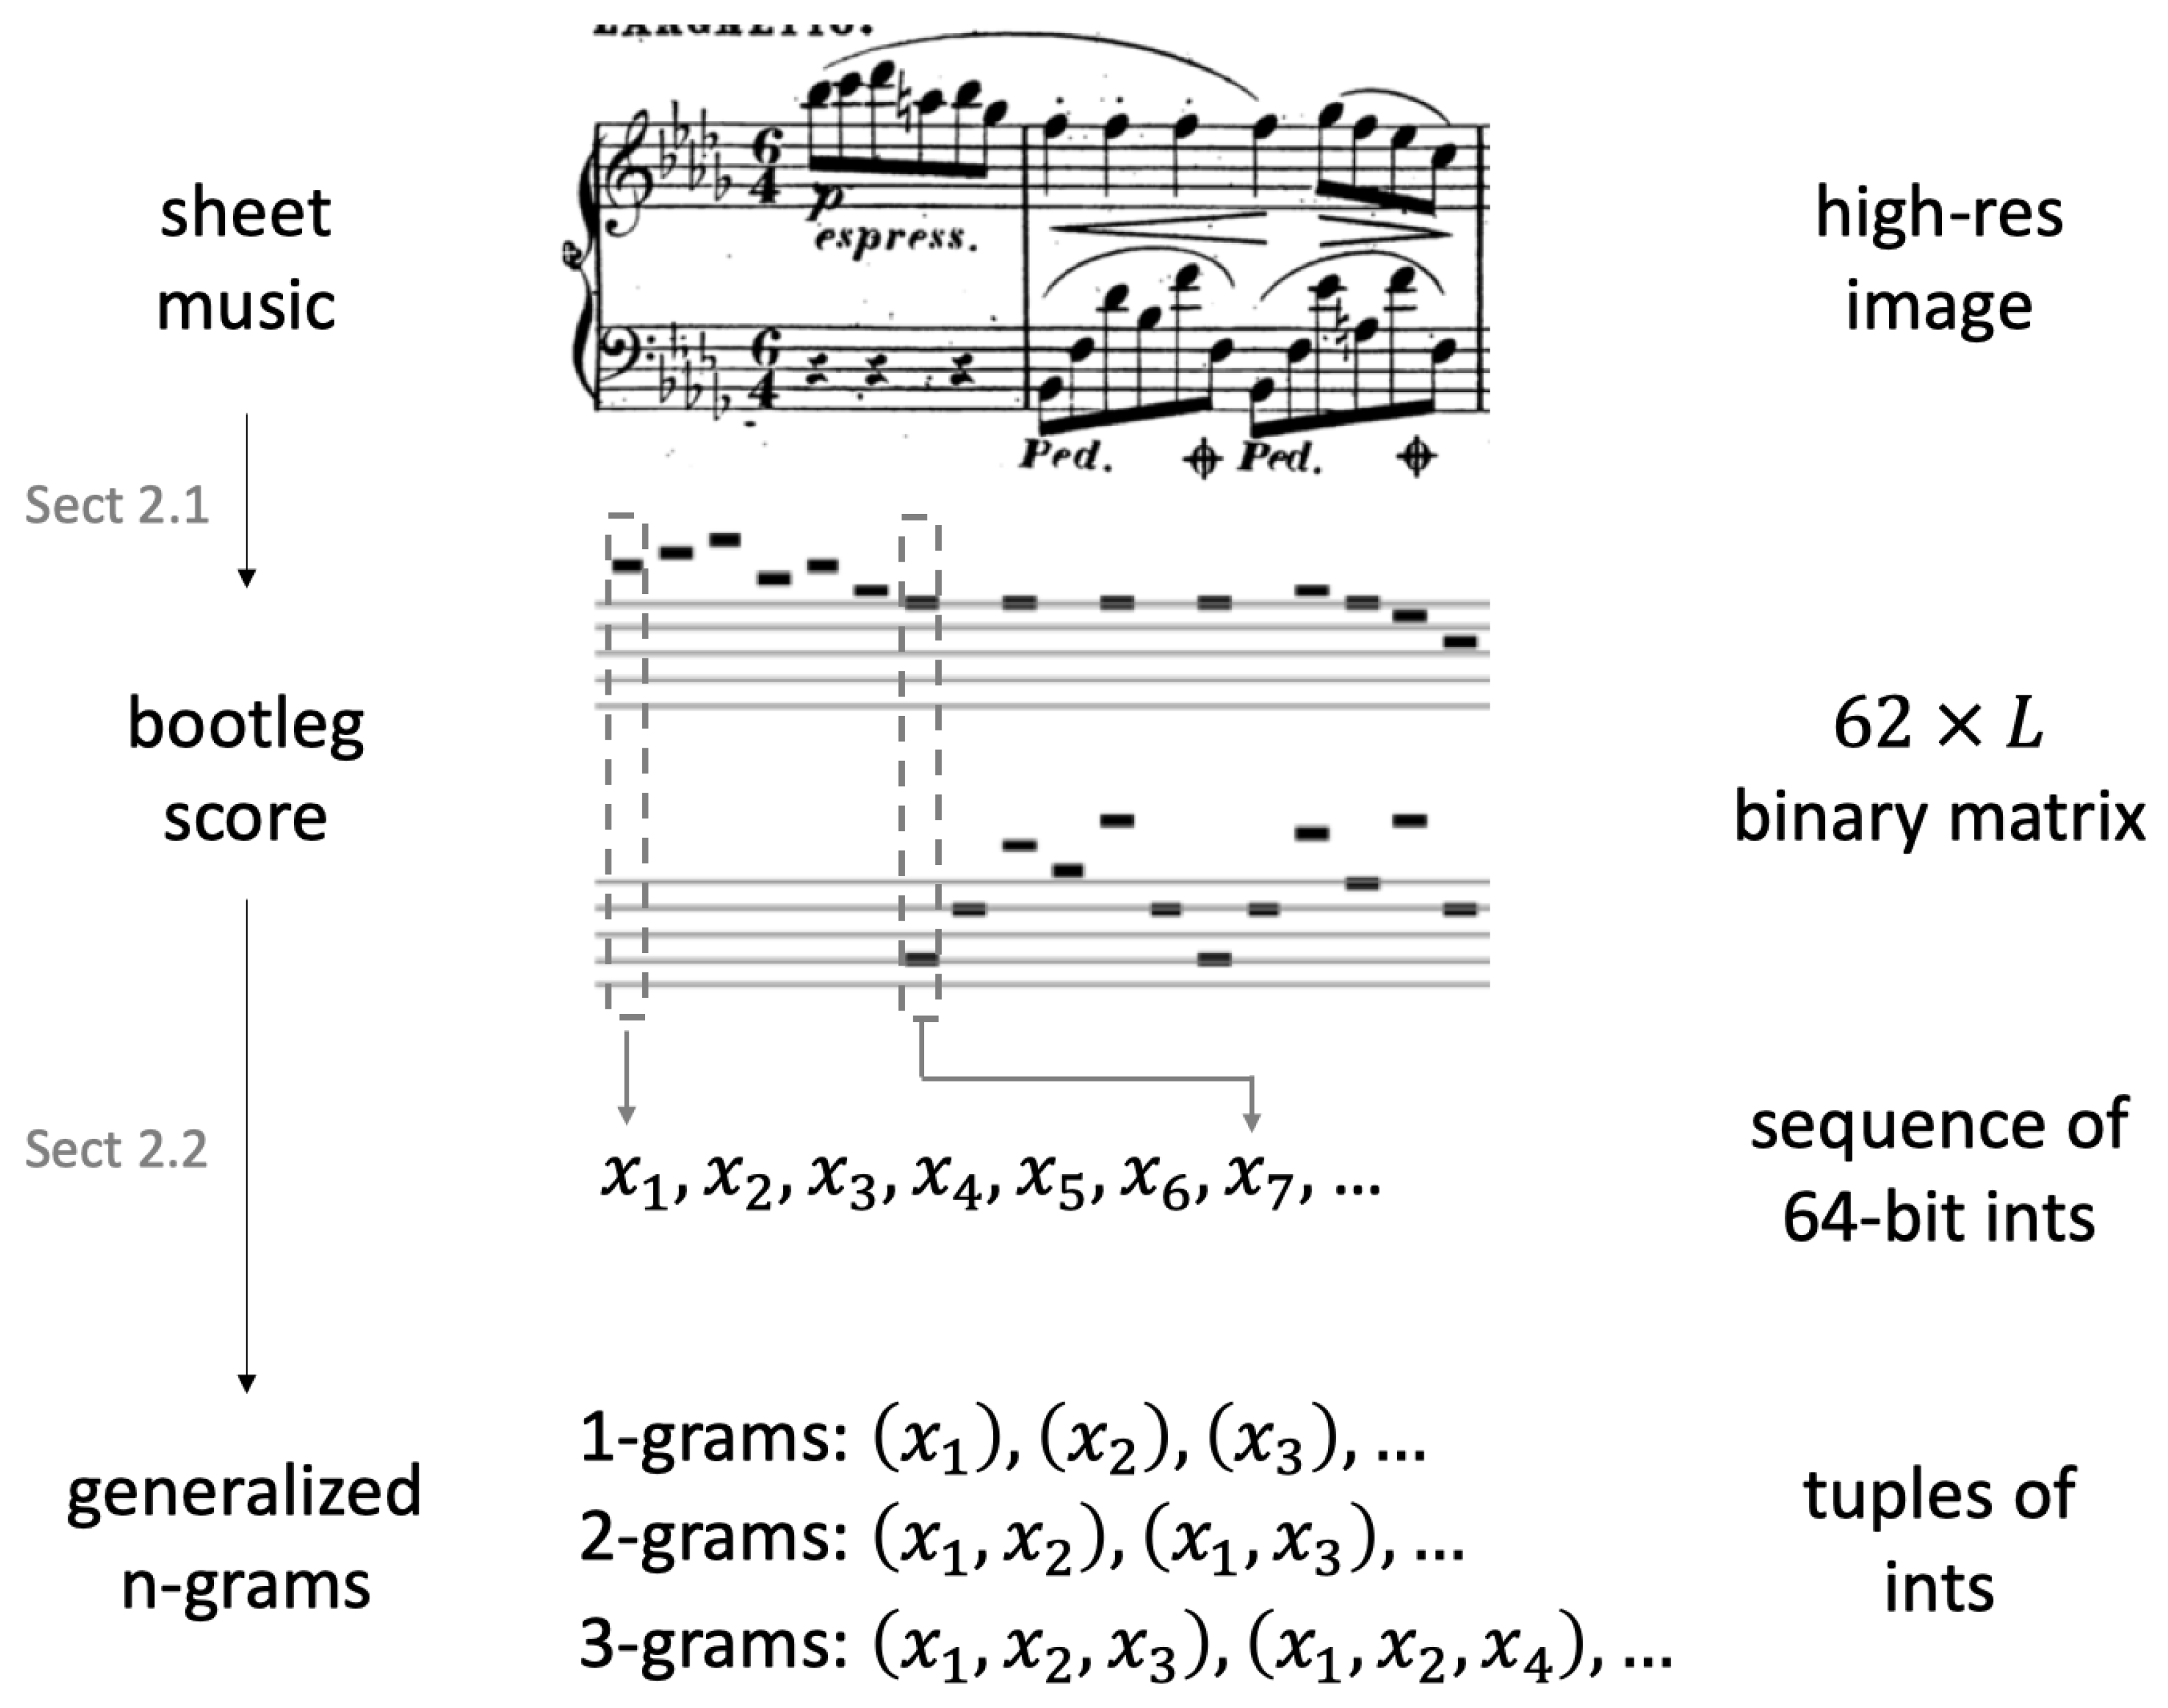
The first component (red box in Figure 1) is converting sheet music images into a feature representation called a bootleg score [25,26]. The bootleg score is a mid-level feature representation that encodes the positions of filled noteheads in sheet music. It is represented as a binary matrix, where 62 indicates the total number of possible staff line positions in both the left- and right-hand staves and where L indicates the number of grouped note events (e.g., a chord containing three notes played simultaneously would constitute a single grouped note event). The first 28 staffline positions correspond to notes A0 through G4 in the left-hand staff, and the last 34 staffline positions correspond to notes E3 through C8 in the right-hand staff. Note that the range E3 through G4 is represented in both the left-hand and right-hand sections of a bootleg score column since notes in this middle range commonly appear in both staves. The upper half of Figure 2 shows a short snippet of sheet music and its corresponding bootleg score representation. Clearly, this representation discards a lot of information contained in the sheet music, including non-filled noteheads (e.g., half notes or whole notes), note duration, accidentals, key signature, time signature, clef changes, and octave markings. Nonetheless, it has been used effectively for a wide range of tasks such as sheet-MIDI retrieval [25,26,27], sheet music identification [28,33], and audio-sheet synchronization [39,40].
2.2. Generalized n-Gram Fingerprints
The second component (blue box in Figure 1) is constructing generalized n-gram fingerprints from the bootleg score. This consists of two sub-steps, which are described in the next two paragraphs. The bottom half of Figure 2 also illustrates the process.
The first sub-step is to convert the bootleg score into a list of integers. Since the bootleg score is a binary matrix, we can encode each 62-bit column as a 64-bit integer. The result is a sequence of L integers .
The second sub-step is to construct a set of fingerprints that we refer to as generalized n-grams. The concept of an n-gram comes from the language modeling literature [41], where the probability of observing a sequence of n consecutive words is estimated based on its frequency of occurrence in a large set of data. Whereas a standard n-gram considers n consecutive elements, our generalized n-gram considers a subset of n elements within a fixed context window. In order to avoid duplicates at different offsets, we always assume that the first “anchor” element is selected. For example, with a context window of length 4, there are a total of 8 generalized n-grams at each offset i: one 1-gram , three 2-grams , three 3-grams , and one 4-gram . In our experiments, we use a context window of length 6 and consider up to 3-grams, resulting in a total of 16 generalized n-grams at each offset. By considering combinations of non-consecutive elements, this representation is more robust to errors in the bootleg score representation.
2.3. Marketplace Database
The third component (orange box in Figure 1) is creating a database containing a subset of generalized n-gram fingerprints. Ideally, we would like to include all generalized n-grams from every page of sheet music in the dataset. However, this would take up too much RAM for a dataset as large as IMSLP. Therefore, we need to choose a subset of fingerprints to include in a database of finite size.
We use principles of economics to decide which fingerprints to include in the database. This problem is analogous to selecting which products to put in a store given finite shelf space. In this analogy, there are two agents with competing interests: the consumer and the store manager. The store manager wishes to maximize profit, whereas the consumer wishes to maximize utility given a finite budget. Note that simply offering the products with the highest profit margin will not result in the highest total profits, since the consumer may be less inclined to purchase expensive items. There is some optimal equilibrium between the competing interests of the store manager and the consumer. This scenario occurs frequently in economics and often leads to solutions like a Nash equilibrium or pareto-optimal solution.
We frame our database design problem based on the economics scenario described above. In our analogy, the store is the database, the store manager is the database designer, and the limited amount of shelf space is the amount of RAM on a server. Likewise, the consumer is a single query, purchased items are n-gram fingerprints, and the consumer’s budget is the amount of latency we are willing to tolerate to do a search. Given this analogy, the database design problem is akin to deciding which items to put on store shelves.
The defining characteristic of the marketplace fingerprinting approach is choice. Rather than trying to find the single best fingerprint design and forcing every query to use the same fingerprint design, we instead offer a variety of fingerprint designs and let each query select the fingerprint designs that are most effective for that particular query. This is analogous to a store offering multiple choices to a consumer and letting the consumer choose the items that provide the most utility given the consumer’s spending budget. This economics approach requires a consideration of both the utility and the cost of a fingerprint, which we describe in the next two paragraphs.
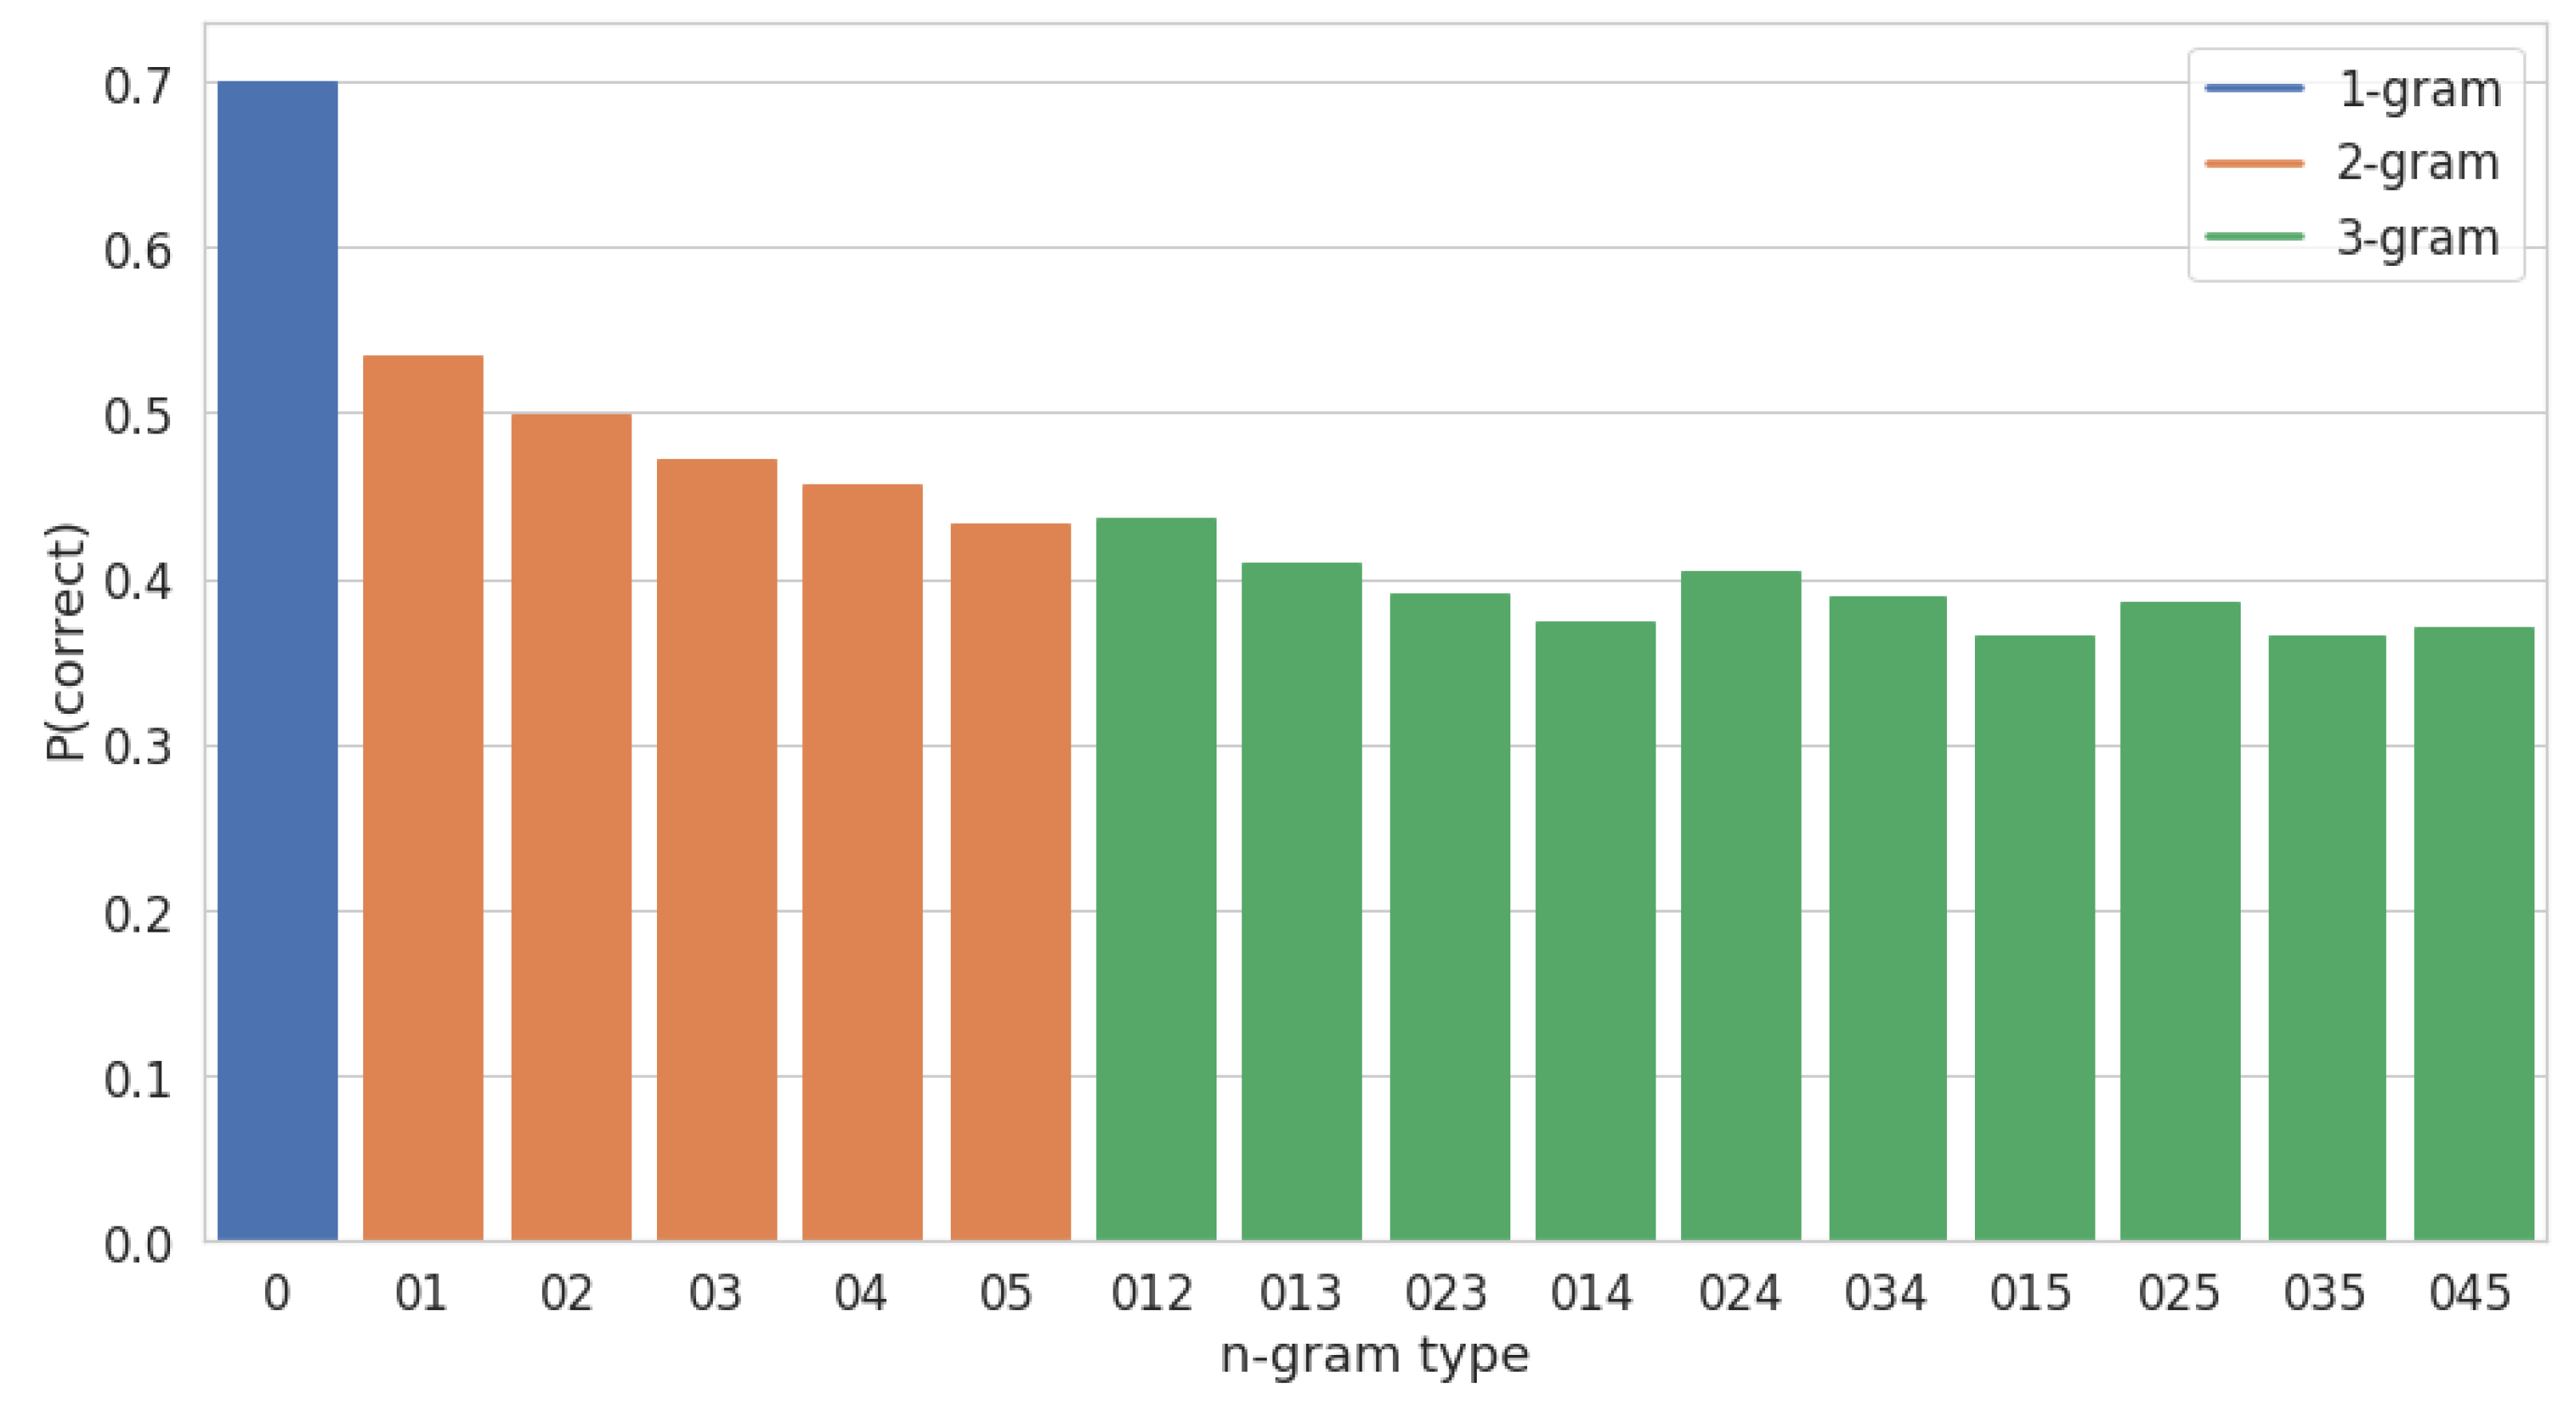
We define a fingerprint’s utility as the probability of a correct lookup. This definition has a very clear probabilistic interpretation. If the fingerprint lookup is correct, it will add 1 point to the score of the true matching item in the database. If fingerprint lookup is incorrect, it will add 0 points to the score of the true matching item in the database. The probability of a correct lookup can therefore be interpreted as the expected number of points that a fingerprint will add to the true matching item in the database. We estimate this probability of correctness based on the training queries in the following way. First, we perform subsequence DTW between each query bootleg score and its true matching reference bootleg score in the IMSLP database. The subsequence DTW provides an (estimated) alignment between each column of the query bootleg score and its matching column in the reference bootleg score. Second, for each element in the estimated subsequence alignment path, we determine if the generalized n-gram of type T at offset i in the query exactly matches the generalized n-gram of type T at offset j in the reference. Third, we aggregate statistics across all training queries to estimate a probability of correctness for each n-gram type T. Figure 3 shows the estimated probability of correctness for all 16 generalized n-gram types on the training data. The numbers on the x-axis indicate the generalized n-gram type (e.g., “02” indicates the 2-gram and “025” indicates the 3-gram ). Unsurprisingly, shorter n-grams and n-grams with smaller context have a higher probability of correctness.
Each fingerprint has two conceptually different types of costs: a memory cost and a runtime cost. The memory cost is the cost to the store and is analogous to the shelf space that an item takes up. We use the number of matches a fingerprint has in the database as a proxy for memory cost because it correlates strongly with the actual amount of memory required to store its occurrences in a reverse index. The runtime cost is the cost to the consumer and is analogous to the price that the consumer pays for an item. We use the number of matches a fingerprint has in the database as a proxy for runtime cost, since processing more matches requires more runtime.
The database design problem has two competing interests: the database’s (i.e., store’s) priorities and the query’s (i.e., consumer’s) priorities. The database prefers items that have a high utility-to-memory-cost ratio. From the database’s perspective, the best fingerprints are very common 1-grams, which have a high probability of correctness (see Figure 3) and low memory overhead. Note that adding a new fingerprint to a reverse index incurs a small amount of memory overhead, and this overhead is minimized proportionally when the fingerprint occurs many times. By selecting fingerprints that occur frequently, it is possible to store more total matches in the database. The query prefers items that have a high utility-to-runtime-cost ratio. From the query’s perspective, the best fingerprints are those that occur very rarely in the database and thus require processing very few database matches. Note that very common 1-grams are a poor tradeoff for the query: they require processing potentially millions of matches in the database in order to add 1 point to the match score of the true matching item. Similarly, very rare 1-grams are a poor tradeoff for the database: they require the maximum (proportional) amount of memory overhead, which limits the total number of matches that can be fit into a fixed amount of memory. The best database design should therefore have fingerprints with a high probability of correctness that are neither extremely common nor extremely rare.
Based on these considerations, we select which fingerprints to include in the database in the following manner. First, we sort all unique fingerprints by their total utility, which we calculate as the utility multiplied by the number of occurrences in the database. The total utility tends to favor shorter n-grams (higher utility) and very common n-grams (more occurrences). Next, we discard any fingerprints that occur more than times. The hyperparameter is determined empirically to remove items that are so expensive that they are never purchased by the consumer and therefore provide no benefit in practice. For example, common 1-grams would require processing millions of matches in the database and will never be selected because of their extremely high cost. Finally, we put the remaining fingerprints into the database in decreasing order of their total utility until we run out of RAM.
The marketplace database is a reverse index of locations of the selected fingerprints. The keys are the fingerprints, which are tuples of integers. The values are a list of all instances where the fingerprint occurs in the database. These instances are specified as a list of (id, offset) tuples, where id identifies the IMSLP PDF and offset indicates where in the bootleg score it occurs. In practice, we implement this as a collection of databases where we we first select the appropriate database based on the n-gram type and then do a lookup in the appropriate database based on the actual n-gram value. In our experiments, the largest database has about 100 million unique fingerprints. These fingerprints have approximately 715 million total matches and take up 120 GB of RAM.
2.4. Image-Image Search
The fourth component (green box in Figure 1) is searching the database at runtime. At an application level, we would like to design the search to maximize retrieval accuracy while staying below a maximum allowable runtime. Accordingly, our search mechanism uses a greedy strategy to maximize utility while remaining under a fixed total budget. We describe the strategy in the consumer-store analogy to provide intuition, and then provide technical details in the next paragraph. The consumer (1) decides on a total budget to spend in the store, (2) divides the total budget by the number of aisles in the store to determine a budget per aisle, (3) rank orders items in each aisle by their utility-to-cost ratio, and then (4) purchases items in each aisle in decreasing order of utility-to-cost ratio until the aisle budget is spent. Any unused funds carry over to the next aisle, and the process repeats for all aisles in the store. This strategy ensures that the consumer never spends more than the total budget, spreads out the spending across all aisles, and approximately maximizes utility in each aisle.
The purchasing strategy described above corresponds to the following steps. We first compute the bootleg score features from a query, where L indicates the number of bootleg score columns in the query. For each offset , we compute 16 generalized n-gram fingerprints. We can denote each fingerprint as , where i indicates the offset and j indicates the n-gram type. Note that each offset corresponds to an aisle and each n-gram type corresponds to a different item. The consumer decides on the total runtime budget (same for all queries) and determines a budget-per-aisle (unique for each query). Note that is the maximum number of database matches we are willing to process for each query, which correlates strongly with runtime. At each offset, the consumer purchases items (i.e., selects fingerprints) in decreasing order of utility-to-cost ratio until the budget-per-aisle has been depleted. Utility-to-cost ratio is calculated as , where indicates the probability of correctness (based only on the n-gram type j) and indicates the number of times occurs in the database. Note that both and can be computed from lookups in an inverted file index without having to actually process a list of matches in the database. Any remaining budget is carried over to the next aisle, and the process is repeated for all offsets . The end result of this purchasing strategy is a list of fingerprints whose matches in the database will be processed.
Match scores are calculated using a histogram of offsets method [42]. First, each selected fingerprint is used to query the inverted file index to retrieve a list of database matches of the form (id, offset), where id specifies the IMSLP PDF and offset indicates the location in the bootleg score where the fingerprint occurs. A histogram is constructed for each IMSLP PDF, and each database match (id, offset) is processed by adding the relative offset (offset) to the histogram for PDF id, where the histograms use a bin size of 10. Note that a sequence of matching fingerprints will result in many matches falling into the same histogram bin, resulting in a peak in the histogram. Therefore, after processing all database matches in the query, we compute a PDF’s match score by the maximum bin count in the histogram. Since there may be multiple PDF versions of a single piece, we compute the piece match score as the maximum PDF score of its constituent PDFs. We then rank all pieces in IMSLP by their piece match score. This ranked list of pieces is the final prediction of the system.
2.5. Cross-Modal Search
The same general approach shown in Figure 1 can be used for cross-modal search. In this subsection, we describe modifications to enable sheet music retrieval based on MIDI queries and audio queries. For audio recordings of piano music, we first convert the audio to MIDI using the Onsets & Frames automatic music transcription (AMT) system [43]. Therefore, in the remainder of this section, we focus on how to enable sheet music retrieval based on a MIDI query. This requires changes to the bootleg score representation and the search mechanism.
The bootleg score representation needs to be modified to handle two types of ambiguities between MIDI and sheet music data. The first type of ambiguity is enharmonic ambiguity. For example, and are enharmonically equivalent but appear in different staff line positions in the sheet music (and therefore different positions in the bootleg score representation). The second type of ambiguity is clef ambiguity. Note that a MIDI note onset does not specify which hand is used to play the note. For high or low notes, the hand can easily be inferred, but it can be unclear which hand should play notes in the middle register. For example, if the left hand played a middle C, there would be a notehead one ledger line above the left hand staff of the bootleg score. If the right hand played it instead, the notehead would appear one ledger line below the right-hand staff. These two types of ambiguity are handled in different ways, which we describe next.
Enharmonic ambiguities are handled by considering two different versions of the bootleg score. The first version is the sharp version, in which all black notes on a piano are interpreted as sharps. For example, the MIDI note 85 would be interpreted as a that appears two ledger lines above the right-hand staff. The second version is the flat version, in which all black notes on a piano are interpreted as flats. In the flat version, the MIDI note 85 would appear as a . Both the sharp and flat versions of the bootleg score can be used to query the database, and the version that achieves a higher match score is used. This approach to handling enharmonic ambiguity was proposed in [27] and adopted here without change.
We experimented with two different ways to handle clef ambiguities. The first is adopted from a previously proposed method, and the second is a novel experimental method.
The first way to handle clef ambiguity is to simply place noteheads at all possible positions in the bootleg score. For example, a MIDI note 60 () would appear in two positions in the bootleg score: one ledger line above the left-hand staff and one ledger line below the right-hand staff. This approach effectively duplicates all noteheads in the bootleg score that appear in the middle register. Note that this requires duplicating the middle register in the MIDI query bootleg score as well as all database sheet music bootleg scores. This way of handling clef ambiguity was first proposed in [27] and has been shown to be effective in enabling cross-modal retrieval.
The second way to handle clef ambiguity is to predict at runtime which MIDI notes appear in the right-hand staff and which appear in the left-hand staff. For each column of the MIDI bootleg score, we first generate a list of candidate bootleg score columns. This list of candidates is generated by considering all left/right hand attribution combinations for notes in the middle register, which we define as notes appearing in the bootleg score between staff positions 18 and 38. For example, if there are N notes in the middle register, there will be candidates. Any notes appearing above position 38 are assumed to be in the right-hand staff, and any notes appearing below position 18 are assumed to be in the left-hand staff. Next, we determine which of the candidates is most likely. We do this by simply treating each candidate as a 1-gram fingerprint, and selecting the candidate that occurs the most times in the database. This process is repeated for each column of the MIDI bootleg score until the entire bootleg score is generated. Note that this method of handling clef ambiguity is done at runtime and does not require changing the bootleg scores in the database.
By incorporating the above changes to handle enharmonic and clef ambiguities, the marketplace system described in Section 2.1, Section 2.2, Section 2.3 and Section 2.4 can be easily adapted to handle cross-modal retrieval.
3. Results
In this section, we describe our experimental setup (Section 3.1) and present experimental results on the four sheet music retrieval tasks: camera-based sheet music retrieval (Section 3.2), scan-based sheet music retrieval (Section 3.3), MIDI-based sheet music retrieval (Section 3.4), and audio-based sheet music retrieval (Section 3.5).
3.1. Experimental Setup
We perform experiments on four different retrieval tasks. Below, we describe the data used in our experiments and the evaluation methodology.
All four tasks use the same searchable database. The database consists of all solo piano sheet music in IMSLP. The database has 31,384 PDFs, 29,310 unique pieces, and 374,758 sheet music pages. This is the same database as [28].
The first retrieval task uses cell phone pictures of physical sheet music as queries. We use the Sheet-MIDI Retrieval dataset [26]. This dataset contains 2000 different cell-phone images from 25 different composers and 200 different piano pieces. The cell phone images are taken of physical pages of piano sheet music placed in various locations. There are 40 train and 160 test pieces. The dataset includes 10 images per piece, resulting in 400 train queries and 1600 test queries. We use the same train/test split as in [33].
The second retrieval task uses scanned sheet music images as queries. This dataset is generated from the corresponding PDFs from the Sheet-MIDI Retrieval dataset. Each PDF page is converted to an image and used as a query. The PDFs are converted to PNG files at 300 dpi and resized so that the width of the image is 2550 pixels. The train queries consist of 217 single page scans from the 40 train pieces, and the test queries consist of 863 single page scans from the 160 test pieces.
The third retrieval task uses MIDI files as queries. The data is taken from the MAESTRO dataset [44]. This dataset consists of audio and MIDI pairs. The audio files are recordings from a piano competition where the pianos were equipped to record MIDI note events. For each (audio, MIDI) pair, we manually found the matching piece in the IMSLP dataset. There are a total of 1276 MIDI files, and we use (256) of the MIDI files for training and (1020) for testing. From each MIDI file, we take random samples of duration L seconds. We consider . The end result is a collection of 6 datasets, one for each value of L.
The fourth retrieval task uses audio recordings as queries. The audio dataset is also taken from the MAESTRO dataset and is prepared similarly to the MIDI data. There are a total of 1276 audio files, and we use (256) of the audio files for training and (1020) for testing. From each audio file, we take samples of duration L seconds. We consider .
All tasks are evaluated along two different axes: retrieval accuracy and runtime. Each query matches a single unique piece in the IMSLP database. Therefore, we evaluate retrieval accuracy using mean reciprocal rank (MRR). The MRR is calculated as , where indicates the rank of the true matching item for the query and N indicates the total number of queries. We also measure the runtime required to process each query and report the average and standard deviation of query runtimes.
3.2. Camera-Based Sheet Music Retrieval
We compare the results of seven different systems. The first five systems use fixed n-gram fingerprints based on bootleg score features. This approach comes from [27], which proposes using each column of a bootleg score representation as a fingerprint (i.e., a fixed 1-gram), and we also include the straightforward generalization of this strategy to 2-grams, 3-grams, 4-grams, and 5-grams. The sixth system uses dynamic n-gram fingerprints [28,33] based on bootleg score features, which is the current state of the art for sheet music retrieval. In the dynamic n-gram approach, the database contains multiple types of fixed n-gram fingerprints (e.g., 1-grams, 2-grams, 3-grams, and 4-grams), and at runtime, the size of each individual n-gram (query) fingerprint is selected dynamically to ensure that the fingerprint is sufficiently discriminative to warrant a table lookup. The seventh system is our proposed marketplace fingerprinting system.
Table 1 shows results on the camera-based sheet music retrieval task. To gain further insight, we evaluate performance under two different conditions. Condition 1 is when the original PDF (that the cell phone image is taken of) exists in the database. Condition 2 is when the original PDF is not in the database but an alternate edition of the same piece exists in the database. We can simulate the second condition by simply removing the exact matching PDF from the database. This means that queries for which there is only a single PDF available in IMSLP are removed from the test set under condition 2. For experiments under the second condition, there are a total of 370 train queries and 1560 test queries. Note that each row of the table corresponds to a single experiment, and the MRRs for the two conditions are determined in the evaluation phase.
There are three things to notice about Table 1. First, the marketplace system substantially outperforms all other systems in retrieval accuracy. For example, the marketplace approach achieves and MRR under conditions 1 and 2, respectively, while the dynamic n-gram approach achieves and MRR. Second, the marketplace system has the lowest average runtime of all systems. The benefit of the marketplace approach is not simply a tradeoff between runtime and retrieval accuracy: it significantly improves retrieval accuracy while simultaneously reducing or maintaining average runtime. It is therefore a unilaterally better solution than the dynamic n-gram approach. Third, there is a small decrease in MRR if we remove the original PDF from the database (Condition 2). This indicates that the system is relatively insensitive to differences in various printed editions.
3.3. Scan-Based Sheet Music Retrieval
The baseline systems for scan-based sheet music retrieval are the same as those for the camera-based task. The only modification to the systems is that the bootleg score feature extraction uses slightly different hyperparameters to account for the differences between cell-phone pictures and scanned images. All systems share the same (modified) set of hyperparameters.
Table 2 shows the results on the scan-based sheet music retrieval task. There are three things to notice. First, the marketplace system unilaterally outperforms all other systems in both retrieval accuracy and runtime. For example, the marketplace approach achieves MRR with an average runtime of seconds, while the dynamic n-gram approach achieves MRR with an average runtime of s. Second, all systems show substantial improvement in retrieval accuracy compared to the camera-based retrieval task (Table 1). This performance gap can be interpreted as the detrimental effect of non-ideal perspective and lighting conditions when using cell phone images. Third, there is a small decrease in MRR if we remove the original PDF from the database (Condition 2). Overall, we see the same trends and patterns for scan-based and cell-phone-based sheet music retrieval tasks.
3.4. MIDI-Based Sheet Music Retrieval
The baseline systems for MIDI-based sheet music retrieval are the same as those for the previous two tasks. However, there are two modifications to the baseline systems that are needed to bridge the modality gap between MIDI and sheet music. The first modification is to handle enharmonic ambiguities for black notes on a piano. We handle this ambiguity by generating both sharp and flat versions of the MIDI bootleg score (as described in Section 2.5, paragraph 3), using both bootleg scores to search the database, and keeping the one with the higher match score. The second modification is to handle ambiguity about whether a MIDI note in the middle register appears in the left- or right-hand staff. We handle this ambiguity by placing all notes in the middle register in both the right and left-hand staves in the bootleg score (as described in Section 2.5, paragraph 5). By applying this change to both the database bootleg scores and the query bootleg score, this ambiguity can be resolved. The two modifications described above were used in [27,28] to enable cross-modal search between MIDI and sheet music images.
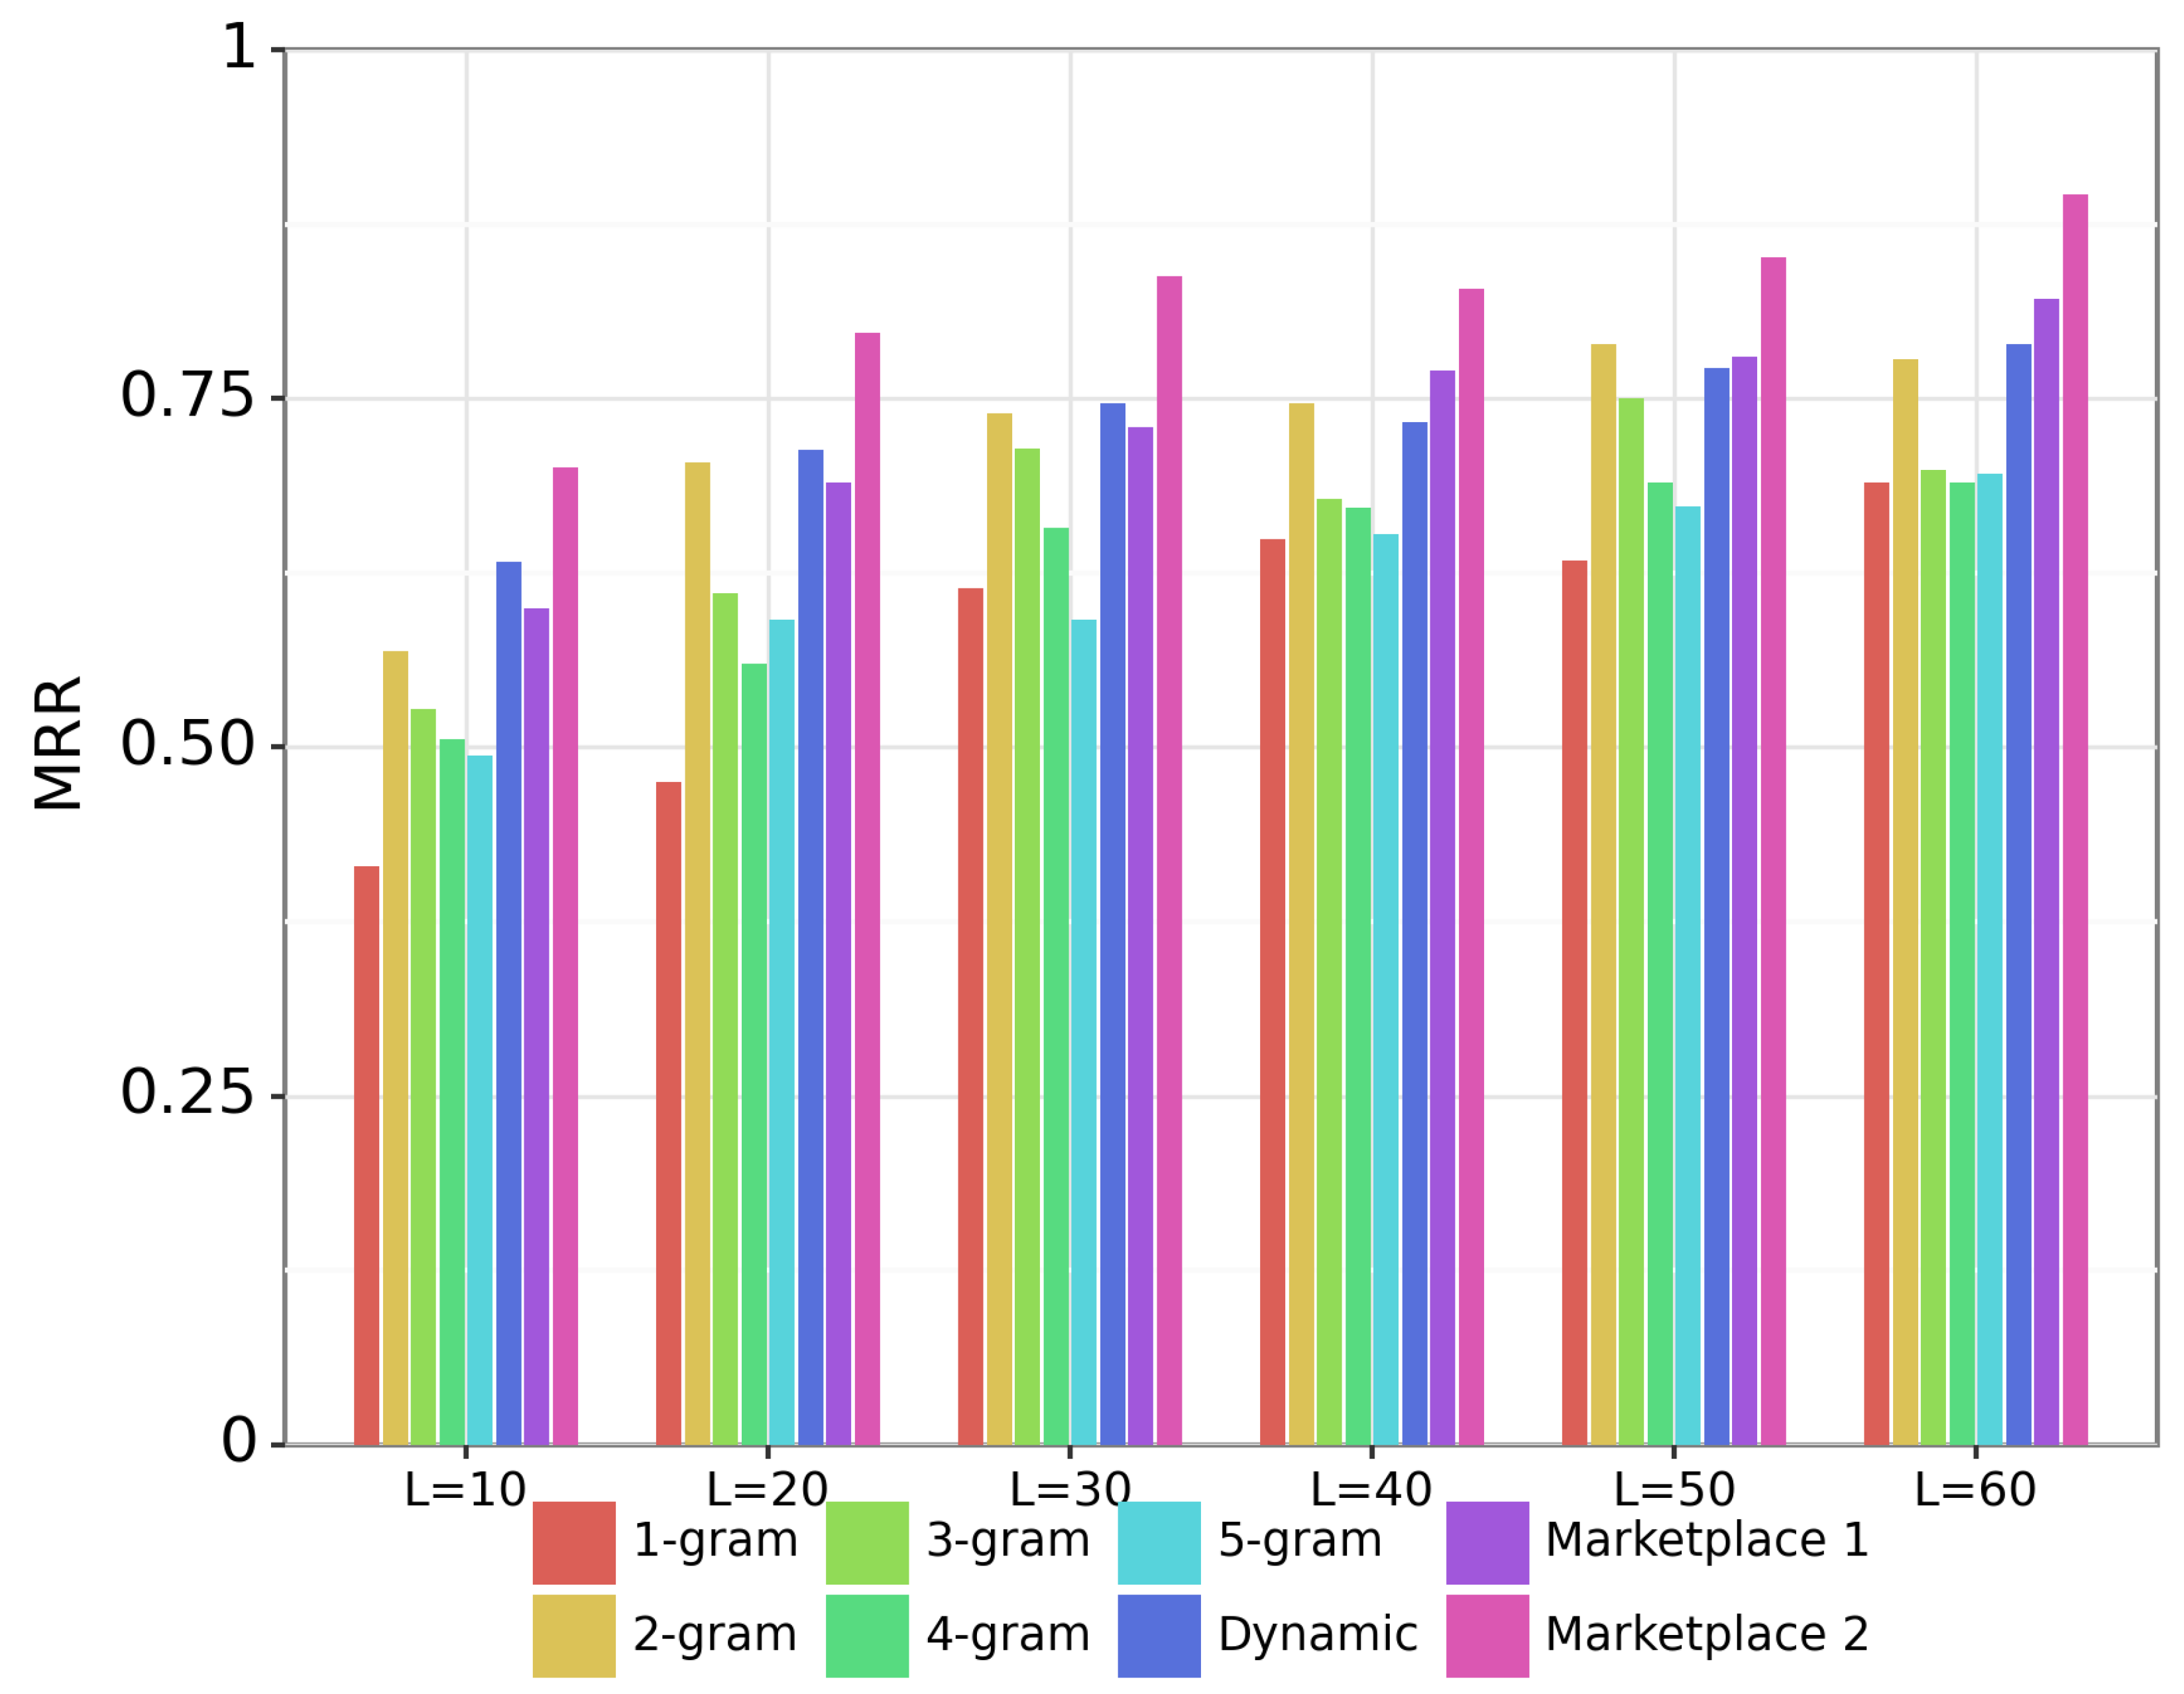
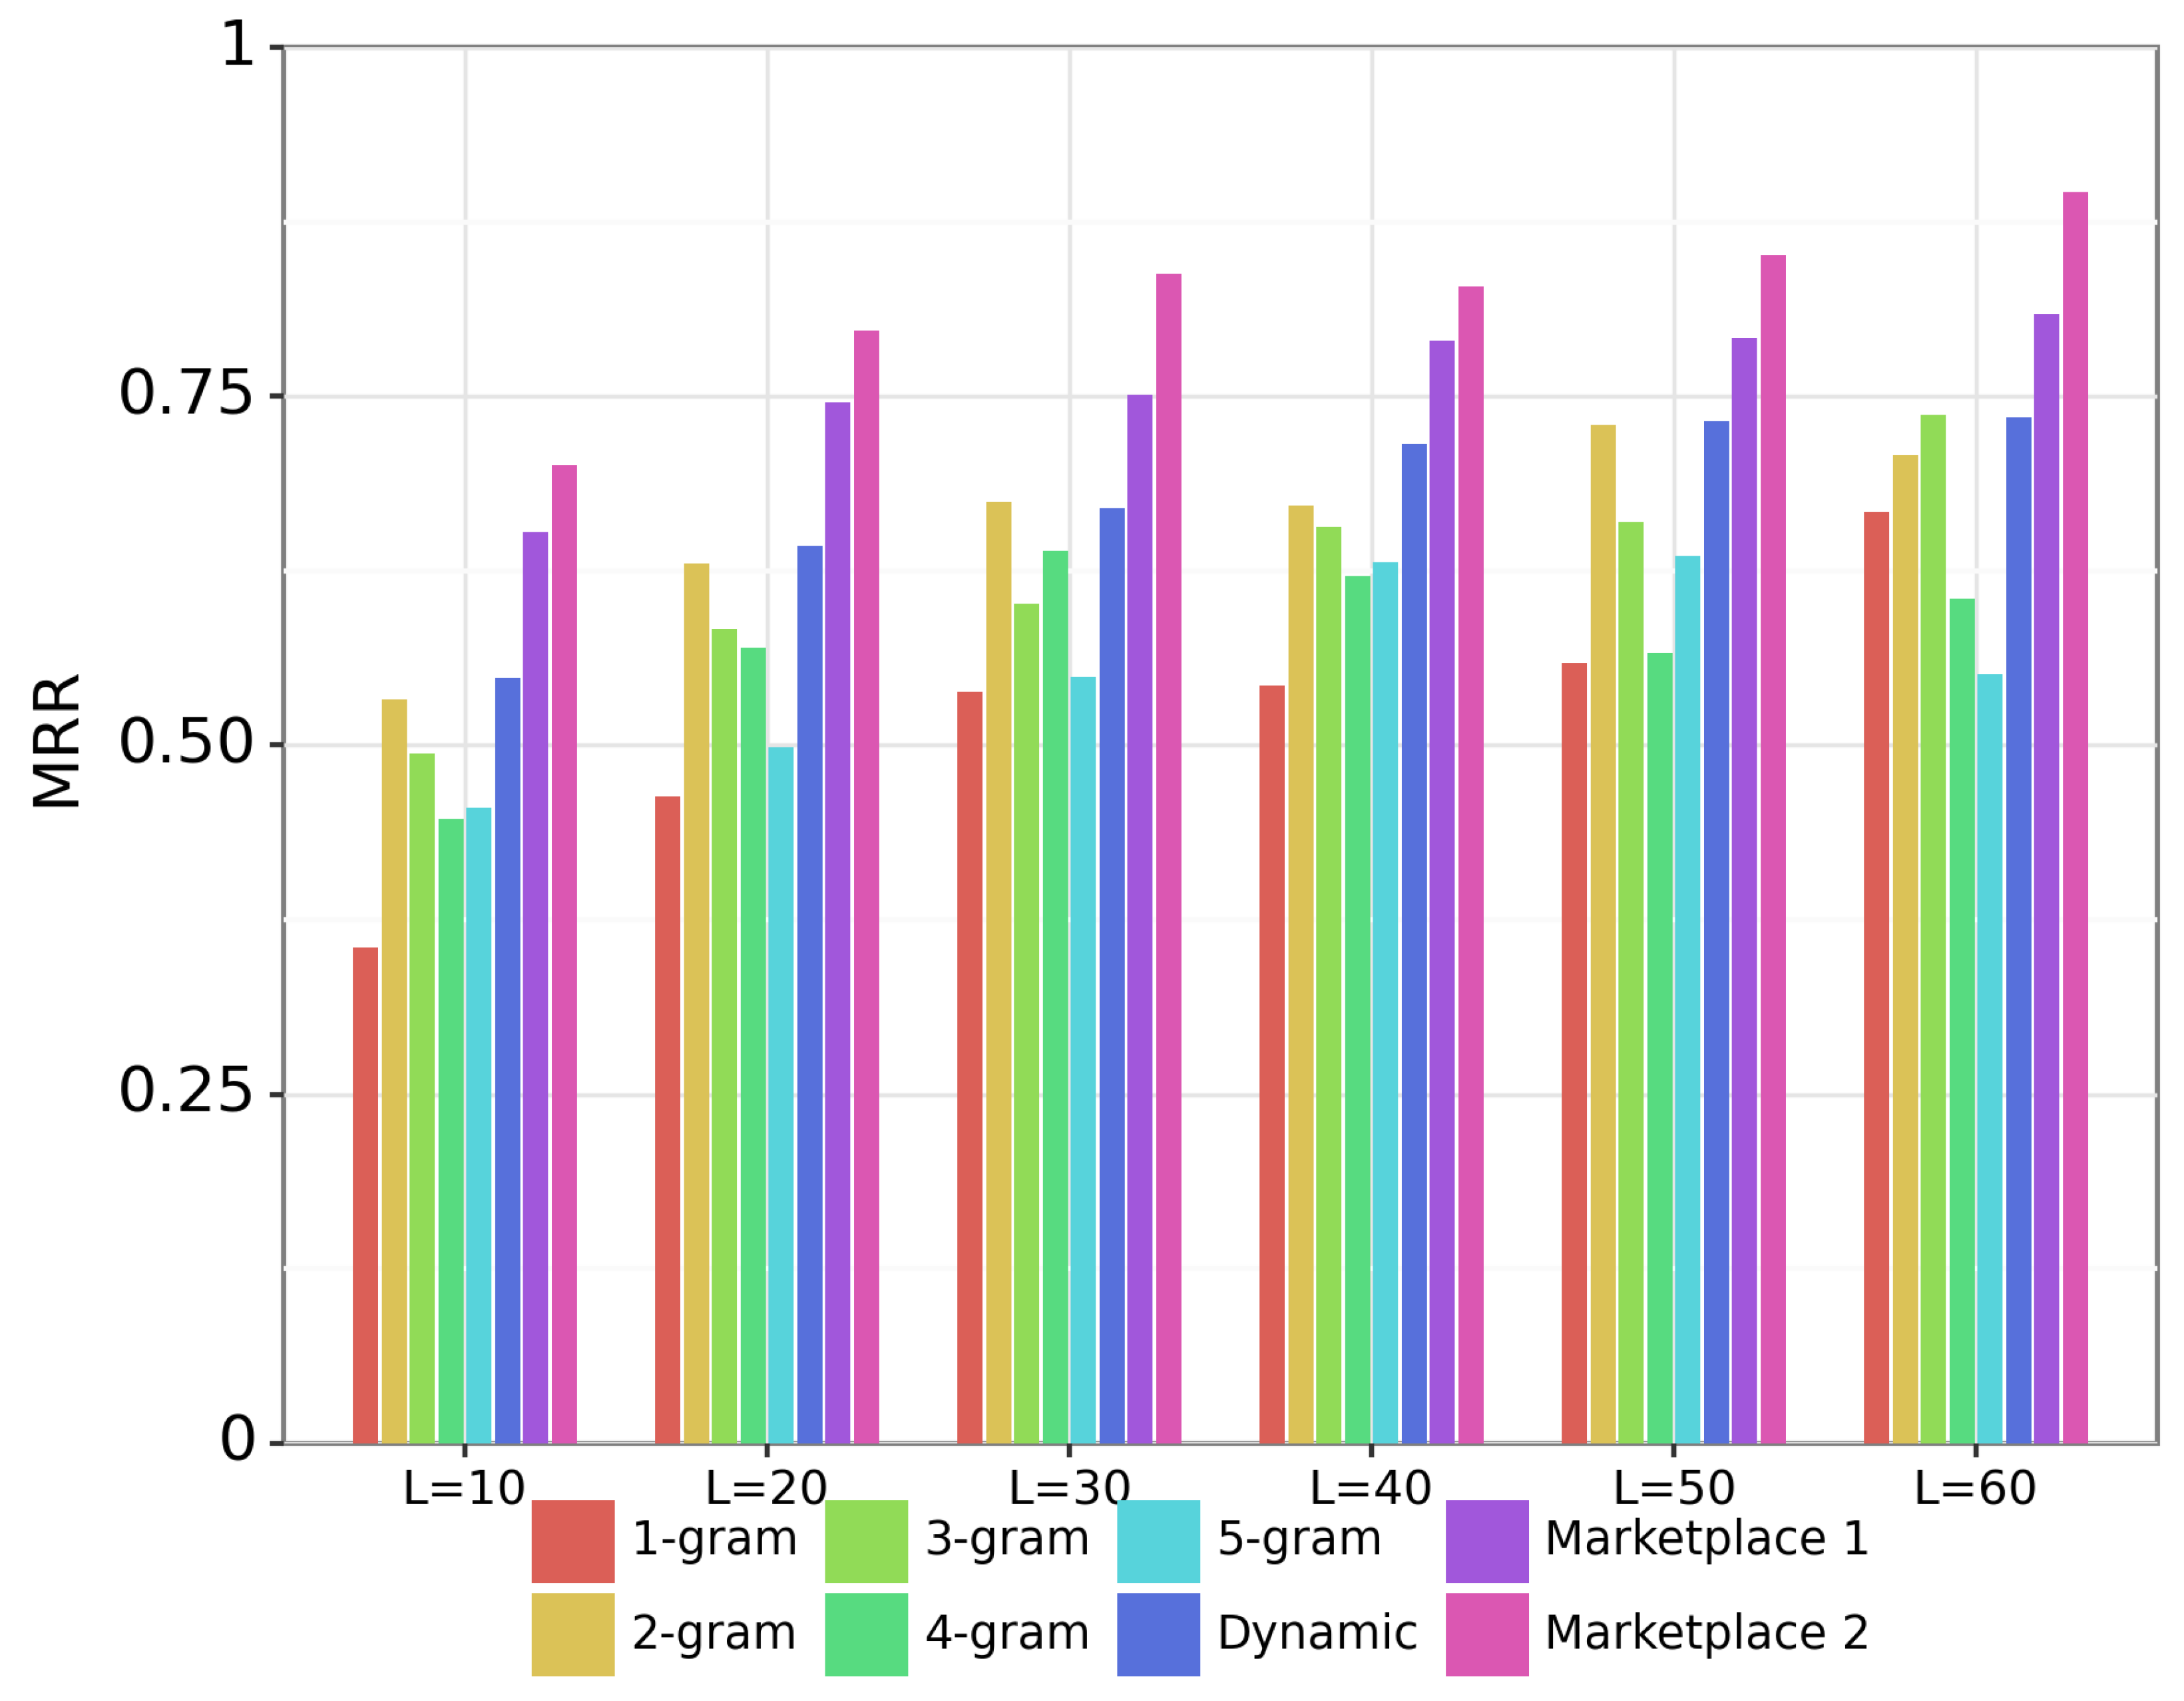
Figure 4 shows results on the MIDI-based sheet music retrieval task. The different groups of bars show the performance with queries of different duration. For example, the group indicates the retrieval accuracy with MIDI queries that are 30 s long. The individual bars within each group show the performance of different systems. For deeper insight, we evaluate the marketplace approach with two different feature representations. The purple bar (“Marketplace 1”) represents the marketplace system that uses bootleg score features with a duplicated middle register, as described in the previous paragraph. The pink bar (“Marketplace 2”) represents the marketplace system using the experimental feature representation described in paragraph 6 of Section 2.5, which involves predicting the clef of middle register notes. The gap between the purple and pink bars provides insight into how important the cross-modal feature representation is to the effectiveness of the marketplace approach.
There are three things to notice about Figure 4. First, the proposed marketplace system (pink) substantially outperforms all others systems by a wide margin. For example, for s queries, the marketplace approach achieves MRR, while the dynamic n-gram approach achieves MRR. Second, longer duration queries yield steady improvement in retrieval accuracy across all systems. While it is no surprise that longer queries have better performance, it is useful to note that none of the systems have reached asymptotic performance up to s queries but continue to show improvement as query length increases. Third, the proposed cross-modal feature representation is critical to the strong performance of the marketplace fingerprinting approach. When the marketplace approach is used with a bootleg score representation with duplicated middle notes (purple), the performance is on par with the dynamic n-gram fingerprinting approach (dark blue). But when MIDI notes in the middle register are assigned to the left- or right-hand clefs, the marketplace approach (pink) shows substantially better performance than the dynamic n-gram approach. We might expect that this novel cross-modal feature representation would also improve performance if used with the dynamic n-gram or fixed n-gram approaches.
3.5. Audio-Based Sheet Music Retrieval
The baseline systems for audio-based sheet music retrieval are the same as those for the MIDI-based task. The only difference is that the audio queries are first preprocessed with the Onsets & Frames automatic music transcription system [43], which converts the audio query into a MIDI query. The MIDI query is then processed by the system exactly as before.
Figure 5 shows results on the audio-based sheet music retrieval task. Each of the groups of bars represent the performance with queries of different duration. Within each group, the individual bars show the performance of the baseline systems and the proposed marketplace approach. As before, we show the performance of the marketplace approach with two different feature representations: a bootleg score with duplicated notes in the middle register (“Marketplace 1”) and a bootleg score where notes in the middle register are classified into left- and right-hand staves (“Marketplace 2”).
Figure 5 shows the same trends as in Figure 4. The proposed marketplace approach (“Marketplace 2”) outperforms all other systems by a substantial margin. Longer query durations up to s show steady improvement in retrieval accuracy. The cross-modal feature representation is again critical to the strong performance of the marketplace approach. Additionally, we observe a slight but consistent decrease in MRRs with audio queries compared to MIDI queries. This accuracy decrease is due to errors in the automatic music transcription preprocessing.
4. Discussion
In this section, we conduct five different analyses to gain a deeper understanding of the proposed system.
4.1. Effect of Runtime Budget
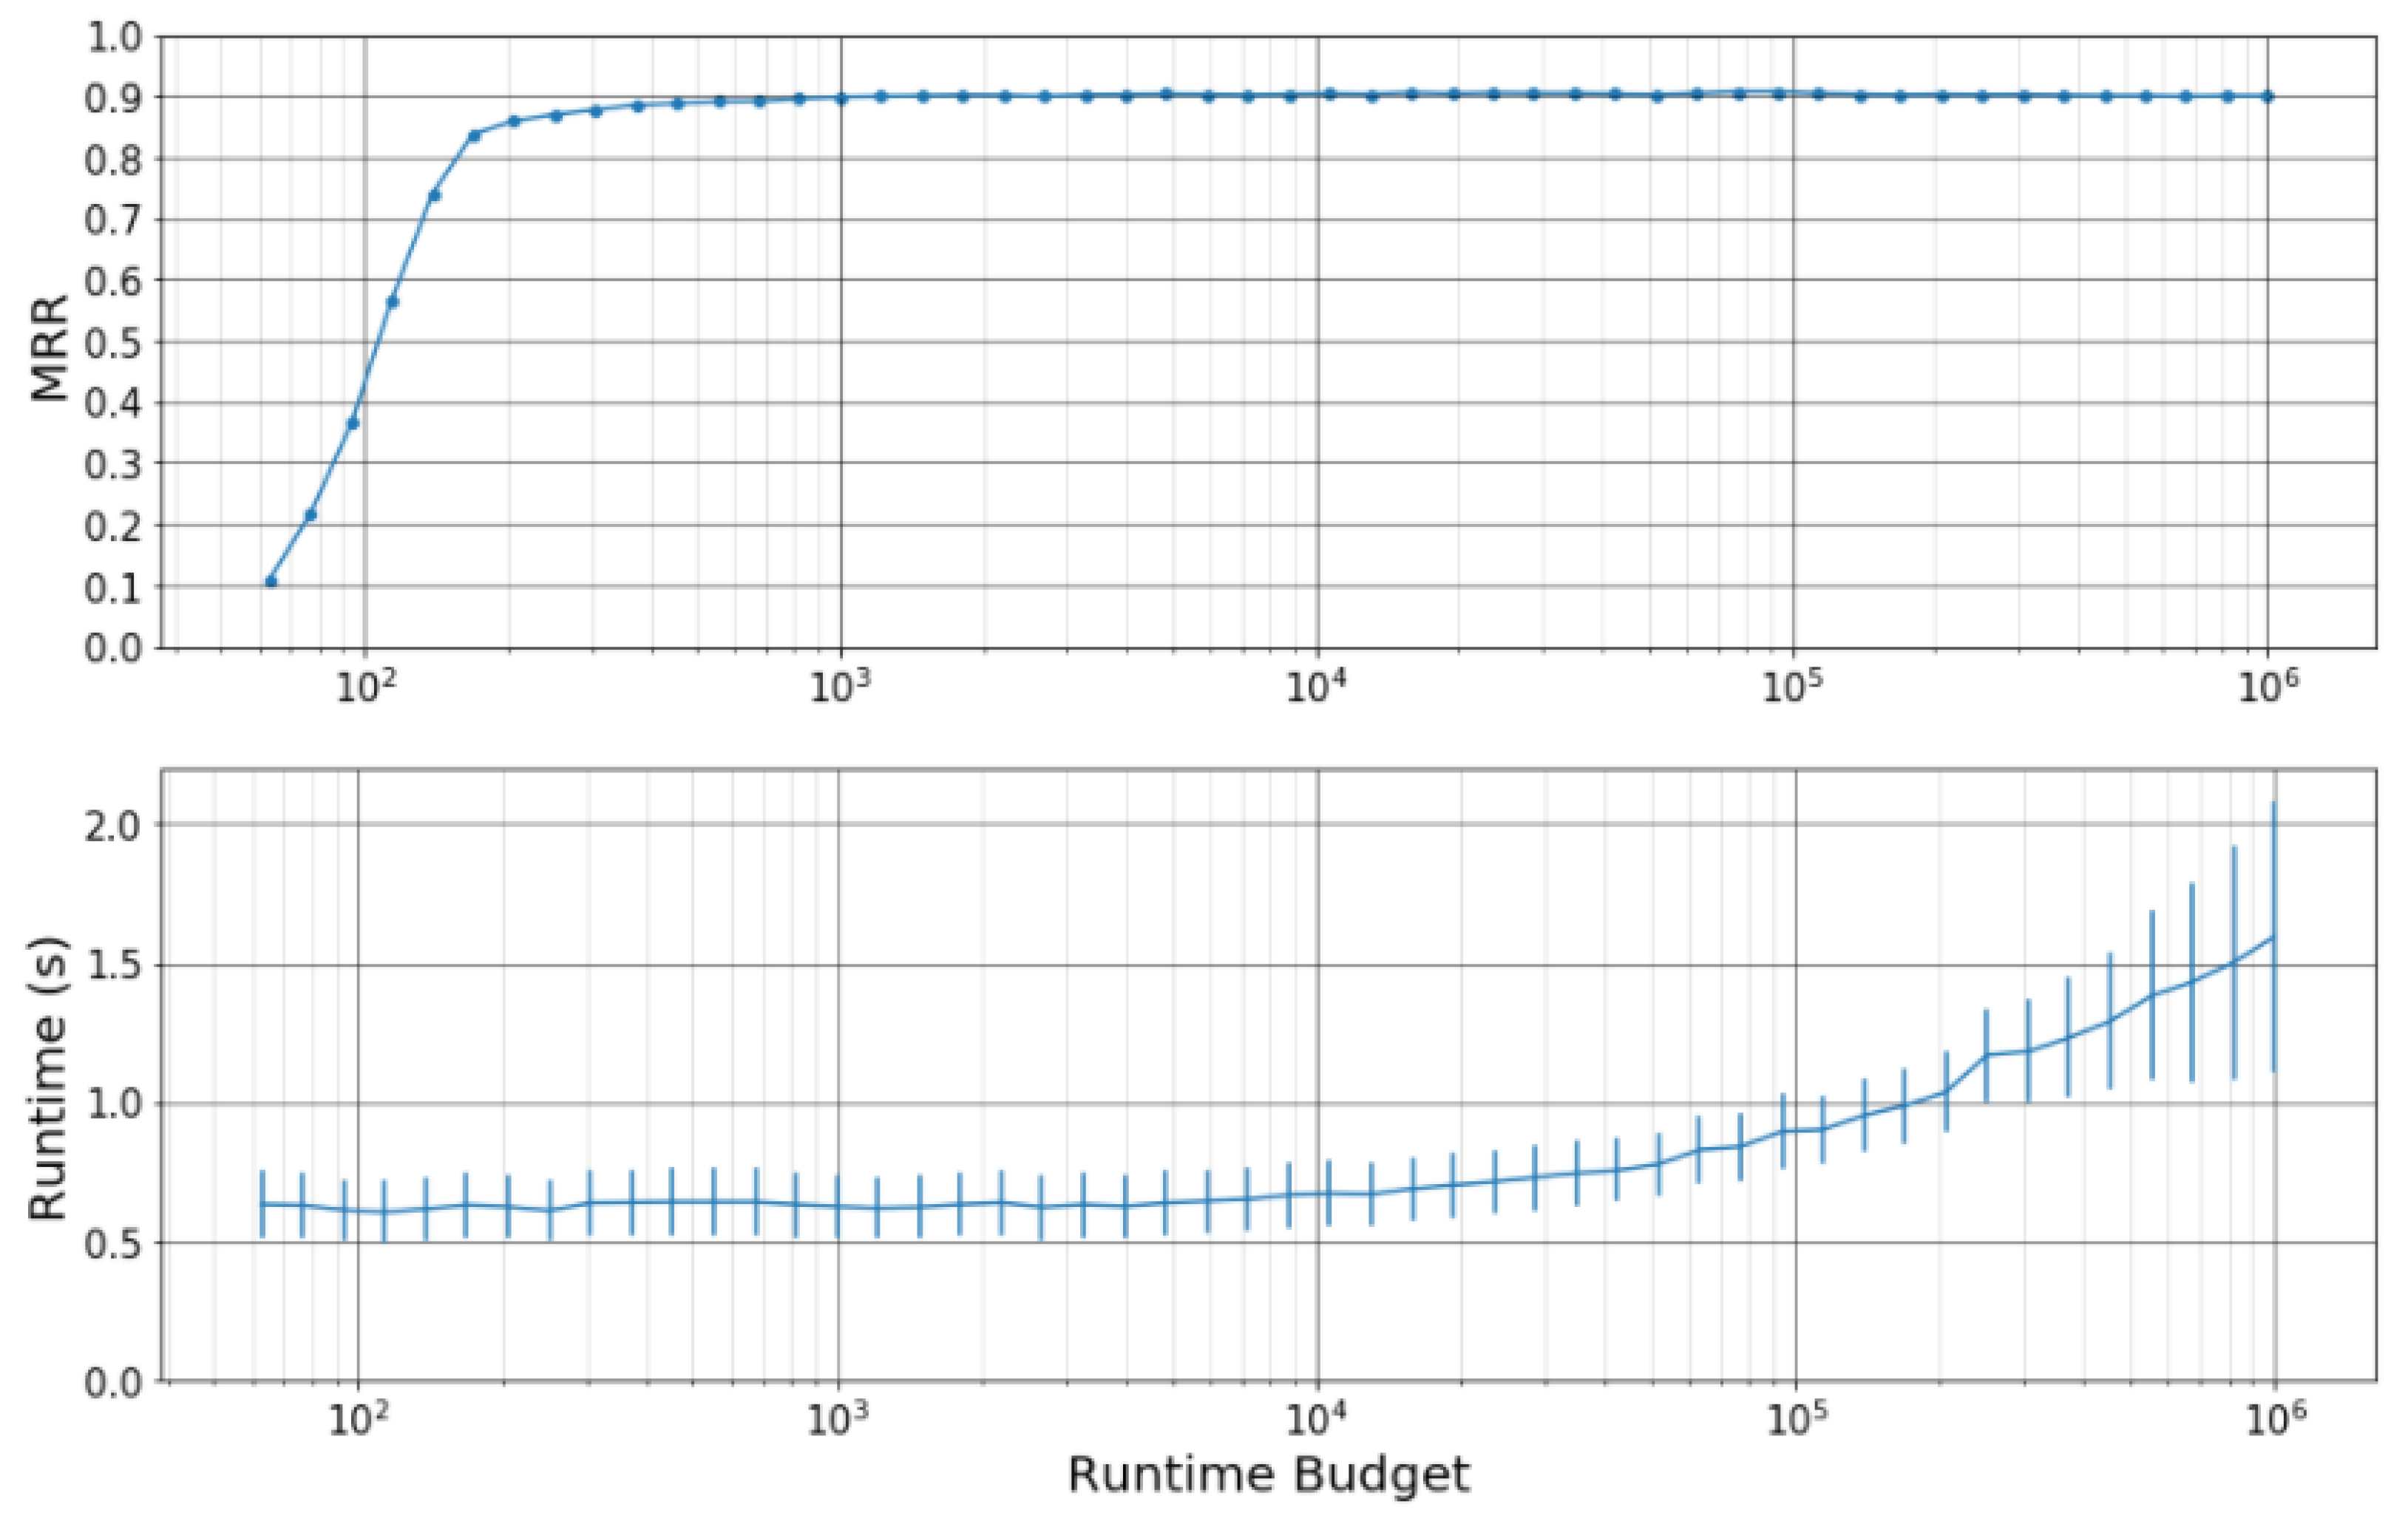
The first analysis is to understand the effect of the runtime budget. Figure 6 shows the effect of runtime budget on retrieval accuracy (top) and average runtime (bottom) for the camera-based retrieval task. Each point shows the retrieval accuracy and average runtime on the test set with a selected runtime budget, where we considered runtime budgets ranging from 63 to . The lower plot shows the average and standard deviation of the query runtimes. Note that the x-axis is on a log scale.
There are a few things to notice about Figure 6. First, the retrieval accuracy increases substantially until runtime budget reaches 1000, at which point the MRR plateaus at roughly . It is quite surprising how small the runtime budget is when performance plateaus. For reference, the dynamic n-gram system described in [33] allows for up to 10,000 matches per fingerprint, meaning that the entire budget would likely be used up after a single fingerprint lookup! This suggests that the system is finding fingerprints that are very discriminative and whose database matches require very little runtime to process. Second, the average runtime grows with the runtime budget, but remains at roughly s until a runtime budget of 5000. Combining the above two observations, we see that the runtime budget that achieves optimal speed and accuracy is between 1000 and 5000.
The biggest takeaway from our first analysis is this: it is not necessary to process a lot of database matches in order to achieve high retrieval accuracy. We do not see an active tradeoff between retrieval accuracy and runtime. Instead, there is a broad range of runtime budgets that achieve approximately optimal retrieval accuracy and runtime.
4.2. Effect of Database Size
The second analysis is to understand the effect of database size. We measured the performance of the marketplace approach with varying database sizes. For a given maximum database size (e.g., 64 GB of RAM), we fit as many generalized n-gram fingerprints as possible in the marketplace database. We also compare performance with the dynamic n-gram approach with varying database sizes. For a given maximum database size, we fit as many types of fixed n-grams as possible. For example, the 1-gram and 2-gram databases require GB and GB, respectively, so a server with 16 GB of RAM would allow for 1-grams only and a server with 32 GB would allow for both 1-grams and 2-grams.
Table 3 compares the performance of the marketplace and dynamic n-gram approaches with varying database size. Each row of the table corresponds to a different maximum database size. There are three things to notice about Table 3. First, the dynamic n-gram system does not show improvement in retrieval accuracy beyond including 2-grams. For example, the MRR of the dynamic n-gram approach only changes from to as memory increases from 32 GB (up to 2-grams) to 128 GB (up to 4-grams). Second, the marketplace system has a higher MRR than the dynamic n-gram system at every database size. This indicates that the marketplace approach is unilaterally better than the dynamic n-gram approach, regardless of the amount of memory available. Third, both systems have achieved approximately asymptotic retrieval accuracy at 128 GB. This suggests that having more RAM will not yield higher MRRs on the given test set.
4.3. Database Coverage
The third analysis is to characterize how well the fingerprint database covers the IMSLP dataset. A single column in a bootleg score is considered “covered” if there is at least one n-gram fingerprint in the database anchored at that position. Coverage for a single PDF file is defined as the proportion of covered positions in the corresponding bootleg score. Each curve in Figure 7 shows the coverage for all piano PDF files in IMSLP, where the PDFs are sorted from lowest coverage (left) to highest coverage (right). There are five curves corresponding to five different systems: the marketplace system with 128 GB RAM (solid green), 64 GB RAM (dashed green), and 32 GB RAM (dotted green), as well as the full dynamic n-gram system with 128 GB RAM under two different settings of its system hyperparameter (solid blue and dashed blue). The figure excludes PDFs in IMSLP that had no bootleg score information. Note that the x-axis is on a log scale.
There are two things to notice about Figure 7. First, the marketplace database with 128 GB RAM has much better coverage than the dynamic n-gram system. This can be seen from the fact that the solid green curve is well above the solid blue curve across the entire x-axis range. This does not necessarily mean that every single PDF has better coverage under the marketplace system (since the two curves have different orderings of the PDFs), but it does suggest that the marketplace system generally improves coverage across the entire database and not just on a select subset of pieces. Second, we notice that having more memory does lead to substantially better coverage, particularly of poorly represented parts of the database. This can be seen from the fact that the three green curves have substantial separation between them, with the separation being largest at the leftmost part of the curve and smallest at the rightmost part of the curve. This suggests that having more memory improves coverage the most for PDFs with the lowest coverage. Based on these observations, we would expect the marketplace system to show improved retrieval accuracy on more diverse test sets as database size increases.
4.4. Number of Fingerprint Lookups
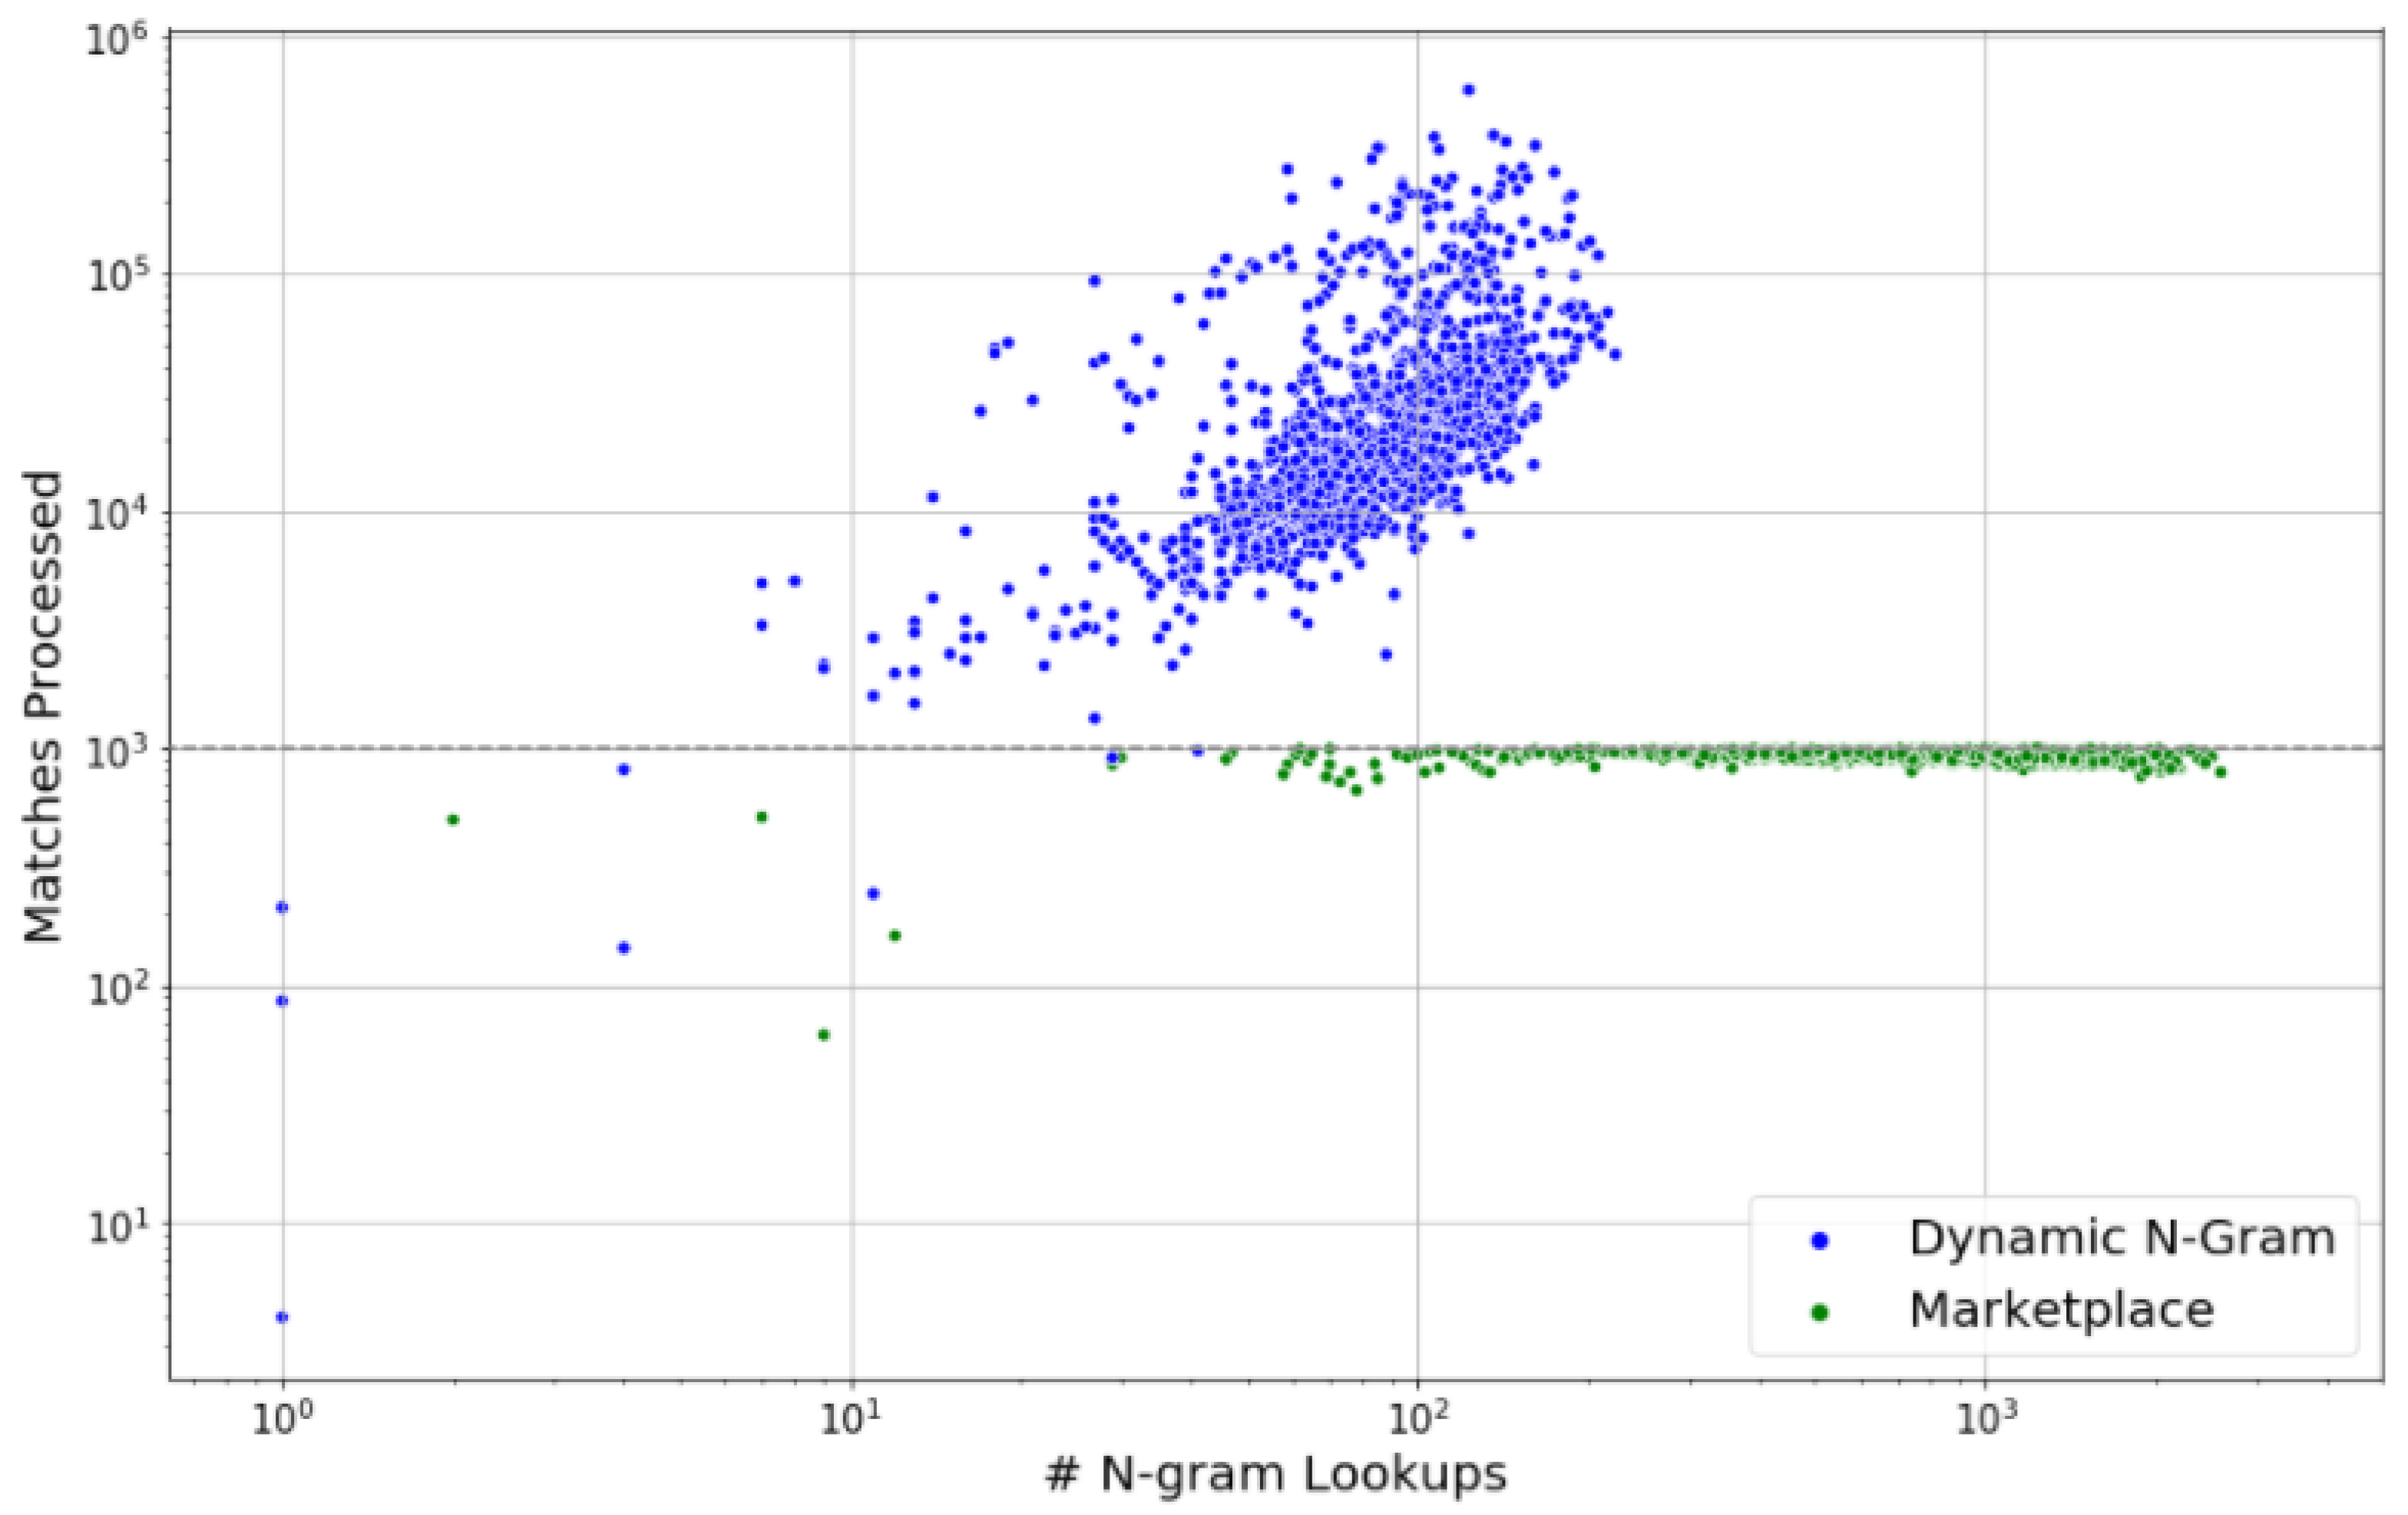
The fourth analysis is to visualize the differences in fingerprint lookup strategy between the marketplace and dynamic n-gram approaches. Here, a fingerprint lookup corresponds to querying the database in order to retrieve a list of matches for a single n-gram fingerprint. Each point in Figure 8 indicates the number of fingerprint lookups (x-axis) and the total number of database matches processed (y-axis) for a single query in the test set. The green points correspond to the marketplace system, and the blue points correspond to the dynamic n-gram system. The dashed black horizontal line indicates the runtime budget used in the marketplace system.
Figure 8 highlights the difference in fingerprint lookup strategy between the marketplace and dynamic n-gram approaches. The dynamic n-gram system has a small number of fingerprint lookups (<200) but a very wide range of matches processed (from hundreds to hundreds of thousands). The marketplace system is the exact opposite: it has a wide range in the number of fingerprint lookups for each query (up to thousands of lookups), but it has a very small and consistent range of total matches processed due to its disciplined spending strategy (always less than 1000). The latter is far more desirable, since it means that the system will have a consistent runtime regardless of how short or long the query bootleg score is.
4.5. Distribution of Fingerprint Frequency
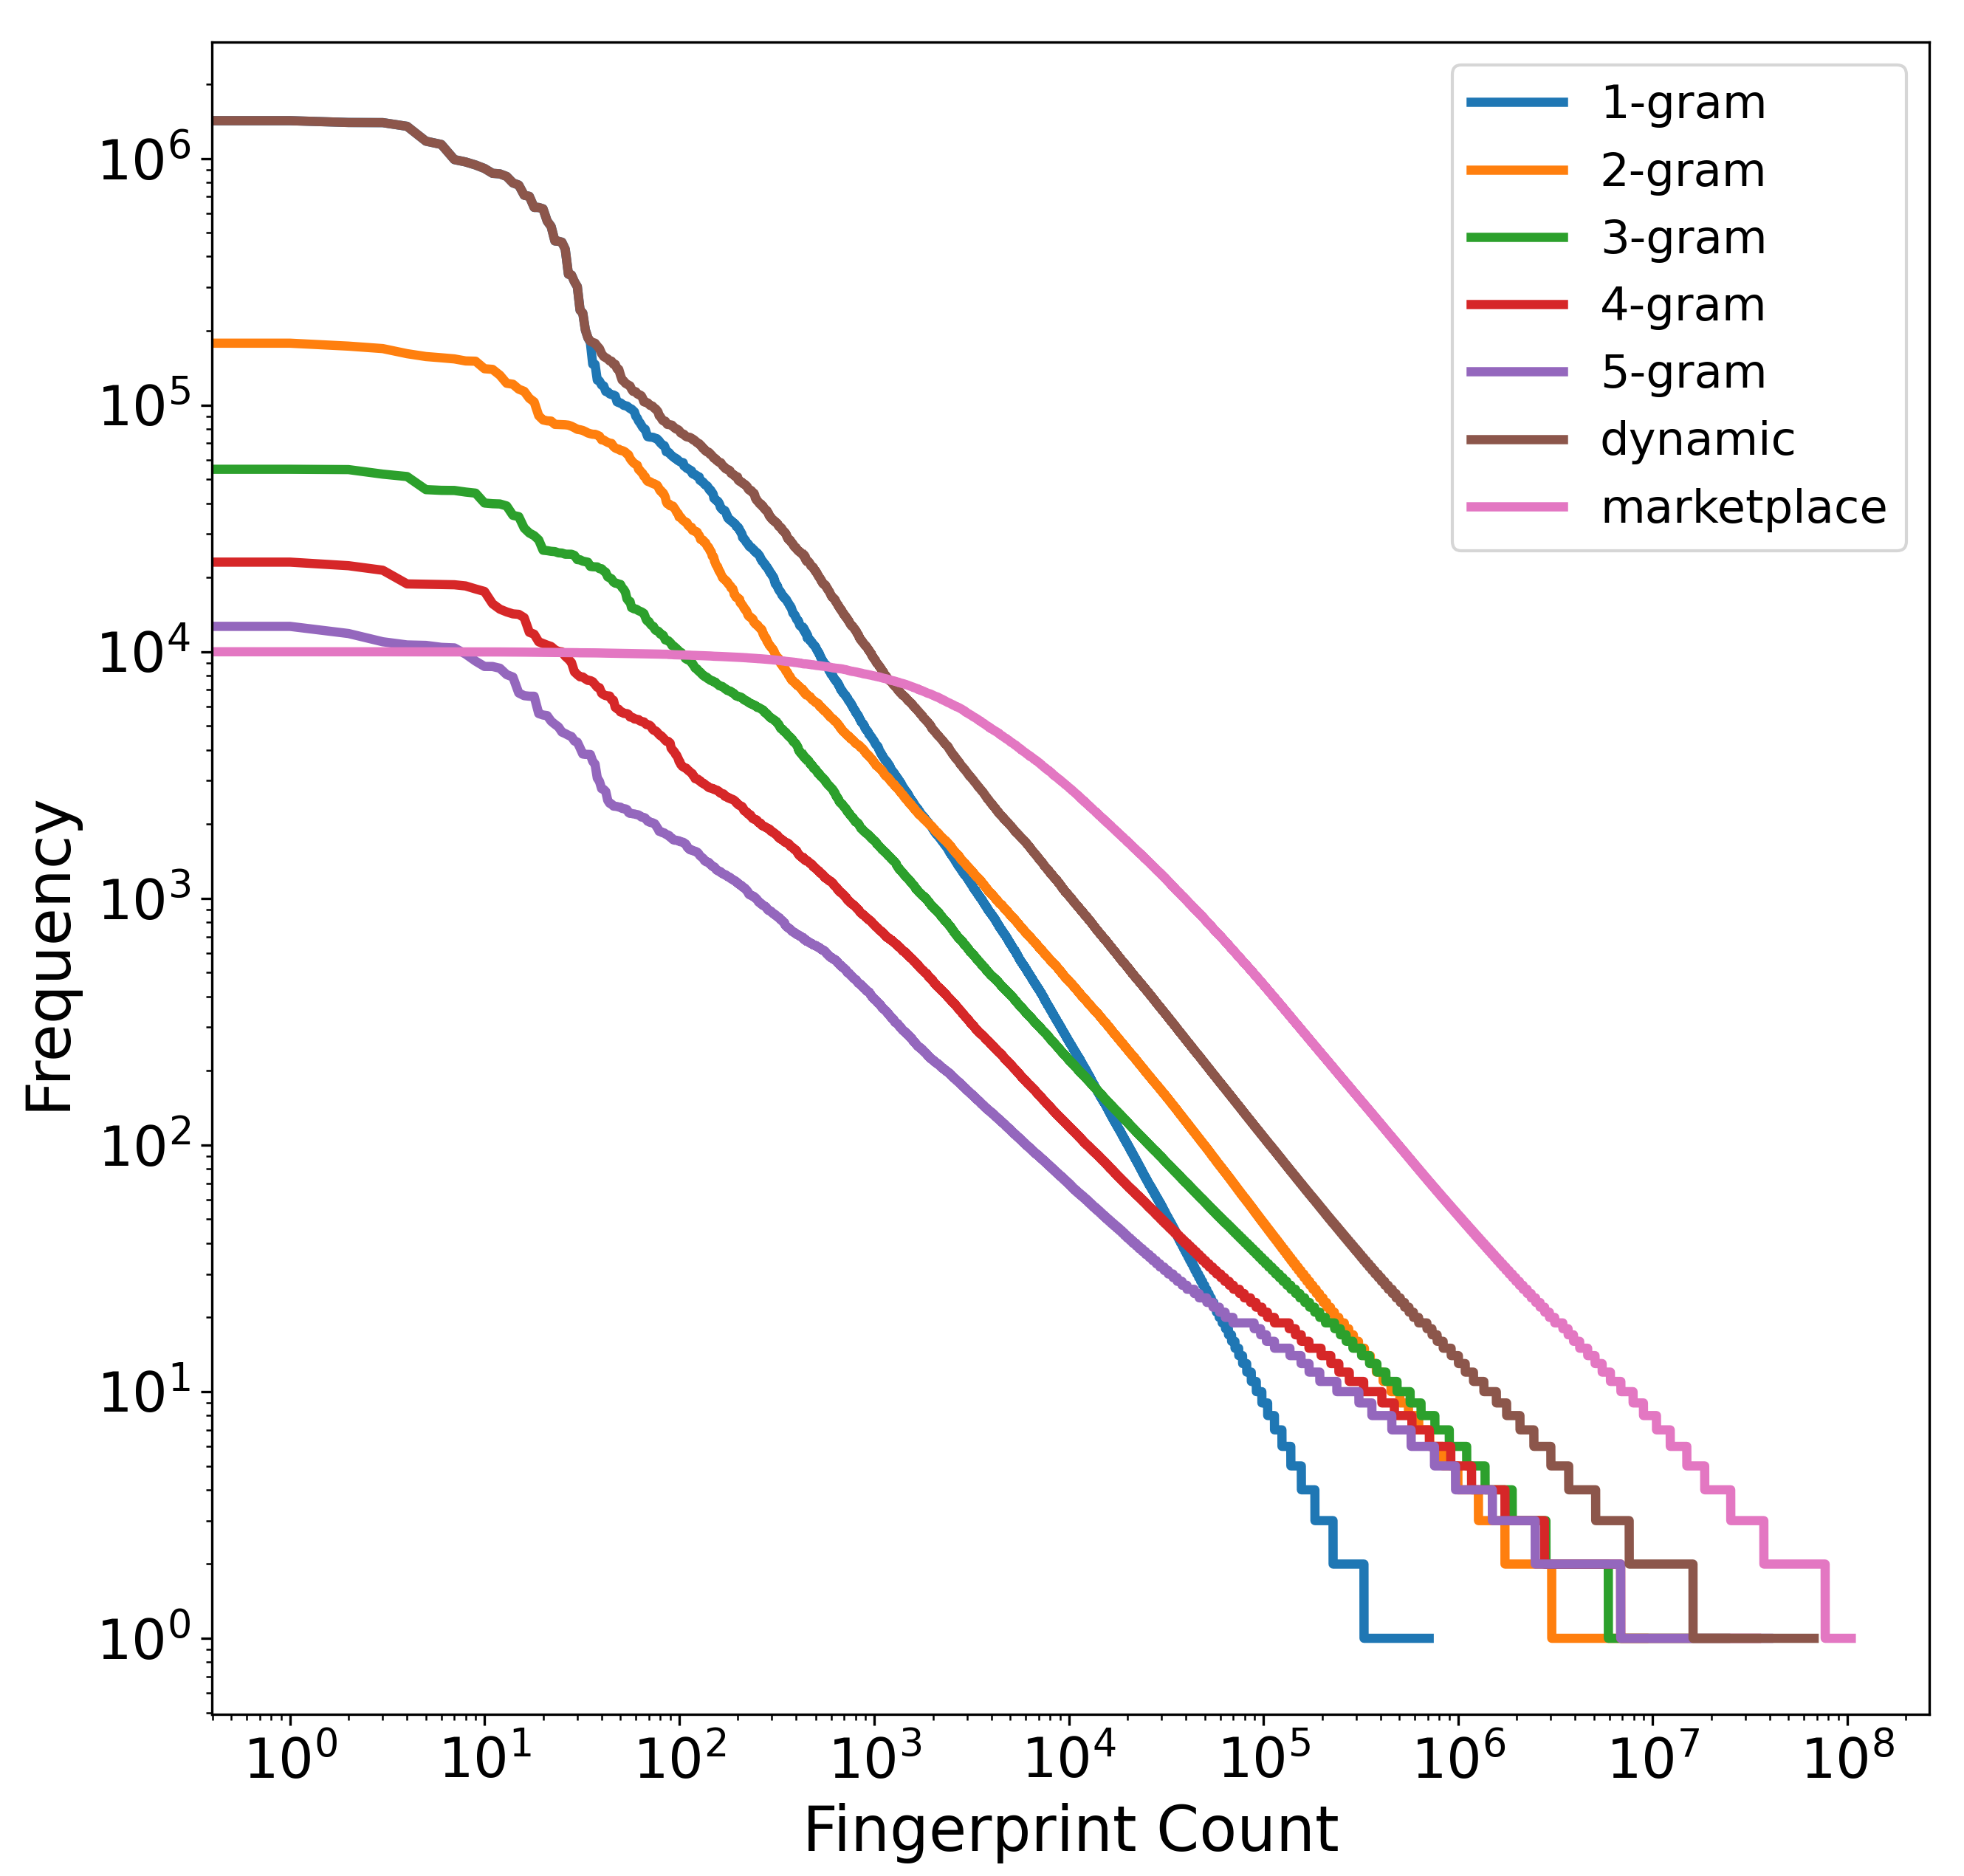
The fifth analysis is to characterize the frequency distribution of fingerprints in each database. The seven curves in Figure 9 show the frequency distribution of fingerprints for seven different systems: fixed n-gram systems for ; the dynamic n-gram system; and the proposed marketplace system. To generate each curve, we count how many times each unique fingerprint occurs in the database and sort the list of unique fingerprints by their frequency of occurrence. Note that in Figure 9, both the x-axis and y-axis are on a log scale.
Figure 9 illustrates how the marketplace system manages memory more strategically than the baseline systems. The dynamic n-gram distribution is very non-uniform: it has some fingerprints that occur millions of times and millions of fingerprints that occur extremely rarely. Both extremes are undesirable: very common fingerprints are undesirable because they require processing millions of matches in the database, and very rare fingerprints are undesirable because they occupy memory in the database but occur very rarely. In contrast, the marketplace system is much closer to a uniform distribution: it has no fingerprints with more than 10,000 matches, and its distribution is much flatter than the dynamic n-gram curve. It accomplishes this by discarding the undesirable fingerprints at the extremes: it does not select extremely common or extremely rare fingerprints, but instead chooses fingerprints that fall somewhere in the middle. By generalizing the notion of n-grams, it is able to populate its memory entirely with fingerprints that avoid both extremes. In this way, it utilizes its memory much more effectively than the fixed n-gram or dynamic n-gram approaches.
5. Conclusions
This article describes a novel method for piano music identification called marketplace fingerprinting. The key defining characteristic of marketplace fingerprinting is choice: we define a broad range of fingerprint designs based on a generalization of n-grams, and then select the fingerprint designs at runtime that are best for a specific query. We show that this setup is equivalent to an economics scenario in which a consumer and a store have competing interests, and we use basic principles of economics to design a system that is an efficient marketplace. We present experimental results on four different retrieval tasks using various forms of piano music, including sheet music images, MIDI files, and audio recordings. Our results indicate that marketplace fingerprinting substantially outperforms previous methods in retrieval accuracy, while simultaneously reducing average runtime.
Future work includes applying the marketplace fingerprinting method to other retrieval tasks and other domains. Marketplace fingerprinting can be interpreted as a retrieval method specifically designed for data that is sequential, sparse, and binary (which in our piano music identification task was a bootleg score representation). In these situations, we might expect a traditional hashing method like locality-sensitive hashing [45] to be inefficient, since most of the elements are zeros. Likewise, we would expect marketplace fingerprinting to be much more effective in finding specific sequence matches than retrieval methods, such as term frequency-inverse document frequency [46], that consider only frequency of occurrence. We leave controlled comparisons of these approaches on various types of data for future work.
Author Contributions
Conceptualization, T.T.; methodology, K.J., D.Y. and T.T.; software, D.Y., A.G. and K.J.; validation, D.Y., A.G. and K.J.; analysis, D.Y. and A.G.; writing—original draft preparation, D.Y. and A.G.; writing—review and editing, T.T.; supervision, T.T.; funding acquisition, T.T. All authors have read and agreed to the published version of the manuscript.
Funding
This research received no external funding.
Institutional Review Board Statement
Not applicable.
Informed Consent Statement
Not applicable.
Data Availability Statement
Code and data used in this paper can be found at http://github.com/HMC-MIR/Marketplace (accessed on 23 April 2022).
Conflicts of Interest
The authors declare no conflict of interest.
Abbreviations
The following abbreviations are used in this manuscript:
| AMT | Automatic music transcription |
| CNN | Convolutional neural network |
| IMSLP | International Music Score Library Project |
| MIDI | Musical instrument digital interface |
| OMR | Optical music recognition |
| Portable document format |
References
- Xu, J.; Wang, C.; Qi, C.; Shi, C.; Xiao, B. Iterative Manifold Embedding Layer Learned by Incomplete Data for Large-Scale Image Retrieval. IEEE Trans. Multimed. 2018, 21, 1551–1562. [Google Scholar] [CrossRef]
- Min, W.; Mei, S.; Li, Z.; Jiang, S. A Two-Stage Triplet Network Training Framework for Image Retrieval. IEEE Trans. Multimed. 2020, 22, 3128–3138. [Google Scholar] [CrossRef]
- Bai, C.; Li, H.; Zhang, J.; Huang, L.; Zhang, L. Unsupervised adversarial instance-level image retrieval. IEEE Trans. Multimed. 2021, 23, 2199–2207. [Google Scholar] [CrossRef]
- Bai, J.; Ni, B.; Wang, M.; Li, Z.; Cheng, S.; Yang, X.; Hu, C.; Gao, W. Deep Progressive Hashing for Image Retrieval. IEEE Trans. Multimed. 2019, 21, 3178–3193. [Google Scholar] [CrossRef]
- Philbin, J.; Chum, O.; Isard, M.; Sivic, J. Object Retrieval with Large Vocabularies and Fast Spatial Matching. In Proceedings of the IEEE International Conference on Computer Vision and Pattern Recognition, Minneapolis, MN, USA, 17–22 June 2007; pp. 1–8. [Google Scholar]
- Philbin, J.; Chum, O.; Isard, M.; Sivic, J.; Zisserman, A. Lost in Quantization: Improving Particular Object Retrieval in Large Scale Image Databases. In Proceedings of the IEEE International Conference on Computer Vision and Pattern Recognition, Anchorage, AK, USA, 23–28 June 2008; pp. 1–8. [Google Scholar]
- Lu, X.; Liu, L.; Nie, L.; Chang, X.; Zhang, H. Semantic-Driven Interpretable Deep Multi-Modal Hashing for Large-Scale Multimedia Retrieval. IEEE Trans. Multimed. 2021, 23, 4541–4554. [Google Scholar] [CrossRef]
- Lin, Q.; Cao, W.; He, Z.; He, Z. Mask Cross-Modal Hashing Networks. IEEE Trans. Multimed. 2020, 23, 550–558. [Google Scholar] [CrossRef]
- Wu, Y.; Wang, S.; Song, G.; Huang, Q. Augmented Adversarial Training for Cross-Modal Retrieval. IEEE Trans. Multimed. 2020, 23, 559–571. [Google Scholar] [CrossRef]
- Ma, X.; Zhang, T.; Xu, C. Multi-Level Correlation Adversarial Hashing for Cross-Modal Retrieval. IEEE Trans. Multimed. 2020, 22, 3101–3114. [Google Scholar] [CrossRef]
- Huiskes, M.J.; Thomee, B.; Lew, M.S. New Trends and Ideas in Visual Concept Detection: The MIR Flickr Retrieval Evaluation Initiative. In Proceedings of the International Conference on Multimedia Information Retrieval, Philadelphia, PA, USA, 29–31 March 2010; pp. 527–536. [Google Scholar]
- Chua, T.S.; Tang, J.; Hong, R.; Li, H.; Luo, Z.; Zheng, Y. NUS-WIDE: A Real-World Web Image Database from National University of Singapore. In Proceedings of the ACM International Conference on Image and Video Retrieval, Santorini, Fira, Greece, 8–10 July 2009; pp. 1–9. [Google Scholar]
- Thomas, V.; Fremerey, C.; Müller, M.; Clausen, M. Linking Sheet Music and Audio—Challenges and New Approaches. In Dagstuhl Follow-Ups. 2016, pp. 1–22. Available online: https://drops.dagstuhl.de/opus/volltexte/2012/3463/pdf/2.pdf (accessed on 20 March 2022).
- Kurth, F.; Müller, M.; Fremerey, C.; Chang, Y.H.; Clausen, M. Automated Synchronization of Scanned Sheet Music with Audio Recordings. In Proceedings of the International Society for Music Information Retrieval Conference, Vienna, Austria, 23–27 September 2007; pp. 261–266. [Google Scholar]
- Fremerey, C.; Müller, M.; Kurth, F.; Clausen, M. Automatic Mapping of Scanned Sheet Music to Audio Recordings. In Proceedings of the International Society for Music Information Retrieval Conference, Philadelphia, PA, USA, 14–18 September 2008; pp. 413–418. [Google Scholar]
- Fremerey, C.; Clausen, M.; Ewert, S.; Müller, M. Sheet Music-Audio Identification. In Proceedings of the International Society for Music Information Retrieval Conference, Kobe, Japan, 26–30 October 2009; pp. 645–650. [Google Scholar]
- Dorfer, M.; Arzt, A.; Widmer, G. Learning Audio-Sheet Music Correspondences for Score Identification and Offline Alignment. In Proceedings of the International Society for Music Information Retrieval Conference, Suzhou, China, 23–27 October 2017; pp. 115–122. [Google Scholar]
- Dorfer, M.; Hajič, J.; Arzt, A.; Frostel, H.; Widmer, G. Learning Audio-Sheet Music Correspondences for Cross-Modal Retrieval and Piece Identification. Trans. Int. Soc. Music. Inf. Retr. 2018, 1, 22–23. [Google Scholar] [CrossRef]
- Dorfer, M.; Schlüter, J.; Vall, A.; Korzeniowski, F.; Widmer, G. End-to-End Cross-Modality Retrieval with CCA Projections and Pairwise Ranking Loss. Int. J. Multimed. Inf. Retr. 2018, 7, 117–128. [Google Scholar] [CrossRef] [Green Version]
- Dorfer, M.; Arzt, A.; Widmer, G. Towards Score Following in Sheet Music Images. In Proceedings of the International Society for Music Information Retrieval Conference, New York, NY, USA, 7–11 August 2016; pp. 789–795. [Google Scholar]
- Dorfer, M.; Henkel, F.; Widmer, G. Learning to Listen, Read, and Follow: Score following as a Reinforcement Learning Game. In Proceedings of the International Society for Music Information Retrieval Conference, Paris, France, 23–27 September 2018; pp. 784–791. [Google Scholar]
- Henkel, F.; Balke, S.; Dorfer, M.; Widmer, G. Score Following as a Multi-Modal Reinforcement Learning Problem. Trans. Int. Soc. Music. Inf. Retr. 2019, 2, 67–81. [Google Scholar] [CrossRef]
- Henkel, F.; Kelz, R.; Widmer, G. Learning to Read and Follow Music in Complete Score Sheet Images. In Proceedings of the International Society for Music Information Retrieval Conference, Montreal, QC, Canada, 11–16 October 2020; pp. 780–787. [Google Scholar]
- Henkel, F.; Kelz, R.; Widmer, G. Audio-Conditioned U-Net for Position Estimation in Full Sheet Images. In Proceedings of the International Workshop on Reading Music Systems, Delft, The Netherlands, 2 November 2019. [Google Scholar]
- Yang, D.; Tanprasert, T.; Jenrungrot, T.; Shan, M.; Tsai, T. MIDI Passage Retrieval Using Cell Phone Pictures of Sheet Music. In Proceedings of the International Society for Music Information Retrieval Conference, Delft, The Netherlands, 4–8 November 2019; pp. 916–923. [Google Scholar]
- Tsai, T.; Yang, D.; Shan, M.; Tanprasert, T.; Jenrungrot, T. Using Cell Phone Pictures of Sheet Music To Retrieve MIDI Passages. IEEE Trans. Multimed. 2020, 22, 3115–3127. [Google Scholar] [CrossRef]
- Tsai, T. Towards Linking the Lakh and IMSLP Datasets. In Proceedings of the IEEE International Conference on Acoustics, Speech and Signal Processing, Toronto, ON, Canada, 4–8 May 2020; pp. 546–550. [Google Scholar]
- Yang, D.; Tsai, T. Piano Sheet Music Identification Using Dynamic N-gram Fingerprinting. Trans. Int. Soc. Music. Inf. Retr. 2021, 4, 42–51. [Google Scholar] [CrossRef]
- Malik, R.; Roy, P.P.; Pal, U.; Kimura, F. Handwritten Musical Document Retrieval Using Music-Score Spotting. In Proceedings of the IEEE International Conference on Document Analysis and Recognition, Washington, DC, USA, 23 August 2013; pp. 832–836. [Google Scholar]
- Calvo-Zaragoza, J.; Toselli, A.H.; Vidal, E. Probabilistic Music-Symbol Spotting in Handwritten Scores. In Proceedings of the IEEE International Conference on Frontiers in Handwriting Recognition, Niagara Falls, NY, USA, 5–8 August 2018; pp. 558–563. [Google Scholar]
- Thompson, J.; Hankinson, A.; Fujinaga, I. Searching the Liber Usualis: Using CouchDB and ElasticSearch to Query Graphical Music Documents. In Proceedings of the International Society for Music Information Retrieval Conference, Miami, FL, USA, 24–28 October 2011. [Google Scholar]
- Achankunju, S.P. Music Search Engine from Noisy OMR Data. In Proceedings of the International Workshop on Reading Music Systems, Paris, France, 20 September 2018. [Google Scholar]
- Yang, D.; Tsai, T. Camera-Based Piano Sheet Music Identification. In Proceedings of the International Society for Music Information Retrieval Conference, Montreal, QC, Canada, 11–16 October 2020; pp. 481–488. [Google Scholar]
- Hajič, J.; Kolárová, M.; Pacha, A.; Calvo-Zaragoza, J. How Current Optical Music Recognition Systems Are Becoming Useful For Digital Libraries. In Proceedings of the 5th International Conference on Digital Libraries for Musicology, Paris, France, 28 September 2018; pp. 57–61. [Google Scholar]
- Waloschek, S.; Hadjakos, A.; Pacha, A. Identification and Cross-Document Alignment of Measures in Music Score Images. In Proceedings of the International Society for Music Information Retrieval Conference, Delft, The Netherlands, 4–8 November 2019; pp. 137–146. [Google Scholar]
- Yao, S.; Niu, B.; Liu, J. Audio Identification by Sampling Sub-Fingerprints and Counting Matches. IEEE Trans. Multimed. 2017, 19, 1984–1995. [Google Scholar] [CrossRef]
- Tsai, T.; Prätzlich, T.; Müller, M. Known-Artist Live Song Identification Using Audio Hashprints. IEEE Trans. Multimed. 2017, 19, 1569–1582. [Google Scholar] [CrossRef]
- Ji, K.; Yang, D.; Tsai, T. Piano Sheet Music Identification Using Marketplace Fingerprinting. In Proceedings of the International Society for Music Information Retrieval Conference, Online, 7–12 November 2021; pp. 326–333. [Google Scholar]
- Shan, M.; Tsai, T. Improved Handling of Repeats and Jumps in Audio-Sheet Image Synchronization. In Proceedings of the International Society for Music Information Retrieval Conference, Montreal, QC, Canada, 11–16 October 2020; pp. 62–69. [Google Scholar]
- Shan, M.; Tsai, T. Automatic Generation of Piano Score Following Videos. Trans. Int. Soc. Music. Inf. Retr. 2021, 4, 29–41. [Google Scholar] [CrossRef]
- Rosenfeld, R. Two Decades of Statistical Language Modeling: Where Do We Go From Here? Proc. IEEE 2000, 88, 1270–1278. [Google Scholar] [CrossRef]
- Wang, A. An Industrial Strength Audio Search Algorithm. In Proceedings of the International Society for Music Information Retrieval Conference, Baltimore, MD, USA, 27–30 October 2003; pp. 7–13. [Google Scholar]
- Hawthorne, C.; Elsen, E.; Song, J.; Roberts, A.; Simon, I.; Raffel, C.; Engel, J.; Oore, S.; Eck, D. Onsets and Frames: Dual-Objective Piano Transcription. In Proceedings of the International Society for Music Information Retrieval Conference, Paris, France, 23–27 September 2018; pp. 50–57. [Google Scholar]
- Hawthorne, C.; Stasyuk, A.; Roberts, A.; Simon, I.; Huang, C.Z.A.; Dieleman, S.; Elsen, E.; Engel, J.; Eck, D. Enabling Factorized Piano Music Modeling and Generation with the MAESTRO Dataset. In Proceedings of the International Conference on Learning Representations, New Orleans, LA, USA, 6–9 May 2019. [Google Scholar]
- Gionis, A.; Indyk, P.; Motwani, R. Similarity Search In High Dimensions Via Hashing. In Proceedings of the Very Large Database (VLDB) Conference, Scotland, UK, 7–10 September 1999; Volume 99, pp. 518–529. [Google Scholar]
- Jones, K.S. A Statistical Interpretation of Term Specificity and Its Application in Retrieval. J. Doc. 1972. Available online: http://courses.cs.tau.ac.il/0368-4341/shared/Papers/ksj_orig.pdf (accessed on 20 March 2022).
Figure 1.
Overview of the marketplace fingerprinting approach for multimodal piano music identification. The input can be a sheet music image, an audio recording, or a MIDI file.
Figure 1.
Overview of the marketplace fingerprinting approach for multimodal piano music identification. The input can be a sheet music image, an audio recording, or a MIDI file.

Figure 2.
Overview of constructing generalized n-gram fingerprints from sheet music. Whereas standard n-grams only consider n consecutive elements, generalized n-grams consider combinations of n elements from a fixed context size.
Figure 2.
Overview of constructing generalized n-gram fingerprints from sheet music. Whereas standard n-grams only consider n consecutive elements, generalized n-grams consider combinations of n elements from a fixed context size.

Figure 3.
Probability of correctness for all 16 generalized n-gram types, as estimated on the training queries. This probability of correctness is used as a measure of a fingerprint’s utility. The n-gram type is indicated as a string where, for example, “025” corresponds to the 3-gram .
Figure 3.
Probability of correctness for all 16 generalized n-gram types, as estimated on the training queries. This probability of correctness is used as a measure of a fingerprint’s utility. The n-gram type is indicated as a string where, for example, “025” corresponds to the 3-gram .

Figure 4.
Experimental results on the MIDI-based sheet music retrieval task. Each query is a MIDI fragment of duration L seconds. Results are shown for the marketplace system with two different feature representations: a bootleg score with duplicated notes in the middle register (“Marketplace 1”) and a bootleg score where notes in the middle register are classified into left- and right-hand staves (“Marketplace 2”).

Figure 5.
Experimental results on the audio-based sheet music retrieval task. Each query is an audio fragment of duration L seconds. The two marketplace systems are the same as in Figure 4.
Figure 5.
Experimental results on the audio-based sheet music retrieval task. Each query is an audio fragment of duration L seconds. The two marketplace systems are the same as in Figure 4.

Figure 6.
The effect of runtime budget on retrieval accuracy (top) and average runtime (bottom) for the marketplace system. The bars in the lower plot indicate one standard deviation above and below the mean.
Figure 6.
The effect of runtime budget on retrieval accuracy (top) and average runtime (bottom) for the marketplace system. The bars in the lower plot indicate one standard deviation above and below the mean.

Figure 7.
Database coverage of marketplace and dynamic n-gram systems. The coverage of a single PDF is defined as the percentage of the corresponding bootleg score that is represented in the database, and each curve shows the coverage of all piano PDFs in IMSLP sorted from least coverage (left) to most coverage (right). Note that the x-axis is on a log scale.

Figure 8.
Comparison of fingerprint lookup strategy between marketplace and dynamic n-gram systems. Each point shows the number of fingerprint lookups and number of database matches processed for a single test query.
Figure 8.
Comparison of fingerprint lookup strategy between marketplace and dynamic n-gram systems. Each point shows the number of fingerprint lookups and number of database matches processed for a single test query.

Figure 9.
Distribution of fingerprint frequency. For each system, the set of unique fingerprints in the database is sorted by frequency of occurrence and shown from most frequent (left) to least frequent (right). The marketplace system avoids fingerprints that are either extremely common or extremely rare. Note that both axes are on a log scale.


Table 1.
Experimental results on the camera-based sheet music retrieval task. Condition 1 assumes that the exact same PDF is in the database, while condition 2 assumes that only alternate printed editions of the same piece exist in the database.
Table 1.
Experimental results on the camera-based sheet music retrieval task. Condition 1 assumes that the exact same PDF is in the database, while condition 2 assumes that only alternate printed editions of the same piece exist in the database.
| System | MRR | Runtime | ||
|---|---|---|---|---|
| Cond 1 | Cond 2 | Avg | Std | |
| 1-gram [27] | 0.71 | 0.66 | 21.5 s | 12.5 s |
| 2-gram | 0.85 | 0.82 | 2.76 s | 1.11 s |
| 3-gram | 0.81 | 0.76 | 1.99 s | 0.36 s |
| 4-gram | 0.76 | 0.74 | 1.12 s | 0.25 s |
| 5-gram | 0.69 | 0.67 | 1.07 s | 0.13 s |
| Dynamic [33] | 0.85 | 0.82 | 0.98 s | 0.12 s |
| Marketplace | 0.91 | 0.89 | 0.95 s | 0.14 s |
Table 2.
Experimental results on the scan-based sheet music retrieval task. Each query is a digital scan of piano sheet music.
Table 2.
Experimental results on the scan-based sheet music retrieval task. Each query is a digital scan of piano sheet music.
| System | MRR | Runtime | ||
|---|---|---|---|---|
| Cond 1 | Cond 2 | Avg | Std | |
| 1-gram [27] | 0.82 | 0.79 | 26.87 s | 9.79 s |
| 2-gram | 0.94 | 0.90 | 3.54 s | 1.47 s |
| 3-gram | 0.93 | 0.91 | 1.71 s | 0.34 s |
| 4-gram | 0.87 | 0.85 | 1.36 s | 0.2 s |
| 5-gram | 0.80 | 0.78 | 1.16 s | 0.12 s |
| Dynamic [33] | 0.95 | 0.92 | 1.21 s | 0.12 s |
| Marketplace | 0.97 | 0.94 | 0.98 s | 0.14 s |
Table 3.
The effect of database size on retrieval accuracy (MRR) for the dynamic n-gram and marketplace systems.
Table 3.
The effect of database size on retrieval accuracy (MRR) for the dynamic n-gram and marketplace systems.
| DB Size | Dynamic n-Gram | Marketplace |
|---|---|---|
| 16 GB | ||
| 32 GB | ||
| 48 GB | ||
| 64 GB | ||
| 80 GB | ||
| 96 GB | ||
| 128 GB |
Publisher’s Note: MDPI stays neutral with regard to jurisdictional claims in published maps and institutional affiliations. |
© 2022 by the authors. Licensee MDPI, Basel, Switzerland. This article is an open access article distributed under the terms and conditions of the Creative Commons Attribution (CC BY) license (https://creativecommons.org/licenses/by/4.0/).
Share and Cite
MDPI and ACS Style
Yang, D.; Goutam, A.; Ji, K.; Tsai, T. Large-Scale Multimodal Piano Music Identification Using Marketplace Fingerprinting. Algorithms 2022, 15, 146. https://0-doi-org.brum.beds.ac.uk/10.3390/a15050146
AMA Style
Yang D, Goutam A, Ji K, Tsai T. Large-Scale Multimodal Piano Music Identification Using Marketplace Fingerprinting. Algorithms. 2022; 15(5):146. https://0-doi-org.brum.beds.ac.uk/10.3390/a15050146
Chicago/Turabian StyleYang, Daniel, Arya Goutam, Kevin Ji, and TJ Tsai. 2022. "Large-Scale Multimodal Piano Music Identification Using Marketplace Fingerprinting" Algorithms 15, no. 5: 146. https://0-doi-org.brum.beds.ac.uk/10.3390/a15050146
Note that from the first issue of 2016, this journal uses article numbers instead of page numbers. See further details here.