
Optimized Score Level Fusion for Multi-Instance Finger Vein Recognition
by
 , , and
Jackson Horlick Teng
, 
Thian Song Ong
*,
Tee Connie
,
Kalaiarasi Sonai Muthu Anbananthen
and
Pa Pa Min
Faculty of Information Science and Technology, Multimedia University, Melaka 75450, Malaysia
*
Author to whom correspondence should be addressed.
Algorithms 2022, 15(5), 161; https://0-doi-org.brum.beds.ac.uk/10.3390/a15050161
Submission received: 1 April 2022
/
Revised: 27 April 2022
/
Accepted: 28 April 2022
/
Published: 11 May 2022
(This article belongs to the Special Issue Metaheuristic Algorithms and Applications)
Abstract
:The finger vein recognition system uses blood vessels inside the finger of an individual for identity verification. The public is in favor of a finger vein recognition system over conventional passwords or ID cards as the biometric technology is harder to forge, misplace, and share. In this study, the histogram of oriented gradients (HOG) features, which are robust against changes in illumination and position, are extracted from the finger vein for personal recognition. To further increase the amount of information that can be used for recognition, different instances of the finger vein, ranging from the index, middle, and ring finger are combined to form a multi-instance finger vein representation. This fusion approach is preferred since it can be performed without requiring additional sensors or feature extractors. To combine different instances of finger vein effectively, score level fusion is adopted to allow greater compatibility among the wide range of matches. Towards this end, two methods are proposed: Bayesian optimized support vector machine (SVM) score fusion (BSSF) and Bayesian optimized SVM based fusion (BSBF). The fusion results are incrementally improved by optimizing the hyperparameters of the HOG feature, SVM matcher, and the weighted sum of score level fusion using the Bayesian optimization approach. This is considered a kind of knowledge-based approach that takes into account the previous optimization attempts or trials to determine the next optimization trial, making it an efficient optimizer. By using stratified cross-validation in the training process, the proposed method is able to achieve the lowest EER of 0.48% and 0.22% for the SDUMLA-HMT dataset and UTFVP dataset, respectively.
1. Introduction
Biometrics is a system that recognizes an individual from the measurements of the individual’s characteristics. These characteristics, also known as “biometric traits”, are separated into physiological or behavioral characteristics. Biometrics has the properties of better user convenience, security, and non-repudiation as the biometric traits are harder to forge, misplace, and share. Among the various hand-based biometrics, the finger vein is particularly secure for personal recognition purposes since the vein structure is hidden inside the finger, making it hard to spoof and perturb.
In general, biometrics can be subdivided into unimodal or multimodal biometrics, depending on the number of biometric traits used. Multimodal biometrics inherently requires a way to combine or fuse the multiple biometric traits used. There are several fusion methods involved for multimodal biometrics: decision level, score level, feature level, and image level, with the amount of information retained increasing and the ease of fusion decreasing in each subsequent fusion level [1]. Among the different fusion strategies, score level fusion is commonly preferred to achieve a balance between ease of fusion and the sufficient amount of information retained to distinguish between a genuine and an impostor case [2].
In this paper, we present a multimodal biometric approach that integrates finger vein features from multiple fingers for personal recognition. Score level fusion is adopted to fuse the finger veins feature set extracted from the histogram of oriented gradients (HOG) [3]. Specifically, HOG is first used to extract the feature from each preprocessed finger vein instance. This is followed by two proposed optimized score level fusion methods: Bayesian optimized support vector machine (SVM) score fusion (BSSF) and Bayesian optimized SVM based fusion (BSBF) for multi-instance finger vein recognition. The rest of the paper is organized into different sections as follows: Section 2 revisits scientific reviews related to the methods of finger vein recognition and score level fusion, while Section 3 outlines the research focus and contribution of this paper. On the other hand, Section 4 presents proposed methods based on the Bayesian optimization approach. It is then followed by experimental analysis to vindicate the proposed solutions in Section 5. The paper is concluded in Section 6 to recap the research finding and possible future works.
2. Literature Review
William et al. [4] proposed the use of a histogram of sign and magnitude extracted using binary gradient contour (BGC) for finger vein recognition. The region of interest (ROI) of the finger was normalized, cropped, resized, and processed with adaptive histogram equalization. BGC is then used to extract the sign and magnitude from the image. The image was divided into a set of cells. From each cell, the histogram of sign and magnitude were found. The histograms were then concatenated with each other to form the final feature representation. The lowest EERs of the proposed method using the SDUMLA-HMT finger vein database for the right index finger and left index finger was 0.353% and 0.390%, respectively.
Cui and Yang [5] proposed a score-level fusion of finger vein and fingerprint biometrics. The orientation field of the fingerprint was first calculated. This was followed by image enhancement, fingerprint thinning, minutiae extraction, and minutiae matching based on ternary vector with alignment. In addition, the finger vein image was normalized in size and grayscale, and enhanced using a ridge wave filter. Afterward, segmentation and thinning of the finger vein were carried out. Finger vein matching was performed by using modified Hausdorff distance (MHD). For fusion, the finger vein matching distance was normalized using min-max normalization; while the fusion of finger vein and fingerprint score was performed using a weighted sum. The proposed method reported a recognition rate of 98.74% using a local database of 2880 finger veins and fingerprint images from 80 fingers.
Yang and Zhang [6] combined finger vein and fingerprint biometrics at the feature level. The fingerprint ROI was extracted using orientation and then cropped into 168 × 168 pixels in size. On the other hand, the finger vein ROI was extracted by using the interphalangeal joint prior and cropped into 160 × 80 pixels. Even symmetric Gabor filter (EGF) was applied to extract the features from the fingerprint and finger vein ROIs. The eight filtered images from the 2D convolution of the ROI and eight orientations of EGF were used to create a feature matrix. The average absolute deviation (AAD) of each 8 × 8 or 16 × 8 block were used to create the feature matrix of a filtered fingerprint or finger vein image. The feature matrix was then rearranged by row into a one-dimensional feature vector for each fingerprint and finger vein, respectively. It is then followed by the use of principal component analysis (PCA) for dimension reduction. Feature level fusion was then implemented using supervised local-preserving canonical correlation analysis (SLPCCA). to identify non-linear relationships between two sets of feature variables while preserving the local structure information in original data, exploiting the mutual information between two different feature sets, and exploiting the class information of the samples. SLPCCA generated a union vector called fingerprint-vein feature vector (FPVFV). The recognition rate of the proposed method is 99.687% using a local database of 640 fingerprints and finger veins from 64 individuals with 10 samples.
Yang et al. [7] proposed another feature-level fusion of finger vein and fingerprint biometrics. The fingerprint image was first normalized, followed by Gabor filter processing, binarization, thinning, minutiae extraction, neighborhood elimination, and ROI extraction. For finger vein biometrics, the vein was extracted by detecting the concavity in the grayscale image, followed by filtering, thinning, de-burring, minutiae extraction, neighborhood elimination, and ROI extraction. The feature-level fusion was implemented with feature concatenation. Neighborhood elimination was used to discard features that were within a certain radius of other features. The features were categorized as excellent or poor-quality features based on five evaluation factors: the number of input minutiae, the size of effective area, the change in the number of minutiae before and after minutiae reduction, the proportion of the number of registered minutiae and input minutiae, and the degree of center deviation. Matching was performed by dynamic weighting matching in which the quality of the features was used to determine the weights of the weighted sum of the matching pairs of features. The proposed method reported a recognition rate of 98.93% using a local database with 40 pairs of images where each pair was composed of a finger vein sample and a fingerprint sample.
He et al. [8] adopted the reduction of high-scores effect (RHE) normalization for score level fusion of fingerprint, face, and finger vein biometrics. The normalization would only be done when the two feature sets have different ranges, in order to minimize information loss. The normalization was performed by using the sum of standard deviation and mean of the genuine distribution to replace the maximum value used in min-max normalization. The proposed normalization was tested using support vector machine (SVM)-based fusion and sum rule-based fusion. The sum rule-based fusion was done by summing all the scores from the matches and when the summed score is above a threshold, it is matched. The SVM-based fusion used C-support vector classification (C-SVC) where the scores from all matches are the feature vector. C-SVC refers to the support vector classifier that uses parameter C as a regularization parameter that implements a penalty on misclassifications, that ranges from zero to infinity. The GAR from the proposed system using sum rule-based fusion was 99.6% at 0.001% FAR using a local database with 510 individuals. The GAR from the proposed system using SVM with radial basis function (RBF) kernel was 99.9% at 0.00003% FAR using a similar dataset.
Khellat-Kihel et al. [9] performed a study exploring the fusion of fingerprint, finger-knuckle-print, and finger vein traits at feature level fusion and decision level fusion. The study made use of Gabor filter 2D to preprocess the three different types of biometric images. The feature extraction was done by using a bank of Gabor filters to obtain a single feature vector. Feature selection was then conducted for each feature vector by using kernel fisher analysis (KFA). In the feature level fusion, the feature vector of three different biometric traits was simply concatenated and then classified by SVM and k-nearest neighbors (KNN). In the enhanced feature level fusion, the feature vectors were concatenated and this was followed by feature selection using KFA. After that, the selected concatenated feature vector was classified by SVM and KNN. Additionally, decision level fusion of the classification results was performed by using majority voting. Two publicly available datasets, the SDUMLA-HMT finger vein database, and the Poly U dataset were used for performance evaluation. The best results for the proposed system using SVM with feature level fusion enhanced feature level fusion, and decision level fusion were 99.96%, 99.69%, and 94.91%, respectively, while the results of KNN with the three fusion methods were 88.21%, 99.06%, and 95.28%, respectively.
Kim et al. [10] proposed a multimodal biometric system by using finger vein and finger shape biometrics for personal recognition. The finger image is first segmented by using Sobel filtering, component labeling, thresholding, and convex hull processing to determine the finger ROI. The finger is then normalized by rotating and cropping. For finger shape recognition, the finger is transformed into a two-dimensional spectrogram image by calculating the frequency of the finger thickness using a short-time Fourier transform (STFT) by sliding a window along the length of the finger. The spectrogram image is then used in a convolutional neural network (CNN) to extract the finger shape feature vector. The feature vector of finger shape is then matched using Euclidean distance matching to obtain the finger shape score. For finger vein recognition, the finger is matched by finding the difference between the images. The difference image is then fed into CNN to obtain the finger vein score. Next, both finger shape score and finger vein score are then normalized with min–max normalization. The scores are then fused together at the score level fusion using weighted sum, weighted product, Bayesian rule, and perceptron rule for multi-modal recognition of the finger shape and finger-vein. The experimental results reveal the robustness of the proposed solution with EER as low as 2.3445% (SDUMLA-HMT dataset) and 0.7859% (Poly U dataset).
3. Contributions
In general, the performance of unimodal biometrics is easily affected by noisy data, interclass similarities, and intraclass variations as compared to the multimodal biometrics approach [1], while the conventional score-level fusion method is limited by the variability of the performance accuracies of different matches. To address these issues, the paper presents the following contributions:
- A multi-instance finger vein system uses different instances of a finger vein, such as index, middle, and ring finger as the feature set. The use of multiple instances increases the number of unique patterns and lowers the interclass similarities. It also allows different finger vein instances to provide more information and thus maintain a minimum performance.
- We propose to optimize the hyperparameters of the histogram of oriented gradients (HOG) feature extractor and support vector machine (SVM) matcher for better performance. Improved performance is observed using the proposed optimization method, which will be indicated in the experimental analysis section. The use of optimizer for HOG features was inspired by the work of Nickfarjam et al. [11] that show improved performance of HOG when using self-adaptive particle swarm optimization (SPSO) for hyperparameter optimization. However, we propose the use of Bayesian optimization as an alternative optimizer to SPSO. SPSO is a population-based optimizer, which means it performs multiple objective function evaluations, according to the size of the population in each optimization step. This makes SPSO much more computationally expensive compared to Bayesian optimization which only performs a single objective function evaluation in each optimization step while maintaining a robust performance.
- The score level fusion method based on Bayesian optimized SVM score fusion (BSSF) and Bayesian optimized SVM based fusion (BSBF) is proposed. In the BSSF method, each finger vein instance is matched using SVM. The resulting score for each finger vein instance is then multiplied with a weight that is optimized using a Bayesian optimizer. The weighted scores are then summed and used to determine the decision of match or not match. In the BSBF method, each finger vein instance is matched using an Euclidean distance matcher. The resulting score for each finger vein instance is then normalized and concatenated as a score vector. The score vector is then fed into the SVM classifier for decision. BSSF should give better performance as compared to BSBF, since there is less information loss, by classifying the HOG feature with SVM. Meanwhile, BSBF classifies the score after Euclidean distance matching, which results in more information loss. However, BSSF requires access to the features from a biometric system, which is not always available in the biometric system. On the other hand, BSBF only requires access to the scores from a biometric system, which is usually available even in a proprietary biometric system; this gives BSBF wider compatibility as compared to BSSF.
4. Proposed Method
The proposed solutions adopt multi-instance finger vein features as the feature descriptors for user recognition. At first, preprocessing of the finger vein images is performed to improve the image quality. A histogram of oriented gradients (HOG) is then used to extract the feature from each finger vein instance, and this is followed by matching for score level fusion. Score level fusion can be approached in two ways: classification or combination approach [12]. In the proposed method, BSSF uses the combination approach and BSBF uses the classification approach.
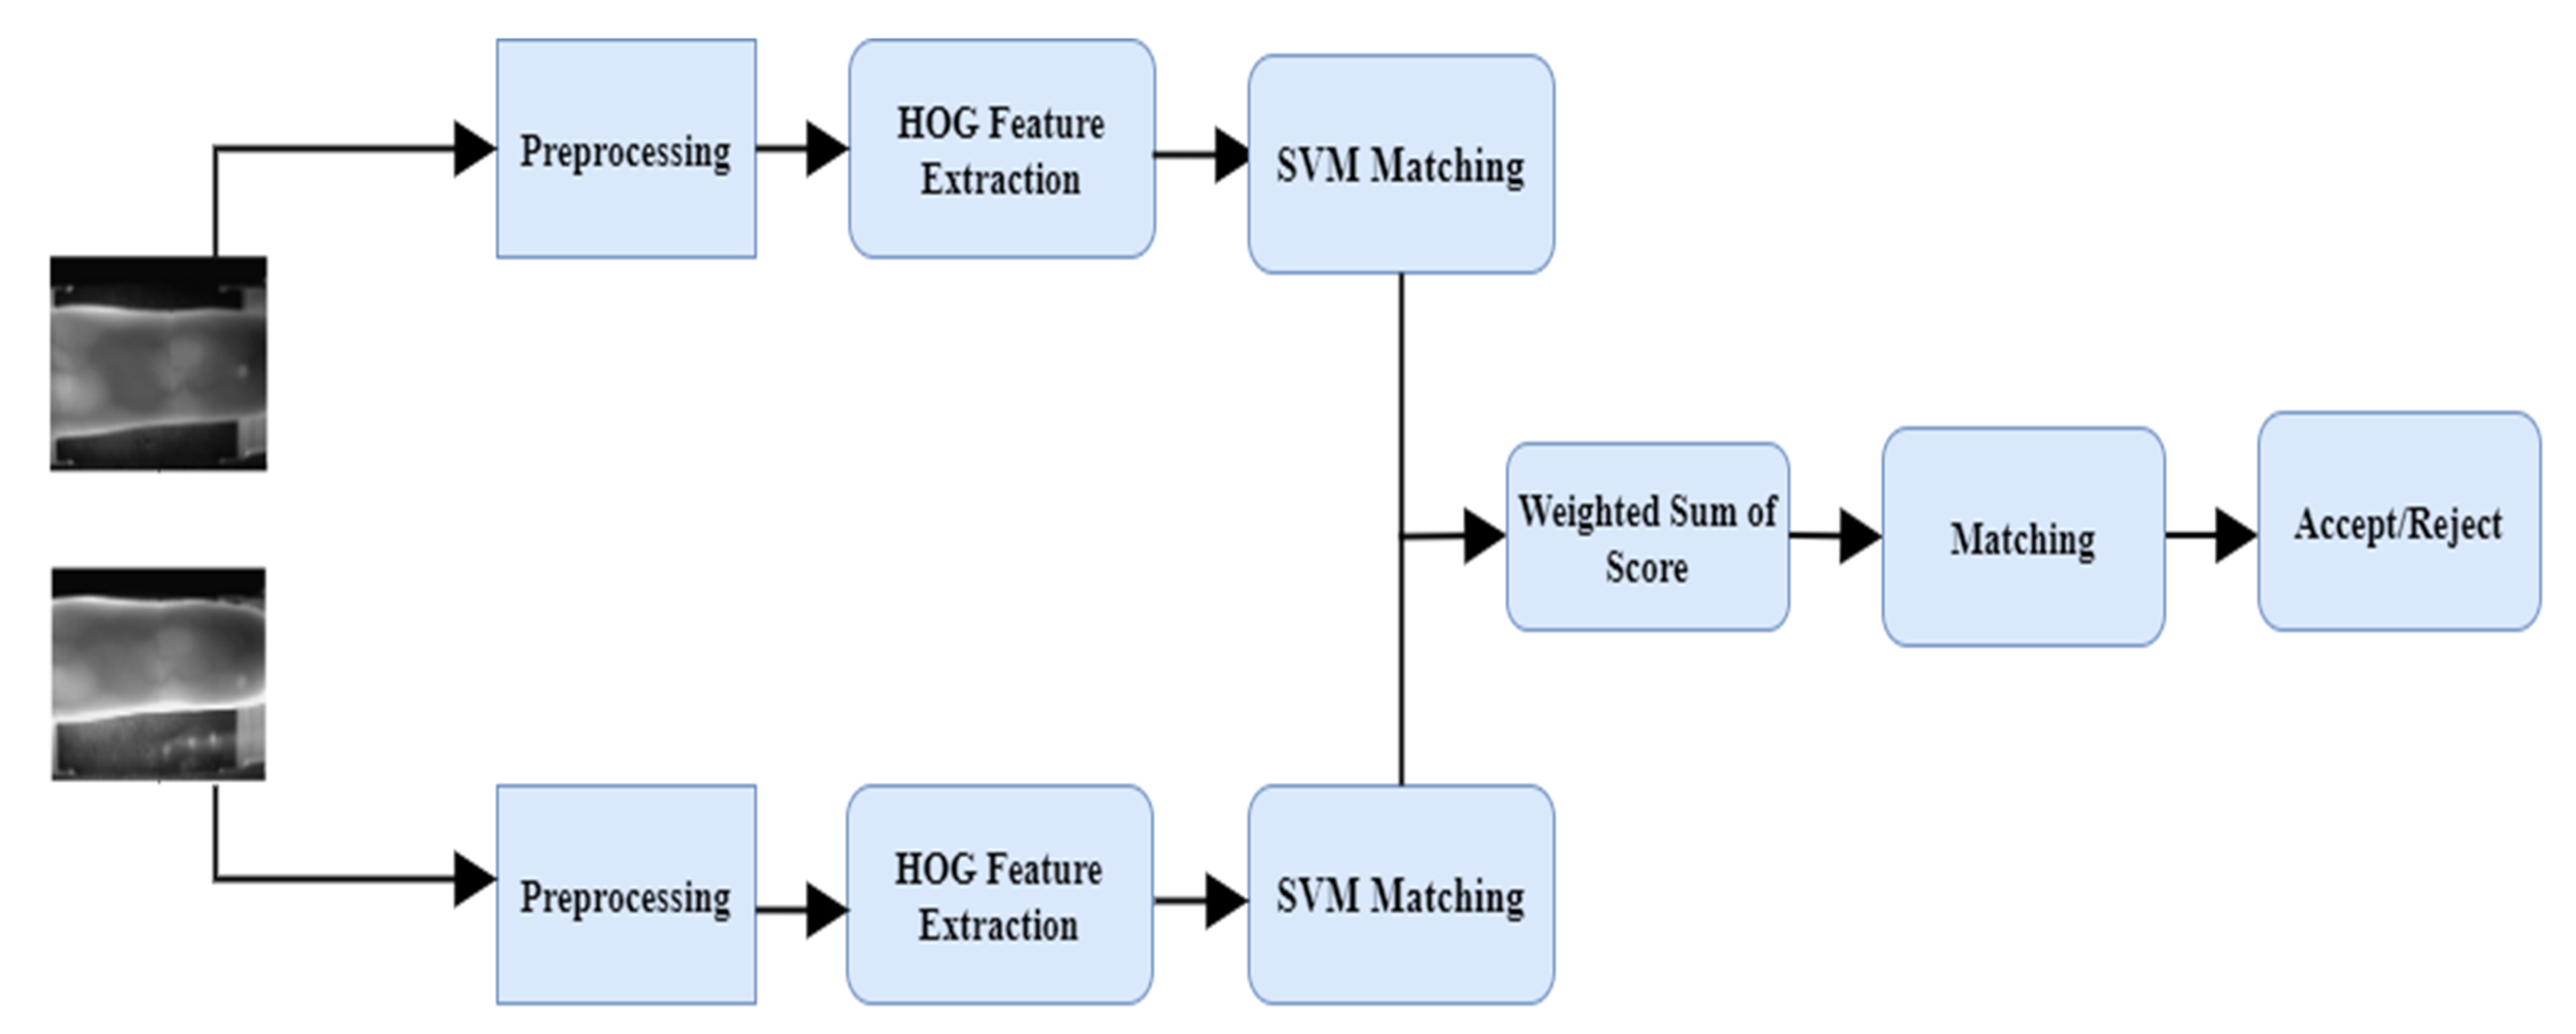
In BSSF, the fusion can be viewed as a SVM combination problem and termed SVM score fusion, where the score is generated from the scoring function of trained SVM on the HOG feature of each finger vein instance. The resulting SVM scores of each finger vein instance are then multiplied with the score weight-optimized using a Bayesian optimizer. The scores will be fused with a weighted sum for final decision (accept or reject). In this context, the hyperparameters of HOG feature extractor, SVM matcher, and the weights infusion are optimized using Bayesian optimization approach. The overall framework of the proposed BSSF is presented in Figure 1.
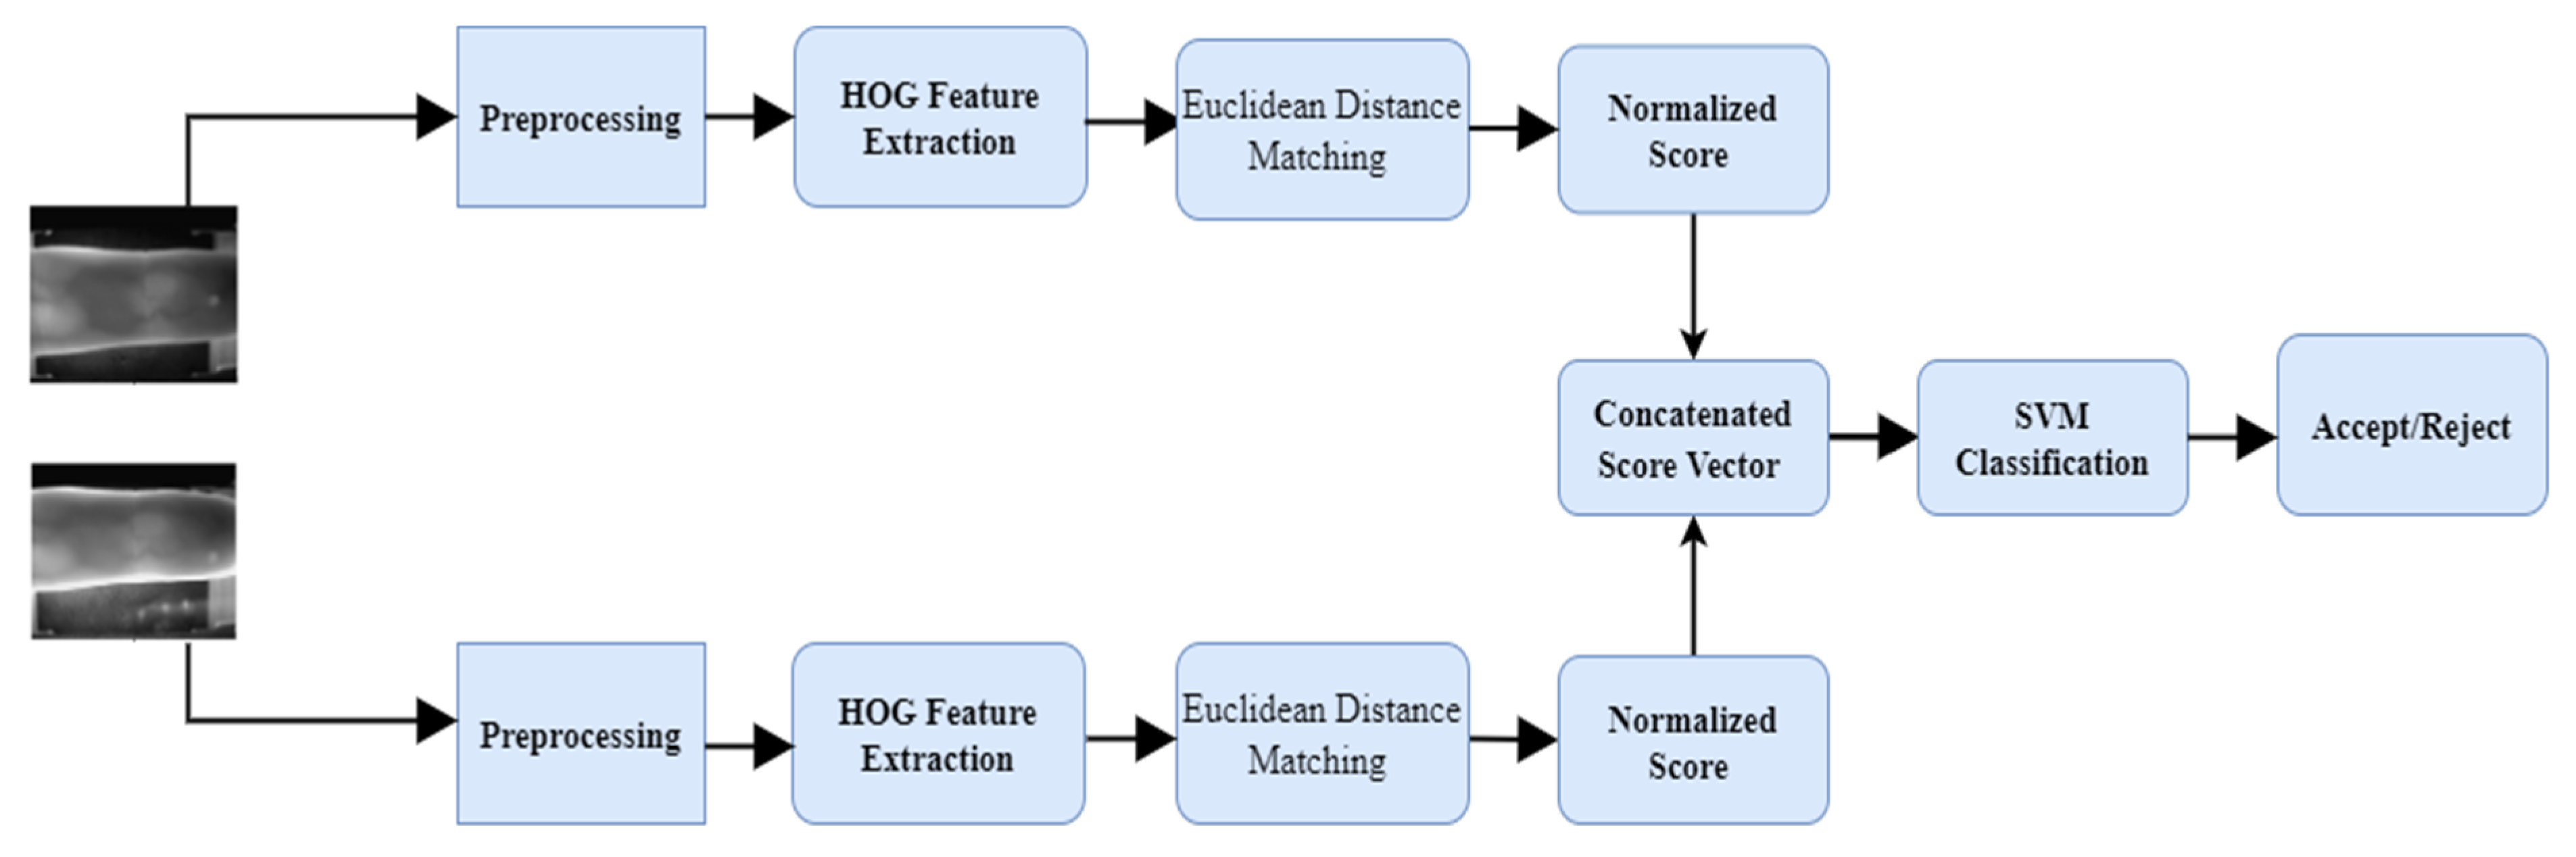
In the second classification approach which is termed as SVM based fusion (BSBF), the HOG feature of different instances is matched using Euclidean distance to construct the normalized scores. For example, the resulting scores of the index and middle finger are concatenated as a score vector. The score vector is then fed into SVM for classification purposes. The overall framework of the proposed BSBF is presented in Figure 2.
4.1. Preprocessing
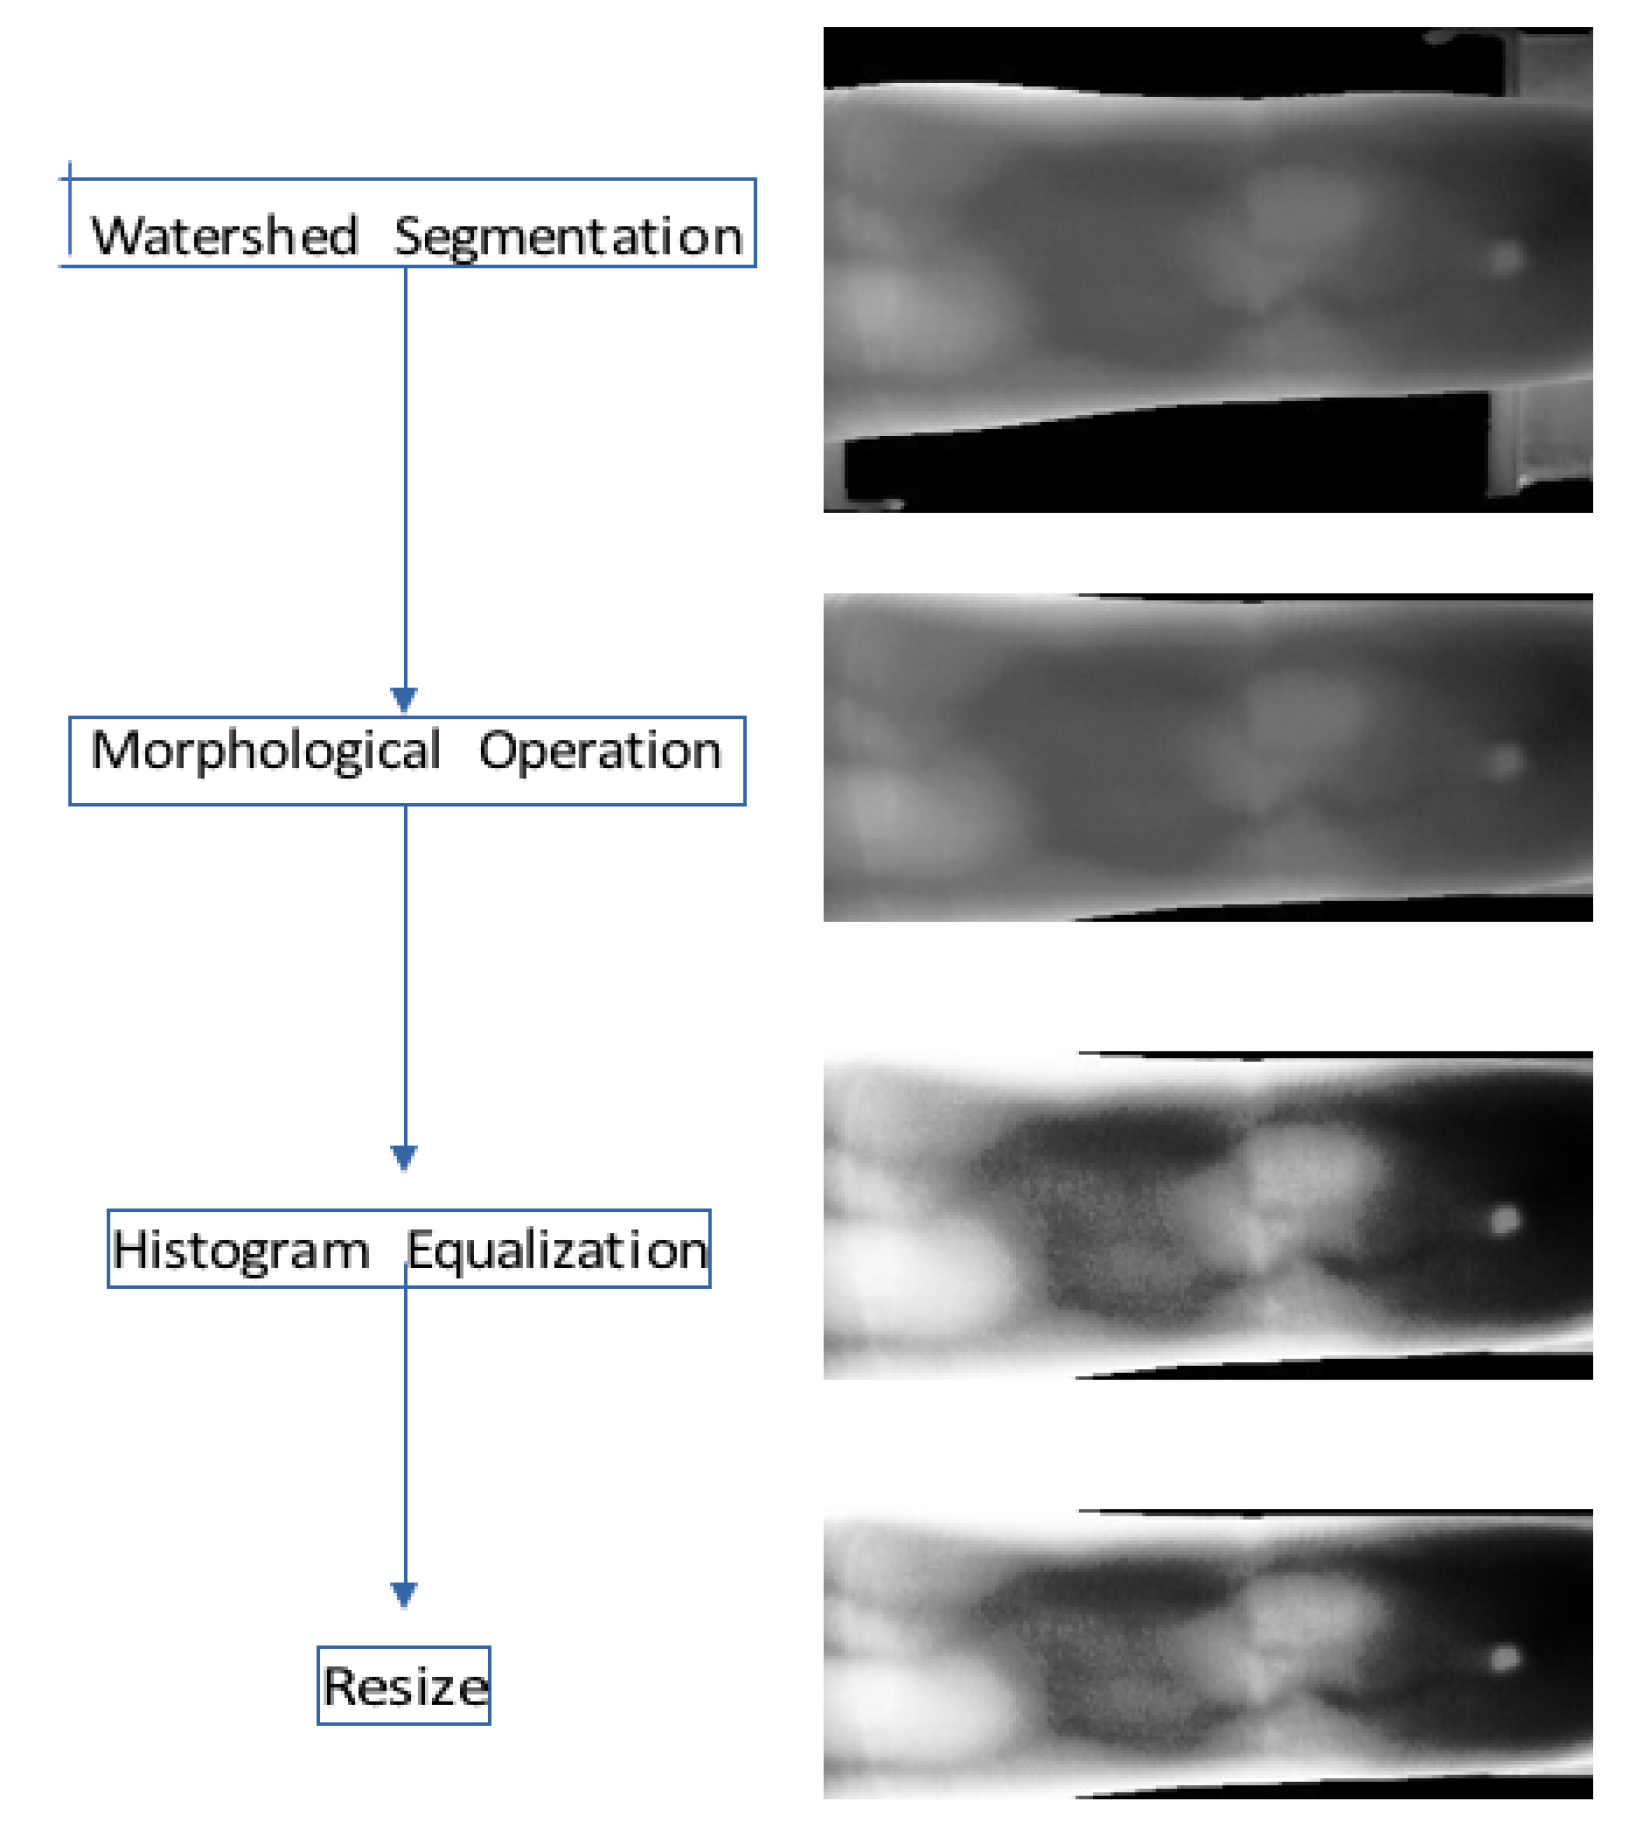
Preprocessing helps to enhance the quality of the finger vein images, which will aid to improve the performance of the system in turn. In the proposed method, preprocessing is divided into different processes which include watershed segmentation, morphological operation, histogram equalization, and image resize. Watershed segmentation is used to segment the finger from the background and obtain the ROI. It works by treating the input image as an elevation map based on the pixel values and flooding the basins from user-defined markers. The markers label the flooded region as either finger vein structure or background image. Morphological operation is then used to further remove unwanted background. It does so by removing small regions and dark regions since the whole finger region is typically big and gray. Histogram equalization is subsequently applied to increase the contrast of the image by more evenly distributing the pixel values through the use of the histogram. Image resizing is performed to change the size of the input image to a fixed size since many matchers require a fixed input size. The preprocessing steps involved are illustrated in Figure 3.
4.2. Feature Extraction
In the proposed method, a histogram of oriented gradients (HOG) is adopted for finger vein feature extraction. HOG is a popular feature descriptor proposed for object recognition [2]. Based on optimization findings, the finger vein image can be optionally normalized with power-law compression to achieve illumination invariance, which is determined by the hyperparameter transform_sqrt. The finger vein image is then divided into small connected regions called cells with the size of pixels × pixels. In each cell, the gradient is computed, which is then used to create a histogram where the histogram bins, with the size of orientations, are based on the orientation of the gradient, and the histogram value is based on the magnitude of the gradient. Next, the cells are grouped into large spatial blocks and each block is then normalized. The final histogram is computed from normalized gradient orientation of all cells within the block. This normalization results in better invariance to changes in illumination and edge contrast. There are four choices of block normalization, determined by the hyperparameter norm, used in HOG for optimization purposes:
- L2:
- L2-Hys: L2, followed by limiting the maximum value of v to 0.2, and renormalizing.
- L1-sqrt: )
- L1: )
where v is the histogram vector of a block and ϵ is a very small constant to prevent division by zero. After that, all the histograms are appended to form the final HOG feature set. In summary, the hyperparameters λ of HOG are:
λHOG = {orientations, pixels, cells, norm, transform_sqrt}
4.3. Fusion and Matching with BSSF and BSBF
Next, the extracted HOG features are fused and matched using SVM based on the implementation of BSSF and BSBF. SVM is a classifier that classifies data by constructing a hyperplane to separate the training data of a class to the nearest training data of other classes with the largest distance. Another characteristic of SVM is the use of kernel function, which allow SVM to classify nonlinear data by creating a similarity matrix between the data for classification purpose.
Given a sample of N independent and identically distributed training instances where xi is the D dimensional input vector (HOG feature) and yi ∈ {−1, 1} is its class label, and the kernel function k (xi, xt) where xt is the test instances. The SVM is trained by optimizing the following:
maximize
with respect to
subject to
where α is the dual coefficients and C is the regularization hyperparameter. The hyperparameter C will be optimized by Bayesian optimizer. After training, the resulting discriminant function of the SVM is:
The proposed system is tested with two kernel functions: linear kernel and radial basis function (RBF) kernel. The linear kernel formulation can be seen in the following:
In summary, the hyperparameter λ of linear SVM is
The RBF kernel can be formulated with the following:
where x and x′ are the HOG vector and γ is the width of the RBF kernel. The hyperparameter γ is optimized by Bayesian optimizer. In summary, the hyperparameters λ of RBF SVM are:
BSSF works by multiplying the weight with the resulting score from SVM prediction and summing them. The summed score is then used to determine a match. The weights are optimized with Bayesian optimization. The BSSF function is given by:
where w is the weight of the score and is the fused score.
BSBF works by computing the score between two samples of a finger vein instance with Euclidean distance matcher. The Euclidean distance is defined as:
The resulting scores from each finger vein instance are then concatenated as a score vector and normalized with z-score normalization as follows:
where S is the score vector from the matcher, s ∈ S, s′ is the normalized score, mean(S) is the arithmetic mean of S, and std (S) is the standard deviation of S. The normalized score vector is then fed into SVM for classification.
4.4. Optimization
Optimization is an iterative process to find the desired solution (minimum or maximum) of a problem while satisfying all of its constraints. An optimization problem could be non-linear or linear. In non-linear optimization, search methods are used iteratively before a solution is achieved.
In a typical machine learning model, the model is trained with data to learn or set the parameters p of the model. While parameters are set by the model, the model also has hyperparameters λ that are typically set by the user manually. In other words, given an objective function f to be minimized, a typical machine learning problem solves the following problem:
While this gives decent performance and is easily solvable for some machine learning models, it, unfortunately, leaves out potential higher performance of the model by not optimizing λ. It is also much more difficult to solve when optimizing both as:
The basic method to solve this is with grid-based search or random search of the hyperparameters. While usable, the problem with hyperparameter optimization is that each evaluation of the hyperparameters is very expensive, since it requires retraining the model. Hence, it is important for hyperparameter optimization to use as little evaluation of objective function as possible. Bayesian hyperparameter optimization is better than grid or random search since it uses previous optimization results for the next optimization, allowing it to be more efficient [13]. Bayesian optimization is also used due to its nature as a non-gradient-based optimizer and has high compatibility. since not all objective functions of machine learning models provide gradient information for optimization [11].
Specifically, the proposed Bayesian optimization can be formalized as sequential model-based optimization (SMBO) [14]. SMBO is started by first initializing a probabilistic regression model M using a small set of samples from domain χ, which is the range of hyperparameters to be optimized. A new sample is selected by optimizing an acquisition function A which uses the model as a cheap surrogate for the expensive objective function f (for BSSF or BSBF). Each sample xi produces an observation of the objective function yi = f (xi). The new sample is appended to the set of all samples or data Q = {(x1, y1),…,(xi, yi)}, which is later used to update the model. A limit T is used to restrict the number of optimization runs. This process is presented in Algorithm 1 [Adapted with permission from [14]].
| Algorithm 1 Sequential Model-Based Optimization (SMBO) |
| Data: // initialize dataset with random samples from domain InitSamples // run for T steps for to do // train a model based on data FitModel // select best hyperparameters based on model ; // evaluate the hyperparameters // append new data end |
SMBOs can be roughly differentiated by their regression models and acquisition functions. In this work, tree-structured parzen estimator (TPE) [15] is used as the regression model and expected improvement (EI) is used as the acquisition function. The SMBO with TPE algorithm is used to optimize the HOG hyperparameters, the SVM hyperparameters, and the weights of the score level fusion. The use of optimization exhibits better results than using a fixed combination of hyperparameters while being faster than using the brute force approach to search for the best combination of hyperparameters. In our implementation, the objective function of BSSF method can be seen in Algorithm 2. The objective function of BSBF method can be observed in Algorithm 3.
| Algorithm 2 BSSF Objective Function |
| Input: Output: error rate // use hyperparameters from Bayesian optimizer trial from Bayesian optimizer; trial from Bayesian optimizer; trial from Bayesian optimizer; // run for each finger for do // HOG feature extraction from data GetHOG ( GetHOG ( // train SVM using HOG features SVMFit(; // use the trained SVM to predict test data to produce probability, which is used as score SVMPredict( // weighted sum of scores for all fingers ; end // calculate EER by comparing prediction with actual result return eer; |
| Algorithm 3 BSBF Objective Function |
| Input: Output: error rate // use hyperparameters from Bayesian optimizer trial from Bayesian optimizer; trial from Bayesian optimizer; // run for each finger for do // HOG feature extraction from data GetHOG( // calculate Euclidean distance from data ; // normalize the scores Normalize(); end // concatenate all the scores from each finger as a score vector // split dataset into train and test data TrainTestSplit(; // train a SVM model SVMFit( // use the trained model to predict test data SVMPredict(); // calculate EER GetEER( return eer; |
5. Experimental Analysis
5.1. Experimental Setup
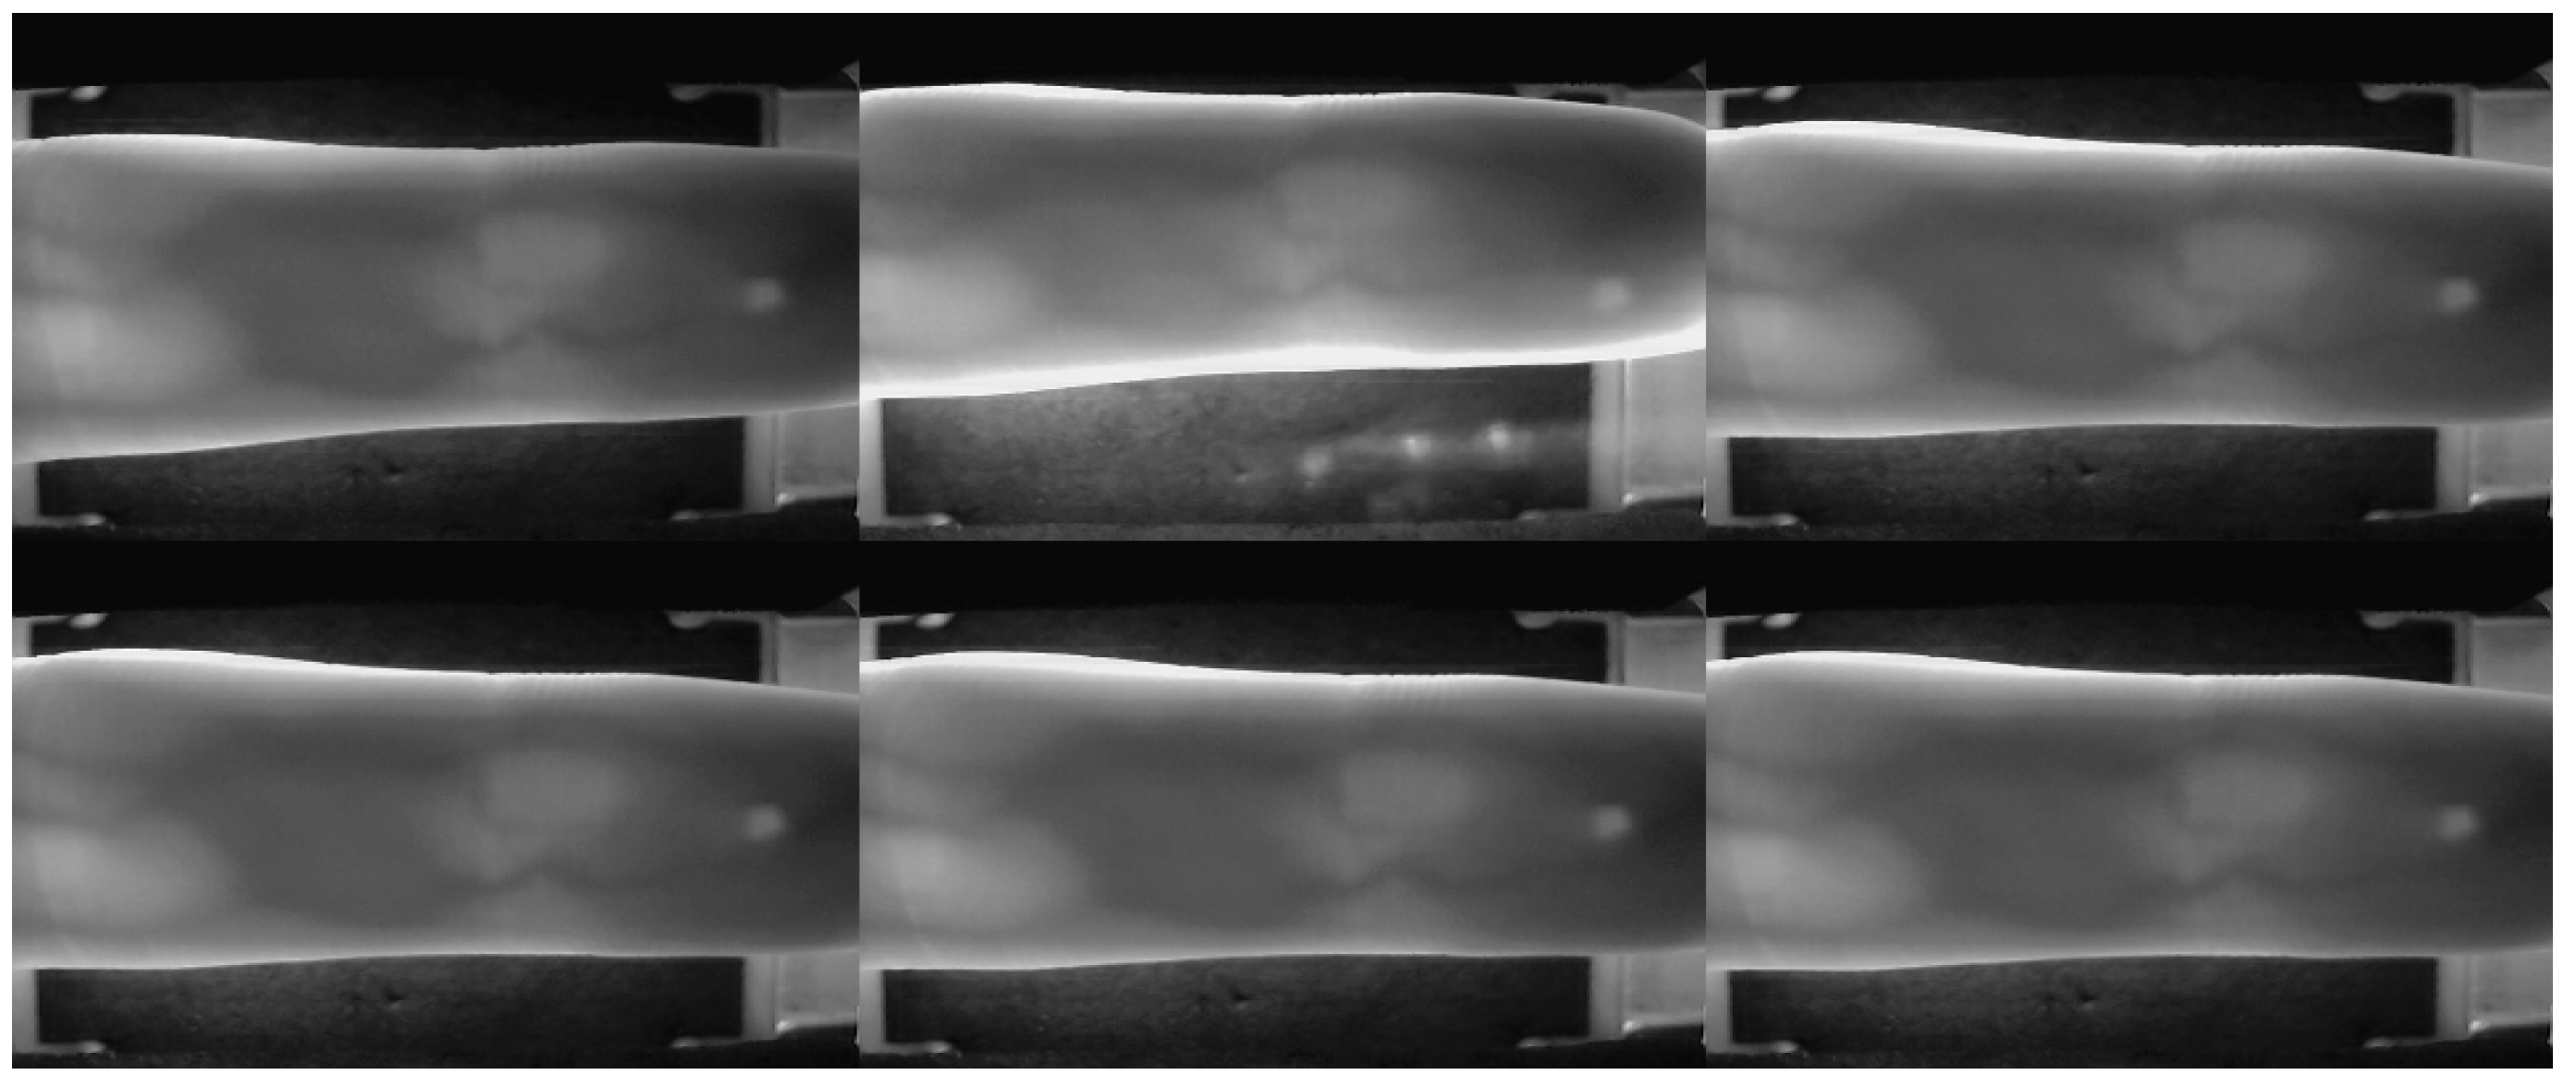
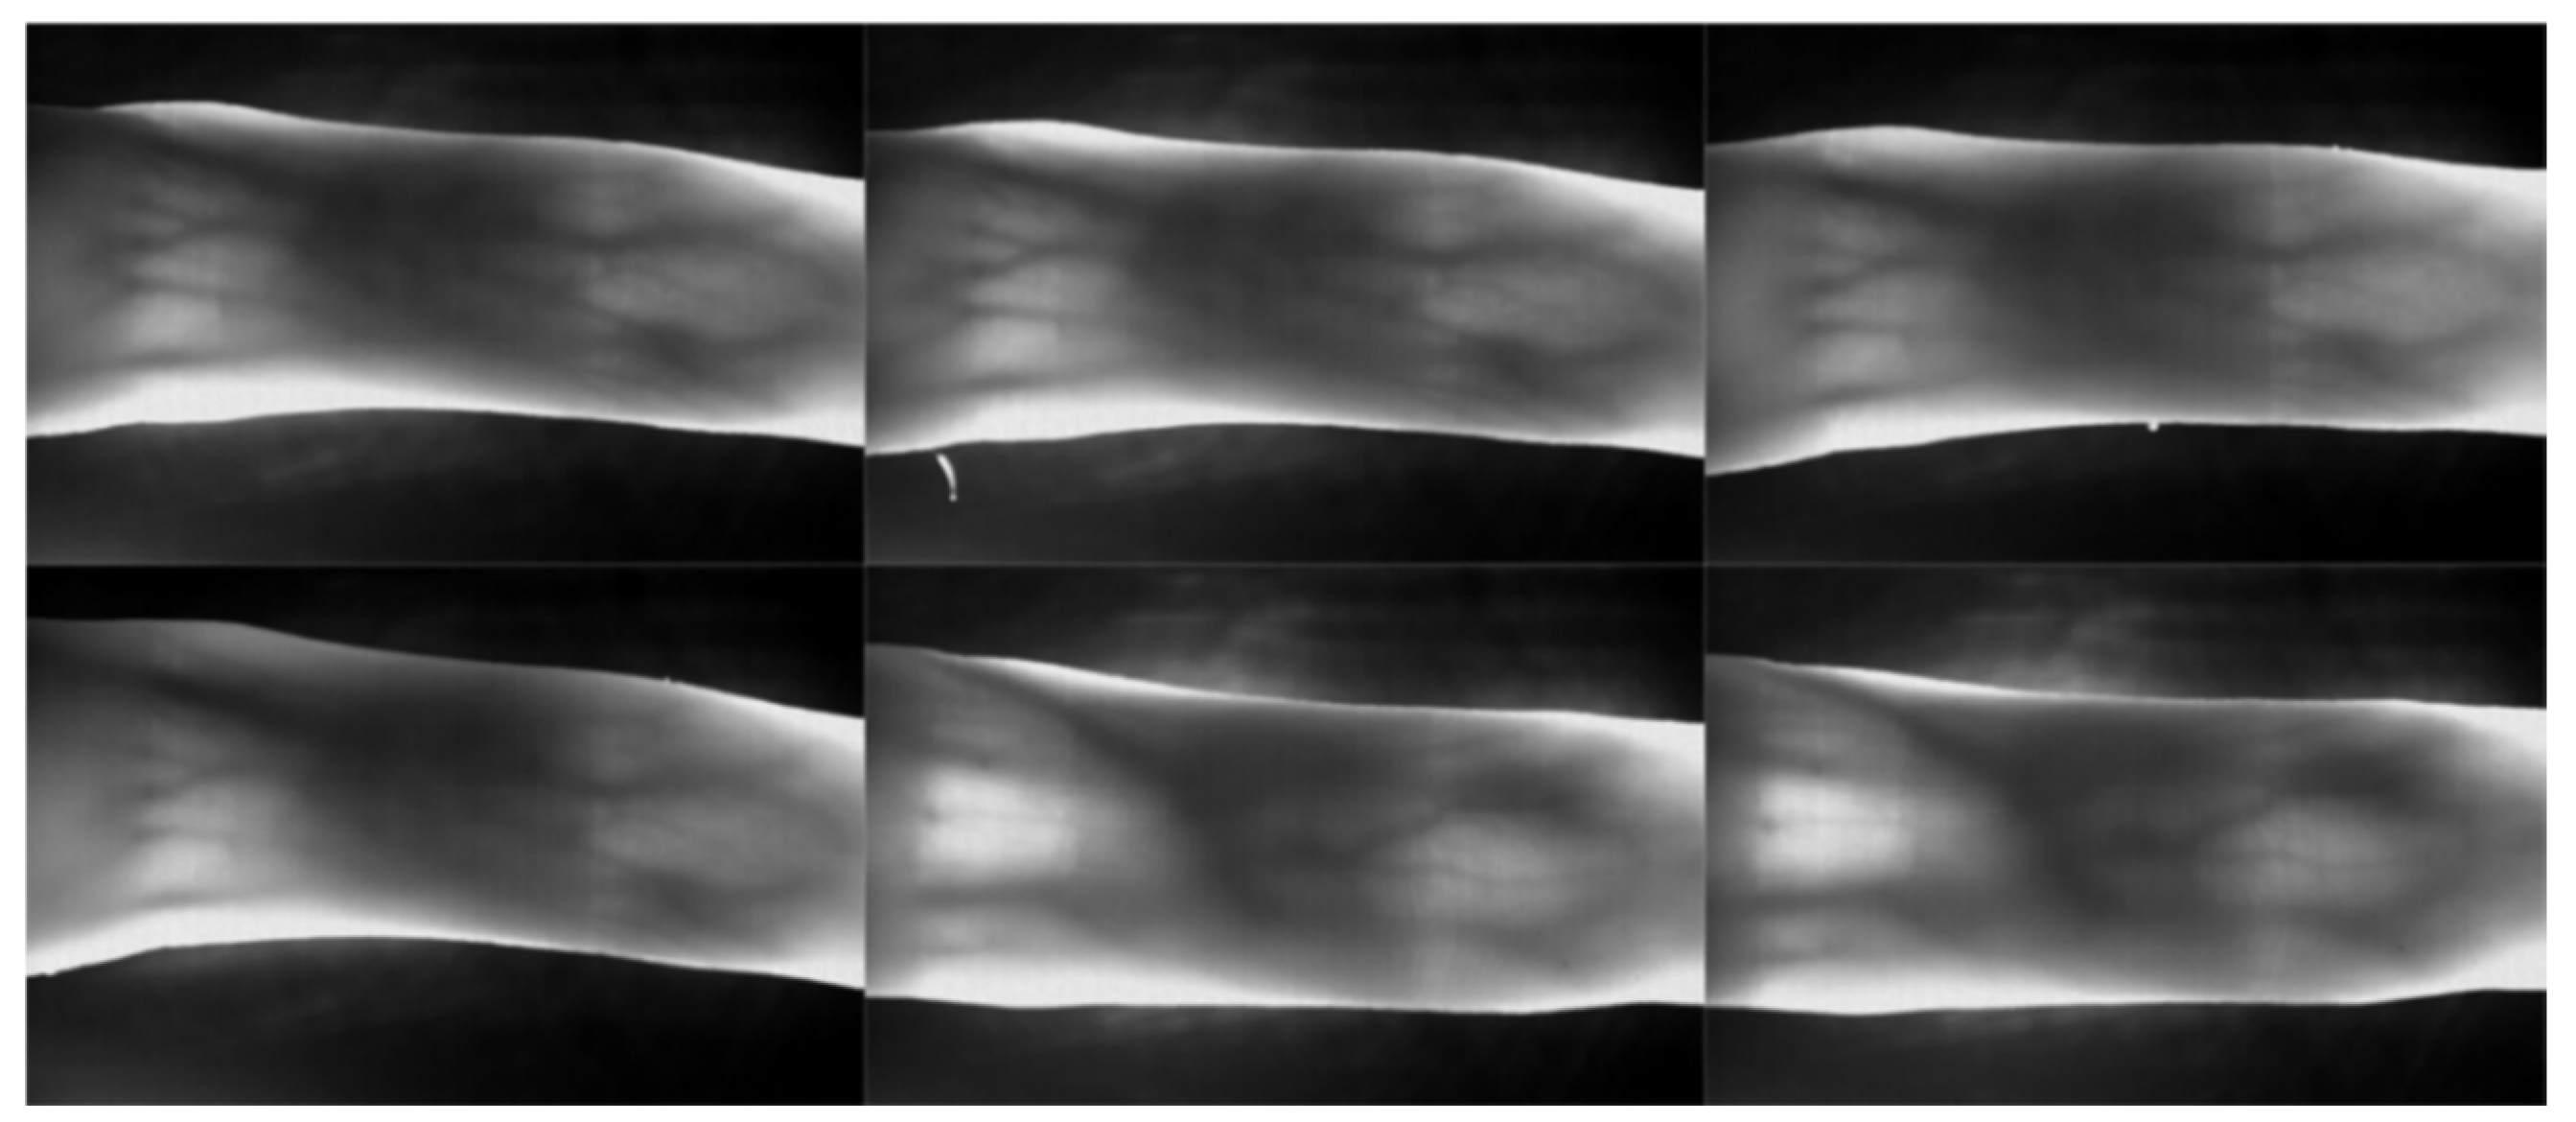
In this work, two publicly available datasets are used for the experimental evaluation of the proposed methods. The SDUMLA-HMT database is the first dataset used. It is a homologous multimodal traits database from the Group of Machine Learning and Applications, Shandong University (SDUMLA) [16]. The SDUMLA-HMT database contains data from 106 individuals of different biometric traits. The biometric traits available in the database include the face, finger vein, gait, iris, and fingerprint. As the focus of this study is on finger vein recognition, only the SDUMLA-HMT finger vein database is used. The images from the index, middle, and ring fingers of both hands were collected six times for 106 individuals. Therefore, there are a total of 3816 (106 individuals × 6 fingers × 6 samples) images in the dataset. Each image is stored in a “bmp” format with the size of 320 × 240 pixels. Some samples of finger vein images in the dataset are shown in Figure 4.
University of Twente Finger Vascular Pattern (UTFVP) dataset is the second dataset used for experimental evaluation. The dataset was collected from 60 individuals with 73% male, 87% right-handed, and 82% aged 19–30 at Twente University [17]. The finger vein images were captured with a local custom device. Each individual provides the index, middle, and ring finger of both hands, and each finger is sampled four times. In total, there are 1440 (60 individuals × 3 fingers × 2 hands × 4 samples) images in the dataset. Each of them is in a “png” format with 672 × 380 pixels in size. The samples of finger vein images from UTFVP can be seen in Figure 5.
For the subsequent experimental analysis purpose, the following conventions are used: li stands for the left index finger, lm stands for the left middle finger, lr stands for the left ring finger, linear1 stands for linear SVM matching without optimization, linear2 stands for linear SVM matching with optimization, while rbf1 stands for RBF SVM matching without optimization, rbf2 stands for RBF SVM matching with optimization, BSSF stands for Bayesian optimized SVM score fusion, and BSBF stands for Bayesian optimized SVM based fusion. Equal error rate (EER) is used as the performance measurement of the proposed methods. EER is the rate at which the false acceptance rate and false rejection rate are (almost) equal. In this work, linear1 and rbf1 are used to serve as a baseline score level fusion method for comparison purpose.
The proposed system is tested with stratified three-fold cross-validation to ensure the validity of the system. The optimization of the hyperparameters is also done with the cross-validation using a different random seed from the test cross-validation to prevent overfitting to the test cross-validation [18].
5.2. Performance Analysis of Multi-Instance Feature Descriptors Biometrics
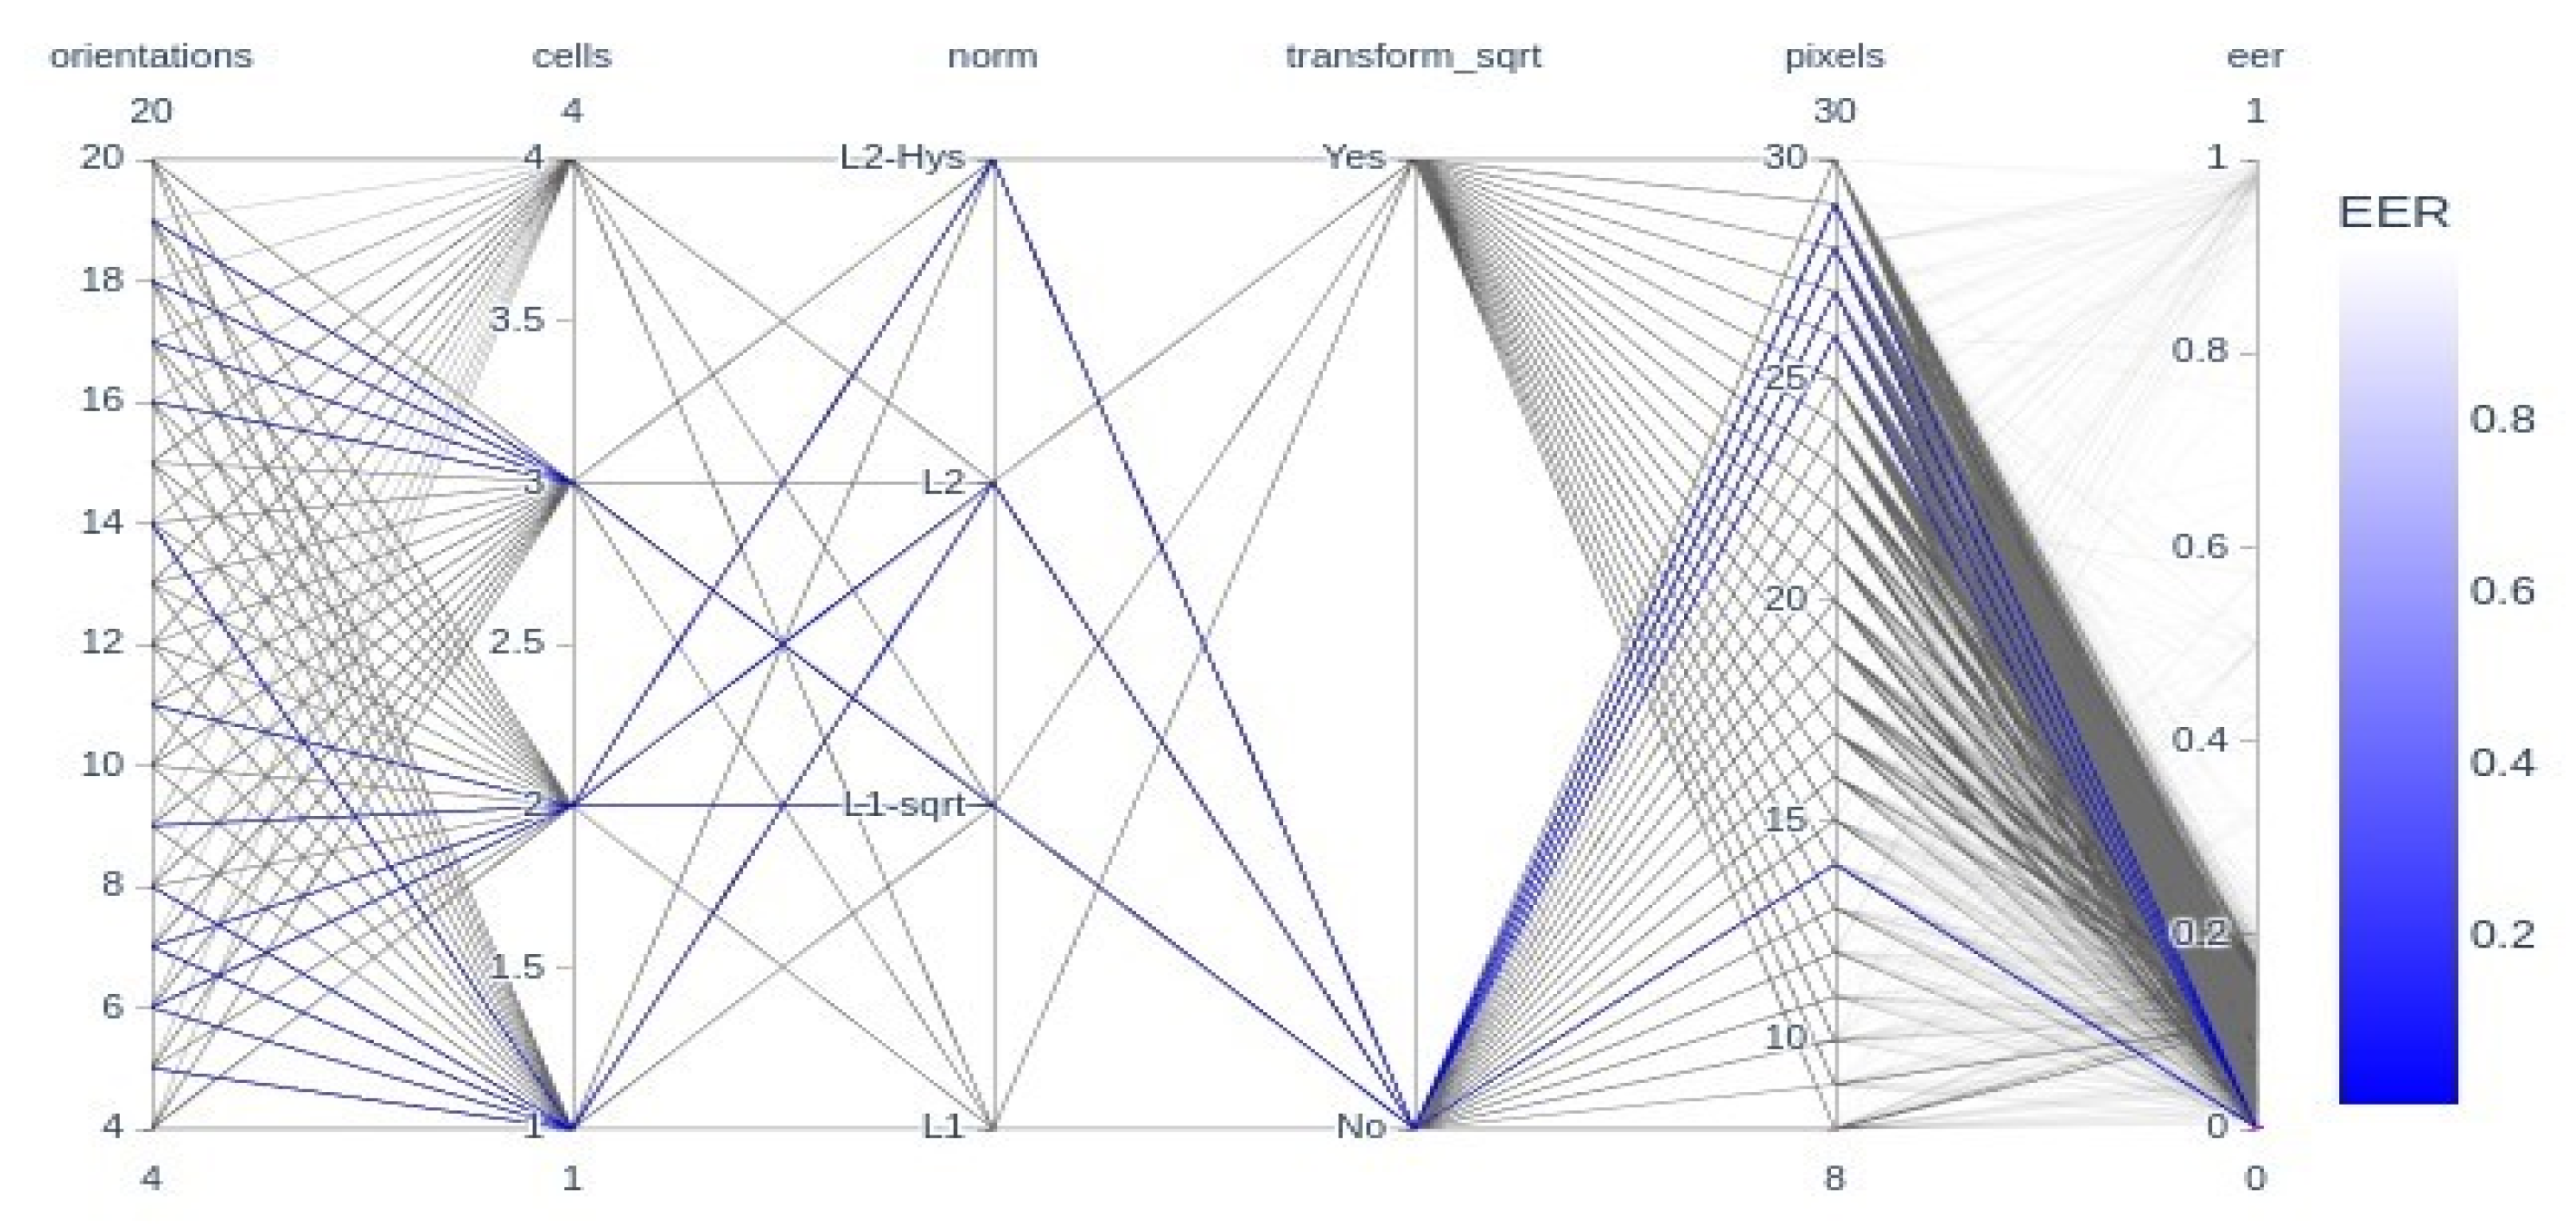
The proposed system uses the Bayesian optimization approach to search for an optimal set of hyperparameters of the histogram of oriented gradients (HOG). The hyperparameters are: orientations, pixels, cells, norm, and transform_sqrt. Orientations is the number of orientations. Pixels is the number of pixels in a cell, while Cells is the number of cells in a HOG block. Norm is the type of block normalization being used, and Transform_sqrt indicates whether the power-law compression is being used to normalize the image before processing. For optimization purposes, the orientations hyperparameter is set in the range of four to twenty. The pixels hyperparameter is set in the range of eight to thirty. The cells hyperparameter is set in the range of one to four. The norm hyperparameter is set for either L1, L1-sqrt, L2, or L2-Hys. On the other hand, the transform_sqrt hyperparameter is set to Yes or No.
Figure 6 depicts the parallel coordinates plot of the hyperparameters. The figure shows the overview of the hyperparameters that give optimal results. The figure consists of all the hyperparameter optimization trials by the Bayesian optimizer for all fingers, datasets, and matchers. Overall, it could be observed that most orientations hyperparameter values, and most cells hyperparameter values are in the range of one to three, whereas L2 and L1-sqrt norm, without transform_sqrt, and high pixels hyperparameter values in the range of twenty-six to twenty-nine are optimal.
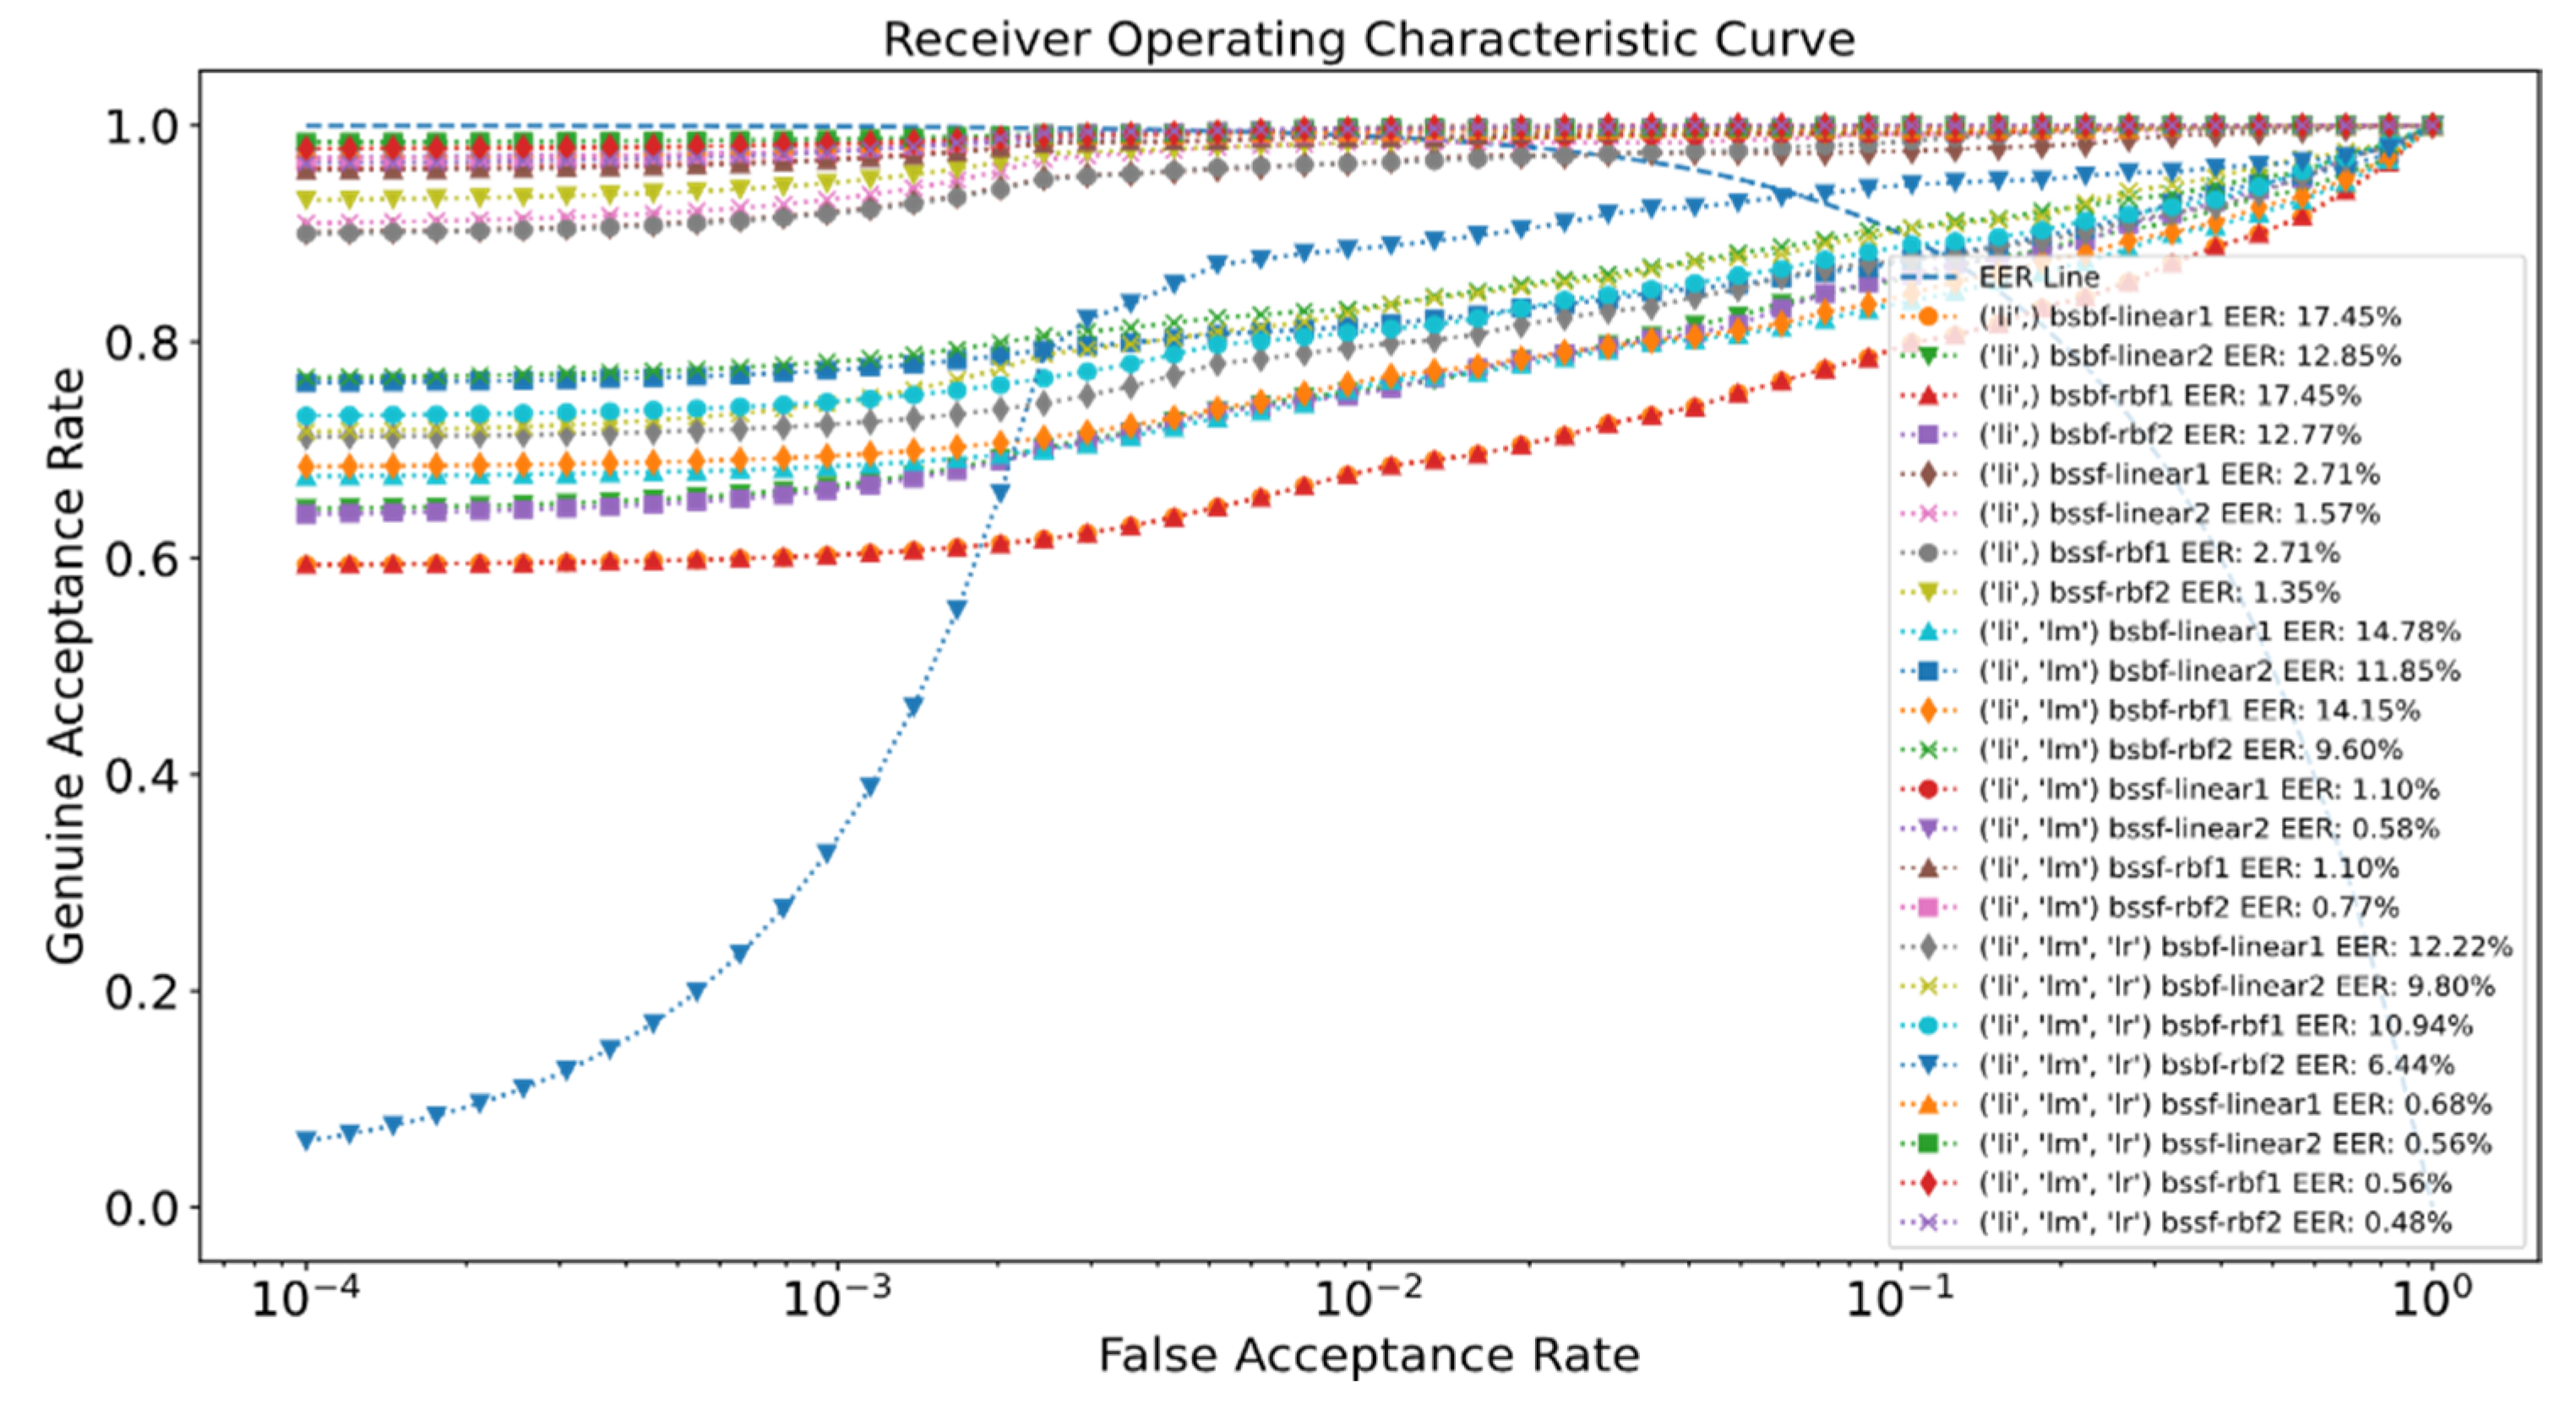
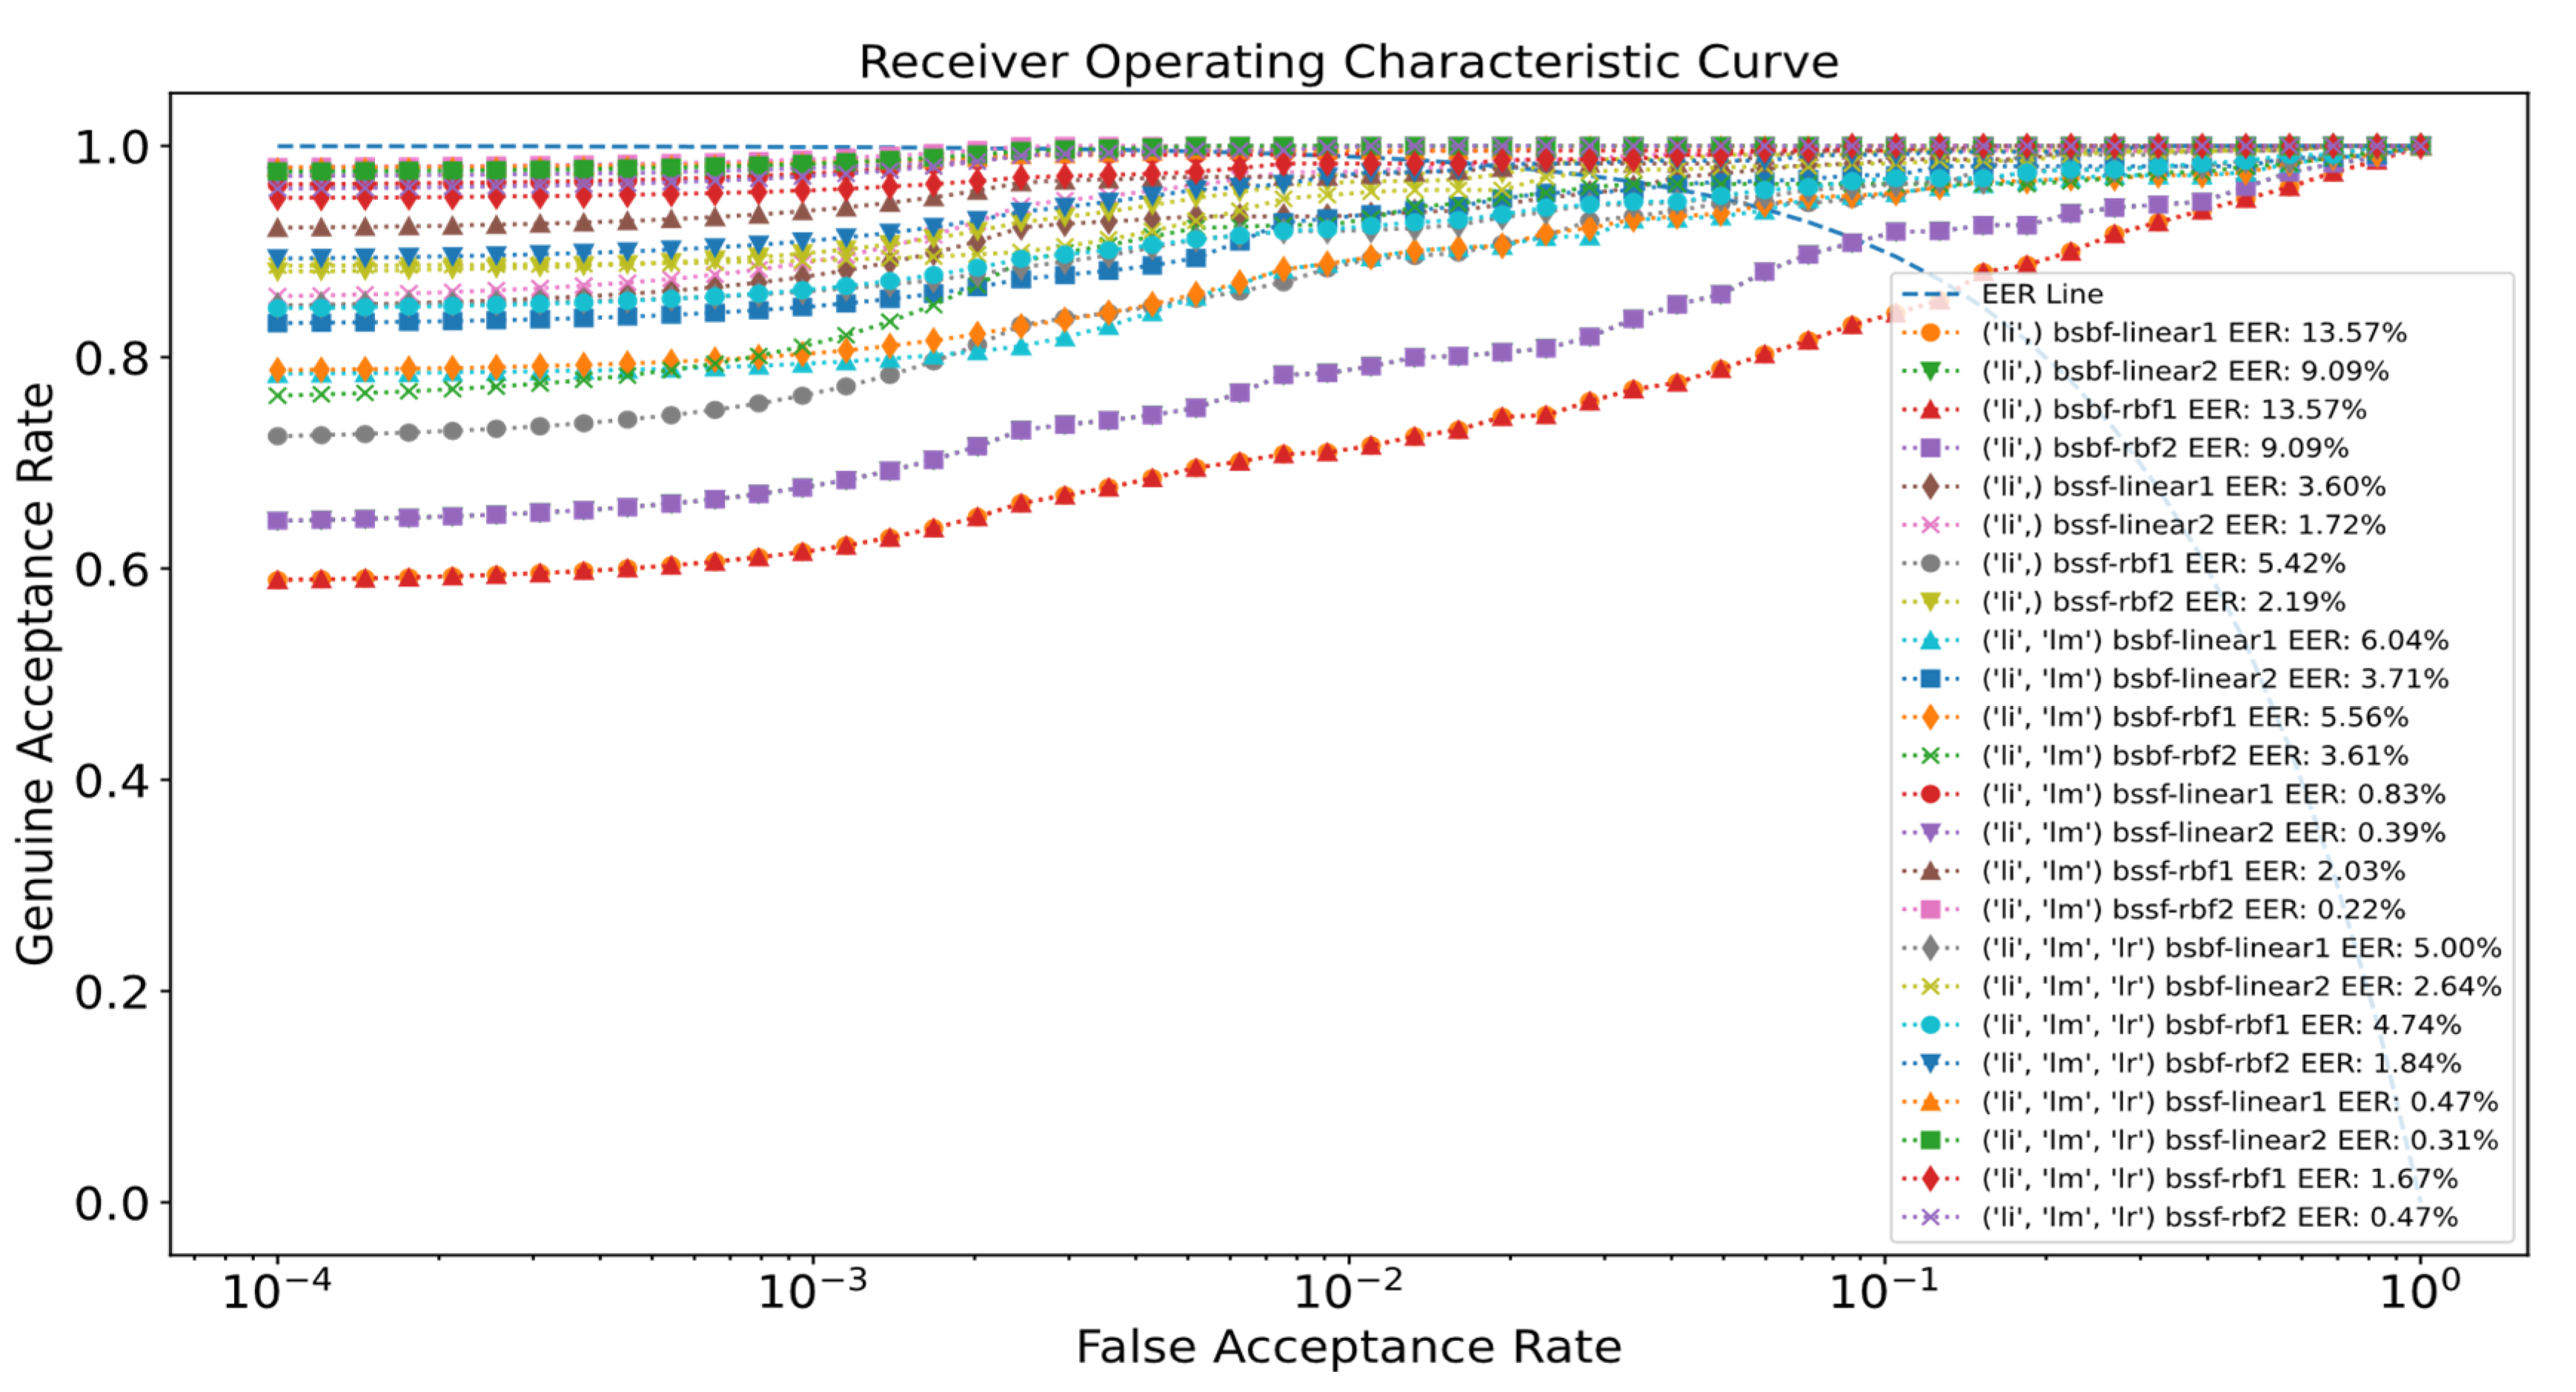
The experimental results of the proposed methods for SDUMLA-HMT are presented in Table 1. The ROC curve of the proposed system for SDUMLA-HMT is illustrated in Figure 7. For the UTFVP dataset, the experimental results of the proposed method can be seen in Table 2, while the ROC curve of the proposed system for UTFVP is depicted in Figure 8.
Table 1 shows the EER for the different matching techniques with optimizations using the SDUMLA-HMT dataset. It can be observed that BSSF with RBF kernel, in general, gives the best result. The lowest EER for the left index finger (li) alone is 1.35%. The fusion of the left index and middle fingers is able to attain better performance with an EER of 0.77%, although it is slightly inferior to the linear kernel (BSSF-linear2) at 0.58%. The best performance can be achieved by combining the left index, middle, and ring fingers with the lowest EER of 0.48% in the RBF kernel. As compared to the BSSF approach, the performance of BSBF is slightly poorer with higher EER for both linear and RBF Kernel. The best results of the BSBF approach are with an EER of 6.44% with RBF kernel by combining the three finger vein instances.
The EER for the UTFVP dataset is presented in Table 2. It can be observed that the performance of the proposed methods tested using different optimization settings for different finger vein combinations is presented. It can be observed that BSSF-linear2, in general, gives better results with the EER of 1.72% for the left index finger. The lowest EER that combines the left index, middle, and ring fingers is 0.31% for BSSF-linear2. Amongst the results, BSSF-rbf2 gives the best EER of 0.22% when using the left index and middle finger. Similar to Table 1, the BSSF method outperforms BSBF in terms of EER. The lowest EER achieved for the BSBF method is 1.84% by using the RBF kernel. To conclude, both the SDUMLA-HMT and UTFVP datasets are able to attain the best performance by using the BSSF approach with RBF kernel, with EERs as low as 0.48% and 0.22%, respectively.
6. Conclusions and Future Works
In this work, two Bayesian optimized score level fusion approaches, namely BSSF and BSBF are presented for multi-instance finger vein recognition. The proposed system supersedes sum rule fusion by using Bayesian optimization in large parts of the system, whereby the optimizations are applied in HOG extraction, SVM matching, and weighted sum rule fusion for robust performance. As for future studies, different biometric traits, such as face or iris, will be explored to evaluate the performance of the proposed methods. Other feature descriptors, such as local binary patterns (LBP) could also be integrated into the proposed system to evaluate its performance.
Author Contributions
Conceptualization, J.H.T., T.S.O. and K.S.M.A.; methodology, J.H.T. and T.S.O.; software, J.H.T.; validation: T.C. and P.P.M.; writing—original draft preparation, J.H.T.; writing—review and editing, T.S.O., T.C., K.S.M.A. and P.P.M.; funding acquisition, T.S.O. All authors have read and agreed to the published version of the manuscript.
Funding
This work is supported by the Fundamental Research Grant Scheme (FRGS) of the Ministry of Higher Education Malaysia (Grant Number: FRGS/1/2019/ICT02/MMU/02/14).
Institutional Review Board Statement
Not Applicable.
Informed Consent Statement
Not Applicable.
Data Availability Statement
SDUMLA-HMT dataset: https://time.sdu.edu.cn/kycg/gksjk.htm. UTFVP dataset: https://www.idiap.ch/software/beat/platform/databases/utfvp/1/ (accessed on 10 January 2022).
Conflicts of Interest
The authors declare no conflict of interest.
References
- Ross, A.; Jain, A.K. Multimodal Biometrics: An Overview. In Proceedings of the Signal Processing Conference, Vienna, Austria, 6–10 September 2004; pp. 1221–1224. [Google Scholar]
- Dass, S.C.; Nandakumar, K.; Jain, A.K. A Principled Approach to Score Level Fusion in Multimodal Biometric Systems. In International Conference on Audio- and Video-Based Biometric Person Authentication; Springer: Berlin/Heidelberg, Germany, 2005; pp. 1049–1058. [Google Scholar] [CrossRef] [Green Version]
- Dalal, N.; Triggs, B. Histograms of Oriented Gradients For Human Detection. In Proceedings of the 2005 IEEE Computer Society Conference On Computer Vision And Pattern Recognition (CVPR), San Diego, CA, USA, 20–25 June 2005; Volume 1, pp. 886–893. [Google Scholar] [CrossRef] [Green Version]
- William, A.; Ong, T.S.; Lau, S.H.; Goh, M.K.O. Finger Vein Verification Using Local Histogram of Hybrid Texture Descriptors. In Proceedings of the 2015 Ieee International Conference On Signal And Image Processing Applications (Icsipa), Kuala Lumpur, Malaysia, 19–21 October 2015; pp. 304–308. [Google Scholar] [CrossRef]
- Cui, F.; Yang, G. Score Level Fusion of Fingerprint and Finger Vein Recognition. J. Comput. Inf. Syst. 2011, 7, 5723–5731. Available online: https://www.researchgate.net/publication/267206184_Score_Level_Fusion_of_Fingerprint And_Finger_Vein_Recognition (accessed on 10 January 2022).
- Yang, J.; Zhang, X. Feature-Level Fusion Of Fingerprint And Finger-Vein For Personal Identification. Pattern Recognit. Lett. 2012, 33, 623–628. [Google Scholar] [CrossRef]
- Yang, Y.; Lin, K.; Han, F.; Zhang, Z. Dynamic Weighting For Effective Fusion of Fingerprint And Finger Vein. Pica. Prog. Intell. Comput. Appl. 2012, 1, 50–61. [Google Scholar]
- He, M.; Horng, S.J.; Fan, P.; Run, R.S.; Chen, R.J.; Lai, J.L.; Khan, M.K.; Sentosa, K.O. Performance evaluation of score level fusion in multimodal biometric systems. Pattern Recognit. 2010, 43, 1789–1800. [Google Scholar] [CrossRef]
- Khellat-Kihel, S.; Abrishambaf, R.; Monteiro, J.L.; Benyettou, M. Multimodal Fusion of The Finger Vein, Fingerprint and The Finger-Knuckle-Print Using Kernel Fisher Analysis. Appl. Soft Comput. 2016, 42 (Suppl. C), 439–447. [Google Scholar] [CrossRef]
- Kim, W.; Song, J.M.; Park, K.R. Multimodal Biometric Recognition Based on Convolutional Neural Network by the Fusion of Finger-Vein and Finger Shape Using Near-Infrared (NIR) Camera Sensor. Sensors 2018, 18, 2296. [Google Scholar] [CrossRef] [PubMed] [Green Version]
- Nickfarjam, A.M.; Najafabadi, A.P.; Ebrahimpour-Komleh, H. Efficient Parameter Tuning for Histogram of Oriented Gradients. In Proceedings of the 2014 22nd Iranian Conference on Electrical Engineering (ICEE), Tehran, Iran, 20–22 May 2014. [Google Scholar] [CrossRef]
- Wang, F.; Han, J. Multimodal biometric authentication based on score level fusion using support vector machine. Opto-Electron. Rev. 2009, 17, 57–64. [Google Scholar] [CrossRef]
- Agrawal, T. Hyperparameter Optimization in Machine Learning; Apress Berkeley: Berkeley, CA, USA, 2021; pp. 81–108. [Google Scholar]
- Dewancker, I.; Mccourt, M.; Clark, S. Bayesian Optimization Primer. 2015. Available online: https://app.sigopt.com/static/pdf/SigOpt_Bayesian_Optimization_Primer.pdf (accessed on 2 January 2022).
- Bergstra, J.S.; Bardenet, R.; Bengio, Y.; Kégl, B. Algorithms For Hyper-Parameter Optimization. Adv. Neural Inf. Processing Syst. 2011, 24, 2456–2554. [Google Scholar]
- Yin, Y.; Liu, L.; Sun, X. SDUMLA-HMT: A Multimodal Biometric Database. In Proceedings of the Biometric Recognition, Beijing, China, 3–4 December 2011; pp. 260–268. [Google Scholar] [CrossRef]
- Ton, B.T.; Veldhuis, R.N.J. A high quality finger vascular pattern dataset collected using a custom designed capturing device. In Proceedings of the 2013 International Conference on Biometrics (ICB), Madrid, Spain, 4–7 June 2013; pp. 1–5. [Google Scholar] [CrossRef]
- Pedregosa, F.; Varoquaux, G.; Gramfort, A.; Michel, V.; Thirion, B.; Grisel, O.; Blondel, M.; Prettenhofer, P.; Weiss, R.; Dubourg, V.; et al. Scikit-learn: Machine Learning in Python. J. Mach. Learn. Res. 2011, 12, 2825–2830. [Google Scholar]
Figure 1.
The Proposed Bayesian optimized SVM Score Fusion (BSSF).

Figure 2.
The proposed Bayesian optimized SVM based fusion (BSBF).

Figure 3.
Preprocessing.

Figure 4.
The sample images of SDUMLA-HMT Finger Vein Dataset.

Figure 5.
The sample images of UTFVP Finger Vein Dataset.

Figure 6.
Parallel Coordinates Plot of the Hyperparameters.

Figure 7.
ROC curve of the proposed system for SDUMLA-HMT.

Figure 8.
ROC curve of the proposed system for UTFVP.


Table 1.
Experimental results of the proposed system for SDUMLA-HMT.
| Fingers | Matchers | Orientations | Pixels | Cells | Norm | Transform_sqrt | EER |
|---|---|---|---|---|---|---|---|
| (‘li’,) | BSBF-linear1 | 9 | 8 | 3 | L2-Hys | Yes | 17.45% |
| (‘li’,) | BSBF-linear2 | 15 | 30 | 2 | L2-Hys | No | 12.85% |
| (‘li’,) | BSBF-rbf1 | 9 | 8 | 3 | L2-Hys | Yes | 17.45% |
| (‘li’,) | BSBF-rbf2 | 9 | 29 | 2 | L2-Hys | No | 12.77% |
| (‘li’,) | BSSF-linear1 | 9 | 8 | 3 | L2-Hys | Yes | 2.71% |
| (‘li’,) | BSSF-linear2 | 16 | 26 | 2 | L1-sqrt | Yes | 1.57% |
| (‘li’,) | BSSF-rbf1 | 9 | 8 | 3 | L2-Hys | Yes | 2.71% |
| (‘li’,) | BSSF-rbf2 | 18 | 26 | 2 | L2-Hys | Yes | 1.35% |
| (‘li’, ‘lm’) | BSBF-linear1 | 9 | 8 | 3 | L2-Hys | Yes | 14.78% |
| (‘li’, ‘lm’) | BSBF-linear2 | 13 | 27 | 3 | L2-Hys | No | 11.85% |
| (‘li’, ‘lm’) | BSBF-rbf1 | 9 | 8 | 3 | L2-Hys | Yes | 14.15% |
| (‘li’, ‘lm’) | BSBF-rbf2 | 19 | 29 | 2 | L2-Hys | No | 9.60% |
| (‘li’, ‘lm’) | BSSF-linear1 | 9 | 8 | 3 | L2-Hys | Yes | 1.10% |
| (‘li’, ‘lm’) | BSSF-linear2 | 14 | 8 | 1 | L1 | Yes | 0.58% |
| (‘li’, ‘lm’) | BSSF-rbf1 | 9 | 8 | 3 | L2-Hys | Yes | 1.10% |
| (‘li’, ‘lm’) | BSSF-rbf2 | 7 | 26 | 2 | L2-Hys | No | 0.77% |
| (‘li’, ‘lm’, ‘lr’) | BSBF-linear1 | 9 | 8 | 3 | L2-Hys | Yes | 12.22% |
| (‘li’, ‘lm’, ‘lr’) | BSBF-linear2 | 17 | 28 | 1 | L2 | No | 9.80% |
| (‘li’, ‘lm’, ‘lr’) | BSBF-rbf1 | 9 | 8 | 3 | L2-Hys | Yes | 10.94% |
| (‘li’, ‘lm’, ‘lr’) | BSBF-rbf2 | 16 | 26 | 1 | L2 | No | 6.44% |
| (‘li’, ‘lm’, ‘lr’) | BSSF-linear1 | 9 | 8 | 3 | L2-Hys | Yes | 0.68% |
| (‘li’, ‘lm’, ‘lr’) | BSSF-linear2 | 8 | 15 | 1 | L2-Hys | No | 0.56% |
| (‘li’, ‘lm’, ‘lr’) | BSSF-rbf1 | 9 | 8 | 3 | L2-Hys | Yes | 0.56% |
| (‘li’, ‘lm’, ‘lr’) | BSSF-rbf2 | 10 | 17 | 1 | L2 | Yes | 0.48% |
Table 2.
Experimental results of the proposed system for UTFVP.
| Fingers | Matchers | Orientations | Pixels | Cells | Norm | Transform_sqrt | EER |
|---|---|---|---|---|---|---|---|
| (‘li’,) | BSBF-linear1 | 9 | 8 | 3 | L2-Hys | Yes | 13.57% |
| (‘li’,) | BSBF-linear2 | 9 | 18 | 1 | L2 | No | 9.09% |
| (‘li’,) | BSBF-rbf1 | 9 | 8 | 3 | L2-Hys | Yes | 13.57% |
| (‘li’,) | BSBF-rbf2 | 9 | 18 | 1 | L2 | No | 9.09% |
| (‘li’,) | BSSF-linear1 | 9 | 8 | 3 | L2-Hys | Yes | 3.60% |
| (‘li’,) | BSSF-linear2 | 14 | 23 | 2 | L1-sqrt | Yes | 1.72% |
| (‘li’,) | BSSF-rbf1 | 9 | 8 | 3 | L2-Hys | Yes | 5.42% |
| (‘li’,) | BSSF-rbf2 | 19 | 28 | 3 | L1-sqrt | No | 2.19% |
| (‘li’, ‘lm’) | BSBF-linear1 | 9 | 8 | 3 | L2-Hys | Yes | 6.04% |
| (‘li’, ‘lm’) | BSBF-linear2 | 19 | 30 | 1 | L1-sqrt | No | 3.71% |
| (‘li’, ‘lm’) | BSBF-rbf1 | 9 | 8 | 3 | L2-Hys | Yes | 5.56% |
| (‘li’, ‘lm’) | BSBF-rbf2 | 20 | 25 | 1 | L2 | Yes | 3.61% |
| (‘li’, ‘lm’) | BSSF-linear1 | 9 | 8 | 3 | L2-Hys | Yes | 0.83% |
| (‘li’, ‘lm’) | BSSF-linear2 | 14 | 14 | 1 | L2 | No | 0.39% |
| (‘li’, ‘lm’) | BSSF-rbf1 | 9 | 8 | 3 | L2-Hys | Yes | 2.03% |
| (‘li’, ‘lm’) | BSSF-rbf2 | 17 | 29 | 3 | L1-sqrt | No | 0.22% |
| (‘li’, ‘lm’, ‘lr’) | BSBF-linear1 | 9 | 8 | 3 | L2-Hys | Yes | 5.00% |
| (‘li’, ‘lm’, ‘lr’) | BSBF-linear2 | 7 | 30 | 1 | L2 | No | 2.64% |
| (‘li’, ‘lm’, ‘lr’) | BSBF-rbf1 | 9 | 8 | 3 | L2-Hys | Yes | 4.74% |
| (‘li’, ‘lm’, ‘lr’) | BSBF-rbf2 | 5 | 30 | 1 | L2 | Yes | 1.84% |
| (‘li’, ‘lm’, ‘lr’) | BSSF-linear1 | 9 | 8 | 3 | L2-Hys | Yes | 0.47% |
| (‘li’, ‘lm’, ‘lr’) | BSSF-linear2 | 8 | 27 | 1 | L2 | No | 0.31% |
| (‘li’, ‘lm’, ‘lr’) | BSSF-rbf1 | 9 | 8 | 3 | L2-Hys | Yes | 1.67% |
| (‘li’, ‘lm’, ‘lr’) | BSSF-rbf2 | 7 | 27 | 2 | L1-sqrt | No | 0.47% |
Publisher’s Note: MDPI stays neutral with regard to jurisdictional claims in published maps and institutional affiliations. |
© 2022 by the authors. Licensee MDPI, Basel, Switzerland. This article is an open access article distributed under the terms and conditions of the Creative Commons Attribution (CC BY) license (https://creativecommons.org/licenses/by/4.0/).
Share and Cite
MDPI and ACS Style
Teng, J.H.; Ong, T.S.; Connie, T.; Sonai Muthu Anbananthen, K.; Min, P.P. Optimized Score Level Fusion for Multi-Instance Finger Vein Recognition. Algorithms 2022, 15, 161. https://0-doi-org.brum.beds.ac.uk/10.3390/a15050161
AMA Style
Teng JH, Ong TS, Connie T, Sonai Muthu Anbananthen K, Min PP. Optimized Score Level Fusion for Multi-Instance Finger Vein Recognition. Algorithms. 2022; 15(5):161. https://0-doi-org.brum.beds.ac.uk/10.3390/a15050161
Chicago/Turabian StyleTeng, Jackson Horlick, Thian Song Ong, Tee Connie, Kalaiarasi Sonai Muthu Anbananthen, and Pa Pa Min. 2022. "Optimized Score Level Fusion for Multi-Instance Finger Vein Recognition" Algorithms 15, no. 5: 161. https://0-doi-org.brum.beds.ac.uk/10.3390/a15050161
Note that from the first issue of 2016, this journal uses article numbers instead of page numbers. See further details here.