1. Introduction
With the aging trend of the world population, the prevalence of chronic and comorbid diseases is rising rapidly in various countries around the world [
1,
2,
3,
4,
5]. A study showed that most elderly people in China are suffering from one or more chronic diseases [
6]. Since ensuring the health of residents has become a major task for the country, chronic diseases and their comorbidities place a heavy burden on patients’ families as well as on the Chinese national healthcare system.
Although with the continuous improvement of national medical facilities, elderly patients can detect physical chronic diseases earlier and obtain treatment earlier, Chinese scholars have also carried out various related studies on chronic diseases and their comorbidities. However, most of the current studies on chronic diseases generally have shortcomings such as single survey content and only analysis of related symptoms. Some studies have also carried out chronic disease analysis based on population cohort observation, but they cannot substantially reflect the disease course and influencing factors of patients with chronic diseases and their comorbidities from the perspective of the observed population alone. Because each patient has different disease courses, the different stages of the comorbidity of chronic diseases evolve under the combination of different conditions and factors.
In the modern social living environment, there are many risk factors for chronic diseases. In addition to social, environmental, and population-related accidents, these risk factors are also closely related to the lives of people with chronic diseases. A prerequisite for precision medicine is to estimate subsequent disease progression from the current patient status. The factors that affect the development of patients’ diseases include age, sex, constitution, and previous chronic diseases, which should be taken into account in the study. Different individuals in the population have different physical conditions, different living habits and eating habits, which may lead to different chronic diseases and their comorbidities.
In the field of chronic diseases and their comorbidity research [
7,
8], many researchers have made many attempts to study the development process and risk factors of chronic diseases comorbidity. Recently, the approach of analytical studies using collected resident medical data or population cohorts has been increasingly adopted by many researchers, and multiple quantified indicators have been considered. However, there is no clear way to describe how multiple chronic diseases evolve over time under different conditions. Traditional statistical learning methods are very useful for evaluating a single disease, but multiple diseases are linked to coevolve and incorporating other conditions into the analysis requires a better model or method.
Although the population cohort method can assist in the study of comorbid transfer of chronic diseases, the population cohort collection requires a lot of manpower and material resources and takes too long. The data simulation method can simulate large populations in a relatively short time, so as to verify which factors will be the key factors for the occurrence and transfer of comorbidities. The focus and goal of this study is to explore a way to build a relatively accurate simulation framework for the evolution of chronic diseases and their comorbidities in the whole life cycle of the population cohort. We will continue to explore adding more factors into the simulation framework, so as to more accurately simulate the influence of each factor.
In this work, we focus on three main chronic conditions either as isolated presentation or combined with the others: ischemic heart disease (IA), ischemic stroke (IS), type II diabetes (DM), ischemic heart disease and ischemic stroke (IA and IS), ischemic heart disease and type 2 diabetes (IA and DM), and ischemic stroke and type 2 diabetes (IS and DM). The simulated population cohort of all individuals starts at health status and ends at death status, and the simulated age range starts from 30 to 90 years. All individuals in the simulated population cohort were in a healthy state at the beginning, and aged year by year during the simulation until the simulation ended after all individuals entered the dead state. This study assumes that individuals will only enter the enumerated health or diseased state, and that all comorbid states develop from monomorbid states, and that individuals will not move directly from health to comorbidity or return to health from illness.
2. Related Works
In 2011, Sun Xiaoyu et al. [
9] analyzed the ECG data of 1042 patients, including 374 non-CHD patients and 668 CHD patients. Based on the 24-h ECG data of patients, Gaussian kernel function was used to build the SVM model, and the experimental results were verified to have better classification effect compared with logistic regression. It can improve the diagnostic accuracy of coronary heart disease.
In 2013, Lappenschaar et al. [
10] proposed a multilevel temporal Bayesian [
11] network to capture the joint evolution of multiple chronic diseases. Based on about 1.5 million patient data extracted from 90 general practice registries in the Netherlands, the study eventually captured the progression trajectory of six chronic cardiovascular diseases and found that the cumulative incidence of chronic comorbidities increased rapidly with the number of diseases already present at baseline.
In 2014, Jensen et al. [
12] compiled the data of 6.2 million people registered in 14.9 years into 1171 important disease progression trajectories, and finally found that the diagnosis of Chronic Obstructive Pulmonary Disease (COPD) and gout greatly increased the risk of comorbid chronic diseases. The same year, Strauss et al. [
13] have used LCGA to understand the effects of the incidence of chronic diseases in the elderly over time in the elderly. The survey was conducted by adopting UK primary medical consultation data, covering data from 24,615 patients aged 0–50 years during 2003–2005, and chronic diseases including 42 consensus definitions. Using LCGA identified different populations with similar progression of multimorbidity over time and ultimately identified five groups of individuals representing different trajectories of life.
In 2015, Foguet-Boreu et al. [
14] used cluster analysis studies to determine the diagnostic clustering of elderly patients with multiple diseases. Factors such as sex and age groups were analyzed by targeting patient registration data from 251 health centers in Spain. The cluster analysis showed that the most common diseases in both the age group and sex groups were chronic diseases of the metabolic circulation class, while including musculoskeletal diseases was the second most common disease diagnosis.Through cluster analysis, doctors can provide corresponding clusters for reference for clinical treatment to achieve more effective treatment. Furthermore, in 2015, Sinnige et al. [
15] analyzed the prevalence of multiple diseases through the clinical data of 120,000 patients older than 55 years from 2002 to 2011, and adjusted for the actual situation, the number of disease types and the time of patient data registration. They calculated the prevalence of chronic diseases such as heart failure, diabetes, migraine, and dementia, using multi-layer statistical models showing that middle-aged and elderly people over 55 had an 86% chance of comorbidity. Same year, Hsu et al. [
16] has used the trajectory modeling method, by targeting the health status data of patients in Taiwan from 1993 to 2007, which covers cardiovascular diseases, lung diseases, arthritis, and other chronic diseases, analysis and verified the combined trajectory of chronic multiple diseases in Taiwan, and checked the related factors and predicted the aging results. Through trajectory analysis methods based on multiple groups, four trajectory groups of multiple diseases were finally identified, and the changes in population health risk evolving with age were demonstrated through multiple disease trajectories.
In 2019, Weiqiang Lin et al. [
17] studied a subcohort of 1215 systolic and 1345 diastolic blood pressures. There were 78 new CHD cases in the systolic blood pressure subcohort, 86 cases of new CHD in the diastolic blood pressure subcohort. Cox regression model analysis was conducted on the two subcohorts to explore whether the change trajectory of blood pressure would cause the occurrence of CHD. The conclusion was that the high and rapid increase or high and rapid decrease in blood pressure change trajectory would increase the risk of new CHD.
In 2020, Cao et al. [
18] used the Cox [
19,
20] proportional hazards model to analyze the comprehensive score association of six common and high-incidence chronic diseases, including dementia, cancer, diabetes, lung disease, cardiovascular disease, and hypertension, with the risk of all-cause mortality in the elderly.
In 2021, Yucheng Guo et al. [
21] studied the change trajectory of disease perception in 192 stroke patients. The patients were surveyed at baseline during the onset of the disease and followed up at 1, 3, and 6 months after the onset, decision tree model was used to analyze the core influencing factors of the change trajectory of disease perception level. Finally, hope was found to be the core influencing factor of the trajectory among such factors as hope, anxiety, occupational status, and age.
In 2022, CAO Zhiwei et al. [
22] analyzed 54,258 patients with new cardiovascular and cerebrovascular disease (CVD), and investigated the effect of baseline Triglyceride glucose index(TyG) longitudinal trajectory on new CVD. The conclusion of the study is that the incidence of CVD increases when the level of TyG trajectory increases. In the same year, Han Juan et al. [
23] conducted a study on 598 elderly patients with comorbidities requiring surgery. The patients were investigated 3 days after surgery, at discharge, and 1 week after discharge to form the trajectory of nursing dependence. The trajectory data were analyzed by using the latent growth mixed model, and the results showed that age, education level, monthly income, living environment and other factors would affect the trajectory of nursing dependence.
3. Method
3.1. Overview
If a population cohort approach is used to study the effects of various factors on chronic diseases and their comorbidities in the whole life cycle, the data collection will take a long time. General cohort data studies collect short-to-medium-term data from populations of different age groups. It could provide a way to build a life-cycle simulation framework for studying of the evolution of chronic diseases and their comorbidities.
This work is carried out based on CKB (China Kadoorie Biobank) data [
24,
25]. CKB data includes baseline data and outcome event data. Baseline data is the information of all the enrolled respondents collected at the beginning of the queue. The outcome event data is the disease event or death event data of all the respondents in regular questionnaires, local hospital records, or medical insurance database records. Baseline data included 512,891 respondents, and each respondent was determined by a unique ID. A total of 716 columns of physical information such as age and gender and dietary habits were recorded for each respondent, and no data were missing. The outcome event data mainly records a total of 156 outcome events for all the baseline data respondents, in which each outcome event is marked by an independent, unrepeated number, corresponding to a class of disease state. The specific classification of disease state selection is mainly based on one or several codes under the ICD10 classification standard, and also records the date and time of each outcome event.
We first constructed a probabilistic graph model of disease progression metastasis for chronic disease and its comorbidities based on CKB data, and then constructed a lifetime population cohort simulation framework. The input of the simulation framework is a state transition probability map by age, which will conduct full life-cycle simulation sample by sample in the simulated population cohort to obtain the disease progression trajectory of chronic diseases and their comorbidities in the population cohort, and compare it with CKB data to verify the validity of the designed simulation framework.
One of the most basic simulation routes in the population cohort full life cycle simulation is from birth to death. However, the samples were enrolled at over 30 years old in CKB data, so information before 30 years cannot be obtained from the CKB data. Therefore, the transfer probability map calculated in this study corresponds to the age starts at 30 years, and the age of the population cohort simulation starts at 30 years, so here assume that the individuals in the simulated population cohort are healthy until 30 years, that is, the basic simulation route of this study starts at 30 years and ends with death.
3.1.1. Simulation States
The states that would be simulated in our study are defined as:
Health: Represents an individual without IA, IS, DM, or any comorbidities;
IA: Represents an individual has IA, but without IS, DM, or any comorbidities;
IS: Represents an individual has IS, but without IA, DM, or any comorbidities;
DM: Represents an individual has DM, but without IA, IS, or any comorbidities;
IA and IS: Represents an individual has IA and IS converted from IA or IS, but without DM or any comorbidities;
IA and DM: Represents an individual has IA and DM converted from IA or DM, but without IS or any comorbidities;
IS and DM: Represents an individual has IS and DM converted from IS or DM, but without IA or any comorbidities;
Death: Represents an individual is dead.
3.1.2. Setting of the Category of Time Interval
The main considerations behind the setting of the category of time interval are:
First, all disease states selected in this study were chronic or chronic comorbid states. If the time interval is set too small, it may result to a transfer probability close to 0 due to the small or no samples of chronic disease conversion in the interval;
Second, if the time interval is set too large, the specific disease state transfer time cannot be accurately expressed, resulting in a large deviation of the average transfer age in the simulation results.
Therefore, under comprehensive consideration, three groups of time interval groups were selected for trial and comparison, namely, 1-year interval group, 2-year interval group, and 5-year interval group.
3.1.3. Data Preprocessing
The preprocessing of CKB data mainly includes two parts: data cleaning and data collation. The data cleaning process is mainly responsible for removing the samples with missing data, samples with unreasonable data range, and samples that are not within the selected state range of this study. Data collation is the foundation for the calculation of transfer probability map in the three groups of time interval groups.
Since this study has assumed that subjects in health will first enter monomorbidity and then turn to comorbidity, but not directly from health to comorbidity, the selected comorbidity states in this study only include the coexistence of two chronic diseases, and there is no assumption that the three chronic diseases will coexist. Therefore, in the step of data cleaning, the samples with the coexistence of two chronic diseases diagnosed on the same day in the CKB source data were excluded first, and then the samples with the coexistence of three chronic diseases in the CKB source data were excluded.
In the process of data collation, since the CKB source data only contains the specific events and time of the disease event or death event for each object, it is necessary to combine the age of the object and the occurrence time of the outcome event, and finally the age of various outcomes is generated for the objects in the data one by one.
3.2. Construction of the State Transition Probability Graph
3.2.1. Calculation of the transition probability
The transition probability is calculated according to the Jaccard coefficient, which is used to compare the similarity and differences between the two effective sample sets
A and
B, and describe the dissimilarity between the sets. The larger the Jaccard coefficient indicates the higher the similarity, and the smaller the Jaccard coefficient, the lower the similarity. The specific formula for the Jaccard coefficient
between sample set
A and
B is as follows:
For disease states, the transition probability was calculated as the proportion of people moving from one state to the next after the specified interval year.
3.2.2. Transition Probability Graph of the 3 Interval Groups
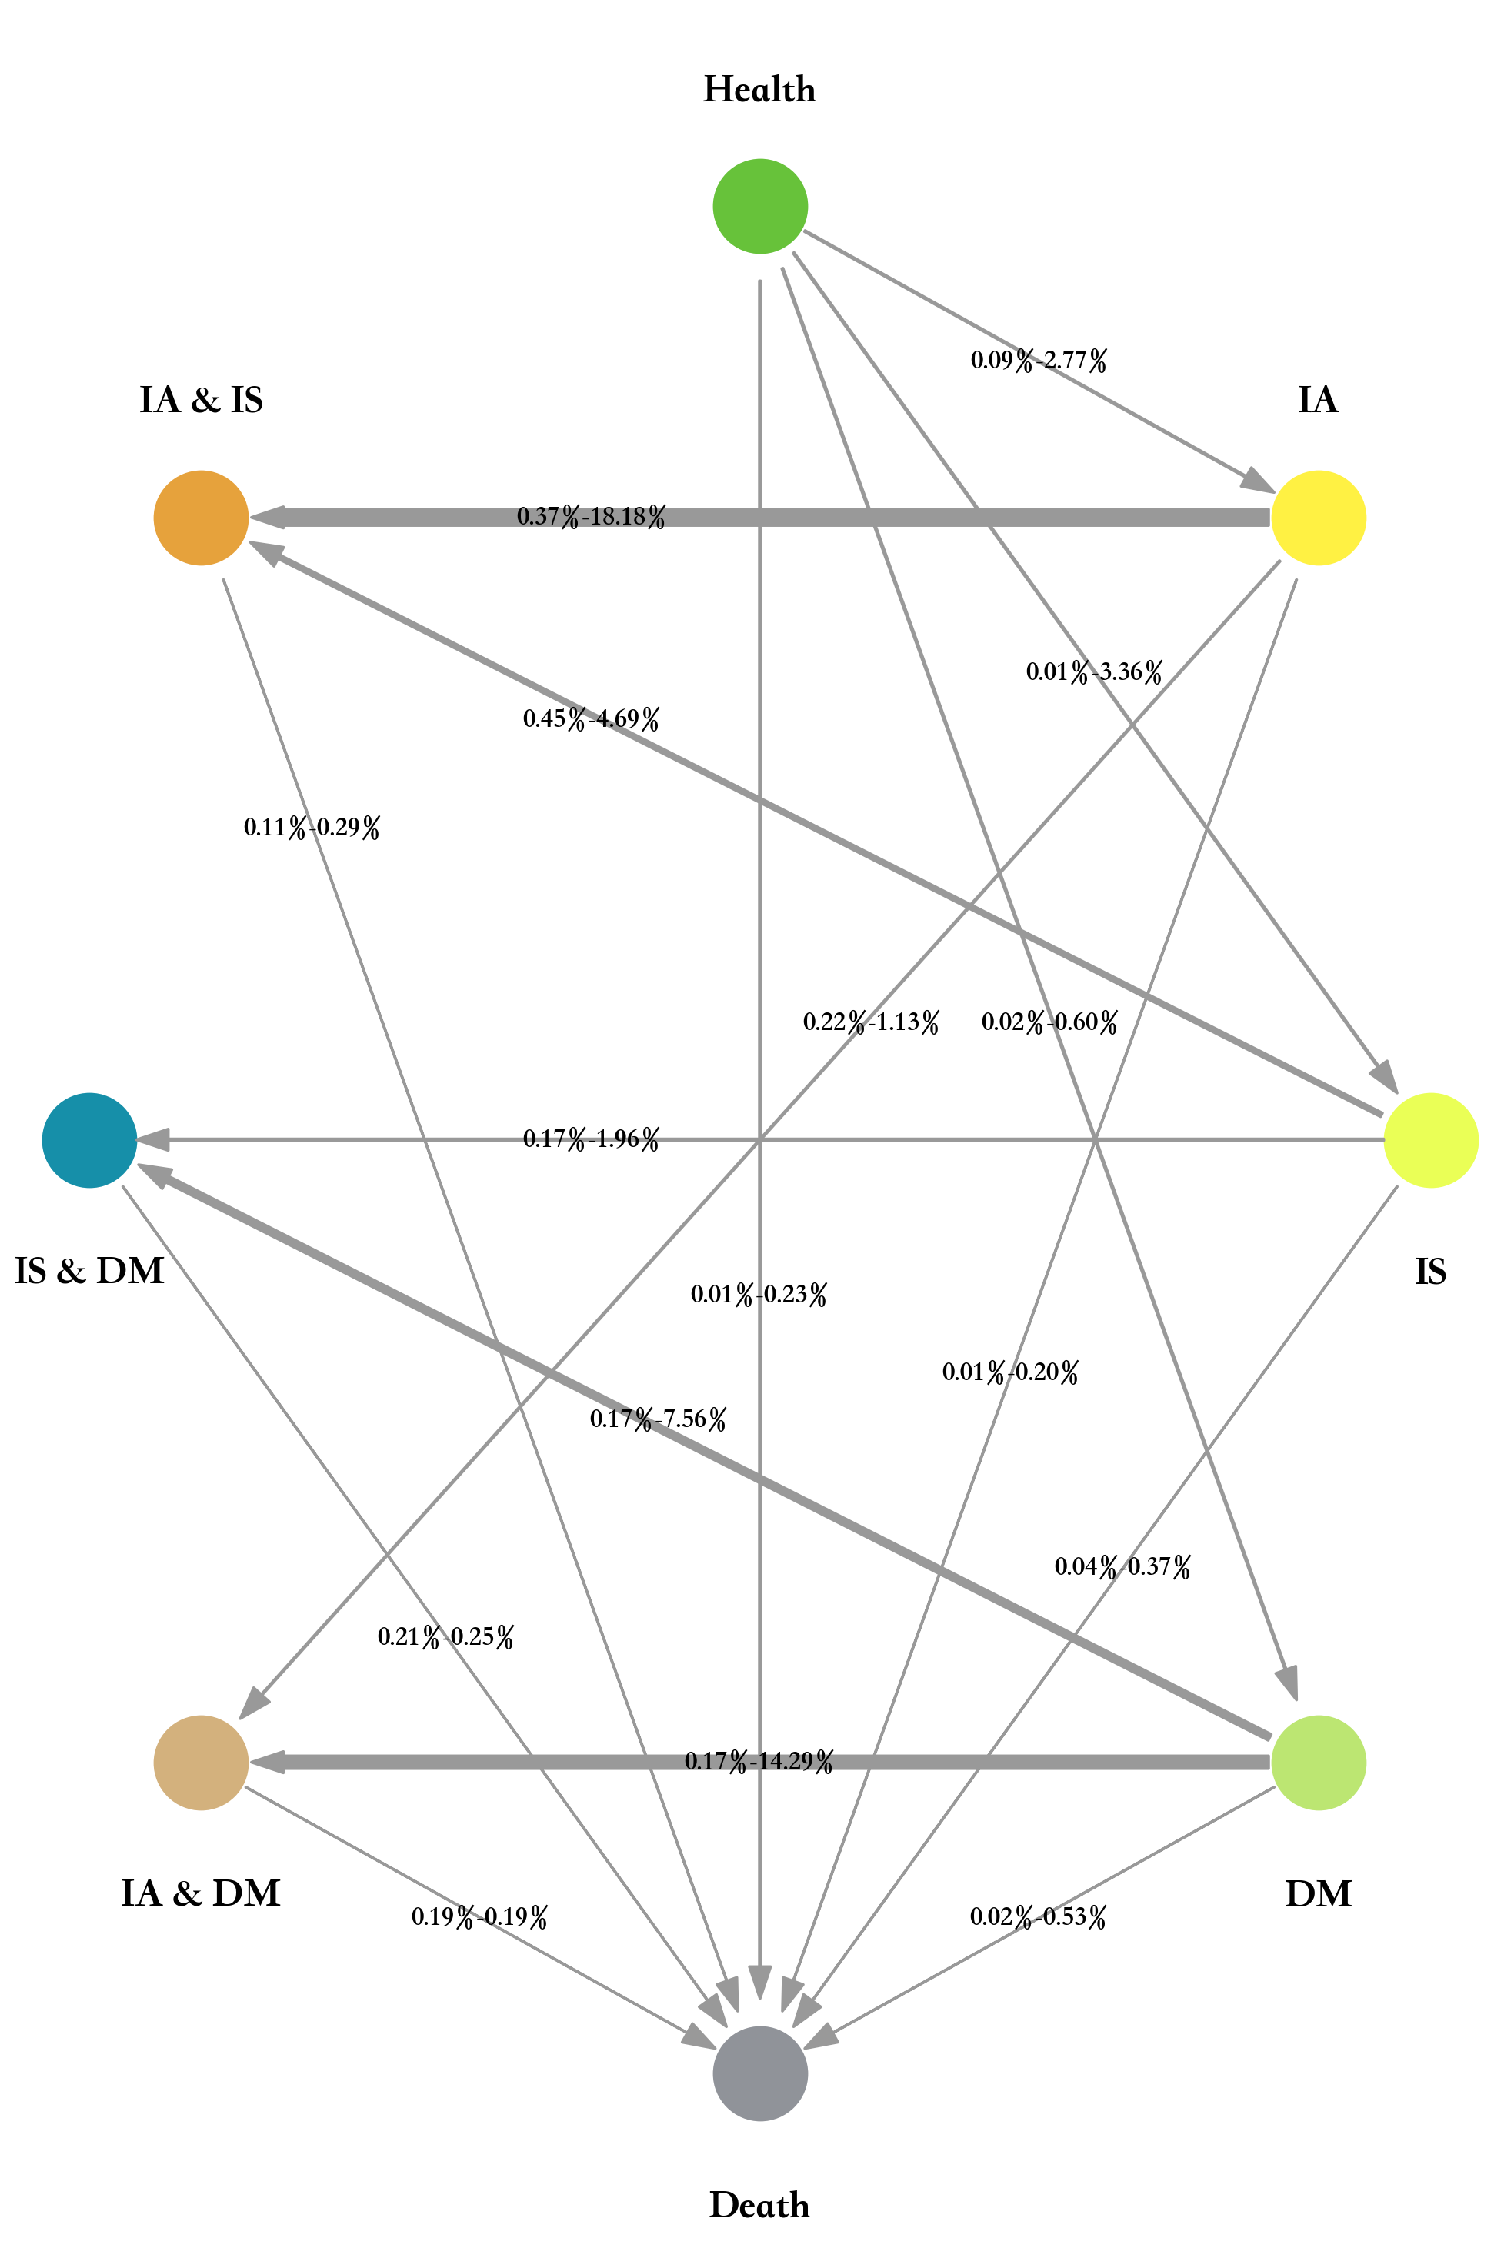
The transition probability graph of the 1-year interval group is shown in
Figure 1. Each node with different color represents a state, corresponding to all the above eight states. Each edge represents the transition from a state to another state, a total of 16 edges. Each edge records the range of the values for transition probabilities from ages 30 to 90, reflecting fluctuations in transition probabilities across time periods. Since it was previously assumed that comorbidity develops from monomorbidity, there are no edges from health to comorbidity status.
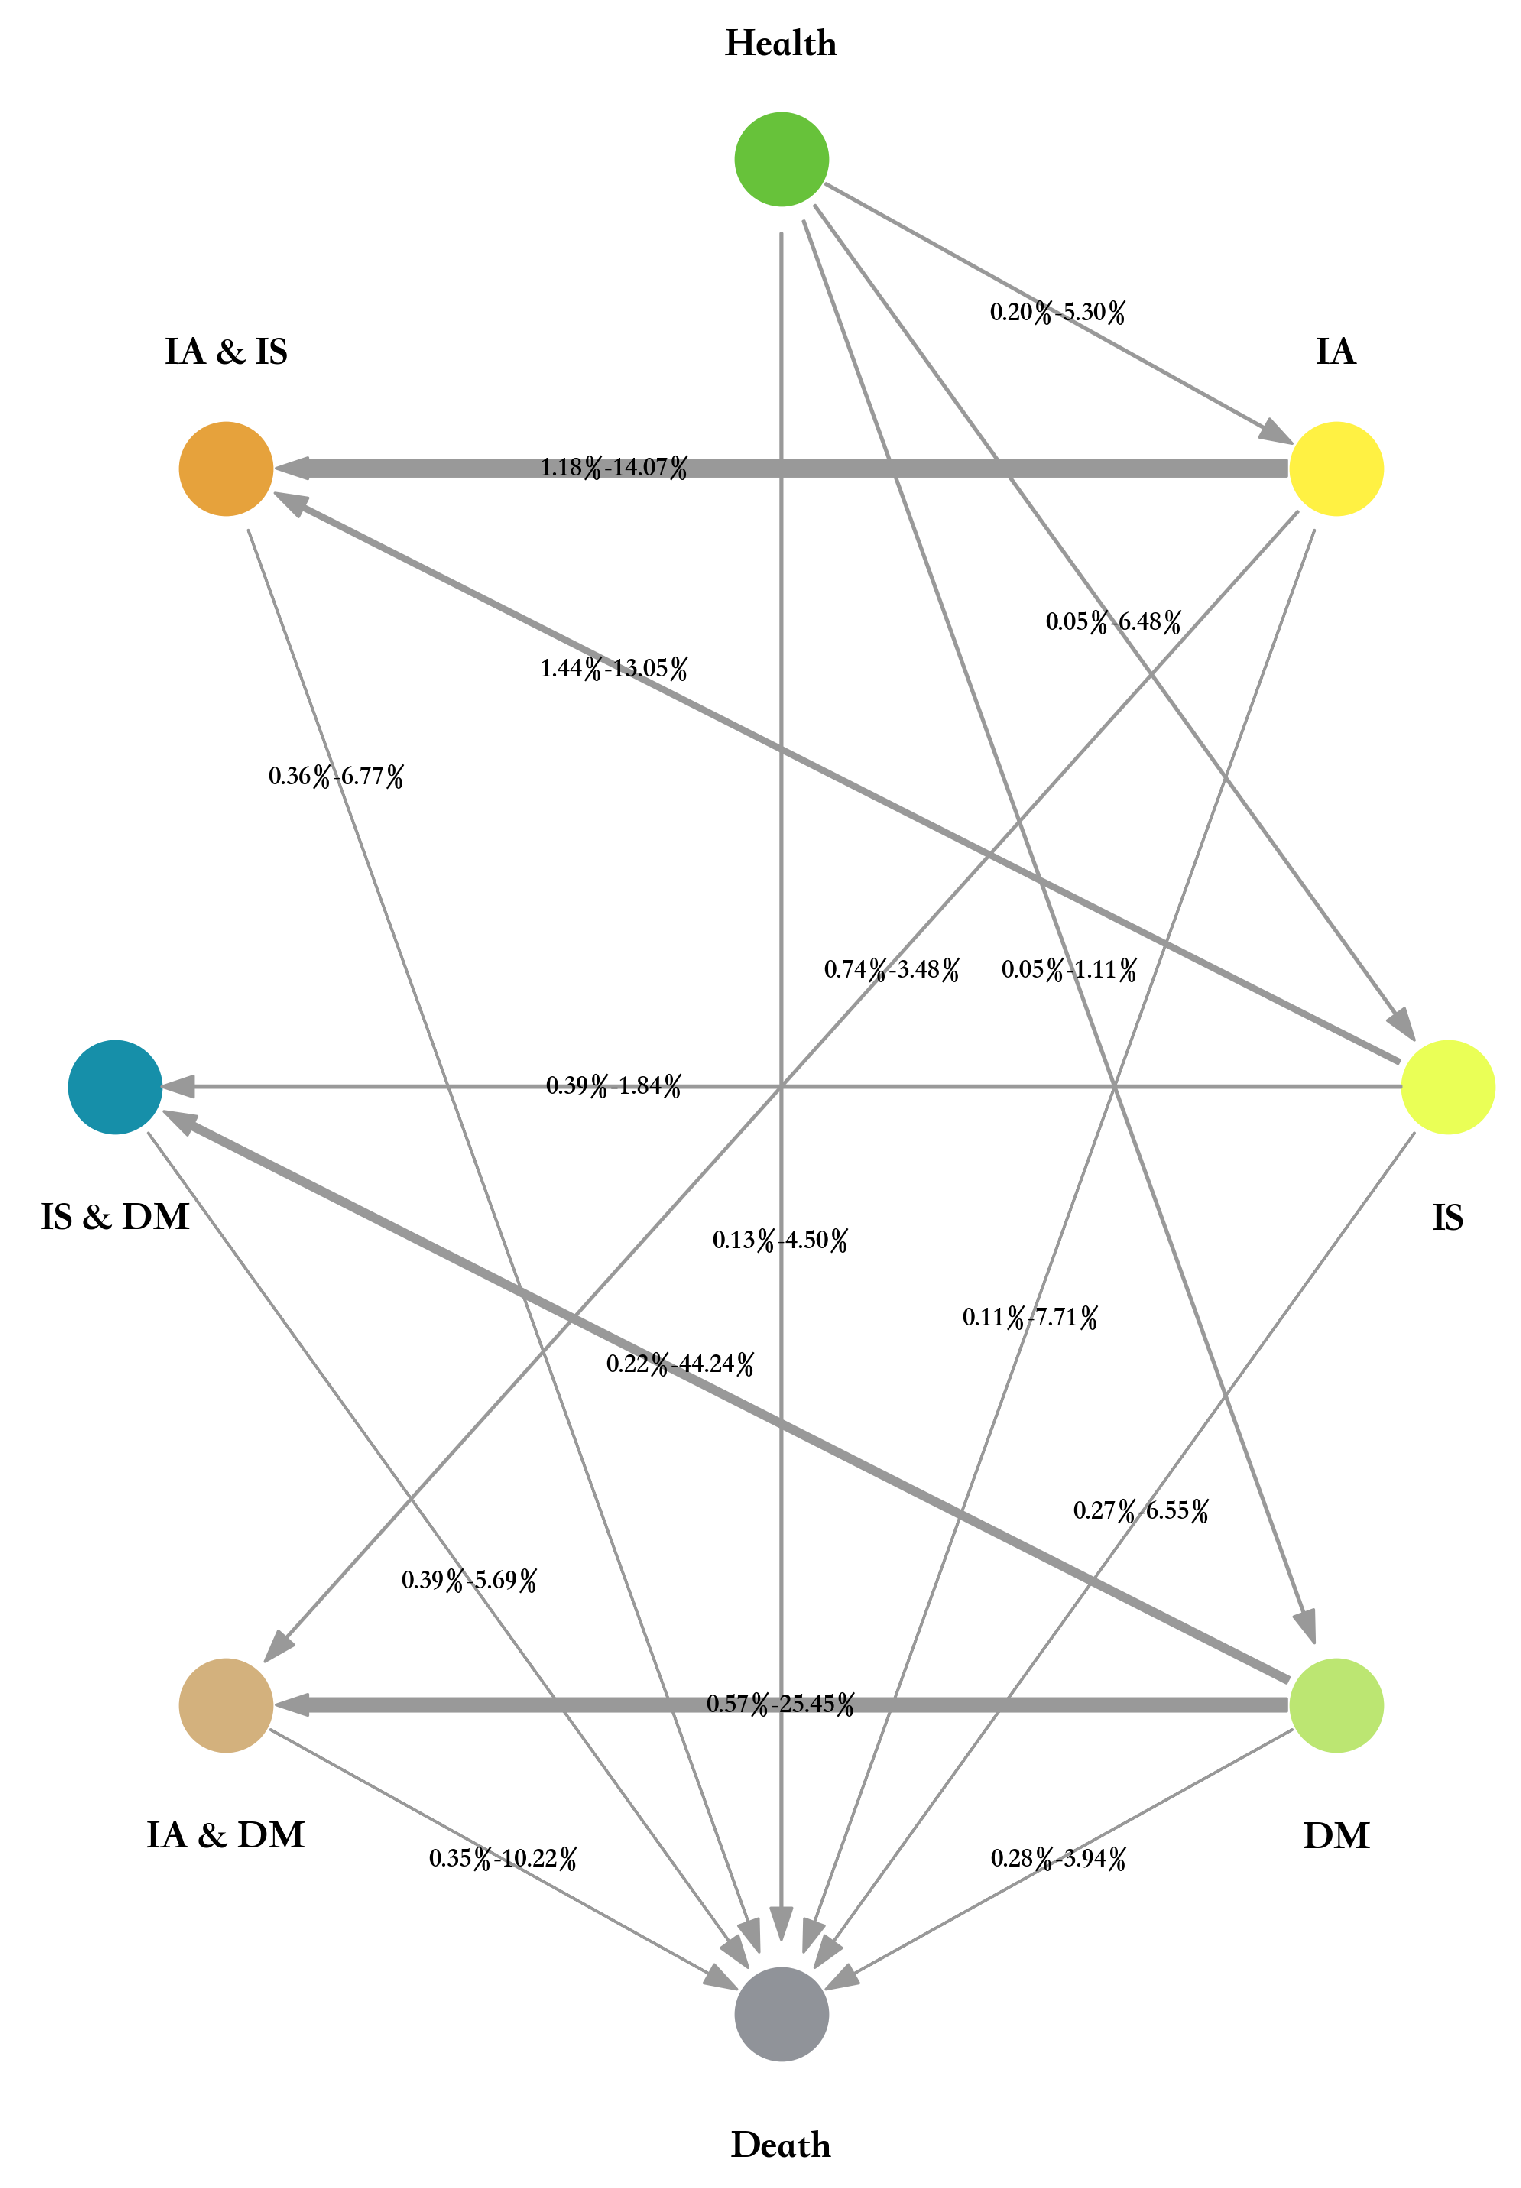
The transition probability graphs of the 2-year interval group and 5-year interval group are shown in
Figure 2 and
Figure 3, respectively.
3.3. Design of the Lifetime Population Cohort Simulation Framework
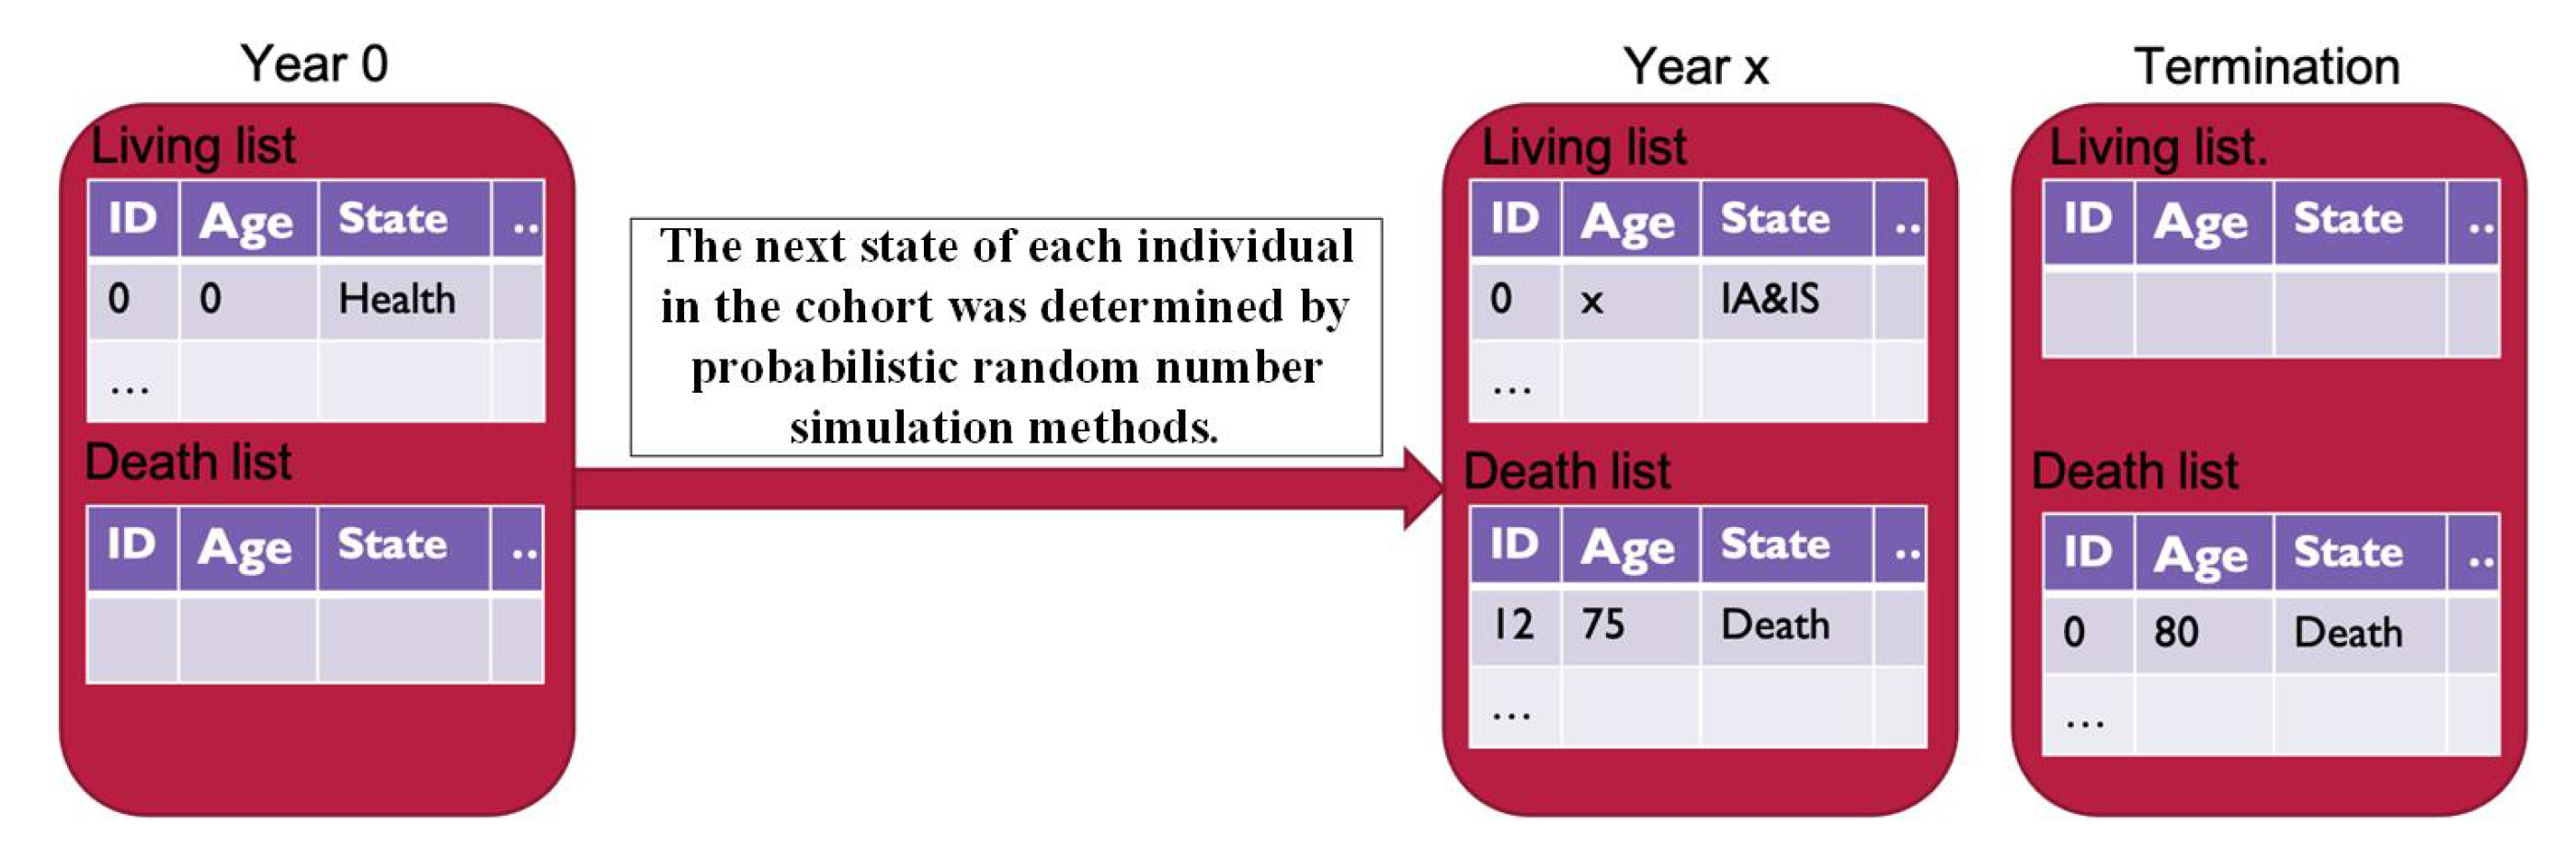
There are two queues in this simulation framework (as shown in
Figure 4): living queue and the death queue. At the beginning of the simulation, all individuals in the population cohort were in the living queue. The simulated individuals start from a health state and end in the death state. Repeat simulation time elapsed until all individuals enter the death queue or at the maximum allowing age.
The whole simulation framework constructs of three parts:
Initialization phase: All individuals are in the living queue, and are set to age 30 with healthy state. The death queue is empty at the initialization phase. Each individual in the cohort has two important attributes, one being age, representing the individual’s current age, and one being state, representing the individual’s current status;
State determination phase: Based on state transition probability to decide the next state of the individual. This phase adopts the idea of the Markov Monte Carlo approach. For each independent object i, a random value p obtained from the sampling of a normally distributed is given as the transition probability sample value for the next year. To determine whether object i remains in its original state or transferred to another disease state by comparing the p value with the calculated transfer state risk threshold;
Aging and death process phase: For each individual in the living queue, a simulation was conducted at each age, with the age increasing with grouping (1-year, 2-year, or 5-year interval). The result of the simulation may be to maintain the current state, enter the next state, or enter the dead state.
4. Results and Discussion
The population of the simulation framework is set to 100,000 individuals in this work. We have conducted several groups of experiments to verify the effectiveness of our method.
4.1. Disease Progression Trajectory
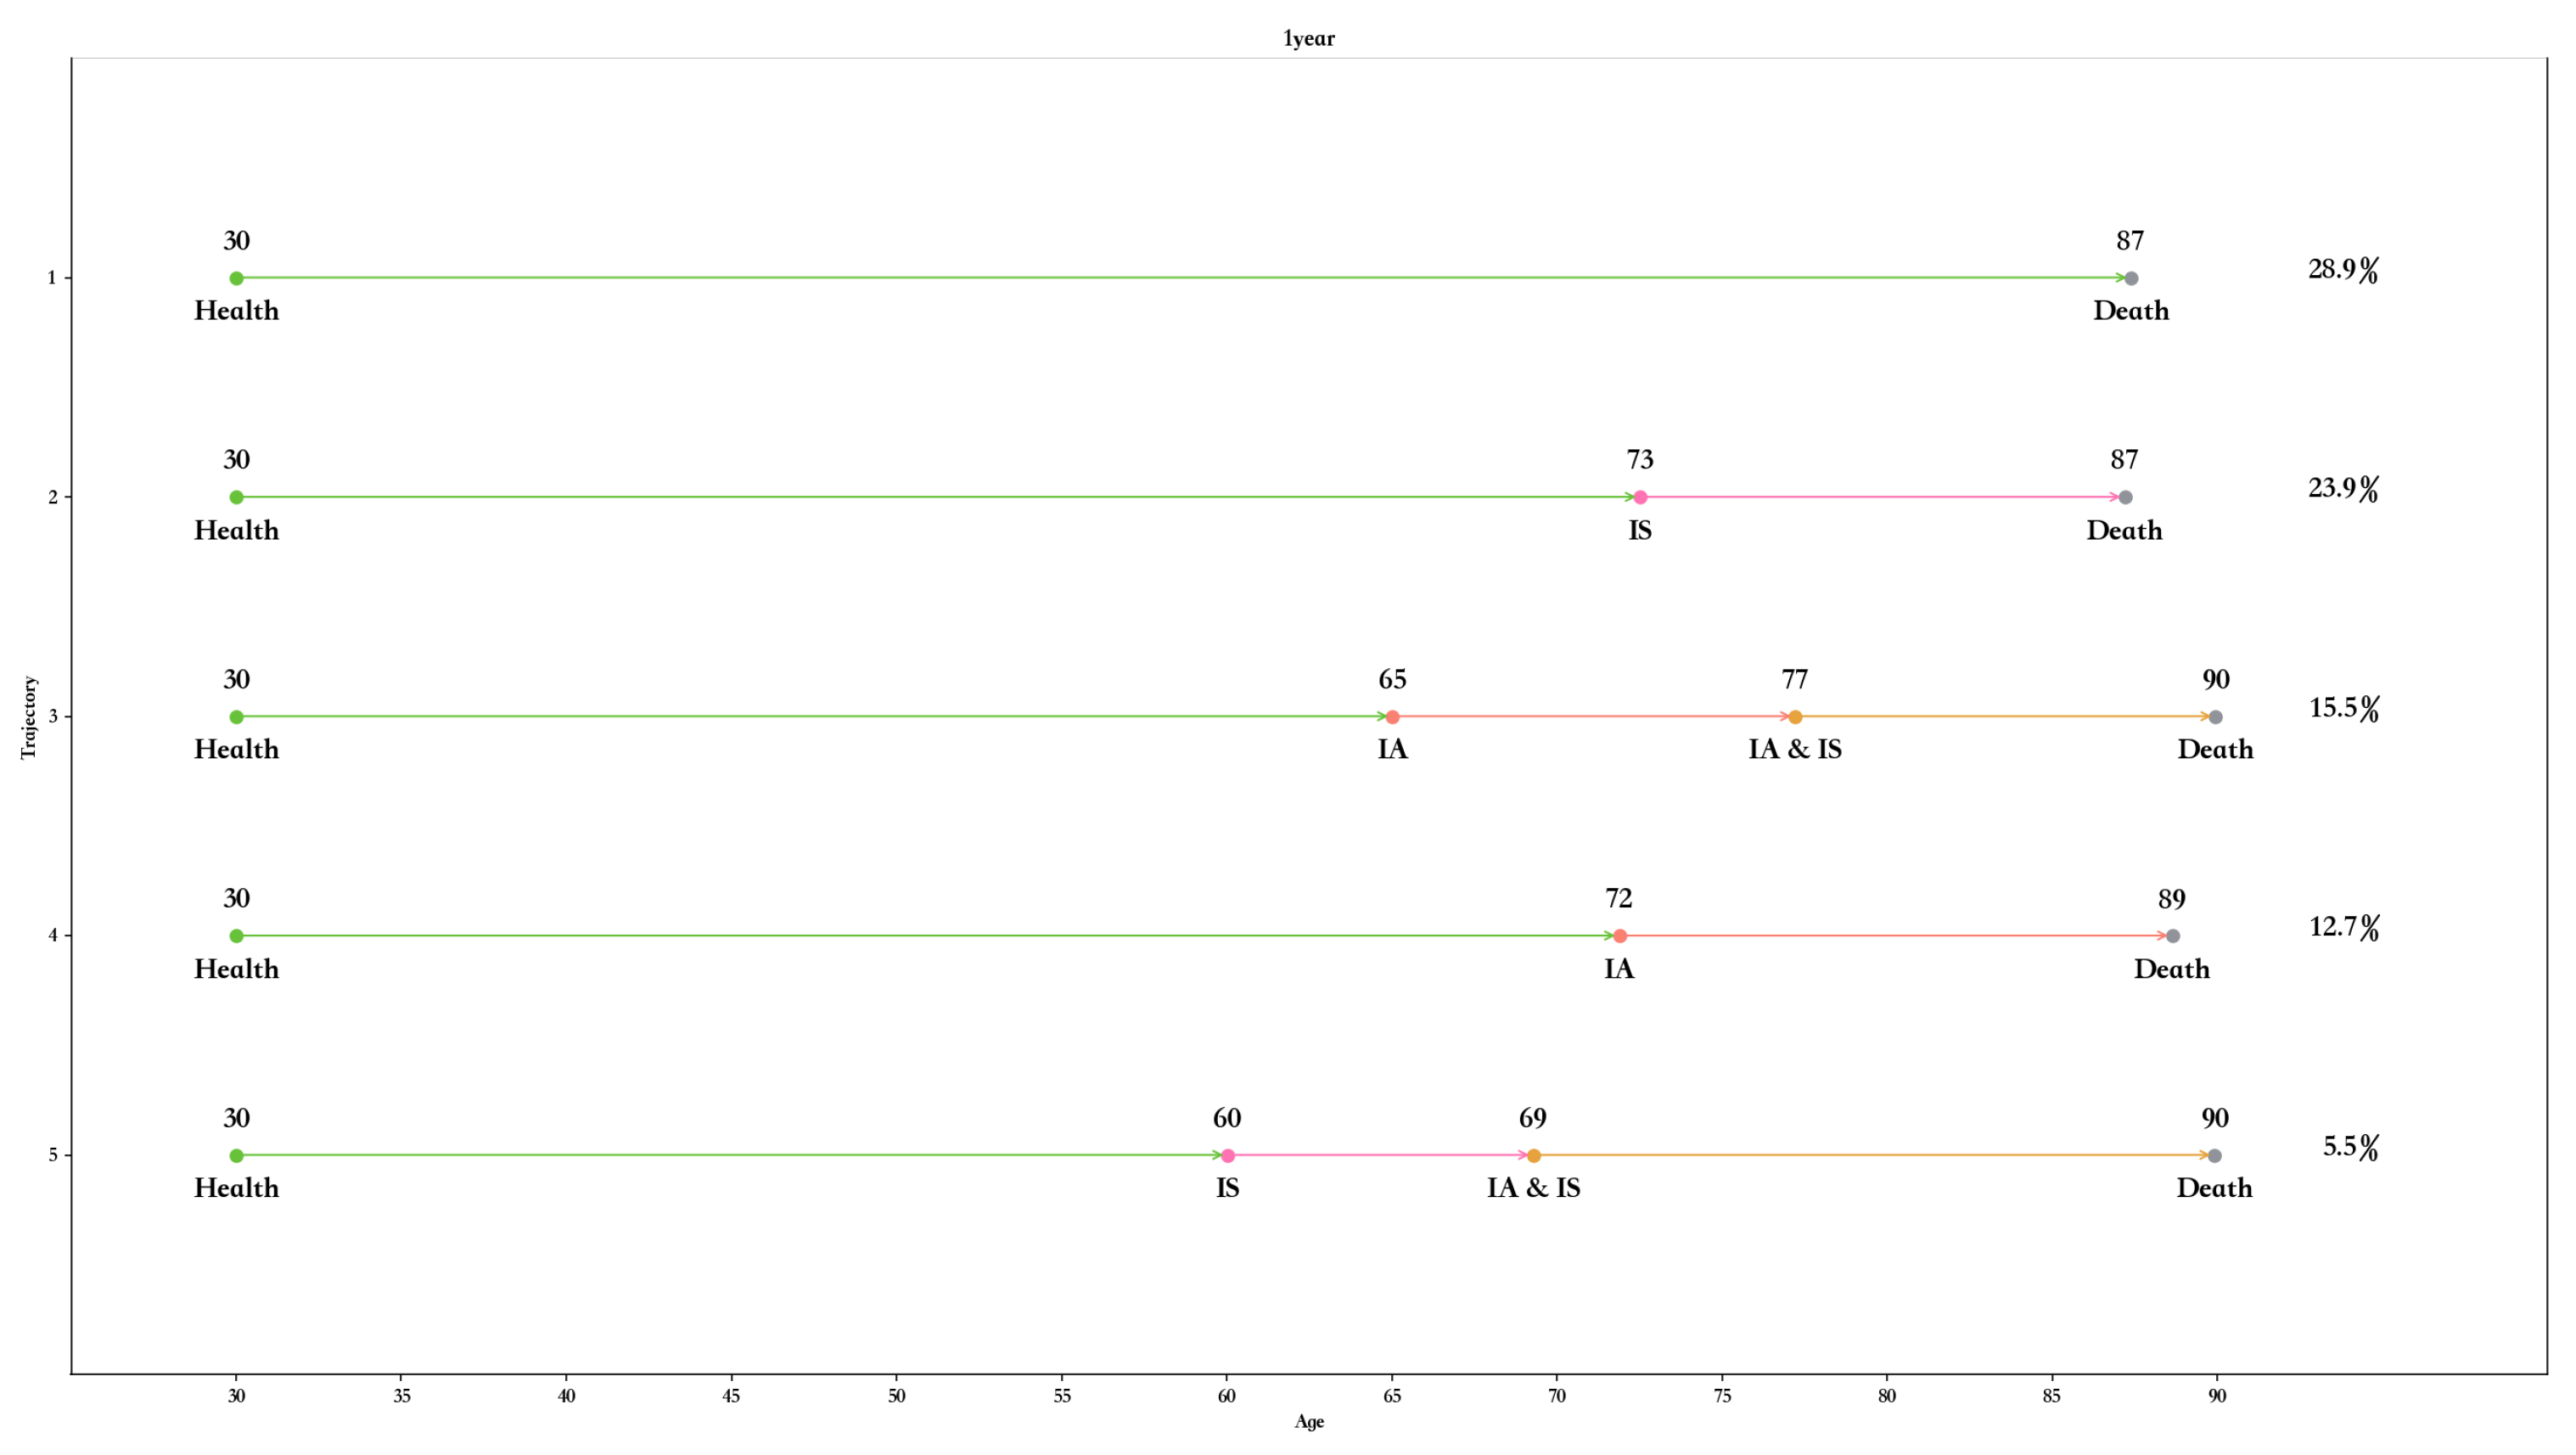
For 1-year interval group, there are 10 different classes of disease progression trajectory.
Figure 5 shows the top five categories of progress trajectory. The number of populations in the top five trajectories reached about 70% of the total cohort population.
It could be found that traces containing the IA or IS state represented a large proportion of the cohort population, except for the first trajectory (Health-> Death). It could also be observed from all 10 trajectories that the healthy population in the cohort developed chronic monomorbidity at an average of 67 years and then chronic comorbidity at an average of 74 years.
For 2-year interval group, there also exists 10 different classes of disease progression trajectory, shown in
Figure 6. The result of 5-year interval group is shown in
Figure 7.
4.2. Disease Transition Mode and Timing
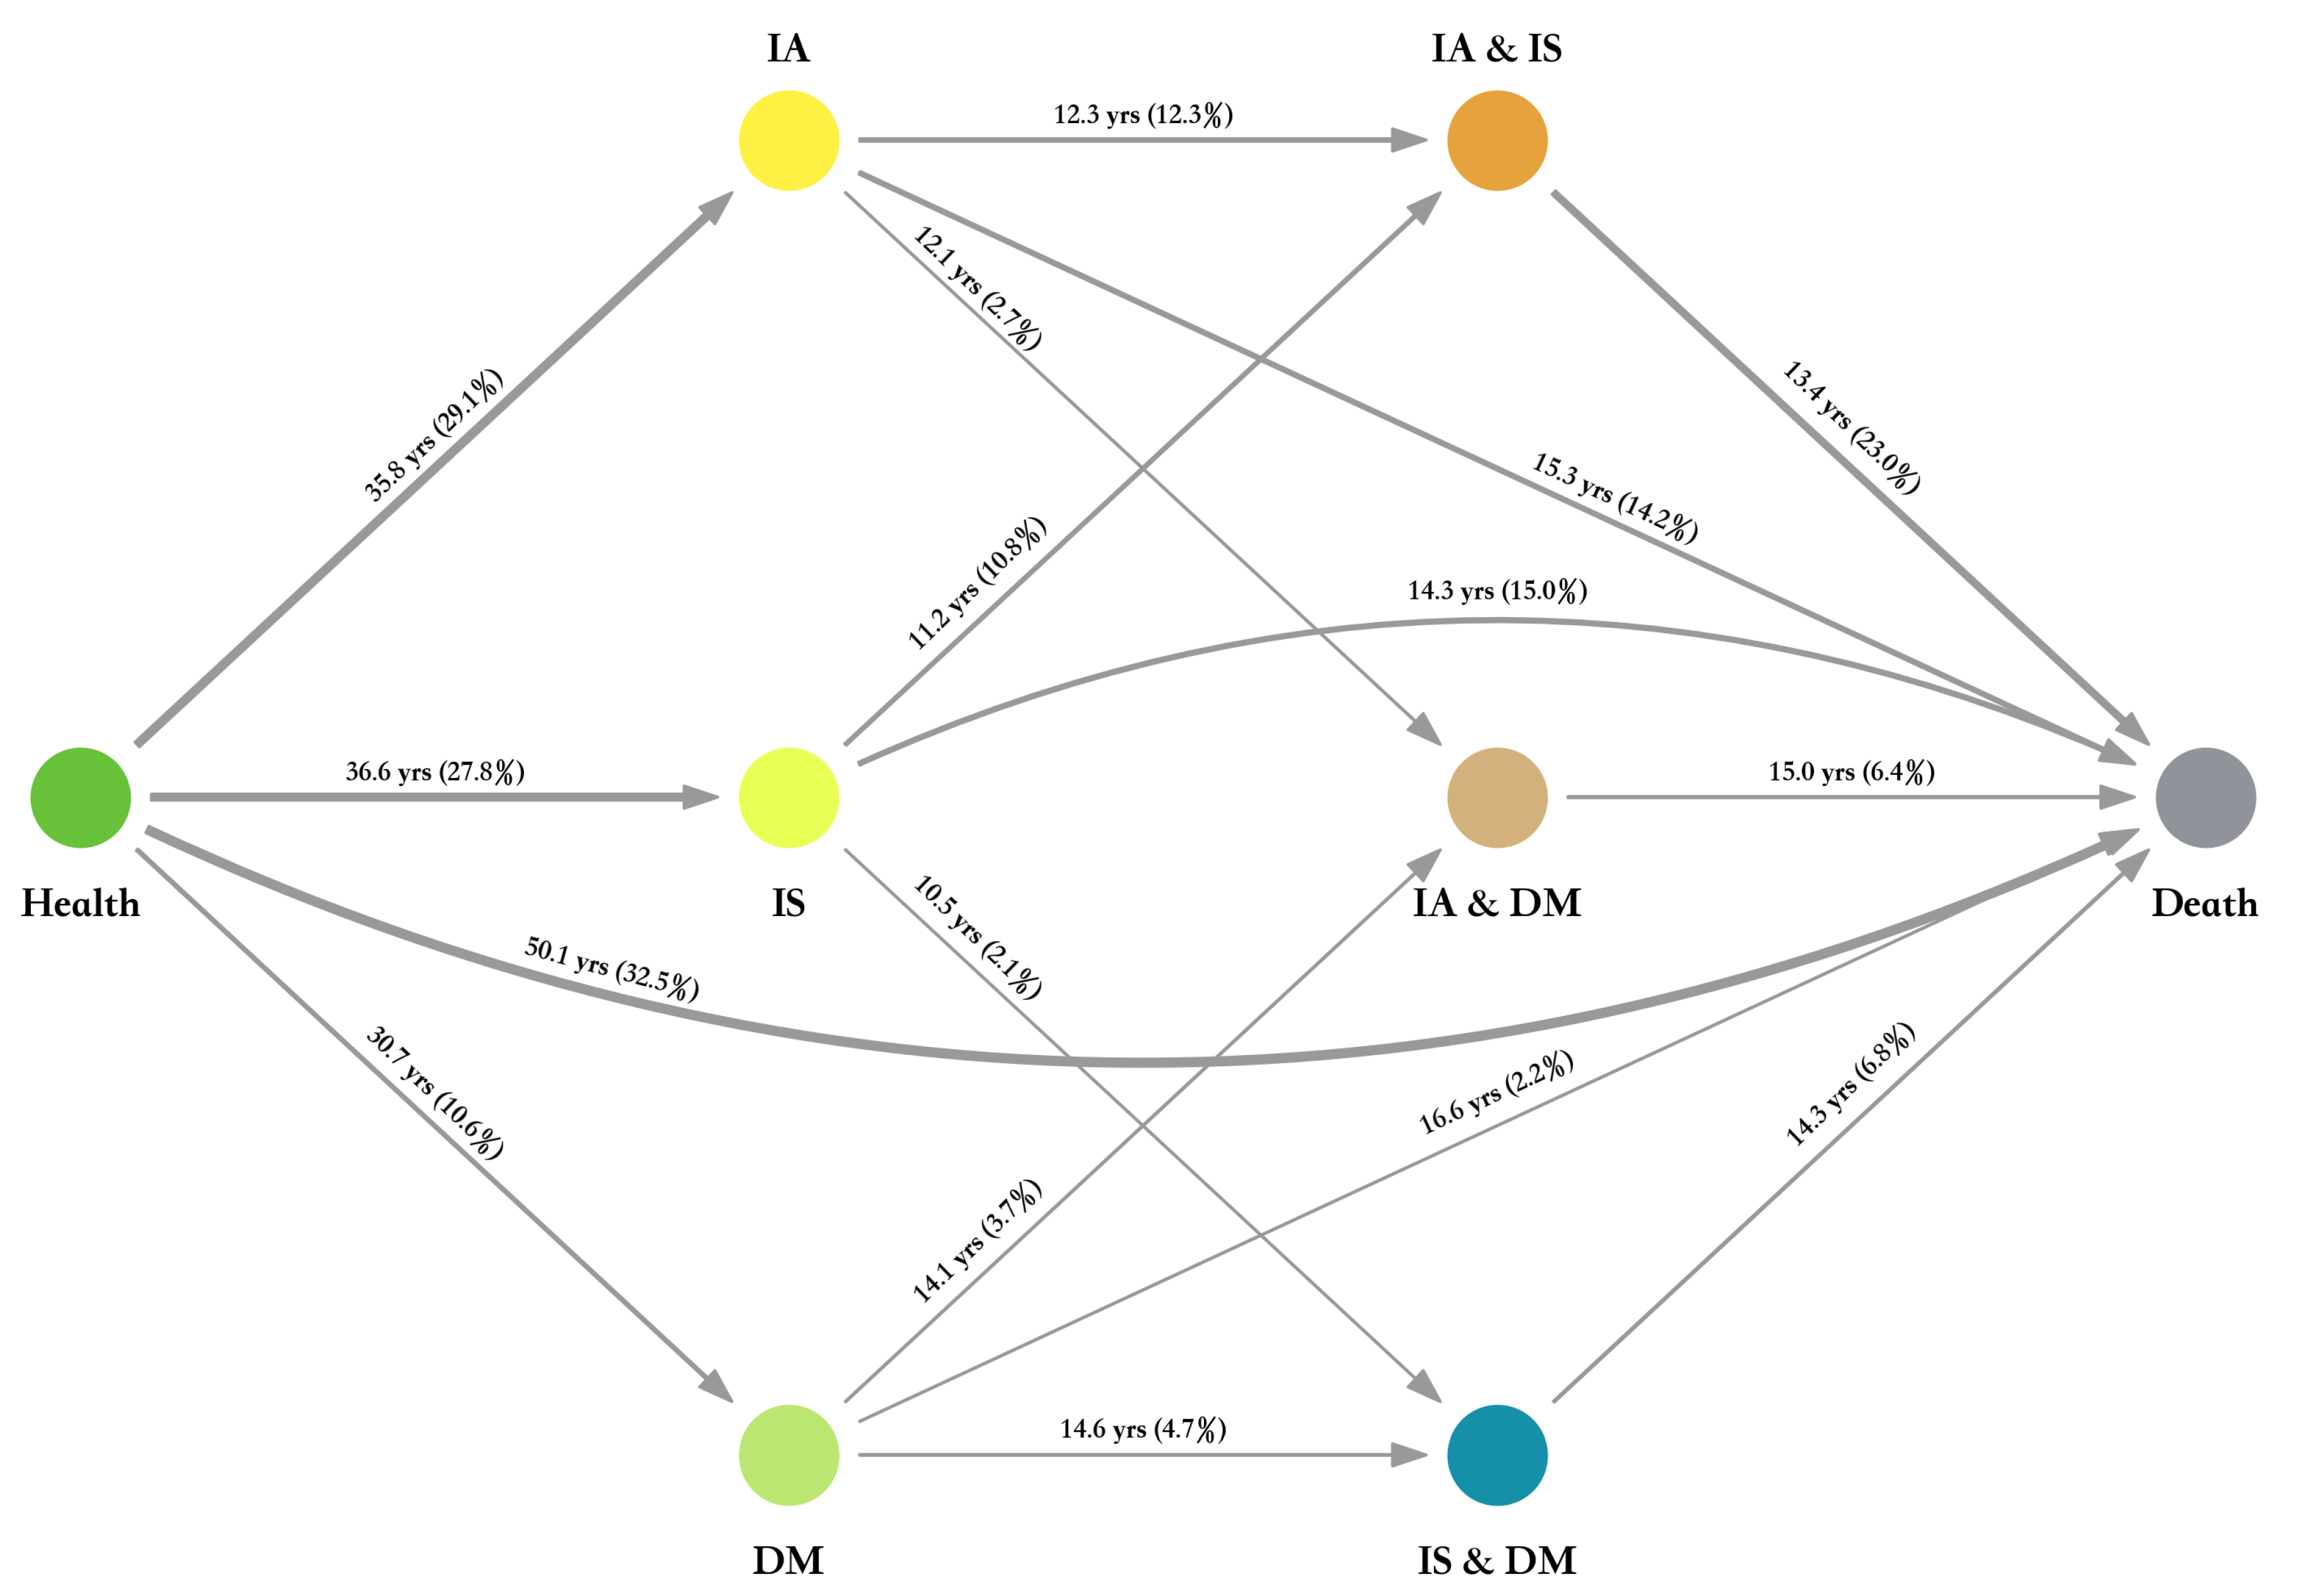
To study disease metastasis throughout the life cycle, we also map the overall disease metastasis. The overall map of disease metastasis is based on the transition probability graph architecture. The overall trend in the disease progression trajectory of the population is presented from left to right. The proportion of the state transfer population and the mean transfer time are indicated along the state transfer edges. The thickness of the connection edge reflects the proportion of the transferred population to the total population cohort. The combination of the connection edge and the data can more intuitively reflect the overall state transition trend of the population cohort.
The overall disease metastasis for 1-year interval group is shown in
Figure 8. Although judging from the average age of death of the top-ranked disease progression trajectory, the average age of death of individuals with chronic disease is later than the progression trajectory from health to death alone, that is, patients with chronic disease tend to live longer than those without disease. However, it can be inferred that patients with chronic diseases or chronic comorbidities tend to pay more attention to their physical health than healthy people who are not sick, which leads to a large number of individuals with slightly longer lives but not healthy bodies in the simulated cohort.
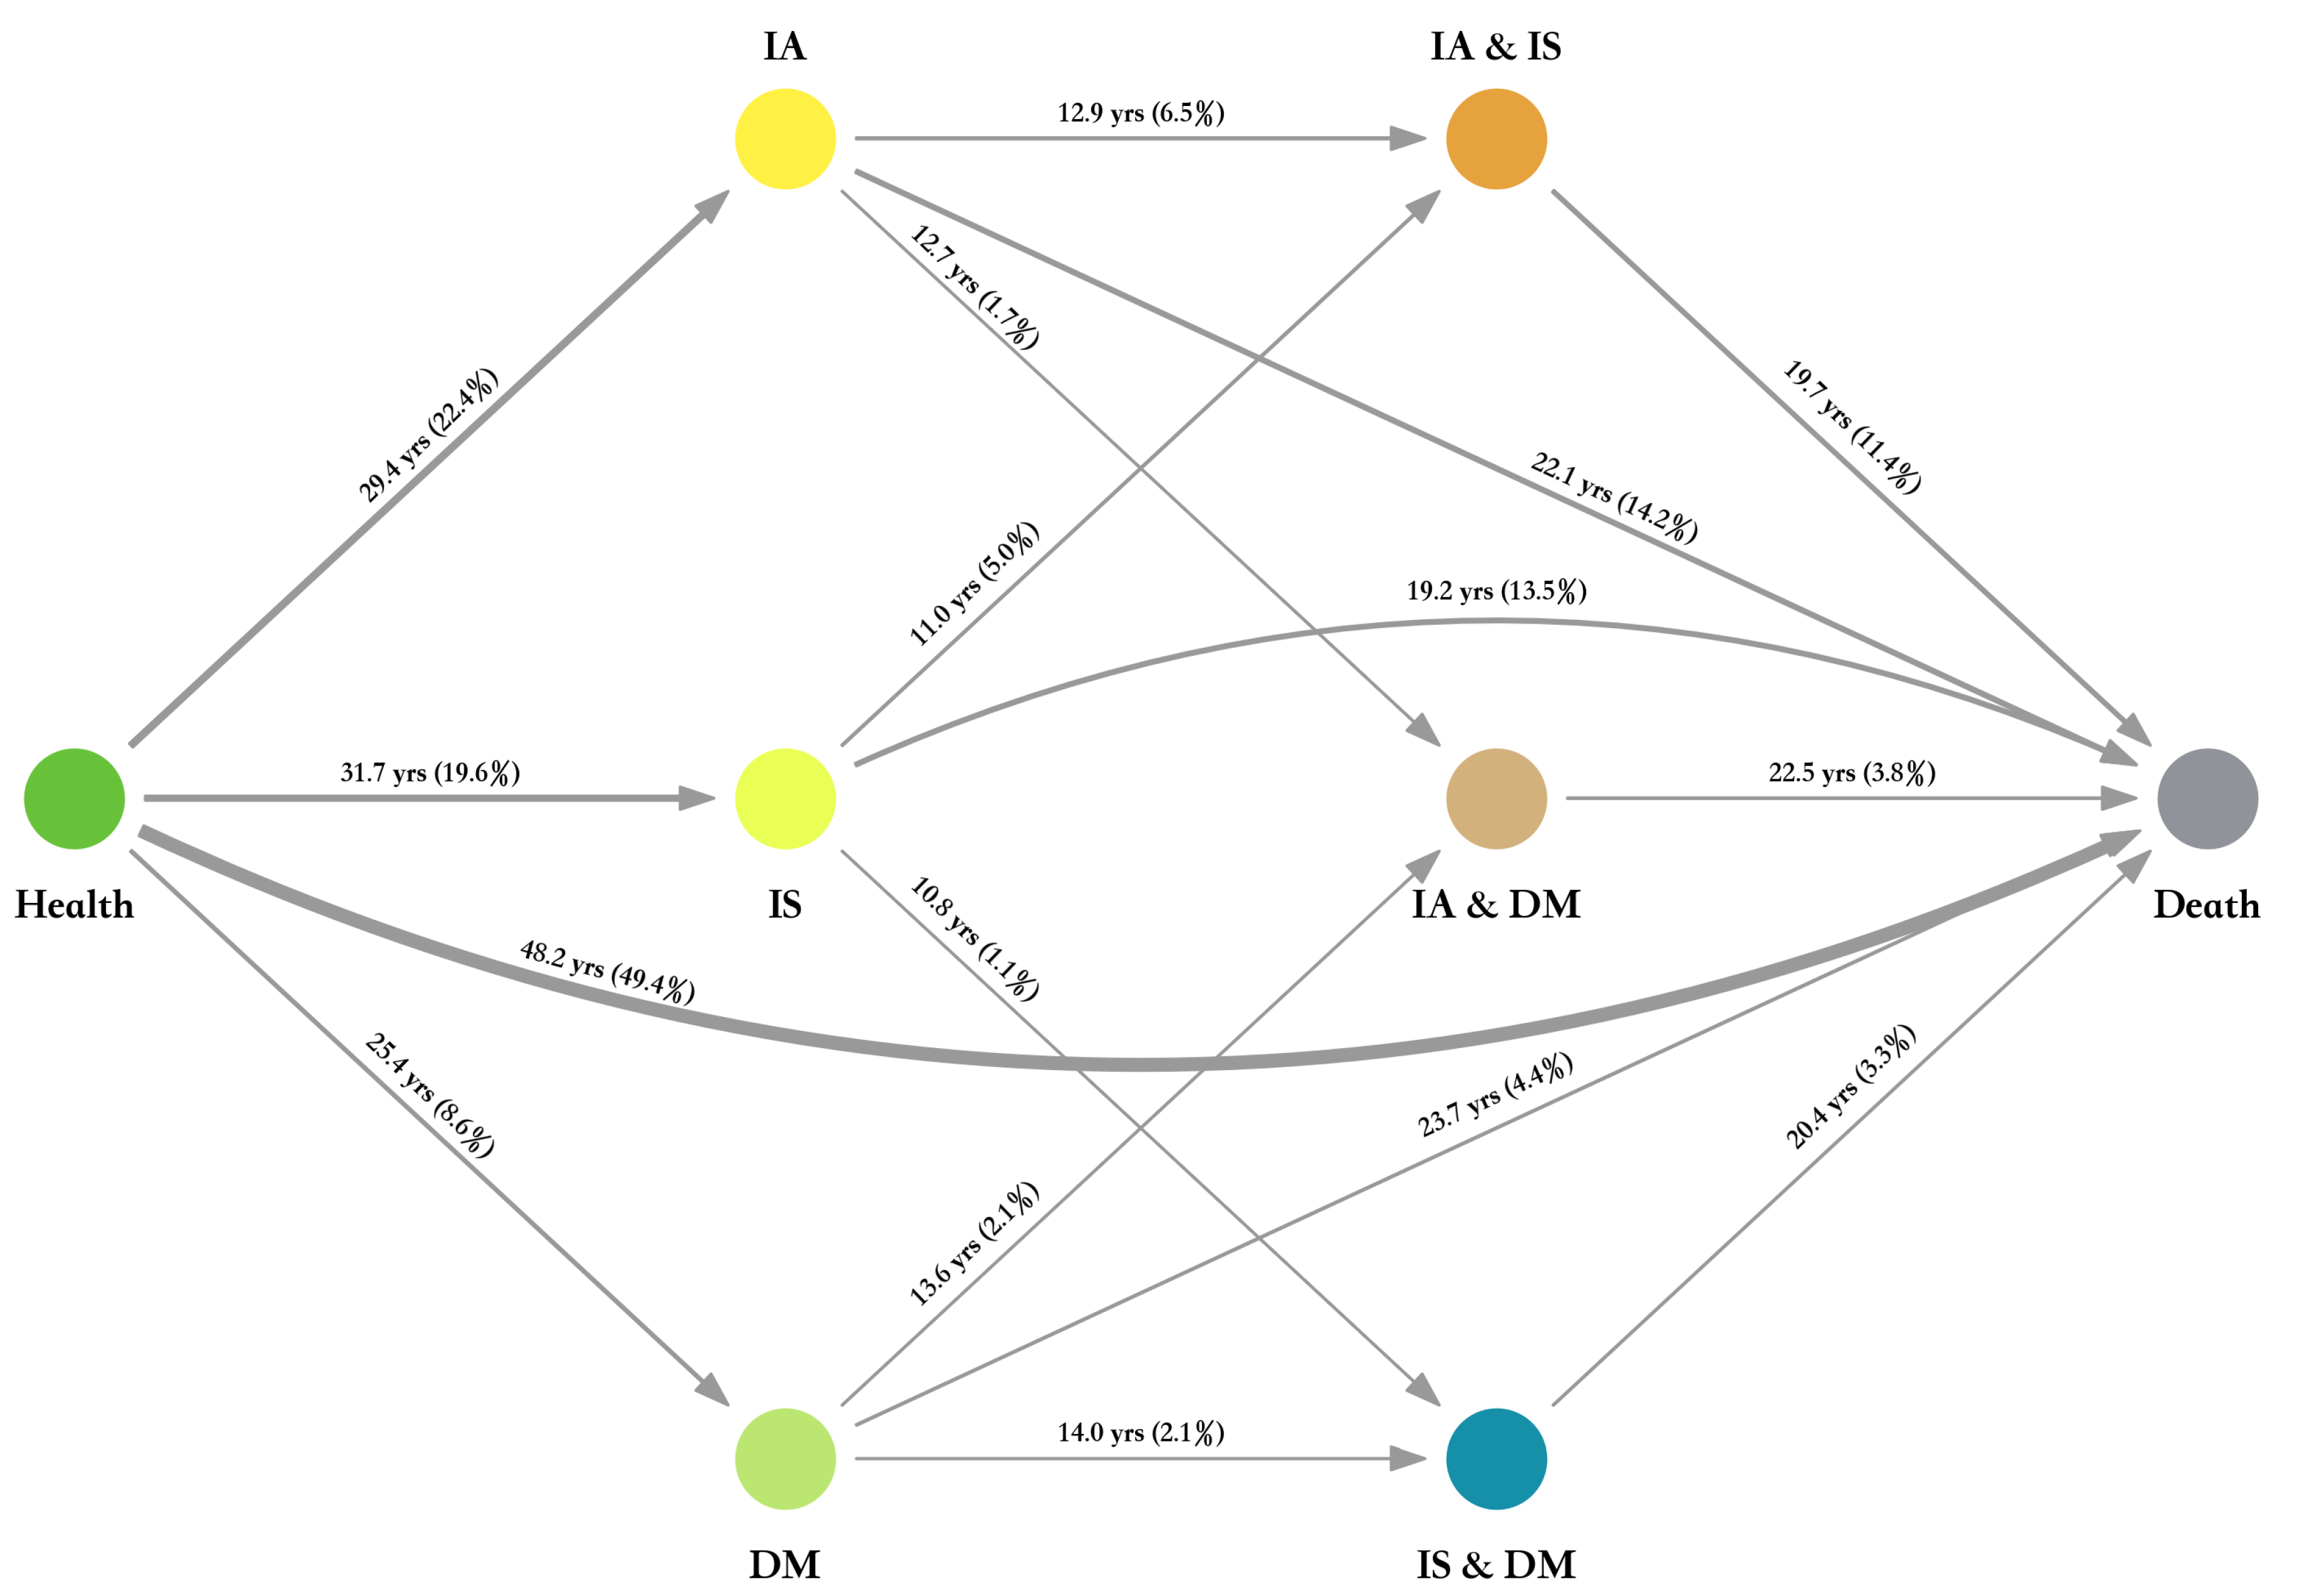
Figure 9 and
Figure 10 show the results for 2-year interval group and 5-year interval group.
4.3. Analysis of the Influence of Time Interval
In order to evaluate the influence of different time interval for the simulation result, we have also conducted several comparisons.
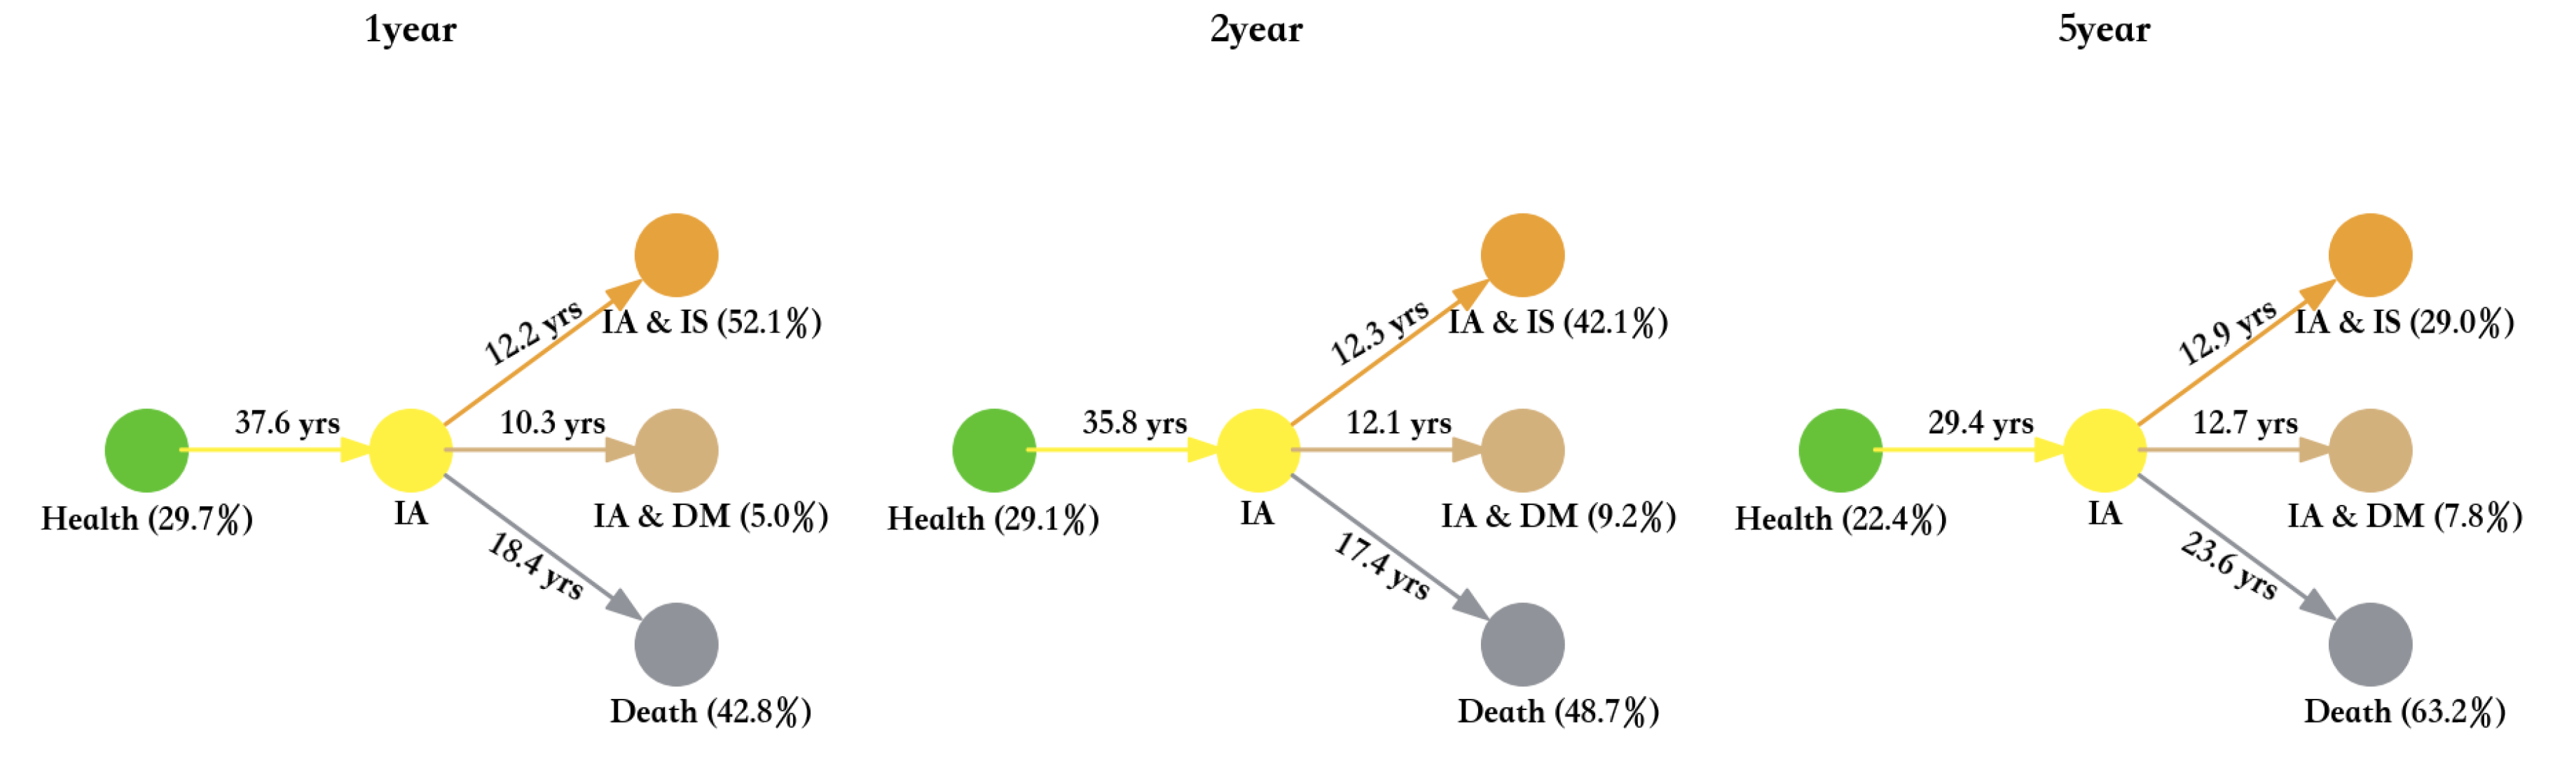
4.3.1. IA
The transition status of IA for different time interval groups is shown in
Figure 11. As can be seen from
Figure 11, the mean age of transition from the health state to IA state in the 5-year interval group is quite different compared to the 1-year and 2-year interval groups. However, the distribution of transition proportions, the distribution of IA status to comorbidity or death status, and the mean age did not differ much among the three groups.
It can also be seen that with the increase in the time interval, the proportion of people moving directly from the IA state to the death state gradually increases.
4.3.2. IS
The transition status of IS for different time interval groups is shown in
Figure 12.
The average transfer time from the health state to IS state is 39.6 years for the 1-year interval group, and for the 2-year interval it is 36.6 years and in the 5-year interval group it is 31.7 years. The value of this average transfer time decreases in these three sets of simulations. After a preliminary analysis, we believe that the possible reason is that the transfer probability of this path is gradually increased and more accurate because the number of samples in the 5-year interval grouping is more accurate.
Moreover, by observing the transfer of IS state to IA and IS or IS and DM state in the three time interval groups, respectively, we could find that the corresponding values of the three interval groups are not very different. After analysis, it was found that even in a small interval of 1 or 2 years, the proportion of samples transformed from IS monomorbidity state to comorbidity state was basically equal to the proportion of simulated result sample at the 5-year interval, so the change of data was not obvious in the conversion map of grouped data.
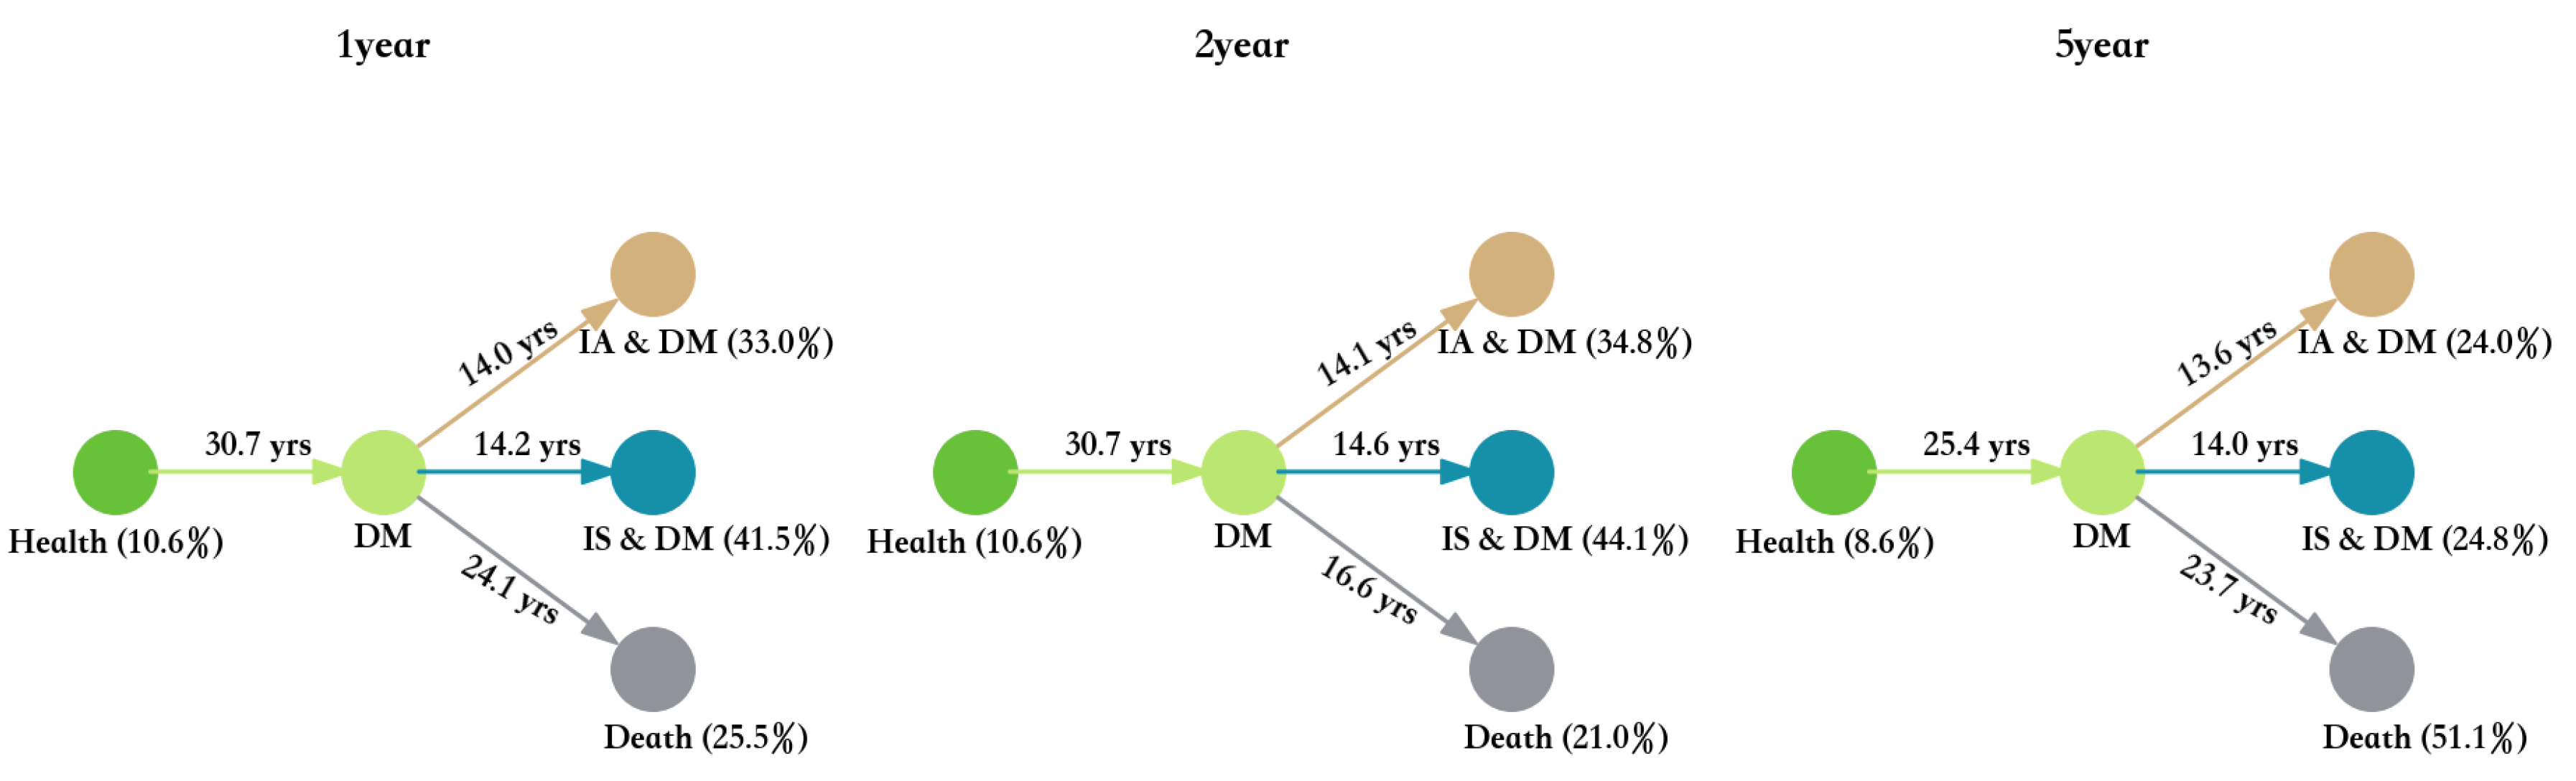
4.3.3. DM
The transition status of DM for different time interval groups is shown in
Figure 13.
It can be found that the three groups of data are not particularly different in terms of the average transfer time or the percentage of transfer. This is mainly because the number of new cases of diabetes in the cohort is relatively stable, resulting in the calculated transfer probability under different groups reflects the trend of stable metastasis. However, in a nuance, the longer the interval, the average transfer time still becomes smaller.
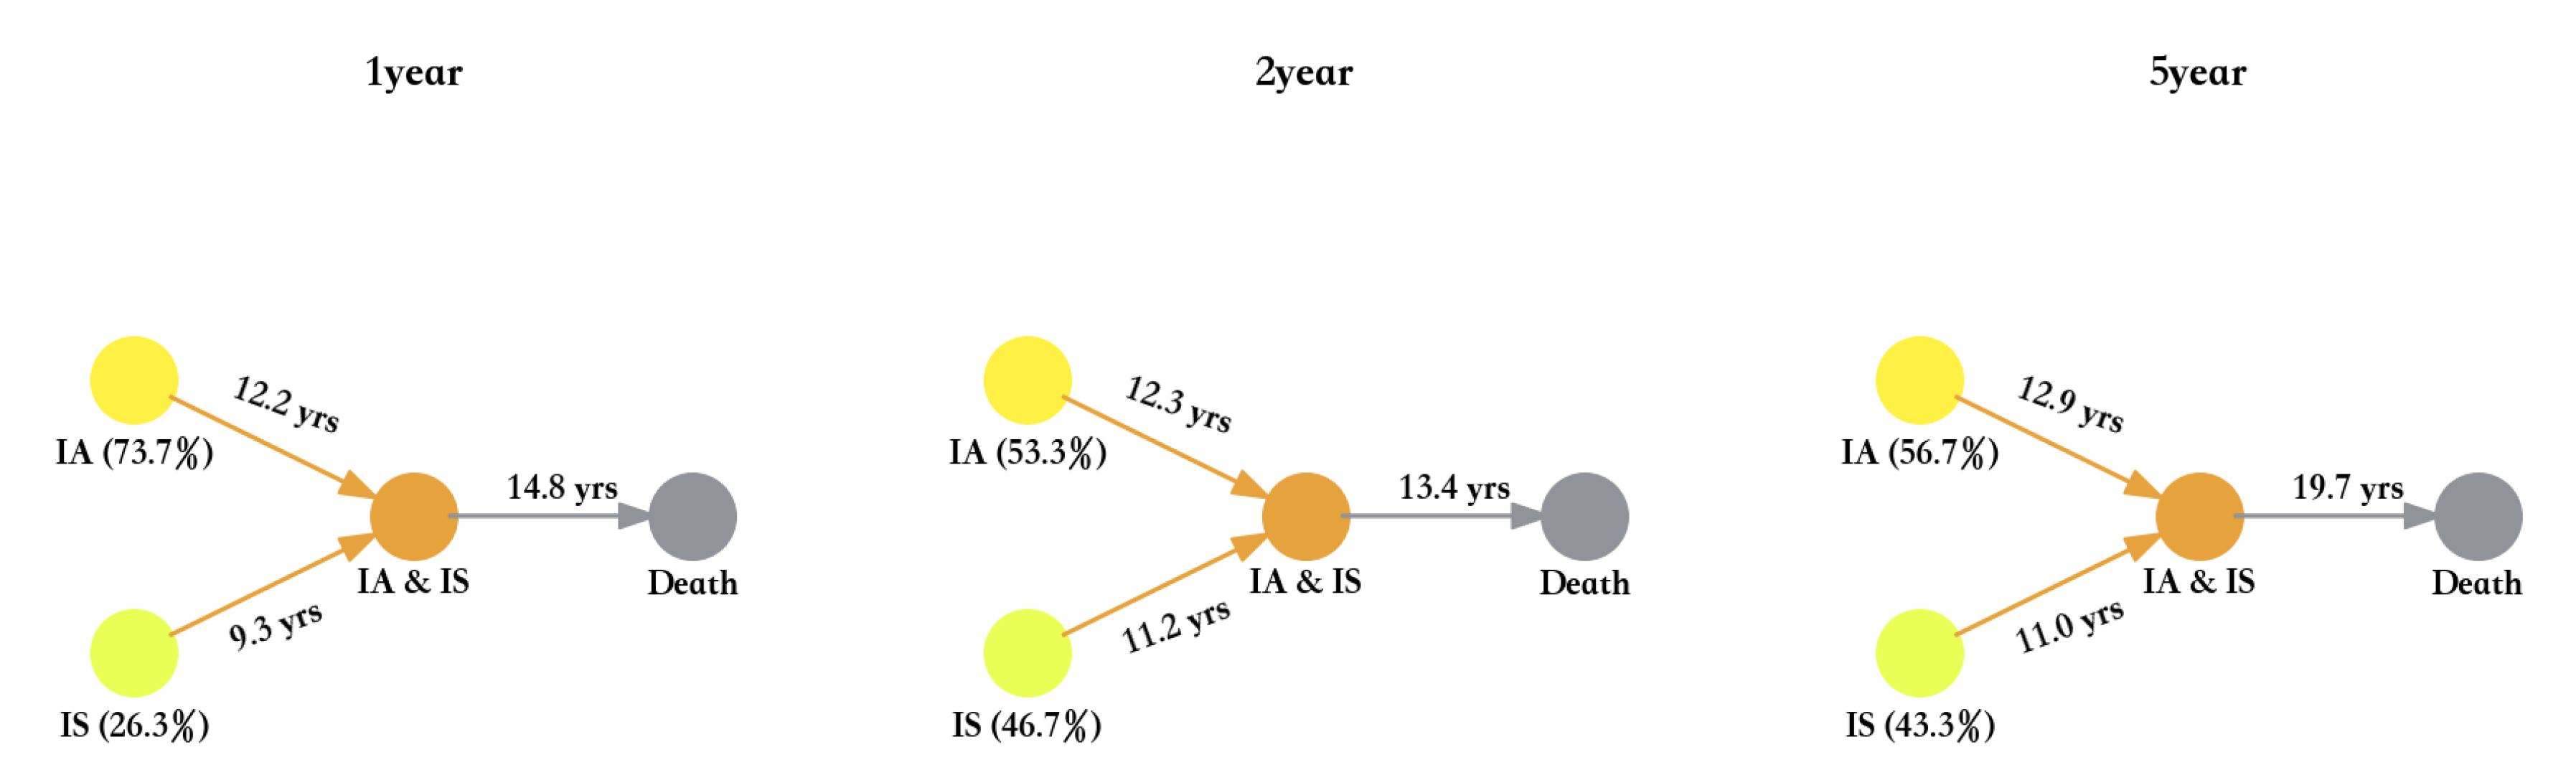
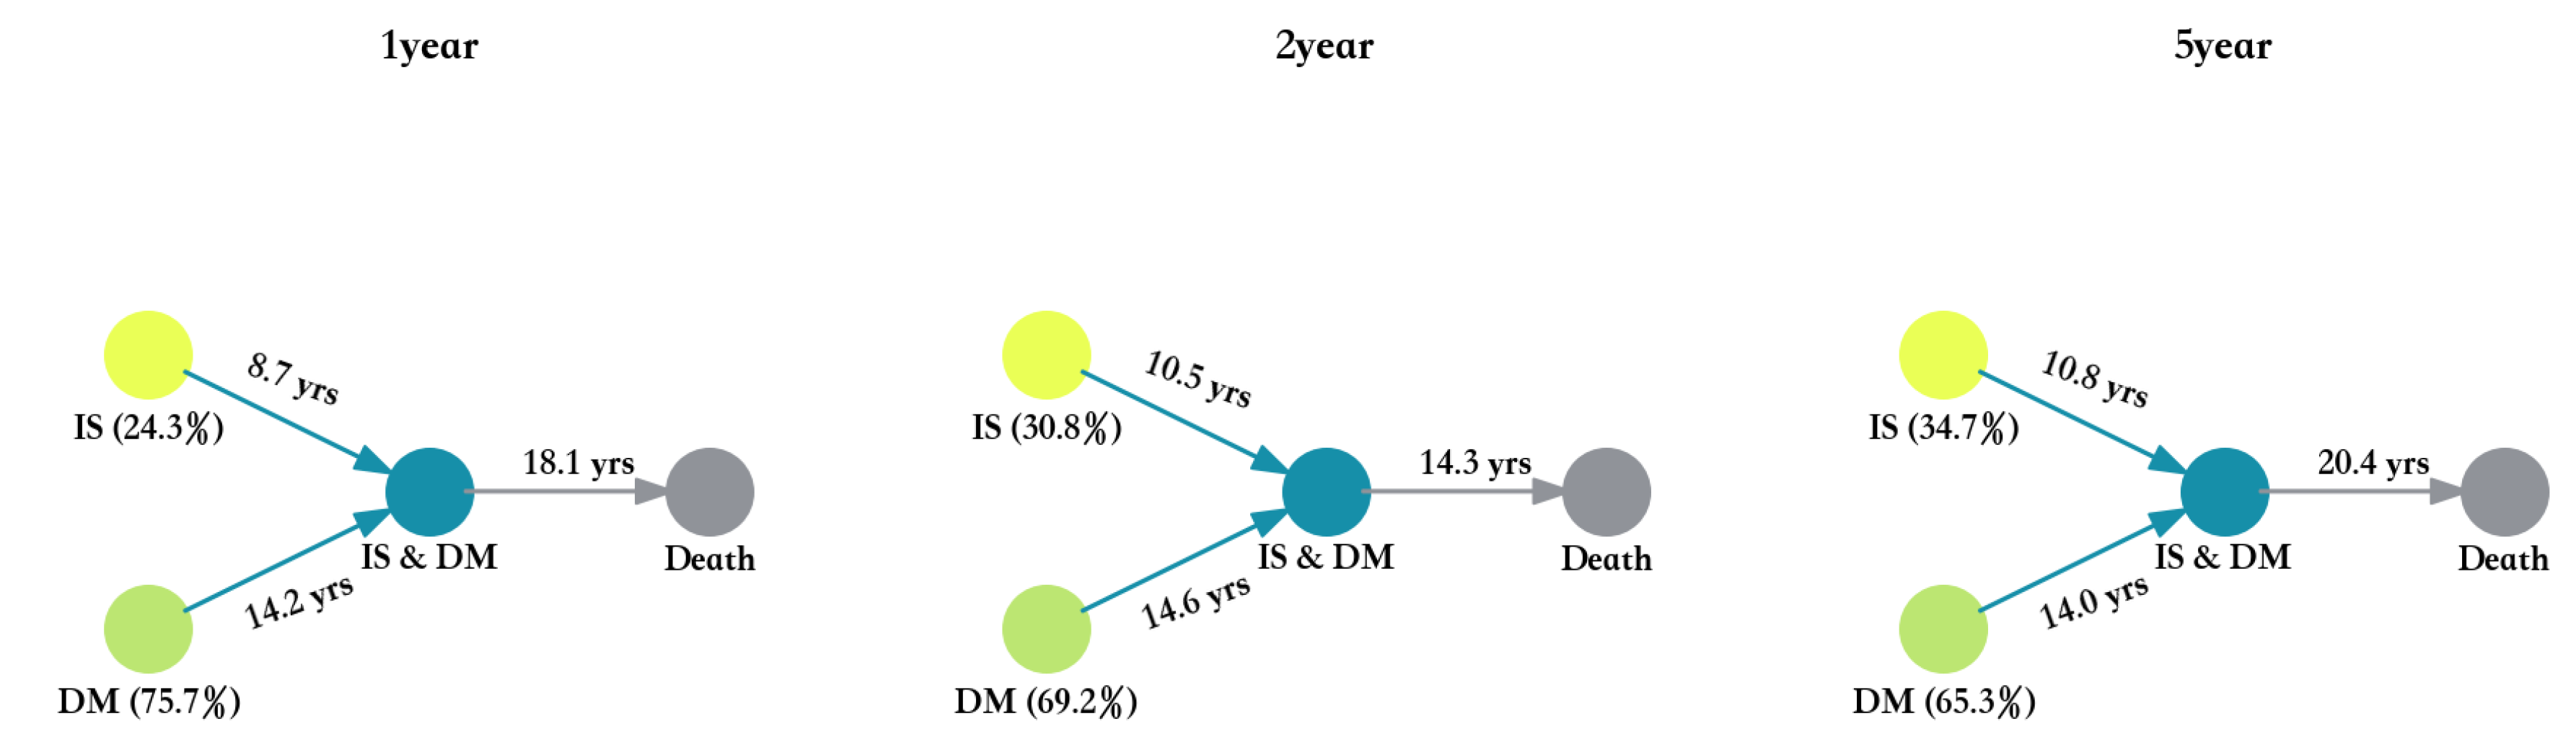
4.3.4. Comorbidity
The transition status of IA and IS, IA and DM, and IS and DM for different time interval groups are shown in
Figure 14,
Figure 15 and
Figure 16.
5. Conclusions
In this paper, we have presented our effort at the construction of a full-lifetime population cohort simulation framework. The design’s aim is to generate a comprehensive understanding of the disease transition over a full lifetime when we only have short-or-medium term population cohort data.
We have chosen IA, IS, and DM with their comorbidities as the simulation states. Three different time interval groups are simulated to decide the influence of time interval on the simulation result.
Overall, some differences were found in the three groups of simulation results. According to the analysis, due to the short simulation interval of the 1-year interval group, the statistical transfer probability is somewhat different from the real time of chronic disease transfer, and it is vulnerable to the fluctuation of the original data. However, because the time interval of each simulation round is short, the average transfer time is more accurate. For simulation results with 2- or 5-year time intervals, the influence of data fluctuations is reduced due to the increase in observed intervals. The number of chronic disease conversion subjects in each round of simulation was relatively stable. However, the disadvantage is that the long simulation interval leads to the average statistical transfer time is somewhat less accurate compared to the 1-year time interval simulation result.
Author Contributions
Conceptualization, P.S. and S.L.; methodology, P.S.; software, S.L.; validation, D.D., J.P. and S.L.; formal analysis, P.S.; investigation, P.S.; resources, X.Y.; data curation, P.S.; writing—original draft preparation, X.Y.; writing—review and editing, P.S.; visualization, S.L.; supervision, X.Y.; project administration, X.Y.; funding acquisition, X.Y. All authors have read and agreed to the published version of the manuscript.
Funding
This work is supported by the National Natural Science Foundation of China under Grant No. 91846303, and the Beijing Municipal Natural Science Foundation under Grand No. 4212043.
Institutional Review Board Statement
Not applicable.
Informed Consent Statement
Not applicable.
Conflicts of Interest
The authors declare no conflict of interest. The funders had no role in the design of the study; in the collection, analyses, or interpretation of data; in the writing of the manuscript; or in the decision to publish the results.
References
- Fortin, M. Prevalence of multimorbidity among adults seen in family practice. Ann. Fam. Med. 2005, 3, 223–228. [Google Scholar] [CrossRef] [PubMed] [Green Version]
- Fortin, M.; Lapointe, L.; Hudon, C.; Vanasse, A. Multimorbidity is common to family practice is it commonly researched? Can. Fam. Physician 2005, 51, 244–245. [Google Scholar] [PubMed]
- Van den Akker, M.; Buntinx, F.; Metsemakers, J.F.; Roos, S.; Knottnerus, J.A. Multimorbidity in general practice: Prevalence, incidence, and determinants of cooccurring chronic and recurrent diseases. J. Clin. Epidemiol. 1998, 51, 367–375. [Google Scholar] [CrossRef]
- Ornstein, S.M.; Nietert, P.J.; Jenkins, R.G.; Litvin, C.B. The prevalence of chronic diseases and multimorbidity in primary care practice: A pprnet report. J. Am. Board Fam. Med. 2013, 26, 518–524. [Google Scholar] [CrossRef]
- Ward, B.W.; Schiller, J.S.; Goodman, R.A. Multiple Chronic Conditions Among US Adults: A 2012 Update. Prev. Chronic Dis. 2014, 11, 130389-91. [Google Scholar] [CrossRef] [Green Version]
- Gao, Y.; Ping, Z.; Pei, X.; Cai, Y.; Wang, J. Multi-correspondence analysis of the status and related factors of chronic diseases multimorbidity in middle-aged and elderly people in China in 2009. J. Hyg. Res. 2020, 49, 844–849. [Google Scholar]
- World Health Organization. The world health report 2008: Primary health care now more than ever. In The World Health Report 2008: Primary Health Care Now More Than Ever; World Health Organization: Geneva, Switzerland, 2008; Volume 25, p. 617. [Google Scholar]
- World Health Organization. A Prioritized Research Agenda for Prevention and Control of Noncommunicable Diseases; World Health Organization: Geneva, Switzerland, 2011. [Google Scholar]
- Sun, X.; Yao, C.; Kang, X. The Application of Support Vector Machine in Building the Early Diagnostic Model of Coronary Artery Disease. Chin. J. Health Stat. 2011, 28, 122–125. [Google Scholar]
- Lappenschaar, M.; Hommersom, A.; Lucas, P.J.; Lagro, J.; Visscher, S.; Korevaar, J.C.; Schellevis, F.G. Multilevel temporal bayesian networks can model longitudinal change in multimorbidity. J. Clin. Epidemiol. 2013, 66, 1405–1416. [Google Scholar] [CrossRef] [Green Version]
- Diez, F.J. Parameter Adjustment in Bayes Networks. The Generalized Noisy Orgate. In Uncertainty in Artificial Intelligence; Morgan Kaufmann: Burlington, MA, USA, 1993; pp. 99–105. [Google Scholar]
- Jensen, A.B.; Moseley, P.L.; Oprea, T.I.; Ellesøe, S.G.; Eriksson, R.; Schmock, H.; Jensen, P.B.; Jensen, L.J.; Brunak, S. Temporal disease trajectories condensed from populationwide registry data covering 6.2 million patients. Nat. Commun. 2014, 5, 4022. [Google Scholar] [CrossRef] [Green Version]
- Strauss, V.Y.; Jones, P.W.; Kadam, U.T.; Jordan, K.P. Distinct trajectories of multimorbidity in primary care were identified using latent class growth analysis. J. Clin. Epidemiol. 2014, 67, 1163–1171. [Google Scholar] [CrossRef] [Green Version]
- Foguet-Boreu, Q.; Violán, C.; Rodriguez-Blanco, T.; Roso-Llorach, A.; Pons-Vigués, M.; Pujol-Ribera, E.; Cossio Gil, Y.; Valderas, J.M. Multimorbidity patterns in elderly primary health care patients in a South Mediterranean European Region: A cluster analysis. PLoS ONE 2015, 10, e0141155. [Google Scholar] [CrossRef] [Green Version]
- Sinnige, J.; Korevaar, J.C.; Westert, G.P.; Spreeuwenberg, P.; Schellevis, F.G.; Braspenning, J.C. Multimorbidity patterns in a primary care population aged 55 years and over. Fam. Pract. 2015, 32, 505–513. [Google Scholar] [CrossRef] [Green Version]
- Hsu, H.-C. Trajectories of multimorbidity and impacts on successful aging. Exp. Gerontol. 2015, 66, 32–38. [Google Scholar] [CrossRef]
- Lin, W.; Wang, C.; Li, M.; Sun, X.; Liu, Y.; Xue, F.; Yuan, Z. Association between trajectory of blood pressure and risk of coronary heart disease in middle aged and elderly population. J. Shandong Univ. Health Sci. 2019, 57, 106–112. [Google Scholar]
- Cao, Z.; Cheng, Y.; Wang, Y.; Sun, L.; Xu, F.; Wang, Y. The prospective cohort study for all cause death effects of high incidence chronic diseases on the elderly. Chin. J. Prev. Control. Chronic Dis. 2020, 28, 20–23. [Google Scholar]
- Lin, D.Y.; Wei, L.J. The robust inference for the cox proportional hazards model. J. Am. Stat. Assoc. 1989, 84, 1074–1078. [Google Scholar] [CrossRef]
- Cox, D.R. Regression models and lifetables. J. R. Statal Soc. 1972, 34, 187–202. [Google Scholar]
- Guo, Y.; Yan, R.; Zhang, W.; Liu, S.; Lv, Y. Longitudinal trajectories of illness perceptions among stroke patients and decision tree analysis of core determinants. J. Nurs. Sci. 2022, 37, 20–24. [Google Scholar]
- Cao, Z.; Liu, Q.; Li, J.; Zhang, J.; Ji, M.; Liu, L.; Song, M.; Sun, J.; Wu, Y. The Effect of Longitudinal Trajectories of Triglyceride-glucose Index on the New-onset Cardiovascular and Cerebrovascular Diseases. Chin. Gen. Pract. 2022, 25, 554–566. [Google Scholar]
- Han, J.; Luo, C.; Tan, J.; Fan, T.; Sha, H.; Wei, L.; Chen, R.; Lu, T.; Pan, M. Care dependency developmental trajectory of elderly patients withcomorbidities undergoing elective surgery based on latent growth mixture model. J. Nurs. Sci. 2022, 37, 71–75. [Google Scholar]
- Chen, Z.M.; Lee, L.; Chen, J.S. The Kadoorie Study of Chronic Disease in China (KSCDC). Int. J. Epidemiol. 2005, 34, 1243–1249. [Google Scholar] [CrossRef] [Green Version]
- Chen, Z.M.; Chen, J.S.; Collins, R. China Kadoorie Biobank of 0.5 million people: Survey methods, baseline characteristics and long-term follow-up. Int. J. Epidemiol. 2011, 40, 1652–1666. [Google Scholar] [CrossRef] [Green Version]
| Publisher’s Note: MDPI stays neutral with regard to jurisdictional claims in published maps and institutional affiliations. |
© 2022 by the authors. Licensee MDPI, Basel, Switzerland. This article is an open access article distributed under the terms and conditions of the Creative Commons Attribution (CC BY) license (https://creativecommons.org/licenses/by/4.0/).


