
A Tailored Pricing Strategy for Different Types of Users in Hybrid Carsharing Systems


1
School of Traffic and Transportation, Beijing Jiaotong University, Beijing 100044, China
2
Key Laboratory of Transport Industry of Big Data Application Technologies for Comprehensive Transport, Beijing Jiaotong University, Beijing 100044, China
*
Author to whom correspondence should be addressed.
Algorithms 2022, 15(5), 172; https://0-doi-org.brum.beds.ac.uk/10.3390/a15050172
Submission received: 20 February 2022
/
Revised: 15 May 2022
/
Accepted: 18 May 2022
/
Published: 20 May 2022
(This article belongs to the Topic Artificial Intelligence and Computational Methods: Modeling, Simulations and Optimization of Complex Systems)
Abstract
:Considering the characteristics of different types of users in hybrid carsharing systems, in which sharing autonomous vehicles (SAVs) and conventional sharing cars (CSCs) coexist, a tailored pricing strategy (TPS) is proposed to maximize the operator’s profit and minimize all users’ costs. The fleet sizes and sizes of SAVs’ stations are also determined simultaneously. A bi-objective nonlinear programming model is established, and a genetic algorithm is applied to solve it. Based on the operational data in Lanzhou, China, carsharing users are clustered into three types. They are loyal users, losing users, and potential users, respectively. Results show the application of the TPS can help the operator increase profit and attract more users. The loyal users are assigned the highest price, while they still contribute the most to the operator’s profit with the highest number of carsharing trips. The losing users and potential users are comparable in terms of the number of trips, while the latter still makes more profit.
1. Introduction
Sharing cars have gained more and more attention in the past few years due to the high utilization rate [1] and the environmental-friendly [2]. Automobiles in the USA spent nearly 90% of their time in parking spaces in 2001 [3]. Furthermore, sharing cars can be used by many people in a day without owning one. From the perspective of sustainability, carsharing is the trend of the future [4]. Most carsharing systems in China are one-way station-based systems, where users can borrow and return cars flexibly [5]. Sharing cars are named conventional sharing cars (CSCs) in this study. In this system, users need to borrow or return cars at stations, and they finish trips in three steps. They need to walk or take bikes from the origins to borrow cars at stations firstly, drive to returning-car stations, and finally go to their destinations by walking or cycling. It is not convenient enough for users. Nowadays, autonomous vehicles (AVs) can already be driven in specific situations [6,7], and they are also used as autonomous trucks [8]. As AVs enter the carsharing systems as sharing autonomous vehicles (SAVs), users can wait for SAVs to pick them up at origins and drop them off at destinations. When compared with CSCs, SAVs can provide more convenient and flexible door-to-door services to users by charging more.
Most research focuses on carsharing systems with either CSCs or SAVs. However, with the development of carsharing systems, there will be CSCs and SAVs coexisting for a long time [4], which is named hybrid carsharing systems here. As far as we know, there are still no studies focusing on hybrid carsharing systems with CSCs and SAVs.
For carsharing systems, setting reasonable prices is vital to enhancing profit [9] and greatly impacting users’ choices [10]. Pricing strategies can be performed in many ways, e.g., incentive, discount/coupon, or penalty. Different pricing strategies have different influences on users’ behaviors [11]. Further, different types of users have different sensitivity to the same price [12] and other distinct characteristics, such as risk preference [12], trip frequency [13], trip purpose [14], and activity persistency [13,15]. Most focus on determining the optimal prices for a whole day or different prices in different periods. However, prices are still uniform for all travelers, and the uniform pricing strategy cannot precisely meet the demands of different user clusters considering their unique characteristics.
Previous studies about the pricing strategies only considered a single service mode in the carsharing system, i.e., the service of CSCs [16] or SAVs [17]. For the service of CSCs, the operator only relocates CSCs between stations to provide station-to-station services to users by maximizing the profit by it containing the cost of relocations, gas consumption, and depreciation and maintenance costs for sharing cars and parking spaces [18]. While for the service of SAVs, the operator does not need to perform relocations, and SAVs are assigned to serve users from their origins to destinations by maximizing profit concerning the assignment cost of SAVs, gas consumption, depreciation, and maintenance costs [19]. In the hybrid carsharing system with both the service of CSCs and the service of SAVs, users can choose different services based on some rules. Therefore, users’ mode choices should be considered in hybrid carsharing systems, which are different from the studies in carsharing systems with a single mode.
In this study, we consider a hybrid carsharing system with both the service of CSCs and the service of SAVs. Users’ choice behaviors are taken into account based on the utilities of each mode. For the service of CSCs, the utility is related to the walking cost from origins to borrowing-car stations, driving cost between stations, and the walking cost from returning-car stations to destinations. For the service of SAVs, the utility is related to the cost of waiting for the SAVs to drive from the nearest autonomous sharing stations to origins and the rental cost of SAVs between origins and destinations. Then, a tailored pricing strategy (TPS) for different user clusters is proposed by combining user clusters’ characteristics in the hybrid carsharing system. Finally, a bi-objective nonlinear programming model is built by considering the operator’s profit and the travel costs of all users simultaneously to determine the optimal fleet size, location, and size of autonomous carsharing stations. Case studies are carried out to explore how the TPS impacts the carsharing system. It turns out that the TPS can reduce all users’ costs and increase the operator’s profit at the same time.
The main contributions of this study are given below:
- In a hybrid carsharing system with both the service of CSCs and the service of SAVs, users’ choice behaviors for different service modes are modeled by considering the rental costs and walking costs of the two service modes.
- Based on the different characteristics of each user cluster, a bi-objective nonlinear programming model is built up to determine the optimal fleet size and prices for different service modes. The TPS is proposed to improve the operator’s profit and the system’s service level. Results show the proposed TPS can enhance the operator’s profit and lower users’ costs.
The paper is organized as follows. In Section 2, literature about SAVs and pricing strategies is reviewed. Then, in Section 3, considering the characteristics of each user cluster, a bi-objective nonlinear programming model is formulated to set tailored prices for different user clusters in the hybrid carsharing system. In Section 4, case studies in Lanzhou, China, are performed to testify to the efficiency of the TPS. Conclusions are drawn in Section 5.
2. Literature Review
2.1. Pricing Strategy in Conventional Carsharing Systems
Many studies showed that prices and demands are related, and a coefficient named price elasticity is widely used to describe the relationship between them [11,16]. Price elasticity equals the demand variations divided by price variations, which is applied to describe the price sensitivity of different user clusters. Different user clusters have different reactions to the same price. Jorge and Correia studied the trip pricing strategy in one-way station-based carsharing systems. A hybrid-integer nonlinear programming model was built to maximize the carsharing operator’s profit [11]. Price and demands were also elastically connected, then a hybrid-integer nonlinear and nonconvex programming model was established to determine the trip price, fleet size, personnel size, and relocations simultaneously [16]. Further, Huang et al. [18] constructed a logit model to represent the nonlinear carsharing demands. Results showed that pricing was a key factor impacting the operator’s profit. A bi-level programming model was built by considering the profit of the carsharing operator and costs of all users and compared the advantages of relocation, pricing, and the combination of relocation and pricing. Results showed that the pricing strategy outperformed in saving costs for all users [20].
Besides the connections between price and demands, many studies also performed price incentives to enhance the performance of conventional carsharing systems. Four price incentive strategies were proposed to help operators. For example, by encouraging users to book cars that should be relocated or parked in a region with low availability of cars, the operator can also set paid relocation tasks and hire users to perform or encourage users to share a car with others. These strategies were much more economical and environmental-friendly [21]. Similar research was done by Angelopoulos et al. [22]. They applied pricing incentives to relocate sharing cars by users instead of relocations by staff. Different price incentives were given based on the priority of each relocation. This strategy worked well in balancing the number of cars in the carsharing system.
Studies mentioned above demonstrated the importance of the prices of sharing cars. However, the characteristics of different users are still not considered in pricing strategies.
2.2. SAVs
Research related to SAVs mainly focused on analyzing the advantages of the SAVs, the assignment and/or dispatch problem, and the price setting. The most common advantages of AVs are to reduce the ownership of private cars [23], less waiting time, shorter travel mileage [24,25], and fewer empty trips [26].
The assignment problem of SAVs is also widely studied. Hanna et al. [27] matched AVs to users’ demands and found that the waiting time and the number of unoccupied trips significantly decreased. Users were clustered by considering the similarity of time and space; then, SAVs were assigned to them. Several users in the same cluster can share an SAV in the study. Extending the waiting time would decrease the fleet size [28]. The joint optimization problem of the assignment and dispatch of AVs was also studied [19]. Centralized dispatchers were designed for immediate travel requests, and decentralized dispatchers served reservation requests. The dispatch strategy worked well in improving the revenue and satisfaction rate of the demands.
Researchers attached much attention to the price-setting problem for AVs. Karamanis et al. [29] explored the advantages of dynamic pricing in a hybrid system with public transport and AVs. A hybrid service of private and ride-sharing was provided by AVs. They found that dynamic pricing was much superior to static pricing in increasing the number of shared trips. By considering the distance, parking fee, traffic, and road conditions, the price for long-range autonomous valet parking was optimized [17]. The performance of hybrid autonomy systems with AVs and human-driven cars was also explored [30]. By setting differentiated prices for different types of cars, the equilibria of the system were achieved efficiently. AVs were assumed to use to provide E-hailing services. A link-based dynamic pricing model was proposed to improve the performance of the road network system [31]. In a hybrid ride-sharing system with AVs and human-driven cars coexisting, the connection between the fleet size of AVs and the operational costs was studied by adjusting the prices for riders and the compensation cost for drivers. It turned out that the operational costs had a significant impact on the setting of the fleet size of AVs. AVs were adopted by Uber and Lyft (examples of ride-sharing companies). Schaller [32] revealed that ride-sharing is one of the competitors of sharing cars. Shokoohyar [33] studied the ride-sharing system from the perspective of drivers considering Uber and Lyft compete with each other. Results showed that the operational cost played an essential role in the drivers’ job satisfaction. Furthermore, Shokoohyar et al. [34] pointed out that reward programs could be used to keep the users as loyal customers.
In previous studies, AVs were mainly used in the taxi or ride-sharing systems. There are no studies focused on hybrid carsharing systems with both the service of SAVs and the service of CSCs. Further, uniform prices were offered to users, and rare research about the differentiated prices for hybrid carsharing systems. To fill the gap, the choice behaviors of different user clusters are analyzed in hybrid carsharing systems. Then, a TPS is proposed to set tailored prices for different user clusters by considering the characteristics of each user cluster, and a bi-objective nonlinear programming model is formulated to maximize the operator’s profit and simultaneously minimize all users’ costs. The optimal price, fleet size, location, and size of SAV stations are jointly determined.
3. Model Formulation
A mathematical model is set to describe the TPS by considering the characteristics of each user cluster in a hybrid carsharing system. Firstly, the hybrid carsharing system is introduced. Then, the notations used in the model are listed. The user clustering is also presented. Finally, the model is described.
3.1. The Hybrid Carsharing System
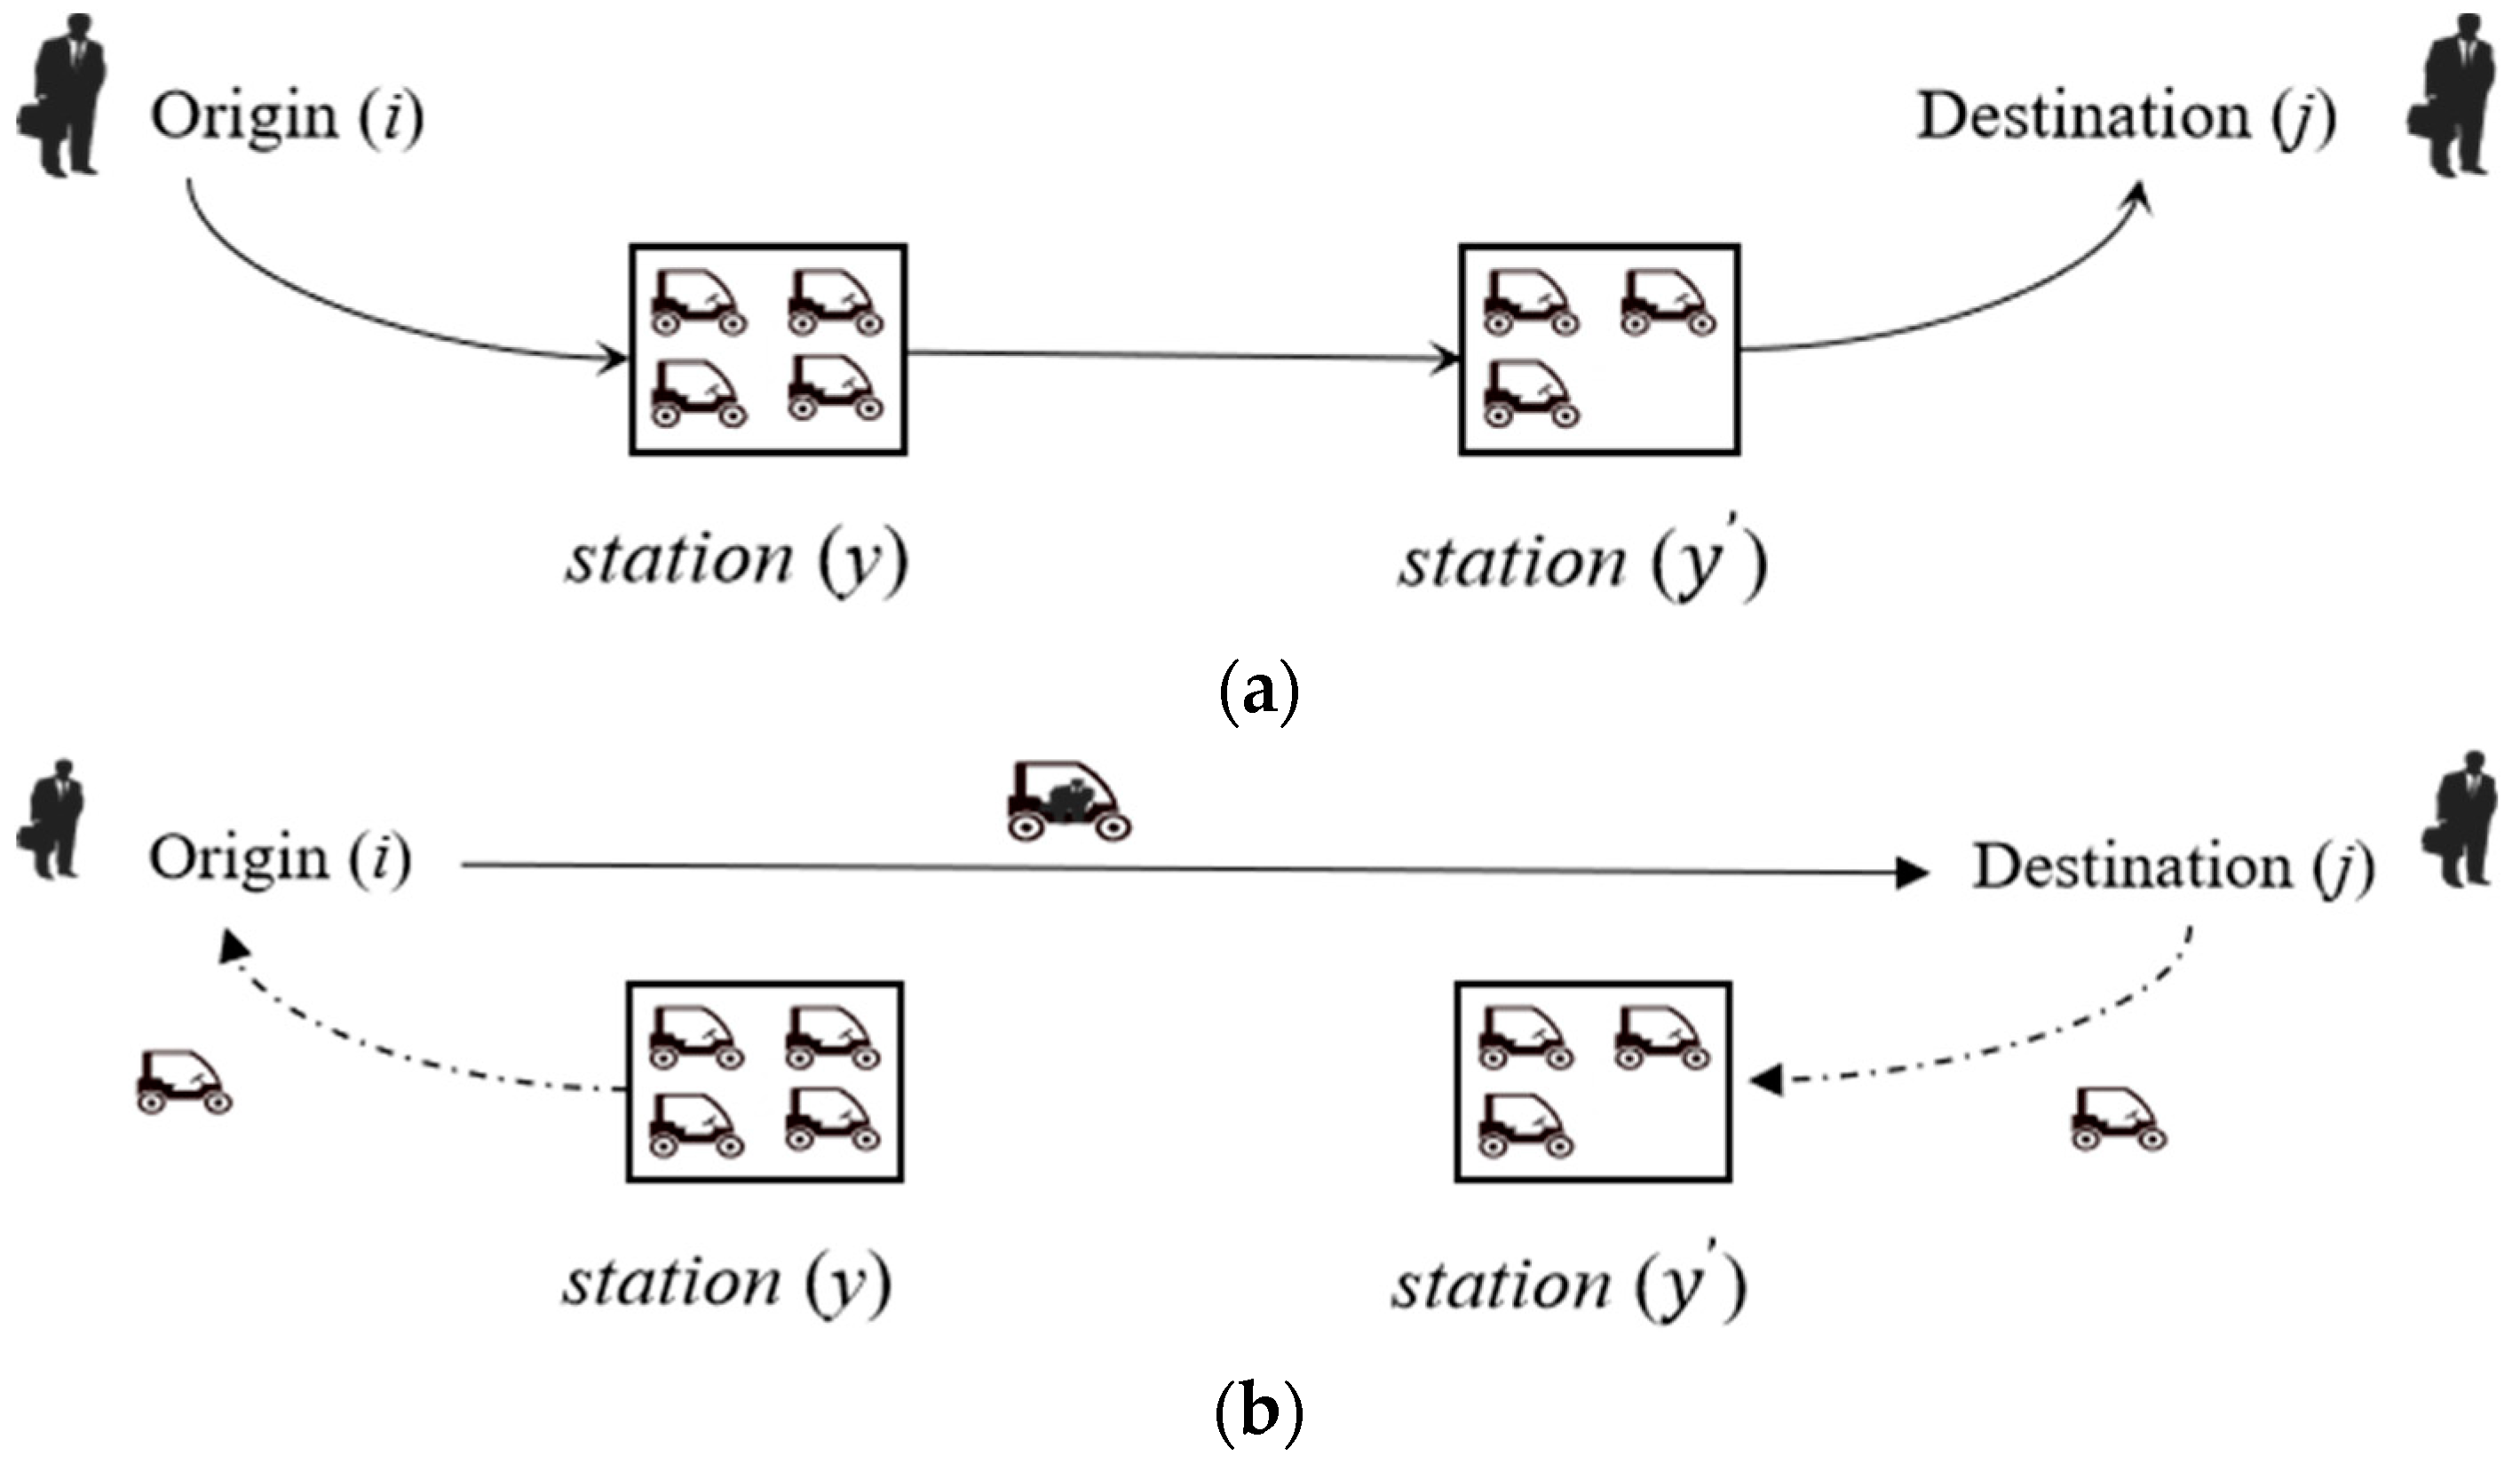
When considering a hybrid carsharing system, there are two kinds of services provided, i.e., the service of CSCs and the service of SAVs, respectively. The former already exists, and the latter is new. The service of CSCs is station-based, which means users must borrow or return CSCs to the nearest carsharing stations. Figure 1 gives an example of the two service modes. In Figure 1a, station is the nearest carsharing station to origin , and station is the nearest carsharing station to destination . For brevity, assuming that users walk from origin to the nearest carsharing station or from the nearest carsharing station to destination . The full-service mode of CSCs is that users walk from origin to station , drive a sharing car to station , and finally walk to destination .
SAVs can provide door-to-door services, as shown in Figure 1b, where SAVs can pick up users from origins and then drop them off at destinations. Users only need to wait at origin , and SAVs would drive from the nearest SAV station to pick them up. Then, users can finish trips directly from origin to destination . After their trips are finished, SAVs are requested to drive back to the nearest SAV station . It is assumed that an SAV can only serve one user per trip.
3.2. Notations
To make a tradeoff between the profit of the carsharing operator and the travel costs of all users, a bi-objective programming model is established to set tailored prices for each user cluster in the hybrid carsharing system. Users in this study are clustered into three types by the K-means clustering method [35]. They are loyal users, losings users, and potential users, respectively. The fleet size for SAVs and CSCs and the size of the SAV stations are also needed to be set in the model. Notations used in the bi-objective programming model are listed below.
| Set | |
| Set of service modes, . and separately represent the service of CSCs and the service of SAVs. | |
| is the maximum cluster. | |
| is the maximum time step of the studied period. | |
| are commonly used indices. | |
| Carsharing stations for the service of both CSCs and SAVs, Commonly used indices are and . | |
| Time-space nodes set combines the nodes and time steps, and means node at time step . | |
| Parameters | |
| Travel demands of user cluster between nodes and node , the departing time step is , and the arriving time step is The demands can be satisfied either by CSCs or SAVs, is dependent on the service mode the user cluster chooses, . | |
| Walking time for user cluster who choose service , between origin and station , departing from time step , . | |
| Walking time for user cluster choosing service , between station and destination , and the departing time step is , . | |
| Waiting time for user cluster choosing service , between station and origin , departing from time step , . | |
| Walking cost per minute for user cluster who choose service . | |
| Waiting cost per minute for user cluster who choose service , . | |
| The initial number of trips for user cluster who choose service , departing from node at time step and arriving at node at time step is different when users choose different service modes. | |
| The initial or the highest price can be set between node and for user cluster who choose service , . | |
| The number of parking places of CSC station , . | |
| The maintenance cost for a parking place per day under service , . | |
| The depreciation cost per car per day under service , . | |
| The driving cost, the operator, should pay for a car per time step under service , . | |
| Travel cost for user cluster who chooses service , departing from node at time step and arriving at node at | |
| Decision variables | |
| The number of trips for user cluster who choose service , departing from node at time step and arriving at node at , is dependent on the service mode users choose. | |
| Rental price per time step between nodes and for user cluster choosing service , and the departing time step is , . | |
| The number of parking places for SAV station , . | |
| Auxiliary variables | |
| The probability of carsharing users who would potentially choose SAVs between nodes and , and the departing time step is . | |
| Demand variation between nodes and for user cluster who choose service , . | |
| Price variation between nodes and for each user cluster under service , and the departing time step is , . | |
3.3. User Clusters and Price Elasticity
In this study, differential prices are given to different user clusters based on the unique characteristics of each one. In our previous study [36], the using frequency monthly and duration (equal to the time of the last use minus the time of the first use) are proposed to be indicators. Then, users can be clustered into three types by the K-means clustering method. Details about the indicators and the clustering results are all shown in Table 1. The first cluster is called the loyal users, i.e., the number of daily trips remains constant. The second cluster is named the losing users, i.e., the number of trips keeps fading until it reaches 0. The last cluster is called the potential users since the number of trips keeps increasing from the middle of the study period.
Each cluster of users have unique characteristics, e.g., travel potential , consumption potential , travel efficiency , and average revenue . Travel potential is defined as the number of carsharing trips of each user cluster. Consumption potential is the revenue that each user cluster can contribute to the operator. Travel efficiency is equal to the total travel time divided by the total travel distance, which means the average travel time per unit travel distance. The bigger the value, the lower the travel efficiency for the corresponding cluster. The average revenue means the average profit per trip each cluster can bring to the operator. As shown in Table 1, the loyal users have the highest travel potential and consumption potential with the lowest average revenue. The average revenue of the losing users is the highest, while the other two indicators are the lowest.
Based on the analysis mentioned above, the penalty coefficient is defined to describe the differences of all user clusters in the model.
Since CSCs or SAVs might not serve all travel demands. The operator would pay extra penalty costs for unmet demands. The penalty coefficient is used to evaluate the potential effect of the unsatisfied demands for user cluster on the operator’s profit. It combines the average revenue, travel potential, and consumption potential, given as Equation (1). The second term and last term mean the proportion of consumption potential and travel potential of user clusters among all user clusters, respectively. The higher the coefficient of user cluster , the more important the corresponding user cluster. Since the penalty coefficient for loyal users is the highest, it is apparent that losing them would significantly reduce the operator’s profit.
Given the circumstances that different user clusters have different features, the TPS is used to set different prices for different clusters and then exploit the potential of all user clusters. In this study, user clusters are distinguished by the price elasticity . The formulation is as shown in Equation (2), which connects the price variations and demand variations. The price elasticity of each user cluster is also given in Table 2. When jointly considering the indicators mentioned in Table 1, the price elasticity of loyal users is set to be the lowest. Since the potential users have the lowest proportion and the highest travel efficiency, they are the most sensitive users to the price. Their price elasticity is set to be the highest.
The demand variation of user cluster can be rewritten as Equation (3).
3.4. Bi-Objective Nonlinear Programming Model
In this section, a bi-objective nonlinear programming model is established to determine the fleet size, location, and size of SAV stations of the hybrid carsharing system. In this model, tailored prices are given, considering the characteristics of each user cluster. In the following, the service choice behaviors and characteristics of all user clusters are analyzed first. Then, the bi-objective nonlinear programming model is constructed in terms of both the operator’s profit and all users’ costs. Finally, the method used to solve the model is presented.
3.4.1. Service Choices of Users
There are two services provided in the system mentioned in Figure 1. Users can choose the service based on the travel utilities of each service. The travel utility of each service takes the negative value of the travel costs of the corresponding service.
The service of CSCs; for users who choose CSCs, the travel costs are shown in Equation (4).
It incorporates three parts, i.e., the walking costs from origin to station and from station to destination , and the rental fees of the CSCs between stations and . All costs mentioned before are linearly connected with the travel time of the trip.
The service of SAVs. Equation (5) shows the travel cost of users who choose SAVs.
there are only two components included. The first one is the waiting costs (waiting for SAVs driving from station to origin to drive them up), and the second is the rental fees from origin to destination .
The travel utility of each mode takes the negative value of the corresponding travel cost. The probability of users’ who would choose SAVs can be calculated based on the logit model in Equation (6).
Then, the upper bound of the number of SAV users belonging to different user clusters is calculated as Equation (7). It ensures that the number of users who choose the service of SAVs is no greater than the upper limit.
3.4.2. Model Formulation
A bi-objective nonlinear programming model is constructed by simultaneously considering the operator’s profit and all users’ costs. The TPS is applied to help the operator and users achieve the goal. The price for each user cluster, fleet size, size of SAV stations, and the demands satisfied by CSCs and SAVs are all determined by the model.
- (1)
- Objective Functions
The objective functions contain two objectives; one is the operator’s profit maximization, and another is to minimize all users’ costs.
Since the carsharing operator can provide two kinds of service, including the service of CSCs and the service of SAVs, then the profit also comes from the two modes. The first objective function is given in Equation (8), and the operator’s profit is maximized.
The first and second terms show the profit gained by the service of CSCs and the service of SAVs, respectively. For the service of CSCs, the operator’s profit equals the rental fees paid by users between stations minus the driving costs during the trips. For the service of SAVs, the profit is equal to the rental fees between origins and destinations paid by users. The third term means the extra driving cost paid by the operator during the trips of SAVs, i.e., the driving cost of SAVs from the carsharing stations to users’ origins and from users’ destinations to carsharing stations. The fourth term represents the depreciation cost of all sharing cars, and the fifth part refers to the maintenance cost of all parking spaces. The last term gives the penalty cost of the unsatisfied carsharing demands.
The second objective is given in Equation (9), and all users’ costs are minimized.
All users’ costs are composed of CSC users and SAV users. CSC users need to pay the rental fees of CSCs between carsharing stations and the walking costs. Combined with the service provided by CSCs (Figure 1a), the walking costs include two components; one is the walking costs from origins to carsharing stations, and another is the walking costs from drop-off stations to destinations. In Figure 1b, SAV users need to pay the rental fees from origins to destinations and the waiting costs when SAVs drive from the nearest carsharing stations to origins.
- (2)
- Constraints
Constraints in the programming model include the flow conservation, constraints about the fleet size and demands, and restrictions about decision variables.
- Flow conservation
The fleet size in consecutive time steps at each station follows the flow conservation rules, as shown in Equation (10).
For both the CSCs’ stations and SAVs’ stations, the number of available sharing cars in the next time step equals to the number of available sharing cars at the current time step , minus the number of cars rented by users at the same time step, then plus the number of users who arrived at this station at the current time step.
The time steps used in Equation (10) are explained below. As shown in Figure 1, when users travel from node to node , the nearest carsharing stations to node and are station and station , respectively. The arriving time step at station is . The departing time step at node is , and the arriving time step at destination is . When users travel from node to and stop by carsharing station and , the arriving time step at station is still , is the departing time step at node and corresponds to the arriving time step at node . Details about the time steps are shown in Table 3.
- Constraints about demands
Since the demand for each cluster is limited, users belonging to different clusters can choose the service of CSCs and the service of SAVs based on the utilities of each service mode. Then, there is an upper bound for the CSC users.
Demands satisfied by CSCs are less than the potential CSCs’ demands, which equals the total demands minus the demands satisfied by SAVs.
Furthermore, under the TPS, the new demands equal to the initial demands plus the demand variations brought by price variations. The demand variation is already given in Equation (3). The demand variation between the same nodes is different for different user clusters.
- Constraints about the fleet size
The fleet size is restricted by the size of the station.
Constraints (13) guarantee that the number of available sharing cars at each station is always no greater than the number of parking places at the same station.
- Domain of decision variables
Constraints (14)–(17) set the domain of all decision variables.
Especially in constraints (14), the price is ensured to vary within the predefined scope, and it should be no greater than the highest price.
Demands satisfied by the CSCs and SAVs are restricted to be an integer in constraints (15)
The number of available sharing cars at each node should also take an integer as below.
The number of parking spaces at each carsharing station should be an integer for SAVs as shown in constraints (17).
3.5. Solution Approach
One of the typical methods to transform a multiple-objective programming model into a single-objective model is linear weighting. A parameter is used to show the importance of one of the objective functions. Considering the importance of the operator’s profit and all users’ costs in the hybrid carsharing system, can be set between 0 and 1. In this study, it is set to be 0.5. It indicates that we take the operator and users equally. The transformed single-objective function becomes the form of Equation (18).
There is a logit model in constraints (5) and a price elasticity in Equation (3) in the transformed programming model. Since the prices for each user cluster are decision variables, it makes the model nonlinear. A genetic algorithm (GA) is applied to solve it, and its coding is by Python. The prices, number of trips of each user cluster, and the number of available sharing cars are all generated randomly as an initial solution. The pseudo-code of the GA is listed in Table 4. is the maximum number of iterations in the GA, and it is set to be 200. is the size of the population and takes 100. and are the crossover rate and mutation rate, respectively, and the values are all set to be 0.5.
4. Case Studies: Lanzhou, China
4.1. Setting Up the Case Studies
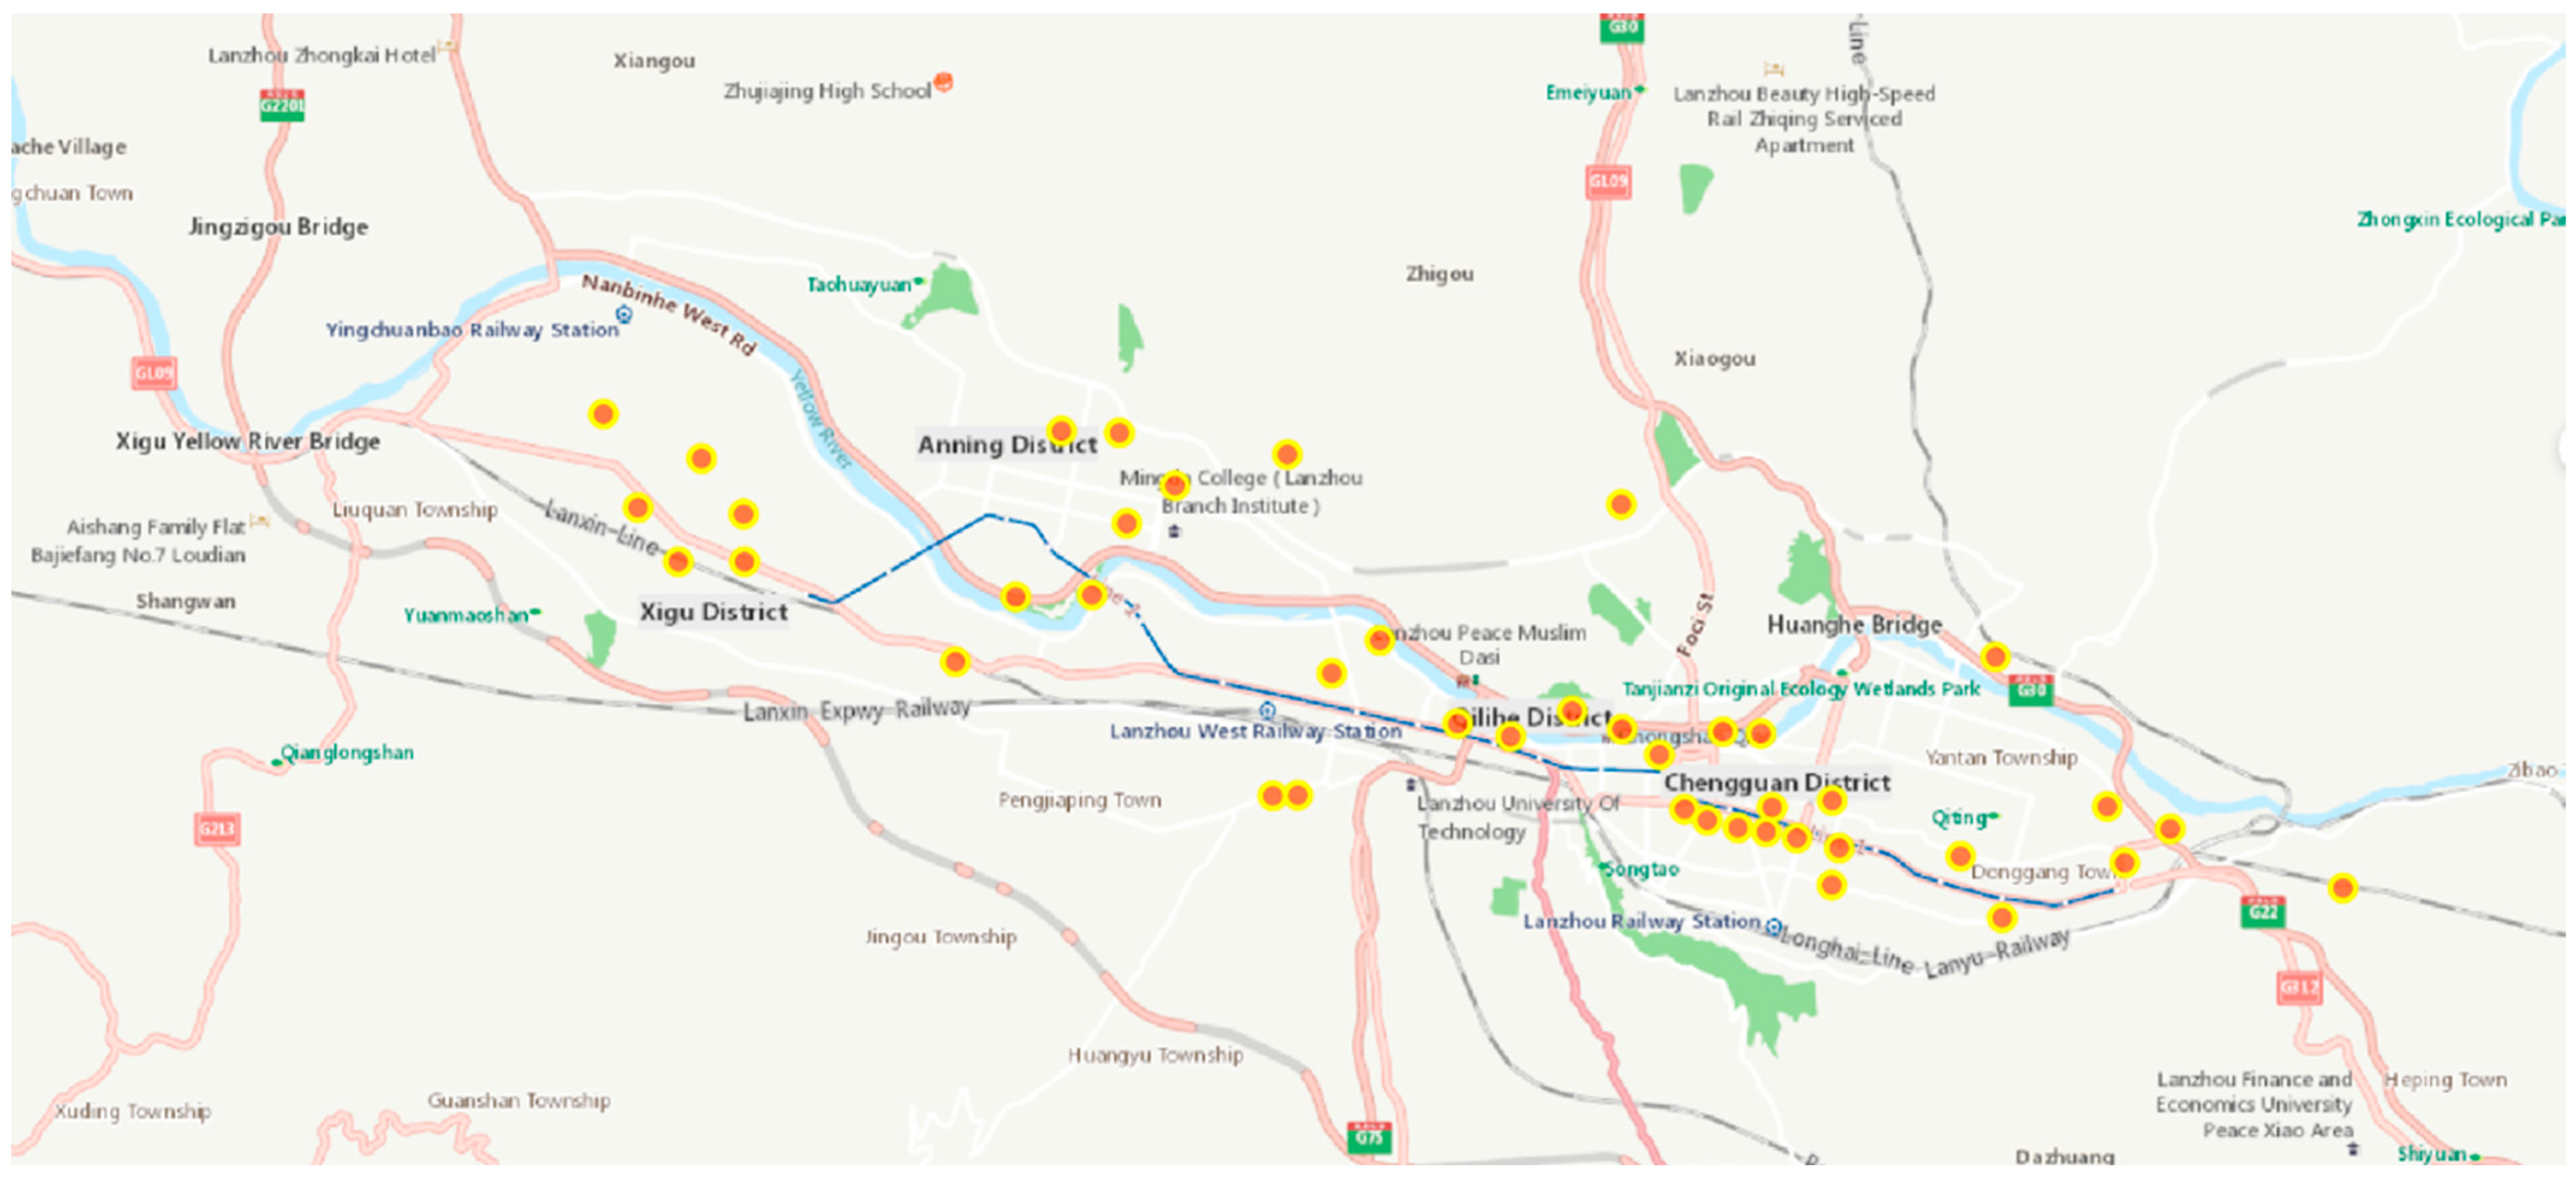
Case studies in Lanzhou, Gansu Province, China, are performed to testify to the efficiency of the TPS for different user clusters. Operational data provided by the carsharing operator in Lanzhou starts from 8 September 2018, to 24 March 2019. The data information includes the data order, start and end time of each trip, pick-up and drop-off stations, travel mileage, users’ ID, etc. There are 84 carsharing stations in total in the carsharing system. Stations used rarely are erased, and the standard of rarely used is that the total number of demands is less than 1000 during the seven months. There are 43 active carsharing stations in the end, and the positions are all labeled in Figure 2. There are 162,158 valid data and 8117 users.
Stations’ sizes, which are the number of parking spaces of each conventional carsharing station, are pre-known. The operational period from 6:00 a.m. to 24:00 a.m. is considered the studied period. It is divided into 9-time steps with a duration of 2 h. Data required in the model is the carsharing demand matrix, price matrix, and travel time matrix. These data all come from real data in Lanzhou. It is noted that travel times for the same trip are different for different user clusters, and it is influenced by the travel efficiency of each cluster.
According to previous studies [18,37,38], the walking time is set to be 5 min for all users who choose the service of CSCs, and the waiting time is also set to be 5 min for users who choose SAVs. The coefficients used in the study are listed in Table 5. Due to the limitation of the operational data, the walking cost () and the waiting cost per minute () for all clusters are assumed the same. The price elasticity is mainly used to reflect the reactions of different clusters to the price variations, and the values for all clusters are already given in Table 2. For the service of CSCs and the service of SAVs, the initial prices and the highest prices are all set to be the same, and they are 0.5 ¥/min and 1.0 ¥/min, respectively.
4.2. Experiments and Results
Influences of the TPS are explored by comparing the models with the TPS (Model I) and without the TPS (Model II). Model II is the same as the transformed model in Equation (18) and constraints (4), (7), (8) and (11)–(18), but the price elasticities for all user clusters are set to be 1.5. The iteration procedures for the models are shown in Figure 3. The fitness of the GA changes little when the iteration number reaches . The proposed GA can always converge in several minutes.
4.2.1. Performance of the Hybrid Carsharing System
When users are not clustered, which means the operator does not apply the TPS in the hybrid carsharing system, then a uniform price is given to all users. In other words, the operator assumes that there is only one type of user. When the TPS is applied based on the clustering results of users, differential prices are given to different clusters. Relevant results are listed in Table 6 to show the advantages of the TPS. It is apparent that the operator’s profit, all users’ costs, and the system planning are different, considering there are different clusters of users. It is essential to take into account the diversity of users.
Several indicators in Table 6 are used to evaluate the performance of the carsharing system with or without the TPS. Revenue corresponds to the first three parts of the objective function (9). It is equal to all rental fees the operator collects from users minus the driving cost the operator needs to pay. The depreciation cost of sharing cars is linearly related to the number of sharing cars, as is the maintenance cost of the parking places and the number of parking places. As for profits, it is the objective function (10). The number of parking spaces is the number of new parking spaces built for SAVs. The fleet size of CSCs or SAVs is the number of sharing cars.
Additionally, five indicators are built to describe the users’ behaviors. The rental cost of CSC users is the cost paid by all the users under the service mode of CSCs. The walking cost of CSC users means the extra walking cost users need to pay between CSC station and destination (origin). The rental cost of SAV users is the rental cost that the SAV users should pay between their origins and destinations. The waiting cost of SAV users is the cost users need to pay when they are waiting for the SAVs driving from SAV stations to their origins to pick them up. All users’ costs correspond to the objective function (10).
4.2.2. Efficiency of the TPS
Table 6 provides indicators of the efficiency of the TPS. In Table 6, when users are clustered and offered a tailored price by the TPS, the profit is 11,209.96 ¥ (14.48%) higher than the profit in the system without the TPS. In the meantime, the cost of all users is lowered with the application of the TPS. Eighteen extra parking spaces, eight more CSCs, and thirty-three more SAVs are needed when users are clustered. This phenomenon reveals that the increase in profit is highly connected with the expansion of the SAVs under this condition. The depreciation cost of sharing cars and the maintenance cost of the parking places increase too, while not much. It indicates that the carsharing operator can significantly increase the profit without investing too much.
As for the users, the cost they need to pay is indeed getting more, especially for the users who choose SAVs, as these users do not need to walk to pick up cars or walk to destinations after the drop-off under the service mode of SAVs. In terms of the rental fee, it is higher for trips with SAVs than that of CSCs.
After the clustering, what is the reaction of each cluster of users? As shown in Table 7, it is evident that users of cluster 1 (loyal users) contribute a large proportion no matter in the CSC system or the SAV system. Users of cluster 2 (losing users) and 3 (potential users) are comparable. Compared with the losing users, the potential users can always bring more revenue to the operator while with the least other costs. All in all, loyal users are the key for the carsharing operator. They should retain this cluster of users as much as possible and try every effort to convert the other two kinds of users into loyal users.
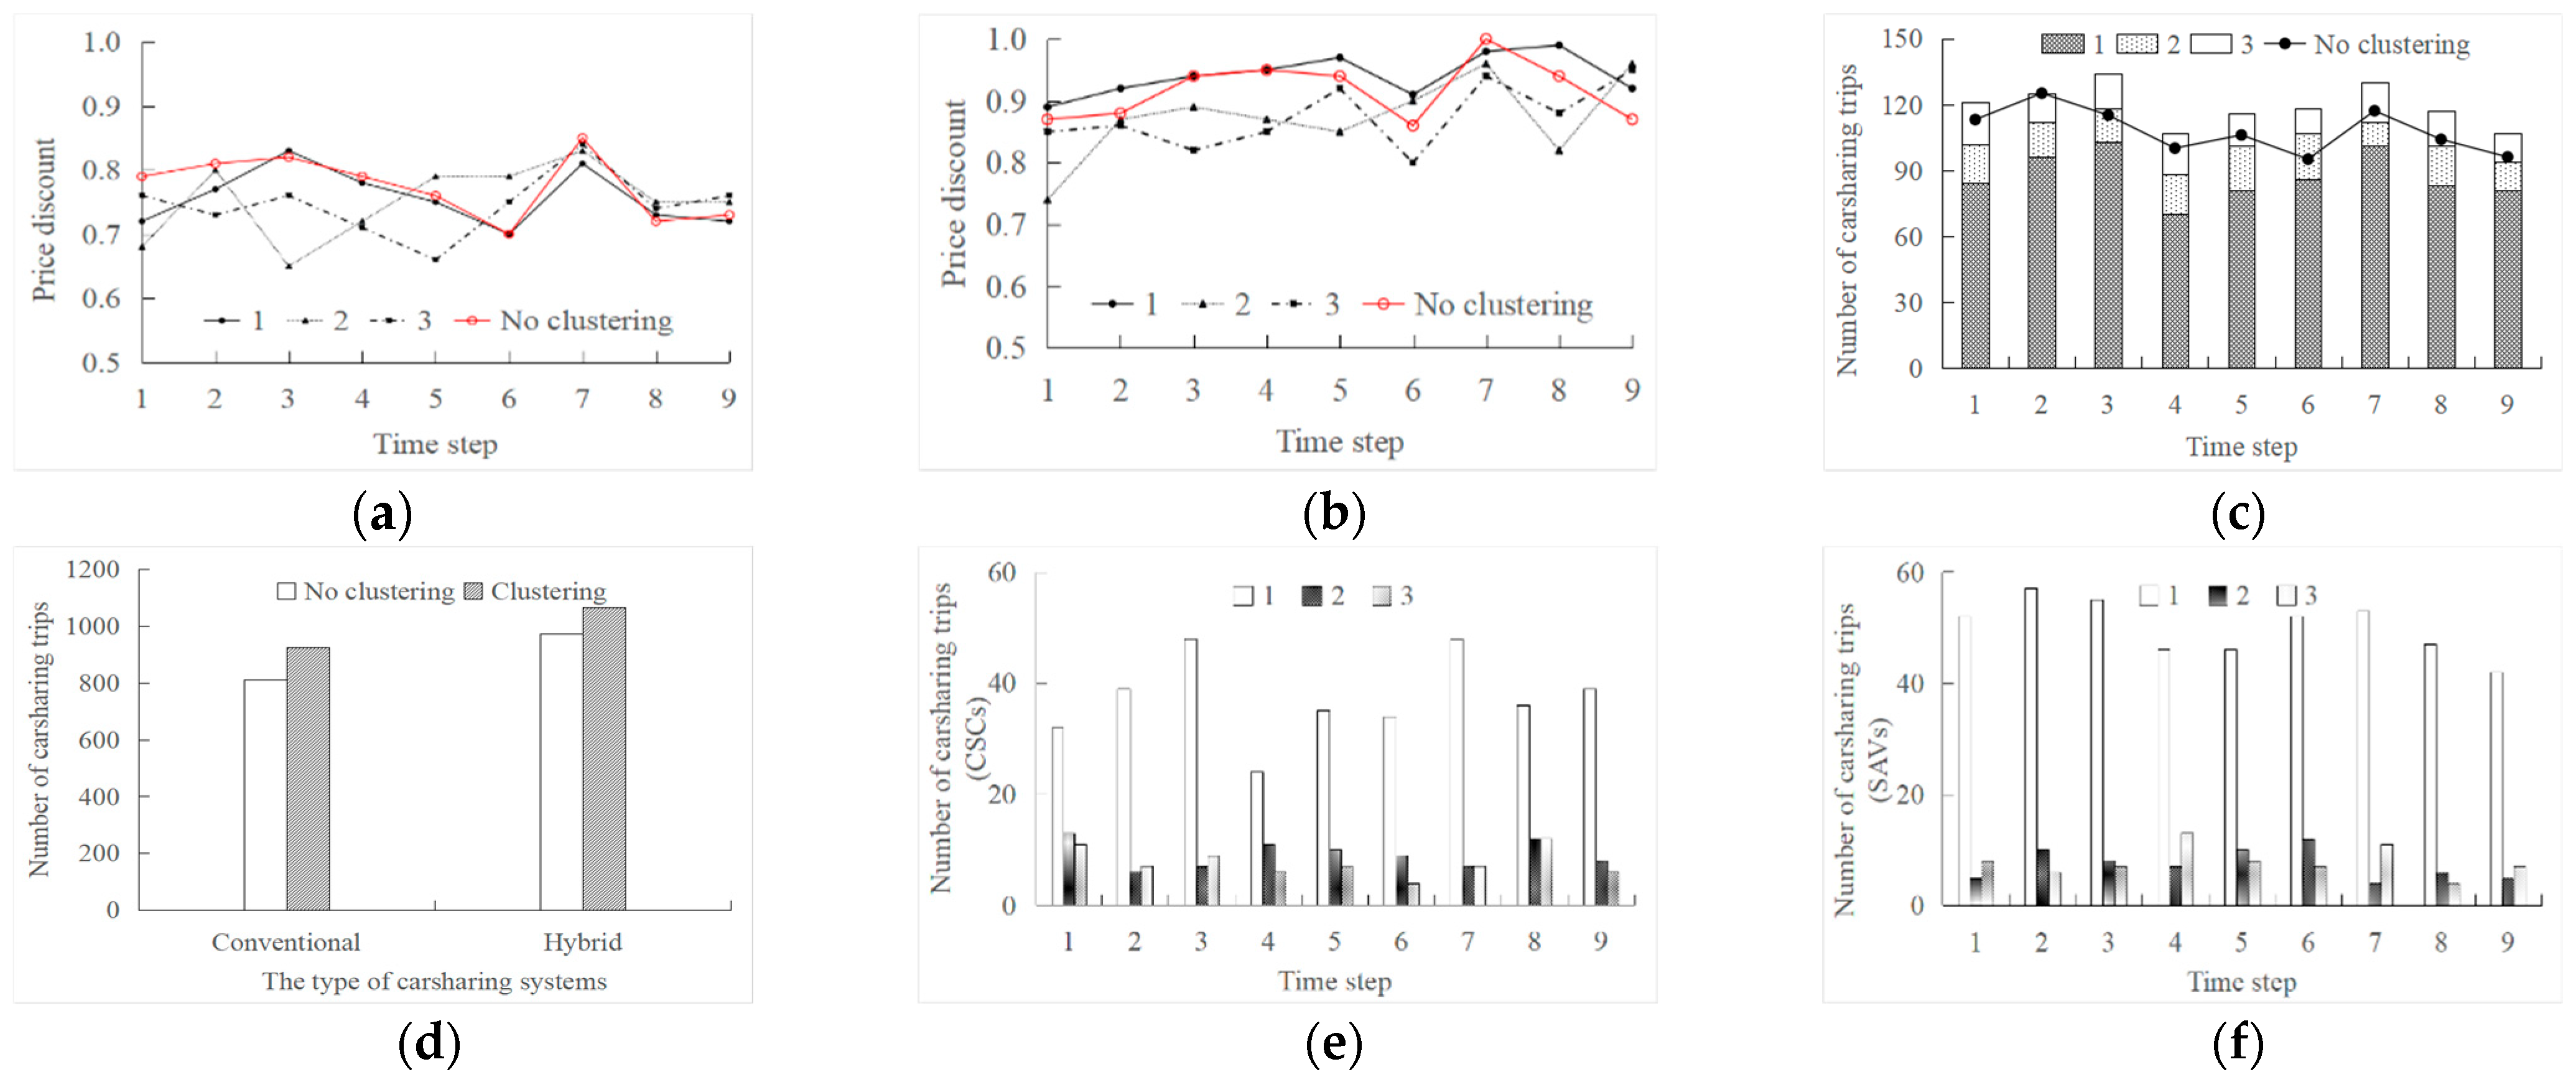
The variations of the price discount () during the studied period (6:00 am to 24:00 am) are shown in Figure 4a,b. When the TPS is not applied, the price discount directly equals the price divided by the maximal price (). Since there is only one type of user when TPS is not applied, . When the TPS is used, the price discount is calculated after weighted (). For example, the price discounts are 0.2, 0.8, and 1.0 for user cluster 1, 2, 3, respectively. Moreover, the number of trips that each user cluster accounts for is 0.6, 0.2, and 0.2, respectively. Then, the weighted price discount is 0.48 (0.6 × 0.2 + 0.2 × 0.8 + 0.2 × 1.0).
The red line means the price discount given to all users in the hybrid carsharing system without the TPS. For CSCs (Figure 4a) and SAVs (Figure 4b), the rental fee that the operator charges from users of cluster 1 (loyal users) is very close with the TPS or without the TPS. While for users of cluster 2 and cluster 3, the prices are much lower in the system with the TPS. It shows that the operator charges less for the users except for loyal users.
As shown in Figure 4c, the number of carsharing trips in each time step is higher when the TPS is applied. The total number of carsharing trips during the studied period is also much higher (Figure 4d). It testifies the efficiency of the TPS. Furthermore, the increase in the number of carsharing trips is particularly high at time step 3 (10:00–12:00) and time step 7 (18:00–20:00). The loyal users contribute the most to the total number of trips, and the corresponding prices are also the highest. This phenomenon reveals that the demands during 10:00–12:00 and 18:00–20:00 are great, and the loyal users would choose sharing cars even if the price is relatively higher during peak hours than at other times. Figure 4e,f show the number of carsharing trips for both the CSCs and SAVs of each user cluster. Regardless of the service mode, the loyal users always count the most in each time step. As for the other two user clusters, there are no big differences in the number of carsharing trips, while the potential users can still make more profits for the operator (Table 6).
4.2.3. Performance of the Hybrid Carsharing System
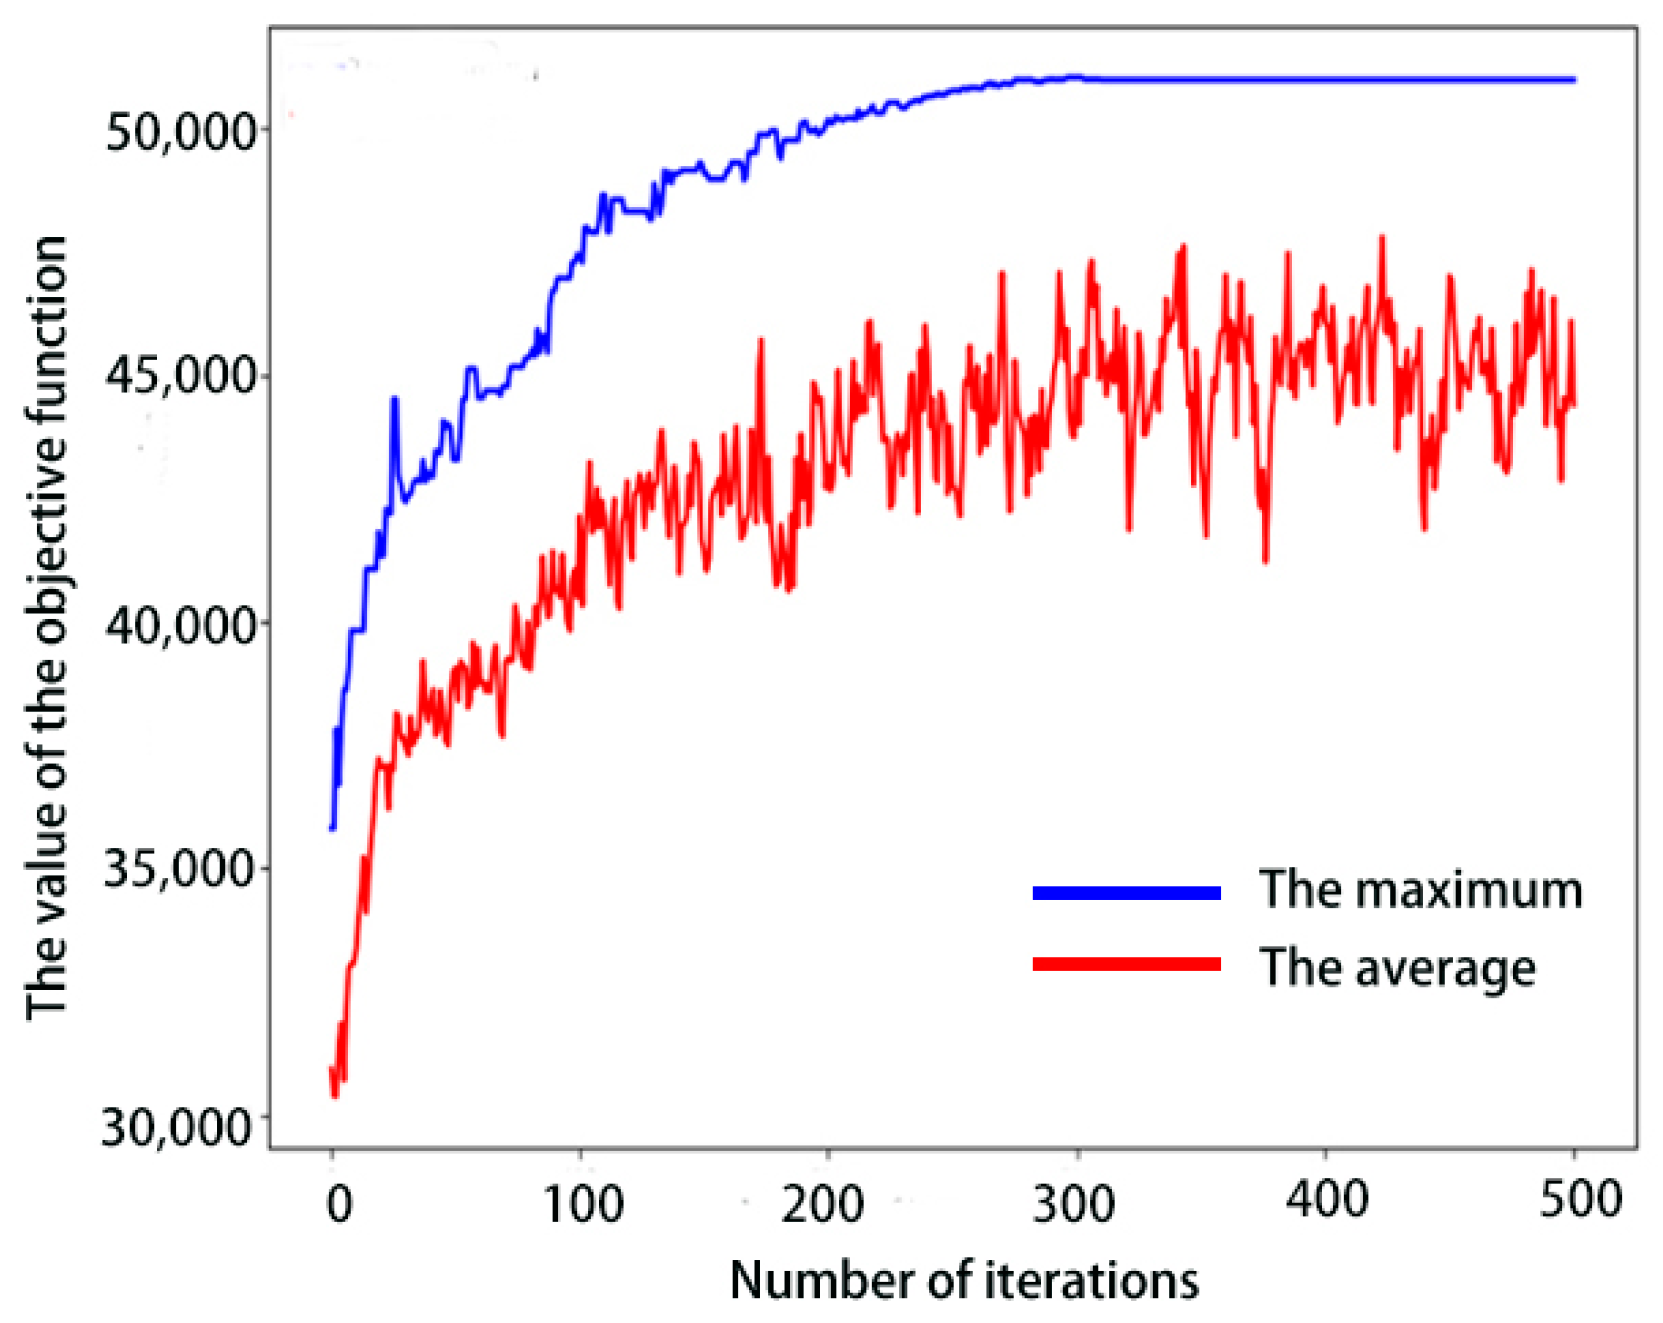
When SAVs are added to the carsharing systems only with the CSCs (named the conventional carsharing systems), what impact could it make? The performances of the conventional carsharing systems and the hybrid carsharing systems with the user clustering strategy are compared mutually. The model only with the conventional carsharing system is nearly the same as the bi-objective model in this study; the only difference is that there is only one service mode in the service mode set . The solution algorithm is still the GA. The converging process is shown in Figure 5.
The obvious advantage of the hybrid carsharing systems is that the profits could be improved. The carsharing operators can earn ¥85,378.79 in hybrid carsharing systems, while it is only ¥50,978.43 in the conventional carsharing system, mainly because more trips are satisfied in the hybrid carsharing system. As shown in Figure 6a, when the SAVs are added to the carsharing system, some CSC users are attracted by the SAVs and then turn to SAV users. Furthermore, many potential carsharing users also join in with the adoption of SAVs. Therefore, the SAVs can help the carsharing operator attract more carsharing users and is worthy of bringing in.
The reason why more users are attracted to the hybrid carsharing system is complicated. We should analyze this from the perspective of CSCs and SAVs. In the hybrid carsharing system, the price discounts for CSCs are much lower than that of the conventional carsharing system. As users have more choices in the hybrid carsharing system, a lower price should be offered to retain the most CSC users. As for the price discounts of SAVs users, they are much higher than that of CSCs in the same system. In the meantime, these discounts are comparable with the price discounts of SAVs in the conventional carsharing system. It tells us that SAVs have a higher pricing power than CSCs, but it still needs to obey the basic market rule and cannot exceed the market price too much. When we put the price discounts of the conventional carsharing system and the weighted price discounts of the hybrid carsharing system together, the average price in the mixed hybrid carsharing system is lower than the price in the conventional carsharing system. When the carsharing operator provides varieties of services, users can benefit from it and finish their trips at a lower price.
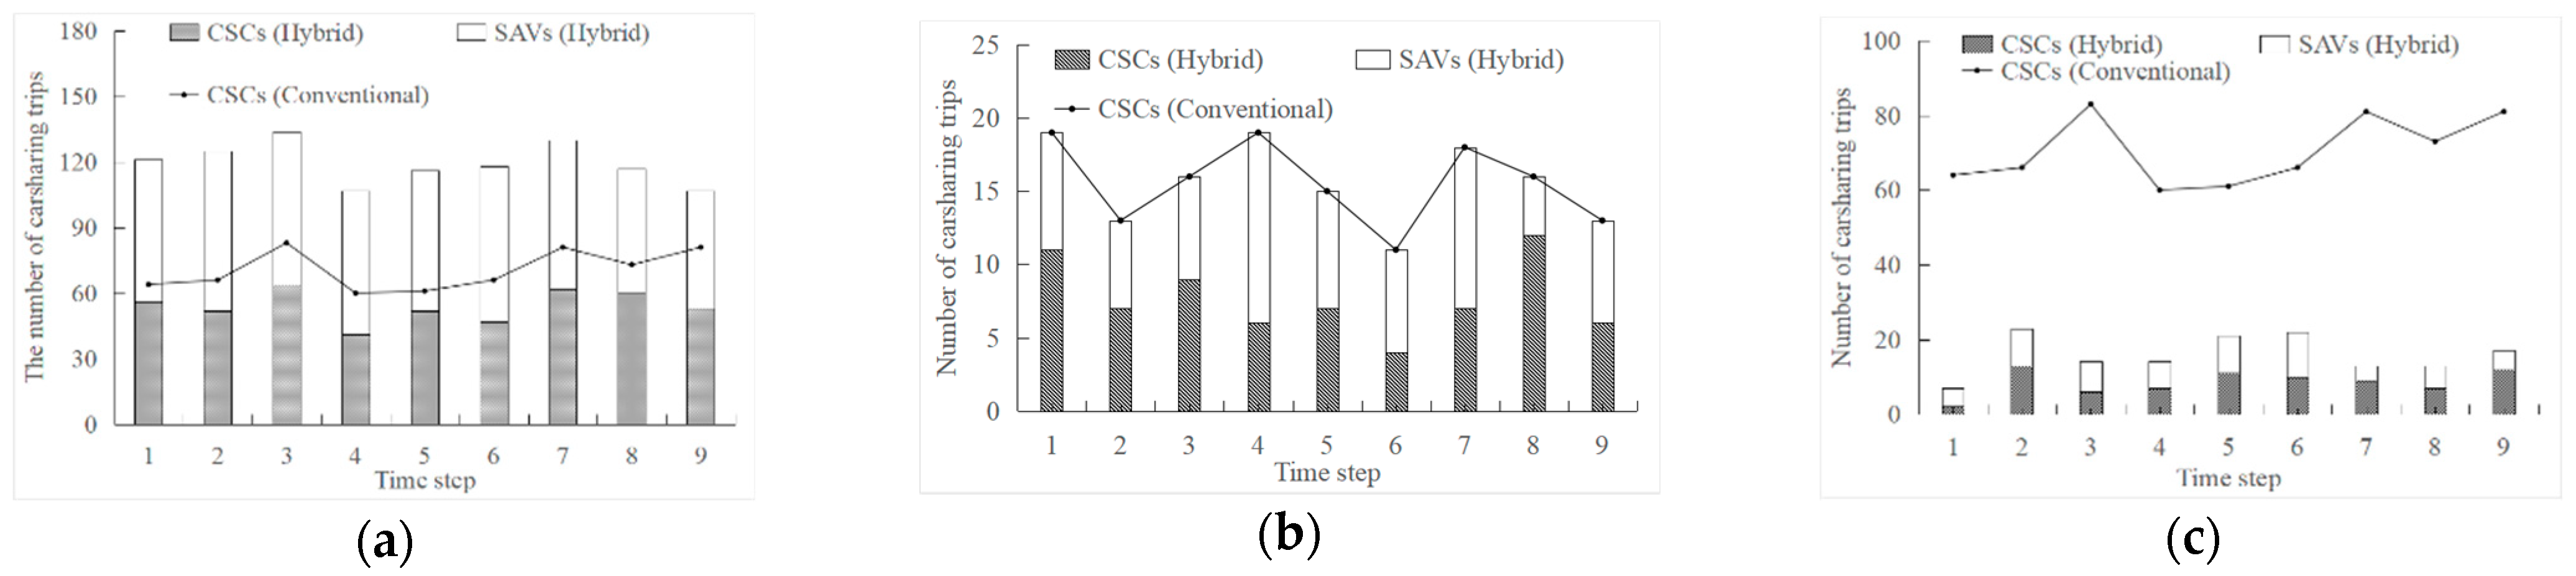
Further, details about the carsharing trips and price discounts for all clusters are shown in Figure 7 and Figure 8. In Figure 7, the numbers of carsharing trips of each cluster in the conventional carsharing system and the hybrid carsharing system are all given. The losing users (cluster 2) are affected deeply by the adoption of SAVs, and a large part of them may turn into potential users (cluster 3). Meanwhile, most potential users are inclined to try SAVs in the hybrid carsharing system. The loyal users (cluster 1) not only have the courage to try SAVs, but the total number of carsharing trips is also increased. It might be because part of potential users turn into loyal users when the SAVs are added to the system. In sum, the adoption of SAVs in the carsharing system is good for loyal users and potential users. It can also speed up the process of converting the losing users into the potential users and the potential users into the loyal users.
The price discounts offered to all clusters are shown in Figure 8. At each time step, the price discount the operator provides to the SAV users is much lower than that of the CSC users in both carsharing systems. As the service mode of SAVs determines the total rental fee of SAVs, it is much higher than the rental fee of CSCs. If the operator still charges a lot, there would be fewer SAV users, and then the adoption of SAVs is meaningless. Price discounts given to the loyal users are higher among all the clusters in both systems (Figure 8a), especially for the price discount of the SAV users in the hybrid carsharing system is the highest. It means that the loyal users make the greatest contributions to the operator. The operator should pay more attention to them.
In a word, when the carsharing operator adopts SAVs to the conventional carsharing system, it is great for most users in the system, especially for the loyal users, and there would be more of them. The losing users are also greatly affected, and they could turn into potential users.
5. Conclusions
In hybrid one-way carsharing systems, a tailored pricing strategy (TPS) for different types of users is proposed to maximize the operator’s profit and minimize all users’ costs simultaneously. Autonomous vehicles and conventional sharing cars are incorporated into hybrid carsharing systems. Users can be clustered into three types based on the operational data by the K-means algorithm. They are the loyal users, losing users, and potential users, respectively. A bi-objective nonlinear programming model is established and then transformed to a single-objective model by weighting each objective function. A genetic algorithm is applied to solve it. In order to testify to the efficiency of the TPS, case studies in Lanzhou, China, are performed. The main contributions of this study can be listed below:
- (1)
- Considering that not all demands can be satisfied by the hybrid carsharing system. A penalty coefficient is defined to reflect the potential effect of unsatisfied demands for each cluster on the profit. It is incorporated into the objective function. It combines travel potential, consumption potential, travel efficiency, and average revenue. The penalty coefficient for loyal users is the highest. It shows the importance of loyal users on the profit.
- (2)
- Differential prices are offered to different users by considering the unique characteristic of each user cluster. The price elasticity combines the price variations and demand variations, and it is used to distinguish different clusters. The carsharing operator can get 14.48% more profit at less extra costs. The loyal users contribute the most to the carsharing operator’s profit and the number of trips, while they pay the highest prices, especially during peak hours. The numbers of carsharing trips for the other two clusters are nearly the same. Compared with the losing users, the potential users can make more profit. The carsharing operator should pay the most attention to loyal users, then the potential users.
- (3)
- Compared with the carsharing system only with conventional cars, the performance of the hybrid carsharing system is explored. It reveals that the adoption of the SAVs benefits the operator and the users, especially the loyal users. Therefore, the conventional carsharing operator should embrace the new technology (referring to AVs in this study).
These results can be the potential directions for the carsharing operator. For example, attaching great importance to the operational data and then analyzing the characteristics of users. Based on the details of the users in the system, the operator can provide many personalized services at different prices; not only more users can be attracted, and more loyal users there would be, but also higher profit and service levels.
There are still many details worthy of discussion. Due to the limitations of the operational data, indicators like “walking cost” and “waiting cost per minute” for all user clusters are assumed to be the same. For simplicity, there are some restrictions on sharing autonomous vehicles like “one sharing autonomous vehicle can only serve one user per trip” and “it needs to return to carsharing stations when a trip is finished”. To further make the model more realistic, the characteristics of users should be explored deeply. Moreover, one sharing autonomous vehicle can pick up more users per trip, and a corresponding price mechanism should be given in the future. Further, there are many competitors for sharing cars, i.e., ride-sharing, taxis, etc. Various traffic modes should be considered to compete with sharing cars.
Author Contributions
Conceptualization, R.L.; data curation, X.Z. and Y.W.; formal analysis, Y.W.; funding acquisition, X.Z.; methodology, Y.W.; project administration, X.Z.; resources, X.Z.; validation, Y.W.; visualization, R.L.; writing—original draft, R.L.; writing—review & editing, R.L. and X.Z. All authors have read and agreed to the published version of the manuscript.
Funding
This research was funded by (the National Natural Science Foundation of China) grant number (71771012), (71961137008), and (72171018).
Institutional Review Board Statement
Not applicable.
Informed Consent Statement
Not applicable.
Data Availability Statement
Data is contained within the article.
Conflicts of Interest
The authors declare no conflict of interest.
References
- Jorge, D.; Correia, G. Carsharing systems demand estimation and defined operations: A literature review. Eur. J. Transp. Infrast. 2013, 13, 201–220. [Google Scholar]
- Sai, Q.; Bi, J.; Chai, J. Optimal model for carsharing station location based on multi-factor constraints. Algorithms 2020, 13, 43. [Google Scholar] [CrossRef] [Green Version]
- Hu, P.S.; Reuscher, T. Summary of Travel Trends: 2001 National Household Travel Survey. 2004. Available online: https://rosap.ntl.bts.gov/view/dot/58882 (accessed on 1 May 2005).
- Li, M.; Zeng, Z.; Wang, Y. An innovative car sharing technological paradigm towards sustainable mobility. J. Clean. Prod. 2020, 288, 125626. [Google Scholar] [CrossRef]
- Shaheen, S.A.; Chan, N.D.; Micheaux, H. One-way carsharing’s evolution and operator perspectives from the Americas. Transportation 2015, 42, 519–536. [Google Scholar] [CrossRef]
- Gibbs, S. Google sibling waymo launches fully autonomous ride-hailing service. The Guardian, 7 November 2017. [Google Scholar]
- Launching Our Self-Driving Robotaxi in Germany. 2021. Available online: https://www.mobileye.com/blog/self-driving-robotaxi-sixt-germany-iaa/ (accessed on 5 March 2022).
- Darwesh, A.; Woods, G.; Saripalli, S. Systems integration, simulation, and control for autonomous trucking. In Proceedings of the 2020 IEEE Intelligent Vehicles Symposium (IV), Las Vegas, NV, USA, 19 October–13 November 2020; pp. 1486–1491. [Google Scholar]
- Jian, S.; Rey, D.; Dixit, V. An Integrated supply-demand approach to solving optimal relocations in station-based carsharing systems. Netw. Spat. Econ. 2018, 19, 611–632. [Google Scholar] [CrossRef]
- Wood, N.; Jones-Meyer, S.N. Integrating automated toll discounts into a real-time ridesharing program. Transp. Res. Rec. 2016, 2597, 20–27. [Google Scholar] [CrossRef]
- Jorge, D.; Molnar, G.; Correia, G.H.D.A. Trip pricing of one-way station-based carsharing networks with zone and time of day price variations. Transp. Res. Part B Methodol. 2015, 81, 461–482. [Google Scholar] [CrossRef]
- Wu, C.; Le Vine, S.; Sivakumar, A.; Polak, J. Dynamic pricing of free-floating carsharing networks with sensitivity to travellers’ attitudes towards risk. Transportation 2021, 49, 679–702. [Google Scholar] [CrossRef]
- Habib, K.M.N.; Morency, C.; Islam, M.T.; Grasset, V. Modelling users’ behaviour of a carsharing program: Application of a joint hazard and zero inflated dynamic ordered probability model. Transp. Res. Part A Policy Pract. 2012, 46, 241–254. [Google Scholar] [CrossRef]
- De Luca, S.; Di Pace, R. Modelling users’ behaviour in inter-urban carsharing program: A stated preference approach. Transp. Res. Part A Policy Pract. 2015, 71, 59–76. [Google Scholar] [CrossRef]
- Habib, K.N.; Morency, C.; Zaman, M.H. Modelling activity persistency and usage of car sharing in Montreal. In Proceedings of the 88th Annual Meeting of Transportation Research Board, Washington, DC, USA, 1–15 January 2009. [Google Scholar]
- Xu, M.; Meng, Q.; Liu, Z. Electric vehicle fleet size and trip pricing for one-way carsharing services considering vehicle relocation and personnel assignment. Transp. Res. Part B Methodol. 2018, 111, 60–82. [Google Scholar] [CrossRef]
- Khalid, M.; Yue, C.; Aslam, N.; Suthaputchakun, C.; Khalid, W. Optimized pricing & scheduling model for long range autonomous valet parking. In Proceedings of the 2018 International Conference on Frontiers of Information Technology (FIT), Islamabad, Pakistan, 17–19 December 2018. [Google Scholar]
- Huang, K.; Correia, G.H.D.A.; An, K. Solving the station-based one-way carsharing network planning problem with relocations and non-linear demand. Transp. Res. Part C Emerg. Technol. 2018, 90, 1–17. [Google Scholar] [CrossRef]
- Duan, L.; Wei, Y.; Zhang, J.; Xia, Y. Centralized and decentralized autonomous dispatching strategy for dynamic autonomous taxi operation in hybrid request mode. Transp. Res. Part C Emerg. Technol. 2020, 111, 397–420. [Google Scholar] [CrossRef]
- Lu, R.; Correia, G.H.D.A.; Zhao, X.; Liang, X.; Lv, Y. Performance of one-way carsharing systems under combined strategy of pricing and relocations. Transp. B Transp. Dyn. 2020, 9, 134–152. [Google Scholar] [CrossRef]
- Schulte, F.; Vo, S. Decision support for environmental-friendly vehicle relocations in free-floating car sharing systems: The case of Car2go. Procedia CIRP 2015, 30, 275–280. [Google Scholar] [CrossRef]
- Angelopoulos, A.; Gavalas, D.; Konstantopoulos, C.; Kypriadis, D.; Pantziou, G. Incentivized vehicle relocation in vehicle sharing systems. Transp. Res. Part C Emerg. Technol. 2018, 97, 175–193. [Google Scholar] [CrossRef]
- Vasconcelos, A.; Martinez, L.M.; Correia, G.; Guimarães, D.C.; Farias, T. Environmental and financial impacts of adopting alternative vehicle technologies and relocation strategies in station-based one-way carsharing: An application in the city of Lisbon, Portugal. Transp. Res. Part D Transp. Environ. 2017, 57, 350–362. [Google Scholar] [CrossRef]
- Fagnant, D.J.; Kockelman, K.M. Dynamic ride-sharing and fleet sizing for a system of shared autonomous vehicles in Austin, Texas. Transportation 2018, 45, 143–158. [Google Scholar] [CrossRef]
- Hyland, M.; Mahmassani, H.S. Dynamic autonomous vehicle fleet operations: Optimization-based strategies to assign AVs to immediate traveler demand requests. Transp. Res. Part C Emerg. Technol. 2018, 92, 278–297. [Google Scholar] [CrossRef]
- Wang, S.; Correia, G.H.D.A.; Lin, H.X. Exploring the performance of different on-demand transit services provided by a fleet of shared automated vehicles: An agent-based model. J. Adv. Transp. 2019, 2019, 7878042. [Google Scholar] [CrossRef] [Green Version]
- Hanna, J.P.; Albert, M.; Chen, D.; Stone, P. Minimum cost matching for autonomous carsharing. IFAC-PapersOnLine 2016, 49, 254–259. [Google Scholar] [CrossRef]
- Li, M.; Zheng, N.; Wu, X.; Li, W.; Wu, J. An Efficient solving method to vehicle and passenger matching problem for sharing autonomous vehicle system. J. Adv. Transp. 2020, 2020, 3271608. [Google Scholar] [CrossRef]
- Karamanis, R.; Angeloudis, P.; Sivakumar, A.; Stettler, M. Dynamic pricing in one-sided autonomous ride-sourcing markets. In Proceedings of the International Conference on Intelligent Transportation Systems, Maui, HI, USA, 4–7 November 2018. [Google Scholar]
- Mehr, N.; Horowitz, R. Pricing traffic networks with mixed vehicle autonomy. In Proceedings of the 2019 American Control Conference (ACC), Philadelphia, PA, USA, 10–12 July 2019. [Google Scholar] [CrossRef] [Green Version]
- Wang, Q.; Miao, F.; Wu, J.; Niu, Y.; Wang, C.; Lownes, N.E. Dynamic Pricing for autonomous vehicle e-hailing services reliability and performance improvement. In Proceedings of the 2019 IEEE 15th International Conference on Automation Science and Engineering (CASE), Vancouver, BC, Canada, 22–26 August 2019; pp. 948–953. [Google Scholar] [CrossRef]
- Schaller, B. Can sharing a ride make for less traffic? Evidence from Uber and Lyft and implications for cities. Transp. Policy 2021, 102, 1–10. [Google Scholar] [CrossRef]
- Shokoohyar, S. Ride-sharing platforms from drivers’ perspective: Evidence from Uber and Lyft drivers. Int. J. Data Netw. Sci. 2018, 2, 89–98. [Google Scholar] [CrossRef]
- Shokoohyar, S.; Sobhani, A.; Sobhani, A. Impacts of trip characteristics and weather condition on ride-sourcing network: Evidence from Uber and Lyft. Res. Transp. Econ. 2020, 80, 100820. [Google Scholar] [CrossRef]
- Morency, C.; Trepanier, M.; Agard, B.; Martin, B.; Quashie, J. Car sharing system: What transaction datasets reveal on users’ behaviors. In Proceedings of the 2007 IEEE Intelligent Transportation Systems Conference, Bellevue, WA, USA, 30 September–3 October 2007; pp. 284–289. [Google Scholar] [CrossRef]
- Zhou, C.; Zhao, X.; Liu, E.; Zhao, J. Differential pricing strategies based on user clustering in a one-way carsharing system. Int. J. Sustain. Transp. 2022. [Google Scholar]
- Gambella, C.; Malaguti, E.; Masini, F.; Vigo, D. Optimizing relocation operations in electric car-sharing. Omega 2018, 81, 234–245. [Google Scholar] [CrossRef]
- Liang, X.; Correia, G.; An, K.; van Arem, B. Automated taxis’ dial-a-ride problem with ride-sharing considering congestion-based dynamic travel times. Transp. Res. Part C Emerg. Technol. 2020, 112, 260–281. [Google Scholar] [CrossRef]
Figure 1.
Service modes in hybrid carsharing systems: (a) Service mode of CSCs, and (b) Service mode of SAVs.
Figure 1.
Service modes in hybrid carsharing systems: (a) Service mode of CSCs, and (b) Service mode of SAVs.

Figure 2.
Labeled Map of Carsharing Stations in Lanzhou.

Figure 3.
Iteration procedure of the GA with or without the TPS. (a) with the TPS, (b) without the TPS ().
Figure 3.
Iteration procedure of the GA with or without the TPS. (a) with the TPS, (b) without the TPS ().

Figure 4.
Performances of each user cluster at each time step with or without the TPS. (a) Price discount for the CSC users, (b) Price discount for the SAV users, (c) Number of carsharing trips, (d) Total number of carsharing trips, (e) Number of CSC trips, (f) Number of SAV trips.
Figure 4.
Performances of each user cluster at each time step with or without the TPS. (a) Price discount for the CSC users, (b) Price discount for the SAV users, (c) Number of carsharing trips, (d) Total number of carsharing trips, (e) Number of CSC trips, (f) Number of SAV trips.

Figure 5.
The iteration procedure of the GA in carsharing systems with CSCs.

Figure 6.
Performance of the carsharing system: (a) Number of carsharing trips, (b) Price discount.

Figure 7.
The number of carsharing trips for each cluster in both carsharing systems: (a) Cluster 1, (b) Cluster 2, (c) Cluster 3.
Figure 7.
The number of carsharing trips for each cluster in both carsharing systems: (a) Cluster 1, (b) Cluster 2, (c) Cluster 3.

Figure 8.
Price discount for each cluster in both carsharing systems. (a) Cluster 1, (b) Cluster 2, (c) Cluster 3.
Figure 8.
Price discount for each cluster in both carsharing systems. (a) Cluster 1, (b) Cluster 2, (c) Cluster 3.


Table 1.
Details about the indicators for different user clusters.
| Indicators | Cluster 1 | Cluster 2 | Cluster 3 |
|---|---|---|---|
| Proportion (%) | 36.63 | 34.55 | 28.82 |
| Using frequency monthly | 6.41 | 1.01 | 3.38 |
| Time of the first use | 181.58 | 169.95 | 51.81 |
| Time of the last use | 19.95 | 147.93 | 31.71 |
| Using duration | 161.63 | 22.02 | 20.1 |
| Consumption potential (¥/day) | 921.87 | 206.5 | 223.16 |
| Travel potential | 42.53 | 6.5 | 7.46 |
| Travel efficiency (min/km) | 4.90 | 5.29 | 5.92 |
| Average revenue (¥/trip) | 21.67 | 31.75 | 29.89 |
| Penalty coefficient | 11.113 | 0.554 | 0.651 |
Table 2.
Price elasticity for each user cluster.
| Clustering | No Clustering | |||
|---|---|---|---|---|
| Cluster 1 | Cluster 2 | Cluster 3 | ||
| 1.3 | 1.4 | 1.5 | 1.5 | |
Table 3.
Details about the time step mentioned in Equation (10).
| CSCs | SAVs | |
|---|---|---|
Table 4.
Pseudocode of the GA.
| Step 1: Initialization |
| , , . |
| Step 2: Get the value of the objective function , . |
| Step 3: Update the maximum of the objective function . |
| Step 4: Stop criteria If m = M, stop. Otherwise, proceed to Step 5. |
| Step5: Crossover and mutation |
| Step 5.1: Crossover , then crossover is performed. The procedure of the crossover is as below: , then the new values are taken as the new generations for the next iteration. |
| Step 5.2: Mutation . |
| Step 6: Update the number of iterations Set m = m + 1, and go back to Step 2. |
Table 5.
Parameters for the case studies.
| Parameters | (¥/min) | ||
|---|---|---|---|
| CSCs | 2 | 7 | 0.007 |
| SAVs | 5 | 7 | 0.050 |
Table 6.
Performance of the hybrid carsharing system with or without the TPS.
| Indicators | TPS (¥) | No TPS (¥) | ||
|---|---|---|---|---|
| Carsharing operator | Revenue | 88,602.79 | 77,392.83 | |
| Profit | 85,378.79 | 74,428.83 | ||
| Depreciation cost of sharing cars | 768 | 588 | ||
| Maintenance cost of the parking places | 2456 | 2376 | ||
| Number of parking spaces for SAVs | 410 | 392 | ||
| Fleet size | CSC | 132 | 124 | |
| SAV | 154 | 121 | ||
| Users | Rental fee | CSC | 39,873.56 | 36,854.75 |
| SAV | 51,695.78 | 43,952.23 | ||
| Walking cost of CSC users | 3100.23 | 3049.56 | ||
| Waiting cost of SAV users | 2056.63 | 2049.56 | ||
| All Users’ costs | 96,726.2 | 85,906.1 | ||
Table 7.
Performance of each user cluster (¥).
| Cluster | Revenue | Walking Cost (CSCs) | Waiting Cost (SAVs) | |
|---|---|---|---|---|
| CSCs | SAVs | |||
| 1 | 22,634.25 | 28,693.23 | 1213.25 | 809.25 |
| 2 | 7681.31 | 10,466.79 | 948.67 | 658.67 |
| 3 | 8237.67 | 10,889.54 | 881.64 | 581.64 |
Publisher’s Note: MDPI stays neutral with regard to jurisdictional claims in published maps and institutional affiliations. |
© 2022 by the authors. Licensee MDPI, Basel, Switzerland. This article is an open access article distributed under the terms and conditions of the Creative Commons Attribution (CC BY) license (https://creativecommons.org/licenses/by/4.0/).
Share and Cite
MDPI and ACS Style
Lu, R.; Zhao, X.; Wang, Y. A Tailored Pricing Strategy for Different Types of Users in Hybrid Carsharing Systems. Algorithms 2022, 15, 172. https://0-doi-org.brum.beds.ac.uk/10.3390/a15050172
AMA Style
Lu R, Zhao X, Wang Y. A Tailored Pricing Strategy for Different Types of Users in Hybrid Carsharing Systems. Algorithms. 2022; 15(5):172. https://0-doi-org.brum.beds.ac.uk/10.3390/a15050172
Chicago/Turabian StyleLu, Rongqin, Xiaomei Zhao, and Yingqi Wang. 2022. "A Tailored Pricing Strategy for Different Types of Users in Hybrid Carsharing Systems" Algorithms 15, no. 5: 172. https://0-doi-org.brum.beds.ac.uk/10.3390/a15050172
Note that from the first issue of 2016, this journal uses article numbers instead of page numbers. See further details here.