
Integrating Process Mining with Discrete-Event Simulation for Dynamic Productivity Estimation in Heavy Civil Construction Operations

School of Civil and Construction Engineering, Oregon State University, Corvallis, OR 97331, USA
*
Author to whom correspondence should be addressed.
Algorithms 2022, 15(5), 173; https://0-doi-org.brum.beds.ac.uk/10.3390/a15050173
Submission received: 11 April 2022
/
Revised: 11 May 2022
/
Accepted: 17 May 2022
/
Published: 21 May 2022
(This article belongs to the Special Issue Process Mining and Its Applications)
Abstract
:Construction companies are increasingly utilizing sensing technologies to automatically record different steps of the construction process in detail for effective monitoring and control. This generates a significant amount of event data that can be used to learn the underlying behavior of agents in a construction site using process mining. While process mining can be used to discover the real process and identify and analyze deviations and bottlenecks in operations, it is a backward-looking approach. On the other hand, discrete event simulation (DES) provides a means to forecast future performance from historical data to enable proactive decision-making by operation managers relating to their projects. However, this method is largely unused by the industry due to the specialized knowledge required to create the DES models. This paper thus proposes a framework that extends the utility of collecting event data and their process models, by transforming them into DES models for forecasting future performance. This framework also addresses another challenge of using DES relating to its inability to update itself as the project progresses. This challenge is addressed by using the Bayesian updating technique to continuously update the input parameters of the simulation model for the most up-to-date estimation based on data collected from the field. The proposed framework was validated on a real-world case study of an earthmoving operation. The results show that the process mining techniques could accurately discover the process model from the event data collected from the field. Furthermore, it was noted that continuous updating of DES model input parameters can provide accurate and reliable productivity estimates based on the actual data generated from the field. The proposed framework can help stakeholders to discover the underlying sequence of their operations, and enable timely, data-driven decisions regarding operations control.
1. Introduction and Background
Construction processes are characterized by complex interactions among highly interdependent components that are subject to complex activity startup conditions. Discrete-event simulation (DES) tools can express the logic of these complex interactions effectively [1]. Even though DES has been widely researched and practiced over the past couple of decades, the development of simulation models is still expensive and time-consuming. DES has been used to analyze construction processes by simulating various “what if” scenarios and redesigning alternatives regarding key performance indicators. Despite this capability, the real-life applications of DES are limited due to two major reasons: (1) it is time-consuming to build a reliable simulation model of construction operations; and (2) it is difficult to represent the complexity of the real-world operations in a simulation model. Moreover, as simulation models are typically static, they do not adapt to the changing conditions of the real world when the initial assumptions and inputs of the model are no longer valid. Typically, the inputs for simulation modeling are statistical data from past projects and the subjective experiences of decision-makers. However, as the project progresses, an additional layer of uncertainties in the form of changing site conditions, equipment breakdowns, weather delays, etc. are introduced into the project which makes the initial models unreliable for continued decision-making. This lack of complete information at the start of operations can lead to non-optimal decision-making relating to an operational variable such as fleet-sizing and resource allocation, resulting in lost productivity and time and cost overruns. One method of overcoming this inherent limitation of a-priori estimation is to constantly update the simulation model in real-time using data that is available from real-world operations. Process mining is a recently developed method wherein operational processes are studied and analyzed based on the event data that is generated during their course [2]. Process mining techniques can be used to discover the underlying behavior of any operation that can be described by events. Moreover, replaying event data on the process model can enable compliance checking and performance analysis of the process. Even though process mining can be used to diagnose bottlenecks and/or non-compliance issues and predict the future direction taken by process instances, it cannot be used to answer “what-if” scenarios and explore comparative redesigns.
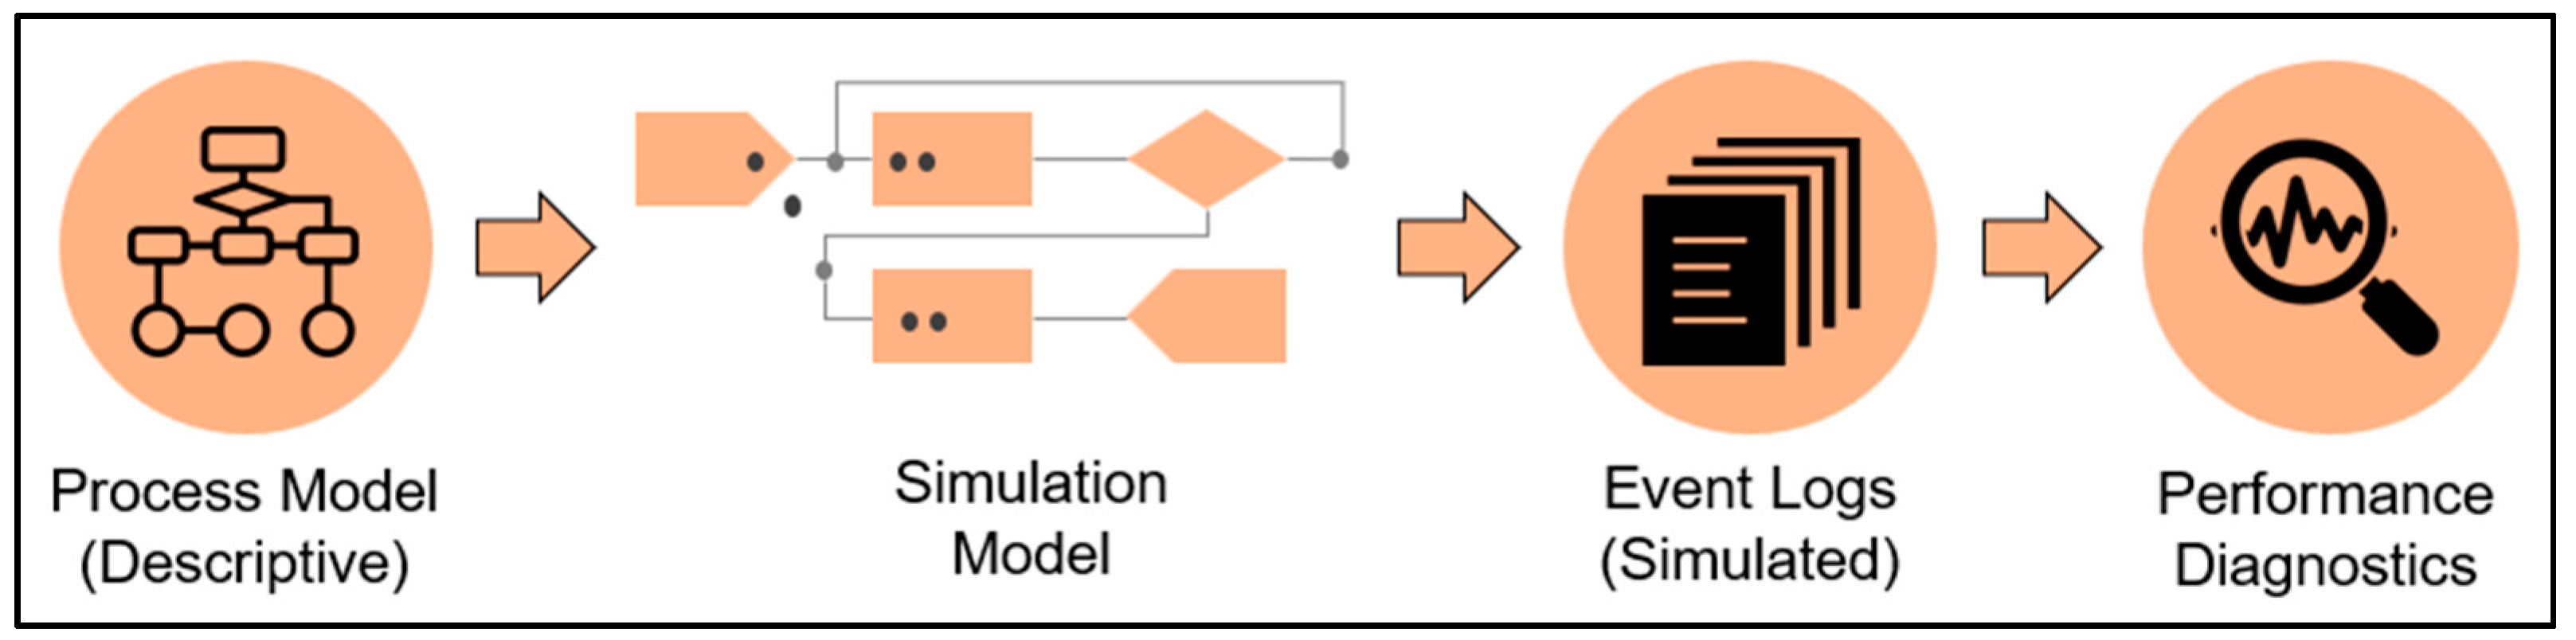
Given the capabilities of these two separate technologies of DES and process mining, their integration can create a whole that overcomes their limitations. Figure 1 demonstrates the classical use of simulation modeling and analysis wherein a simulation model is created from a textual description of the process. The model can be further used to generate event logs recording the simulated behavior of the process.
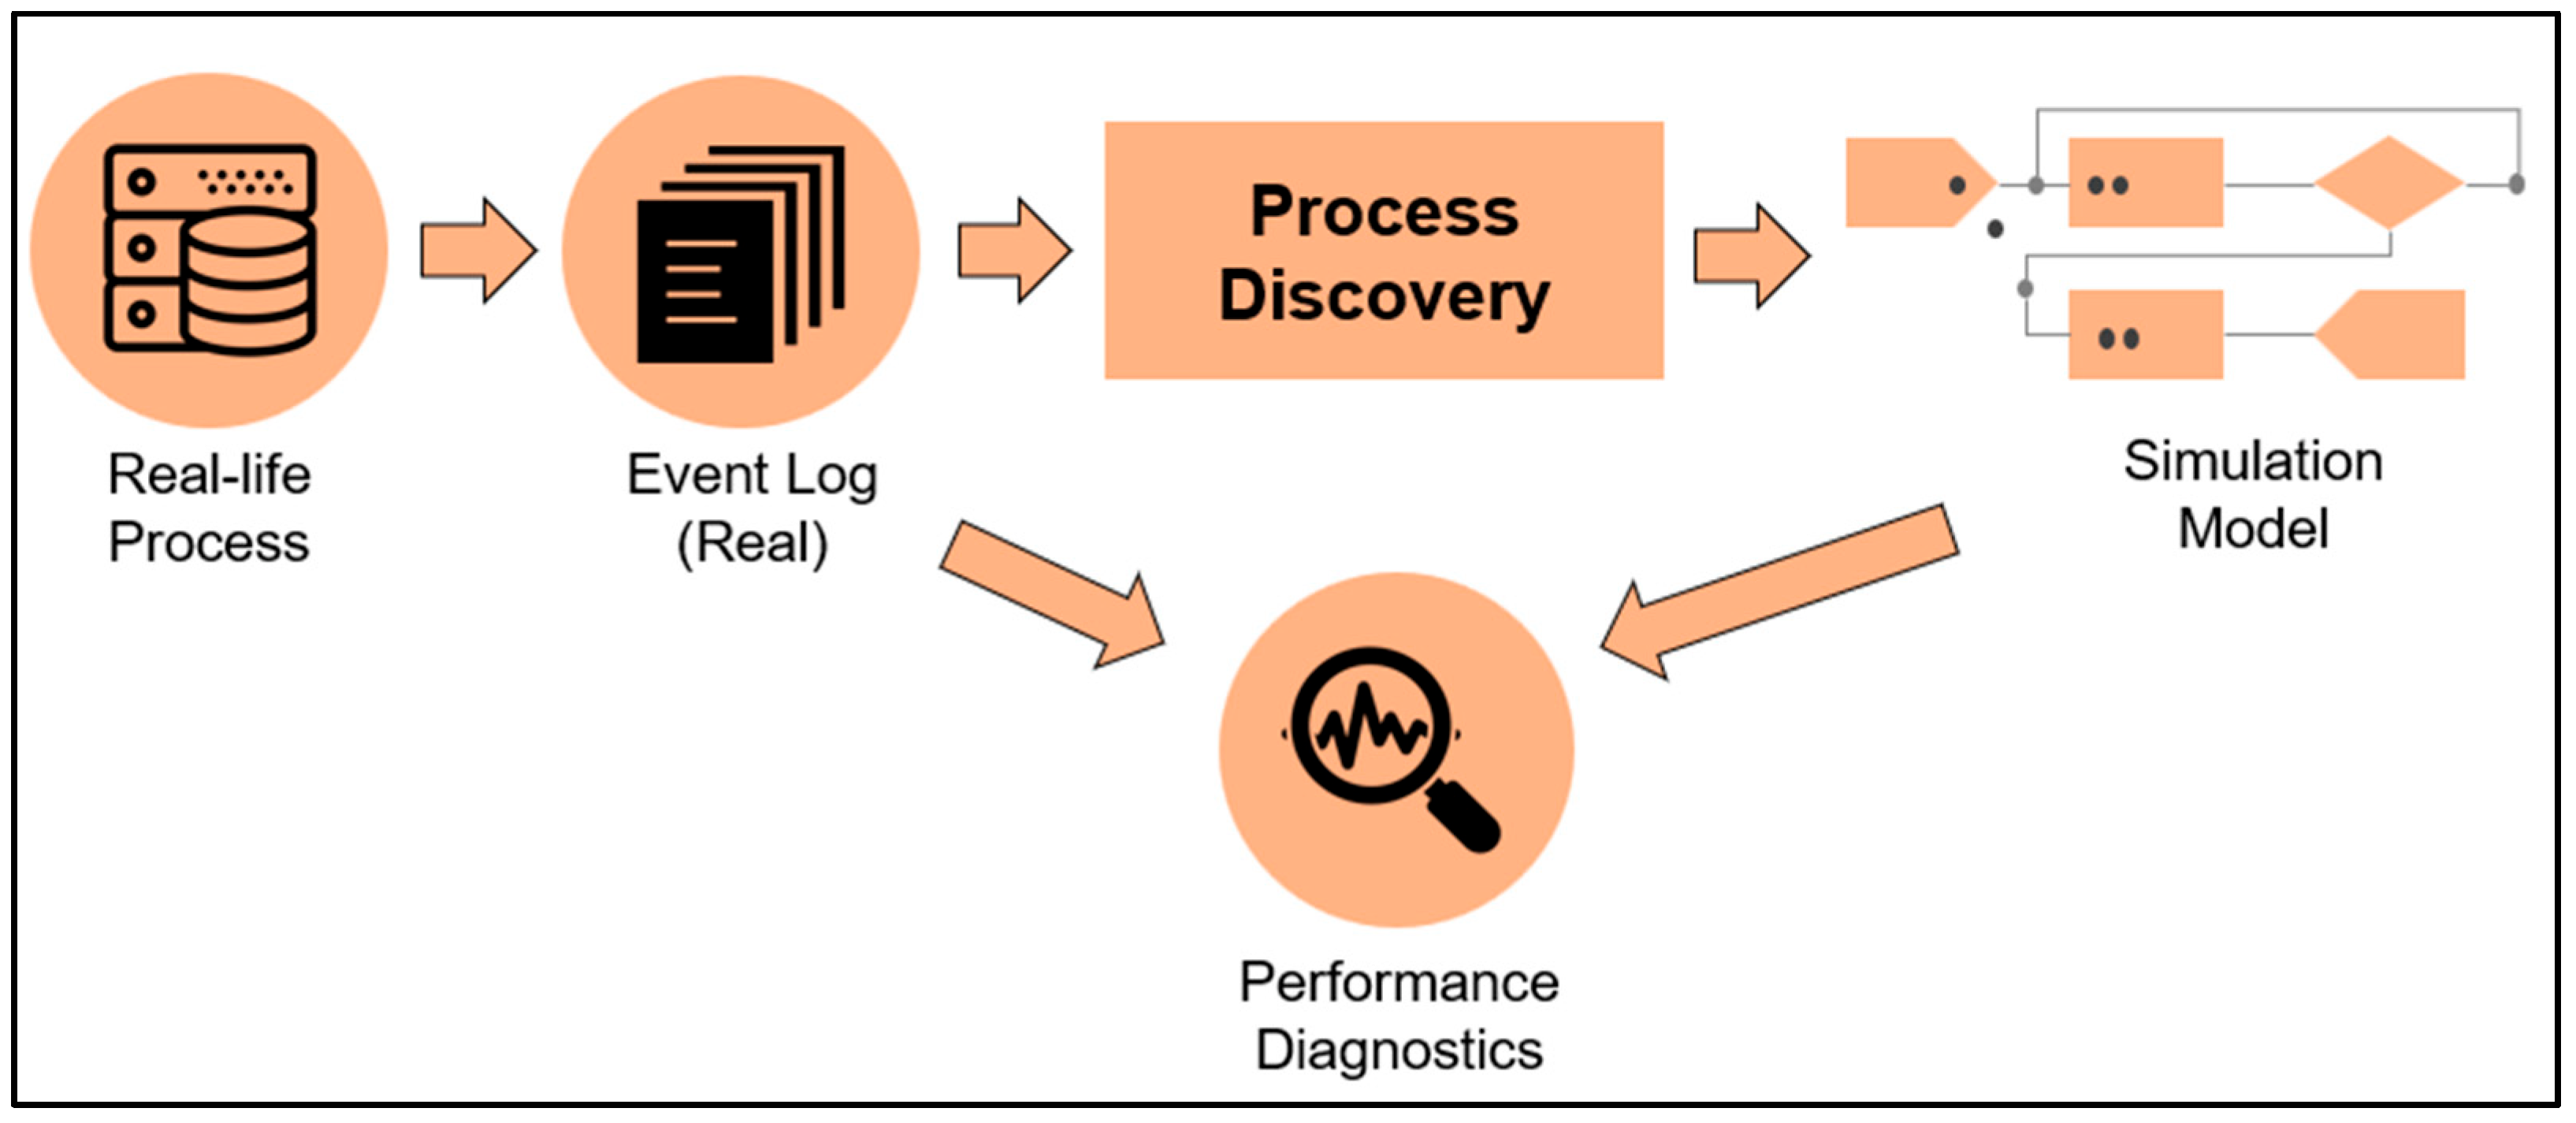
Figure 2 shows how can process mining and simulation modeling can be integrated to diagnose the performance of the process. In this case, event data generated by some process can be used to discover the descriptive process model. Further, the event logs can be replayed over the model to analyze bottlenecks and add the temporal and stochastic behavior of the model.
This paper presents a framework that generates DES models from event logs using process mining techniques and then updates the DES model with real-time data captured from the operation using Bayesian updating. Thus, the productivity estimation of the construction operation can be measured dynamically which will enable stakeholders to make timely, data-driven decisions regarding their operations.
2. Literature Review
Simulation models digitally recreate existing or planned processes to perform experiments on the model to analyze results obtained regarding the behavior of operations. Simulation modeling can be an important decision-support tool to analyze construction operations and processes that takes place throughout the project life cycle. Important information regarding resources, managerial rules, and stochastic events can also be incorporated with simulation models. However, there are certain challenges in designing and implementing simulation models for real-life construction projects. One survey identified that the non-familiarity with different simulation paradigms of construction-site stakeholders is one of the major reasons that simulation models are not being implemented for construction projects [3]. Generating a credible simulation model of a construction operation requires a specific set of skillsets that construction stakeholders typically lack. This limitation can be overcome through the use of process mining techniques, which can discover the underlying behavior of any operation and thus aid in developing simulation models for their analysis. This paper combines the technique of process mining and simulation modeling for dynamic productivity estimation of construction operations to enable timely and effective decision-making. The following subsections discuss the state of the art in process mining and simulation modeling.
2.1. Integrated Applications of Process Mining and Simulation Modeling
Several attempts have been made to create a methodology that combines process mining and simulation. Process mining techniques were implemented to discover the simulation model in a semi-automatic fashion by Rozinat et al. [4]), who demonstrated that event logs encompass different attributes such as control flow, data, resources, or time and can be used to create a simulation model. Liu [5] investigated the potential of integrating process mining with discrete-event simulation modeling. This paper stated that using historical data and process mining tools, discrete operational processes can be characterized easily. However, the primary challenge lies in interpreting the results from process mining and importing them into simulation tools. The author undertook this challenge in bridging the gap between process mining and discrete-event simulation modeling by creating a compatible tool that can import the process models from the process mining tool into generating a simulation model.
Process mining has also been applied in conjunction with agent-based simulation [6]. This study illustrates that there is a gap between the high level of abstraction at which the business processes are usually modeled and the low-level characteristics of events that are generated during the execution of the process. This gap was addressed by utilizing process mining techniques to capture this relationship in a hierarchical Markov model. At the same time, agent-based simulation techniques were used to generate low-level behavior for new versions of the process. By inserting changes to the process model, reconfiguring the simulation model, generating a new event log, and mining a new hierarchical model iteratively, this study was able to generate a more accurate and balanced model.
Process models created manually can depict an idealistic and simpler version of the process by not considering the complex nature of the real-world processes. To address this, analysis of actual event logs using process mining can aid improve the fidelity of the model. To this extent, data mining, and process mining were utilized in conjecture with simulation modeling to present a methodological approach to redesigning the process [7]. This study used process mining to extract the required parameters to create the simulation model based on a realistic model of the process obtained from the event logs. Several redesign alternatives were compared to select the most accurate and reliable model.
With the increasing availability of fine-grained event data for business processes, one study conducted a comparative experimental evaluation of eleven outcome-oriented predictive monitoring techniques based on real-life event logs [8]. This study used event logs to extract features and trained classification algorithms such as K-nearest neighbor (KNN), random forest (RF), support vector machine (SVM), etc. The result demonstrated the feasibility of using event logs, and classification algorithms to perform outcome-oriented predictive analysis for business processes. However, similar technology can be implemented in other fields such as engineering, healthcare, construction, and navigation, among others.
Even though there have been developments in integrating process mining and simulation modeling techniques, widespread adoption of these techniques is hindered due to numerous challenges. As summarized in Norambuena [9], the primary challenges are lack of process knowledge is captured event logs, unstructured nature of data, lack of details, or excessive details in the event log. This study investigates these challenges to create a meaningful, event log with an appropriate amount of abstraction in the data structure.
2.2. Process Mining Applications in Architecture, Engineering, and Construction
There have been studies to integrate process mining and simulation modeling for construction engineering and management. One paper proposed an approach to discovering an activity cycle diagram (ACD) from the activity log data of the construction machinery [10]. This study introduced a refined alpha algorithm to discover the underlying behavior of heavy construction equipment from the ordered and recorded sequential activities. Eventually, it demonstrated the successful mining of the workflow process of earthmoving operations represented by an ACD.
In another effort, process mining techniques were applied in the Architecture, Engineering, Construction, and Facility Management industry (AECFM) [11]. As the AECFM industry is utilizing and adapting IT systems within the lifecycle of projects, this creates the possibility to use process mining to gather important insights into the processes of construction projects. Three case studies were performed in the design-, build-, and operational phases. The findings of the study provide useful insight and potential applications of process mining in the AECFM industry.
Process mining has been applied to data-driven process discovery in the cost estimation process in construction [12]. Data were collected from a software-supported cost estimation platform for three different construction projects. Analysis was carried out from the control flow, case, and organizational perspective. An automated script was developed to improve the quality of the logged data to meet the process mining requirements. The findings show that the proposed approach can perform comparative analyses across projects and companies to make process mining methods a useful application in the Architecture, Engineering, Construction, and Operation (AECO) industry.
The building information model (BIM) has been integrated with process mining to get insights regarding the bottlenecks during the construction process [13]. An unmanned aerial vehicle was used to generate as-built point cloud models which were then compared with the as-planned BIM model. As-planned models were translated into event logs using a software tool, the Evenlog service [14]. Then the as-built data was merged with the event logs to create as-built event logs. This enabled process mining analytics and insights were extracted regarding bottlenecks and deviations during the construction process.
Recent years have seen an increase in the modular construction of housing units which are built inside a factory and then transported to the construction site. Rashid and Louis [15] used process mining to discover the construction process of modular construction in the factory. Radiofrequency identification (RFID) technology was used to track the modular units as they passed from one station to another. The event log was generated from the time-synced location data of the modular units, and the alpha algorithm was used to discover the underlying sequence of the operation.
As the AEC industry is rapidly moving towards an intelligent and databased direction, a study proposed a framework to retrieve new data structure of command-object graphs from 3D modeling event logs [16]. The case study demonstrated that the 3D modeling event logs can provide quantitative and traceable data for early design stages which can add significant value to the later stages of the construction.
A review paper analyzed sixty-two published articles regarding the application of data mining and process mining in underground mining activities [17]. While there were significant works in the domain of data mining, the authors could find only a handful of papers related to process mining applications in underground mining. Despite the lack of research efforts, the process mining papers exhibited the potential of such technique in process improvement and efficiency increasing by using process discovery, conformance checking, and process enhancement.
2.3. Discrete-Event Simulation (DES) in Construction
There has been a significant body of work on the application of DES to improve the efficiency of on-site construction operations. Louis and Dunston [18] provided a framework for real-time monitoring of earthmoving operations using sensor data and finite-state machines. The authors also demonstrate the utility of discrete-event simulation modeling in both the planning and construction phases by advancing the model with information received from construction resources. Akhavian and Behzadan [19,20] developed a methodology to generate operational knowledge from multimodal data collected from various sensors (e.g., load cell, ultra-wideband, etc.) attached to earthmoving equipment. The generated knowledge was further utilized to develop an accurate and realistic simulation model. The methodology was validated using laboratory-scale experiments. Lu and Olofsson [21] proposed a framework consisting of building information modeling (BIM) and DES to enable the integration of DES in the planning and follow-up of construction activities. Vahdatikhaki et al. [22] proposed a framework integrating tracking technologies used in Automated Machine Guidance (AMG) with simulation-driven 4D modeling to use the simulation tool as a proactive monitoring and planning tool in earthmoving projects. A laboratory-scale experiment was conducted to validate the proposed framework.
The application of simulation tools in planning and managing underground infrastructure constructions was investigated [23]. This study shows the usefulness of simulation and analytical tools in capturing the risks and uncertainties of underground infrastructure construction projects and assisting in decision-making. Ioannou and Martinez [24] used DES to compare two alternatives for performing tunneling operations on the basis of cost. González and Echaveguren [25] proposed a dynamic modeling framework based on DES by integrating traffic models and sustainable goals in road construction operations. A hypothetical project was studied to validate the framework and the results demonstrated that the proposed framework could optimize the number of trucks and front-end loaders to minimize the emission level. Chen et al. [26] presented an intelligent scheduling system based on simulation modeling and integrating the major construction factors such as schedule, cost, space, manpower, equipment, and material simultaneously in a unified environment. Moreover, the evolutionary algorithm was utilized to achieve near-optimum distribution of manpower, equipment, material, and space according to project objectives and constraints. The case studies demonstrated higher effectiveness of the proposed framework compared to traditionally used scheduling tools such as Primavera and MS Projects.
Zhang et al. [27] proposed a DES model to estimate the emissions and noise generated from construction equipment from earthmoving projects. The case study demonstrated that the proposed framework is more convenient and accurate in accounting uncertainties, randomness, and dynamics in quantifying the emissions and noise compared to field measurement. Chan and Lu [28] presented a DES modeling approach to improve the effectiveness of the material handling system in a precast viaduct construction project. The knowledge generated from the simulation model was added to the experience of the site manager and project director to assist them in designing the material handling system.
2.4. Gaps in Knowledge and Research Objectives
Even though there has been some work in integrating process mining and DES for construction operations, no previous effort presented a complete methodological framework to implement the integrated system for real-world applications. Moreover, previous studies validated the limited framework using simulated data, which can pose an additional challenge upon implementation as real-world activities contain more complexities and uncertainties. Also, there is a gap in how to further use the simulation modes using the most up-to-date data from the field. A dynamic estimation framework is missing which uses the most recent field data and near-time simulation modeling. Considering these gaps, the goal of this paper is to develop a framework for dynamic productivity estimation for heavy civil operations by using process mining, DES modeling, and Bayesian updating techniques. The specific research objectives undertaken in this paper are:
- Utilize event logs from the real-life construction operation to discover the process and create a DES simulation model.
- Create a continuous updating mechanism using the Bayesian updating method for dynamic productivity estimation.
3. Methodology
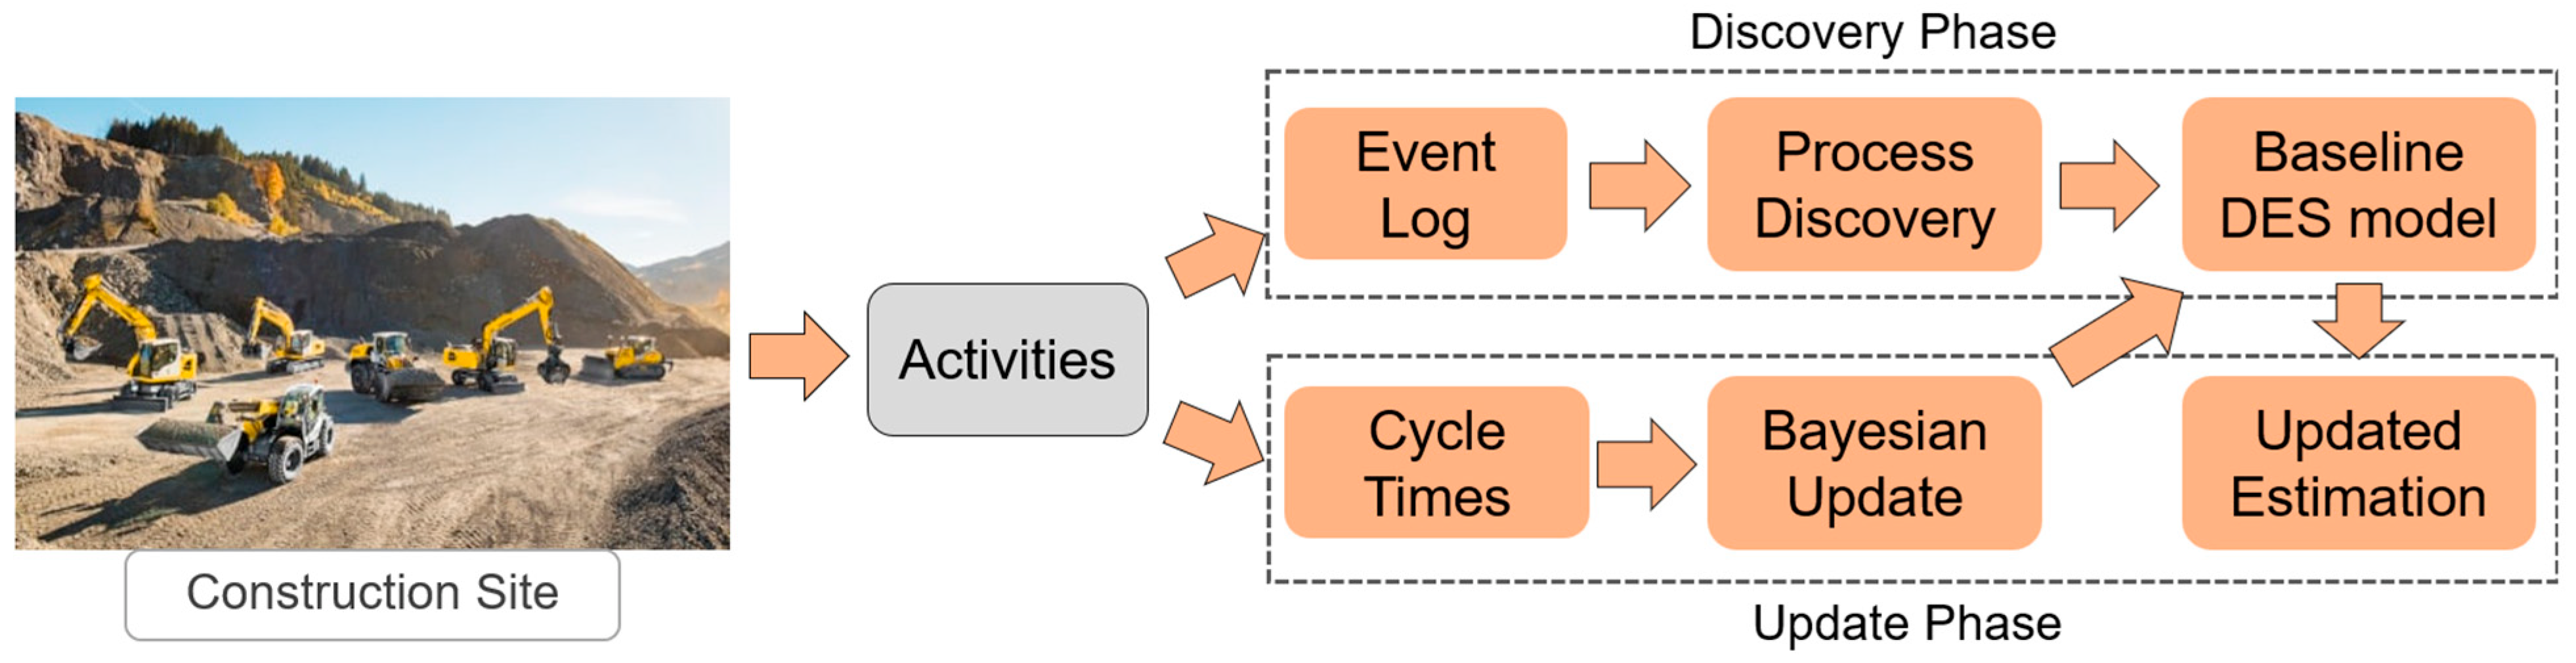
The proposed methodological framework in the paper is demonstrated in Figure 3. The primary methodological phases of this framework are (1) Activity Identification Phase, which relates to identifying the activities of the resources, (2) Discovery Phase, which relates to discovering the baseline DES model using process mining, and (3) Update Phase, that relates to updating the baseline DES model using the Bayesian updating technique. The Activity Identification Phase is a prerequisite to achieving the goal of this study and is presented elaborately in Rashid & Louis [29]. The activities identified in Rashid & Louis [29] will be used to generate the required event log. Thus, this section will primarily focus and elaborate on steps two and three, denoted as ‘Discovery Phase’ and ‘Update Phase’ in Figure 3.
3.1. Activity Identification Phase
First, the activities of the resources from the construction site are identified using sensors and deep learning algorithms. Motion data (e.g., acceleration, orientation, etc.) from different articulated body parts of the equipment are captured using IMUs. These data contained noises and inconsistencies. A noise filtering technique, Median filtering is used to eliminate the noises and the linear interpolation method is used to interpolate the missing data points. Data augmentation techniques are used to generate synthetic data capturing the inter-class dependencies among different activities (e.g., loading, hauling, etc.). Then a deep learning technique, long short-term memory (LSTM)-based recurrent neural network (RNN) is trained and tested to identify activities of the equipment. Details of this activity identification framework are presented in Rashid & Louis [29]. Four major activities are identified in this study, which are essential to developing the DES model, and they are Loading, Hauling, Dumping, and Returning dump trucks. After the activities are identified, further steps can be categorized into two phases: the discovery phase, and the update phase. In the discovery phase, a baseline discrete-event simulation model is created from the activities using the process mining technique. Once the baseline model is created, the cycle time of each activity is calculated and fitted to the distribution using Chi-square goodness-of-fit. As the project progresses, the prior distributions are updated using the Bayesian updating technique and these updated distributions are used as a new input to the baseline simulation model. An updated estimation is generated from the model and the plan is updated based on the new prediction. The discovery and update phases are explained in detail in the following sections.
3.2. Discovery Phase
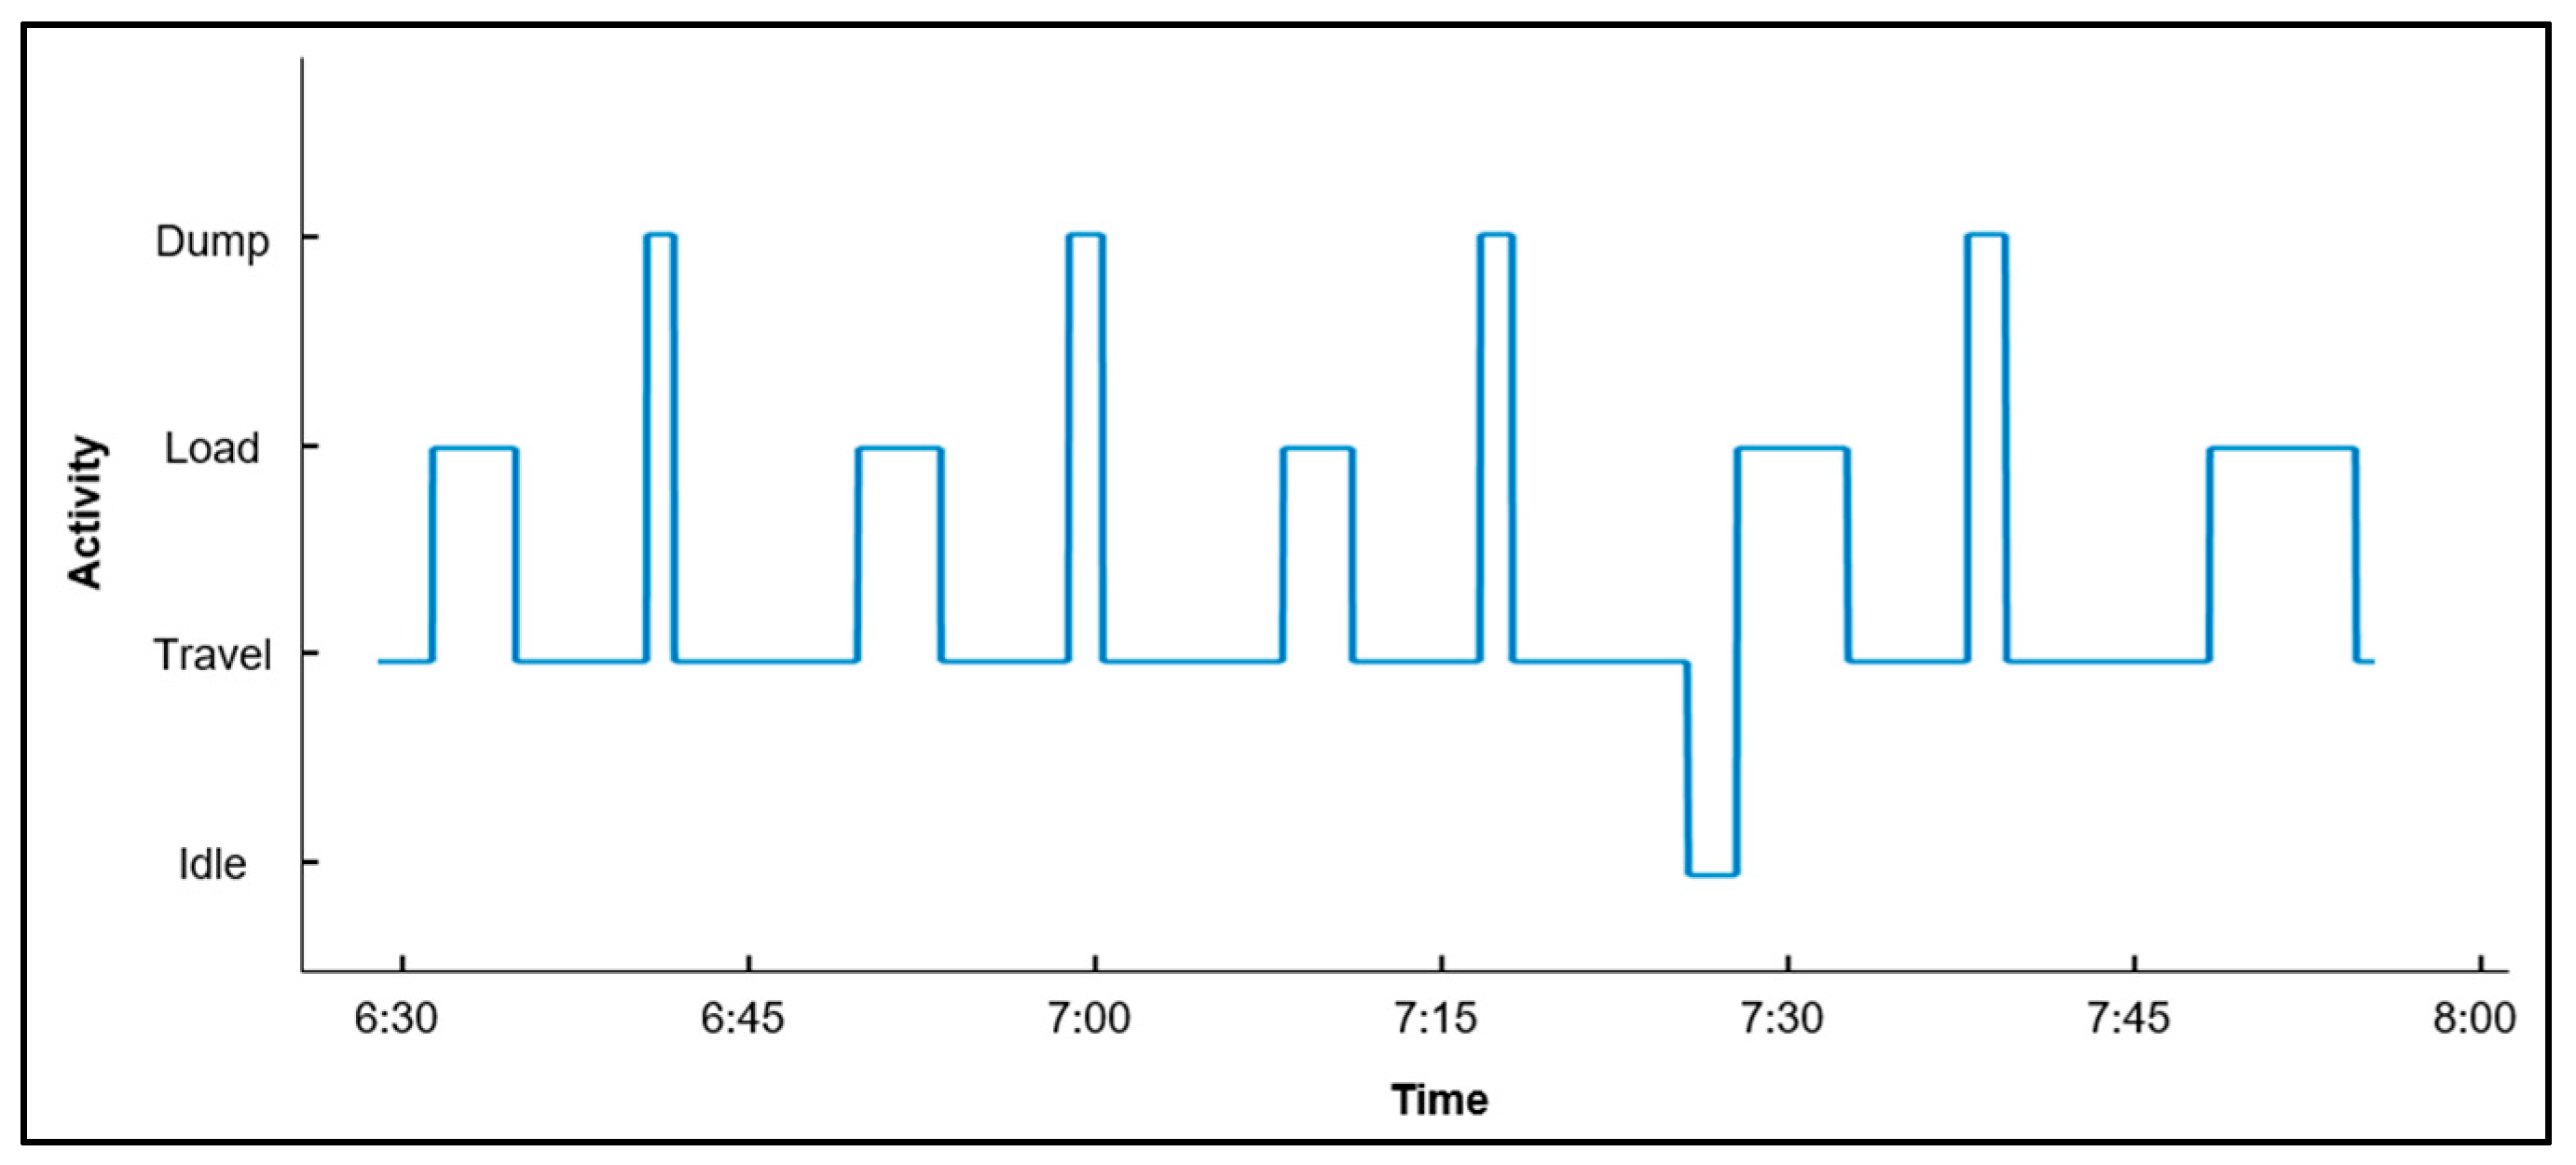
The discovery phase starts with generating event logs from the activities identified at the construction site. For each of the moving agents on the construction site (e.g., dump trucks), one activity profile is created. Figure 4 demonstrates an example of an activity profile. Activities and their associated durations are calculated aligning with the time of occurrence. For example, at 6:32, the dump truck was loading for about 3 min.
The operation that is chosen for this study is moving earth from one location of the job site to another with the help of an excavator and dump truck. This operation is cyclical in nature and follows four major distinct activities for the dump truck: load, haul, dump, and return. In addition to that, the dump truck might have to wait in the queue before loading or dumping. Each cycle of each dump truck is considered a case, and each activity within that cycle is considered an event. The activity profile shown in Figure 4 is converted into an event log following the times and the sequence of the events (i.e., activities). Each cycle or case can be represented by a trace, and the multiset of the traces is represented by the event log. A sample trace can be expressed by refers to five events belonging to the same case. If is the universe of activities, a trace is the sequence of activities. is the universe of traces. is the universe of event logs. is a multiset of observed traces. is a set of traces appearing in the .
Once the event log is generated from the activities, process discovery algorithms (e.g., α-algorithm, heuristic miner) are used to find discover the underlying behavior of the event log. Details of these algorithms are explained in Rozinat et al. [4]. The open-source process mining software, ProM is used to discover the process from event logs. Different parameters are tested until the discovered process reflects real-world operations accurately. Once the underlying behavior of the operation is known, the discrete-event simulation (DES) technique is used to generate a model of the operation. In this study, a discrete-event simulation tool, jStrobe is used to develop the simulation model. The first couple of cycles of the operation is used to determine the duration of each activity. This model is used as a baseline to update while more recent data from the field are generated.
3.3. Update Phase
After identifying activities from the construction resources, the duration of all the activities is calculated. These durations are updated continuously using the Bayesian update method and are used as the primary input parameter of the DES model. The input durations are fitted to distributions using the Chi-Square Goodness-of-Fit test, which tests if a sample of data came from a specific theoretical distribution. This test groups the data into bins, then calculates the observed and expected counts for those bins and computes the chi-square test statistics.
The inputs (i.e., duration of the activities) to the simulation model are assumed to be continuous with an underlying probability density function (PDF). The prior assumptions are updated using Bayes’ theorem when new duration data are calculated from the activity identification model. The Bayesian updating can be expressed with Equation (1)
Here, is the prior distribution, which is revised to the posterior distribution , is the random variable for the parameter of a distribution, k is the normalizing constant , and is the likelihood of observing the experimental outcome assuming a given . The initial distribution assumption for the duration parameter is updated using the more recent observed data. Thus, the judgments and observational data are systematically combined as posterior distribution is obtained from both prior distribution and likelihood function. If the prior distribution is a conjugate of the distribution of the underlying random variable, the posterior distribution can be calculated in the same mathematical form as the prior Ang & Tang [30]. Equations (2) and (3) show the updating process of normally distributed data.
Here, , , are posterior, prior, and sample mean respectively, and are posterior, prior, and sample standard deviation, n is the sample size.
When more data are obtained after the first update, the updating process can be done successfully using these two equations. The posterior statistics from the previous stage become the prior distribution for the next updating stage. Based on these updating techniques, the duration parameter of the DES model is updated using a predefined frequency. As the project progresses, the most up-to-date durations are used as simulation input to generate updated estimations thus, making the model more accurate and reliable. These estimations can be used to update the project plan based on real-life data, thus ensuring data-driven decision-making.
4. Case Study and Results
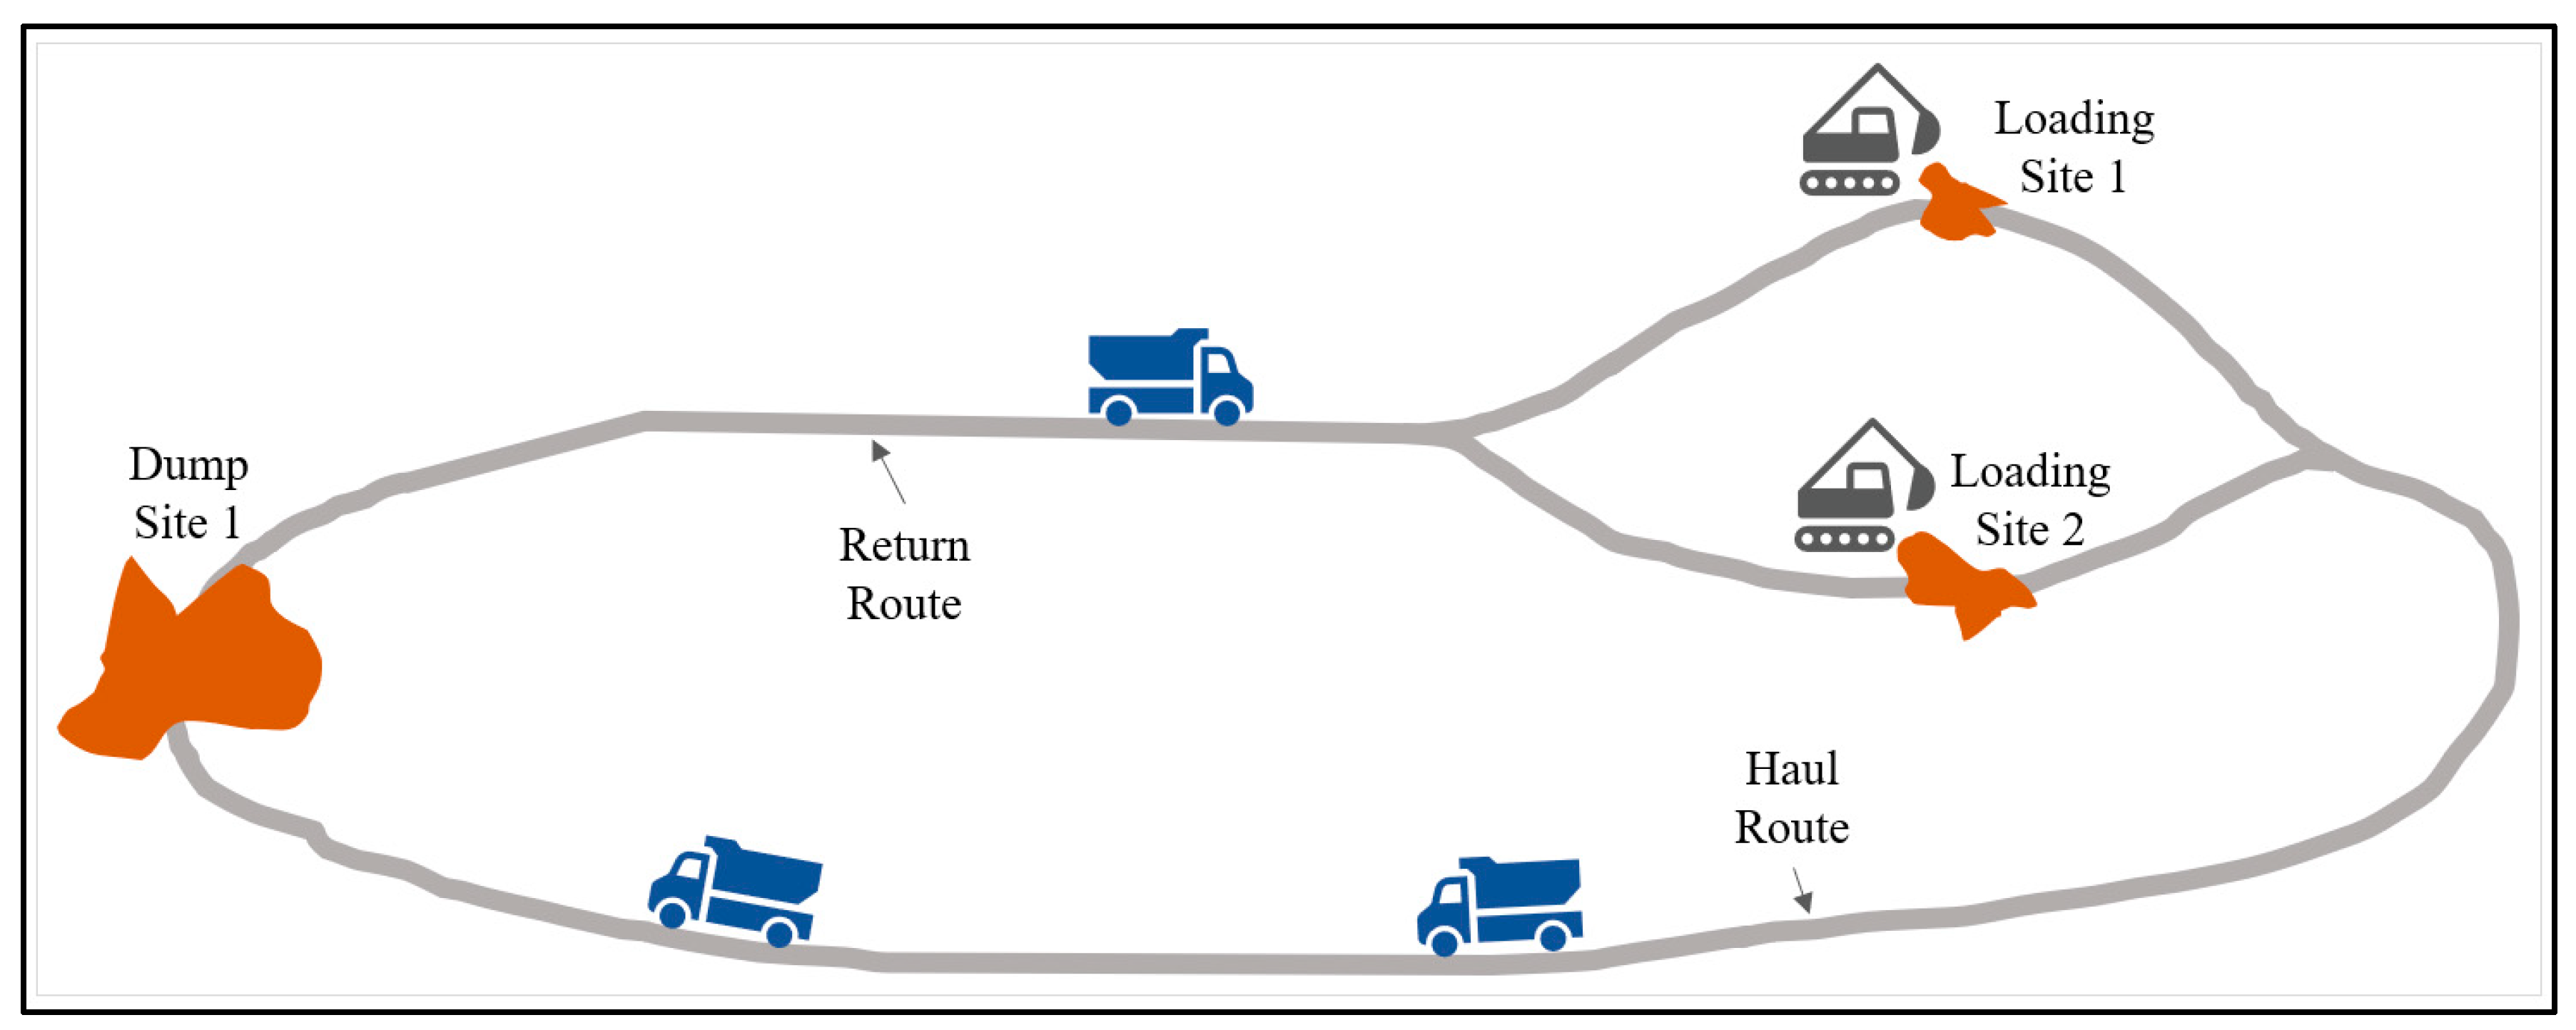
To evaluate the proposed methodology a real-world earthmoving site was selected. This was a highway extension project. The earthmoving operation was mainly carried out using five dump trucks and two excavators. There were two loading sites, each having one excavator, and one dumping site. Thus, the trucks need to decide upon which excavator to go to after dumping their load. Figure 5 shows a schematic layout of the site.
4.1. Activity Identification
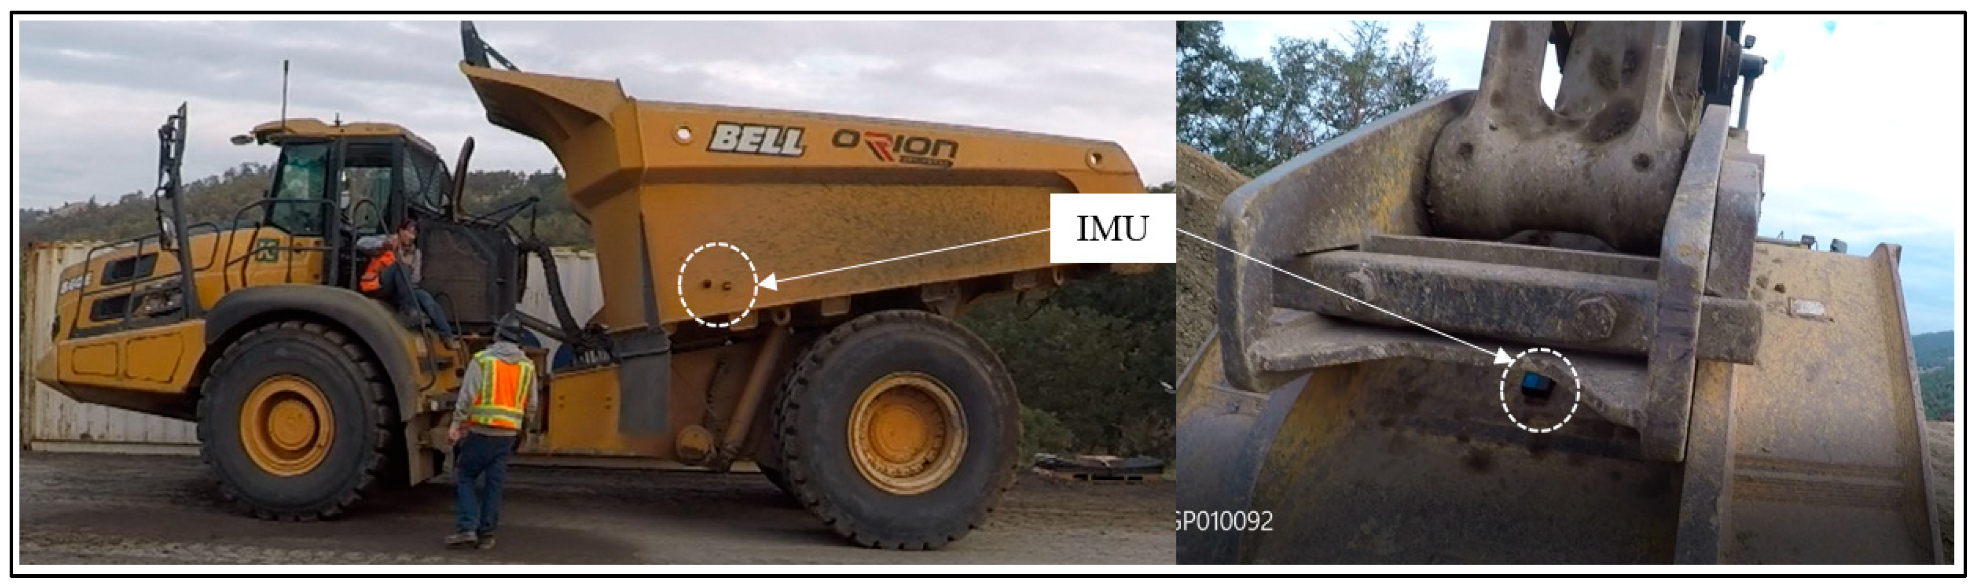
IMU sensors were attached to the equipment using a plastic box with a magnetic bottom. For excavators, IMU sensors were attached to the bucket to maximize the activity identification accuracy. GPS sensors were also attached to the trucks to record their movements. The activities were recorded using a video camera. Unfortunately, one sensor fell off a truck, and one sensor malfunctioned. Thus, data from three trucks and two excavators were available for further analysis. Figure 6 shows the sensor attachment to the dump truck and excavator.
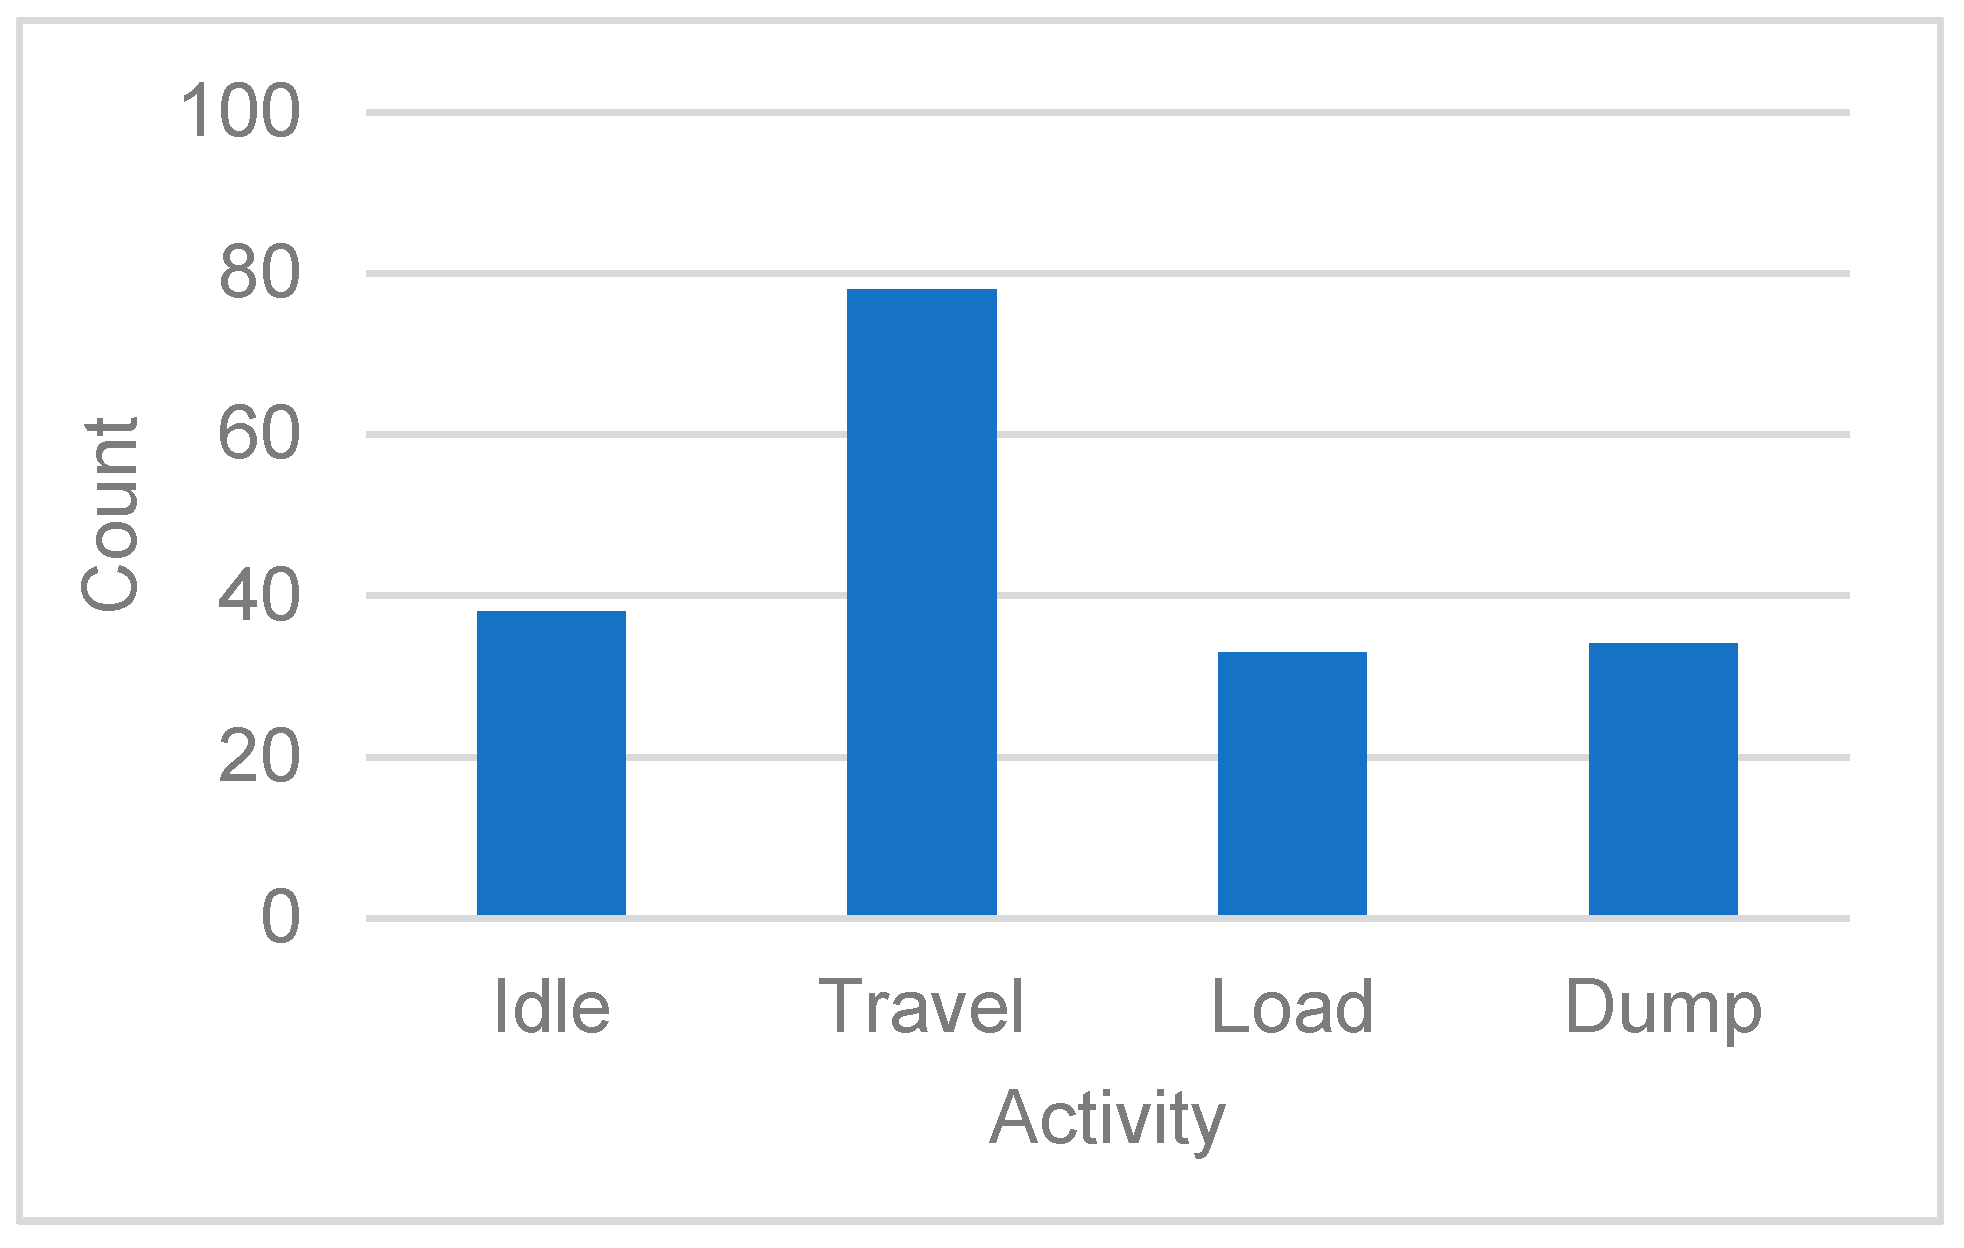
The collected data were used to train an LSTM network to identify the activities following the steps described in Rashid & Louis [29]. For this study, three types of activities were identified from the dump truck, they are load, travel, and dump. In addition to these, all the wait times were also measured between those activities. Figure 7 shows the number of times each of those activities occurred during the data collection process. If travel occurred after loading, it was assumed to be hauling (i.e., the truck was moving from load area to dump area with soil) and if it happened after dumping, it was assumed to be returning (i.e., the truck was moving from dump area to load area empty).
4.2. Event Log and Process Discovery
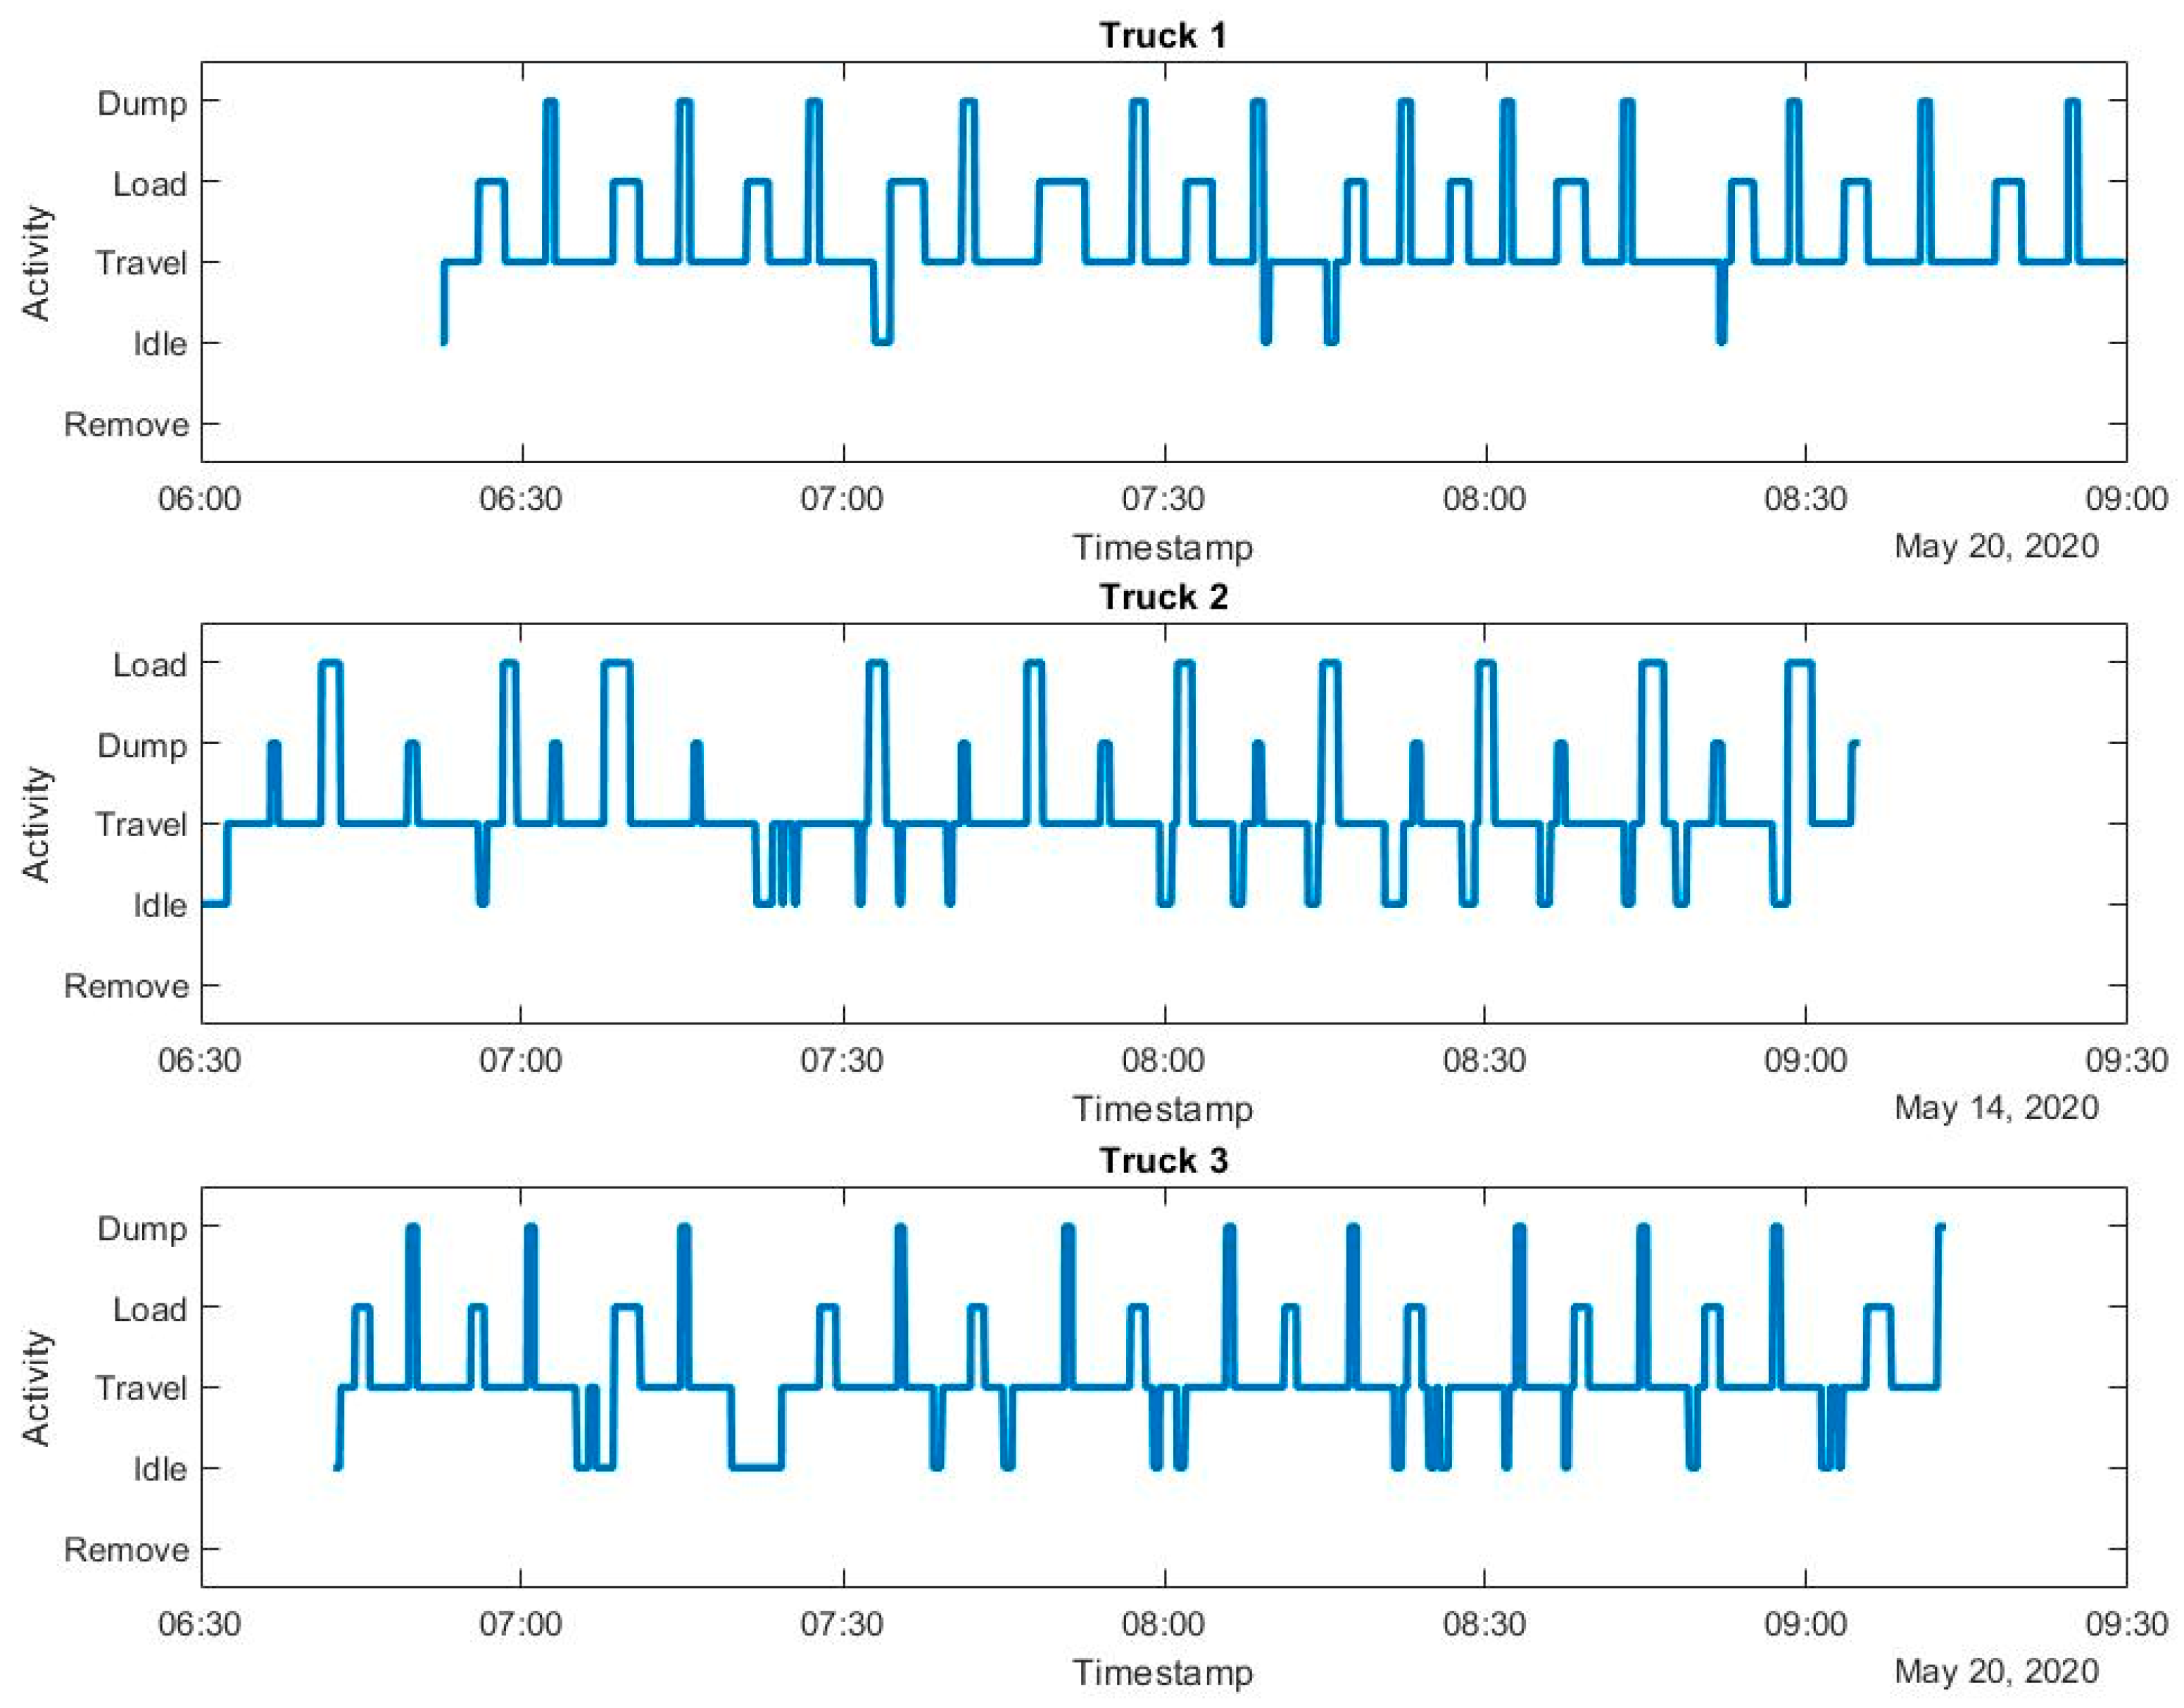
Once the activities are identified, activity profiles are created for each of the dump trucks where it shows the activities with corresponding timestamps as shown in Figure 8. This was done to create an event log from the activity profile. This activity profile is then converted into an event log with timestamps and the name of activities.
During the event log generation, idle activities were further divided into several categories based on their relevance in the operation. For example, if the truck is idle before loading, it is assumed that there is a queue in the loading zone and the truck is waiting for the excavator to be loaded. Similarly, if the truck is idle before the dumping, the truck is assumed to be waiting in a queue to get into the dump zone. Moreover, two excavators were operating on the site, so based on the GPS data, it was also categorized if the truck was waiting for one excavator or another (e.g., WtExc1 means waiting for excavator 1). There was a total of 32 cases, 149 events, and 9 event classes. A case is defined as a complete operational cycle, which typically follows as the truck is loaded, then hauled to the dumpsite, dumped the soil, and returned to the loading zone, as well as all the wait time in between those activities. The 9 event classes were WtExc1 (i.e., waiting for excavator 1), WtExc2 (i.e., waiting for excavator 2), LdExc1 (i.e., loading under excavator 1), LdExc2 (i.e., loading under excavator 2), Haul, Wt2Dmp (i.e., waiting to enter the dump zone), Dump, Wt2Ret (i.e., waiting to return from the dump zone), and Return. Table 1 summarizes the event log in terms of cases and events.
Once the event log is created, the underlying operational process is discovered using the process discovery algorithm. Several process discovery algorithms such as alpha++, alpha#, heuristic miner, and inductive miner were implemented to discover the process model of the operation. As the earthmoving process is relatively simple and there are no short-loops, self-loops, and frequency-related issues, the output from all the mining algorithms presented a very similar process model. These mining algorithms and variations were primarily derived from the alpha algorithm. The alpha algorithm is based on abstracting certain relationships between activities, such as direct succession, causality, parallel, and choice. A footprint was drawn from the event logs using these relationships which is shown in Table 2.
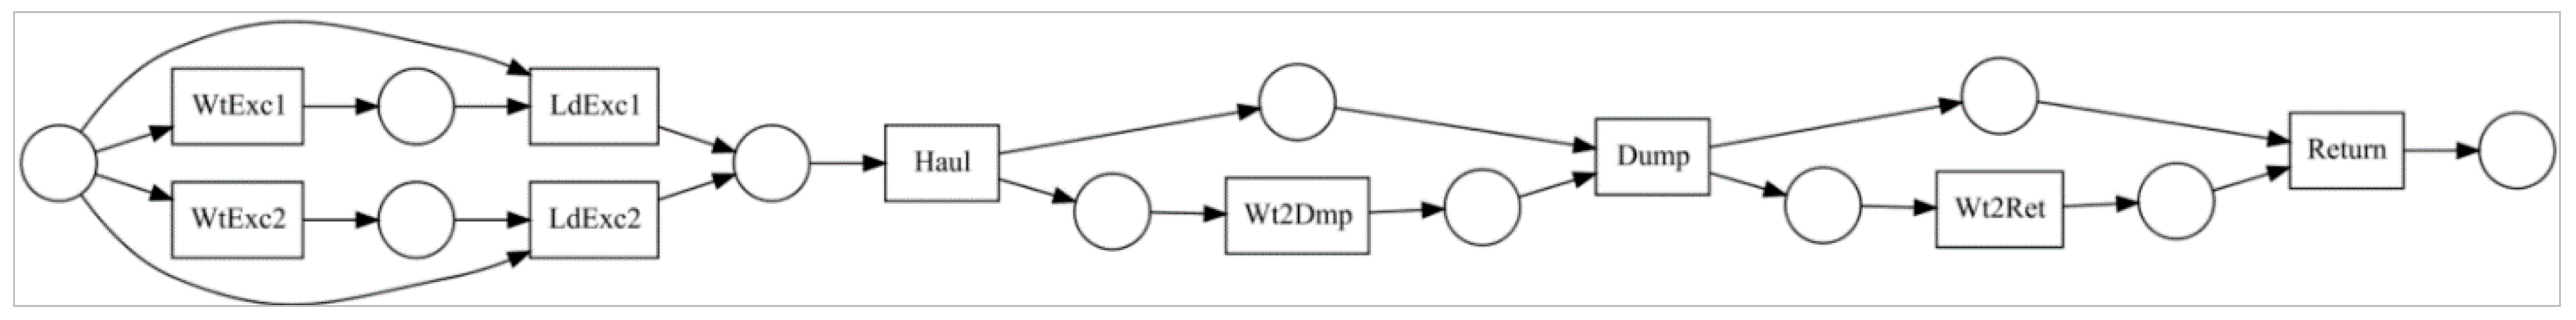
Table 2 shows that all the activities are related to each other by one of those relations. For example, WtExc1 is directly followed by LdExc1, denoted by the arrow (→) sign. WtExc1 activity also happens in parallel with WtExc2 activity which is denoted by the || sign. Except for these two, there is no other activity that follows or is followed by the WtExc1 activity, denoted by the # sign. This footprint is used to draw the Petri net shown in Figure 9 which demonstrates the process model of the earthmoving operation.
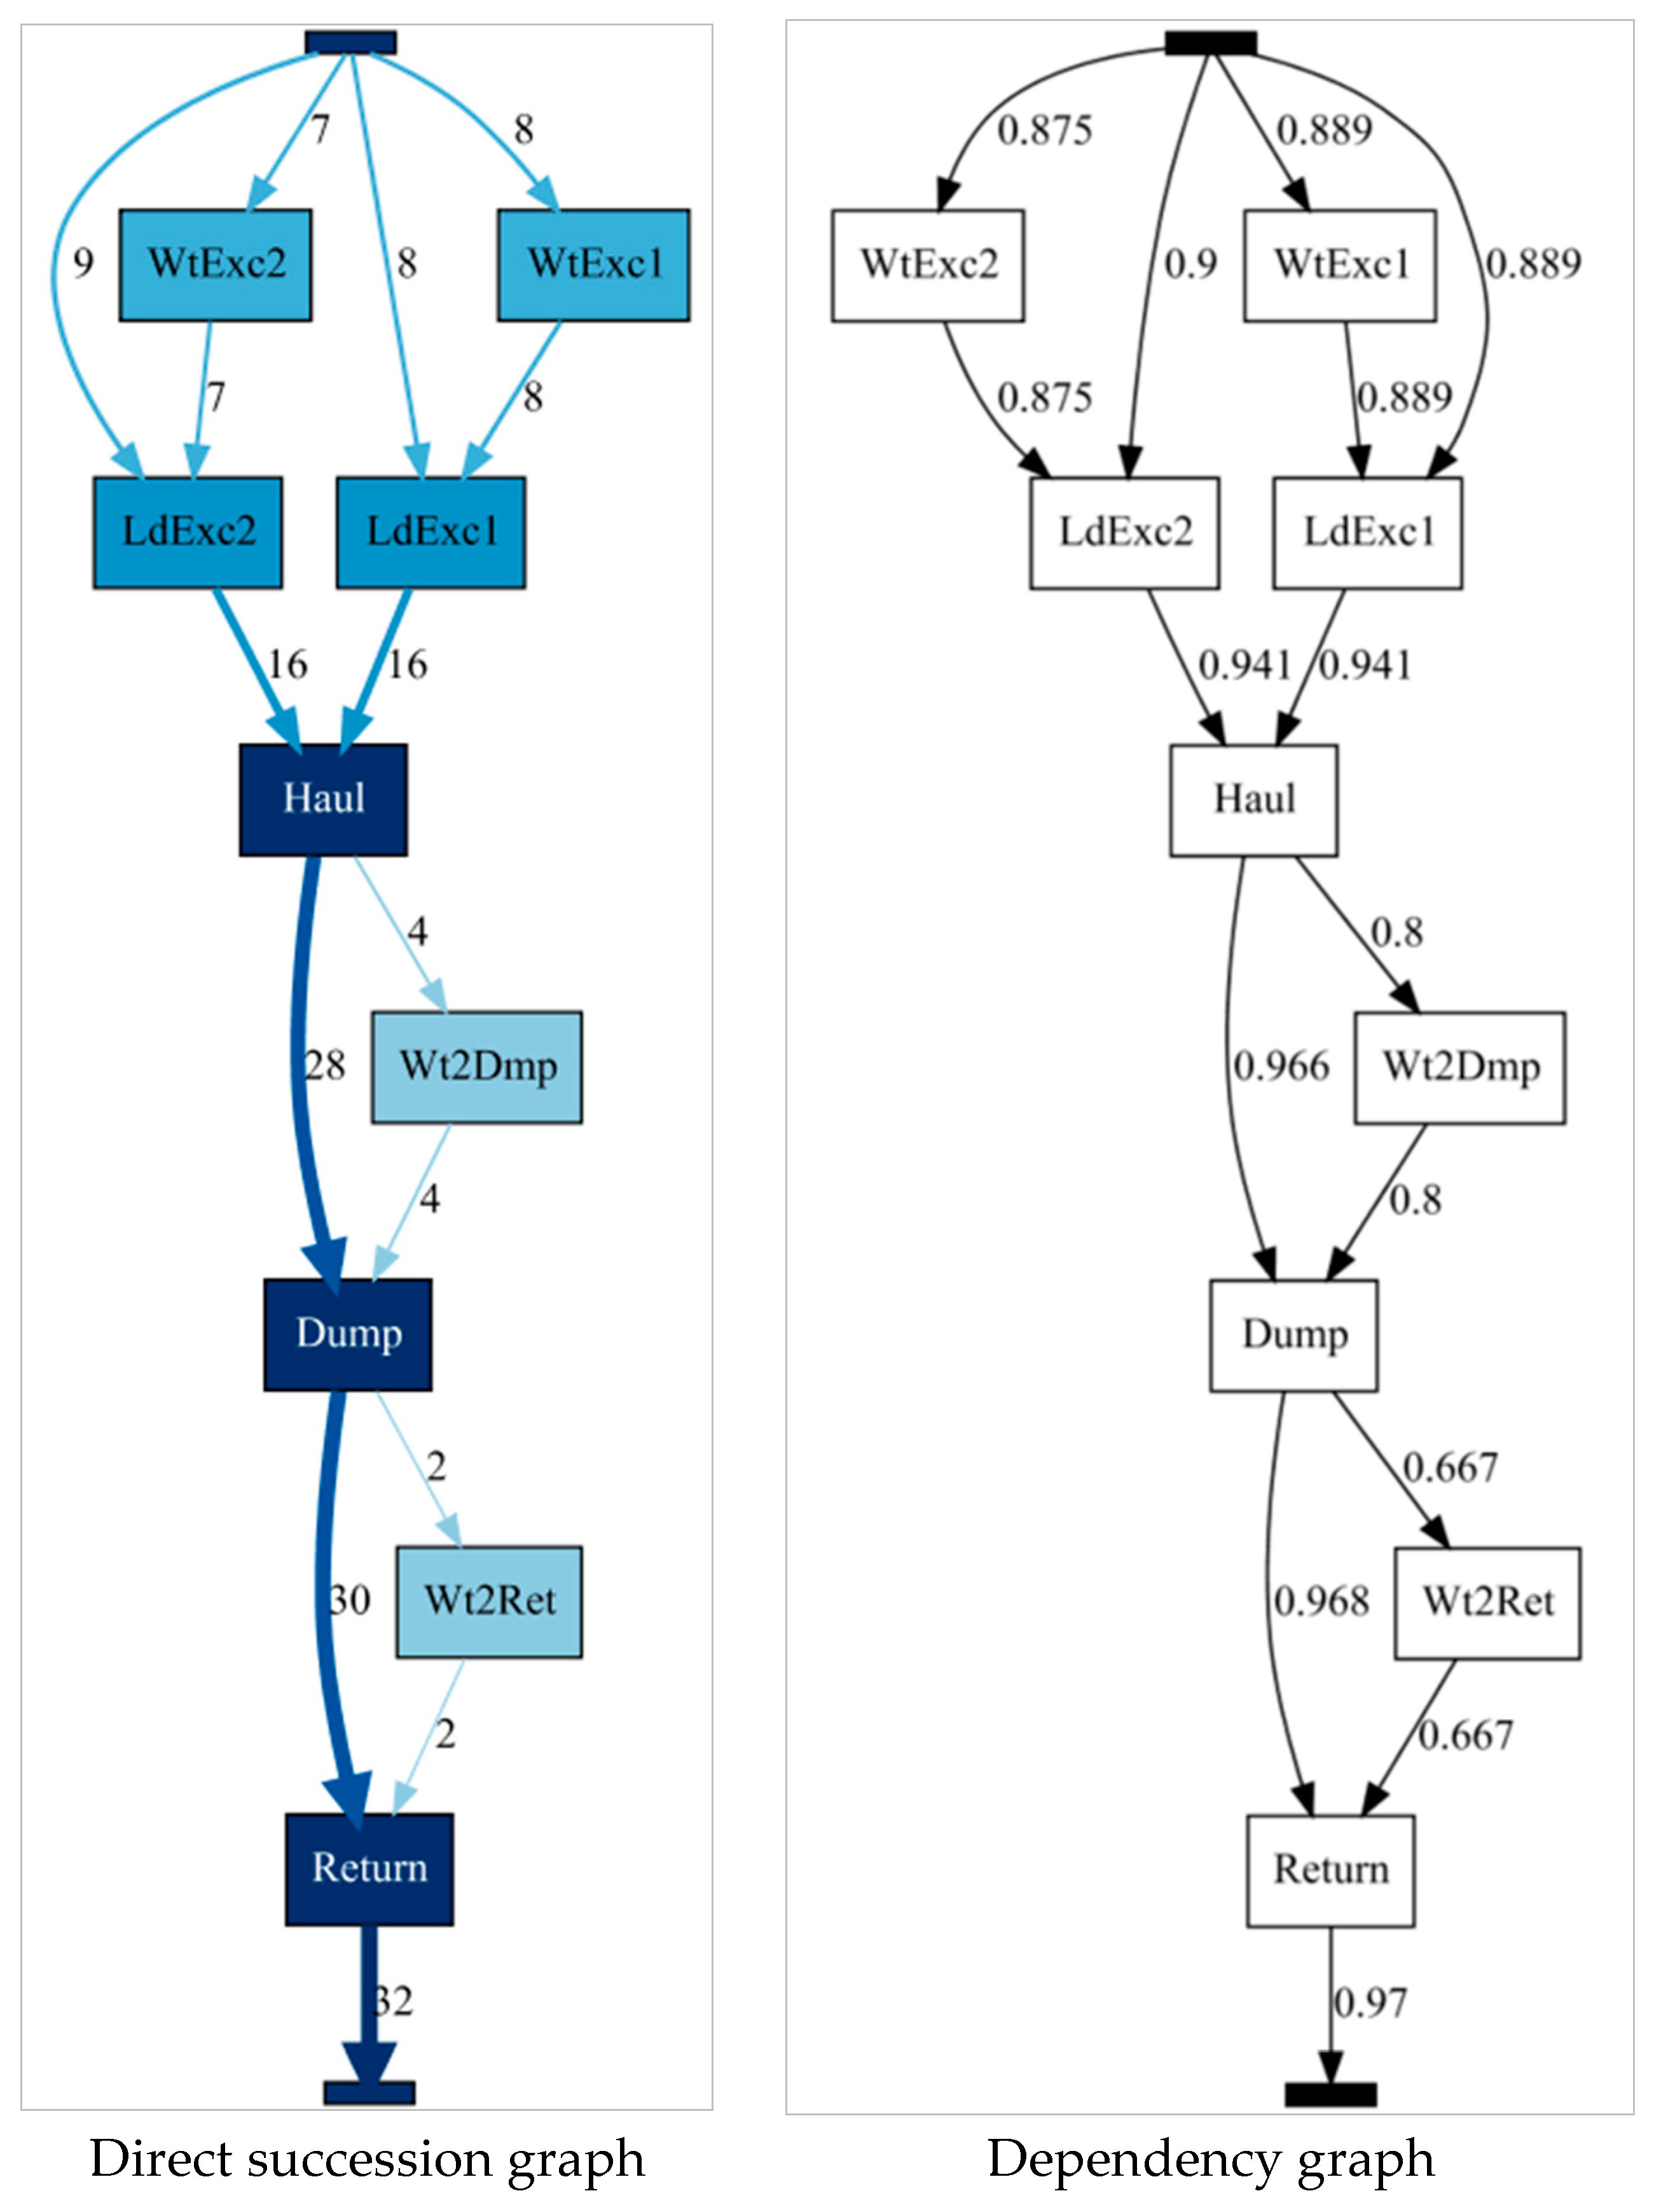
The operation starts with the trucks waiting for either excavator 1 or 2 and they are loaded with soil. Then the soil-filled truck hauls to the dump zone. Sometimes, due to queues, the trucks had to wait to get into the dump area. The trucks then dump the earth and sometimes wait to get out from the dump area due to queues. Finally, the trucks return to the load area and wait to be loaded again. Heuristic miner was also used to generate the direct succession graph and dependency graph demonstrating inter-class dependencies between the event classes as shown in Figure 10. The direct succession graph shows how many times each activity was followed by another. For example, the Haul activity was followed by the Dump activity 28 times, and the Wt2Dmp activity 4 times. The dependency measures were calculated using the following equation.
If is the value of the dependency relation between and b,
In the dependency graph the dependency value of is 0.966. As Haul was followed by Dump 28 times, and Dump was never followed by Haul, according to Equation (4), the dependency value is 28/29 or 0.966.
4.3. Cycle Time Calculation
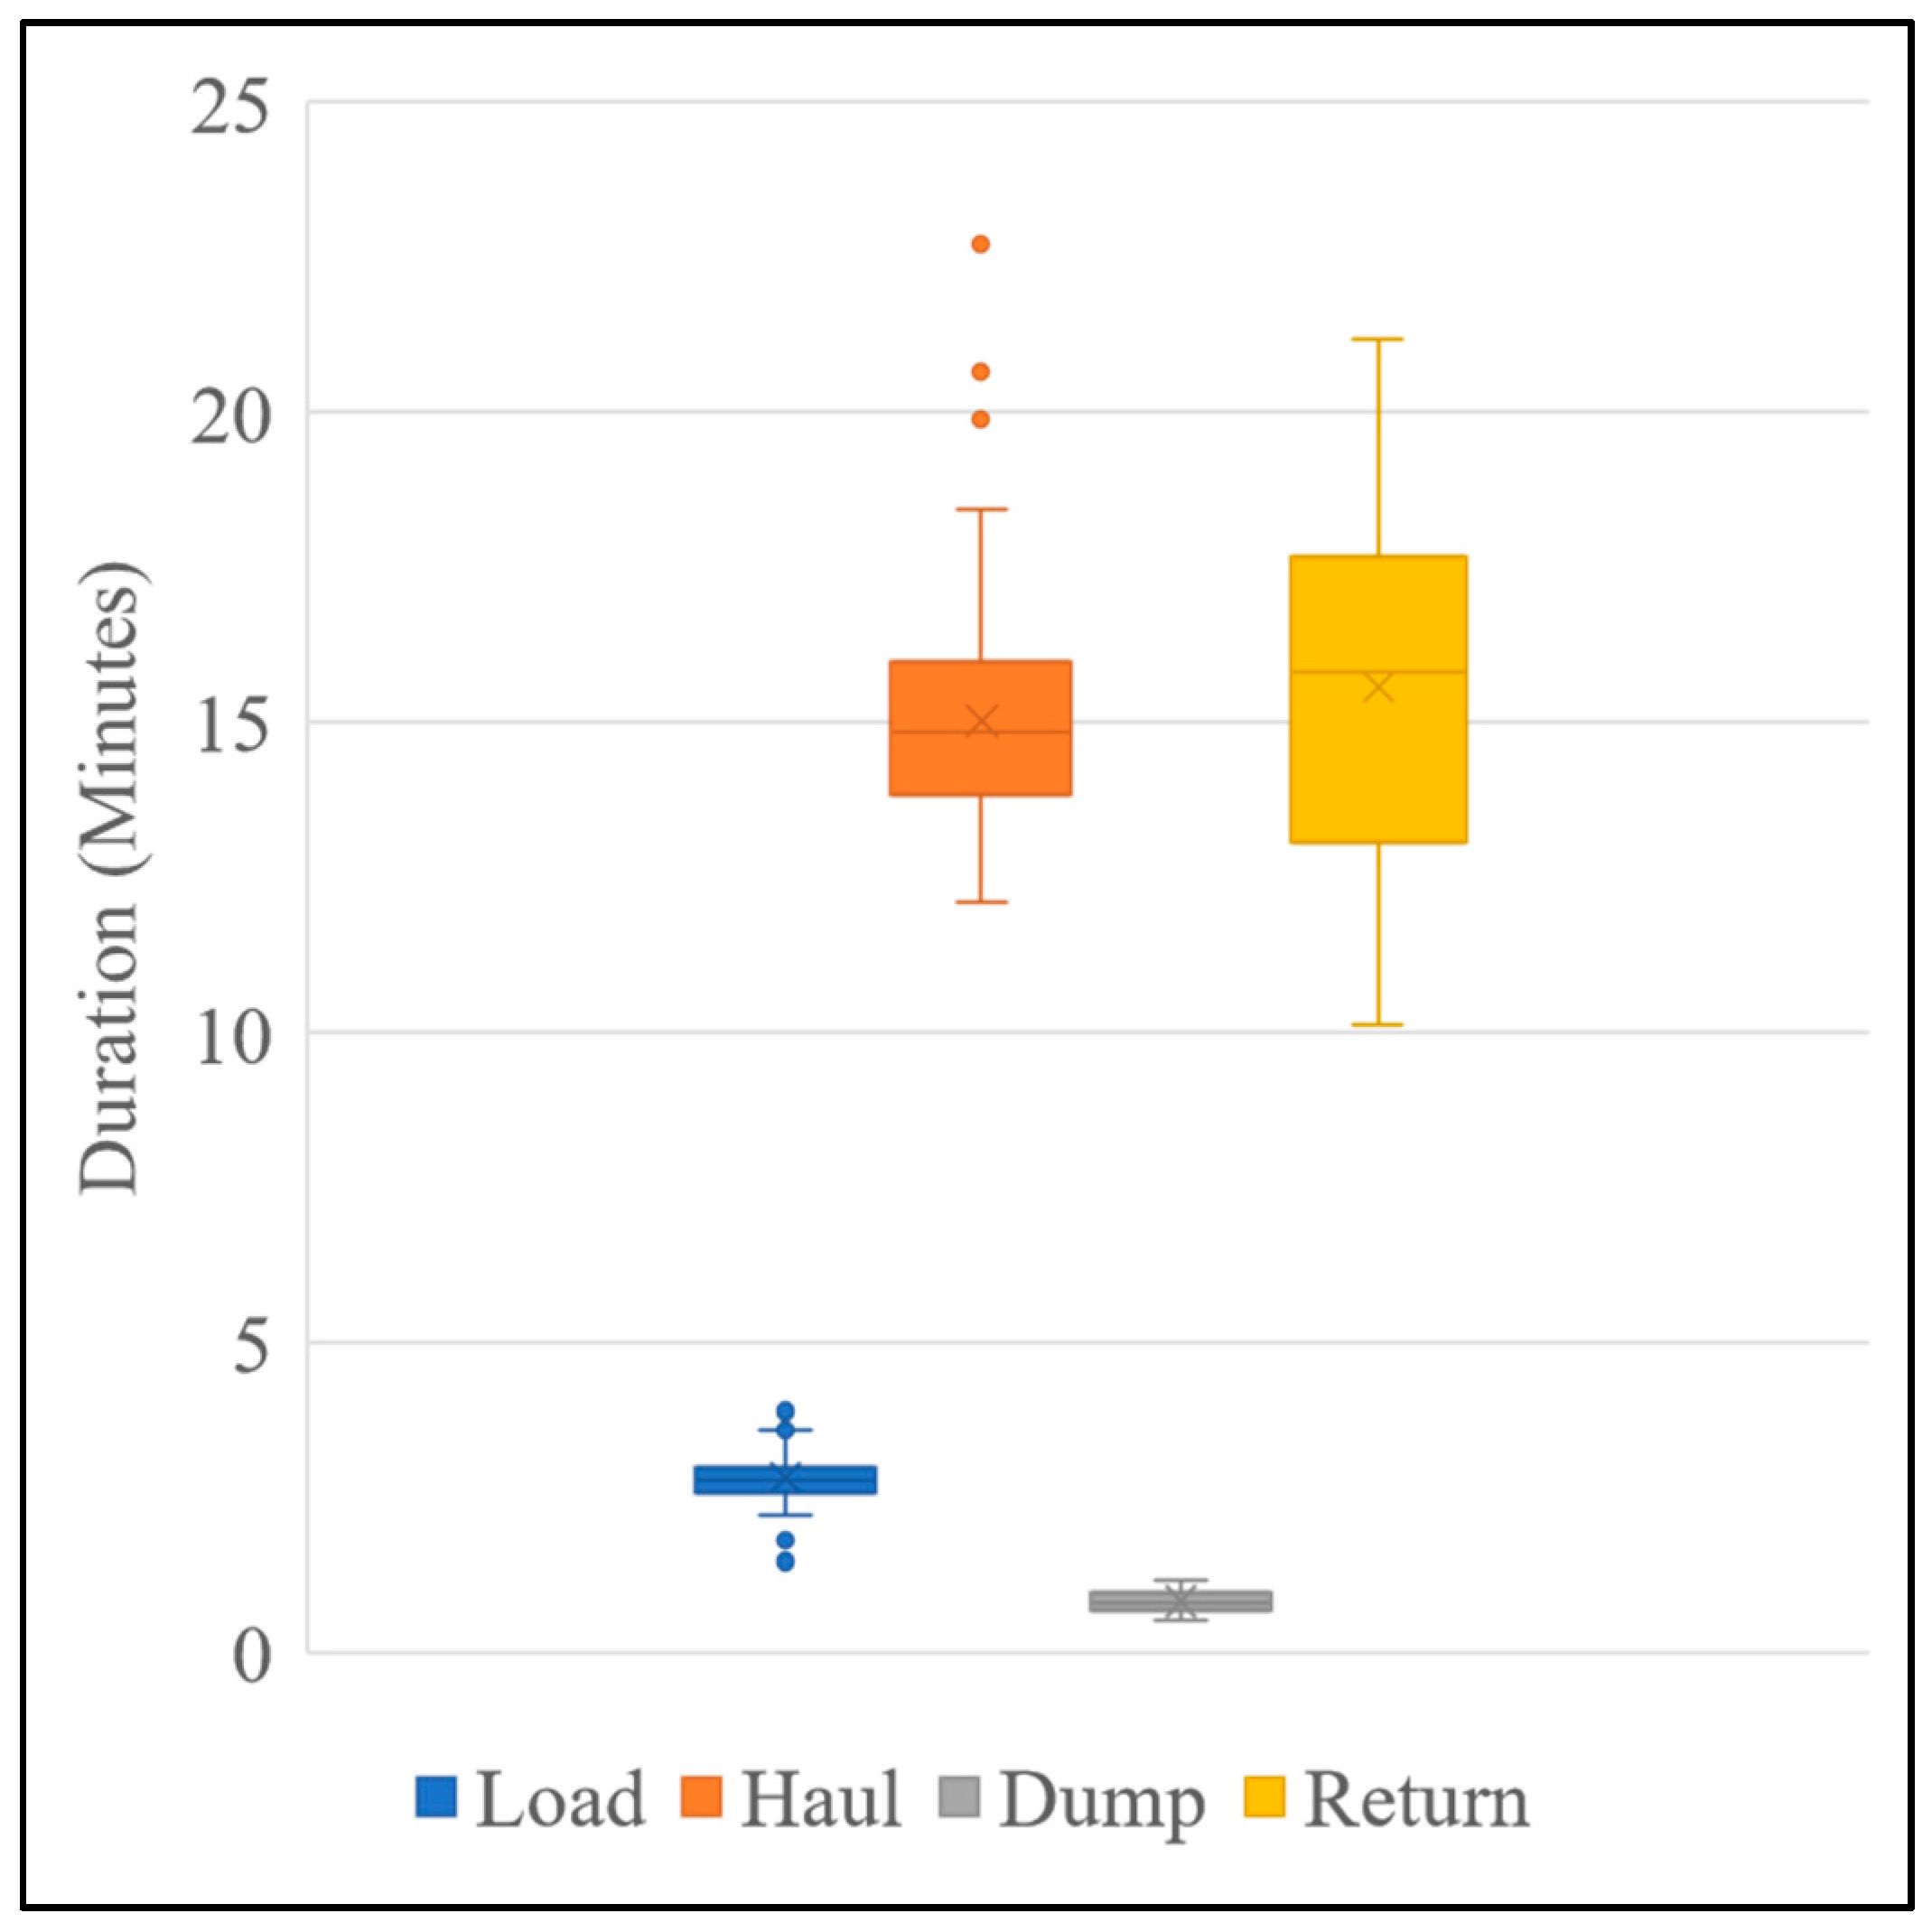
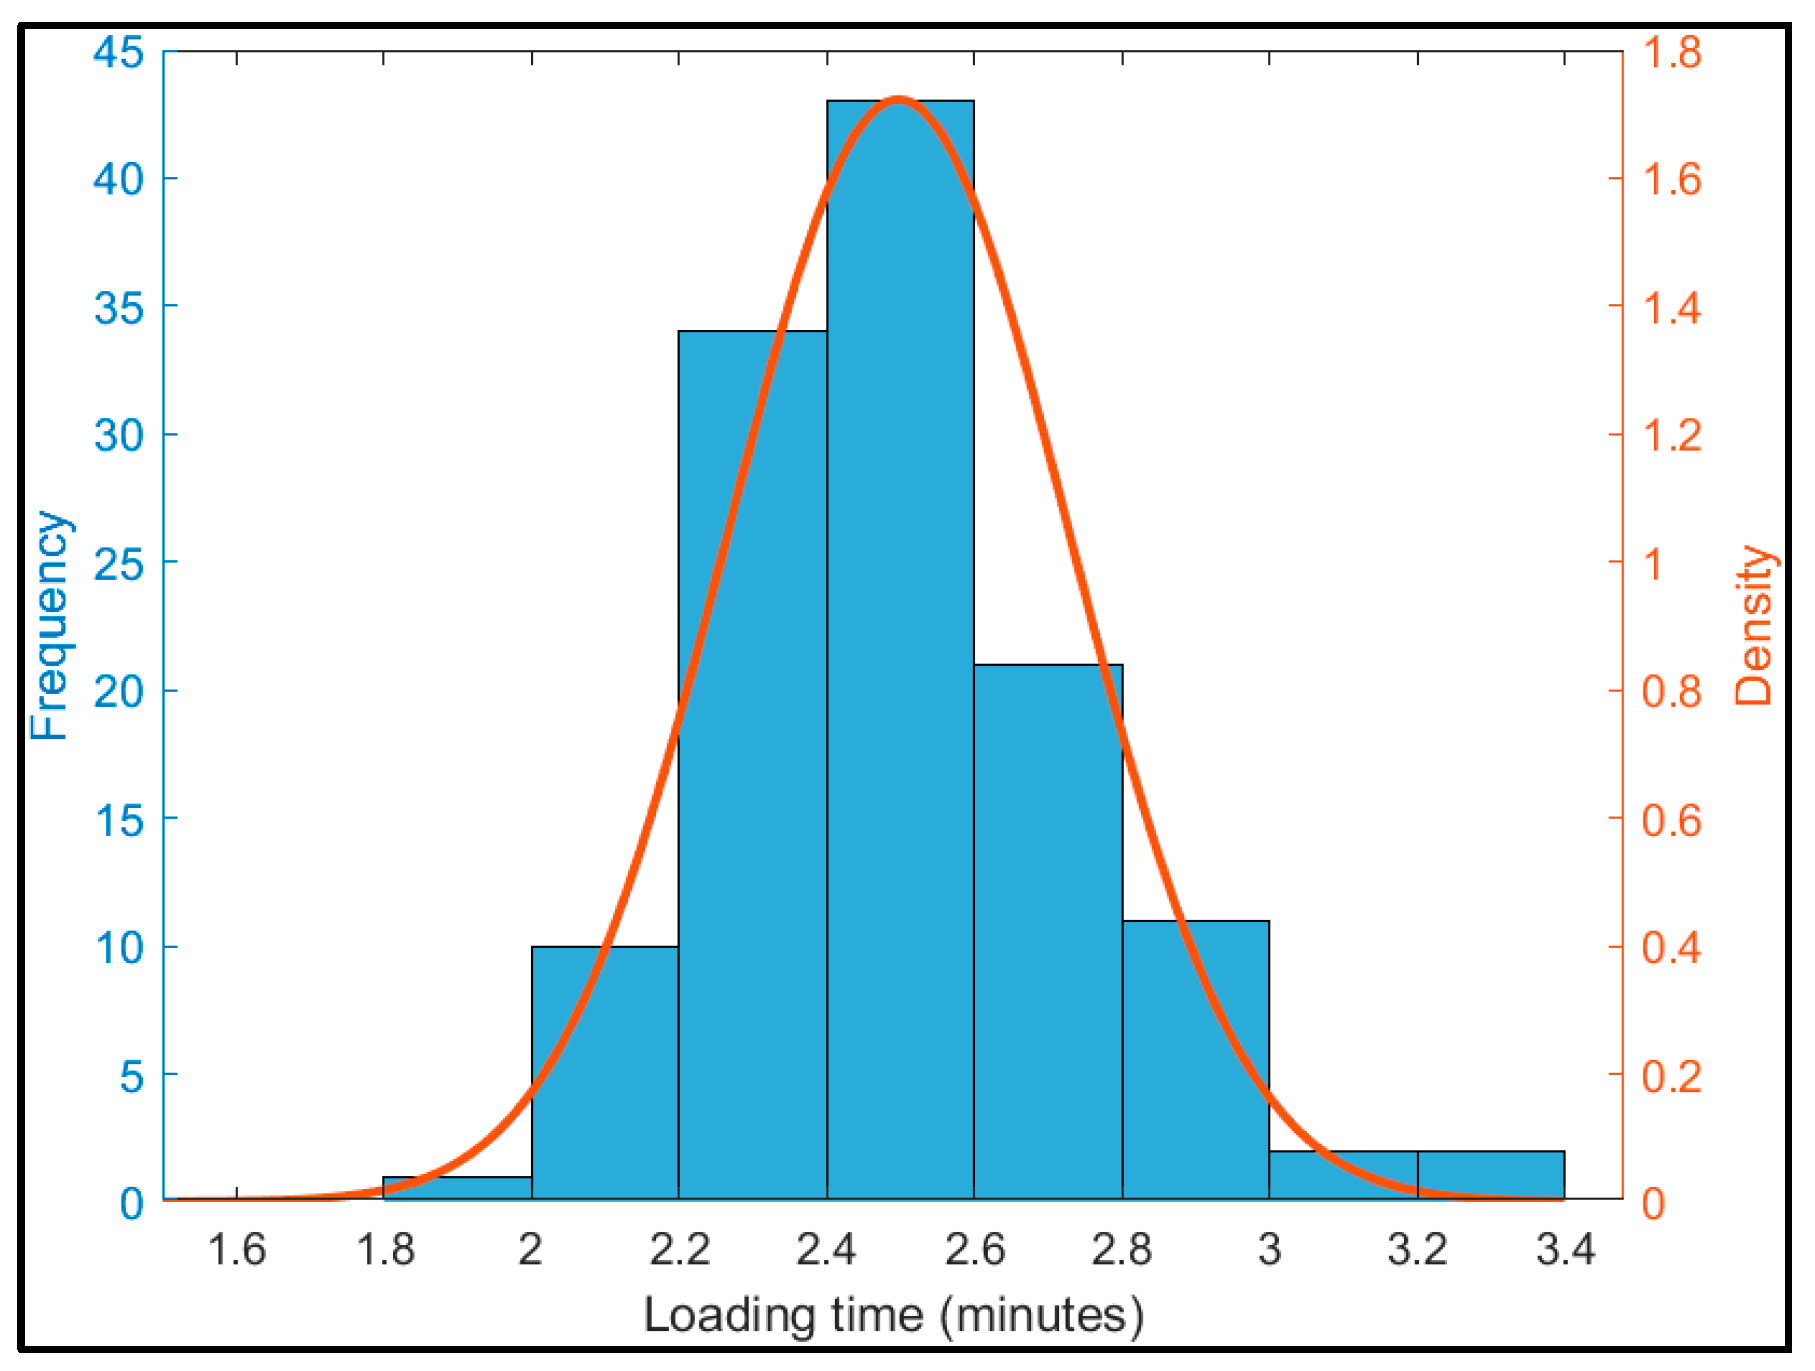
The duration of all the activities was calculated once the activities were identified accurately. Figure 11 shows the duration of different activities of the dump trucks. The average duration for Loading, Hauling, Dumping, and Returning are 2.81 min, 15.03 min, 0.83 min, and 15.53 min, respectively. These durations will be the primary input parameter of the DES model as a distribution (e.g., normal distribution, gamma distribution, etc.). The distributions were fitted using the Chi-Square Goodness-of-Fit test, which tests if a sample of data came from a specific theoretical distribution. This test groups the data into bins, then calculates the observed and expected counts for those bins and computes the chi-square test statistics. All four activities were fitted to normal distribution. Figure 12 shows the histogram and probability density of the loading times.
The calculated means and standard deviations for all four activity durations are shown in Table 3. The return route for the trucks was longer than the hauling route which is reflected in the data. These values were assumed to be the initial input parameters for the base DES model.
4.4. Baseline Model Development
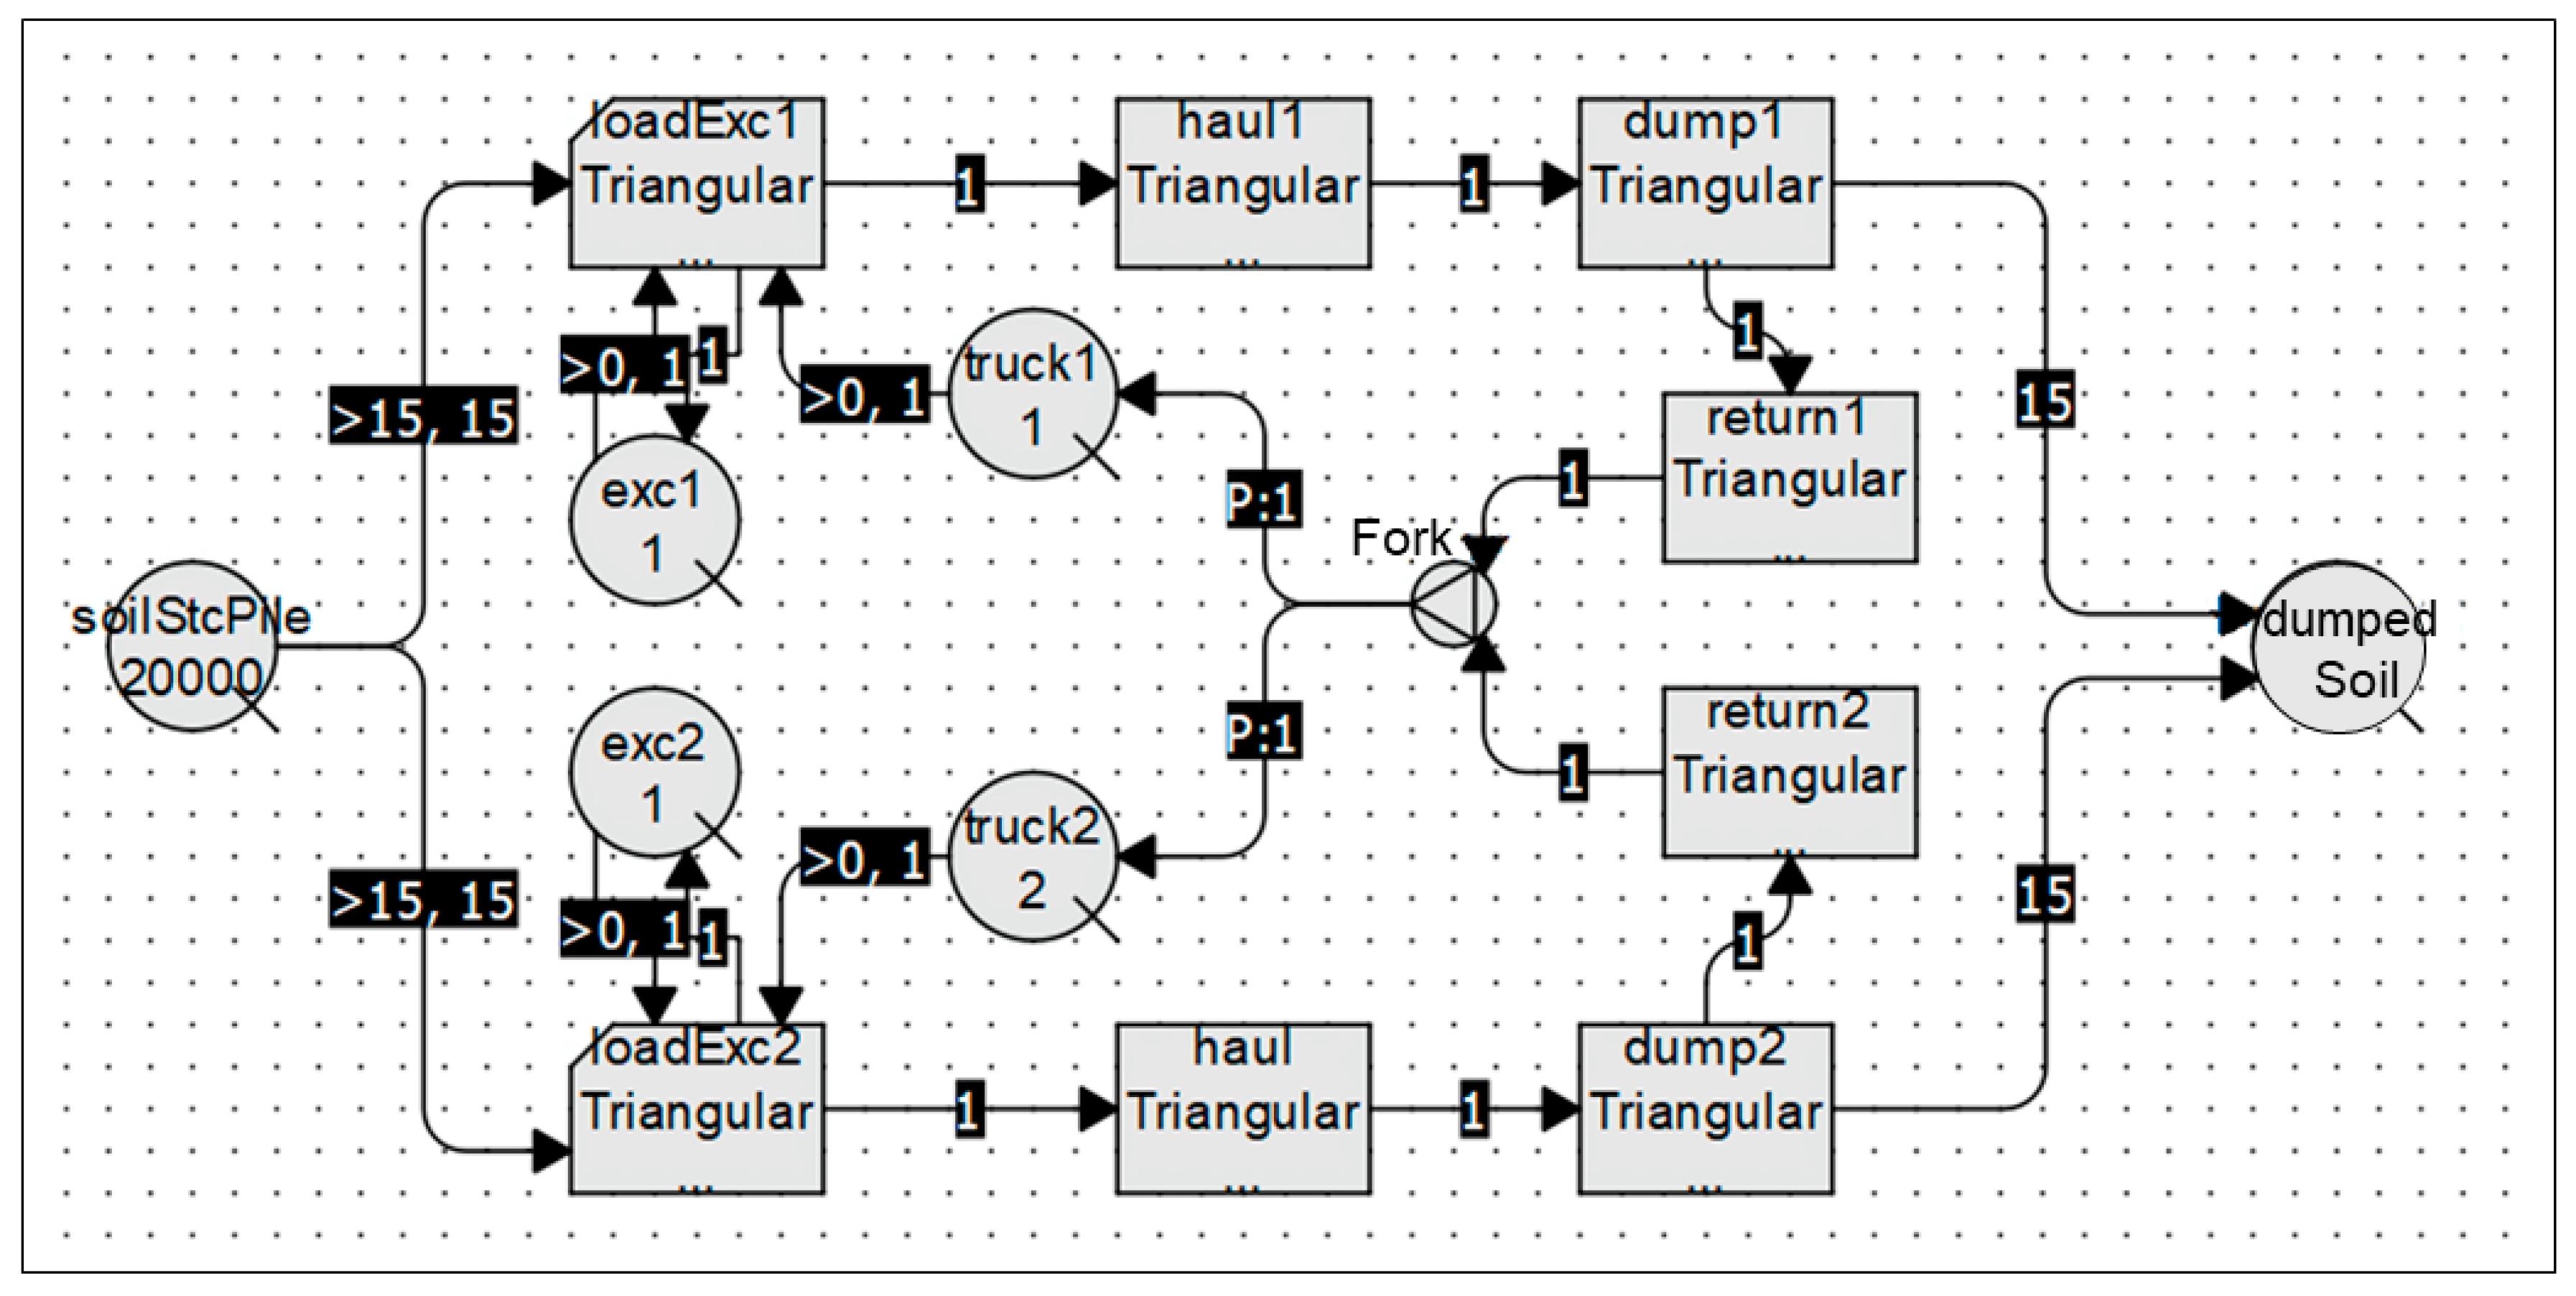
Once the underlying behavior of the operation is understood from the Petri net and the dependency graph, and cycle times are calculated, a model is built using a discrete event simulation software named jStrobe [17] (Louis & Dunston, 2016). This is a construction-oriented discrete event simulation package that allows the user to model earthmoving operations as a chronological sequence of events with the help of a user-friendly graphical interface. jStrobe allows the user to model a variety of different operations using different levels of detail. Figure 12 shows the complete DES model. The relationship between activities is defined from the discovered process (i.e., Petri net) and the primary input to the model is the distribution of cycle times. The primary three components of the DES model are queue, activity, and link. Queues are nodes holding the resources until any activity draws them away and are denoted by circular shape. It can be in Figure 12 that the number of trucks (e.g., denoted as ‘truck1’ and ‘truck2’), and excavators (e.g., denoted as ‘exc1’ and ‘exc2’) are modeled using queues. These four queues represent the four placeholders for these resources. Moreover, the soil stockpile, as well as the dumped soil, is also modeled using queues. Activities are nodes that represent the tasks to be performed in the model using the required resources. There are two types of activities, combi and normal. Combis are activities whose startup depends on certain conditions being met, denoted by rectangles with a beveled corner. On the other hand, Normals are activities that start starts as soon as the preceding activity is completed and are denoted by the rectangular symbol. In Figure 12, the loading with excavator 1 (‘loadExc1’) can only start when there are resources in the ‘truck1’ and ‘exc1’ queues. Each activity has a time duration that follows a distribution, and in this paper, a ‘triangular’ distribution is used for the cycle time of the activities. The third major component of the DES model is linked. The different nodes in the network are connected by links. The resources from one node to another are passed through the links by meeting certain conditions. For example, in Figure 13, when there is more than one truck in the ‘truck1’ queue, the ‘loadExc1’ activity pulls one truck through the link. Once the baseline DES model is created, this is further updated using the Bayesian updating method as the project progresses.
4.5. Bayesian Updating
It was assumed that total of 20,000 cubic yards of soil needed to be moved from the cut areas to the fill area. As data could be obtained from three trucks (out of five), it was also assumed that the project was run by only three trucks instead of five. The initial simulation predicted the project will be completed in 16 days. To match the project duration with the collected data, the activity durations were divided into 16 sub-sections, representing data from each day of the project.
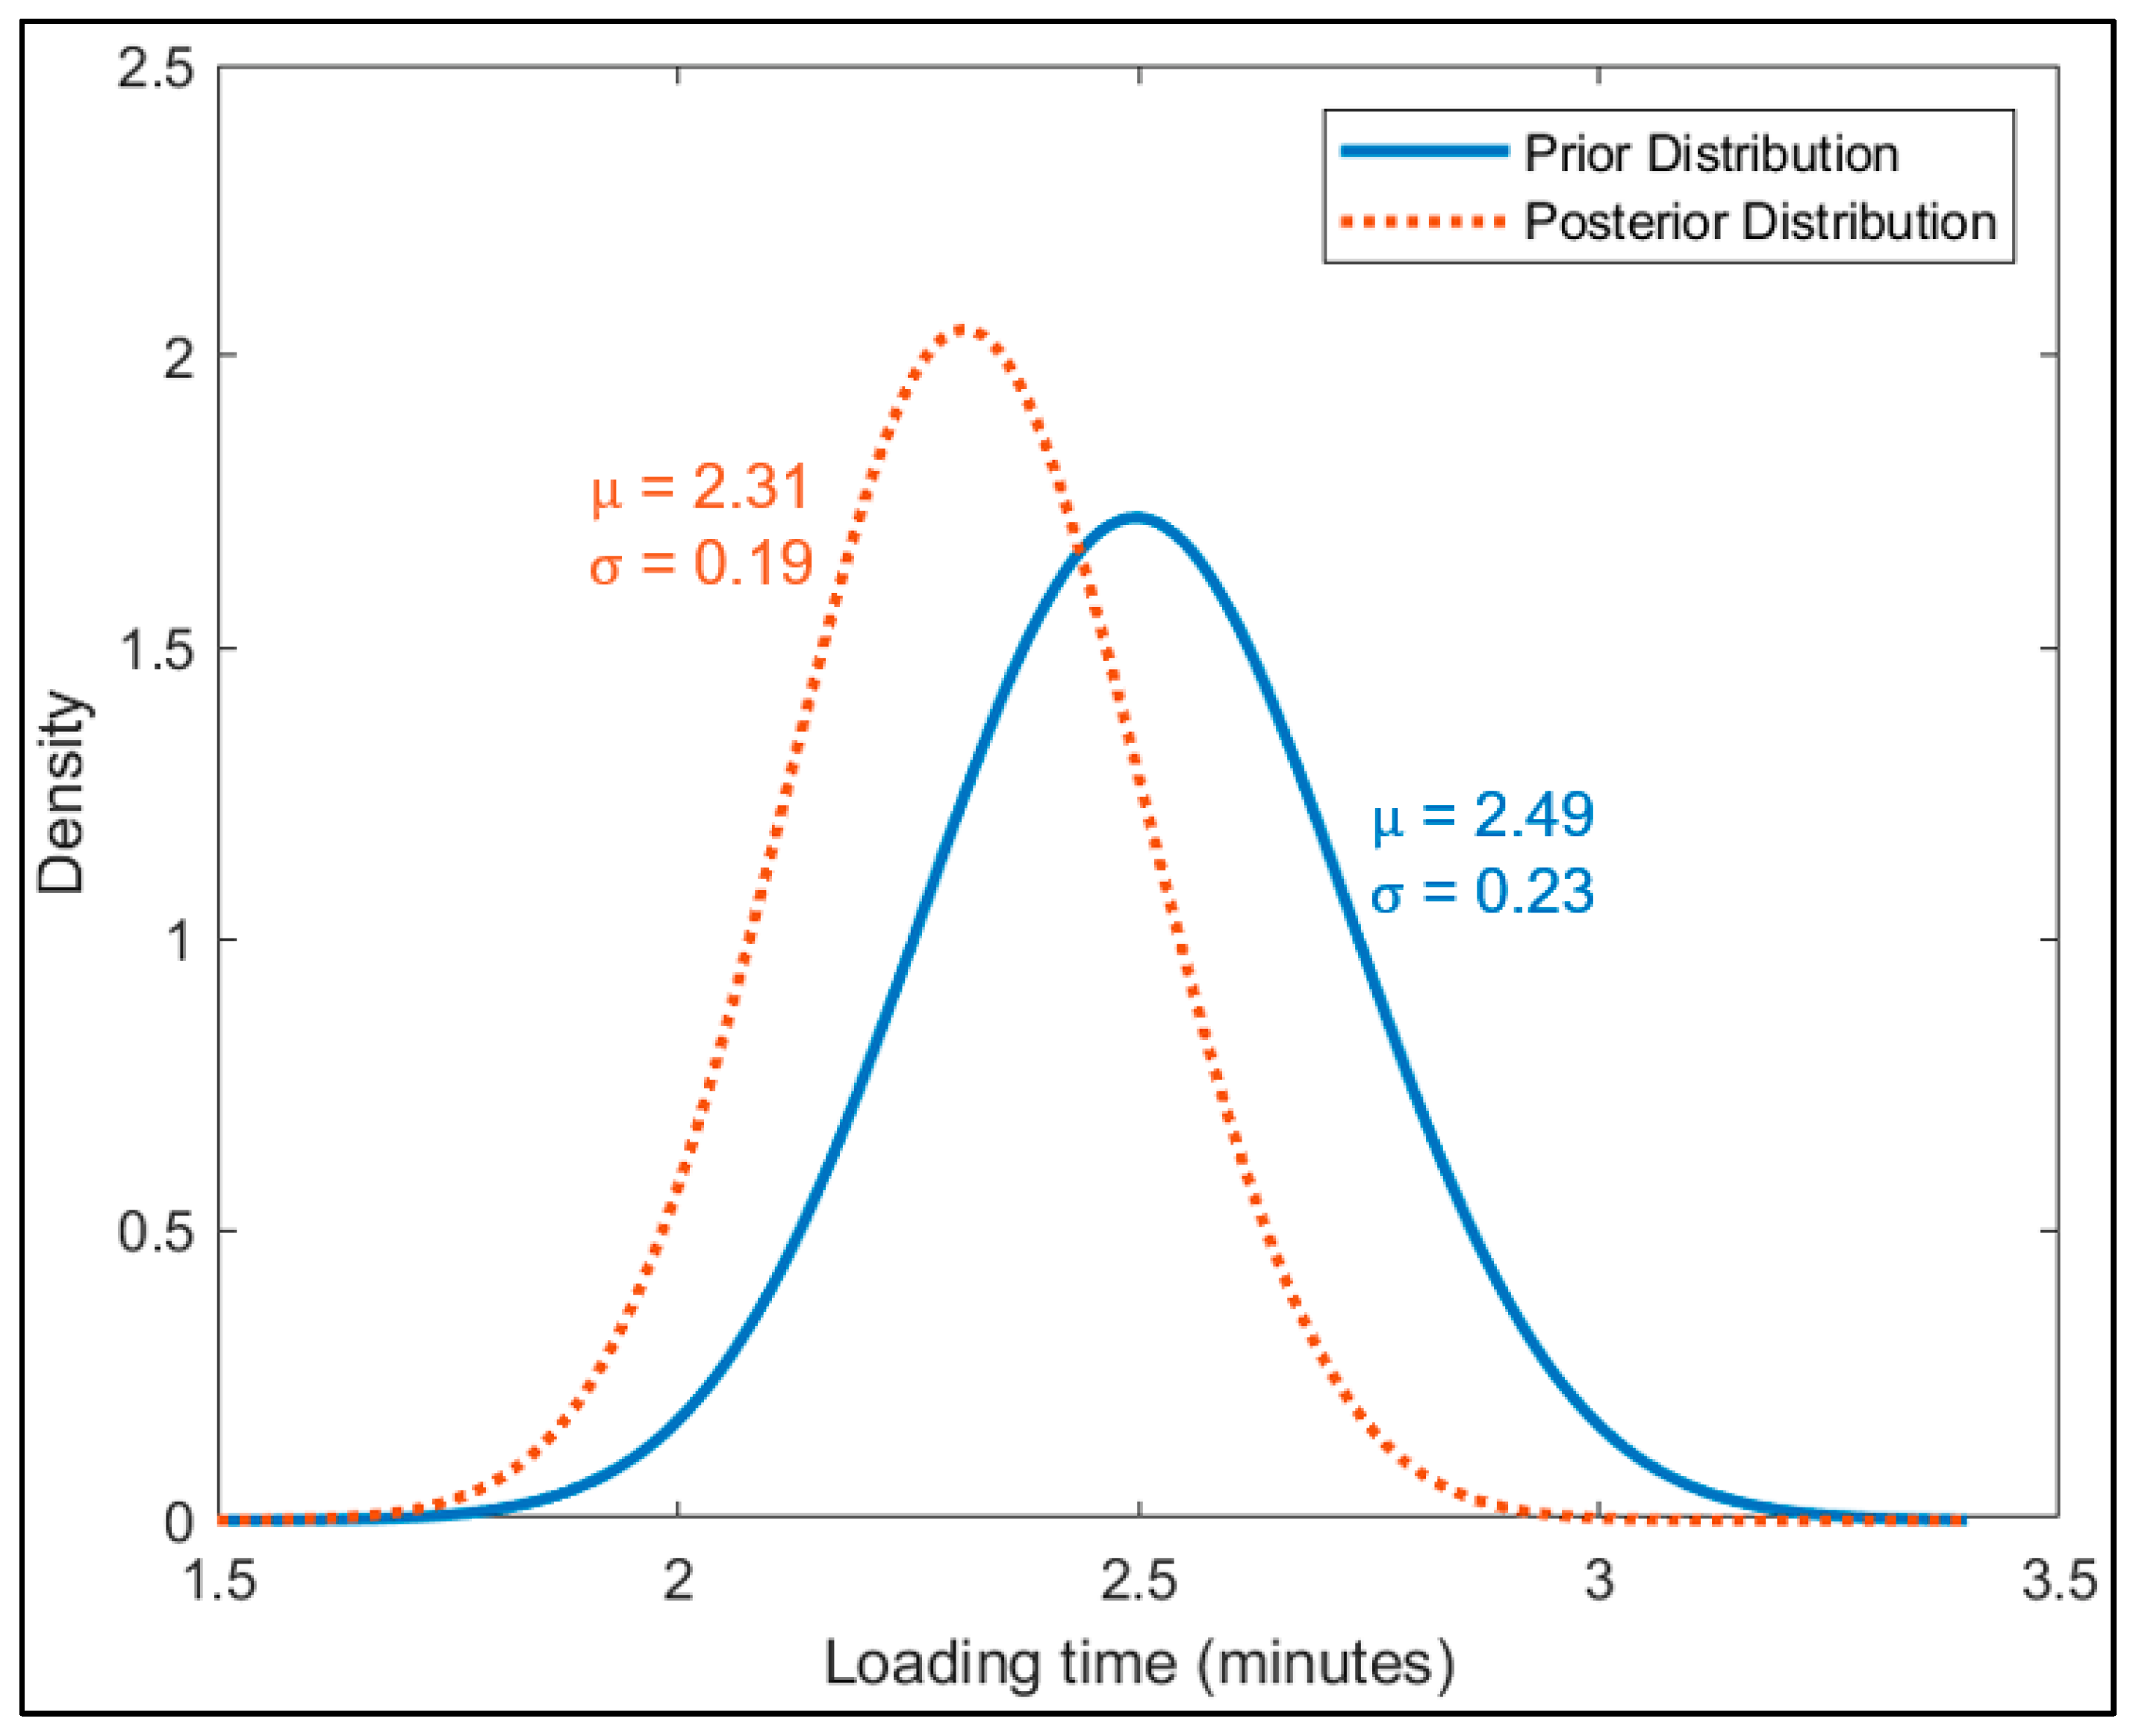
It was decided to update the model every 2 days using the most recent durations. To update the input parameters (i.e., activity durations), the Bayesian technique was used to combine the initial estimates and actual sample data as described in the Methodology section. Figure 14 shows the comparison of prior and posterior distribution updated on day 2 for the loading time. We see that the prior was a normal distribution with a mean of 2.49 and a standard deviation of 0.23, which was updated to a posterior with a mean of 2.31 and a standard deviation of 0.19. This calculation was done for each of the four activities. So, the next prediction of the DES model was obtained using these updated input parameters. This process was continued every 2 days to get an updated prediction from the simulation model.
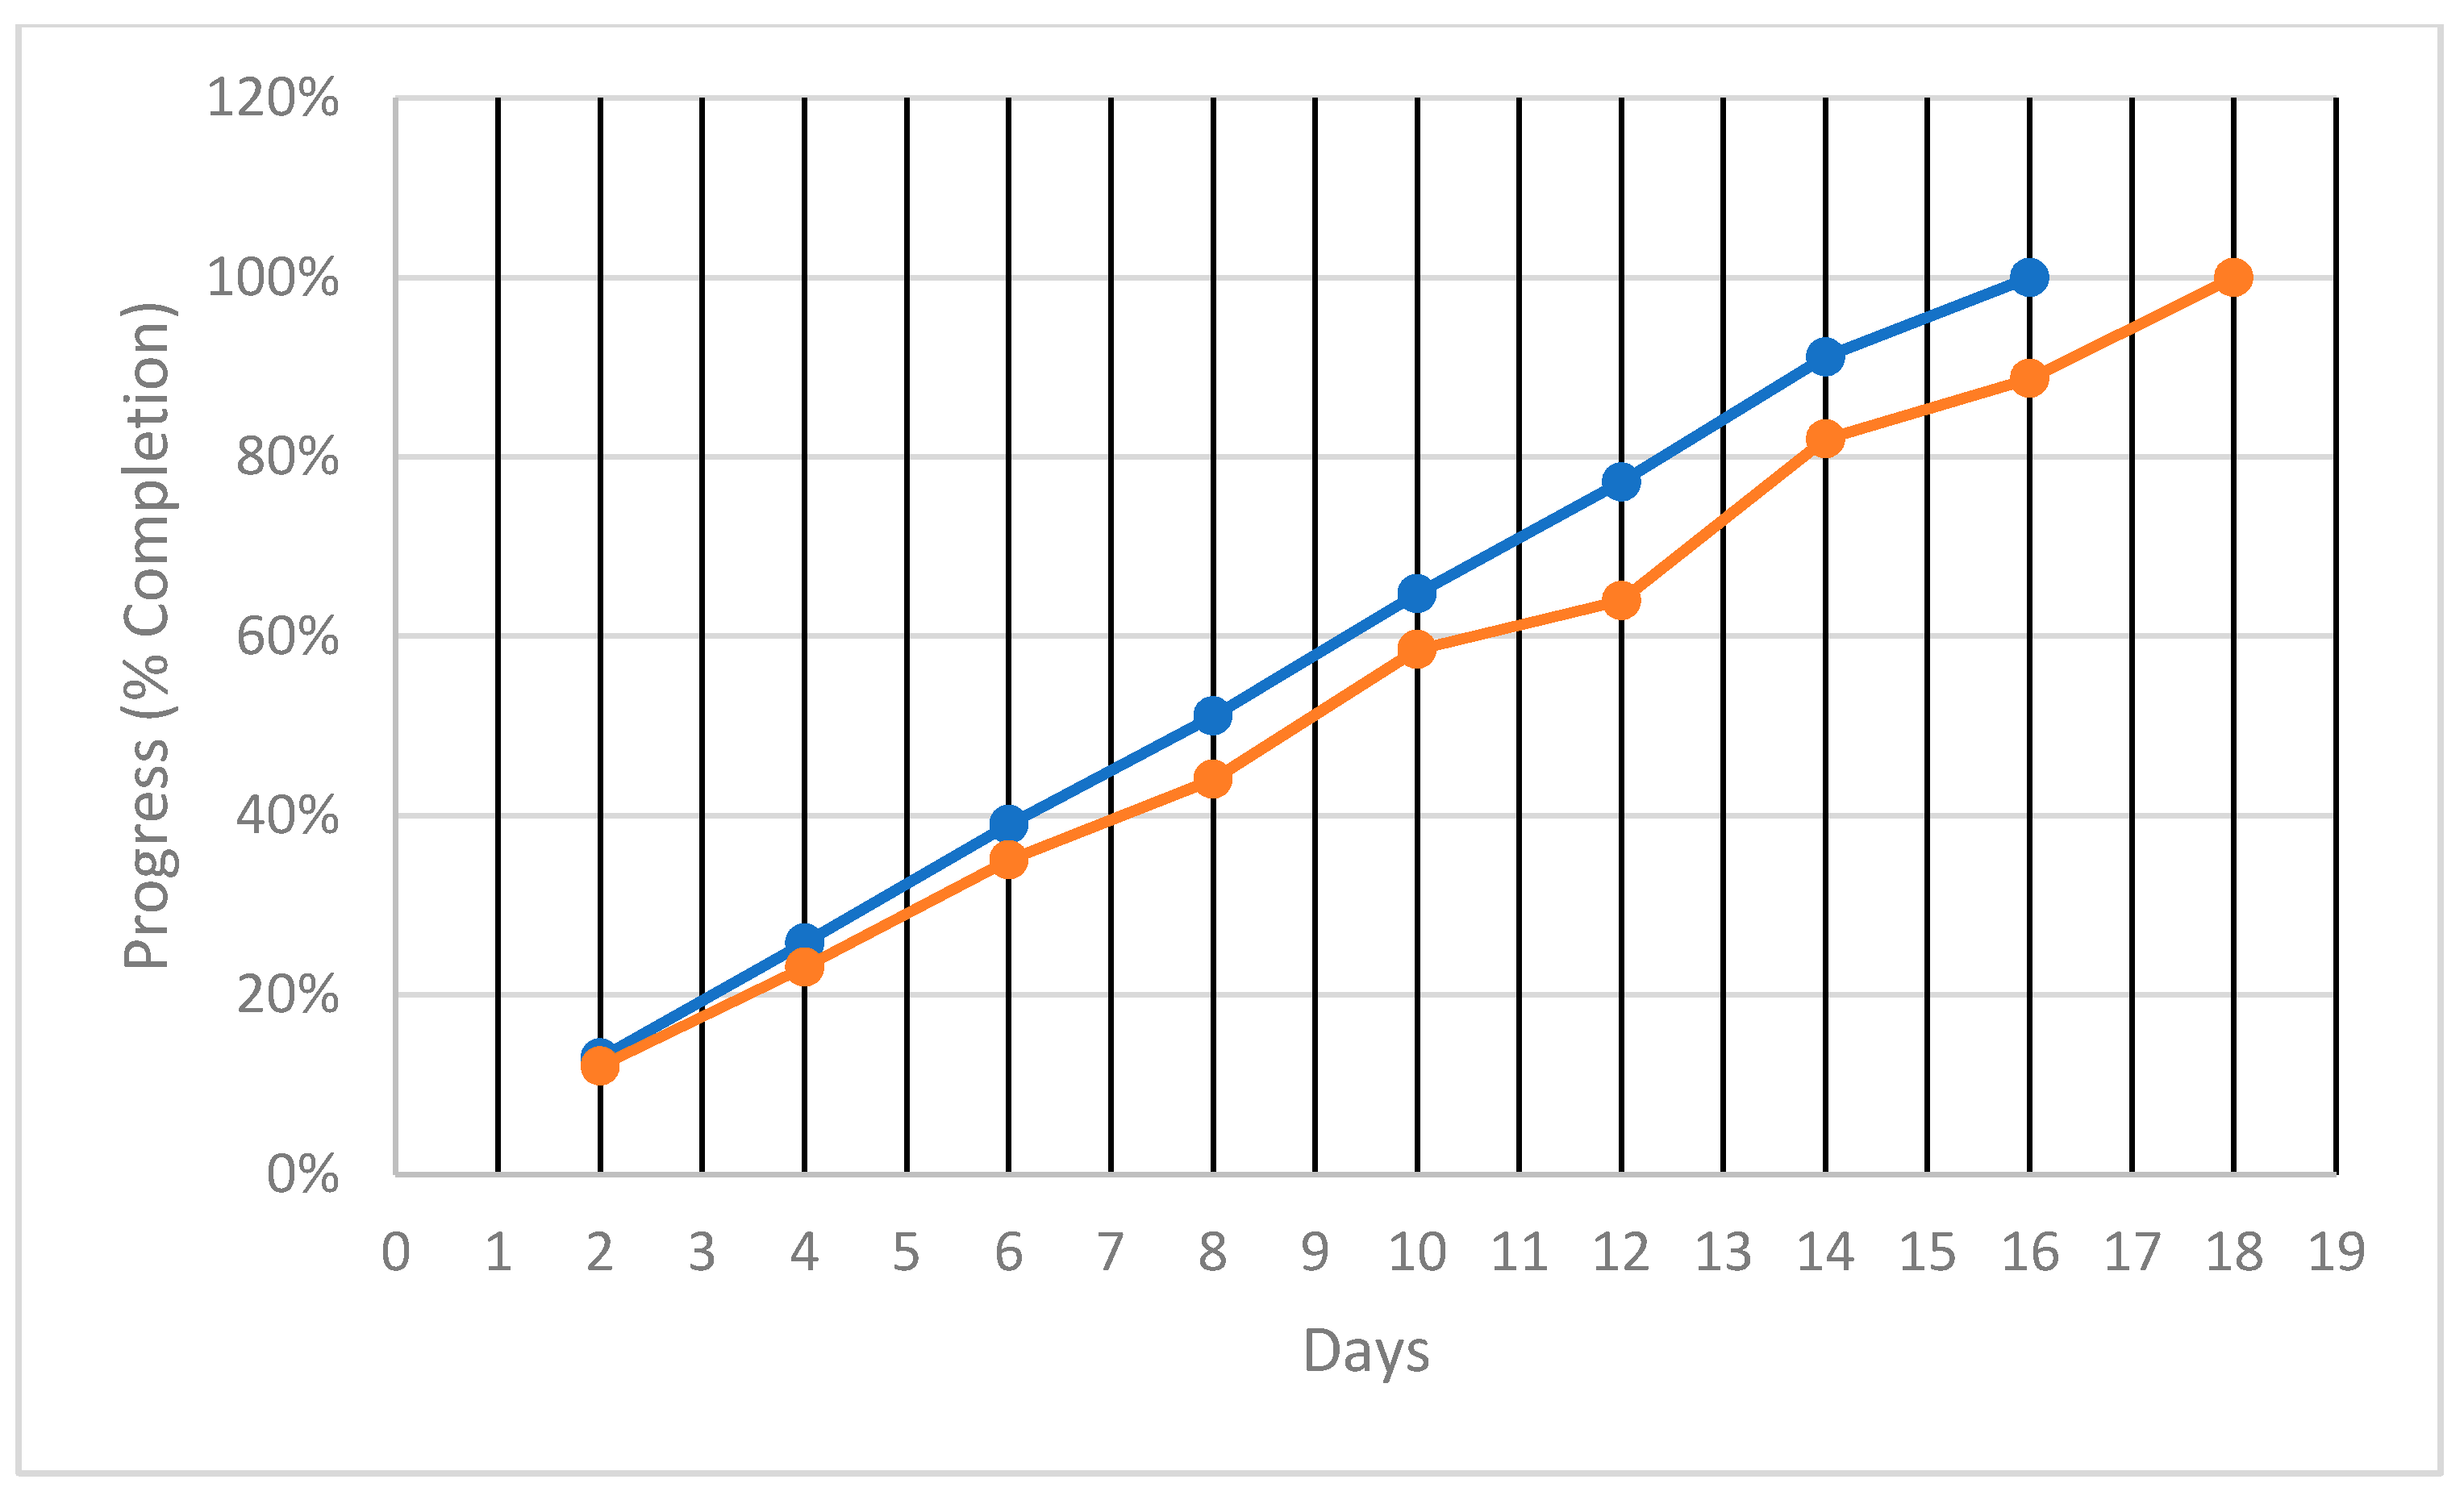
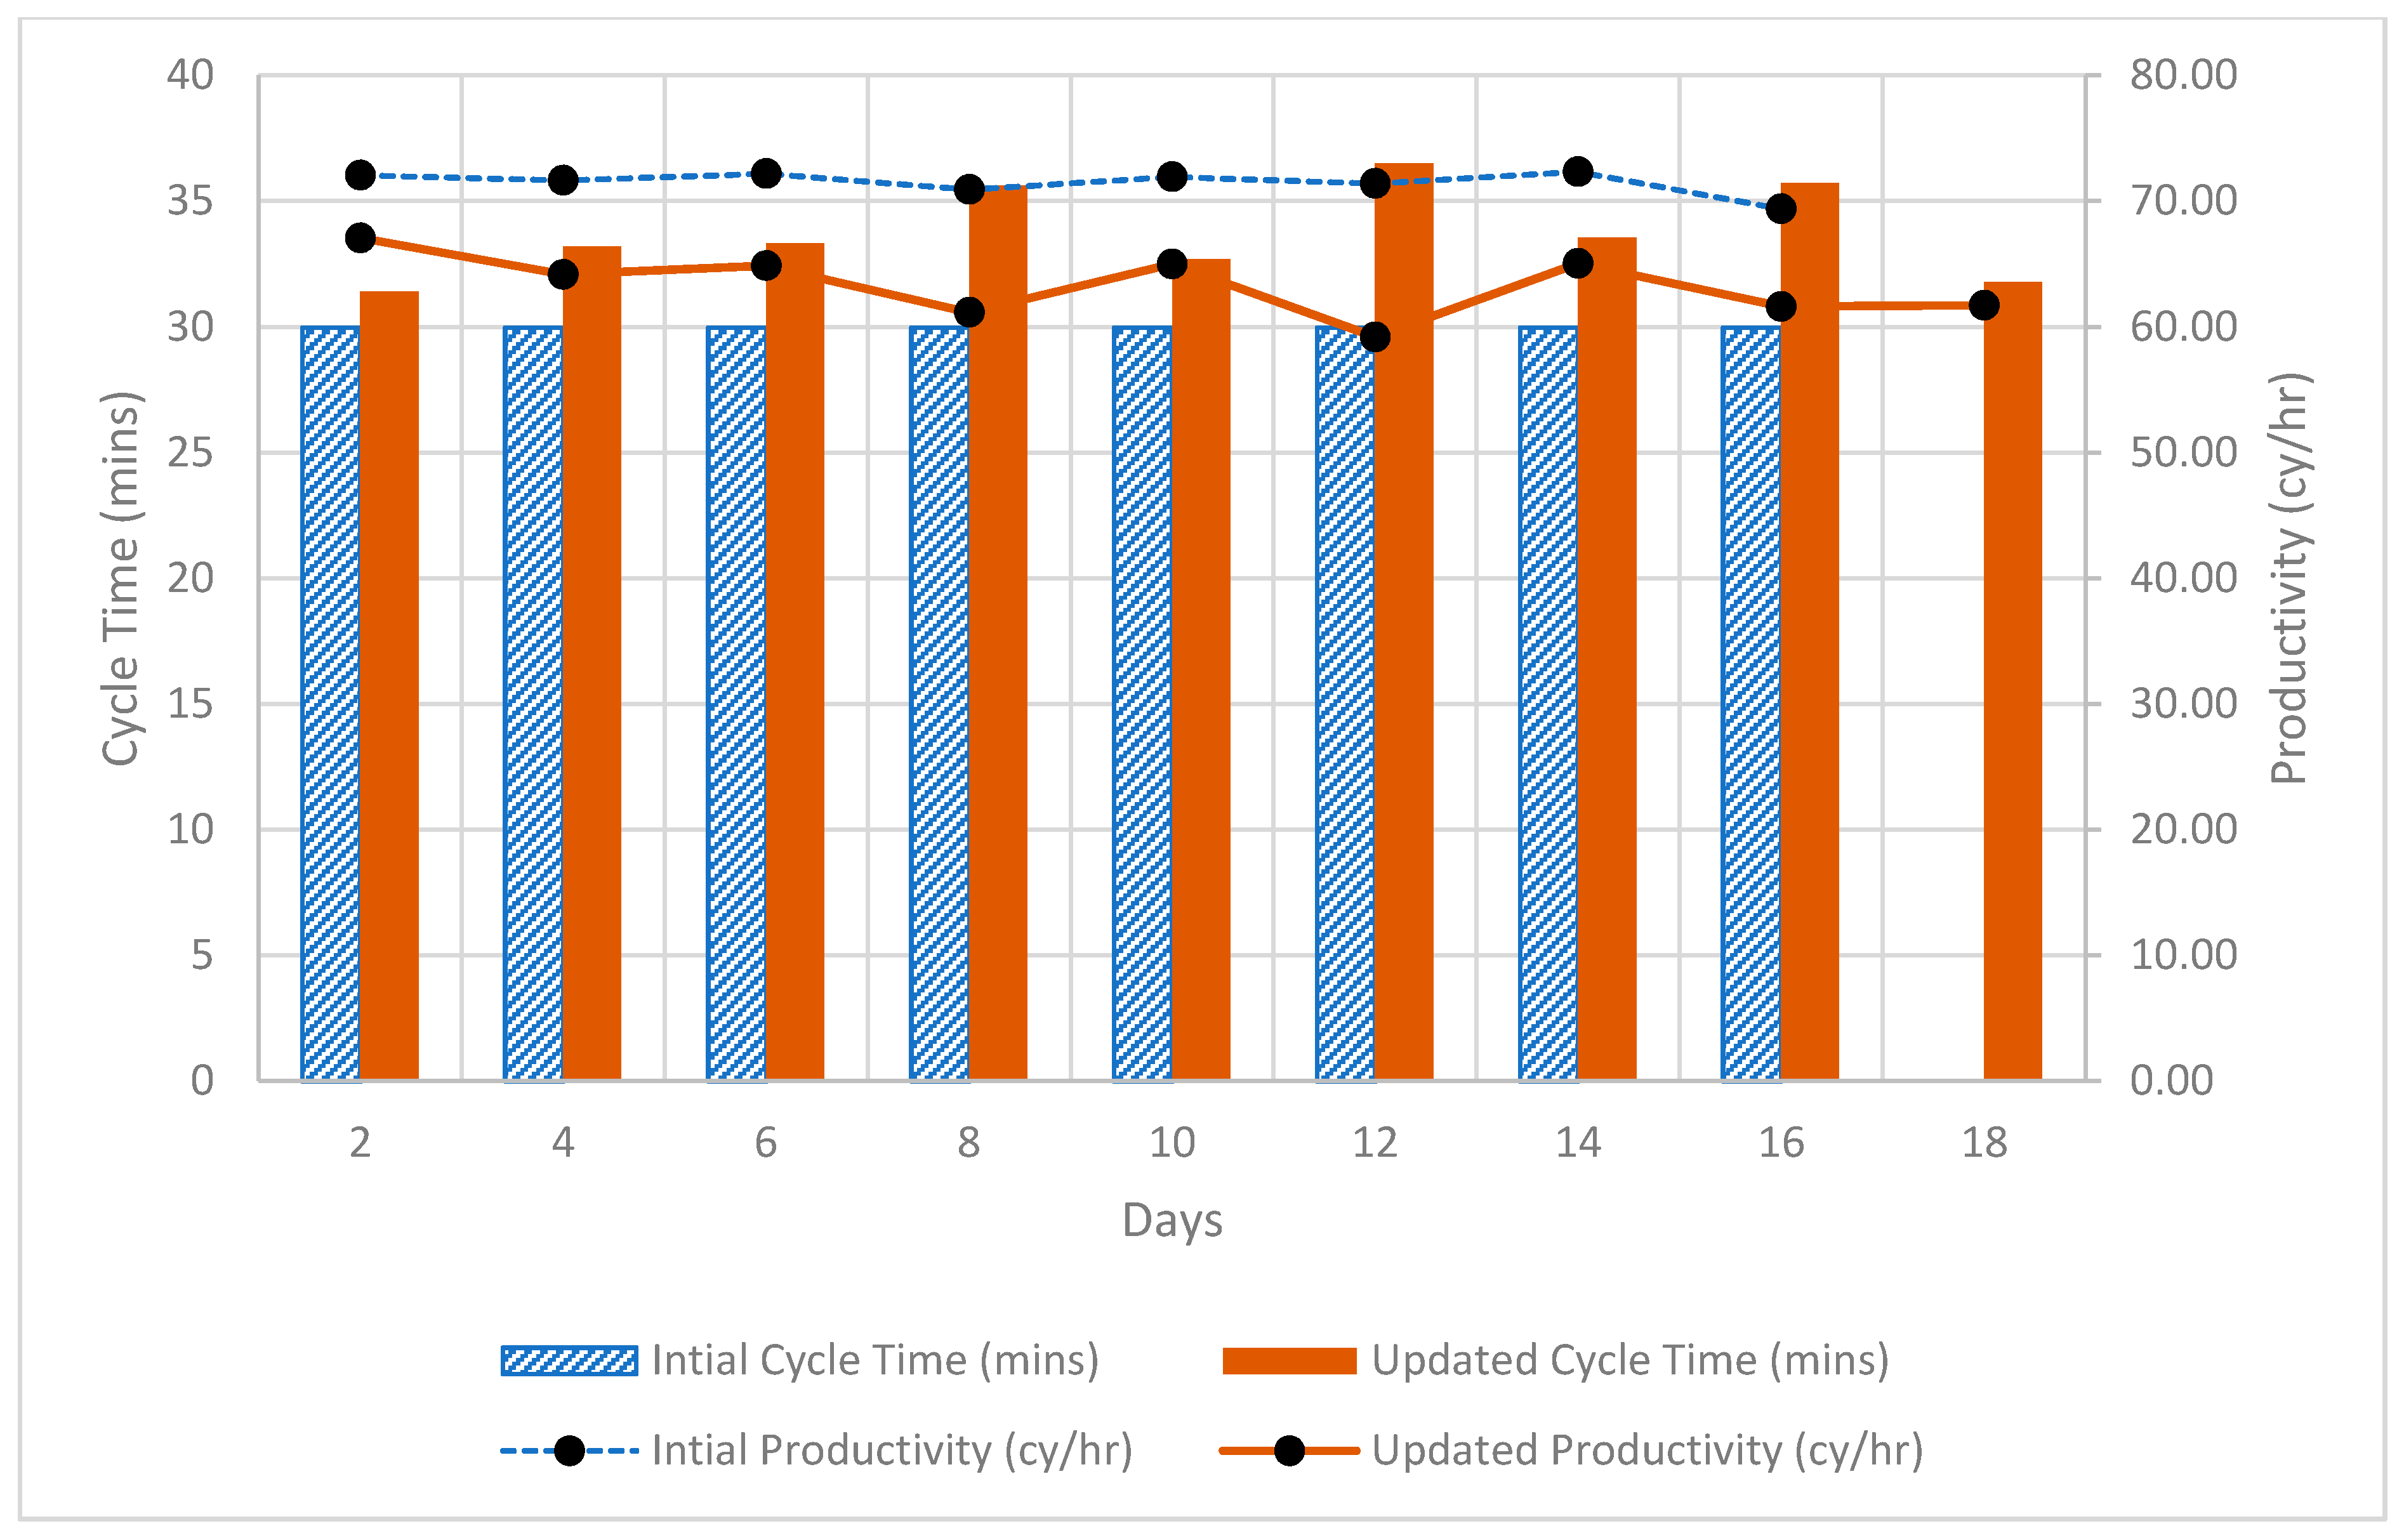
Figure 15 shows the percent completion of the project using a static prediction at the beginning (i.e., at day zero) of the project and dynamic prediction using the updated (at every 2 days) cycle times from the Bayesian update. The static simulation shows that the total project completion time was 16 days. However, when the cycle times were updated using the Bayesian updating technique and used as inputs in the simulation model, the project completion time was extended to 18 days. Figure 16 shows how cycle times changed throughout the project compared to the initial estimates. Following the updated cycle time, the productivity also changed, and we see how the productivity decreased with increased cycle time in Figure 16.
Figure 15 and Figure 16 show that simulations conducted during the construction might provide more accurate and reliable predictions as they used the actual data from the site compared to the initial prediction. These results show that the Bayesian updating technique was successfully used to update the distribution of the input parameters. Moreover, it leads to the conclusion that updating the simulation model frequently with actual data collected from the field can improve the prediction of the project performance by eliminating uncertainty in the original assumption.
5. Conclusions
This paper presents a framework that uses process mining techniques to utilize the event data collected from the earthmoving site and discovers the process model. The process model was used to develop a DES model of the earthmoving operations. Furthermore, the Bayesian updating technique was used to update the input parameters of the DES model for an up-to-date and accurate productivity estimation based on field data. A real-world earthmoving operation was chosen as a case study. Field data were collected using IMU attached to the excavators and dump trucks. Previous works explained how deep learning techniques network was used to predict the activities of the equipment. Then the activity profile for all the resources was generated which recorded the events that happened on the site with their corresponding times. This was used as an event log, and the α-algorithm was used to discover the process model of the operation. A DES model was developed based on the process model. Cycle times calculated from the predicted activities were used as inputs in the DES simulation model. Bayesian techniques were used to update the distribution of the input parameters of the simulation model. This demonstrates a formal approach to combining original estimates with the sample data collected from the site. The updated simulation prediction shows an increase in cycle times compared to the initial predictions as the project progresses. This shows reduced productivity, and the project duration was predicted to extend by 2 days compared to the initial prediction. These results can be used as a guideline to control the project cost and schedule.
This research contributes to the body of knowledge by demonstrating the capability of process mining and the DES model to accurately mimic the real-life operation of construction sites. The presented framework can facilitate the decision-making process by simulating the most up-to-date field conditions. Moreover, the study contributes to the practice by presenting an integrated framework that contains an activity identification model for heavy civil equipment, process mining, and a DES model simulating earthmoving operations. This provides a platform to automatically monitor the activities as well as estimate productivity by utilizing the most recent information.
In this paper, process mining was used only for discovering the process model. Future studies will investigate other capabilities of process mining such as deviation detection, and bottleneck identification for construction operations. Moreover, the case study was performed only using data from the excavator and dump trucks. The future study can expand this work by including other earthmoving equipment (e.g., loader, scraper, grader, etc.) to capture the complex dynamics of typical heavy civil operations.
Author Contributions
Conceptualization, K.M.R. and J.L.; methodology, K.M.R. and J.L.; software, K.M.R. and J.L.; validation, K.M.R.; formal analysis, K.M.R. and J.L.; investigation, K.M.R. and J.L.; resources, J.L.; data curation, K.M.R.; writing—original draft preparation, K.M.R.; writing—review and editing, J.L.; visualization, K.M.R.; supervision, J.L.; project administration, J.L. All authors have read and agreed to the published version of the manuscript.
Funding
This research received no external funding.
Institutional Review Board Statement
Not applicable.
Informed Consent Statement
Not applicable.
Data Availability Statement
The data presented in this study are available on request from the corresponding author. The data are not publicly available due to confidentiality agreement with construction project owners from where data was collected.
Conflicts of Interest
The authors declare no conflict of interest.
References
- Martinez, J.C. Methodology for Conducting Discrete-Event Simulation Studies in Construction Engineering and Management. J. Constr. Eng. Manag. 2010, 136, 3–16. [Google Scholar] [CrossRef]
- Van der Aalst, W. Data science in action. In Process Mining; Springer: Berlin/Heidelberg, Germany, 2016; pp. 3–23. [Google Scholar] [CrossRef]
- Leite, F.; Cho, Y.; Behzadan, A.H.; Lee, S.; Choe, S.; Fang, Y.; Akhavian, R.; Hwang, S. Visualization, Information Modeling, and Simulation: Grand Challenges in the Construction Industry. J. Comput. Civ. Eng. 2016, 30, 04016035. [Google Scholar] [CrossRef] [Green Version]
- Rozinat, A.; Mans, R.; Song, M.; van der Aalst, W. Discovering simulation models. Inf. Syst. 2009, 34, 305–327. [Google Scholar] [CrossRef] [Green Version]
- Liu, S. Integrating Process Mining with Discrete-Event Simulation Integrating Process Mining with Discrete-Event Simulation Modeling Modeling. 2015. Available online: https://scholarsarchive.byu.edu/etd (accessed on 20 March 2022).
- Szimanski, F.; Ralha, C.G.; Wagner, G.; Ferreira, D.R. Improving Business Process Models with Agent-Based Simulation and Process Mining. Lect. Notes Bus. Inf. Process. 2013, 147, 124–138. [Google Scholar] [CrossRef] [Green Version]
- Aguirre, S.; Parra, C.; Alvarado, J. Combination of Process Mining and Simulation Techniques for Business Process Redesign: A Methodological Approach. In Lecture Notes in Business Information Processing; Springer: Berlin/Heidelberg, Germany, 2013; Volume 162, pp. 24–43. [Google Scholar] [CrossRef] [Green Version]
- Teinemaa, I.; Dumas, M.; Rosa, M.L.; Maggi, F.M. Outcome-oriented predictive process monitoring: Review and benchmark. ACM Trans. Knowl. Discov. Data 2019, 13, 1–57. [Google Scholar] [CrossRef]
- Norambuena, B.K. Integration of Process Mining and Simulation: A Survey of Applications and Current Research. In Trends and Advances in Information Systems and Technologies; Springer: Cham, Switzerland, 2018; pp. 287–294. [Google Scholar] [CrossRef]
- Ahn, S.; Dunston, P.S.; Kandil, A.; Martínez, J.C. Process Mining Technique for Automated Simulation Model Generation Using Activity Log Data. Comput. Civ. Eng. 2015, 2015, 636–643. [Google Scholar] [CrossRef]
- Van Schaijk, S.; van Berlo, L.A.H.M. Introducing process mining for AECFM: Three experimental case studies. In Ework and Ebusiness in Architecture, Engineering and Construction; CRC Press: Boca Raton, FL, USA, 2016; pp. 481–486. [Google Scholar]
- Kropp, T.; Bombeck, A.; Lennerts, K. An approach to data driven process discovery in the cost estimation process of a construction company. In Proceedings of the International Symposium on Automation and Robotics in Construction, Dubai, United Arab Emirates, 2–4 November 2021; pp. 893–900. [Google Scholar] [CrossRef]
- Van Schaijk, S. Building Information Model (BIM) Based Process Mining. 2016. Available online: https://0-doi-org.brum.beds.ac.uk/10.13140/RG.2.1.2276.9047 (accessed on 12 February 2022).
- Xiaoyu, H.; Shunxiang, W. Vista event log file parsing based on XML technology. In Proceedings of the 2009 4th International Conference on Computer Science & Education, Nanning, China, 25–28 July 2009; p. 1186. [Google Scholar]
- Rashid, K.M.; Louis, J. Process discovery and conformance checking in modular construction using RFID and process mining. In Construction Research Congress 2020: Computer Applications; American Society of Civil Engineers: Reston, VA, USA, 2020; pp. 640–648. [Google Scholar] [CrossRef]
- Gao, W.; Wu, C.; Huang, W.; Lin, B.; Su, X. A data structure for studying 3D modeling design behavior based on event logs. Autom. Constr. 2021, 132, 103967. [Google Scholar] [CrossRef]
- Brzychczy, E. An Overview of Data Mining and Process Mining Applications in Underground Mining. Inżynieria Miner. 2019, 1, 21. [Google Scholar] [CrossRef]
- Louis, J.; Dunston, P.S. Methodology for Real-Time Monitoring of Construction Operations Using Finite State Machines and Discrete-Event Operation Models. J. Constr. Eng. Manag. 2017, 143, 04016106. [Google Scholar] [CrossRef]
- Akhavian, R.; Behzadan, A.H. Knowledge-Based Simulation Modeling of Construction Fleet Operations Using Multimodal-Process Data Mining. J. Constr. Eng. Manag. 2013, 139, 04013021. [Google Scholar] [CrossRef] [Green Version]
- Akhavian, R.; Behzadan, A.H. Construction equipment activity recognition for simulation input modeling using mobile sensors and machine learning classifiers. Adv. Eng. Inform. 2015, 29, 867–877. [Google Scholar] [CrossRef]
- Lu, W.; Olofsson, T. Building information modeling and discrete event simulation: Towards an integrated framework. Autom. Constr. 2014, 44, 73–83. [Google Scholar] [CrossRef]
- Vahdatikhaki, F.; Hammad, A.; Setayeshgar, S. Real-time simulation of earthmoving projects using automated machine guidance. In Proceedings of the International Symposium on Automation and Robotics in Construction, Montreal, QC, Canada, 15 August 2013; p. 1. [Google Scholar]
- Ruwanpura, J.Y.; Ariaratnam, S.T. Simulation modeling techniques for underground infrastructure construction processes. Tunn. Undergr. Space Technol. 2007, 22, 553–567. [Google Scholar] [CrossRef]
- Ioannou, P.G.; Martinez, J.C. Comparison of Construction Alternatives Using Matched Simulation Experiments. J. Constr. Eng. Manag. 1996, 122, 231–241. [Google Scholar] [CrossRef] [Green Version]
- González, V.; Echaveguren, T. Exploring the environmental modeling of road construction operations using discrete-event simulation. Autom. Constr. 2012, 24, 100–110. [Google Scholar] [CrossRef]
- Chen, S.-M.; Griffis, F.; Chen, P.-H.; Chang, L.-M. Simulation and analytical techniques for construction resource planning and scheduling. Autom. Constr. 2012, 21, 99–113. [Google Scholar] [CrossRef]
- Zhang, H.; Zhai, D.; Yang, Y.N. Simulation-based estimation of environmental pollutions from construction processes. J. Clean. Prod. 2014, 76, 85–94. [Google Scholar] [CrossRef]
- Chan, W.-H.; Lu, M. Materials Handling System Simulation in Precast Viaduct Construction: Modeling, Analysis, and Implementation. J. Constr. Eng. Manag. 2008, 134, 300–310. [Google Scholar] [CrossRef]
- Rashid, K.M.; Louis, J. Times-series data augmentation and deep learning for construction equipment activity recognition. Adv. Eng. Inform. 2019, 42, 100944. [Google Scholar] [CrossRef]
- Ang, A.H.-S.; Tang, W.H. Probability Concepts in Engineering Planning and Design: Basic Principles, Volume 1; John Wiley & Sons: Hoboken, NJ, USA, 1975; pp. 329–359. [Google Scholar]
Figure 1.
The classical use of simulation.

Figure 2.
Integrating process mining and simulation for performance analysis.

Figure 3.
Framework for data-driven decision making.

Figure 4.
Activity profile of a dump truck.

Figure 5.
Schematic layout of the earthmoving site.

Figure 6.
IMU attachment to dump truck and excavator.

Figure 7.
Count of identified activities.

Figure 8.
Activity profile of three trucks.

Figure 9.
Discovered Petri net using α-algorithm.

Figure 10.
Process discovery using heuristic miner.

Figure 11.
Cycle time durations of dump trucks.

Figure 12.
Distribution of loading time.

Figure 13.
DES model of the earthmoving operations.

Figure 14.
Prior and posterior normal distribution of the loading time after day 2.

Figure 15.
Percent completion of the project with initial vs. updated prediction.

Figure 16.
Cycle times and productivities using initial and updated cycle times.


Table 1.
Summary of the event classes with their absolute and relative occurrence.
| Class | Absolute Occurrence | Relative Occurrence |
|---|---|---|
| Haul | 32 | 21.5% |
| Return | 32 | 21.5% |
| Dump | 32 | 21.5% |
| LdExc1 | 16 | 10.7% |
| LdExc2 | 16 | 10.7% |
| WtExc1 | 8 | 5.4% |
| WtExc2 | 7 | 4.7% |
| Wt2Dmp | 4 | 2.7% |
| Wt2Ret | 2 | 1.3% |
Table 2.
Footprint of the event log showing the relationship between activities.
| WtExc1 | WtExc2 | LdExc1 | LdExc2 | Haul | Wt2Dmp | Dump | Wt2Ret | Return | |
|---|---|---|---|---|---|---|---|---|---|
| WtExc1 | # | || | → | # | # | # | # | # | # |
| WtExc2 | || | # | # | → | # | # | # | # | # |
| LdExc1 | # | # | # | || | → | # | # | # | # |
| LdExc2 | # | # | || | # | → | # | # | # | # |
| Haul | # | # | # | # | # | → | → | # | # |
| Wt2Dmp | # | # | # | # | # | # | → | # | # |
| Dump | # | # | # | # | # | # | # | → | → |
| Wt2Ret | # | # | # | # | # | # | # | # | → |
| Return | → | → | # | # | # | # | # | # | # |
Table 3.
The mean and standard deviation of each activity.
| Activity | Duration (Minutes) | |
|---|---|---|
| Mean | Std. Dev. | |
| Loading | 2.49 | 0.23 |
| Hauling | 15.02 | 1.77 |
| Dumping | 0.83 | 0.18 |
| Returning | 15.55 | 2.76 |
Publisher’s Note: MDPI stays neutral with regard to jurisdictional claims in published maps and institutional affiliations. |
© 2022 by the authors. Licensee MDPI, Basel, Switzerland. This article is an open access article distributed under the terms and conditions of the Creative Commons Attribution (CC BY) license (https://creativecommons.org/licenses/by/4.0/).
Share and Cite
MDPI and ACS Style
Rashid, K.M.; Louis, J. Integrating Process Mining with Discrete-Event Simulation for Dynamic Productivity Estimation in Heavy Civil Construction Operations. Algorithms 2022, 15, 173. https://0-doi-org.brum.beds.ac.uk/10.3390/a15050173
AMA Style
Rashid KM, Louis J. Integrating Process Mining with Discrete-Event Simulation for Dynamic Productivity Estimation in Heavy Civil Construction Operations. Algorithms. 2022; 15(5):173. https://0-doi-org.brum.beds.ac.uk/10.3390/a15050173
Chicago/Turabian StyleRashid, Khandakar M., and Joseph Louis. 2022. "Integrating Process Mining with Discrete-Event Simulation for Dynamic Productivity Estimation in Heavy Civil Construction Operations" Algorithms 15, no. 5: 173. https://0-doi-org.brum.beds.ac.uk/10.3390/a15050173
Note that from the first issue of 2016, this journal uses article numbers instead of page numbers. See further details here.