Article

Geographical Distribution and Environmental Correlates of Eleutherosides and Isofraxidin in Eleutherococcus senticosus from Natural Populations in Forests at Northeast China

1
College of Pharmacy, Heilongjiang University of Chinese Medicine, Harbin 150040, China
2
Northeast Institute of Geography and Agroecology, Chinese Academy of Sciences, Changchun 130120, China
*
Author to whom correspondence should be addressed.
These authors contributed equally.
Submission received: 31 July 2019 / Revised: 26 September 2019 / Accepted: 27 September 2019 / Published: 4 October 2019
(This article belongs to the Special Issue Forest, Foods and Nutrition)

Abstract

:
Non-wood forest products (NWFPs) derived from understory plants are attracting attention about sustainable forestry development. Geographical distribution and climate correlates of bioactive compounds are important to the regional management for the natural reserves of medical plants in forests. In this study, we collected Eleutherococcus senticosus individuals from 27 plots to map the special distribution of concentrations of eleutheroside B, eleutheroside E, and isofraxidin in forests of Northeast China. Compound concentrations in both aerial and underground organs were further detected for relationships with the average of 20-year records of temperature, precipitation, and relative humidity (RH). We found higher shoot eleutheroside B concentration in populations in northern and low-temperature regions (R = −0.4394; P = 0.0218) and in eastern and high-RH montane forests (R = 0.5003; P = 0.0079). The maximum-likelihood regression indicated that both RH (Pr > Chi-square, 0.0201) and longitude (Pr > Chi-square, 0.0026) had positive contributions to eleutheroside B concentration in roots, but precipitation had strongly negative contributions to the concentrations of eleutheroside E (Pr > Chi-square, 0.0309) and isofraxidin (Pr > Chi-square, 0.0014) in roots. Both geography and climate factors had effects on the special distribution of medical compounds in E. senticosus plants in natural populations in Northeast China. The management of NWFP plants at the regional scale should consider effects from climatic geography.

1. Introduction

Climate change is expected to drive the shift in structure and composition of forest ecosystems [1]. Forest vegetation is a critical player in land–atmosphere interactions by regulating the energy, water, and carbon cycles [2]. Over the last decades, it was found that growth of temperate forest vegetation is heavily dependent on rising temperature [3,4]. In contrast, the rising (CO2) consequence of this growth contributed to the increase of daily maximum temperature, which can reinforce the mean temperature increase in temperate forests [2]. Currently, both empirical models and field investigations have intensively detected the change of general vegetation in temperate forest ecosystems in the scenario with increasing temperature. Although plants in the understory plants are sensitive and adaptable to local environment conditions [5,6,7,8], their relationship with climatic factors has been less understood.
Many understory plants are of significant values in edible and medicine manufacture, which can be classified into the category of non-wood forest products (NWFPs). NWFPs are defined in this context as all the products other than woods derived from forests, shrubs, tree plantations, and trees outside forests [9,10]. NWFPs can be taken as a potential asset in forest management system generating socioeconomic benefits along the entire value-chain spanning rural development [11]. Increasing needs to touch nature and to consume forest products promote the international trade of NWFPs through countries and interest in NWFPs is growing in Europe and East Asia [9,11,12,13]. Because of the cover of tree canopy, it is unlikely to directly detect the relationship between NWFP plants and regional climate factors using the model with data about dominant trees. Therefore, it is of strong necessity to make field investigation for functional traits of NWFP plants to establish their responsive dataset. This consumes significant workload and time and much less is known about the response of NWFP plants to regional climate change.
Traditional culture of original stocks to produce NWFPs was conducted on farmland using cloth-shading at high density [14,15,16]. However, practices are accumulating to cultivate NWFP plants in forests at the understory layer where trees provide necessary shade and soils supply sufficient rhizosphere condition [13,15]. The forest-culture mode can further contribute to the conservation of natural forest ecosystem by fully exploiting the resource of the understory space. Mapping the distribution of natural populations can supply essential information for ecologically sustainable management of NWFP plants [17]. Environmental factors varied with geographical patterns which drive the spatial distribution of phenotype of local plants [5,18]. Therefore, to map the geographical distribution of traits of NWFP plants would benefit the illustration of adaption to location environment and further analyze the response to climate change.
Eleutherococcus senticosus is one of the NWFP species with thorny stem and branch which is also one of the best-known medical plants from the Araliaceae family. E. senticosus is also referred to as Acanthopanax senticosus as well with so-called names of Siberian ginseng in Europe and America, ciwujia in China, and gasiogapi in Korea [19]. E. senticosus is commonly used as an ingredient of folk medicines which have been documented in both Chinese and European pharmacopoeia [20]. Abundant content of multiple bioactive ingredients contributes to the medical value of E. senticosus. Eleutheroside B is the main effect compound due to antioxidant, immunomodulatory, and anti-inflammatory activities [21,22]. Eleutheroside E is another bioactive ingredient that has stress-protective activities. The structures of eleutherosides B and E are elucidated as lignans of syringin and acanthoside D, respectively (Figure 1). Isofraxidin (7-hydroxy-6,8-dimethoxycoumarin; Figure 1) has similar effect as eleutherosides and performs better in antifatigue and antistress [21]. Organs of stem, branch, and roots all had records to be detectable for these bioactive compounds [21,22]. Studies of environmental factors on metabolites are scattered and placed by limited attention. It was indicated that temperature in the range of 12–18 °C resulted in the accumulation of total phenolics, flavonoids, and eleutheroside E in E. senticosus [3,23]. These results suggest that the trait of metabolites in E. senticosus may be distributed with some geographical pattern by the driving of regional environmental factors. However, to the best of our knowledge, relevant evidence is quite scarce for either a geographical map of metabolites or clear relationship with environmental factors.
Forests in Northeast China reserve abundant amount of natural E. senticosus populations, which were chosen as the objectives of this study. We conducted a field investigation to collect aerial and below-ground organs to detect contents of eleutheroside B, eleutheroside E, and isofraxidin. The aim of the study was to map the special distribution of these bioactive compounds in forests of Northeast China and further detect the environmental correlates. With regard to the experimental results that eleutherosides accumulate in cooler temperature [3,23], it was hypothesized that metabolite content was higher in the northern part of the research region or in montane areas at higher elevations.

2. Materials and Methods
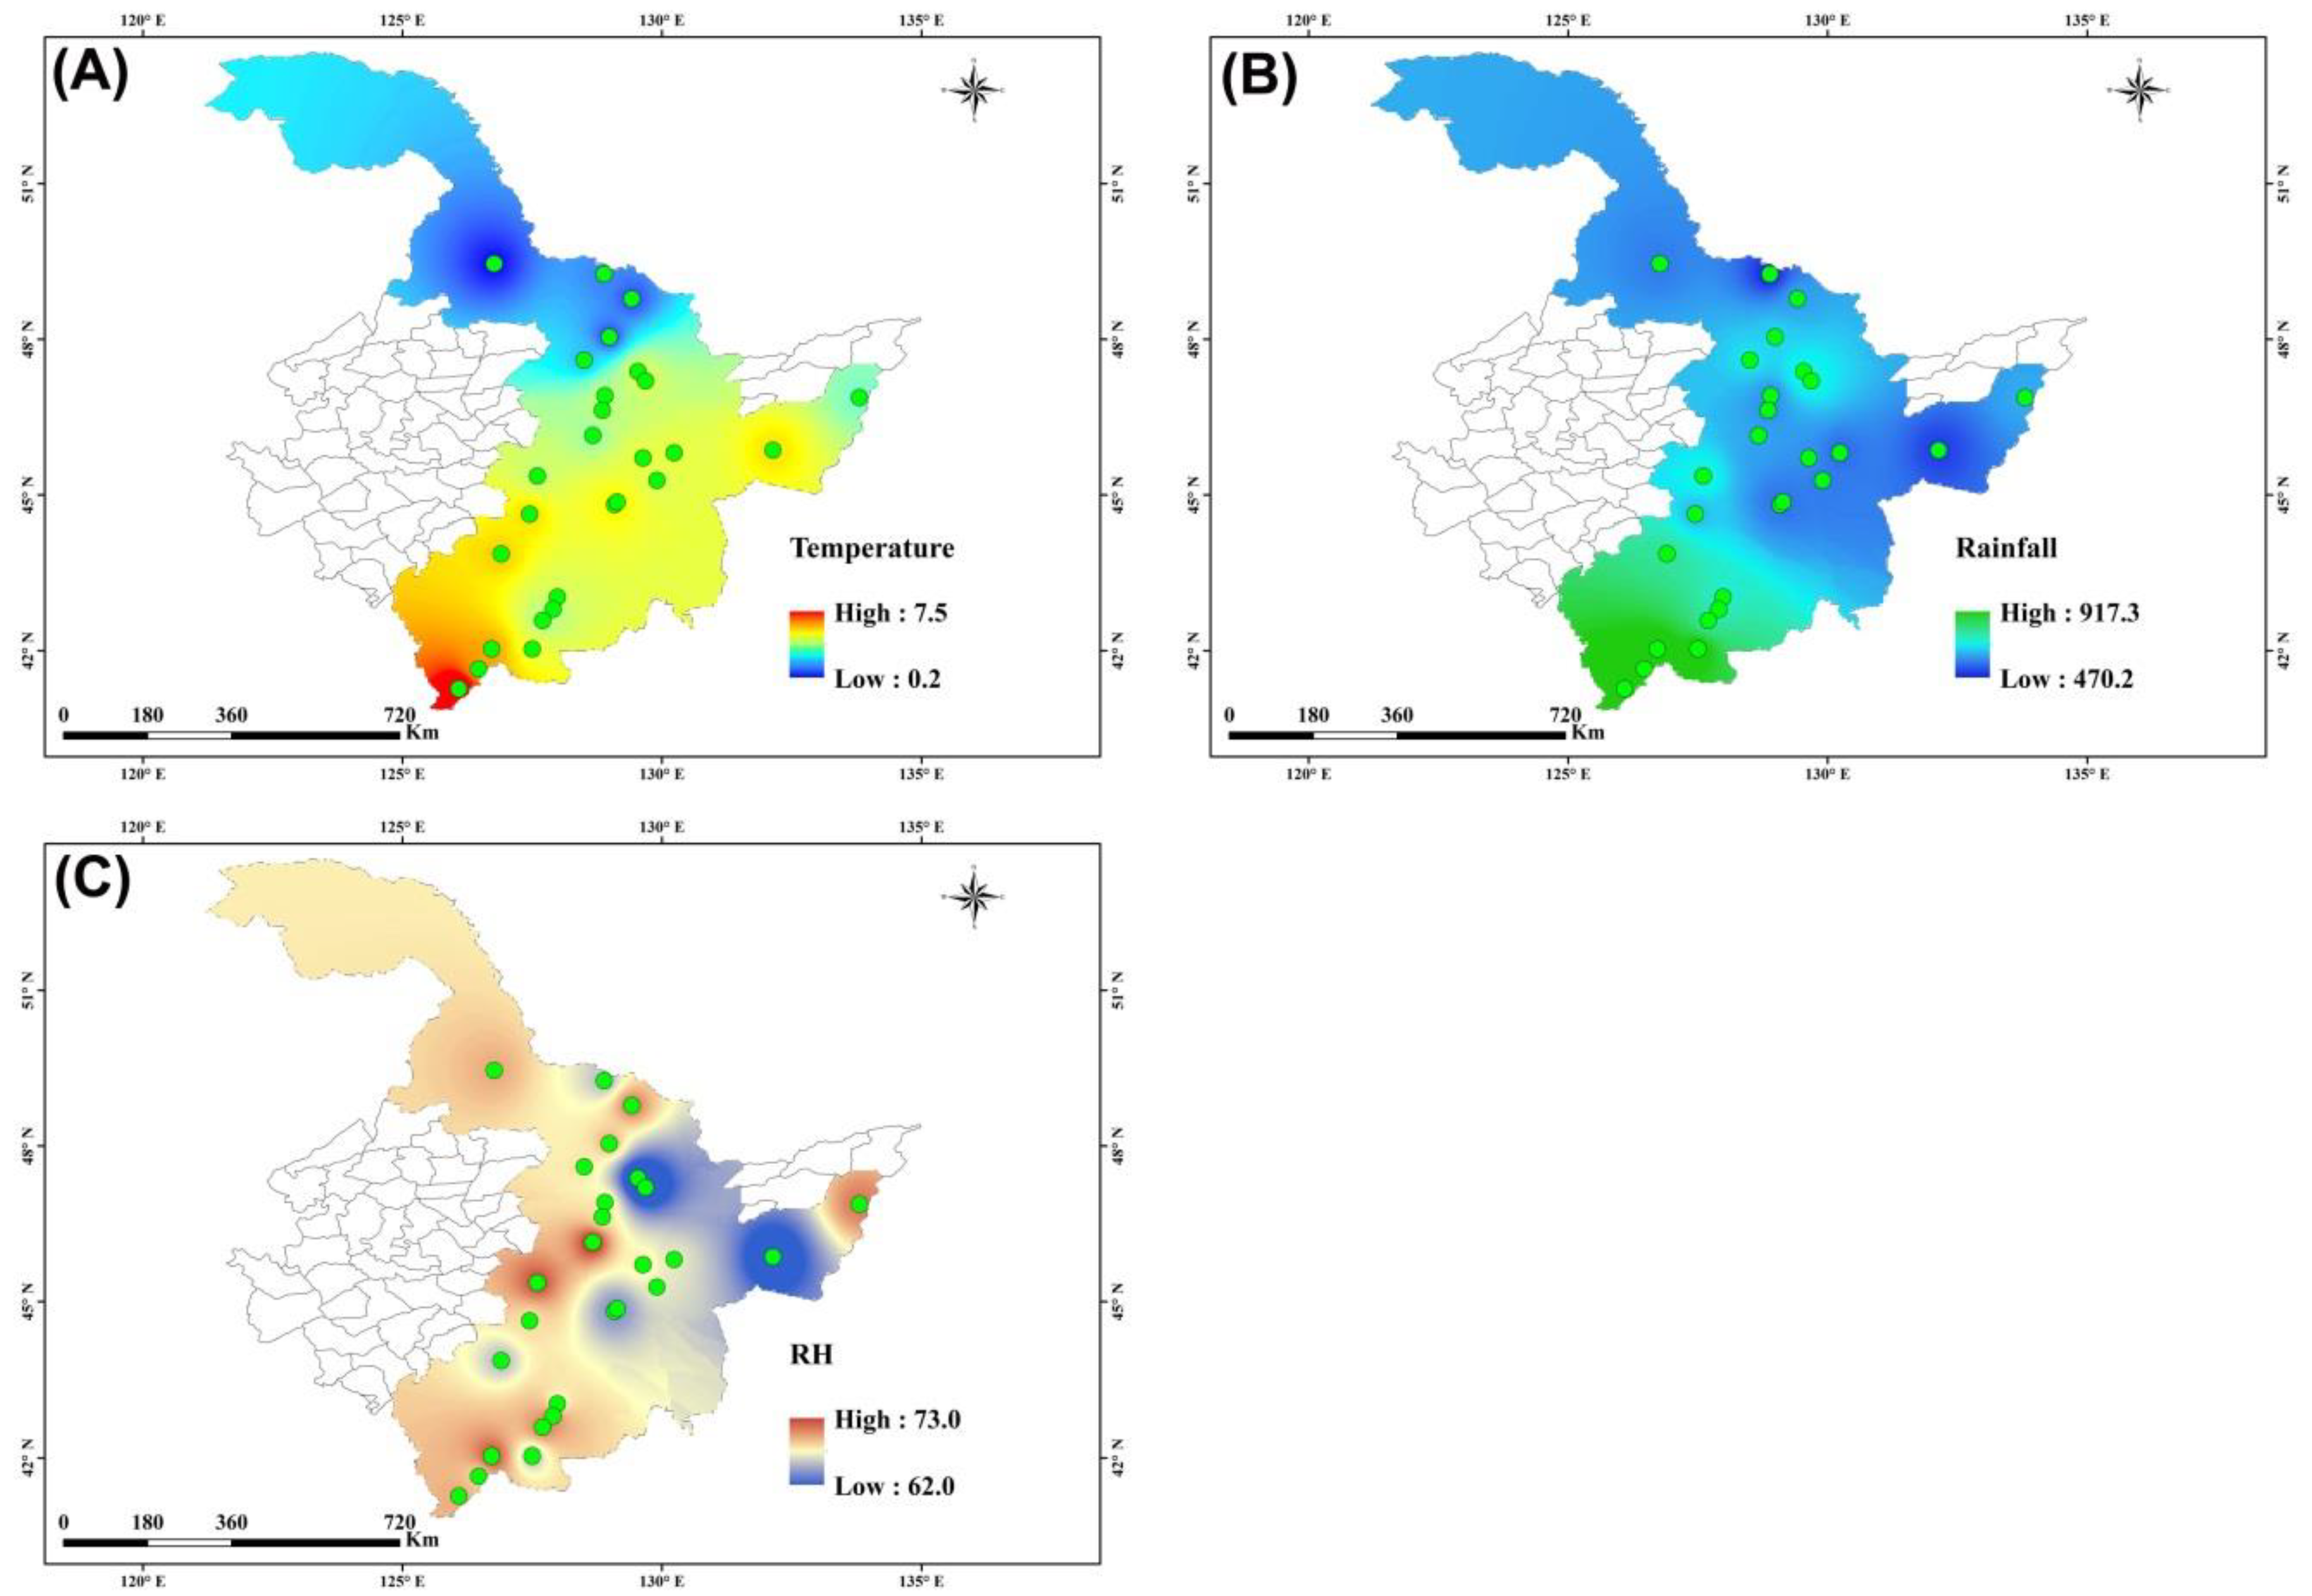
2.1. Study Area

Forests in Northeast China were chosen as the study area. Northeast China is referred to including the eastern region of Inner Mongolia Province, Heilongjiang Province, Jilin Province, and Liaoning Province. According to the topography, mountains in Northeast China include Changbai Mountains (eastern montane regions across Jilin and Liaoning Provinces), the lesser Khingan Mountains (mid- to mid-eastern regions of Heilongjiang Provinces), and the Greater Khingan Mountains (northeastern regions in Heilongjiang Province and northwestern regions of Inner Mongolia Province) [26,27]. The regional climate in mountains of Northeast China is characterized by a long and chilling winter, a dry and windy spring and autumn, and a rainy summer with mild temperature. In eastern mountains in Heilongjiang and Jilin Provinces, the mean annual temperature varies between −4.7 and 10.7 °C with an annual precipitation of 866 mm. Regional relative humidity (RH) was averaged to be about 65%. The targeted forests that harbored natural E. senticosus populations were mainly dominated by trees of Abies nephrolepis, Alnus mandshurica, Betula platyphylla, Larix gmelinii, Pinus koraiensis, Populus davidiana, and Quercus mongolica [28,29,30].

2.2. Data Collection

Environmental factors were studied with the focus on temperature, precipitation, and relative humidity (RH) [26]. Data about these three parameters were averaged for the historical record of annual amounts during 1996 and 2016 for 27 meteorological stations. Specific locations and topographic information for these stations are listed in Table 1. These stations were chosen because at least one natural E. senticosus population was found nearby. During the time from July to late August in 2017, three sub-plots were randomly set around the coordinate of the meteorological station. Each sub-plot had an area of 400 m2 in a 20 m × 20 m spacing stand, wherein a number of 10 E. senticosus individuals were randomly investigated across the stand for height and root-collar diameter (RCD) (Table 1). Thereafter, both aerial and below-ground parts of investigated individuals were harvested. Roots were carefully shoveled from soils and whisked rhizosphere soils. Harvested individuals were transported to the laboratory on ice (0–2 °C) where roots were further carefully rinsed to clean the roots free from soils. Both aerial shoots and underground roots were rinsed by distilled water and prepared for further determination.

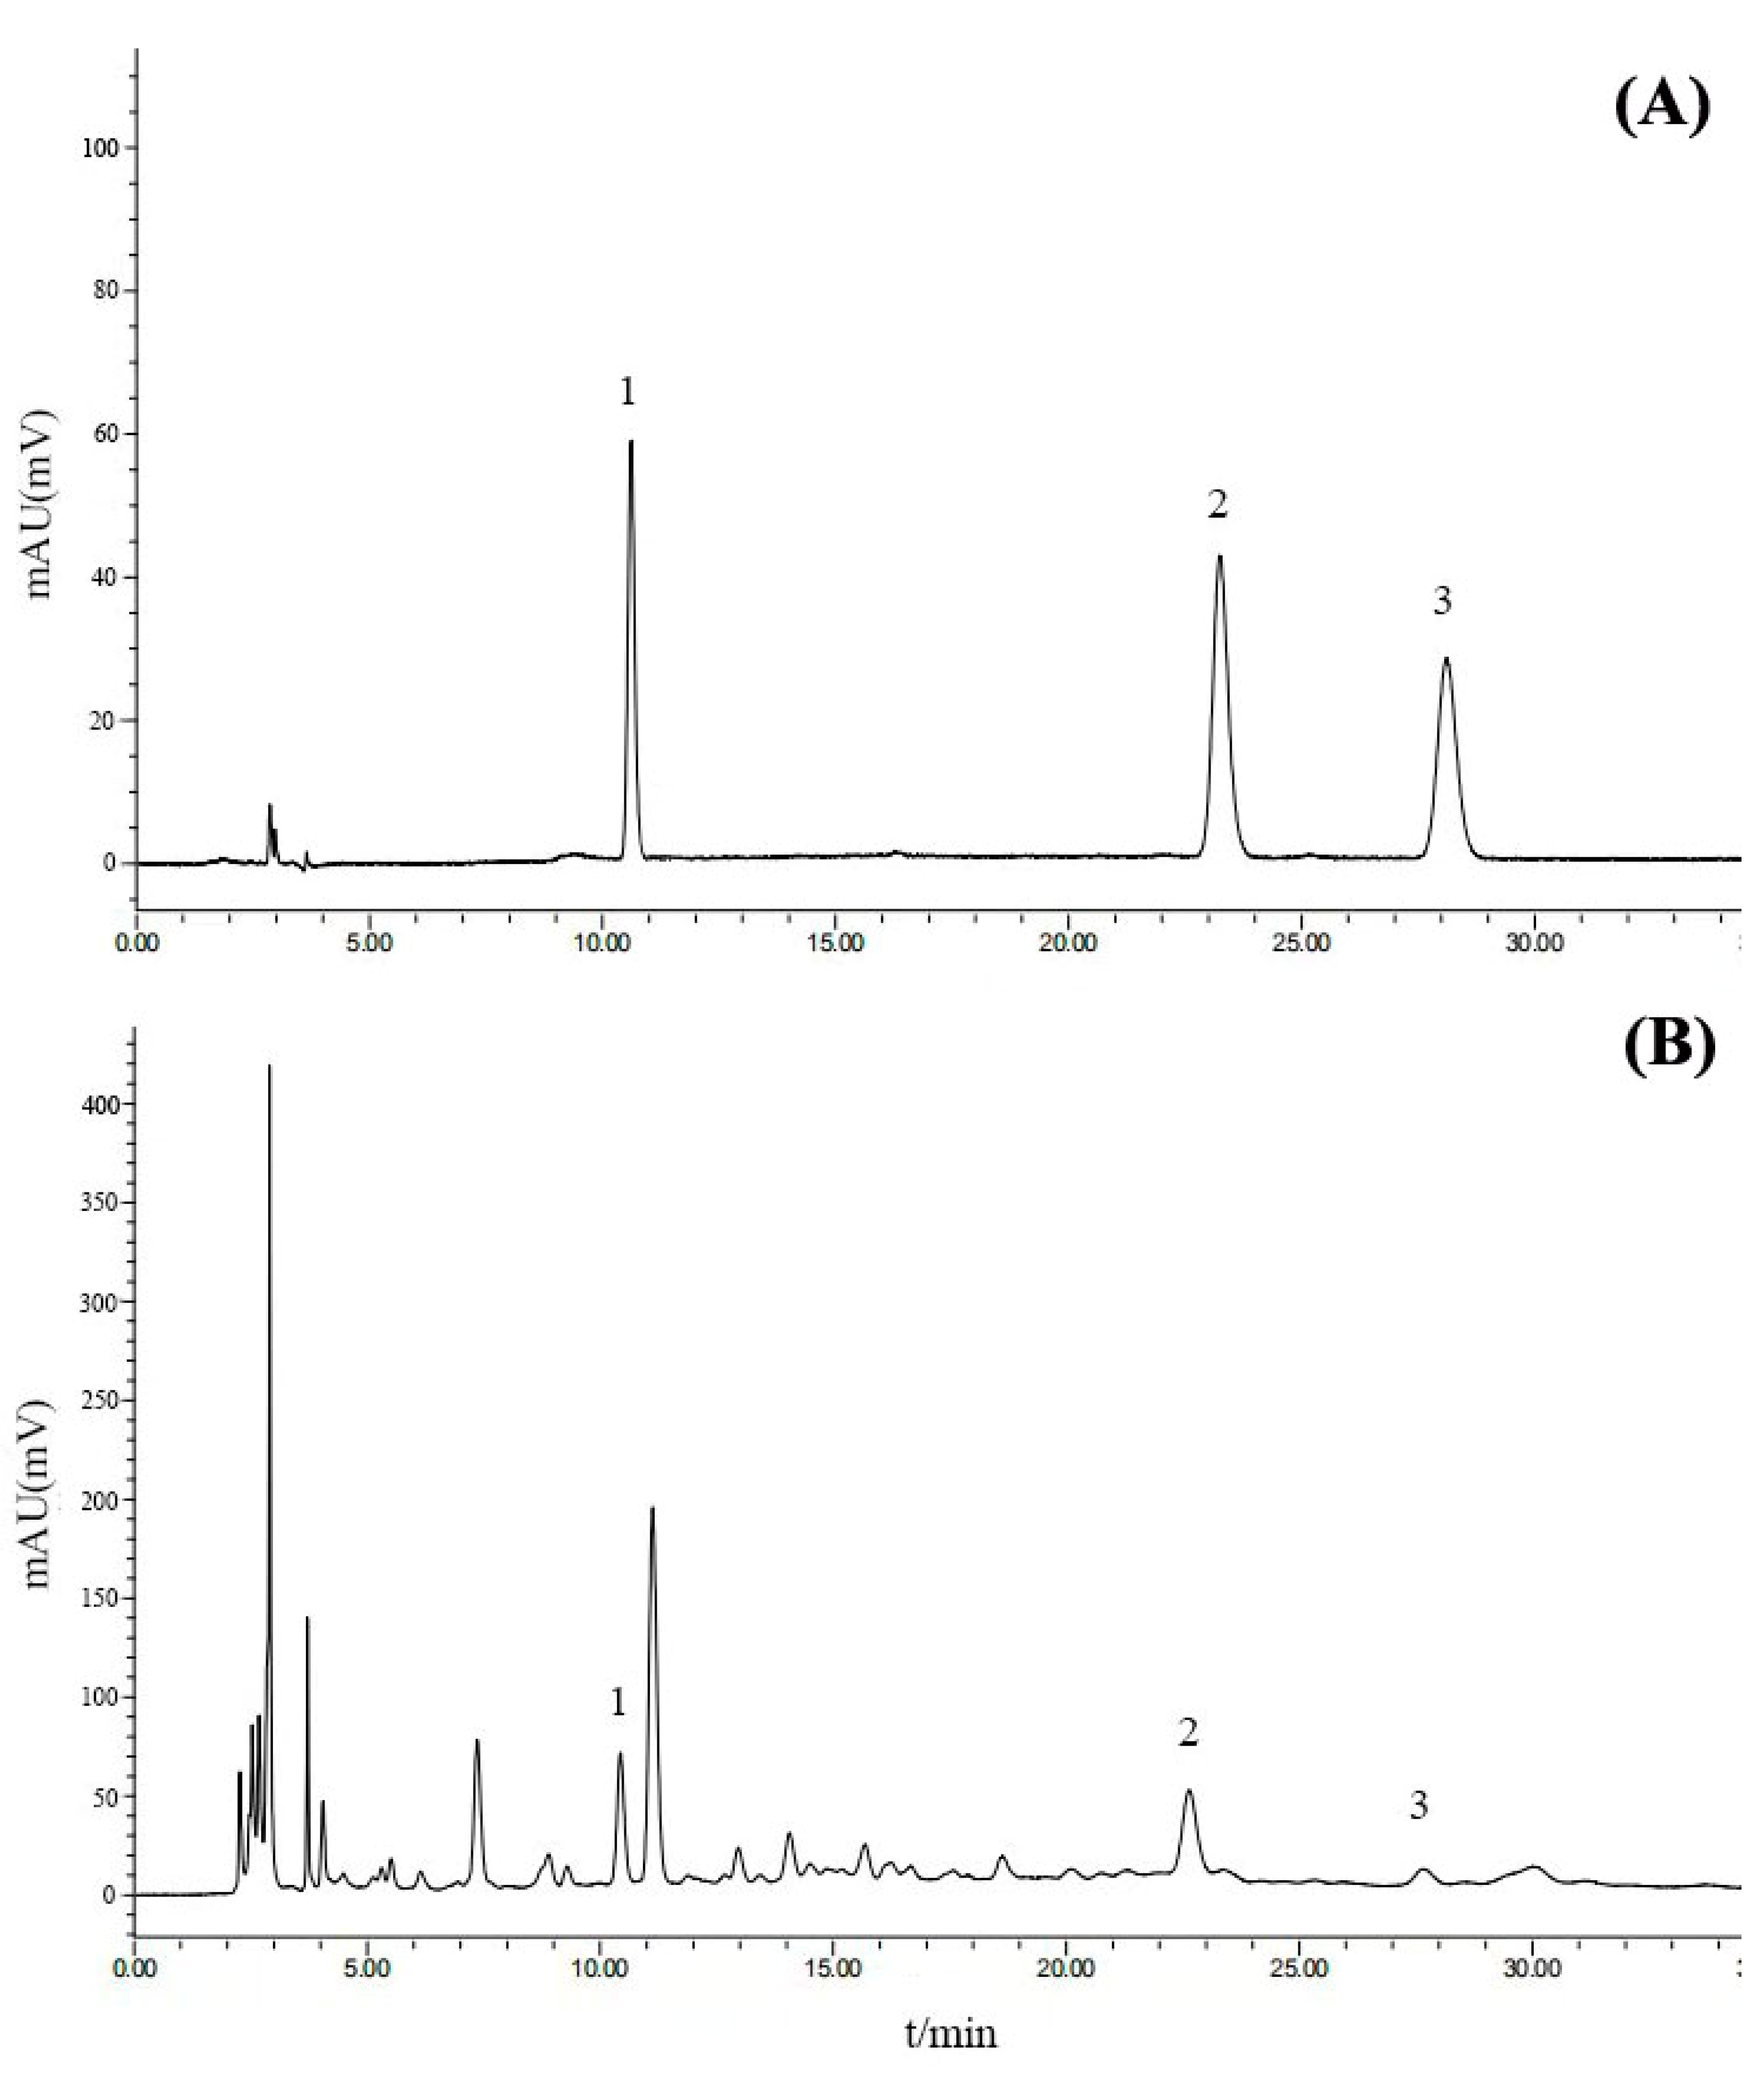
2.3. Bioactive Compound Analysis

The methodology of bioactive compound extraction was modified from that of Wu et al. [20]. Samples were oven-dried at 45 °C for 72 h and ground to pass a 60-mesh sieve (0.25 mm). Approximately 1 g of dry powdered plant material was extracted with 25 mL of methanol (70%; v/v) by supersonic for 75 min. The extract was moved to a 2 mL tube for centrifugation at 4000 rpm at 4 °C for 10 min. The supernatant was filtered to pass the 0.45 μm millipore-filter and reserved at 0–2 °C until the analysis using high-performance liquid chromatography (HPLC) (Waters 2695 Separations Module Waters 2998 PDA Detector, Waters Inc., Milford, MA, USA).
Measurement of the bioactive compounds were carried out with the HPLC system using a Welchrom C18 (250 mm × 4.6 mm, 5 μm) chromatographic column. The elution gradient of the mobile phase consisted of chromatographically pure acetonitrile (J&K Scientific Ltd. Headquarters, Beijing, China) and phosphoric acid (0.1%; w/w) at the rate of 1 mL min−1: 10%–15% acetonitrile at 0%–12 min, 15%–20% acetonitrile at 12%–35 min. The column temperature was maintained at 35 °C and the injection volume was 10 μL. The determination wavelength was used at 206 nm.
A weight of 2.502, 2.510, and 2.501 mg of reference substances for eleutheroside B (HPLC ≥ 98%, batch number P14J7F8937), eleutheroside E (HPLC ≥ 98%, batch number W11J7K8869), and isofraxidin (HPLC ≥ 99%, batch number Y12J7S17732) (Yuanye Bio. S&T. Inc., Shanghai, China) was prepared and placed in 10 mL volumetric flasks, respectively. Flasks were added to using methanol to the volume of 10 mL to obtain the references of three compounds. References were used to make the prepared model by regressing known concentrations in a given range to the peak area (Table 2). The chromatogram is shown in Figure 2.
Using this regression model, the references were extracted six times in 10 μL for three compounds to calculate the relative standard deviation (RSD). As a result, RSD for the peak area of 0.62%, 0.40%, and 0.32% for eleutheroside B, eleutheroside E, and isofraxidin, respectively, was obtained indicating the precision of the determination can be acceptable. RSD of determination using samples at 0, 4, 6, 8, 10, and 12 h after preparation for eleutheroside B, eleutheroside E, and isofraxidin were 1.19%, 0.88%, and 0.79%, respectively, suggesting samples were stable for12 h. The six repeated analyses of each parameter resulted in RSD ranging from 0.78% to 1.20%, which indicated an acceptable precision of technically repeated measures.

2.4. Statistical Analysis

Values of both parameters about regional environment (temperature, precipitation, and RH) and bioactive compounds (eleutheroside B, eleutheroside E, and isofraxidin) were interpolated by kriging using ArcGIS software (V-9.3, Esri China Information Technology Ltd., Beijing, China) to map their spatial distributions. Data about bioactive compounds for one plot of E. senticosus population were averaged for the mean from three sub-plots. Data about compound concentrations were calculated and mapped separately in aerial and underground organs.
Statistical analyses were finished using SAS software (ver. 9.4 64-bit, SAS Institute, Cary, NC, USA). All data were checked for the normal distribution and necessary transformation was made to pass the normality test. Pearson correlation was employed twice. Firstly, it was performed to detect the relationship between data about regional climate (temperature, precipitation, and RH) and topographical factors (longitude, latitude, elevation, and slope). Subsequently, the linear correlation was employed again to detect the relationship between any of the unique abiotic factors and bioactive compound concentrations. Thereafter, the stepwise regression was employed to identify the contribution of multiple abiotic variables to concentrations of the three compounds. When the linear regression failed to test the multiple variables, raw data were used for the maximum-likelihood regression. The significance of probability for both Pearson correlation and multiple-variable-regression was accepted at the 0.05 level.

3. Results

3.1. Spatial Distribution of Climatic Factors

The average temperature from 1996 to 2016 presented a geographically descending gradient from the south to the north (Figure 3A). Precipitation was also found to be higher in the southern regions in the study area (Figure 3B). However, RH was lower in the central part of the research area than in the surrounding regions especially the eastern edge and the western and southwestern orientations (Figure 3C).

3.2. Spatial Distribution of Bioactive Compounds

Eleutheroside B concentration in E. senticosus shoot was higher in surrounding areas than in the central part of the study area (Figure 4A). Eleutheroside E concentration was higher in the southern and eastern regions of the study area than in the northern regions (Figure 4B). Shoot isofraxidin concentration was found to be higher in the surrounding areas than in central regions of the studied areas (Figure 4C).
Eleutheroside B and eleutheroside E concentrations in E. senticosus roots had similar spatial distribution patterns, which showed alternatively low and high concentrations from the northern part of the study area to the south (Figure 5A,B). These two compounds also showed higher concentrations in the eastern regions. However, root isofraxidin showed another different distribution pattern where the concentration was higher in the two regions near the western and eastern edges than in the central part (Figure 5C).

3.3. Relationship Between Parameters About Climate and Topography

Both longitude and latitude had a negative relationship with temperature, suggesting temperature tended to decline to the northern or to the eastern orientations in the study area (Table 3). Elevation had a positive relationship with RH, suggesting the high air humidity at high altitude. Longitude also had a positive relationship with elevation, but latitude had a negative relationship with elevation (Table 3). These results suggested that mountains tended to be higher in regions to the southeastern orientation.

3.4. Relationship Between Abiotic Factors and Bioactive Compounds

The Pearson regression indicated that RH was positively correlated to eleutheroside B concentration in shoot (Pearson correlation coefficients: R = 0.5003; P = 0.0079). Therefore, RH was further found to have a linear relationship with eleutheroside B concentration in shoot (Figure 6A). In contrast, temperature was negatively correlated to eleutheroside B concentration in shoot (Pearson correlation coefficients: R = −0.4394; P = 0.0218). Another negatively linear regression was found between temperature and shoot eleutheroside B concentration (Figure 6B). RH was positively correlated to eleutheroside B concentration in roots (Pearson correlation coefficients: R = 0.4155; P = 0.0311) (Figure 6C), but latitude was negatively correlated to eleutheroside E concentration in shoot (Pearson correlation coefficients: R = −0.5083; P = 0.0068) (Figure 6D).

3.5. Regression of Multiple Varialbles of Abiotic Factors with Bioactive Compounds

Stepwise regression indicated that temperature and latitude had negative contributions to eleutheroside B concentrations in E. senticosus shoot (Table 4). Although latitude also had a negative contribution to eleutheroside E concentration in shoot, the contribution of temperature to shoot eleutheroside E concentration was positive.
The maximum-likelihood regression indicated that both RH and longitude had positive contributions to eleutheroside B concentration in roots, but precipitation had a strongly negative contribution to the eleutheroside E concentration in roots (Table 5). Temperature and elevation had positive contributions to isofraxidin concentration in shoot, while the contributions from RH and slope were negative. Temperature, RH, and longitude all had positive contributions to isofraxidin concentration in roots, but precipitation had a negative contribution.

4. Discussion

Our results were agreeable to our hypothesis that eleutheroside B concentration in E. senticosus shoot tended to be higher in the northern part of the study area and lower in the southeast part. Pearson correlation clearly indicated a negative relationship between temperature and shoot eleutheroside B concentration. Our results were different from those of Shohael et al. [31], where eleutheroside B concentration increased from 18 to 24 °C with an undetectable level at 12 °C. It may be roughly concluded that eleutheroside B concentration increased with temperature in Shohael et al., which appeared to disagree to our results [31]. However, two aspects of methodology existed in the former study to generate the difference. Firstly, materials in Shohael et al. were used as somatic embryos, which were fragile and sensitive to exogenous environment [31], but ours were employed as mature individuals from the natural population. Furthermore, the temperature in Shohael et al. varied within the range of indoor conditions from 12 to 30 °C [31], but the real temperature for natural populations was as low as 0%–7 °C with annual chilling periods. It was indicated that the temperature at 20 °C was suitable for the development of embryos [14], but this temperature may occur only in summer for some natural populations. However, other botanic studies revealed that low temperature can induce the synthesis of anthocyanin in several plant species [15,18]. In addition, Schmidt et al. studied the climatic influence on kale (Brassica oleracea) and found that the concentration of flavonoids grew in cooler temperatures ranging 0.3%–9.6 °C [32].
It was surprising that the geographical change of shoot eleutheroside B concentration had no relationship with the single factor of latitude unless with the involvement of temperature as another independent variable in the stepwise regression. Thus, both geography and Pearson correlation clearly revealed that temperature declined along the latitude gradient from the south to the north. These results together suggest that the special distribution of eleutheroside B concentration in E. senticosus stem was shaped by the geographical distribution of temperature along the latitude gradient. On the other hand, we also found a positive relationship between RH and shoot eleutheroside B concentration. This part of results contradicted those in Guo et al., where RH was negatively correlated with betulin and lupeol concentrations in B. platyphylla trees [26]. However, our results concur with those findings about forest crops in the understory [23,33]. Two possible explanations may be responsible for our results. The increase of RH can induce the synthesis of secondary metabolites through depressing vapor pressure deficit [23]. Otherwise, higher RH may induce the synthesis of eleutheroside B concentration as a response to the stimulated disease explosion [33].
In contrast to the relationship between temperature and shoot eleutheroside B concentration, temperature was found to be positively correlated with shoot eleutheroside E concentration with decreasing latitudes. This coincided with the higher eleutheroside E concentration in E. senticosus individuals in the southwestern part of the study area and the lower one in the northern part. This special distribution matched that of regional temperature. Again, our results about shoot eleutheroside E concentration disagreed with those in Shohael et al., where E. senticosus embryos showed decreasing eleutheroside E concentration with the increase of temperature from 12 to 24 °C [31]. This part of the results concurs with those in Guo et al., where the concentration of secondary metabolites in Scutellaria baicalensis plants was positively correlated with temperature across mainland China [29]. However, our results about shoot eleutheroside E concentration failed to support the hypothesis because there was a negative relationship with latitude. Because the single factor temperature failed to have any relationship with shoot eleutheroside E concentration, we surmise other abiotic factors, such as light quality and ultraviolet (UV) light [34], may have contributed to the spatial pattern of eleutheroside E distribution.
Results about eleutheroside B concentration in E. senticosus roots support the other part of our hypothesis. The maximum-likelihood regression indicated that both RH and longitude contributed to the positive effect on root eleutheroside B concentration. In addition, RH was positively correlated with elevation, which was further positively correlated with longitude. Therefore, these results together suggest that E. senticosus individuals tended to have high accumulation of eleutheroside B concentration in roots in populations in moist forests distributed in altitudes of mountains in the eastern regions. The eastern alp in our study was mainly accounted for by Changbai mountains, where it was reported that the decline of temperature with the increase of elevation controlled the evapotranspiration, which resulted in the rising RH along the elevation gradient [35]. The high RH in the eastern mountains may have promoted the accumulation of eleutheroside B in roots.
Although we found the negative relationship between rainfall and eleutheroside E concentration in roots, no relationship was further detected between rain and other climate or topographical parameters. We surmise that abundant rainfall favored the condition for E. senticosus growth and controlled the synthesis of eleutheroside E in roots. This part of the results concurred with those about medical herbs in South Africa [36] and Brazil [37]. A study on Euclea undulata Thunb. var. myrtina reported that concentrations of epicatechin and 7-methyl-juglone in roots were depressed in the rainy season for the population in the winter rainfall area. The study on Tithonia diversifolia revealed that change of inorganic-element concentrations in soils determined the concentration of secondary metabolites in roots.
Factors of slope and temperature had strong negative and positive contributions (estimates of about ± 2.0) to the isofraxidin concentration in stem, respectively. These two factors had no relationship with each other; therefore, the two contributions were separated. The positive effect of temperature on isofraxidin concentration coincided with that on eleutheroside E, which may share the same mechanism that had been discussed in the preceding paragraphs. The slope in our study ranged between 0° and 33°. In another study, Wei et al. studied the response of Aralia elata, the species from another genus in Araliaceae, to different slopes and found that nearly all plant parameters decreased since the slope increased up to 9° [13]. The positive correlation between elevation and shoot isofraxidin concentration resulted from strong UV-light-induced compound synthesis and accumulation [34]. The strongly negative correlation between rainfall and isofraxidin concentration in roots concurred with the findings about root eleutheroside E concentration. Positive contributions of temperature, RH, and longitude to root isofraxidin concentration indicated that E. senticosus individuals in natural populations in regions at high elevation with an annual temperature of about 5 °C had the highest levels of root isofraxidin.

5. Conclusions

In this study, 27 plots were investigated to detect the special distribution and environmental correlates of eleutheroside B, eleutheroside E, and isofraxidin in individuals from natural E. senticosus populations in forests of Northeast China. Populations in northern regions around the Greater Khingan Mountains tended to have a higher concentration of eleutheroside B in aerial organs, which was driven by the lower temperature therein. Another region of forests that harbored E. senticosus individuals with higher concentration of eleutheroside B concentration in shoots was located at the eastern mountains with high elevation and high humidity. Concentrations of eleutheroside B and isofraxidin were higher in the southern and eastern edges of the study area, where higher temperature drove the concentrations in aerial organs and lower rainfall drove those in roots. Therefore, the spatial distribution of bioactive compounds in medical plants in the understory can be driven by regional climate factors. The management of non-wood forest product plants at the regional scale should consider effects from climatic geography.

Author Contributions

Conceptualization, S.G., H.W., and Z.W.; methodology, S.G. and H.W.; software, H.W. and X.C.; field investigation, S.G., J.L., R.F., and M.X.; chemical analysis, J.L. and X.C.; data curation, S.G., H.W., and X.C.; writing—original draft preparation, S.G.; writing—review and editing, H.W.; project administration, Z.W.; funding acquisition, Z.W.

Funding

This research was funded by the National Key Research and Development Program of China (grant number 2016YFC0500300), the Heilongjiang Province Foundation for The National Key Research and Development Program of China (grant number GX17C006), the Post-Doctoral Foundation of Heilongjiang Province of China (grant number LBH-Z17208), the National Natural Science Foundation of China (grant number 41971122; 41861017), and the Funding for Jilin Environmental Science (grant number 2017-16).

Conflicts of Interest

The authors declare no conflict of interest.

References

  1. Walsh, E.S.; Vierling, K.T.; Strand, E.; Bartowitz, K.; Hudiburg, T.W. Climate change, woodpeckers, and forests: Current trends and future modeling needs. Ecol. Evol. 2019, 9, 2305–2319. [Google Scholar] [CrossRef] [PubMed] [Green Version]
  2. Lemordant, L.; Gentine, P. Vegetation response to rising co2 impacts extreme temperatures. Geophys. Res. Lett. 2019, 46, 1383–1392. [Google Scholar] [CrossRef]
  3. Park, H.; Jeong, S.J.; Ho, C.H.; Kim, J.; Brown, M.E.; Schaepman, M.E. Nonlinear response of vegetation green-up to local temperature variations in temperate and boreal forests in the northern hemisphere. Remote Sens. Environ. 2015, 165, 100–108. [Google Scholar] [CrossRef]
  4. Wang, G.; Wang, P.; Wang, T.Y.; Zhang, Y.C.; Yu, J.J.; Ma, N.; Frolova, N.L.; Liu, C.M. Contrasting changes in vegetation growth due to different climate forcings over the last three decades in the selenga-baikal basin. Remote Sens. 2019, 11, 17. [Google Scholar] [CrossRef]
  5. Ahlstrand, N.I.; Reghev, N.H.; Markussen, B.; Hansen, H.C.B.; Eiriksson, F.F.; Thorsteinsdottir, M.; Ronsted, N.; Barnes, C.J. Untargeted metabolic profiling reveals geography as the strongest predictor of metabolic phenotypes of a cosmopolitan weed. Ecol. Evol. 2018, 8, 6812–6826. [Google Scholar] [CrossRef]
  6. Jochum, G.M.; Mudge, K.W.; Thomas, R.B. Elevated temperatures increase leaf senescence and root secondary metabolite concentrations in the understory herb panax quinquefolius (araliaceae). Am. J. Bot. 2007, 94, 819–826. [Google Scholar] [CrossRef]
  7. Souther, S.; McGraw, J.B. Evidence of local adaptation in the demographic response of american ginseng to interannual temperature variation. Conserv. Biol. 2011, 25, 922–931. [Google Scholar] [CrossRef]
  8. Vezza, M.; Nepi, M.; Guarnieri, M.; Artese, D.; Rascio, N.; Pacini, E. Ivy (hedera helix l.) flower nectar and nectary ecophysiology. Int. J. Plant Sci. 2006, 167, 519–527. [Google Scholar] [CrossRef]
  9. Abraham, E.M.; Theodoropoulos, K.; Eleftheriadou, E.; Ragkos, A.; Kyriazopoulos, A.P.; Parissi, Z.M.; Arabatzisa, G.; Soutsas, K. Non-wood forest products from the understory and implications for rural development: The case of a broadleaf deciduous oak forest (quercus frainetto t e n.) in chalkidiki, greece. J. Environ. Prot. Ecol. 2015, 16, 1024–1032. [Google Scholar]
  10. FAO Towards a harmonized definition of non-wood forest products. Unasylva 1999, 198, 63–66.
  11. Huber, P.; Hujala, T.; Kurttila, M.; Wolfslehner, B.; Vacik, H. Application of multi criteria analysis methods for a participatory assessment of non-wood forest products in two european case studies. For. Policy Econ. 2019, 103, 103–111. [Google Scholar] [CrossRef]
  12. Huber, F.K.; Ineichen, R.; Yang, Y.P.; Weckerle, C.S. Livelihood and conservation aspects of non-wood forest product collection in the shaxi valley, southwest china(1). Econ. Bot. 2010, 64, 189–204. [Google Scholar] [CrossRef]
  13. Wei, H.X.; Zhao, H.T.; Chen, X. Foliar n:P stoichiometry in aralia elata distributed on different slope degrees. Not. Bot. Horti. Agrobo. 2018, 47, 887–895. [Google Scholar] [CrossRef]
  14. Gao, Z.; Khalid, M.; Jan, F.; Saeed ur, R.; Jiang, X.; Yu, X. Effects of light-regulation and intensity on the growth, physiological and biochemical properties of aralia elata (miq.) seedlings. South Afr. J. Bot. 2019, 121, 456–462. [Google Scholar] [CrossRef]
  15. Nadeau, I.; Olivier, A. The biology and forest cultivation of american ginseng (panax quinquefolius l.) in canada. Can. J. Plant Sci. 2003, 83, 877–891. [Google Scholar]
  16. Yu, X.H.; Gao, Z.L.; Juan, J.X.; Cheng, Y.; Zhao, M.L.; Ma, D.N.; Xu, X.B.; Jiang, X.M. Digital analysis on cone-thorn density and morphology in mutant aralia elata seedlings induced by ethyl methanesulfonate. Int. J. Agric. Biol. 2019. [Google Scholar]
  17. Yang, X.; Skidmore, A.K.; Melick, D.R.; Zhou, Z.; Xu, J. Mapping non-wood forest product (matsutake mushrooms) using logistic regression and a gis expert system. Ecol. Model. 2006, 198, 208–218. [Google Scholar] [CrossRef]
  18. Choi, S.; Kwon, Y.R.; Hossain, M.A.; Hong, S.W.; Lee, B.H.; Lee, H. A mutation in ela1, an age-dependent negative regulator of pap1/myb75, causes uv- and cold stress-tolerance in arabidopsis thaliana seedlings. Plant Sci. 2009, 176, 678–686. [Google Scholar] [CrossRef]
  19. Jung, C.H.; Ahn, J.; Heo, S.H.; Ha, T.-Y. Eleutheroside e, an active compound from eleutherococcus senticosus, regulates adipogenesis in 3t3-l1 cells. Food Sci. Biotechnol. 2014, 23, 889–893. [Google Scholar] [CrossRef]
  20. Wu, K.X.; Liu, J.; Liu, Y.; Guo, X.R.; Mu, L.Q.; Hu, X.H.; Tang, Z.H. A comparative metabolomics analysis reveals the tissue-specific phenolic profiling in two acanthopanax species. Molecules 2018, 23, 14. [Google Scholar] [CrossRef]
  21. Sun, H.; Liu, J.H.; Zhang, A.H.; Zhang, Y.; Meng, X.C.; Han, Y.; Zhang, Y.Z.; Wang, X.J. Characterization of the multiple components of acanthopanax senticosus stem by ultra high performance liquid chromatography with quadrupole time-of-flight tandem mass spectrometry. J. Sep. Sci. 2016, 39, 496–502. [Google Scholar] [CrossRef] [PubMed]
  22. Lu, F.; Sun, Q.; Bai, Y.; Bao, S.; Li, X.; Yan, G.; Liu, S. Characterization of eleutheroside b metabolites derived from an extract of acanthopanax senticosus harms by high-resolution liquid chromatography/quadrupole time-of-flight mass spectrometry and automated data analysis. Biomed. Chromatogr. 2012, 26, 1269–1275. [Google Scholar] [CrossRef] [PubMed]
  23. Lihavainen, J.; Keinanen, M.; Keski-Saari, S.; Kontunen-Soppela, S.; Sober, A.; Oksanen, E. Artificially decreased vapour pressure deficit in field conditions modifies foliar metabolite profiles in birch and aspen. J. Exp. Bot. 2016, 67, 4367–4378. [Google Scholar] [CrossRef] [PubMed] [Green Version]
  24. Lee, S.Y.; Son, D.; Ryu, J.; Lee, Y.S.; Jung, S.H.; Kang, J.I.; Lee, S.Y.; Kim, H.S.; Shin, K.H. Anti-oxidant activities of acanthopanax senticosus stems and their lignan components. Arch. Pharm. Res. 2004, 27, 106–110. [Google Scholar] [CrossRef] [PubMed]
  25. Niu, X.F.; Xing, W.; Li, W.F.; Fan, T.; Hu, H.; Li, Y.M. Isofraxidin exhibited anti-inflammatory effects in vivo and inhibited tnf-alpha production in lps-induced mouse peritoneal macrophages in vitro via the mapk pathway. Int. Immunopharmacol. 2012, 14, 164–171. [Google Scholar] [CrossRef] [PubMed]
  26. Guo, S.L.; Zhang, D.H.; Wei, H.Y.; Zhao, Y.N.; Cao, Y.B.; Yu, T.; Wang, Y.; Yan, X.F. Climatic factors shape the spatial distribution of concentrations of triterpenoids in barks of white birch (betula platyphylla suk.) trees in northeast china. Forests 2017, 8, 12. [Google Scholar] [CrossRef]
  27. Shen, X.J.; Liu, B.H.; Xue, Z.S.; Jiang, M.; Lu, X.G.; Zhang, Q. Spatiotemporal variation in vegetation spring phenology and its response to climate change in freshwater marshes of northeast china. Sci. Total Environ. 2019, 666, 1169–1177. [Google Scholar] [CrossRef] [PubMed]
  28. Dai, L.M.; Shao, G.F.; Xiao, B.Y. Ecological classification for mountain forest sustainability in northeast china. For. Chron. 2003, 79, 233–236. [Google Scholar] [CrossRef]
  29. Guo, L.; Wang, S.; Zhang, J.; Yang, G.; Zhao, M.; Ma, W.; Zhang, X.; Li, X.; Han, B.; Chen, N.; et al. Effects of ecological factors on secondary metabolites and inorganic elements of scutellaria baicalensis and analysis of geoherblism. Sci. China Life Sci. 2013, 56, 1047–1056. [Google Scholar] [CrossRef] [PubMed]
  30. Wan, J.Z.; Wang, C.J.; Yu, J.H.; Nie, S.M.; Han, S.J.; Liu, J.Z.; Zu, Y.G.; Wang, Q.G. Developing conservation strategies for pinus koraiensis and eleutherococcus senticosus by using model-based geographic distributions. J. For. Res. 2016, 27, 389–400. [Google Scholar] [CrossRef]
  31. Shohael, A.M.; Ali, M.B.; Yu, K.W.; Hahn, E.J.; Paek, K.Y. Effect of temperature on secondary metabolites production and antioxidant enzyme activities in eleutherococcus senticosus somatic embryos. Plant Cell Tissue Organ. Cult. 2006, 85, 219–228. [Google Scholar] [CrossRef]
  32. Schmidt, S.; Zietz, M.; Schreiner, M.; Rohn, S.; Kroh, L.W.; Krumbein, A. Genotypic and climatic influences on the concentration and composition of flavonoids in kale (brassica oleracea var. Sabellica). Food Chem. 2010, 119, 1293–1299. [Google Scholar] [CrossRef]
  33. Shivanna, M.B.; Achar, K.G.S.; Vasanthakumari, M.M.; Mahishi, P. Phoma leaf spot disease of tinospora cordifolia and its effect on secondary metabolite production. J. Phytopathol. 2014, 162, 302–312. [Google Scholar] [CrossRef]
  34. Jaakola, L.; Hohtola, A. Effect of latitude on flavonoid biosynthesis in plants. Plant Cell Environ. 2010, 33, 1239–1247. [Google Scholar] [CrossRef] [PubMed]
  35. Yan, C.; Han, S.; Zhou, Y.; Zheng, X.; Yu, D.; Zheng, J.; Dai, G.; Li, M.-H. Needle δ13c and mobile carbohydrates in pinus koraiensis in relation to decreased temperature and increased moisture along an elevational gradient in ne china. Trees 2012, 27, 389–399. [Google Scholar] [CrossRef]
  36. Botha, L.E.; Prinsloo, G.; Deutschländer, M.S. Variations in the accumulation of three secondary metabolites in euclea undulata thunb. Var. Myrtina as a function of seasonal changes. South Afr. J. Bot. 2018, 117, 34–40. [Google Scholar] [CrossRef]
  37. Sampaio, B.L.; Edrada-Ebel, R.; Da Costa, F.B. Effect of the environment on the secondary metabolic profile of tithonia diversifolia: A model for environmental metabolomics of plants. Sci. Rep. 2016, 6, 29265. [Google Scholar] [CrossRef]
Figure 1. Chemical structures of eleutherosides B and E and isofraxidin [24,25].
Forests 10 00872 g001
Figure 2. Chromatogram for peaks of eleutheroside B, eleutheroside E, and isofraxidin in Eleutherococcus senticosus. (A) Peaks of eleutheroside B (1), eleutheroside E (2), and isofraxidin (3) in the reference. (B) Peaks of eleutheroside B (1), eleutheroside E (2), and isofraxidin (3) in the tested samples.
Forests 10 00872 g002
Figure 3. Interpolated mapping of geographical distributions of climatic factors in forests harboring Eleutherococcus senticosus populations in Northeast China. (A) Geographical distribution of temperature (°C); (B) geographical distribution of annual rainfall; (C) geographical distribution of relative humidity (RH) (%). Green dots indicate distribution of plots.
Forests 10 00872 g003
Figure 4. Interpolated mapping of geographical distributions of concentrations of bioactive compounds in aerial organs of Eleutherococcus senticosus individuals from populations in Northeast China. (A) Geographical distribution of eleutheroside B (mg g−1); (B) geographical distribution of eleutheroside E (mg g−1); (C) geographical distribution of Isofraxidin (mg g−1). Green dots indicate distribution of plots.
Forests 10 00872 g004
Figure 5. Interpolated mapping of geographical distributions of concentrations of bioactive compounds in underground organs of Eleutherococcus senticosus individuals from populations in Northeast China. (A) Geographical distribution of eleutheroside B (mg g−1); (B) geographical distribution of eleutheroside E (mg g−1); (C) geographical distribution of Isofraxidin (mg g−1). Green dots indicate distribution of plots.
Forests 10 00872 g005
Figure 6. Linear correlation between abiotic factors and concentrations of bioactive compounds in Eleutherococcus senticosus individuals from populations in Northeast China. (A) Regression between relative humidity and shoot eleutheroside B concentration; (B) regression between temperature and shoot eleutheroside B concentration; (C) regression between relative humidity and root eleutheroside B concentration; (D) regression between latitude and shoot eleutheroside E concentration. R2 and P values are coefficients from linear regression models.
Forests 10 00872 g006
Table 1. Plot characteristics of natural Acanthopanax senticosus populations in forests in Northeast China.
Plot NumberLatitudeLongitudeElevation (m)Slope (°)Forest TypeCD 1 (%)Shoot Height (cm)RCD 2 (cm)
149°28ʹ41″126°46ʹ29″5355Broadleaf-conifer0.5161.67 ± 10.411.13 ± 0.06
249°16ʹ33″128°53ʹ30″19815Mongolian oak 30.9168.33 ± 7.641.33 ± 0.15
348°47ʹ24″129°25ʹ29″31710Broadleaf-conifer0.4193.33 ± 36.171.57 ± 0.38
448°3ʹ24″128°59ʹ16″3468Broadleaf-conifer0.65203.33 ± 27.541.87 ± 0.23
547°23ʹ57″129°32ʹ30″34510Secondary forest0.2158.33 ± 16.071.77 ± 0.15
645°49ʹ58″130°14ʹ24″30115Secondary forest0.5166.67 ± 55.081.20 ± 0.35
745°43ʹ23″129°38ʹ38″1640Larch 40.3178.33 ± 25.171.30 ± 0.20
847°36ʹ31″128°30ʹ11″3225Broadleaf-conifer0.65196.00 ± 20.811.33 ± 0.21
947°12ʹ35″129°41ʹ21″4124Secondary forest0.45195.00 ± 21.791.43 ± 0.32
1046°55ʹ57″128°54ʹ37″43910Broadleaf-conifer0.7170.00 ± 5.001.20 ± 0.09
1146°38ʹ35″128°51ʹ35″32713Broadleaf-conifer0.7170.00 ± 10.001.68 ± 0.16
1246°9ʹ10″128°40ʹ2″1685Secondary forest0.55168.33 ± 10.411.41 ± 0.12
1345°22ʹ45″127°36ʹ18″36313Broadleaf-conifer0.5168.33 ± 7.641.36 ± 0.21
1444°49ʹ52″129°5ʹ47″6745Fir 50.7197.33 ± 23.691.33 ± 0.20
1544°52ʹ22″129°8ʹ16″54010Broadleaf-conifer0.67150.00 ± 10.001.09 ± 0.08
1643°2ʹ1″127°59ʹ42″7145Broadleaf-conifer0.7176.67 ± 11.551.50 ± 0.20
1742°48ʹ58″127°54ʹ19″58615Secondary forest0.7165.00 ± 21.791.33 ± 0.25
1842°35ʹ48″127°42ʹ32″7913Secondary forest0.5173.33 ± 5.771.47 ± 0.29
1942°2ʹ41″127°30ʹ44″8393Secondary forest0.5160.00 ± 17.327.40 ± 5.39
2042°2ʹ24″126°43ʹ45″7238Broadleaf-conifer0.7186.67 ± 11.551.43 ± 0.15
2141°39ʹ48″126°28ʹ47″41610Secondary forest0.7140.00 ± 0.010.87 ± 0.06
2241°16ʹ35″126°5ʹ16″72615Secondary forest0.7173.33 ± 20.821.23 ± 0.23
2343°52ʹ48″126°54ʹ16″30533Secondary forest0.7196.67 ± 15.281.13 ± 0.15
2444°38ʹ48″127°27ʹ13″26620Secondary forest0.7146.67 ± 5.771.27± 0.16
2545°52ʹ49″132°08ʹ11″24520Broadleaf forest 60.6176.00 ± 14.421.57 ± 0.15
2646°53ʹ47″133°48ʹ57″39830Broadleaf forest0.6165.00 ± 15.001.60 ± 0.36
2745°17ʹ22″129°54ʹ28″39225Broadleaf-conifer0.6171.67 ± 12.581.43 ± 0.35
1 CD, canopy density; 2 RCD, root-collar diameter; 3 Dominated by Quercus mongolica Fisch.; 4 Dominated by Larix gmelinii; 5 Dominated by Abies nephrolepis (Trautv.) Maxim.; 6 Dominated by Populus davidiana, Betula platyphylla, Q. mongolica Fisch., and Acer palmatum.
Table 2. Prepared model of linear regression with ranged of known concentrations as independent and the peak area as dependent.
CompoundRegression ModelR2Independent Range (μg)
Eleutheroside BY = 3,970,604.45x − 1316.930.99970.0390–2.502
Eleutheroside EY = 675,578.96x − 23,980.500.99970.0390–2.510
IsofraxidinY = 6,040,711.41x − 148,307.390.99960.0195%–2.507
Table 3. Pearson correlation between parameters about climate and topography.
Regression CoefficientTemperatureRH 1Rainfall 2LongitudeLatitudeElevation 3Slope 4
TemperatureR1
P
RHR0.229841
P0.2488
RainfallR−0.14057−0.222091
P0.48430.2655
LongitudeR−0.411670.14211−0.111741
P0.03290.47950.579
LatitudeR−0.78313−0.257050.083920.08851
P<0.00010.19550.67730.6607
ElevationR0.13730.52385−0.057120.43327−0.508331
P0.49470.00500.77720.02400.0068
SlopeR0.07157−0.01393−0.270390.36195−0.0009−0.120761
P0.72280.9450.17260.06360.99640.5485
1 RH, relative humidity, transformed by the square divided by 100; 2 transformed by the reciprocal times 100; 3 transformed by the logarithm; 4 transformed by the logarithm of raw data plus one.
Table 4. Stepwise regression of temperature and latitude factors on eleutheroside B and E concentrations in Eleutherococcus senticosus stems.
VariableEstimateStandard ErrorType II SS 1F ValuePr > F
Stem eleutheroside B
Intercept28.067267.8215518.1693112.880.0015
Temperature−0.913740.2346921.3885415.160.0007
Latitude−0.439050.1577510.930557.750.0103
Stem eleutheroside E 2
Intercept4.393830.878110.4452725.04<0.0001
Temperature0.071970.026350.132697.460.0116
Latitude−0.074350.017710.3134217.620.0003
1 SS, sum of squares; 2 Data about stem eleutheroside E were log-transformed before use in the regression model.
Table 5. Maximum-likelihood regression of variables about climate and topography on eleutheroside B and E concentrations in roots and isofraxidin content in stem and root in Eleutherococcus senticosus plants.
VariableDFEstimateWald Chi-squarePr > Chi-squareEstimateWald Chi-squarePr > Chi-square
Root eleutheroside BRoot eleutheroside E
Intercept1−56.92664.720.0298−53.511.110.2929
Temperature1−0.2080.480.4897−0.006100.9916
RH10.170815.40.02010.13210.860.3546
Rainfall1−8.07860.40.5247−53.21924.660.0309
Longitude10.51549.050.00260.61543.420.0643
Latitude1−0.28551.460.2271−0.22810.250.6191
Elevation11.01460.440.5092−2.45710.680.4103
Slope1−0.12320.030.86300.6220.20.6537
Scale11.1264 2.1869
Stem isofraxidinRoot isofraxidin
Intercept116.06872.450.11731.61751.740.1866
Temperature12.10629.670.00190.309414.640.0001
RH1−0.60874.470.03460.162822.43<0.0001
Rainfall1−1.27180.90.3438−0.512710.220.0014
Longitude10.007600.97060.04853.850.0496
Latitude10.000900.9546−0.00272.070.1499
Elevation10.75874.740.02950.02660.410.5219
Slope1−2.23293.890.0486−0.09630.510.4762
Scale15.9059 0.705
1 Values in bold font indicate estimates that have significant contribution to dependent variables.

