Changes in the Species Composition of Elms (Ulmus spp.) in Poland


1
Institute of Dendrology, Polish Academy of Sciences, 62-035 Kórnik, Poland
2
Institute of Landscape Architecture, Wrocław University of Environmental and Life Sciences, 50-375 Wrocław, Poland
3
Faculty of Forestry, Poznań University of Life Sciences, 60-637 Poznań, Poland
*
Author to whom correspondence should be addressed.
Forests 2019, 10(11), 1008; https://0-doi-org.brum.beds.ac.uk/10.3390/f10111008
Submission received: 5 October 2019
/
Revised: 7 November 2019
/
Accepted: 9 November 2019
/
Published: 11 November 2019
Abstract
:In nearly 600 randomly selected forest stands including elms (Ulmus spp.), we conducted field research to identify them to species level and to find trees showing symptoms of Dutch elm disease (DED). The presented data show that all the 3 native elms (U. glabra, U. laevis, and U. minor) still exist in the whole ranges of their distribution in Poland reported earlier, but their role as forest-forming species has changed. In comparison to published data, the contribution of U. minor has markedly decreased, while an increased contribution was observed in the case of U. laevis, a species which in the past was predominantly located out of woodland and was rarely cultivated. In mountains, where the most frequent is U. glabra, the contribution of elms to forest stands is currently clearly lower than in the lowlands and uplands of Poland. The observed changes most probably result from Dutch elm disease. It cannot be excluded that the changes are at least partly linked with natural correction of forest stand composition modified earlier by human activity (silviculture). In all parts of Poland, trees with symptoms of Dutch elm disease are found, but large-scale decline (of a majority of elm trees) is observed only in about 1.5% of the directly investigated localities.
1. Introduction
Three elm species are native to Poland: wych elm (Ulmus glabra Huds.), field elm (U. minor Mill.), and European white elm (fluttering elm) (U. laevis Pall.). U. glabra prefers submontane and montane zones. Outside mountainous regions, it usually occurs in mixed stands with the other 2 native elm species, U. minor and U. laevis. The other 2 species occupy the lowlands and the submontane zone, mostly in river valleys, along streams, in riverine forests, and in forests on sunny slopes (U. minor) [1,2,3,4,5]. According to some sources cited above, including the publication by Matuszkiewicz [4], based on extensive phytosociological literature, U. minor is regarded as the most important forest-forming elm species in natural forests in the lowlands of Poland, e.g., in the major alluvial forest communities in this region, while U. laevis is always an admixture. Overall, in comparison with other tree genera, there are few publications on Ulmus spp. Most of them concern various issues more or less associated with the problem of Dutch elm disease (DED) epidemics (e.g., [6,7,8,9,10,11,12]). Further on, there are publications on ecophysiology and recently also genetics [13,14,15]. There is a shortage of publications on the quantitative contribution of individual species to forest stands in a given area.
The rapid decline in interest of elm cultivation was associated with the onset of the epidemic of Dutch elm disease (DED). In Europe, it is caused by two fungal species, Ophiostoma ulmi and O. novo-ulmi, and spread by bark beetles (subfamily Scolytinae). Fungal spores are transferred from infected trees to healthy ones by young beetles that feed after emergence (before reaching sexual maturity) in the crowns of elm trees, excavating galleries or cavities in the young bark and wood of shoots. The processes that regulate the current beetle-fungus symbiosis remain poorly understood. The relationships between elm bark beetles and O. ulmi s.l. depend on several factors, such as the climatic and environment characteristics, and the interactions between the components of the biotic community [16,17,18,19].
DED was first observed in France in 1918, followed by Germany in 1921, and Austria in 1926. In Poland, it was first recorded probably in Katowice in 1927 (although the pathogen was not identified). The occurrence of the pathogen was confirmed in northern Poland in 1932, whereas in Warsaw, in 1935. In the 1950s and 1960s, the disease was reported from all parts of the country and caused substantial losses in urban green areas and on roadsides, but also in forests [20,21]. Apart from the pathogen identified in the 1920s and 1930s, O. ulmi, also the more aggressive strain, O. novo-ulmi, was observed, but it was confirmed as late in 1978 [22]. The occurrence of both these strains as well as O. americana was reported in 2004. However, in studies conducted by our research team, only O. novo-ulmi was identified [23].
This paper presents results of our assessment of the contributions of individual elm species to forest stands in various parts of Poland and occurrence of DED symptoms. This study was part of a research programme aimed to investigate the current elm resources in Poland and to form a basis for elm restitution and conservation.
2. Materials and Methods
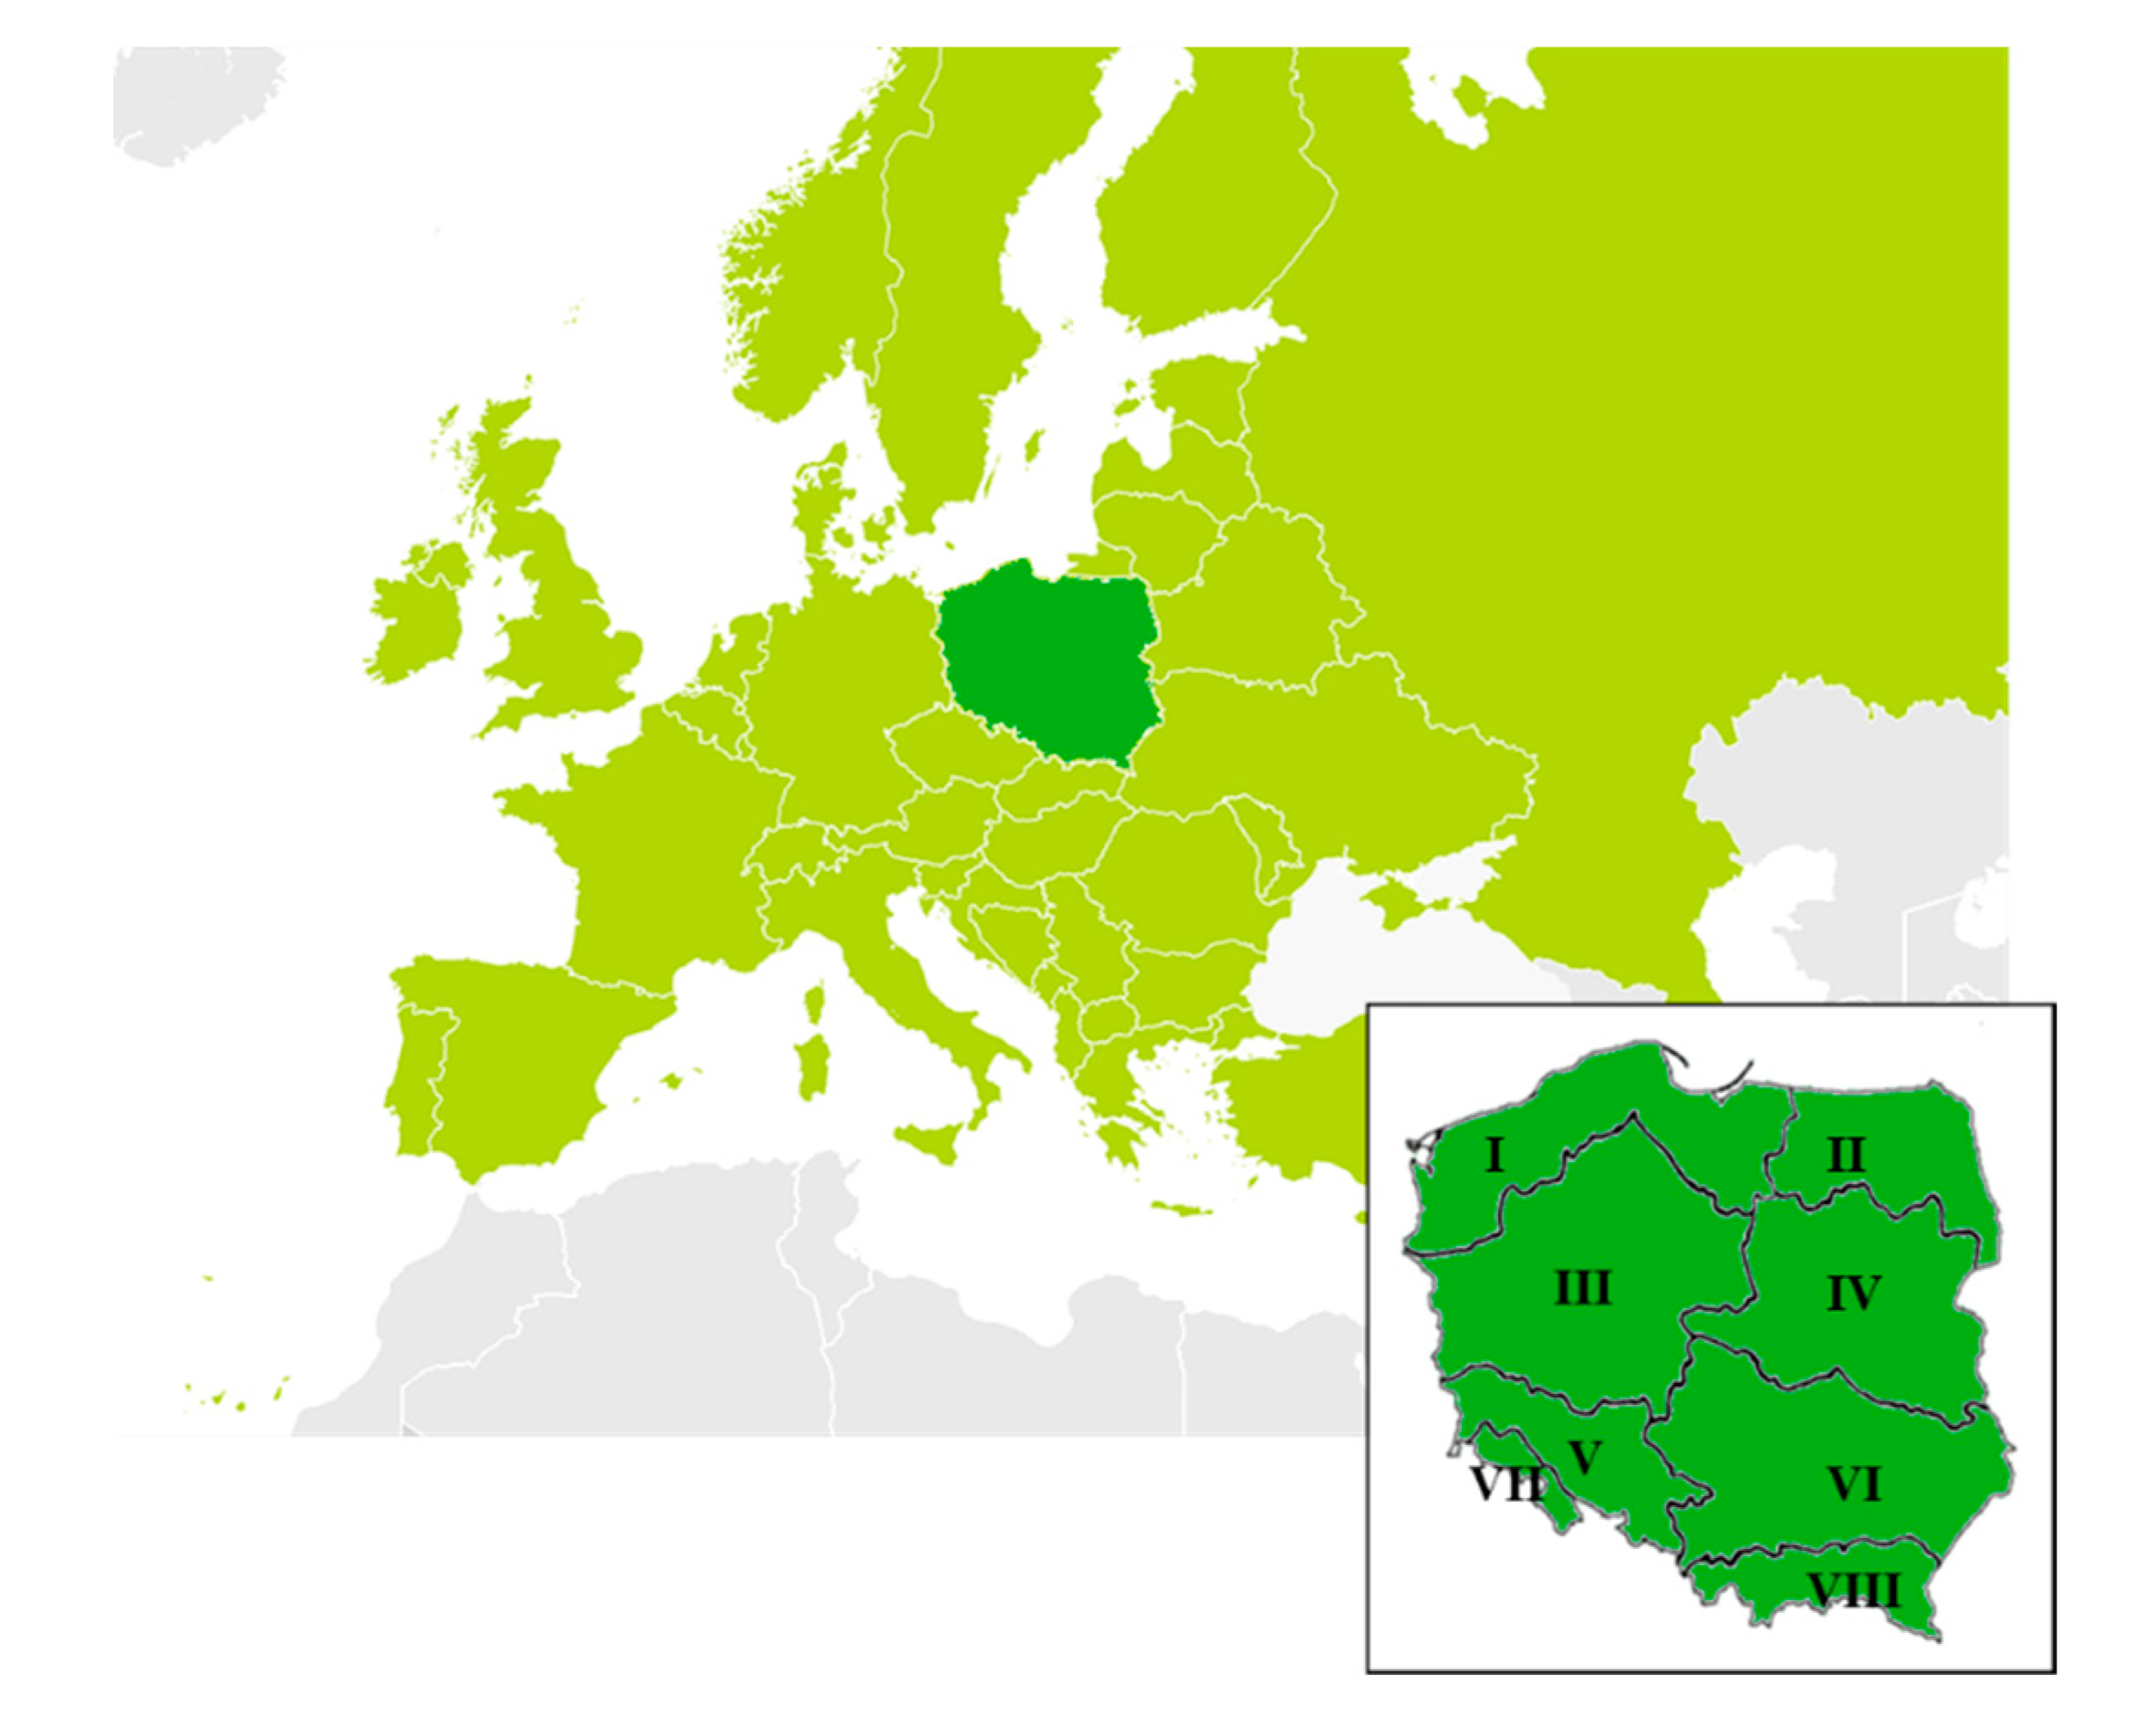
Poland is divided into 8 forest regions (Figure 1, Table 1), each characterized by relatively uniform physiographic conditions and climate, so we collected data on elms and DED in all the regions [24].
Forest plots with elms in Poland were identified, located, and initially described based on forest inventory data, available in a database of the National State Forests Holding, a table of all forest plots including elms during the last forest management survey [25].
Selection of forest stands for this study was carried out in 2013 (the beginning of the study) on the basis of the latest forestry documentation. Forests in Poland are surveyed by foresters continuously, in 10-year cycles, to cover all the forest stands. Hence, the data used as a basis for selection of forest stands with elms were collected in 2004–2013. However, data on individual forest stands were later updated, taking into account new forest surveys conducted by foresters [25].
Forestry documentation usually did not include information on individual species of elm in each of the forest stands. As a result, data on elm species had to be collected directly in the field.
In Poland, forests are divided by a network of treeless lines into administrative units known as forest divisions, covering about 25 hectares each. Those units are composed of irregular smaller units known as forest plots (FPs.), delimited on the basis of factors related to forest stand structure. A forest plot (FP.) is a forest patch uniform in respect of economically important characters (e.g., tree age and species composition), which needs to be managed in a uniform way. It is a basic unit of forest description and forest management planning. Its synonyms are forest subdivision or simply forest stand in jargon. The minimum size of FP. is 1 hectare if the variation of forest units is low and 0.5 hectare if the variation is high. In nature reserves and experimental forests, FP. are delimited irrespective of plot size [26].
The forest plots (FPs.) described above were the basis for distinguishing the elm localities in our study.
In Polish conditions, all forest stands (FPs.) every 10 years are subject to a survey. Special departments (Offices of Forest Management) then investigate directly all the forest plots in a given Forest District, describe the forest stands and make measurements. Thanks to this, each forest stand (FP.) is provided with a detailed description. The description includes the following elements: area, tree species composition, age, forest stand health and technical characters, and tree dimensions of the species accounting about 10% of the canopy. Currently, contributions of individual species are generally determined separately for each layer of the forest stand. It is determined as the percentage contribution of the given species to the total projected crown area in the given layer [26].
The General Directorate of State Forests collects data on forest stands in all forest units in a computer database. A large proportion of the included data (e.g., concerning individual FP. are available on the online Forest Database [27]).
As a result of our application, we received from the Forest Database an Excel spreadsheet with data on all the forest plots where elms were recorded during the last forest survey (about 60,000 records). The spreadsheet included FP. numbers (enabling their unambiguous identification in the field) with data on plot area, forest site type, layers of vegetation, and percentage contribution and age of elm trees. In some cases a FP. appeared in more than one record, because if trees of the same species differ in age more than 20 years on average or form distinct layers, then in the tabulated description the relevant data (mean height, mean breast height diameter, etc.) are recorded separately. However, the data are recorded only if tree crowns of the given species and age group cover at least 10% of plot area. More detailed descriptions of the FP. are available in the online Forest Database [27].
The available data were divided into individual geographical units (forest regions, forest districts) and according to other criteria, such as elm age and percentage contribution to the forest stand (FP.). In each of the 8 investigated forest regions, we selected forest districts located in different parts of the region, preferring those where forest plots (FP.) with variable contributions of elms were located. In total, field work included 67 forest districts located in various parts of Poland. Within individual forest districts, FPs. were basically selected randomly, but with various contributions of elms: 33% of the investigated FPs. were dominated by elm (contribution >50%), in 33% of FPs., elms accounted for 10%–50% of trees, and in the remaining 33% of FPs., the contribution of elms was <10%. We also selected plots (FPs.) so, that half of them were young (up to 50 years old), while the other half were plots with elms older than 50 years.
If during random selection the same plot was selected twice (a rare event), e.g., as a locality of younger elms and of elms older than 50 years, an additional FP. was selected.
In total, for direct field research, we selected in this way 500 FPs., in individual forest regions proportionally to the number of records in the table from the General Directorate of State Forests. In forest regions II, V, and VII, because of additional investigations, the number of FPs was increased by about 100 in total (600 FPs. were investigated directly).
The criteria used in the distinguishing of elms’ localities is described below. Each species found in the same forest plot (FP) was treated as a separate locality, even if it was represented by one individual only. This was justified by the fact that currently most of the elm trees in Poland grow singly or in small groups [25]. Besides, several or even single individuals usually indicate that the given species was more numerous there in the past.
Rarely, individuals of the same species within a given forest plot (FPs.) were treated as 2–3 localities, if they formed distinct layers of vegetation: always in the canopy, whereas in the lower layers of vegetation, only if the crowns of elms in the lower layer covered the same or larger area than in the canopy or if their cover exceeded 50% of plot area. If the above criteria were not met, the trees in lower layers were described jointly with trees in the uppermost layer, and that layer determined their age classification. This was partly due to the fact that in forestry documentation for trees of the same species found in various layers of the same plot (FP.), separate records are created. However, on the other hand, nearly always some elm seedlings are found under the canopy of older trees, but this does not mean that they form a young generation, which in the future will regenerate the existent population. Distinguishing of infrequent seedlings as a separate locality in situations when the given species is already listed in the given plot (FP.) would not be justified. It is assumed that regeneration of a given population is highly probable if the crowns of the lower layer cover a similar or larger area than the cover of tree crowns in the upper layer [26]. In such a situation, uncommon in Polish elms populations (this applied only to 12 directly investigated forest plots), treating the elms in the lower layer as a separate locality was justified in our opinion. Consequently, the total number of localities analysed in this paper was higher than planned initially.
During field survey, we verified the data included in the detailed FP. descriptions, available in offices of individual forest districts and in the online Forest Database [27]. We assessed visually the contributions of elm (percentage contribution of projected crown area in the given layer). First of all, we identified elm species and determined if and to what extent they showed DED symptoms.
Tree age was determined mostly on the basis of data from the detailed descriptions of individual forest plots [27].
Field research was conducted mainly in 2013–2017. DED occurrence was determined on the basis of its commonly known symptoms described e.g., by Hartman et al. [28]: Characteristic withering of leaves, ring-like discolouration within the sapwood, characteristic beetle feeding galleries under the bark of dying trees. From some forest stands, samples were collected and subjected to phytopathological inspection in the laboratory, which usually confirmed the occurrence of pathogenic Ophiostoma species, as reported in a separate paper [23].
The assessment of DED symptoms was initially made by all members of our team jointly for consistency. Twigs were collected at each plot from selected trees, mostly in situations when the symptoms were not evident, e.g., only dry, leafless shoots. Samples for phytopathological analyses in the laboratory were randomly collected from individual forest regions.
In this study we took into account only the presence or absence of DED symptoms in a given locality.
Like in respect of percentage contribution, also in respect of DED symptoms, each species was analysed separately. That is why sometimes the same forest plot was classified as a locality affected by DED in one species (e.g., U. minor) and simultaneously as a locality without DED symptoms in another elm species (most often U. laevis).
Differences in percentage distributions of the analyzed features for individual forest regions were tested using the χ2 test. The significance of differences between individual species in the percentage of localities with DED symptoms was tested using the Tukey’s test. In the analyses, software Statistica version 8.0 (StatSoft Polska Inc., USA) was used. Data in % were transformed before the analysis according to formula of Bliss [29].
3. Results
In the 600 forest plots included in this study, in total 797 localities of the 3 elm species were distinguished: 516 of U. laevis, 179 of U. glabra, and 102 of U. minor (65%, 22%, and 13% of the total, respectively). Table 2 shows data concerning all forest plots with elms, plots selected for this study, and number of distinguished localities of individual species. Special attention was paid to the localities where DED symptoms were observed and to the forest stands (FPs.) dominated by a given elm species. The data are presented separately for 8 forest regions and 2 age groups: younger and older than 50 years.
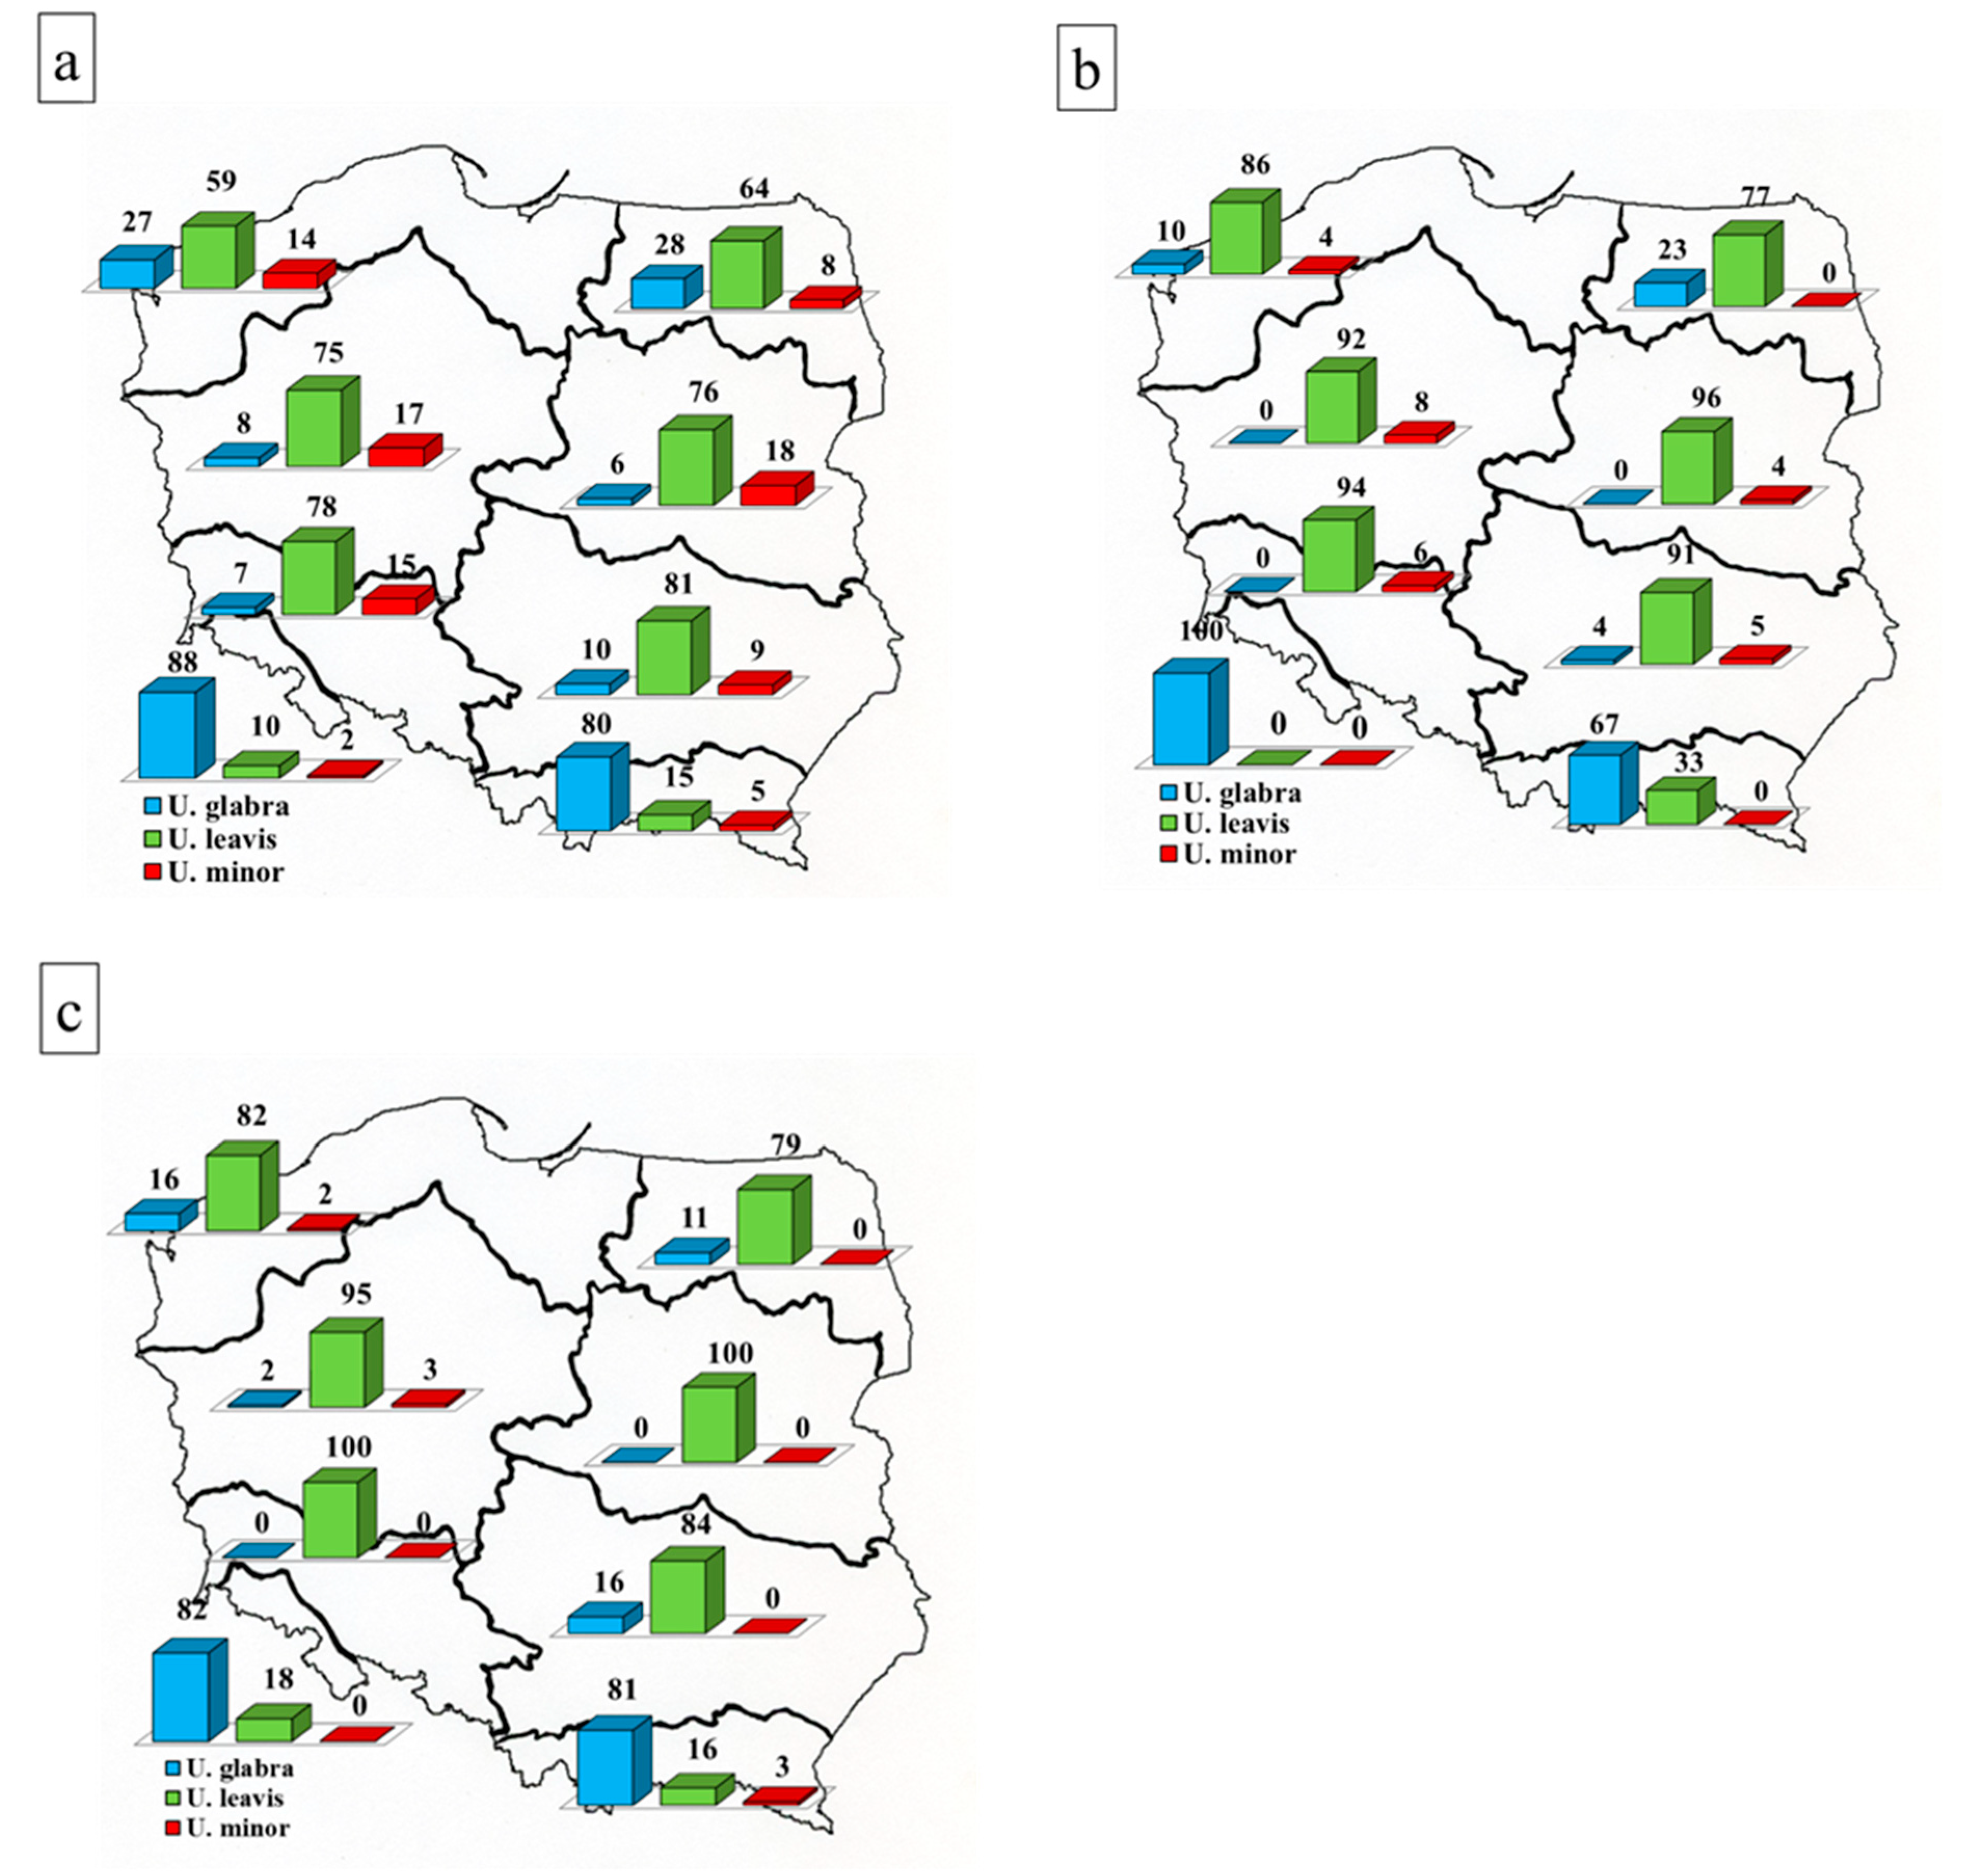
Contributions of individual species to the total number of elm localities in individual forest regions (Figure 2) indicate that U. laevis has much more localities than the other species in nearly all forest regions, as it accounts for 59%–81% of all localities. The only exceptions are the mountainous regions VII and VIII, where only U. glabra is frequent. Among the localities where elms are dominant species or are on average older than 50 years, percentage contributions of U. laevis are even higher (77–96% and 77–100%, respectively).
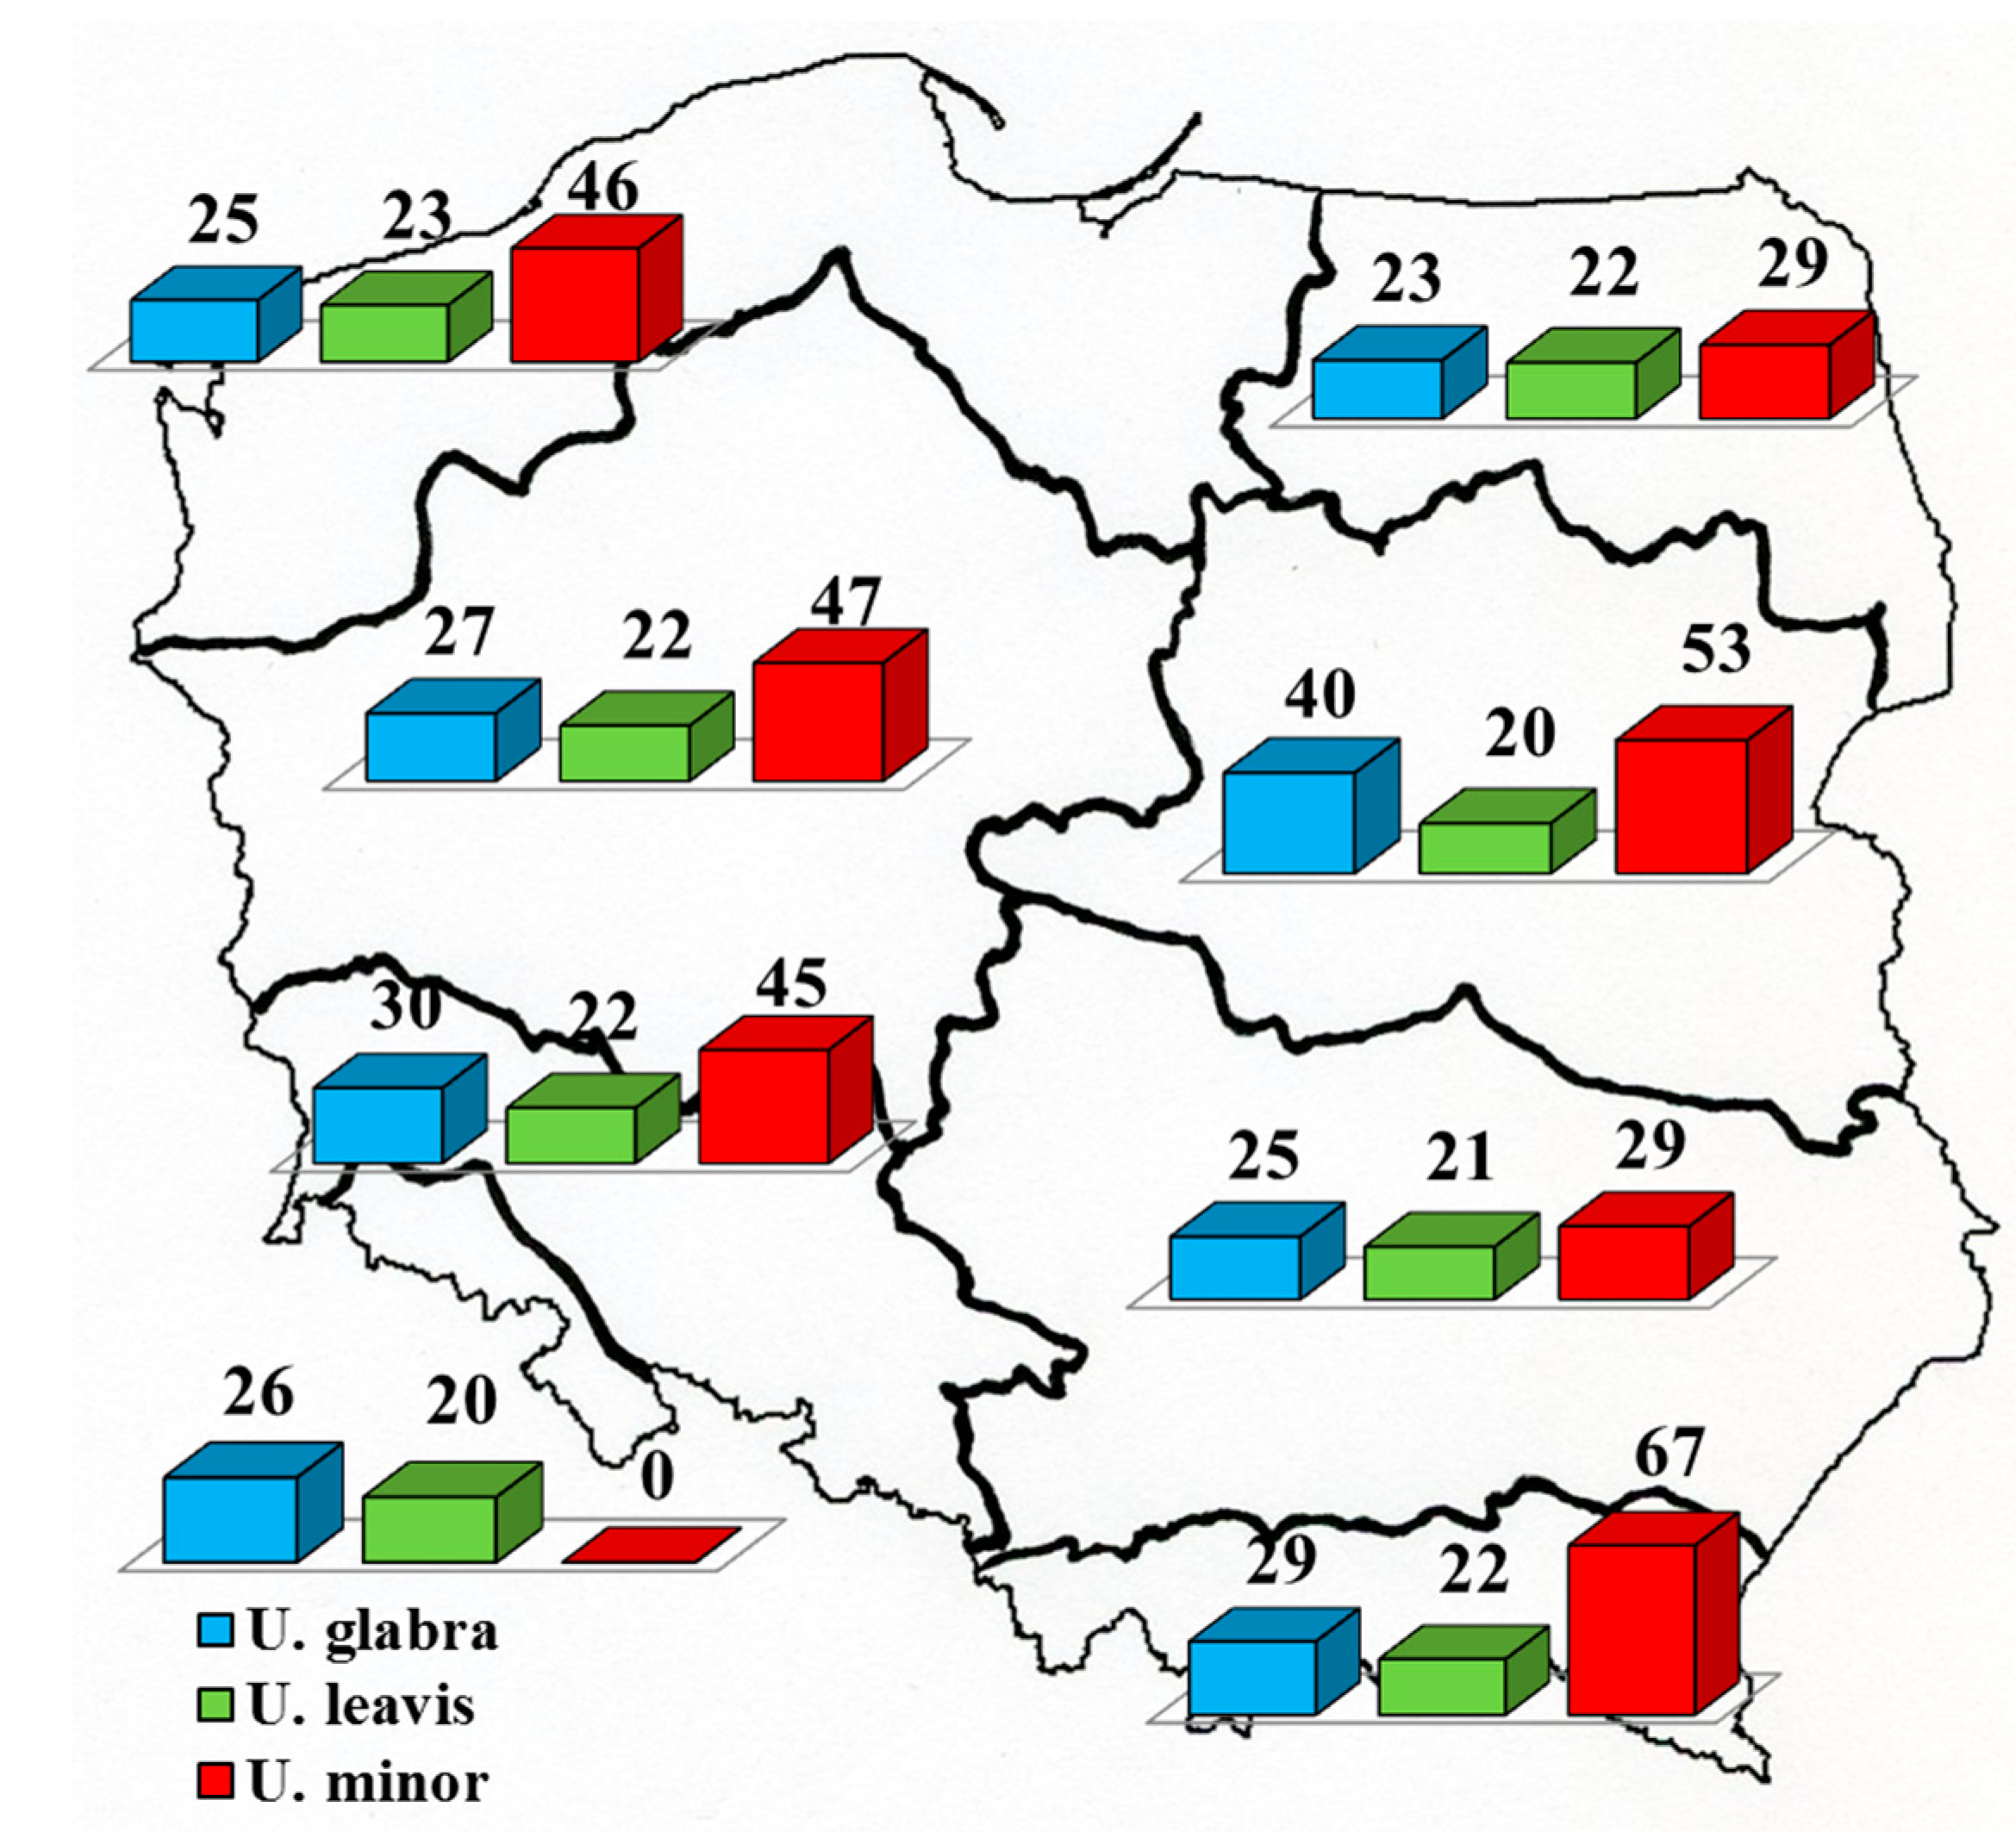
Figure 3 presents percentage contribution of localities with Dutch elm disease to the total pool of investigated localities of individual Ulmus spp.
Data on percentage contributions of localities with DED symptoms for U. laevis and especially U. minor in mountainous regions (VIII, and particularly VII) should be treated as rough estimates because of the small number of localities (3 and 1 localities, U. minor).
The data presented in Table 3a–c suggest that three groups of regions with a similar contribution of individual elm species can be distinguished. The first group consists of regions I and II, located in the north of Poland. They are distinguished by the greater share of U. glabra and slightly less dominance of U. laevis. Certain similarities to these regions are shown by the upland region VI (3c). However, in general (all plots jointly and plots dominated by elms) this region is similar to the group of lowland regions III, IV, and V (3a and 3b), distinguished by clear U. laevis domination. The third group of regions is composed of the above-mentioned mountainous regions VII and VIII. They are distinguished by the dominance of U. glabra and by the low participation of U. laevis and especially U. minor. Data from Figure 3 and Table 3d suggest no significant differences in DED occurrence in the different regions. Localities of U. laevis with some trees showing DED accounted in individual forest regions (excluding mountainous regions VII and VIII) for 20%–22% of the total number of investigated localities of this species. The corresponding values for U. glabra and U. minor were 25%–40% and 29%–47%. The mean values of 21%, 32,5% and 38%, respectively, differ statistically (Tukey’s test, p < 0.05).
Trees with DED symptoms were also recorded in all parts of Poland, but in most of the investigated forest stands one to several dozen trees were affected by the disease, and large-scale decline (a majority of elm trees showing DED symptoms) was observed only in 9 localities (1.5%).
4. Discussion
The presented data show that in spite of the long-term impact of DED, all of the 3 analysed elms are found in all parts of Poland.
The majority of the examined elm trees represented U. laevis, i.e., a species that was not commonly grown in forests in the past [5] and silvicultural literature cited. This species clearly dominates in most parts of Poland, particularly in forest regions III (Wielkopolska-Pomerania), IV (Mazovia-Podlasie), V (Silesia), and VI (Małopolska). This species prevails especially in older forest stands and in forest stands dominated by elms.
Similarly, U. minor is distributed throughout Poland, except for the highest parts of the mountains. Large specimens and forest stands dominated by this species are very rare.
U. glabra has maintained its dominant position in mountainous regions. However, a strong impact of DED on this species is evidenced by a markedly lower proportion of elms per unit of forest area in mountainous regions (virtually no forest stands dominated by elms in this region), and very few older trees in non-mountainous forest stands. Higher contributions of this species outside mountains were recorded in the forest regions with higher numbers of forest sites on slopes, i.e., in the northern forest regions I and II, shaped by the last glacial period, and forest region VI, located in the south, in the belt of uplands dissected by gullies.
Published data indicated that in comparison with the 1970s, the number of forest stands dominated by elms has increased [25,30]. The percentage of localities with DED symptoms in individual forest regions is very similar (Figure 3, Table 3d). Nevertheless, relatively, the least damaged species is U. laevis. The currently observed clear dominance of U. laevis in a larger part of Poland, especially with regard to older trees and localities with a higher contribution of elms, also suggests a markedly stronger impact of DED on two other species. According to the literature [2,4], U. laevis in non-mountainous parts of Poland should be less common than U. minor in both anthropogenic communities and in nearly natural vegetation. According to Matuszkiewicz [4], in alluvial forests, the ratio of the two species should be about 1:4 or even 1:8. It should be noted that the literature data on which Matuszkiewicz (l.c.) was based, originated mainly from the second half of the 20th century. Presumably the remarkable change in their proportions is due to DED. U. minor is the elm species considered to be the most susceptible to DED, while U. laevis is considered to be the less impacted since the beetle vectors of this disease colonize trees of this species less commonly [31]. It is noteworthy, however, that the dominance of U. minor in forest stands on potential sites of lowland alluvial forest in Poland [2,4], contrasts with some published reports from other countries, both from the East and from the West of Europe [1,32,33,34], which suggest that the most typical elm species of alluvial forests is U. laevis. Nevertheless, it cannot be excluded that the contribution of U. minor to alluvial forests was artificially increased before the DED epidemics. In the case of fungal diseases transmitted by insect vectors, the effectiveness of the transmission often depends on tree condition. Bark beetles (Scolytus spp.), as secondary pests, prefer weaker trees [35]. The artificial elevation of the contribution of U. minor on alluvial sites could be a factor that slightly increased the impact of the pathogen on the species, although it probably was not a dominant factor.
According to Mackenthun [36,37], in Saxony, humans destroyed about 90 fertile alluvial forests where percentage contributions of elms were the highest. Probably a similar trend was observed all over West and Central Europe because forests of this type grow on very fertile alluvial soils, which are very attractive to agriculture. Data presented by Matuszkiewicz [38] indicate that in Poland only about 3% of fertile elm-ash forests are left, i.e., even less than in Saxony. However, it must be noted that currently over two-thirds of elms are scattered on more numerous non-alluvial sites, mostly in oak-hornbeam forests [25].
As mentioned above, in current forest practice, individual elm species are often not distinguished, although it is easy to identify U. laevis during seed collection. Due to this, in some regions, an increased contribution of one species can be accidental, but it should not be assumed that this applies to the whole country. The dominance of U. laevis in Saxony’s alluvial forests was reported also by Mackenthun [36,37], whereas in riverine forests in the Oder (Odra) valley in western Poland, by Danielewicz [39].
To present properly the problems linked with DED, many factors must be taken into account, e.g., plot area, size of the local population, number and percentage of trees with DED symptoms, percentage of crown involvement, coexistence of several species of elms within one plot, occurrence of elms in neighbouring forest plots, size of the forest complex, forest site type, and differences between regions. These relationships will be discussed separately, in at least one publication. Here we would like to draw attention to two interesting findings linked with changes in dominance structure of elm resources: (1) DED is still observed throughout the country; and (2) U. laevis is significantly less affected by the disease than the other species.
Author Contributions
Conceptualization, A.N-F., M.F., P.Ł.; methodology, A.N-F., M.F.; software, A.N-F., M.F., P.Ł.; validation, M.F., P.Ł.; formal analysis, A.N-F., M.F.; investigation, A.N-F., M.F., P.Ł.; resources, A.N-F; data curation, A.N-F., M.F., P.Ł.; writing—original draft preparation, A.N-F., M.F.; writing—review and editing, A.N-F., M.F.; visualization, A.N-F.; supervision, A.N-F.; project administration, A.N-F.; funding acquisition, A.N-F.
Funding
This study was supported by the National Science Centre, Poland, grant No. 2011/01/B/NZ9/02883 “Assessment of the present population size, distribution, and condition of elms (Ulmus spp.) in Poland.” and the Institute of Dendrology, Polish Academy of Sciences, Kórnik, Poland.
Conflicts of Interest
The authors declare no conflicts of interest. The funders had no role in the design of the study; in the collection, analyses, or interpretation of data; in the writing of the manuscript; or in the decision to publish the results.
References
- Richens, R.H. Elm; Cambridge University Press: Cambridge, UK, 1983. [Google Scholar]
- Boratyńska, K.; Sękiewicz, M.; Boratyński, A. Morfologia, systematyka, zmienność i rozmieszczenie geograficzne [Morphology, systematics, variability and geographical distribution]. In Wiązy [Elms]; Bugała, W., Boratyński, A., Iszkuło, G., Eds.; Bogucki Wydawnictwo Naukowe: Poznan, Poland, 2015; pp. 24–52. [Google Scholar]
- Collin, E.; Bozzano, M. Implementing the dynamic conservation of elm genetic resources in Europe: Case studies and perspectives. iForest Biogeosci. For. 2015, 8, 143–148. [Google Scholar] [CrossRef]
- Matuszkiewicz, J.M. Rola wiązów w zespołach roślinnych Polski [The role of the elms in plant associations in Poland]. In Wiązy [Elms]; Bugała, W., Boratyński, A., Iszkuło, G., Eds.; Bogucki Wydawnictwo Naukowe: Poznan, Poland, 2015; pp. 181–235. [Google Scholar]
- Filipiak, M.; Napierała-Filipiak, A. Zarys ekologii [Outline of ecology]. In Wiązy [Elms]; Bugała, W., Boratyński, A., Iszkuło, G., Eds.; Bogucki Wydawnictwo Naukowe: Poznan, Poland, 2015; pp. 133–181. [Google Scholar]
- Martín, J.A.; Esteban, L.G.; De Palacios, P.; Solla, A.; Gil, L. Bordered pit and ray morphology involvement in elm resistance to Ophiostoma novo-ulmi. Can. J. For. Res. 2009, 39, 420–429. [Google Scholar] [CrossRef]
- Solheim, H.; Eriksen, R.; Hietala, A.M. Dutch elm disease has currently a low incidence on wych elm in Norway. For. Pathol. 2011, 41, 182–188. [Google Scholar] [CrossRef]
- Martín, J.A.; Sobrino-Plata, J.; Rodríguez-Calcerrada, J.; Collada, C.; Gil, L. Breeding and scientific advances in the fight against Dutch elm disease: Will they allow the use of elms in forest restoration? New For. 2018, 50, 183–215. [Google Scholar] [CrossRef]
- Urban, J.; Dvořák, M. Sap flow-based quantitative indication of progression of Dutch elm disease after inoculation with Ophiostoma novo-ulmi. Trees 2014, 28, 1599–1605. [Google Scholar] [CrossRef]
- Menkis, A.; Östbrant, I.L.; Wågström, K.; Vasaitis, R. Dutch elm disease on the island of Gotland: Monitoring disease vector and combat measures. Scand. J. For. Res. 2016, 31, 237–241. [Google Scholar] [CrossRef]
- Flynn, L.E.; Mitchell, F.J.G. Comparison of a recent elm decline with the mid-Holocene Elm Decline. Veg. Hist. Archaeobot. 2018, 28, 391–398. [Google Scholar] [CrossRef]
- Martin, J.A.; Solla, A.; Ruiz-Villar, M.; Gil, L. Vessel length and conductivity of Ulmus branches: Ontogenetic changes and relation to resistance to Dutch elm disease. Trees 2013, 27, 1239–1248. [Google Scholar] [CrossRef]
- Del Puerto, M.M.; García, F.M.; Mohanty, A.; Martín, J.P. Genetic Diversity in Relict and Fragmented Populations of Ulmus glabra Hudson in the Central System of the Iberian Peninsula. Forests 2017, 8, 143. [Google Scholar] [CrossRef]
- Gong, J.; Zhang, Z.; Zhang, C.; Zhang, J.; Ran, A. Ecophysiological Responses of Three Tree Species to a High-Altitude Environment in the Southeastern Tibetan Plateau. Forests 2018, 9, 48. [Google Scholar] [CrossRef]
- Sepúlveda, P.; Johnstone, D.M. A novel way of assessing plant vitality in urban trees. Forests 2019, 10, 2. [Google Scholar] [CrossRef]
- Brasier, C.M. Ophiostoma novo-ulmi sp. nov., causative agent of the current Dutch elm disease pandemics. Mycopathologia 1991, 115, 151–161. [Google Scholar] [CrossRef]
- Santini, A.; Montaghi, A.; Vendramin, G.G.; Capretti, P. Analysis of the Italian Dutch Elm Disease Fungal Population. J. Phytopathol. 2005, 153, 73–79. [Google Scholar] [CrossRef]
- Solla, A.; Dacasa, M.C.; Nasmith, C.; Hubbes, M.; Gil, L. Analysis of Spanish populations of Ophiostoma ulmi and O. novo-ulmi using phenotypic characteristics and RAPD markers. Plant Pathol. 2008, 57, 33–44. [Google Scholar] [CrossRef]
- Santini, A.; Faccoli, M. Dutch elm disease and elm bark beetles: A century of association. iForest Biogeosci. For. 2015, 8, 126–134. [Google Scholar] [CrossRef]
- Mańka, K.; Sobiczewski, P.; Mańka, M.; Fiedorow, Z. Fitopatologia Leśna [Forest Pathology]; PWRiL: Warszawa, Poland, 2005. [Google Scholar]
- Grzywacz, A. Ważniejsze choroby infekcyjne. In Wiązy [Elms]; Bugała, W., Boratyński, A., Iszkuło, G., Eds.; Bogucki Wydawnictwo Naukowe: Poznan, Poland, 2015; pp. 324–367. [Google Scholar]
- Mańka, K.; Bałązy, S.; Chwaliński, K.; Michalski, J. Odporność wiązów w Poznaniu i okolicy na holenderską chorobę wiązu [Elm resistance to Dutch elm disease in Poznań and the surrounding area]. Zesz. Probl. Postępów Nauk Rol. 1978, 198, 251–265. [Google Scholar]
- Łakomy, P.; Kwaśna, H.; Kuźmiński, R.; Napierała-Filipiak, A.; Filipiak, M.; Behnke, K.; Behnke-Borowczyk, J. Investigation of Ophiostoma population infected elms in Poland. Dendrobiology 2016, 76, 137–144. [Google Scholar] [CrossRef]
- Zielony, R.; Kliczkowska, A. Regionalizacja Przyrodniczo-Leśna Polski 2010 [Natural-Forest Regionalization of Poland 2010]; CILP: Warszawa, Poland, 2012. [Google Scholar]
- Napierała-Filipiak, A.; Filipiak, M.; Jaworek, J. Rozmieszczenie zasobów drzew z rodzaju wiąz (Ulmus spp.) w lasach Polski w świetle dokumentacji leśnej [Distribution of elms (Ulmus spp.) in Polish forests according to the forestry inventory]. Sylwan 2014, 158, 811–820. [Google Scholar]
- Jaszczak, R.; Magnuski, K. Urządzanie Lasu [Forest Inventory]; Wydawnictwo Uniwersytetu Przyrodniczego: Poznan, Poland, 2010. [Google Scholar]
- Forest Data Bank. Available online: https://www.bdl.lasy.gov.pl/portal/ (accessed on 9 November 2019).
- Hartmann, G.; Nienhaus, F.; Butin, H. Farbatlas Waldschäden: Diagnose von Baumkrankheiten; Eugen Ulmer KG: Stuttgart, Germany, 2007. [Google Scholar]
- Snedecor, G.W.; Cochran, W.G. Statistical Methods, 6th ed.; The Iowa State University Press: Ames, IA, USA, 1976; pp. 327–329. [Google Scholar]
- Napierała-Filipiak, A.; Filipiak, M.; Łakomy, P.; Kuźmiński, R.; Gubański, J. Changes in elm (Ulmus) populations of mid-western Poland during the past 35 years. Dendrobiology 2016, 76, 145–156. [Google Scholar] [CrossRef]
- Pajares, J.A.; Martín-Benito, D.; García-Vallejo, M.C.; López, D. Triterpenes in elms in Spain. Can. J. For. Res. 2005, 35, 199–205. [Google Scholar]
- Pogrebniak, P. Podstawy Typologii Leśnej [Basics of Forest Typology]; PWRiL: Warszawa, Poland, 1961. [Google Scholar]
- Li, M.; Lopez, R.; Venturas, M.; Pita, P.; Gordaliza, G.G.; Gil, L.; Rodríguez-Calcerrada, J. Greater resistance to flooding of seedlings of Ulmus laevis than Ulmus minor is related to the maintenance of a more positive carbon balance. Trees 2015, 29, 835–848. [Google Scholar] [CrossRef]
- Venturas, M.; Fuentes-Utrilla, P.; López, R.; Perea, R.; Fernández, V.; Gascó, A.; Guzmán, P.; Li, M.; Calcerrada, J.R.; Miranda, E.; et al. Ulmus laevis in the Iberian Peninsula: A review of its ecology and conservation. iForest Biogeosci. For. 2015, 8, 135–142. [Google Scholar] [CrossRef] [Green Version]
- Mańka, M. Choroby Drzew Leśnych [Diseases of Forest Trees]; PWRiL: Warszawa, Poland, 2011. [Google Scholar]
- Mackenthun, G.L. The role of Ulmus laevis in German floodplain landscapes. For. Syst. 2004, 13, 55–63. [Google Scholar]
- Mackenthun, G.L. Elm Losses and their Causes over a 20 Year Period—A long-term Study of Ulmus in Saxony, Germany. In Proceedings of the Third International Elm Conference, Florence, Italy, 9–11 October 2013. [Google Scholar]
- Matuszkiewicz, J.M. Zespoły Leśne Polski [Forest Plants Communities in Poland]; Wydawnictwo Naukowe PWN: Warszawa, Poland, 2002. [Google Scholar]
- Danielewicz, W. Ekologiczne Uwarunkowania Zasięgów Drzew i Krzewów na Aluwialnych Obszarach Doliny Odry[Ecological determinants of the range of trees and shrubs in the alluvial areas of the Oder valley]; Wydawnictwo Uniwersytetu Przyrodniczego: Poznan, Poland, 2008. [Google Scholar]
Figure 1.
Location of Poland (dark green) on a map of Europe and the studied forest regions (I–VIII, described in Table 1).
Figure 1.
Location of Poland (dark green) on a map of Europe and the studied forest regions (I–VIII, described in Table 1).

Figure 2.
Percentage contributions of localities of U. glabra, U. laevis and U. minor in individual forest regions: for all localities jointly (a), for localities dominated by elms (b), and for localities where elm trees were older than 50 years (c). The data are broken down by forest regions.
Figure 2.
Percentage contributions of localities of U. glabra, U. laevis and U. minor in individual forest regions: for all localities jointly (a), for localities dominated by elms (b), and for localities where elm trees were older than 50 years (c). The data are broken down by forest regions.

Figure 3.
Number of localities of the given species with symptoms of Dutch elm disease and number of localities of this species (expressed as percentage).
Figure 3.
Number of localities of the given species with symptoms of Dutch elm disease and number of localities of this species (expressed as percentage).


Table 1.
Characteristics of individual forest regions in Poland [24].
Table 1.
Characteristics of individual forest regions in Poland [24].
| Forest Region | Area (km2) | Forest Area/Area (%) | Average Annual Temperature (oC) | Growing Season (Days) | Average Annual Rainfall (mm) | Dominant Forest Site Types | Altitude level (m a.s.l.) |
|---|---|---|---|---|---|---|---|
| I | 40,188 | 28.6 | 8.5 | 210–220 | 550–700 | FMCF—31% FCF—28.8% FMDF—17.1% FDF—11% | 0–329 |
| II | 27,660 | 33.7 | 7.5 | 180–200 | 550–600 | FCF—32.8% FMCF—26% FMDF—13.1% FDF—10.2% | 40–150 (one extreme 309 m) |
| III | 71,483 | 33.2 | 8.5 | 210–220 | 500–570 | FCF—53.2% FMCF—19.4% DCF—8.4% FMDF—7.7% | 40–220 |
| IV | 53,199 | 21.7 | 8.0 | 200–210 | 500–550 | FCF—39.9% FMCF—19.3% FMDF—13% FDF—8.4% | 60–235 |
| V | 27,202 | 28.3 | 8.0 | 210–220 | 550–650 | FCF—25.8% FMCF—24.1% FMDF—12.7% WMCF—11.4% | 100–718 |
| VI | 68,522 | 24.9 | 8.0 | 200–210 | 650 | FCF—29.6% FMCF—21.1% FMDF—14.3% FDF—9.3% | 150–612 |
| VII | 5036 | 41.3 | 7.5 | 190–210 | 600–700 | MMCF—32.1% MMDF—25.9% UMDF—16.2% | 200–1602 |
| VIII | 19,389 | 41.4 | 7.0 | 180–200 | 700–900 | MDF—54.9% UDF—25.8% MMDF—11.4% | 250–2499 |
DCF—dry coniferous forest; FCF—fresh coniferous forest; FMCF—fresh mixed coniferous forest; FDF—fresh deciduous forest; FMDF—fresh mixed deciduous forest; MDF—mountain deciduous forest; MMCF—mountain mixed coniferous forest; MMDF—mountain mixed deciduous forest; UDF—upland deciduous forest; UMDF—upland mixed deciduous forest; WMCF—wet mixed coniferous forest [24].
Table 2.
Numbers of elm localities in Poland and of those selected and investigated in the field during this study.
Table 2.
Numbers of elm localities in Poland and of those selected and investigated in the field during this study.
| Forest Region | No. of Elm Localities by State Forest Database in 2013 (Localities with the Given Age only) | No. of Selected Forest Plots with Elms | No. of Elm Localities Covered by this Study | ||||||||||||||||||
|---|---|---|---|---|---|---|---|---|---|---|---|---|---|---|---|---|---|---|---|---|---|
| <50 Years | >50 Years | <50 years | >50 years | ||||||||||||||||||
| U. glabra | U. laevis | U. minor | U. glabra | U. laevis | U. minor | ||||||||||||||||
| T | DED | D | T | DED | D | T | DED | D | T | DED | D | T | DED | D | T | DED | D | ||||
| I | 4071 | 4788 | 70 | 17 | 3 | 2 | 16 | 2 | 9 | 12 | 6 | 1 | 7 | 3 | 1 | 37 | 8 | 15 | 1 | 0 | 0 |
| II | 4730 | 2862 | 70 | 16 | 4 | 5 | 21 | 3 | 9 | 7 | 2 | 0 | 10 | 2 | 2 | 38 | 10 | 14 | 0 | 0 | 0 |
| III | 7148 | 8986 | 150 | 13 | 3 | 0 | 55 | 9 | 16 | 31 | 15 | 2 | 2 | 1 | 0 | 92 | 23 | 30 | 3 | 1 | 2 |
| IV | 3256 | 2661 | 60 | 5 | 2 | 0 | 21 | 4 | 9 | 15 | 8 | 1 | 0 | 0 | 0 | 43 | 9 | 17 | 0 | 0 | 0 |
| V | 4308 | 4446 | 110 | 10 | 3 | 0 | 46 | 13 | 18 | 22 | 10 | 3 | 0 | 0 | 0 | 70 | 13 | 27 | 0 | 0 | 0 |
| VI | 2870 | 3091 | 60 | 3 | 1 | 1 | 36 | 6 | 10 | 7 | 2 | 1 | 5 | 1 | 0 | 27 | 7 | 10 | 0 | 0 | 0 |
| VII | 248 | 331 | 45 | 24 | 6 | 1 | 1 | 0 | 0 | 1 | 0 | 0 | 18 | 5 | 1 | 4 | 1 | 0 | 0 | 0 | 0 |
| VIII | 721 | 1796 | 35 | 24 | 6 | 0 | 4 | 1 | 1 | 2 | 1 | 0 | 25 | 8 | 2 | 5 | 1 | 0 | 1 | 1 | 0 |
| Total | 27,352 | 28,961 | 600 | 112 | 28 | 9 | 200 | 38 | 72 | 97 | 44 | 8 | 67 | 20 | 6 | 316 | 72 | 113 | 5 | 2 | 2 |
T—total; D—forest plots dominated by the individual species of elm; DED—the localities of the individual elm species with the symptoms of DED; <50 years—localities of elm up to 50 years old; >50 years—localities of elm older than 50 years old.
Table 3.
Values of χ2 test for differences in percentage distributions of the analyzed features for individual forest regions.
Table 3.
Values of χ2 test for differences in percentage distributions of the analyzed features for individual forest regions.
| Forest Region | I | II | III | IV | V | VI | VII | VIII |
|---|---|---|---|---|---|---|---|---|
| a—All Localities Jointly | ||||||||
| I | 2.982 | 12.044 | 19.780 | 19.780 | 2.024 | 87.409 | 88.206 | |
| II | 2.982 | 10.702 | 13.464 | 13.464 | 1.079 | 92.565 | 98.040 | |
| III | 12.044 | 10.702 | 5.128 | 5.128 | 14.565 | 131.660 | 131.418 | |
| IV | 19.780 | 13.464 | 5.128 | 0 | 17.391 | 138.983 | 144.828 | |
| V | 19.780 | 13.464 | 5.128 | 0 | 17.391 | 138.983 | 144.828 | |
| VI | 2.024 | 1.079 | 14.565 | 17.391 | 17.391 | 87.155 | 92.797 | |
| VII | 87.409 | 92.565 | 131.660 | 138.983 | 138.983 | 87.155 | 3.124 | |
| VIII | 88.206 | 98.040 | 131.418 | 144.828 | 144.828 | 92.797 | 3.124 | |
| b—Localities Dominated by Elms | ||||||||
| I | 9.618 | 11.536 | 10.549 | 10.756 | 2.824 | 163.636 | 69.800 | |
| II | 9.618 | 32.331 | 29.087 | 30.690 | 19.537 | 125.203 | 39.111 | |
| III | 11.536 | 32.331 | 1.418 | 0.307 | 4.698 | 200 | 102.848 | |
| IV | 10.549 | 29.087 | 1.418 | 0.421 | 4.245 | 200 | 101.767 | |
| V | 10.756 | 30.690 | 0.307 | 0.421 | 4.140 | 200 | 102.299 | |
| VI | 2.824 | 19.537 | 4.698 | 4.245 | 4.140 | 184.615 | 88.030 | |
| VII | 163.636 | 125.203 | 200 | 200 | 200 | 184.615 | 3.124 | |
| VIII | 69.800 | 39.111 | 102.848 | 101.767 | 102.299 | 88.030 | 3.124 | |
| c—Localities where Elm Trees were Older than 50 Years | ||||||||
| I | 1.858 | 12.515 | 16.004 | 14.434 | 12.355 | 76.154 | 56.678 | |
| II | 1.858 | 15.222 | 19.110 | 16.111 | 10.578 | 74.040 | 56.122 | |
| III | 12.515 | 15.222 | 0.321 | 0.250 | 0.321 | 128.215 | 105.454 | |
| IV | 16.004 | 19.110 | 0.321 | 0.376 | 4.159 | 134.983 | 111.912 | |
| V | 14.434 | 16.111 | 0.250 | 0.376 | 2.086 | 131.550 | 108.930 | |
| VI | 12.355 | 10.578 | 0.321 | 4.159 | 2.086 | 121.932 | 100.962 | |
| VII | 76.154 | 74.040 | 128.215 | 134.983 | 131.550 | 121.932 | 2.667 | |
| VIII | 56.678 | 56.122 | 105.454 | 111.912 | 108.930 | 100.962 | 2.667 | |
| d—Localities with Dutch Elm Disease | ||||||||
| I | 2.079 | 0.039 | 1.931 | 0.392 | 2.044 | 65.102 | 1.362 | |
| II | 2.079 | 2.213 | 3.987 | 1.501 | 0.131 | 48.997 | 6.735 | |
| III | 0.039 | 2.213 | 1.429 | 0.247 | 2.036 | 64.955 | 1.292 | |
| IV | 1.931 | 3.987 | 1.429 | 0.863 | 2.977 | 62.507 | 3.039 | |
| V | 0.392 | 1.501 | 0.247 | 0.863 | 1.129 | 59.742 | 2.447 | |
| VI | 2.044 | 0.131 | 2.036 | 2.977 | 1.129 | 48.569 | 6.519 | |
| VII | 65.102 | 48.997 | 64.955 | 62.507 | 59.742 | 48.569 | 79.735 | |
| VIII | 1.362 | 6.735 | 1.292 | 3.039 | 2.447 | 6.519 | 79.735 | |
bold values—indicate statistically significant differences (p < 0.05).
© 2019 by the authors. Licensee MDPI, Basel, Switzerland. This article is an open access article distributed under the terms and conditions of the Creative Commons Attribution (CC BY) license (http://creativecommons.org/licenses/by/4.0/).
Share and Cite
MDPI and ACS Style
Napierała-Filipiak, A.; Filipiak, M.; Łakomy, P. Changes in the Species Composition of Elms (Ulmus spp.) in Poland. Forests 2019, 10, 1008. https://0-doi-org.brum.beds.ac.uk/10.3390/f10111008
AMA Style
Napierała-Filipiak A, Filipiak M, Łakomy P. Changes in the Species Composition of Elms (Ulmus spp.) in Poland. Forests. 2019; 10(11):1008. https://0-doi-org.brum.beds.ac.uk/10.3390/f10111008
Chicago/Turabian StyleNapierała-Filipiak, Anna, Maciej Filipiak, and Piotr Łakomy. 2019. "Changes in the Species Composition of Elms (Ulmus spp.) in Poland" Forests 10, no. 11: 1008. https://0-doi-org.brum.beds.ac.uk/10.3390/f10111008
Note that from the first issue of 2016, this journal uses article numbers instead of page numbers. See further details here.