Polyphenolic Profile and Antioxidant Activity of Juglans regia L. Leaves and Husk Extracts


1
Institute of Polymer and Dye Technology, Faculty of Chemistry, Lodz University of Technology, Stefanowskiego 12/16, 90-924 Lodz, Poland
2
Institute of General and Ecological Chemistry, Faculty of Chemistry, Lodz University of Technology, Zeromskiego 116, 90-924 Lodz, Poland
3
Institute of Molecular and Industrial Biotechnology, Faculty of Biotechnology and Food Sciences, Lodz University of Technology, Stefanowskiego 4/10, 90-924 Lodz, Poland
*
Author to whom correspondence should be addressed.
Forests 2019, 10(11), 988; https://0-doi-org.brum.beds.ac.uk/10.3390/f10110988
Submission received: 8 October 2019
/
Revised: 29 October 2019
/
Accepted: 30 October 2019
/
Published: 6 November 2019
(This article belongs to the Special Issue Forest, Foods and Nutrition)
Abstract
:The aim of this study is to characterize the antioxidant capacity and establish the profile of polyphenolic compounds in walnut extracts (different extracts prepared from walnut leaf and green husks). The correlation between bioingredients of the product tested and their ability to scavenge free radicals and reduce them by chelating various metal ions were examined. Research technology combining TG (thermogravimetry), FTIR (Fourier-transform infrared spectroscopy), high-performance liquid chromatography system (HPLC) with electrochemical methods (cyclic and differential pulse voltammetry) and spectrophotometric methods (ABTS, FRAP, and DPPH assays) was used to rate the potential oxidation-reduction components of walnut extracts. A high affinity for scavenging free radicals ABTS and DPPH was found for natural substances present in leaves and green husks. The walnut is beneficial to health as it contains alpha-linolenic acid in its lipid fraction and, as demonstrated in this study, its husks are rich in polyphenolics with high antioxidant capacity.
1. Introduction
Natural polyphenols are a large group of secondary plant metabolites, arising from phenylalanine or shikimic acid. These plant compounds perform an important function in counteracting different types of stress factors, such as ultraviolet irradiation, aggression by pathogens, parasites, and plant predators. Moreover, natural polyphenols affect the organoleptic properties of plants and foods of plant origin [1]. In addition, these compounds are well-known for their advantageous effects on human health. The literature describes their antioxidant, cardioprotective, cytotoxic, anti-inflammatory, as well as antibacterial properties [2,3]. As they are widely found in plants, these substances are a beneficial alternatives to antibiotics and additives of chemical origin. The application of plant origin compounds as natural preservatives in the foodstuffs production because of their advantage to human health has been intensively tested in recent years. Walnut leaves and husks are among the sources studied. The deciduous tree Juglans regia L. is commonly called walnut and belongs to the Juglandaceae family. Plant materials (leaves, bark, unripe nuts) obtained from this tree was commonly used in folk medicine for its strong antioxidant capacity, antidiabetic, antibacterial, anti-inflammatory, anti-atherogenic, and liver-protective properties [4,5]. The main active ingredients in raw material are tannins (gallotannins and ellagitannins) and 1,4,5-trihydroxynaphthalene-4-beta-D-glucoside, which is converted into a naphthoquinone derivative-juglon (5-hydroxy-1,4-naphthoquinone) during drying of the leaves and green husks. Moreover, the walnut leaf contains flavonols (derivatives of quercetin and kaempferol), phenolic acids (caffeic, p-coumaric), and oils [6,7,8,9,10]. Furthermore, Oliveira et al. (2008) [11] have shown that aqueous extracts of green husk or walnut leaves have significant antioxidant properties. The phenolic compounds contained in the raw material are responsible for the antioxidant effects. Walnuts are a rich source of linolenic, palmitic, oleic, and stearic acid, phytosterols, nonsodium minerals, g-tocopherol, melatonin, vitamin E, and polyphenols. The most important polyphenols in plant materials obtained from walnuts, are ellagitannins, which are metabolized to urolithins, compounds with antioxidant, anti-inflammatory, cytotoxic as well as prebiotic effects [12]. Anderson et al. and Jahanban-Esfahlan et al. [13,14] described that walnut extract contains gallic acid, ellagic acid, and flavonoids, tannins, folate, proteins, melatonin and sterols and minerals.
An alternative to traditional methods to determine the antioxidant effect of different extracts of plant origin or natural substances are electrochemical methods. In recent years, these methods have aroused great interest of scientists [15,16,17]. Electrochemical methods have many advantages, such as quick, simple, and low price. In addition, these methods allow measurements in the presence of colored or other masking compounds that may interfere with measurements by other methods, e.g., spectrophotometric. The experimental parameters, which are useful in examination the antioxidant properties of the analyzed compounds, such as peak potential (Epa) and peak current (ipa) can be determined by using electrochemical methods. Low values of oxidation potentials (Epa) indicate the tendency of a given molecule to donate electrons, therefore to demonstrate its strong antioxidant effect. Cyclic voltammetry (CV) is the method used to test the properties of electrode processes, giving data on the thermodynamics of electrode reactions and kinetics of electron transfer, as well as and also coupled chemical reactions or adsorption processes. One more electrochemical method applied to examine the antioxidant effect of the extracts of plant origin under study is differential pulse voltammetry (DPV). This method is characterized by a good detection limit and high resolution [18,19,20,21,22,23,24]. Evaluation of redox behavior by means of electrochemical characterizes provide an antioxidant profile. Furthermore, it is possible to calculate the electrochemical index value, which is a reliable measure associated with the antioxidant potential (EI) [15,25]. The aim of this work was to determine the antioxidant capacity of leaf and walnut green husk extracts by using cyclic voltammetry (CV) and differential pulse voltammetry (DPV). The methods are known for their suitability for food control and monitoring the levels of antioxidant activity in samples of biological origin. The advantage of the CV and DPV methods compared to traditional in vitro methods is that they are cheap methods, giving very precise results and at the same time correlate with traditional methods, e.g., DPPH, ABTS.
In the last decade, FTIR spectroscopy has been shown to be a powerful method for the analysis of natural molecules and of complex biological systems such as tissues and cells. An advantage of FTIR spectroscopy is that this method can be applied to powdered, dehydrated, or aqueous samples. The FTIR method is simple, selective, validated, and ecofriendly [26,27].
Scheme (Figure S1) of Polyphenolic Profile and Antioxidant Activity of Juglans regia L. Leaves and Husk Extracts has been included in Supplementary Materials.
2. Materials and Methods
2.1. Reagents and Chemicals
Samples of leaves and green walnut husks of walnut were obtained from trees growing on the farm in central Poland. Plant materials were taken from seven different walnut trees, variety: non-grafted, age 16-years. The species was confirmed by a specialist in the field of horticulture. Plant materials were harvested in October. The trees grow on a sandy clay loam, in temperate climate, southern exposure to sun. The trees are bred in accordance with the principles of ecological horticulture.
The following reagents were used for the tests: 2,2′-azino-bis(3-ethylbenzothiazoline-6-sulfonic acid) diammonium salt (ABTS, purity ≥98% (HPLC), Sigma Aldrich, Saint Louis, MO, USA), potassium persulfate (99.99%, Sigma Aldrich, Saint Louis, MO, USA), 2,2-Diphenyl-1-picrylhydrazyl (DPPH, ≤100%, Sigma Aldrich, Darmstadt, Germany), 2,4,6-Tris (2-pyridyl)-s-triazine (TPTZ, ≥99.0% (HPLC), Sigma Aldrich, Buchs, Switzerland), Iron (III) chloride FeCl3 (pure P.A., Chempur, Piekary Slaskie, Poland), hydrochloric acid HCl (Standard solution 40 mmol·L−1, Chempur, Piekary Slaskie, Poland), acetate buffer solution (0.3 mol·L−1, pH 3.6, Chempur, Piekary Slaskie, Poland), 2,9-Dimethyl-1, 10-phenanthroline (Neocuproine, purity ≥98%, Sigma Aldrich, Beijing, China), copper (II) chloride CuCl2 (standard solution 0.01 mol·L−1, Chempur, Piekary Slaskie, Poland), ammonium acetate (NH4Ac) buffer solution (1.0 mol·L−1, pH 7.0, Chempur, Piekary Slaskie, Poland), ethyl alcohol (pure P.A., 96%, POCH, Gliwice, Poland), acetonitrile (pure P.A., 99.5%, POCH, Gliwice, Poland).
Acetonitrile, chlorogenic acid, caffeic acid, (+)catechin, coumaric acid, cryptochlorogenic acid, (−)epicatechin, ferulic acid, formic acid, gallic acid, ellagic acid, juglone, kaempferol, myricetin, neochlorogenic acid, quercetin, quercetin 3-glucoside, quercetin 3-rhamnoside, rutin, sinapic acid, syringic acid, quercetin and (+)-catechin were bought from Sigma-Aldrich (Steinheim, Germany). Ultra purity water was done in the laboratory using a SimplicityTM Water Purification System (Millipore, Marlborough, MA, USA).
2.2. Preparation of the Extracts
Material from the seven different walnut trees was collected for testing: leaves and green husks. From the husks and leaves, collected from each of the seven trees, three leaves and husks extracts from one tree were prepared. Concentration of all extracts were 50 mg/mL.
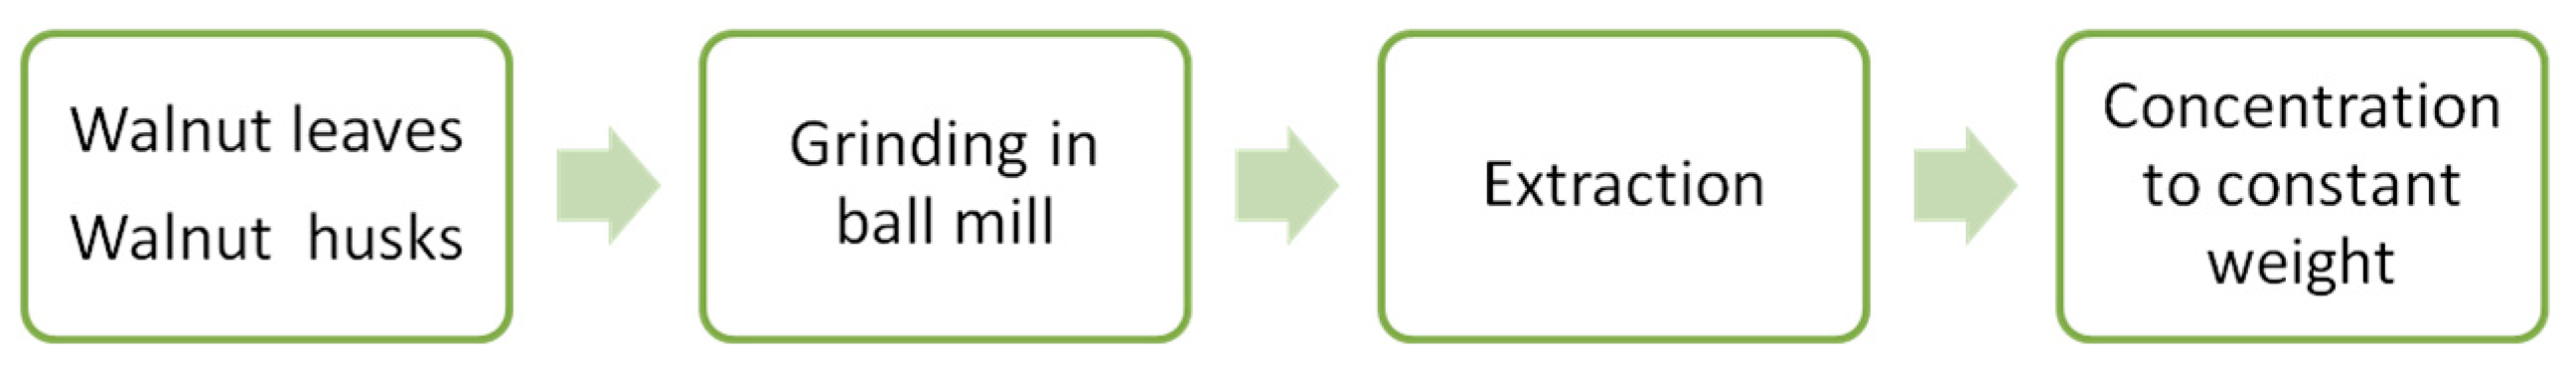
Leaves and husks of the walnut were cut into pieces and then ground in a ball mill. The particle size of the shredded plant materials was less than 1 mm. Plant materials were extracted using a five-fold volume of 70% ethanol under continuous mixing conditions (200 RPM, 25 °C). The extraction was carried out at 25 °C and at dark for 7 days. The final extracts of leaves and husks of the walnut were concentrated to constant weight using a rotary evaporator under reduced pressure conditions at 30 °C (Scheme 1).
In all considered analysis, the tests were repeated three times on samples of husks and leaf extracts obtained from seven trees. The average results are presented in the manuscript.
2.3. Measurement Methods
2.3.1. Thermal Decomposition
The thermogravimetric (TG) analysis of leaves and husks of the walnut was determined using a Mettler Toledo Thermobalance (TA Instruments, Greifensee, Switzerland). The samples of 5 mg were inserted in aluminum pans and heated from 25 °C to 800 °C under a dynamic nitrogen flow (50 mL/min). A heating rate of 5 °C/min was used.
2.3.2. FTIR and UV-VIS Spectra
Using infrared spectroscopy (FTIR) and ultraviolet visible (UV-VIS) spectroscopy, the presence of active plant substances in raw walnut leaves and its extract was investigated. Samples of leaves and its extract were placed in the infrared beam output of a Nicoled 670 spectrometer (Thermo Fisher Scientific, Waltham, MA, USA). Analysis of the oscillatory spectra obtained allows examine of the functional groups with which the radiation interacted. The UV-VIS spectra of the walnut leaf extract solution were recorded from a mixture of 0.2 mL of the extract and 1.8 mL of 70% ethanol. 70% ethanol was used as a blank. The mixture was scanned at 190–1100 nm using a UV-spectrometer (Evolution 220, Thermo Fisher Scientific, Waltham, MA, USA).
2.3.3. HPLC-PDA Analysis of Phenolic Compounds
Phenolic profiles were performed using a high-performance liquid chromatography system (Waters, Milford, MA) that consisted of a gradient pump (1525), photodiode array detector (2998), auto-injector (2707), and Breeze 2 system controller equipped with a 250 × 4.6 mm i.d, 5 µm Symmetry C18 column (Waters). The mobile phase was a binary gradient with A, water/formic acid (90:10, v/v), and B, water/acetonitrile/formic acid (40:50:10, v/v/v), with a flow rate of 1 mL/min [28]. The binary gradient was as follows: 100–12% B (0 min), 12–30% B (0–26 min), 30–100% B (26–40 min): 100% B (40–43 min), 12% B (43–48 min), and 12% B (48–50 min). Detector was set at 280 nm for hydroxybenzoic acid derivatives and flavanols, 320 nm for hydroxycinnamic acid derivatives and 360 nm for flavonols. Phenolic compounds were identified by comparison of its retention time and absorption spectra (240–500nm) with standards and literature [29,30,31,32]. The identified compounds were quantified according to the peak area measurements, which were reported in calibration curves of the corresponding standards. Unidentified hydroxybenzoic acids, hydroxycinnamic acids, and flavonols were quantified as gallic acid, chlorogenic acid, and quercetin 3-galactoside, respectively. Data are reported as means ± standard deviations of two independent analyses.
2.3.4. Cyclic and Differential Pulse Voltammetry
Determination and testing of antioxidant capacity of compounds found in solutions obtained from walnut leaf and husks extracts were made by electroanalysis using cyclic voltammetry (CV) and differential pulse voltammetry (DPV). The tests were performed using an Autolab electroanalytical unit (EcoChemie, Holland). The solution was placed in an electrolytic cell with three electrodes, the indicator electrode being platinum with a geometric surface of 1 cm2, whose potential was measured against the ferricinium/ferrocene reference electrode (Fc+/Fc). The third electrode was platinum as the auxiliary electrode, and the current dependence of the potential of the indicator electrode in the potential range from 0 V to 2 V was recorded. CV were recorded for a polarization rate (v) of 0.1 V · s−1. DPV were recorded in the same potential range with modulation amplitude 25 mV, pulse width 50 ms (scan rate (v) 0.01 V · s−1).
Before the measurements, oxygen dissolved in the solution was displaced with argon, and an argon cushion was maintained on the test solution during measurement. The tests were determined at 25 °C.
2.3.5. Antioxidant Activity Properties Measured by ABTS and DPPH Methods
The antioxidant capacity of walnut leaves were carried out by ABTS and DPPH assay. The methods are based on the reduction of 2,2′-azino-bis(3-ethylbenzothiazoline-6-sulphonic acid) ABTS and 2,2-diphenyl-1-picrylhydrazyl DPPH.
ABTS (6 mmol·L−1) and potassium persulfate (2.45 mmol·L−1) solution were mixed in ethanol, in volume ratio 7:1:2 v/v/v, then the mixture was allowed to stand for 16 h to generate reactive radicals. The ABTS/radical solution was diluted with ethanol to an absorbance of 0.70 at 734 nm. Then, 2 mL of diluted ABTS solution was added to 50 μL of walnut leaves extract. Absorbance was recorded with a UV-spectrometer (Evolution 220, Thermo Fisher Scientific, Waltham, MA, USA) at 734 nm.
The ethanol solution of the DPPH (2.0 mL) with a concentration 0.1 mmol·L−1 was added to 0.5 mL of alcohol solution (70% ethanol) that contained 50 μL of walnut leaf extract. Then, after 10 min of mixing, the absorbance of the solutions was determined at 517 nm.
The inhibition level (%) of the ABTS or DPPH radical (A%) was determined using the Equation (1):
where A0 is the absorbance of the control (reagent mixture without plant extract), and A1 is the absorbance in the presence of the extract.
Inhibition (A%) = (((A0−A1)/A0) × 100)
2.3.6. Determination of Ion Reduction—Iron by FRAP Method and Copper by CUPRAC Method
The FRAP method is based on reduction of ferric ion (Fe3+-TPTZ complex) under acidic conditions. The solution of the oxidant in the FRAP method was obtained by the addition of 25 mL of acetate buffer (0.3 mol·L−1, pH 3.6), 2.25 mL of TPTZ solution (10 mmol·L−1 TPTZ in 40 mmol·L−1 HCl) and 2.25 mL of FeCl3 (20 mmol·L−1 in water solution). Walnut leaf extract (0.2 mL) was added to the oxidant solution and, after 4 min, absorbance at 595 nm was measured. As a blank, the reagent mixture without walnut leaf extract was used.
The CUPRAC method is analogous to the FRAP method and involves the reduction of copper ions. CuCl2 (0.01 mol · L−1, 0.25 mL), neokuproin ethanol solution (7.5 × 10⁻³ mol · L−1, 0.25 mL) and CH3COONH4 buffer solution (pH 7.0, 1 mol · L−1, 0.25 mL) were mixed in a test tube, and then walnut leaf extract (0.2 mL) was added. Absorbance at 450 nm was measured against blank reagent (reagent mixture without walnut leaf extract) after 30 minutes incubation at 25 °C.
The ferric and cupric ions reducing power was calculated as Equation (2):
where: A0—absorbance of the reagent test, AAR—absorbance of sample after reaction.
ΔA = AAR − A0
3. Results and Discussion
3.1. Characteristics of Thermal Decomposition of Plant Materials
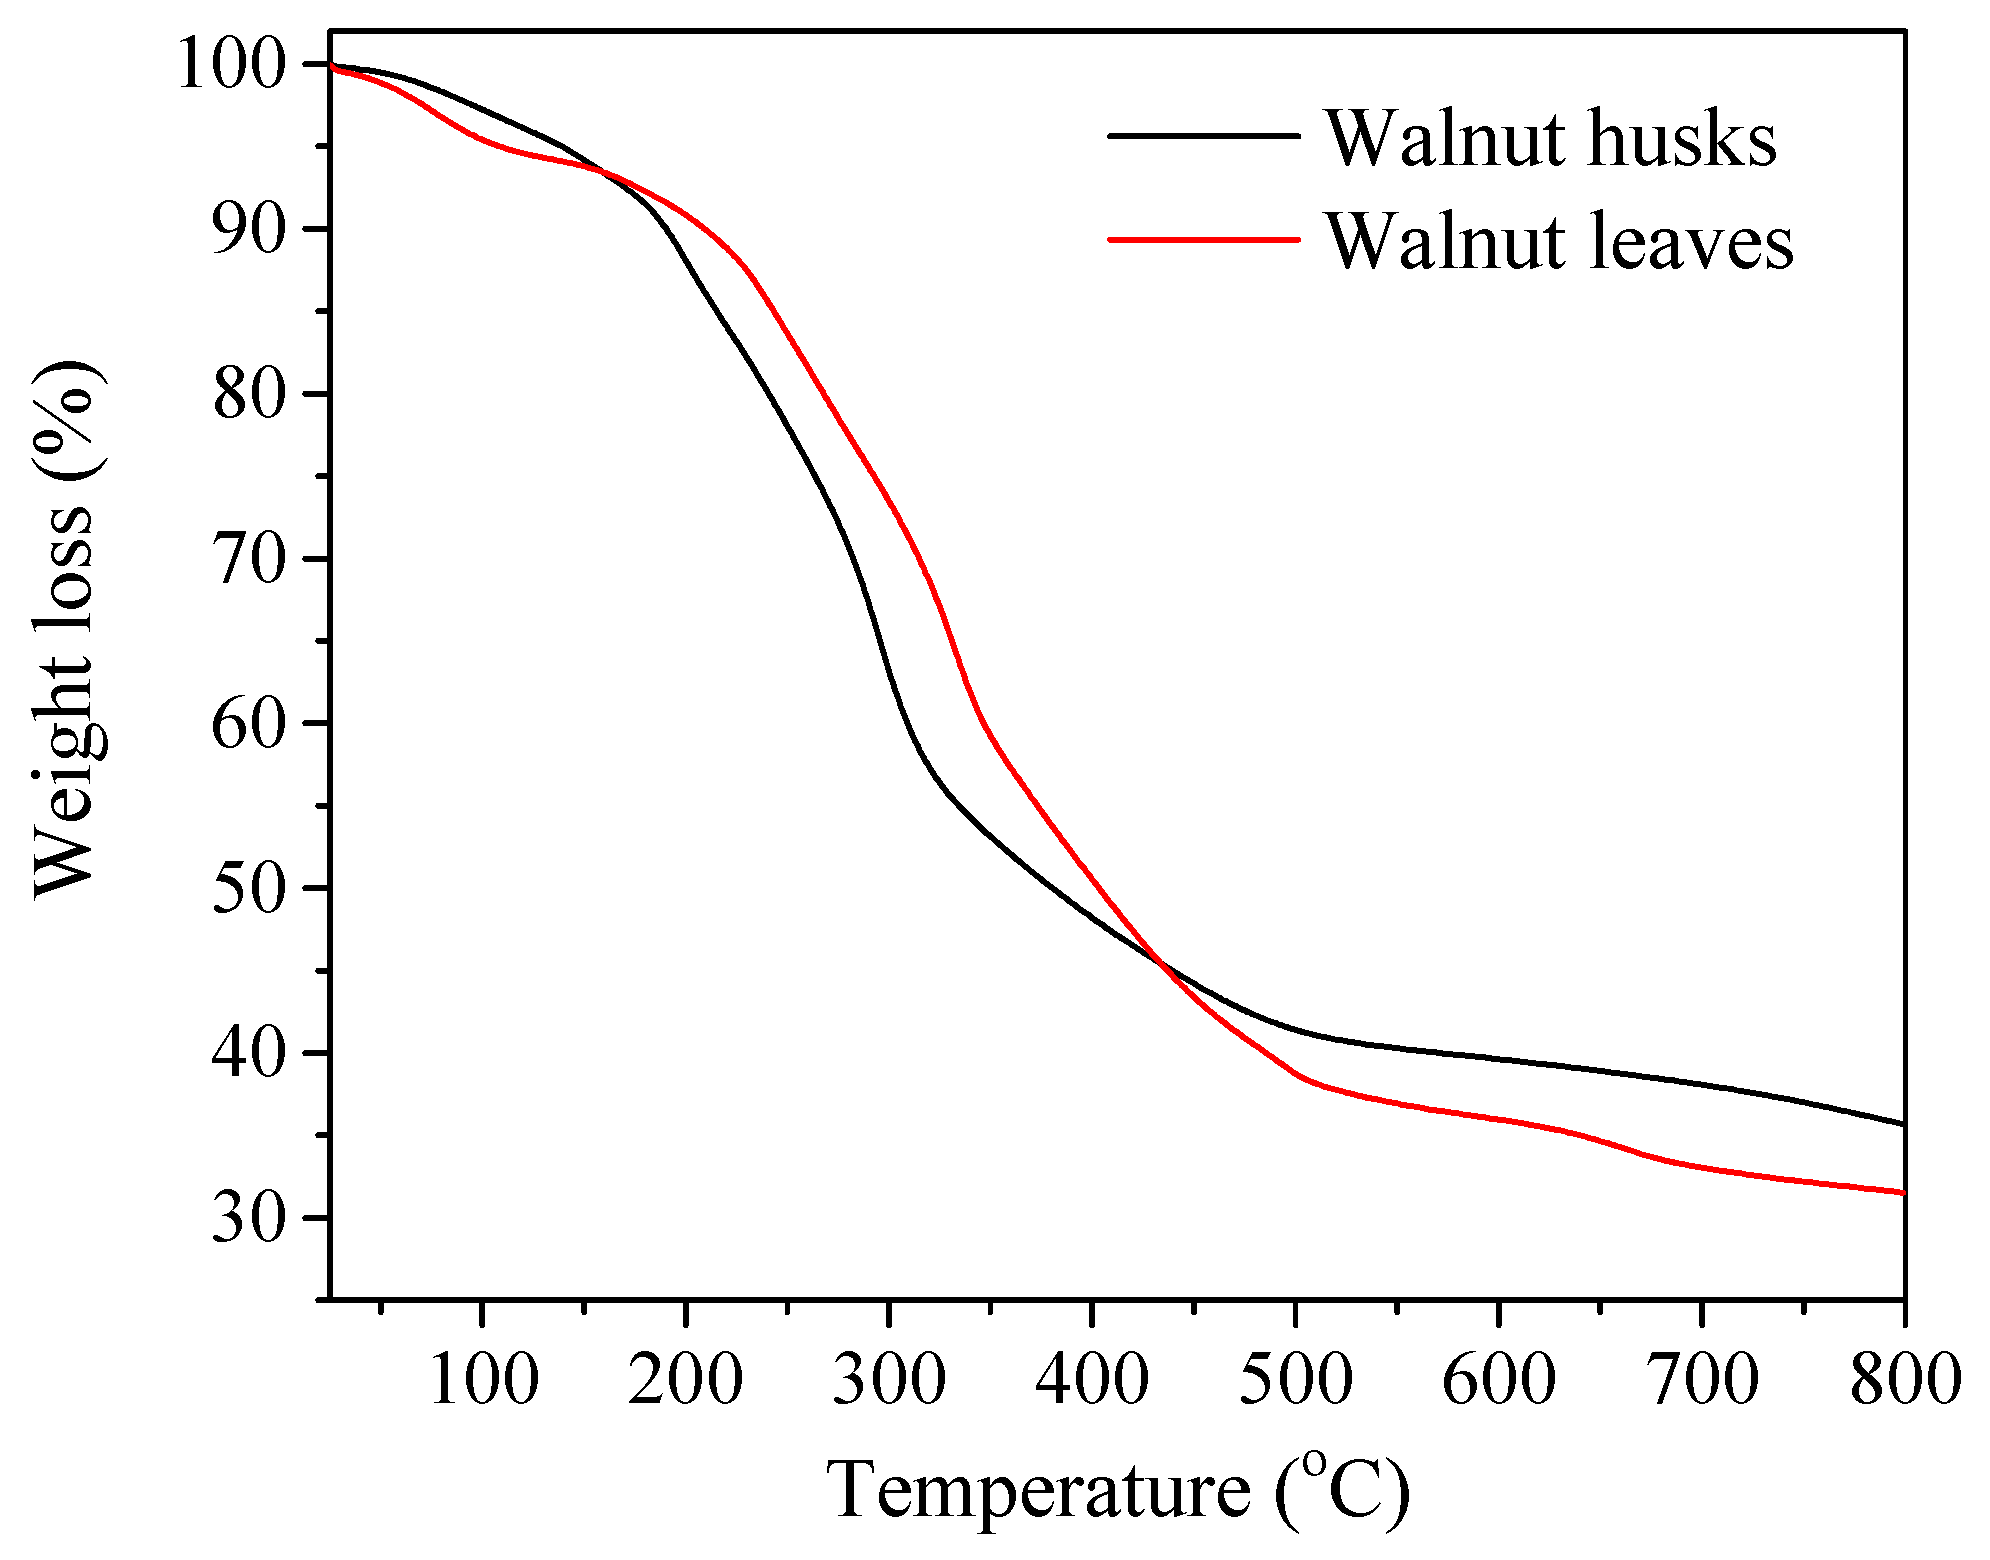
In order to assess the thermal stability of walnut leaves and husks obtained, thermogravimetry was performed by means of thermic analysis (Figure 1, Table 1). Decomposition temperature and mass loss of plant materials were determined. The distribution of samples is in three-stage. The plant substances in the leaf extract are slightly more stable than those found in the husks. This is evidenced by the fact that 50% weight loss for the leaf extracts is recorded at 267 °C while for the husks 50% loss is already achieved at 240 °C.
3.2. Analysis of Polyphenolic Profile of Extracts
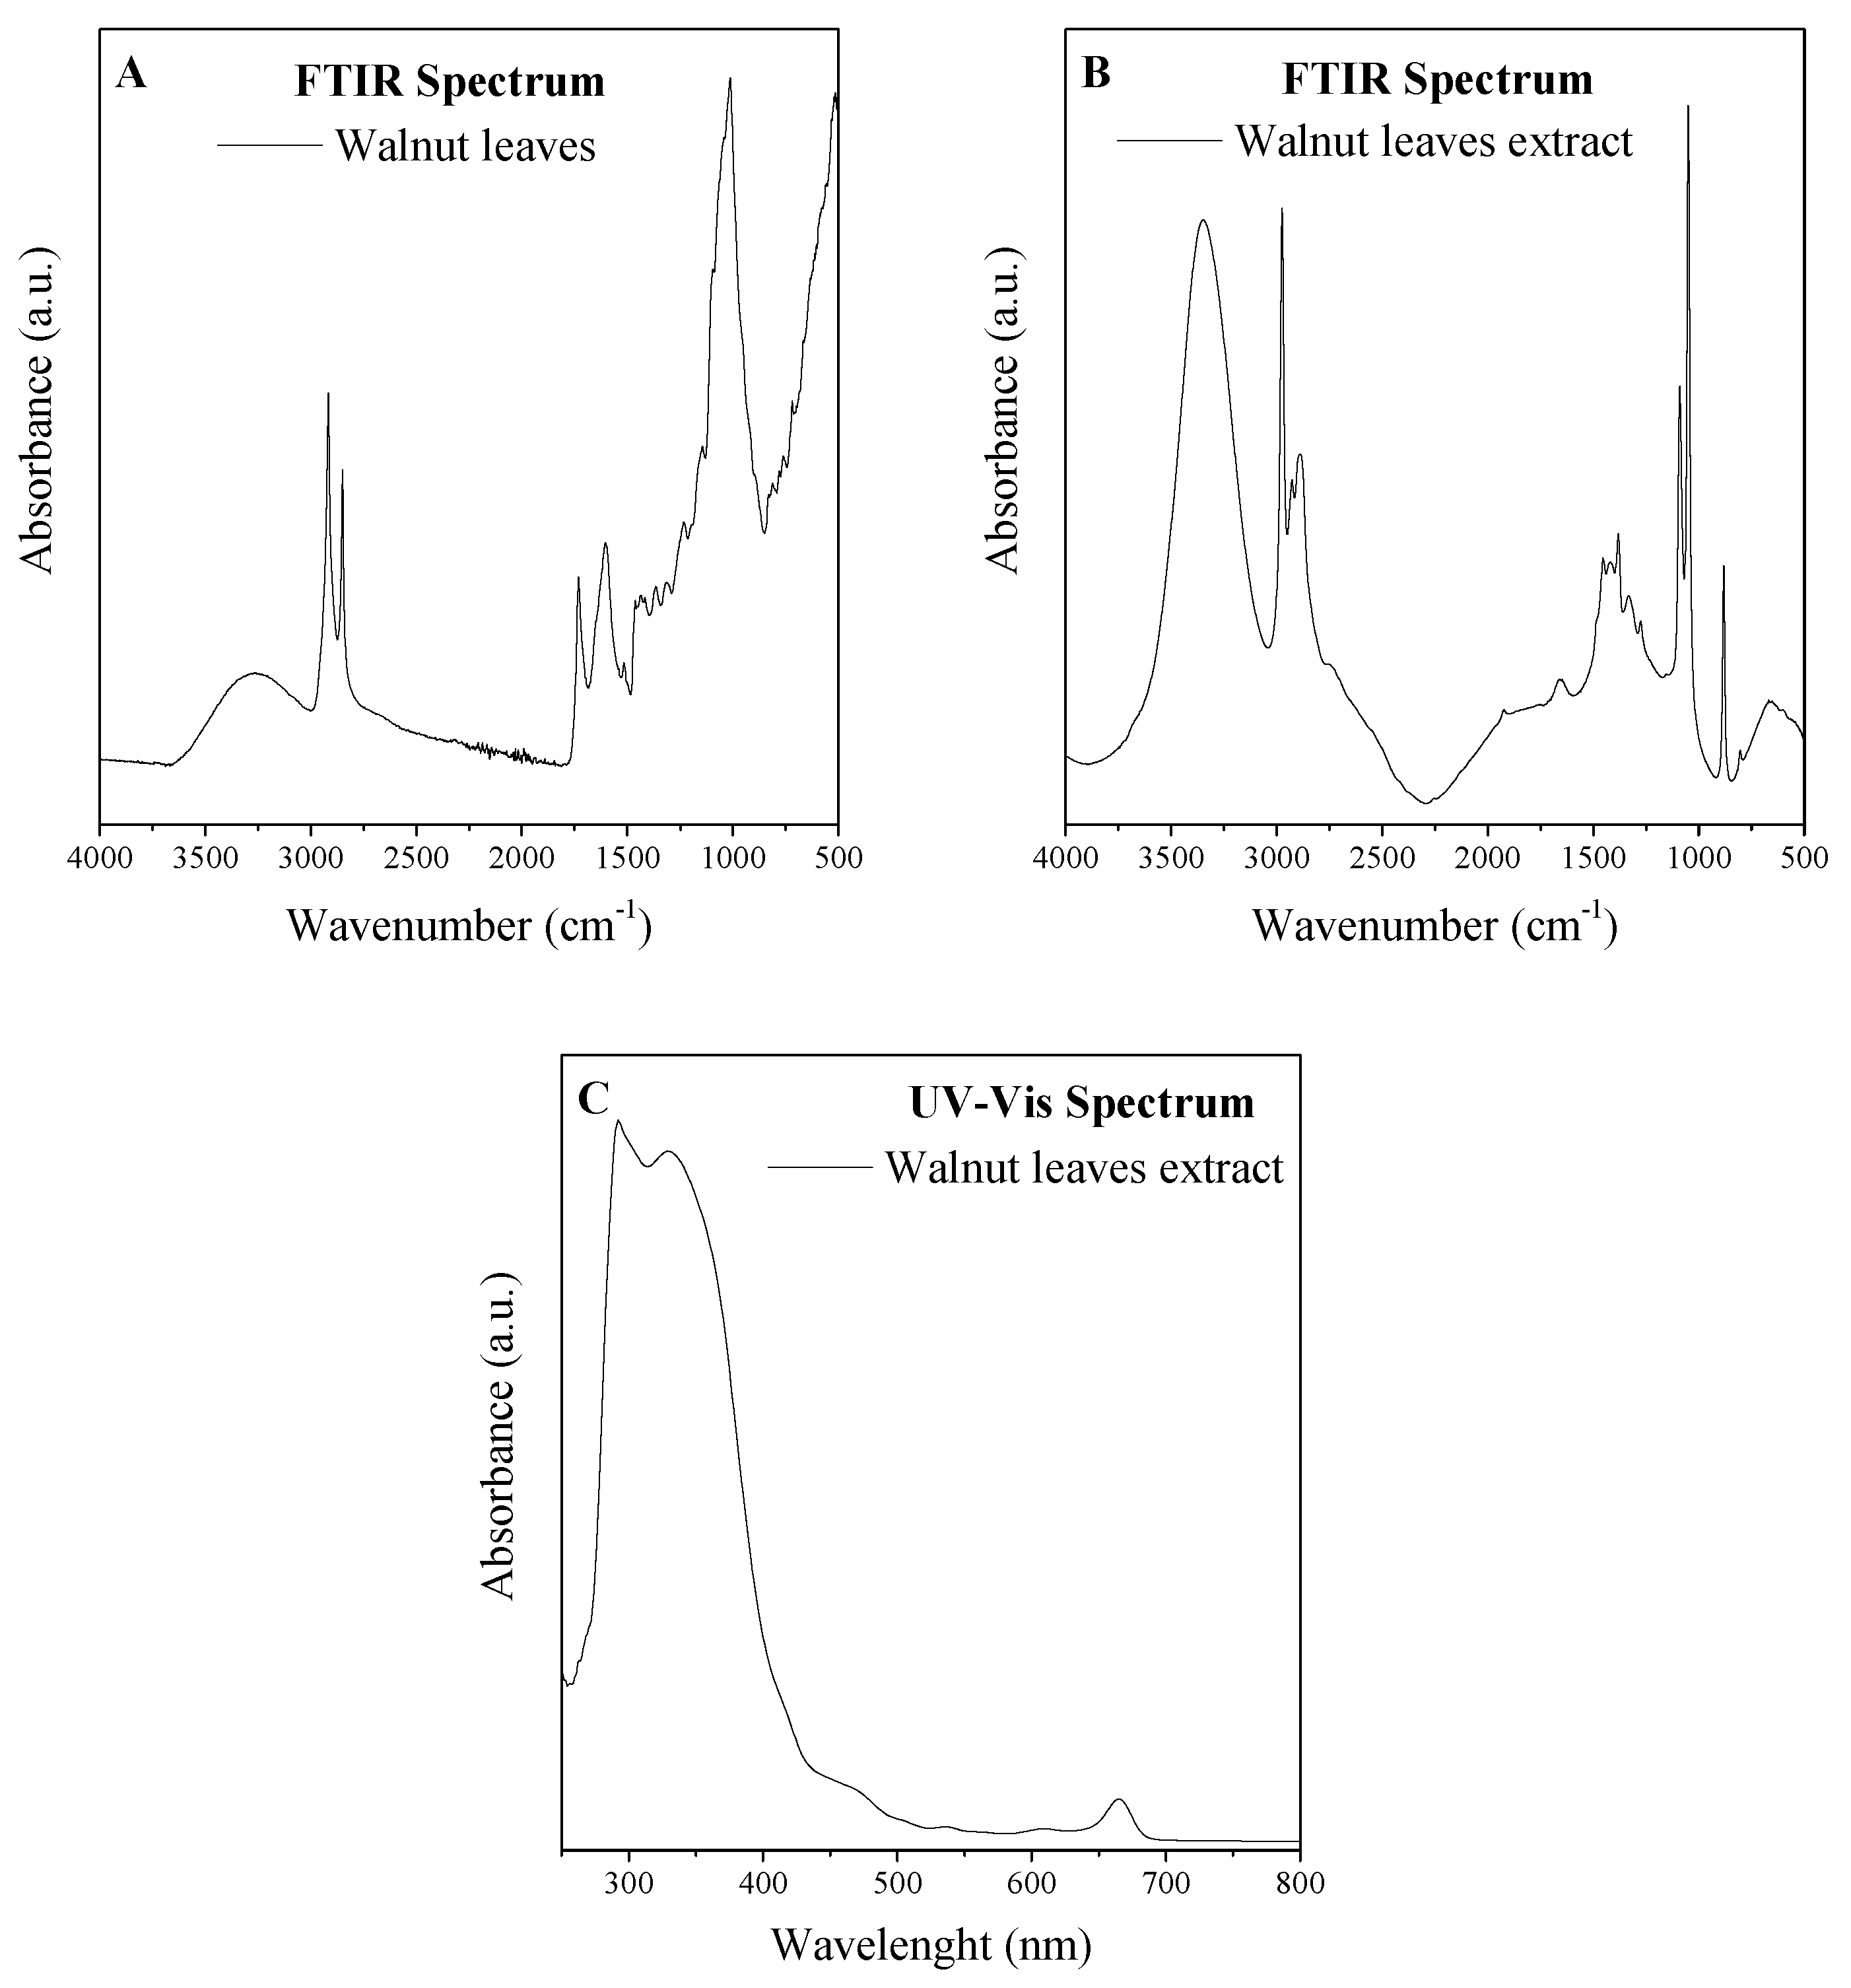
The FTIR and UV-VIS analyzes were performed on a sample of raw plant leaf material as well as on leaf extracts. To FTIR and UV-VIS analyzes, leaves and walnut leaf extract were selected as samples representing the composition of the material obtained from the walnut tree. The FTIR and UV-VIS spectroscopy of walnut husk and walnut husk extract has been described in another authors’ publication [33].
Analysis of the composition of the extracts was made on the basis of FTIR and UV-VIS analyses (Figure 2). The FTIR spectrum reflects the composition of the material. From the spectra, the presence of phenol functionalities was confirmed. Absorption peaks present in the spectrum at about 3200 cm−1 are responsible for the phenol O-H stretching groups, while 1603 cm−1 is from the resonance groups of the aromatic C=C, and C-H aliphatic is between 2850 and 3000 cm−1. In the region of 1530 cm−1, a band from in-plane bending of phenyl C-H bonds was noted. Absorptions at 1442 and 1325 cm−1 were assigned to C-H deformations and in plane O-H bending. Peaks identified from 1200 to 1030 cm−1 were corresponded to C-O stretching and-OH deformation vibrations in secondary alcohols and phenols, and also to C-O-C glycosidic linkage vibrations [34,35,36,37].
Sarai Agustin-Salaza [38] made a thorough analysis of the composition of nutshell extract by means of FIA-ESI-IT-MS/MS method. The data obtained allowed description of the composition of the extract examined, which contained, among others, (epi)gallocatechin, anthocyanidin, taxifolin, ellagic acid, (epi)catechin, trans-resveratrol, gallic acid, coumaric acid, protocatechuic acid, trans-cinannamic acid, and protocatechualdehyde.
The UV-VIS spectra of flavones and related glycosides exhibit two strong absorption peaks at 300–380 nm and 240–280 nm [39]. The maximum absorbance of flavonol was determined at 350 nm [39]. Additionally, the peaks of natural phenolic acids, e.g., gallic acid, ferulic acid, p-coumaric acids, and vanillic acid, have absorbance maxima in the range of approximately 290–350 nm [40,41,42,43]. Chlorophylls a and b exhibited maximum absorbance in the ranges 400–500 nm and 600–700 nm [44].
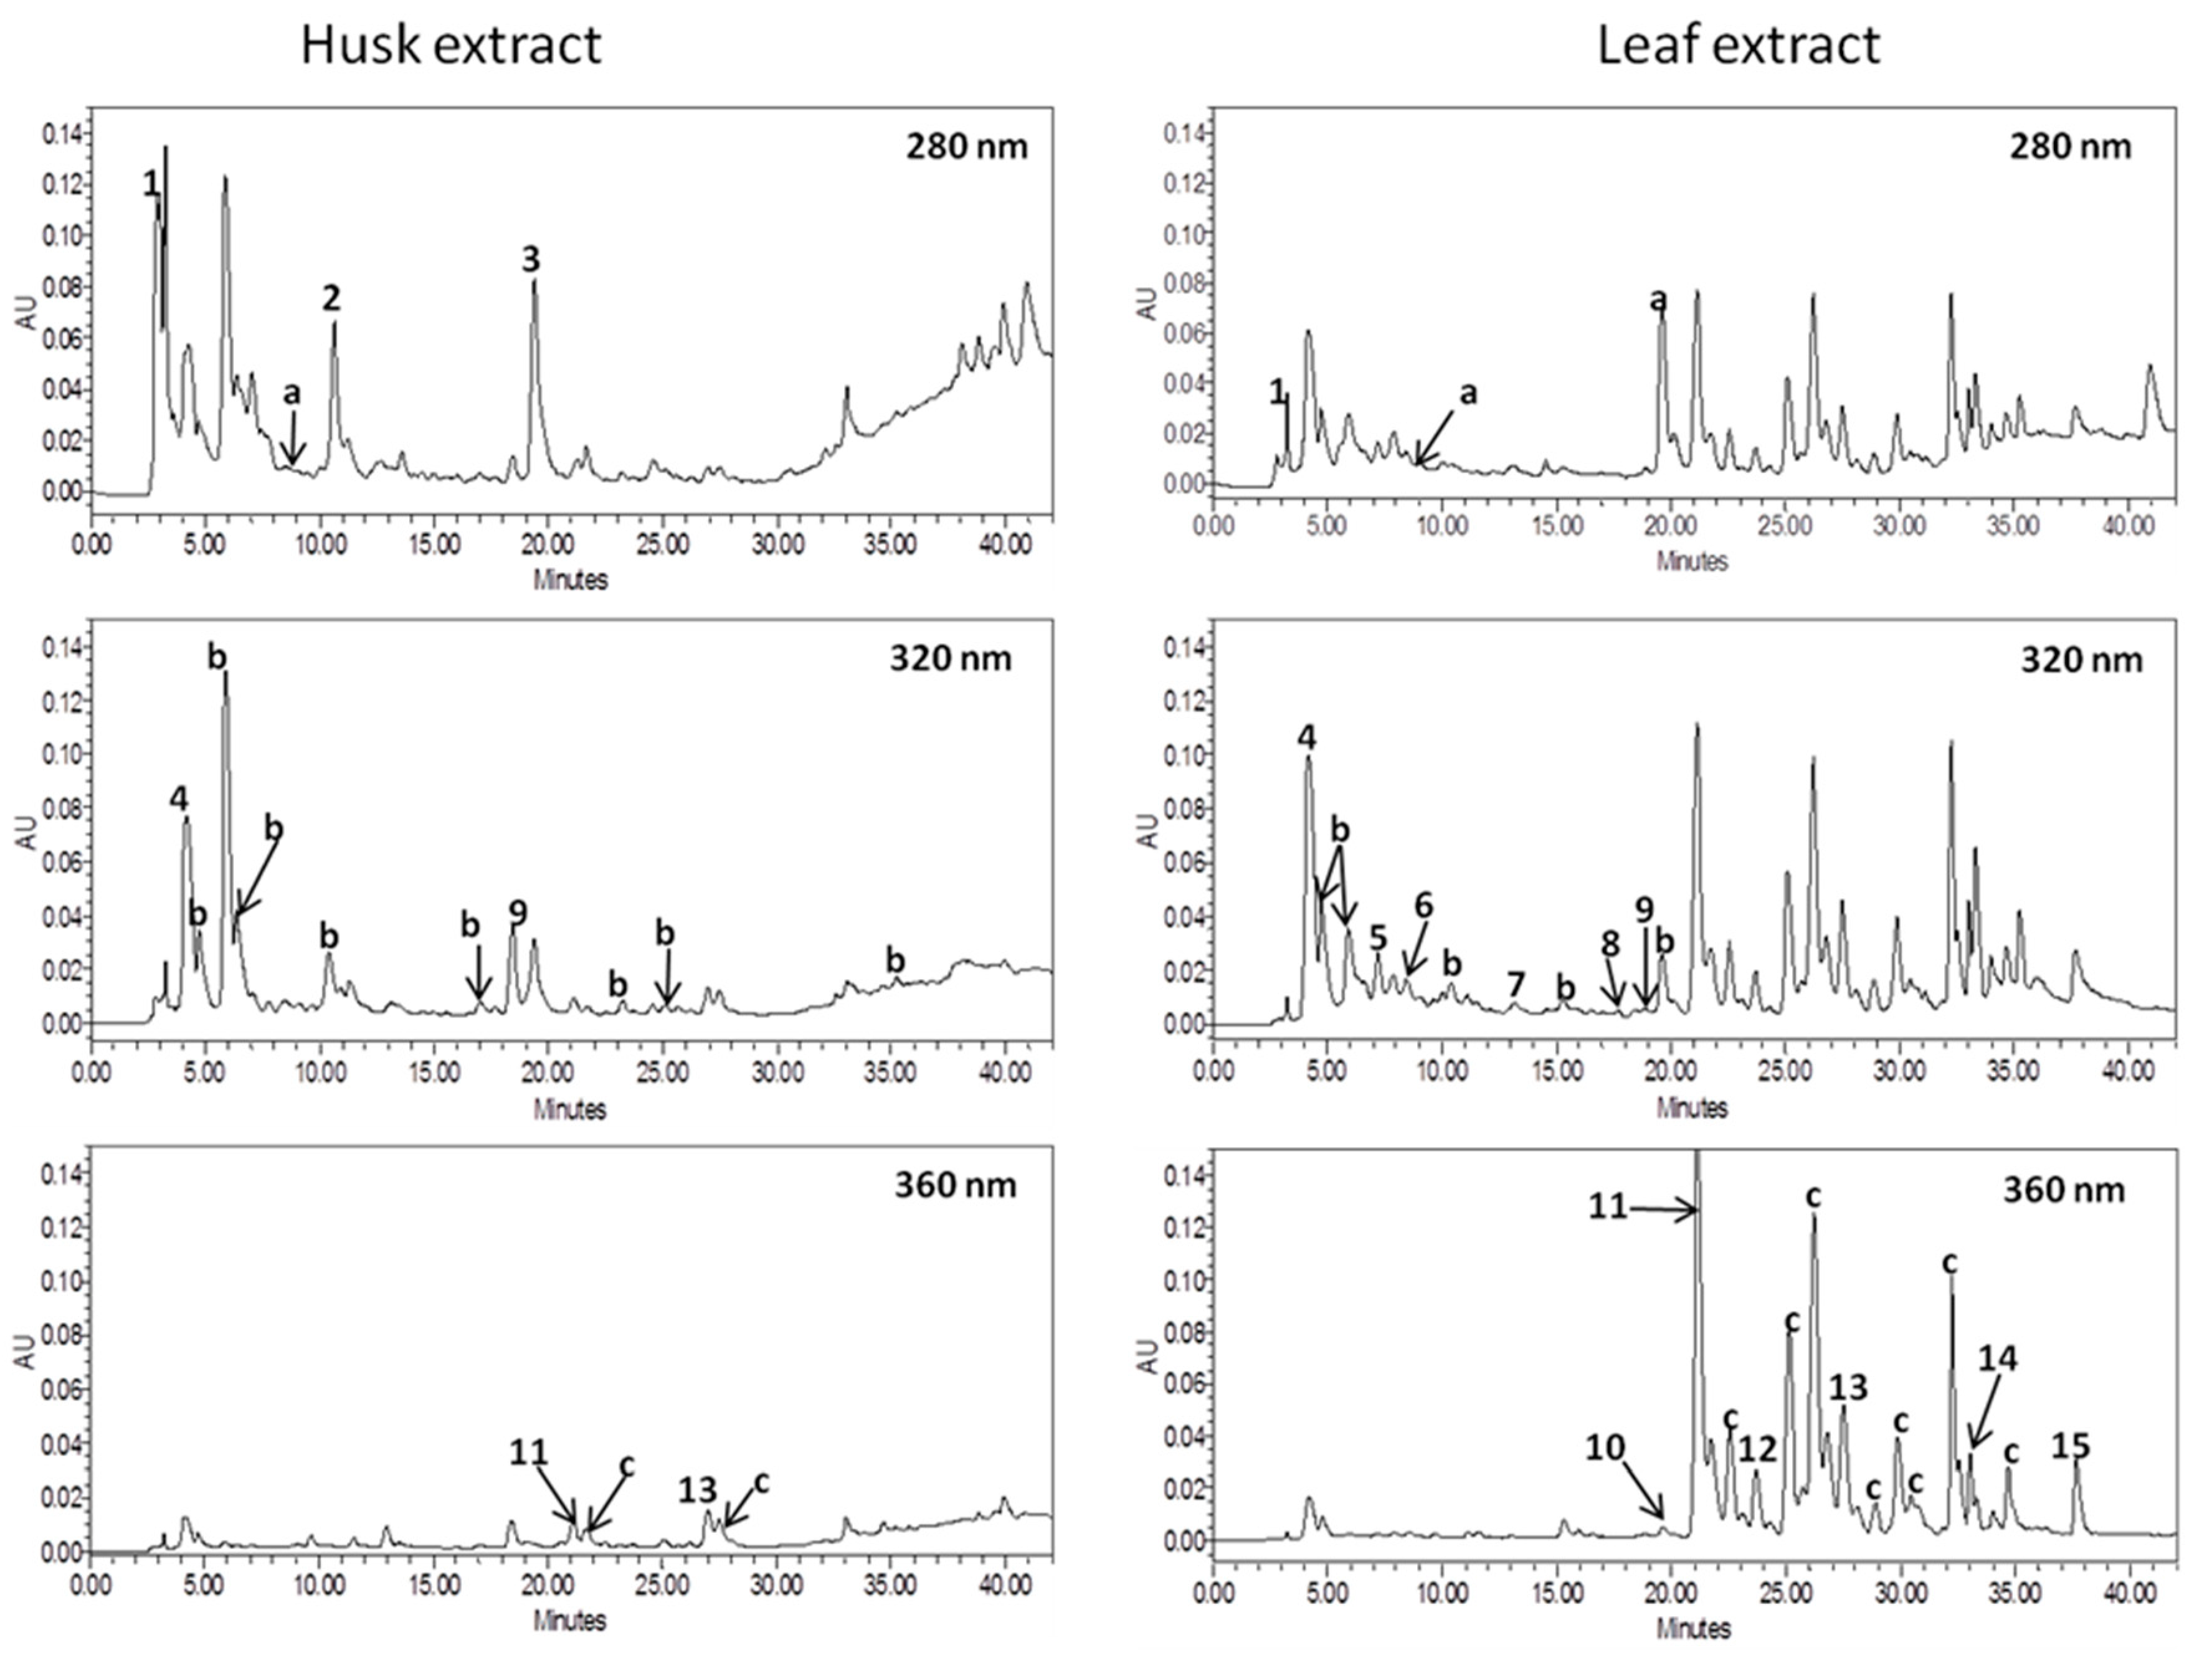
The results of qualitative and quantitative analyses of phenolic compounds by HPLC method allowed to conclude that walnut extracts tested had the different phenolic profile (Table 2, Figure 3). The contents of phenolic compounds was expressed in mg/g of extract as a mean value ± standard deviation (Table 2). Among the tested walnut extracts, higher content of total phenolics was found in leaf extract. It contained about five times more phenolic compounds than walnut husk extract.
The UV spectra of the compounds obtained by HPLC-PDA analysis revealed that flavonols (59.34% of total phenolics) were the main groups of phenolic compounds in leaf extract while hydroxycinnamic acids (57.00% of total phenolics) dominated in the husk extract. Among the identified phenolics, quercetin 3-galactoside and gallic acid were the main compounds of walnut leaf and husk extracts, respectively. Quercetin 3-galactoside was the main phenolic compound in the walnut leaves studied by Pereira et al. [31]. Nour at al. [30] reported ellagic acid as the dominating phenolic acid of fresh walnut leaves. Unfortunately, in the presented studies this compound was present only in the walnut husk extract. The reasons for the lack of this substance in the tested extract is certainly how the plant was collected, stored, and prepared. Literature reports that ellagic acid is present only in fresh plant. Yield of extraction of walnut appears to depend on temperature. Higher temperature reduces the efficiency of extraction. Juglone degrades in certain solvents and aquatic conditions that include acetonitrile, methanol, acidic solutions, alkaline solutions, and saline water [45,46], but juglon is stable in acidic conditions. According to the above-cited authors catechin hydrate and myricetin were the main flavonoids in walnut leaves. In contrast, our extracts did not contain catechins, while the content of myricetin in the leaf extract was lower than other flavonol aglycons (quercetin and kaempferol). In addition, in both extracts, no juglone (5-hydroxy-1-4-naphthoquinone) was found. According to literature, juglone is present in considerable amounts in all green and growing parts of the tree but because of polymerization phenomena, juglone only occurs in dry leaves at vestigial amounts [31,47].
3.3. Analysis of Properties of Extracts
The Electrochemical Behavior of Walnut Leaves and Husk at the Pt Electrode
Voltammetric analysis is used to evaluate the antioxidant properties of compounds found in various plant extracts by many researchers [18,19,20], as well as in beverages [21] and biological fluids [22], providing information on the value of peak potential and current [23]. The dependence of the current on the potential of the indicator electrode is characterized by the electrochemical reactions of compounds in solution on the tested electrodes. Electrochemical behavior of walnut extract solutions obtained from leaf and husks is presented in Figure 4 and Figure 5. The cyclic voltammetry (CV) method and the differential pulse voltammetry (DPV) method, which is characterized by higher resolution, were used. Typical cyclic voltammograms for the test extracts (first cycle) are shown in Figure 4. A voltammograms was also recorded for the supporting electrolyte (0.1 mol·L−1 (C4H9)4NClO4 in acetonitrile) which does not show peaks in the range of potentials studied.
On the voltammogram for the walnut leaf extract solution, four electrooxidation peaks are visible. The first peak (I peak) is at a potential of 0.254 V, the second peak at 0.968 V, the third poorly developed peak at 1.184 V potential and the fourth peak at 1.777 V potential. In the reverse polarization cycle on the voltammogram, one peak is visible at a potential of 0.184 V, whereas on the voltammogram made for walnut husk extract, three weakly formed peaks are observed, characterized by lower currents than for the walnut leaf extract: first peak at 0.159 V potential, second peak at 0.764 V potential, and third peak at 1.576 V potential. Peak currents for walnut leaf extract are higher than for walnut husk extract.
Because of the shape of the voltammograms (their profile), it can be stated that the extracts tested are characterized by different qualitative and quantitative composition of compounds that oxidize (different composition). The purpose of this work is to determine the antioxidant capacity of these extracts. On the basis of voltammetric tests, it can be concluded that the antioxidant properties of the extract of walnut leaves are enhanced, because it contains more polyphenolic compounds oxidizing in the range of potentials tested than the walnut husks extracts.
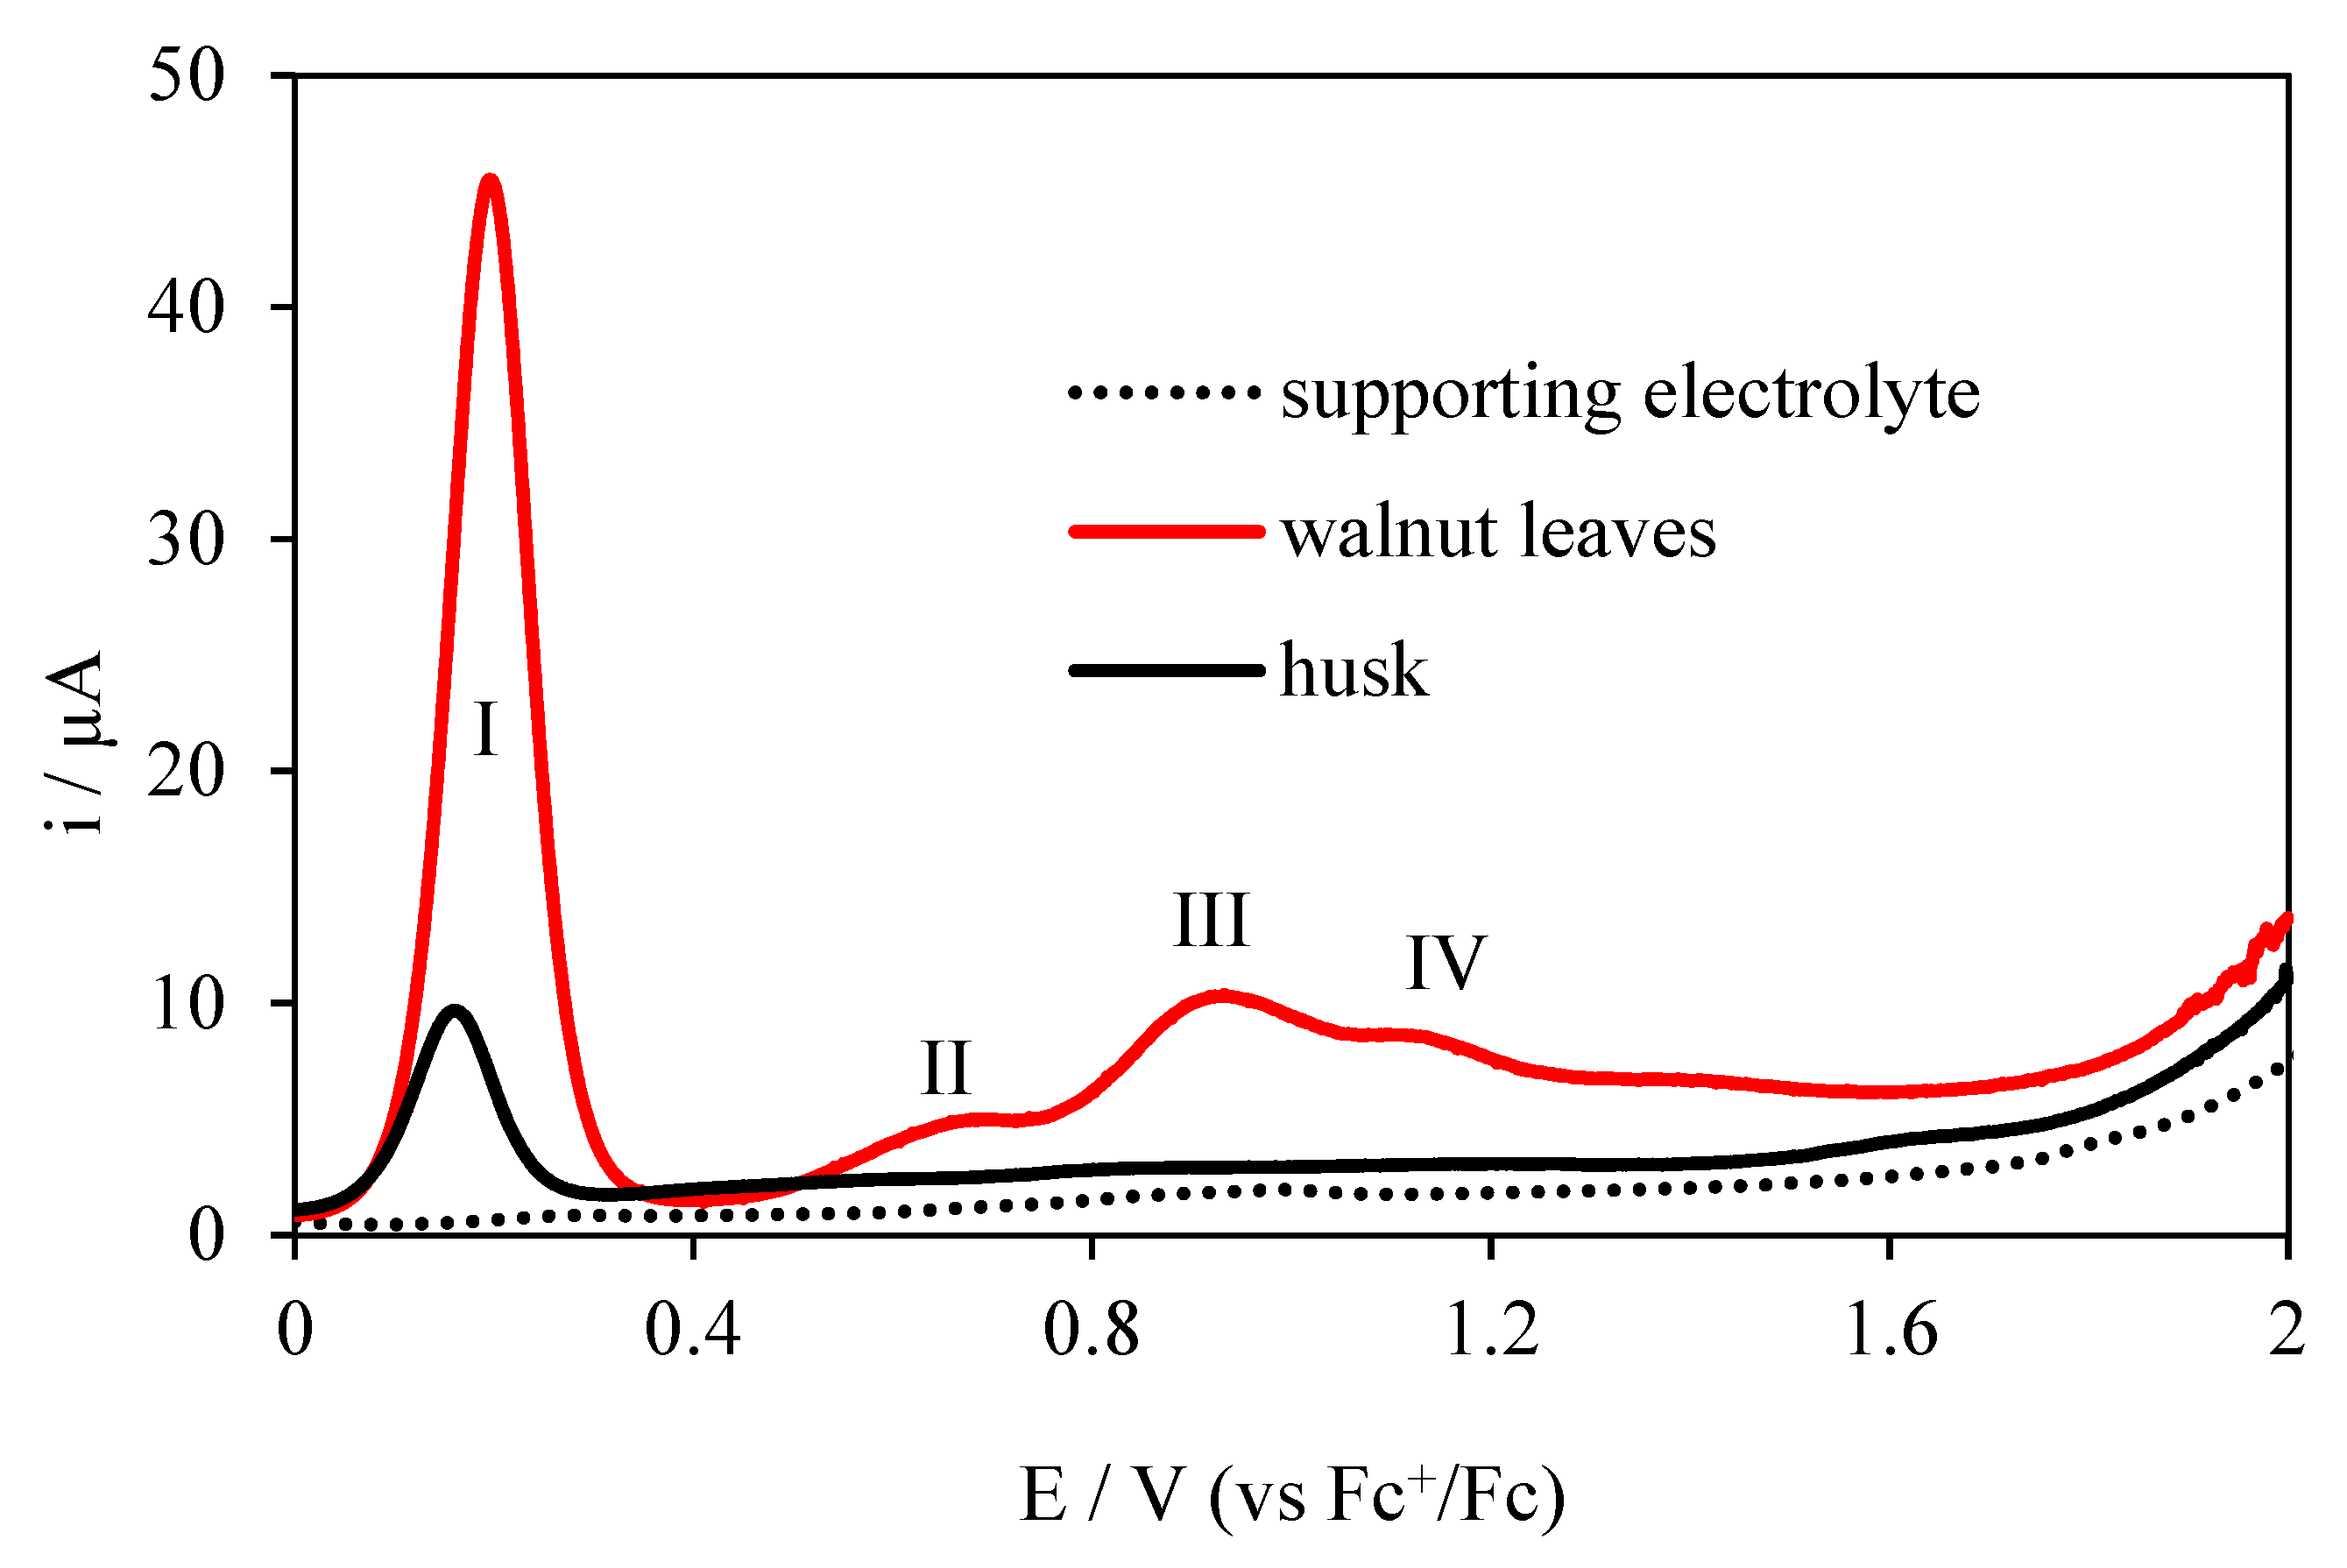
The use of the second DPV method is associated with its higher resolution and the elimination of absorbable compounds, because they are not electroactive in this technique and, for this reason, there are no visible peaks on the voltammogram [24]. The differential pulse voltammograms (DPV) for the walnut extracts and basic electrolyte studied are shown in Figure 5. Four peaks are visible for the walnut leaf extract: first peak at 0.194 V potential, second peak at 0.648 V potential, third peak at 0.905 V potential, and fourth peak at 1.118 V potential. Regarding CV, a new peak at a potential of 0.648 V appeared on the DPV, but there is no peak at a potential 1.777 V. This indicates better DPV resolution and the adsorptive character of the electrooxidation of the compound at a potential of 1.777 V.
The DPV voltammogram obtained for walnut husks extract shows one peak at 0.144 V potential and a second very poorly developed peak at 1.564 V potential. However, there is no peak visible on the CV at 0.764 V potential. This indicates the adsorptive nature of the electrode reaction taking place at this potential. Electrochemical tests performed using the DPV method and the potentials and peak currents determined, confirm that the extract from walnut leaves has better antioxidant properties. Electrochemical studies have shown better antioxidant properties of leaf extract, therefore further spectrophotometric studies were performed for this extract only.
The electrochemical index (EI) was calculated taking into account the main voltammetric parameters, peak potential (Epa), and peak current (Ipa). Based on the fact that the lower the Epa (thermodynamic parameter), the higher is the electron donor ability, and the higher the Ipa (kinetic parameter), the higher is the amount of electroactive species, EI was calculated using the following equation [15,48]
EI =Ipa1/Epa1 + Ipa2/Epa2 + · · · + Ipan/Epan.
The determined parameters Epa, Ipa and the calculated EI values for the examined extracts are included in the Table 3.
From the values presented in Table 3, it follows that walnut husks have better antioxidant properties.
The literature [38] shows that nutshells contain a number of substances with antioxidant properties. Another very interesting aspect is the presence of substances with bactericidal and fungicidal properties. This last property is mainly due to the presence of juglone. As part of the publication, the antiradical and reducing properties of the mixture of polyphenols present in the extract tested were examined. Currently, in both medicine and other fields, researchers are looking for substances with strong stabilizing properties. An additional advantage is their natural and renewable origin. Polyphenols play a very important role in the absorption or neutralization of free radicals. According to the tests carried out on the SET mechanism (transfer of a single electron), the walnut leaf extract showed some antioxidant activity (Table 4). The inhibition of the subject examined by the reduction of free radicals according to the ABTS and DPPH method extends to about 6.71%–6.94%, compared to the standard herbal extract which has high antioxidant capacity, ranging from 8%–39%. A similar effect was noted for the FRAP and CUPRAC methods. The power to reduce iron ions is 0.82 and copper 0.38 a.u., in comparison with from 0.2 to 2 a.u. for a green tea extract [49]. From this, it can certainly be said that substances present in the plant materials tested have strong antioxidant capacity. This work has been attempted to correlate the key chemical parameters of biosubstances of extract including the radical scavenging, chelating, reducing capacity with their electrochemical properties. It is surprising that confirmation of one study in another was obtained. Both the electrochemical and spectrophotometric parts are confirmed by the high antioxidant potential of substances present in the tested extract.
4. Conclusions
CV and DPV electrochemical methods were applied to determine the antioxidant capacity of leaf extracts and walnut husks. They showed correlation with other methods such as spectrophotometric analysis ABTS, DPPH, FRAP, and CUPRAC. Four qualitative peaks were designated on the basis of the electrical tests. The first peak (I peak) is at a potential of 0.254 V, the second peak at 0.968 V, the third peak at 1.184 V potential, and the fourth peak at 1.777 V potential. Substances present in the extract with antioxidant capacity have a high affinity for scavenging free radicals, and less ability to reduce transition metal ions. HPLC analysis shows the great advantage of the phenolic compounds in the leaves relative to the husk. Unfortunately, there is no juglone, which is very unstable and quickly degrades. Thermogravimetric analysis allowed determination of the thermal stability of the plant materials. It was found that plant materials (leaf and husks) derived from walnut can be processed up to 240 °C. It should be said that walnut extracts are very rich in materials that inhibit oxidation processes. These bioactive compounds present in walnut extracts are suggested as an interesting economical source of antioxidants for use in the food and nutraceutical [50,51,52] industries. The use of electrochemical techniques in combination with spectrophotometric methods has allowed an in-depth study of the antioxidant potential of bioactive substances present in the tested extract. The research proposed and the results obtained would be of great interest to understand the relationship between content and scavenging mechanism of all the nutrients in walnuts.
Supplementary Materials
The following are available online at https://0-www-mdpi-com.brum.beds.ac.uk/1999-4907/10/11/988/s1, Figure S1: Scheme of Polyphenolic Profile and Antioxidant Activity of Juglans regia L. Leaves and Husk Extracts.
Author Contributions
A.M. conceived, designed, and performed the experiments, analysed and interpreted the data, and wrote the paper; A.P., E.C. and M.L.-B. performed the experiments and analysed and interpreted the data.
Funding
This study was supported by the National Centre for Research and Development (NCBR) project: LIDER/32/0139/L-7/15/NCBR/2016.
Conflicts of Interest
The authors declare no conflict of interest.
References
- Di Mauro, M.D.; Giardina, R.C.; Fava, G.; Mirabella, E.F.; Acquaviva, R.; Renis, M.; D’Antona, N. Polyphenolic profile and antioxidant activity of olive mill wastewater from two Sicilian olive cultivars: Cerasuola and Nocellara etnea. Eur. Food Res. Technol. 2017, 243, 1895–1903. [Google Scholar] [CrossRef]
- Mauro, M.D.D.; Fava, G.; Spampinato, M.; Aleo, D.; Melilli, B.; Saita, M.G.; Centonze, G.; Maggiore, R.; Antona, D.; Di Mauro, M.D.; et al. Polyphenolic Fraction from Olive Mill Wastewater: Scale-Up and in Vitro Studies for Ophthalmic Nutraceutical Applications. Antioxidants 2019, 8, 462. [Google Scholar] [CrossRef] [PubMed]
- Fraga, C.G.; Croft, K.D.; Kennedy, D.O.; Tomás-Barberán, F.A. The effects of polyphenols and other bioactives on human health. Food Funct. 2019, 10, 514–528. [Google Scholar] [CrossRef] [PubMed] [Green Version]
- Acquaviva, R.; D’Angeli, F.; Malfa, G.A.; Ronsisvalle, S.; Garozzo, A.; Stivala, A.; Ragusa, S.; Nicolosi, D.; Salmeri, M.; Genovese, C. Antibacterial and anti-biofilm activities of walnut pellicle extract (Juglans regia L.) against coagulase-negative staphylococci. Nat. Prod. Res. 2019, 2019, 1–6. [Google Scholar] [CrossRef]
- Masek, A.; Chrzescijanska, E.; Latos-Brozio, M.; Zaborski, M. Characteristics of juglone (5-hydroxy-1,4,-naphthoquinone) using voltammetry and spectrophotometric methods. Food Chem. 2019, 301, 125279. [Google Scholar] [CrossRef]
- Salejda, A.M.; Janiewicz, U.; Korzeniowska, M.; Kolniak-Ostek, J.; Krasnowska, G. Effect of walnut green husk addition on some quality properties of cooked sausages. LWT 2016, 65, 751–757. [Google Scholar] [CrossRef]
- Amaral, J.S.; Valentão, P.; Andrade, P.B.; Martins, R.C.; Seabra, R.M. Do Cultivar, Geographical Location and Crop Season Influence Phenolic Profile of Walnut Leaves? Molecules 2008, 13, 1321–1332. [Google Scholar] [CrossRef] [Green Version]
- Zhou, Y.; Yang, B.; Jiang, Y.; Liu, Z.; Liu, Y.; Wang, X.; Kuang, H. Studies on Cytotoxic Activity against HepG-2 Cells of Naphthoquinones from Green Walnut Husks of Juglans mandshurica Maxim. Molecules 2015, 20, 15572–15588. [Google Scholar] [CrossRef] [Green Version]
- Rusu, M.E.; Gheldiu, A.-M.; Mocan, A.; Moldovan, C.; Popa, D.-S.; Tomuta, I.; Vlase, L. Process Optimization for Improved Phenolic Compounds Recovery from Walnut (Juglans regia L.) Septum: Phytochemical Profile and Biological Activities. Molecules 2018, 23, 2814. [Google Scholar] [CrossRef]
- Liu, R.; Wu, L.; Du, Q.; Ren, J.-W.; Chen, Q.-H.; Li, D.; Mao, R.-X.; Liu, X.-R.; Li, Y. Small Molecule Oligopeptides Isolated from Walnut (Juglans regia L.) and Their Anti-Fatigue Effects in Mice. Molecules 2019, 24, 45. [Google Scholar] [CrossRef]
- Oliveira, I.; Sousa, A.; Ferreira, I.C.; Bento, A.A.; Estevinho, L.; Pereira, J.A.; Estevinho, M.L.M.F. Total phenols, antioxidant potential and antimicrobial activity of walnut (Juglans regia L.) green husks. Food Chem. Toxicol. 2008, 46, 2326–2331. [Google Scholar] [CrossRef] [PubMed]
- Ros, E.; Izquierdo-Pulido, M.; Sala-Vila, A. Beneficial effects of walnut consumption on human health role of micronutrients. Curr. Opin. Clin. Nutr. Metab. Care 2018, 21, 498–504. [Google Scholar] [CrossRef] [PubMed]
- Jahanban-Esfahlan, A.; Ostadrahimi, A.; Tabibiazar, M.; Amarowicz, R. Comparative Review on the Extraction, Antioxidant Content and Antioxidant Potential of Diferent Parts of Walnut (Juglans regia L.) Fruit and Tree. Molecules 2019, 24, 2133. [Google Scholar] [CrossRef] [PubMed]
- Anderson, K.J.; Teuber, S.S.; Gobeille, A.; Cremin, P.; Waterhouse, A.L.; Steinberg, F.M. Walnut Polyphenolics Inhibit In Vitro Human Plasma and LDL Oxidation. J. Nutr. 2001, 131, 2837–2842. [Google Scholar] [CrossRef] [PubMed]
- Lino, F.; De Sá, L.; Torres, I.; Rocha, M.; Dinis, T.; Ghedini, P.; Somerset, V.; Gil, E.; Rocha, M. Voltammetric and spectrometric determination of antioxidant capacity of selected wines. Electrochim. Acta 2014, 128, 25–31. [Google Scholar] [CrossRef]
- Jara-Palacios, M.J.; Escudero-Gilete, M.L.; Hernández-Hierro, J.M.; Heredia, F.J.; Hernanz, D. Cyclic voltammetry to evaluate the antioxidant potential in winemaking by-products. Talanta 2017, 165, 211–215. [Google Scholar] [CrossRef]
- Masek, A.; Chrzescijanska, E.; Latos, M.; Zaborski, M. Influence of hydroxyl substitution on flavanone antioxidants properties. Food Chem. 2017, 215, 501–507. [Google Scholar] [CrossRef]
- Barros, L.; Cabrita, L.; Boas, M.V.; Carvalho, A.M.; Ferreira, I.C. Chemical, biochemical and electrochemical assays to evaluate phytochemicals and antioxidant activity of wild plants. Food Chem. 2011, 127, 1600–1608. [Google Scholar] [CrossRef]
- Masek, A.; Chrzescijanska, E.; Kosmalska, A.; Zaborski, M. Antioxidant activity determination in Sencha and Gun Powder green tea extracts with the application of voltammetry and UV-VIS spectrophotometry. Comptes Rendus Chime 2012, 15, 424–427. [Google Scholar] [CrossRef]
- Masek, A.; Chrzescijanska, E.; Kosmalska, A.; Zaborski, M. Characteristics of compounds in hops using cyclic voltammetry, UV–VIS, FTIR and GC–MS analysis. Food Chem. 2014, 156, 353–361. [Google Scholar] [CrossRef]
- Hoyos-Arbeláez, J.; Vázquez, M.; Contreras-Calderón, J. Electrochemical methods as a tool for determining the antioxidant capacity of food and beverages: A review. Food Chem. 2017, 221, 1371–1381. [Google Scholar] [CrossRef] [PubMed]
- Vicentini, F.C.; Raymundo-Pereira, P.A.; Janegitz, B.C.; Machado, S.A.; Fatibello-Filho, O. Nanostructured carbon black for simultaneous sensing in biological fluids. Sens. Actuators B Chem. 2016, 227, 610–618. [Google Scholar] [CrossRef]
- Rebelo, M.; Rego, R.; Ferreira, M.; Oliveira, M.C. Comparative study of the antioxidant capacity and polyphenol content of Douro wines by chemical and electrochemical methods. Food Chem. 2013, 141, 566–573. [Google Scholar] [CrossRef] [PubMed]
- Brett, C.M.A.; Brett, A.M.O. Electrochemistry—Principles, Methods and Applications; Oxford University Press: Oxford, UK, 1993. [Google Scholar]
- Escarpa, A. Food electroanalysis: Sense and simplicity. Chem. Rec. 2012, 12, 72–91. [Google Scholar] [CrossRef]
- Duygu, D.; Baykal, T.; Acikgoz, D.; Yildiz, K. Fourier Transform Infrared (FT-IR) Spectroscopy for Biological Studies. J. Sci. 2009, 22, 117–121. [Google Scholar]
- Ashokkumar, R.; Ramaswamy, M. Phytochemical screening by FTIR spectroscopic analysis of leaf extracts of selected Indian Medicinal plants. Int. J. Curr. Microbiol. App. Sci. 2014, 3, 395–406. [Google Scholar]
- Dyrby, M.; Westergaard, N.; Stapelfeldt, H. Light and heat sensitivity of red cabbage extract in soft drink model systems. Food Chem. 2001, 72, 431–437. [Google Scholar] [CrossRef]
- Amaral, J.S.; Seabra, R.M.; Andrade, P.B.; Valentão, P.; Pereira, J.A.; Ferreres, F. Phenolic profile in the quality control of walnut (Juglans regia L.) leaves. Food Chem. 2004, 88, 373–379. [Google Scholar] [CrossRef]
- Nour, V.; Trandafir, I.; Cosmulescu, S. HPLC Determination of phenolic acids, flavonoids and juglone in walnut leaves. J. Chromatogr. Sci. 2013, 51, 883–890. [Google Scholar] [CrossRef]
- Pereira, J.A.; Oliveira, I.; Sousa, A.; Valentão, P.; Andrade, P.B.; Ferreira, I.C.; Ferreres, F.; Bento, A.A.; Seabra, R.; Estevinho, L. Walnut (Juglans regia L.) leaves: Phenolic compounds, antibacterial activity and antioxidant potential of different cultivars. Food Chem. Toxicol. 2007, 45, 2287–2295. [Google Scholar] [CrossRef]
- Sipkina, N.Y.; Skorik, Y.A. Detection and determination of some phenolic and cinnamic acids in plant extracts. J. Anal. Chem. 2015, 70, 1406–1411. [Google Scholar] [CrossRef]
- Latos-Brozio, M.; Masek, A. Effect of Impregnation of Biodegradable Polyesters with Polyphenols from Cistus Linnaeus and Juglans regia Linnaeus Walnut Green Husk. Polymers 2019, 11, 669. [Google Scholar] [CrossRef] [PubMed]
- Dos Santos, R.C.; Amorim, A.D.G.N.; Thomasi, S.S.; Figueiredo, F.C.; Carneiro, C.S.; Da Silva, P.R.P.; Neto, W.R.D.V.; Ferreira, A.G.; Júnior, J.R.D.S.; Leite, J.R.D.S.D.A. Development of an electrolytic method to obtain antioxidant for biodiesel from cashew nut shell liquid. Fuel 2015, 144, 415–422. [Google Scholar] [CrossRef]
- Foo, L.Y. Proanthocyanidins: Gross Chemical Red Spectra Structures by Infra-Red Spectra. Phytochemistry 1981, 20, 1397–1402. [Google Scholar] [CrossRef]
- Kacuráková, M. FT-IR study of plant cell wall model compounds: Pectic polysaccharides and hemicelluloses. Carbohydr. Polym. 2000, 43, 195–203. [Google Scholar] [CrossRef]
- McGhie, T.K.; Rowan, D.R.; Edwards, P.J. Structural Identification of Two Major Anthocyanin Components of Boysenberry by NMR Spectroscopy. J. Agric. Food Chem. 2006, 54, 8756–8761. [Google Scholar] [CrossRef]
- Agustin-Salazar, S.; Gamez-Meza, N.; Medina-Juárez, L.Á.; Malinconico, M.; Cerruti, P. Stabilization of Polylactic Acid and Polyethylene with Nutshell Extract: Efficiency Assessment and Economic Evaluation. ACS Sustain. Chem. Eng. 2017, 5, 4607–4618. [Google Scholar] [CrossRef]
- Joshi, D.D. UV–Vis. Spectroscopy: Herbal Drugs and Fingerprints. In Herbal Drugs and Fingerprints: Evidence Based Herbal Drugs; Springer: Delhi, India, 2012; pp. 101–120. [Google Scholar] [CrossRef]
- Engida, A.M.; Faika, S.; Nguyen-Thi, B.T.; Ju, Y.-H. Analysis of major antioxidants from extracts of Myrmecodia pendans by UV/visible spectrophotometer, liquid chromatography/tandem mass spectrometry, and high-performance liquid chromatography/UV techniques. J. Food Drug Anal. 2015, 23, 303–309. [Google Scholar] [CrossRef] [Green Version]
- Song, H.; Chen, C.; Zhao, S.; Ge, F.; Liu, D.; Shi, D.; Zhang, T. Interaction of gallic acid with trypsin analyzed by spectroscopy. J. Food Drug Anal. 2015, 23, 234–242. [Google Scholar] [CrossRef] [Green Version]
- Rojas, J.; Londono, C.; Ciro, Y. The health benefits of natural skin UVA photoprotective compounds found in botanical sources. Int. J. Pharm. Pharm. Sci. 2016, 8, 13–23. [Google Scholar]
- Ebrahimia, I.; Gashtib, M.P. Extraction of juglone from Pterocarya fraxinifolia leaves for dyeing, anti-fungal finishing, and solar UV protection of wool. Colora Technol. 2015, 131, 451–457. [Google Scholar] [CrossRef]
- Butnariu, M.; Coradini, C.Z. Evaluation of Biologically Active Compounds from Calendula officinalis Flowers using Spectrophotometry. Chem. Central J. 2012, 6, 35. [Google Scholar] [CrossRef] [PubMed]
- Hadjmohammadi, M.R.; Kamel, K. Determination of juglone (5-hydroxy 1,4,-naphthoquinone) in Pterocarya flaxinifolia by RP-HPLC. Iran. J. Chem. Chem. Eng. 2006, 25, 73–76. [Google Scholar]
- Wright, D.; Mitchelmore, C.; Dawson, R.; Cutler, H. The Influence of Water Quality on the Toxicity and Degradation of Juglone (5-Hydroxy 1,4-Naphthoquinone). Environ. Technol. 2007, 28, 1091–1101. [Google Scholar] [CrossRef] [PubMed]
- Solar, A.; Colaric, M.; Usenik, V.; Stampar, F. Seasonal variations of selected flavonoids, phenolic acids and quinines in annual ahoots of common walnut (Juglans regia L.). Plant Sci. J. 2006, 170, 453–461. [Google Scholar] [CrossRef]
- De Macêdo, I.Y.L.; Garcia, L.F.; Neto, J.R.O.; de Siqueira Leite, K.C.; Ferreira, V.S.; Ghedini, P.C.; de Souza Gil, E. Electroanalytical tools for antioxidant evaluation of red fruits dry extracts. Food Chem. 2017, 217, 326–331. [Google Scholar] [CrossRef]
- Masek, A. Antioxidant and Antiradical Properties of Green Tea Extract Compounds. Int. J. Electrochem. Sci. 2017, 12, 6600–6610. [Google Scholar] [CrossRef]
- Daliu, P.; Santini, A.; Novellino, E. A decade of nutraceutical patents: Where are we now in 2018? Expert Opin. Ther. Patents 2018, 28, 875–882. [Google Scholar] [CrossRef]
- Santini, A.; Novellino, E. Nutraceuticals-shedding light on the grey area between pharmaceuticals and food. Expert Rev. Clin. Pharmacol. 2018, 11, 545–547. [Google Scholar] [CrossRef]
- Daliu, P.; Santini, A.; Novellino, E. From pharmaceuticals to nutraceuticals: Bridging disease prevention and management. Expert Rev. Clin. Pharmacol. 2019, 12, 1–7. [Google Scholar] [CrossRef]
Scheme 1.
Preparation of extracts from walnut leaves and husks.

Figure 1.
Thermogravimetry analysis (TGA) curves of plant materials: walnut husks and leaves.

Figure 2.
Fourier-transform infrared (FTIR) spectrum of leaves of walnut (a) and extract of leaves of walnut (b) and ultraviolet visible (UV-VIS) spectrum of extract of leaves of walnut (c).
Figure 2.
Fourier-transform infrared (FTIR) spectrum of leaves of walnut (a) and extract of leaves of walnut (b) and ultraviolet visible (UV-VIS) spectrum of extract of leaves of walnut (c).

Figure 3.
Chromatograms of walnut leaf and husk extracts at λ = 280 nm, 320 nm, and 360 nm. Peaks: 1, gallic acid; 2, syringic acid; 3, ellagic acid; 4, neochlorogenic acid; 5, chlorogenic acid; 6, caffeic acid; 7, p-coumaric acid; 8, ferulic acid; 9, sinapic acid; 10, rutin; 11, Quercetin 3-galactoside; 12, myricetin; 13, quercetin 3-rhamnoside; 14, quercetin; 15, kaempferol; a, unidentified hydroxybenzoic acids; b, unidentified hydroxycynnamic acids; c, unidentified flavonols.

Figure 4.
Cyclic voltammetry (CV) electrooxidation of leaf extracts and walnut husks on the electrode Pt; c = 20 mg/dm3 in 0.1 M (C4H9)4NClO4 in acetonitrile, v = 0.1 V/s.
Figure 4.
Cyclic voltammetry (CV) electrooxidation of leaf extracts and walnut husks on the electrode Pt; c = 20 mg/dm3 in 0.1 M (C4H9)4NClO4 in acetonitrile, v = 0.1 V/s.
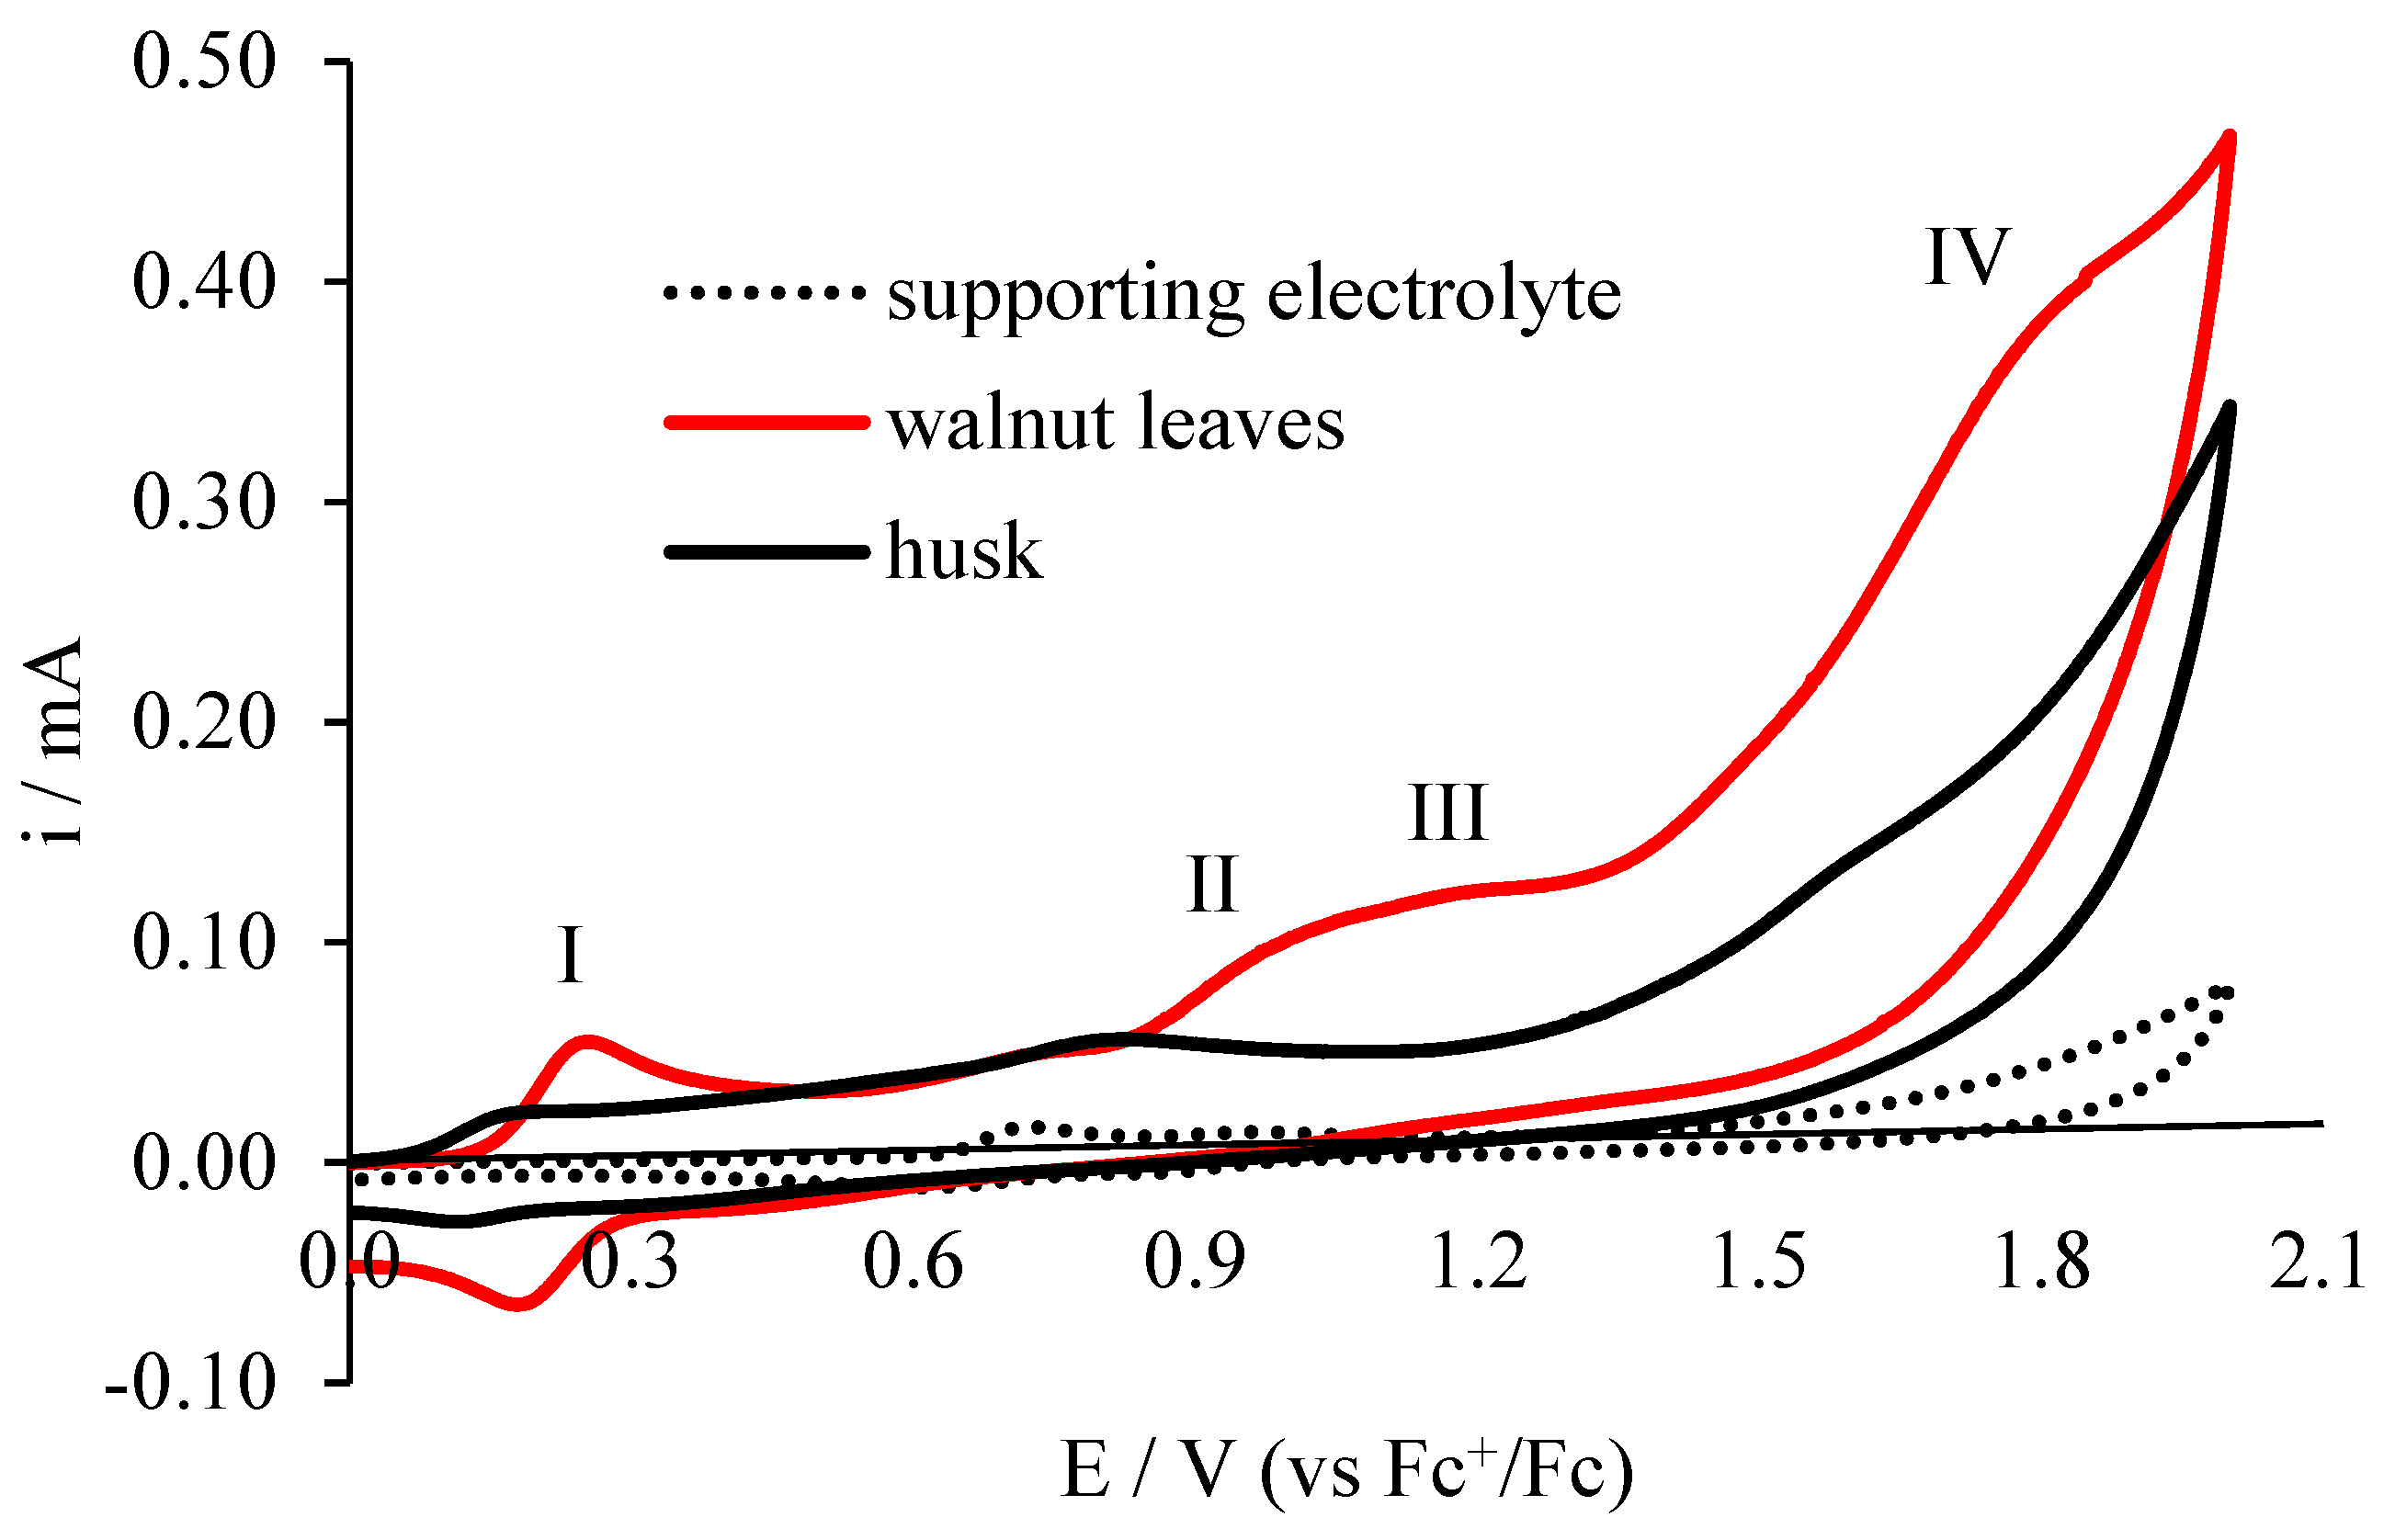
Figure 5.
Differential pulse voltammograms (DPV) electrooxidation of extracts from walnut leaf and husks on the Pt electrode; c = 20 mg/dm3 in 0.1 mol·L−1 (C4H9)4NClO4 in acetonitrile.
Figure 5.
Differential pulse voltammograms (DPV) electrooxidation of extracts from walnut leaf and husks on the Pt electrode; c = 20 mg/dm3 in 0.1 mol·L−1 (C4H9)4NClO4 in acetonitrile.


Table 1.
T20, T50, and T65 of plant materials: walnut husks and leaves.
| Sample | T20 | T50 | T65 |
|---|---|---|---|
| Walnut husks | 240 | 380 | 799 |
| Walnut leaves | 267 | 403 | 640 |
Table 2.
Phenolic compounds content in walnut leaf extract and walnut husk extract.
| Compounds | Content (mg/g of Extract) | |
|---|---|---|
| Leaf Extract | Husk Extract | |
| Gallic acid | 0.59 ± 0.03 | 6.06 ± 0.18 |
| Syringic acid | - | 1.75 ± 0.16 |
| Other hydroxybenzoic acids 1 | 9.11 ± 1.64 | 4.68 ± 0.06 |
| Ellagic acid | - | 0.44 ± 0.01 |
| Neochlorogenic acid | 11.20 ± 0.25 | 3.82 ± 0.14 |
| Chlorogenic acid | 3.56 ± 0.17 | - |
| Caffeic acid | 0.65 ± 0.03 | - |
| Sinapic acid | 0.12 ± 0.01 | 0.73 ± 0.04 |
| Ferulic acid | 0.09 ± 0.00 | - |
| p-Coumaric acid | 0.07 ± 0.01 | - |
| Other hydroxycinnamic acids 2 | 50.25 ± 6.15 | 17.68 ± 1.47 |
| Myricetin | 0.45 ± 0.04 | - |
| Quercetin | 1.85 ± 0.31 | - |
| Kaempferol | 1.03 ± 0.08 | - |
| Quercetin 3-rhamnoside | 8.04 ± 0.52 | 0.94 ± 0.04 |
| Quercetin 3-galactoside | 18.91 ± 0.03 | 0.43 ± 0.04 |
| Rutin | 0.23 ± 0.03 | - |
| Other flavonols 3 | 79.89 ± 1.12 | 2.47 ± 0.10 |
| Total | 186.04 ± 5.30 | 39.00 ± 0.65 |
Mean ± SD, n = 2. 1 as gallic acid equivalents; 2 as chlorogenic acid equivalents; 3 as quercetin-3-galactoside equivalents.
Table 3.
Peak potentials (Ep) and currents (Ip) determined from CV i DPV, antioxidant capacity (EI).
Table 3.
Peak potentials (Ep) and currents (Ip) determined from CV i DPV, antioxidant capacity (EI).
| Method | Peak I | Peak II | Peak III | Peak IV | EItotal | ||||
|---|---|---|---|---|---|---|---|---|---|
| Ep (V) | ip (µA) | Ep (V) | ip (µA) | Ep (V) | ip (µA) | Ep (V) | ip (µA) | ||
| CV for husk | 0.15 | 21.00 | 0.80 | 56.00 | 1.58 | 134.00 | |||
| CV for walnut leaves | 0.23 | 51.00 | 0.94 | 87.00 | 1.17 | 122.00 | 1.75 | 357.00 | |
| DPV for husk | 10.15 | 9.07 | |||||||
| DPV for walnut leaves | 1.90 | 45.00 | 0.65 | 4.77 | 0.89 | 9.96 | 1.11 | 8.64 | |
| EI for husk (CV) | 138.16 | 70.00 | 84.81 | 292.97 | |||||
| EI for walnut leaves (CV) | 221.74 | 92.55 | 104.27 | 418.57 | |||||
| EI for husk (DPV) | 0.89 | 0.89 | |||||||
| EI for walnut leaves (DPV) | 23.68 | 7.34 | 11.19 | 7.79 | 50.00 | ||||
Table 4.
Antioxidant capacity and ability to reduce iron and cooper ions of extracts of walnut leaves.
Table 4.
Antioxidant capacity and ability to reduce iron and cooper ions of extracts of walnut leaves.
| Method | Walnut Leaves | |
|---|---|---|
| Antioxidant capacity | ||
| ABTS | inhibition [%] | 6.94 ± 0.35 |
| DPPH | inhibition [%] | 6.72 ± 0.34 |
| Reduction of iron and cooper ions | ||
| FRAP | Fe3+→Fe2+ (∆A, a.u.) | 0.82 ± 0.04 |
| CUPRAC | Cu2+→Cu1+ (∆A, a.u.) | 0.38 ± 0.02 |
© 2019 by the authors. Licensee MDPI, Basel, Switzerland. This article is an open access article distributed under the terms and conditions of the Creative Commons Attribution (CC BY) license (http://creativecommons.org/licenses/by/4.0/).
Share and Cite
MDPI and ACS Style
Masek, A.; Latos-Brozio, M.; Chrzescijanska, E.; Podsedek, A. Polyphenolic Profile and Antioxidant Activity of Juglans regia L. Leaves and Husk Extracts. Forests 2019, 10, 988. https://0-doi-org.brum.beds.ac.uk/10.3390/f10110988
AMA Style
Masek A, Latos-Brozio M, Chrzescijanska E, Podsedek A. Polyphenolic Profile and Antioxidant Activity of Juglans regia L. Leaves and Husk Extracts. Forests. 2019; 10(11):988. https://0-doi-org.brum.beds.ac.uk/10.3390/f10110988
Chicago/Turabian StyleMasek, Anna, Malgorzata Latos-Brozio, Ewa Chrzescijanska, and Anna Podsedek. 2019. "Polyphenolic Profile and Antioxidant Activity of Juglans regia L. Leaves and Husk Extracts" Forests 10, no. 11: 988. https://0-doi-org.brum.beds.ac.uk/10.3390/f10110988
Note that from the first issue of 2016, this journal uses article numbers instead of page numbers. See further details here.