Article

Timber and Branch Volume Prediction: Effects of Stand and Site Characteristics on Dendromass and Timber-To-Branch Volume Ratio of Norway Spruce in Managed Forests

Faculty of Forestry and Wood Sciences, Czech University of Life Sciences Prague, Kamýcká 129, Prague-Suchdol 16521, Czech Republic
*
Author to whom correspondence should be addressed.
Submission received: 7 January 2019 / Revised: 4 February 2019 / Accepted: 8 February 2019 / Published: 10 February 2019
(This article belongs to the Special Issue Forest Stand Management and Biomass Growth)

Abstract

:
The objective of this study was to develop the models that predict both timber and branch volumes of Norway spruce (Picea abies/L./Karst.), the most abundant tree species in Europe, and determine the relationships among timber and branch volumes and various site and stand characteristics. The data used in this study come from 76 sample plots in the different stands and site conditions across Norway spruce forests in the Czech Republic. Timber volume was determined by Huber’s formula and branch volume (logging residue) was determined by drying and weighing of 10 samples from the 10-chipped trees on each sample plot, meaning that a total of 760 samples were analyzed. The results showed that timber volume was significantly positively correlated with branch volume, mean diameter at breast height (mean DBH) per sample plot, mean height per sample plot, slope of sample plot, and stand age, but negatively correlated with stand stocking. The branch volume was more significantly affected by stand stocking than timber volume. The timber-to-branch volume ratio (TBR) reached the mean value of 3.7 (±0.14 SE) and significantly increased with increasing elevation. The trees on the nutrient-rich sites were characterized by higher branch volume, while TBR reached higher values on the acid sites. Site quality class had a significant effect only on the branch volume production. Compared to the timber volume (root mean square error, RMSE = 3.6176; adjusted coefficient of determination, R2adj = 0.7310), the branch volume was relatively poorly described by the model (RMSE = 1.928; R2adj = 0.2517). The volume prediction models show that timber volumes increase with increasing slope and branch volume increases with decreasing site quality class. For effective forest management practice, the highest branch volume in favor of timber production is characterized for lowland forests with stand stocking ≤60% (TBR 1.5), while the highest share of timber volume (TBR 9.5) can be reached in the mountains with a full stand stocking.

1. Introduction

Plant biomass has been becoming one of the popular energy sources [1,2] and it has a significant contribution to the nonproductive functions as well [3,4]. Its value as a source of energy has increased in recent years because of the trends based on the principles of sustainable development (expressed in Rio de Janeiro in 1992) and realization of the World Summit on Sustainable Development in 2002 [5]. The important objective of the EU and its member countries including the Czech Republic is to increase the share of renewable energy sources that help reach sustainable development and independence [6]. There are other reasons for using a larger amount of plant biomass due to the tax relief, subsidy supports, and availability of the plant biomass sources in each member country. The dendromass is a part of the plant biomass which covers a huge portion of total available biomass sources. The dendromass has successfully replaced the natural gas and steam coal for heating. At the current prices, the heat from burning wood waste is cheaper than fossil fuels, as derived primarily from the local sustainable sources [7,8]. However, the transportation cost is very high in general, and therefore this could hamper for a full utilization of the dendromass [9]. The availability of the dendromass and strategy of increasing its production are described in the literature [10]. In forestry, a specific type of the dendromass, which is also known as logging residues or small wood, is usually considered as an alternative energy source. The logging residues (branches and top wood) are important parts of the logged trees which are not used for primary purposes, such as round wood and pulp wood. Before 2008 in the Czech Republic, logging residues were usually left on the ground or removed immediately after felling the trees, based on the suspicion of the potential spreading of the insects and pests and assumption that regeneration could come up easily. The dendromass mostly contains branch biomass, and this is the reason that a term dendrommass is synonymously used as branch biomass.
The measurement of dendromass in the forest ecosystems is important not only for assessing forest production functions but also for nonproductive functions, such as protection of soil, water, nutrients, and enhancement of biodiversity [11,12,13]. Only a few plant biomass studies [14,15,16,17] have aimed mainly at exploring on the physiological, ecological, and management aspects of the dendromass production in various stand conditions of the forests. These studies, in many cases, are related to the global climate changes and the potential of carbon sequestration, especially for tree species preferring shade and requiring enough moisture due to the extended drought periods [3,18,19,20].
The growth of tree parts is largely affected by various internal and external factors [21,22]. Therefore, research is necessary in several disciplines, such as geological, pedological, hydrological, climatic, and vegetation conditions, which significantly affect the primary production of the forest stands [20,23,24]. Various methods of estimating dendromass are available [25,26], and they are based on the long-term research sample plot data [27,28,29,30]. The dendromass can be estimated using the relationship among stem volume and other tree- and stand-level variables [31,32]. Since the influence of some important site factors on the dendromass may be significantly high, and therefore they need to be evaluated [33,34]. However, only few studies [35] showed insignificant relationships among logging residues and forest stand conditions. Some tree parts (assimilation apparatus and thin roots) may change in a short period such as 1 to 5 years, and in other parts (e.g., woody parts) the changes have been seen in the period of 10 to 100 years [36,37,38]. Studies [17,39,40] often aim at estimating dendromass yields from the allometric relationships among tree and stand level variables for mature or maturing stands, but only few studies [13,31,41,42] aim at estimating dendromass amounts of young stands. Distribution patterns of the dendromass substantially differ between young and mature trees [31], for example, Konôpka et al. [43] presented that the stem volume share in a total volume of the dendromass of Norway spruce (Picea abies/L./Karst.) trees increases with age, but amount of branch, needle, and root decrease with age. The empirical dendromass models were developed in the past for a few tree species in various geographic regions and forest stand conditions, especially for the aboveground tree parts [44,45,46,47]. All these, however, do not have tendencies of generalization, and therefore cannot be used for forest stands with different management regimes [48].
Considering the importance of a total dendromass production, prediction of the timber and branch volumes may be crucial using some important dendrometric measures and selected stand and site characteristics of the forests. The improper management of the dendromass could cause a negative impact on the forest landscape, such as deforestation, soil degradation, and reduction of biodiversity richness [49]. Establishing the quantitative relationships among timber and branch volumes, dendrobiomass, stand and site characteristics may offer better alternatives for more effective forest management. This study is a continuation of the previous works [50]. The objectives of this study are (i) to develop the models that predict both timber and branch volumes of Norway spruce—the most abundant tree species in Europe—and (ii) to determine the relationships among timber volume and branch volume and various site and stand characteristics affecting their productions. This study attempts to answer the following questions through logical ways:
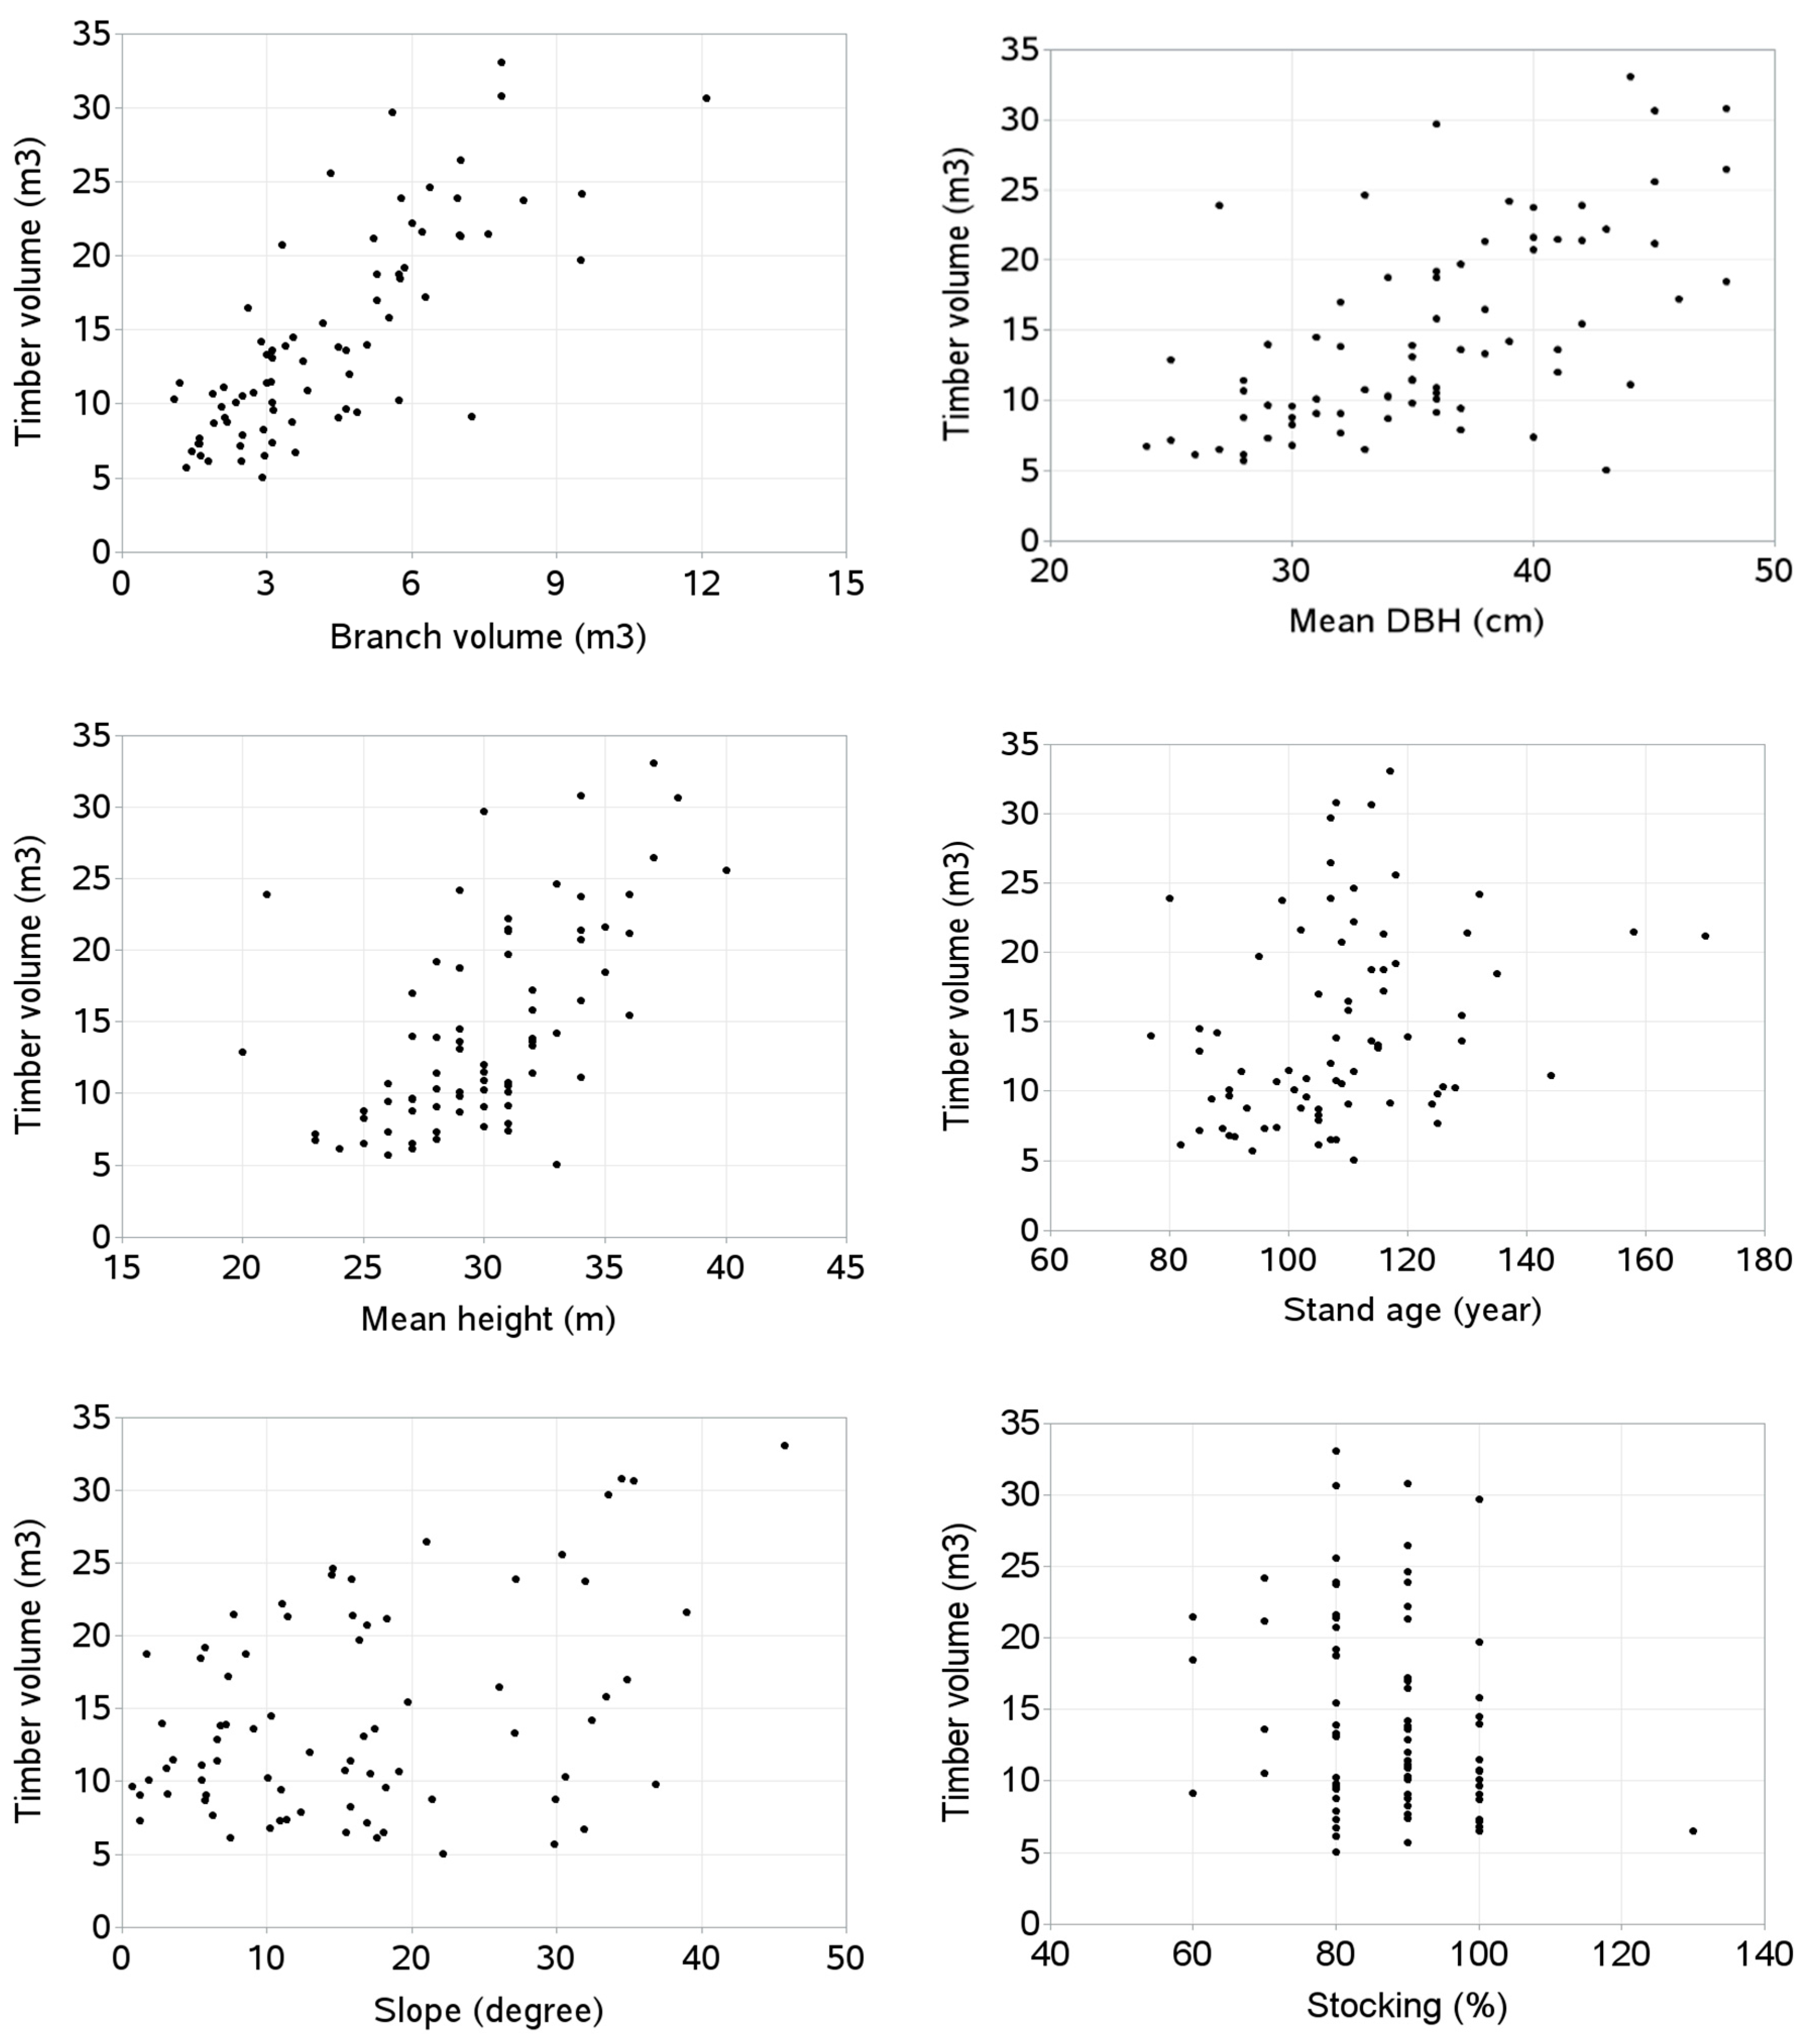
  • What stand and site characteristics are correlated with timber volume?
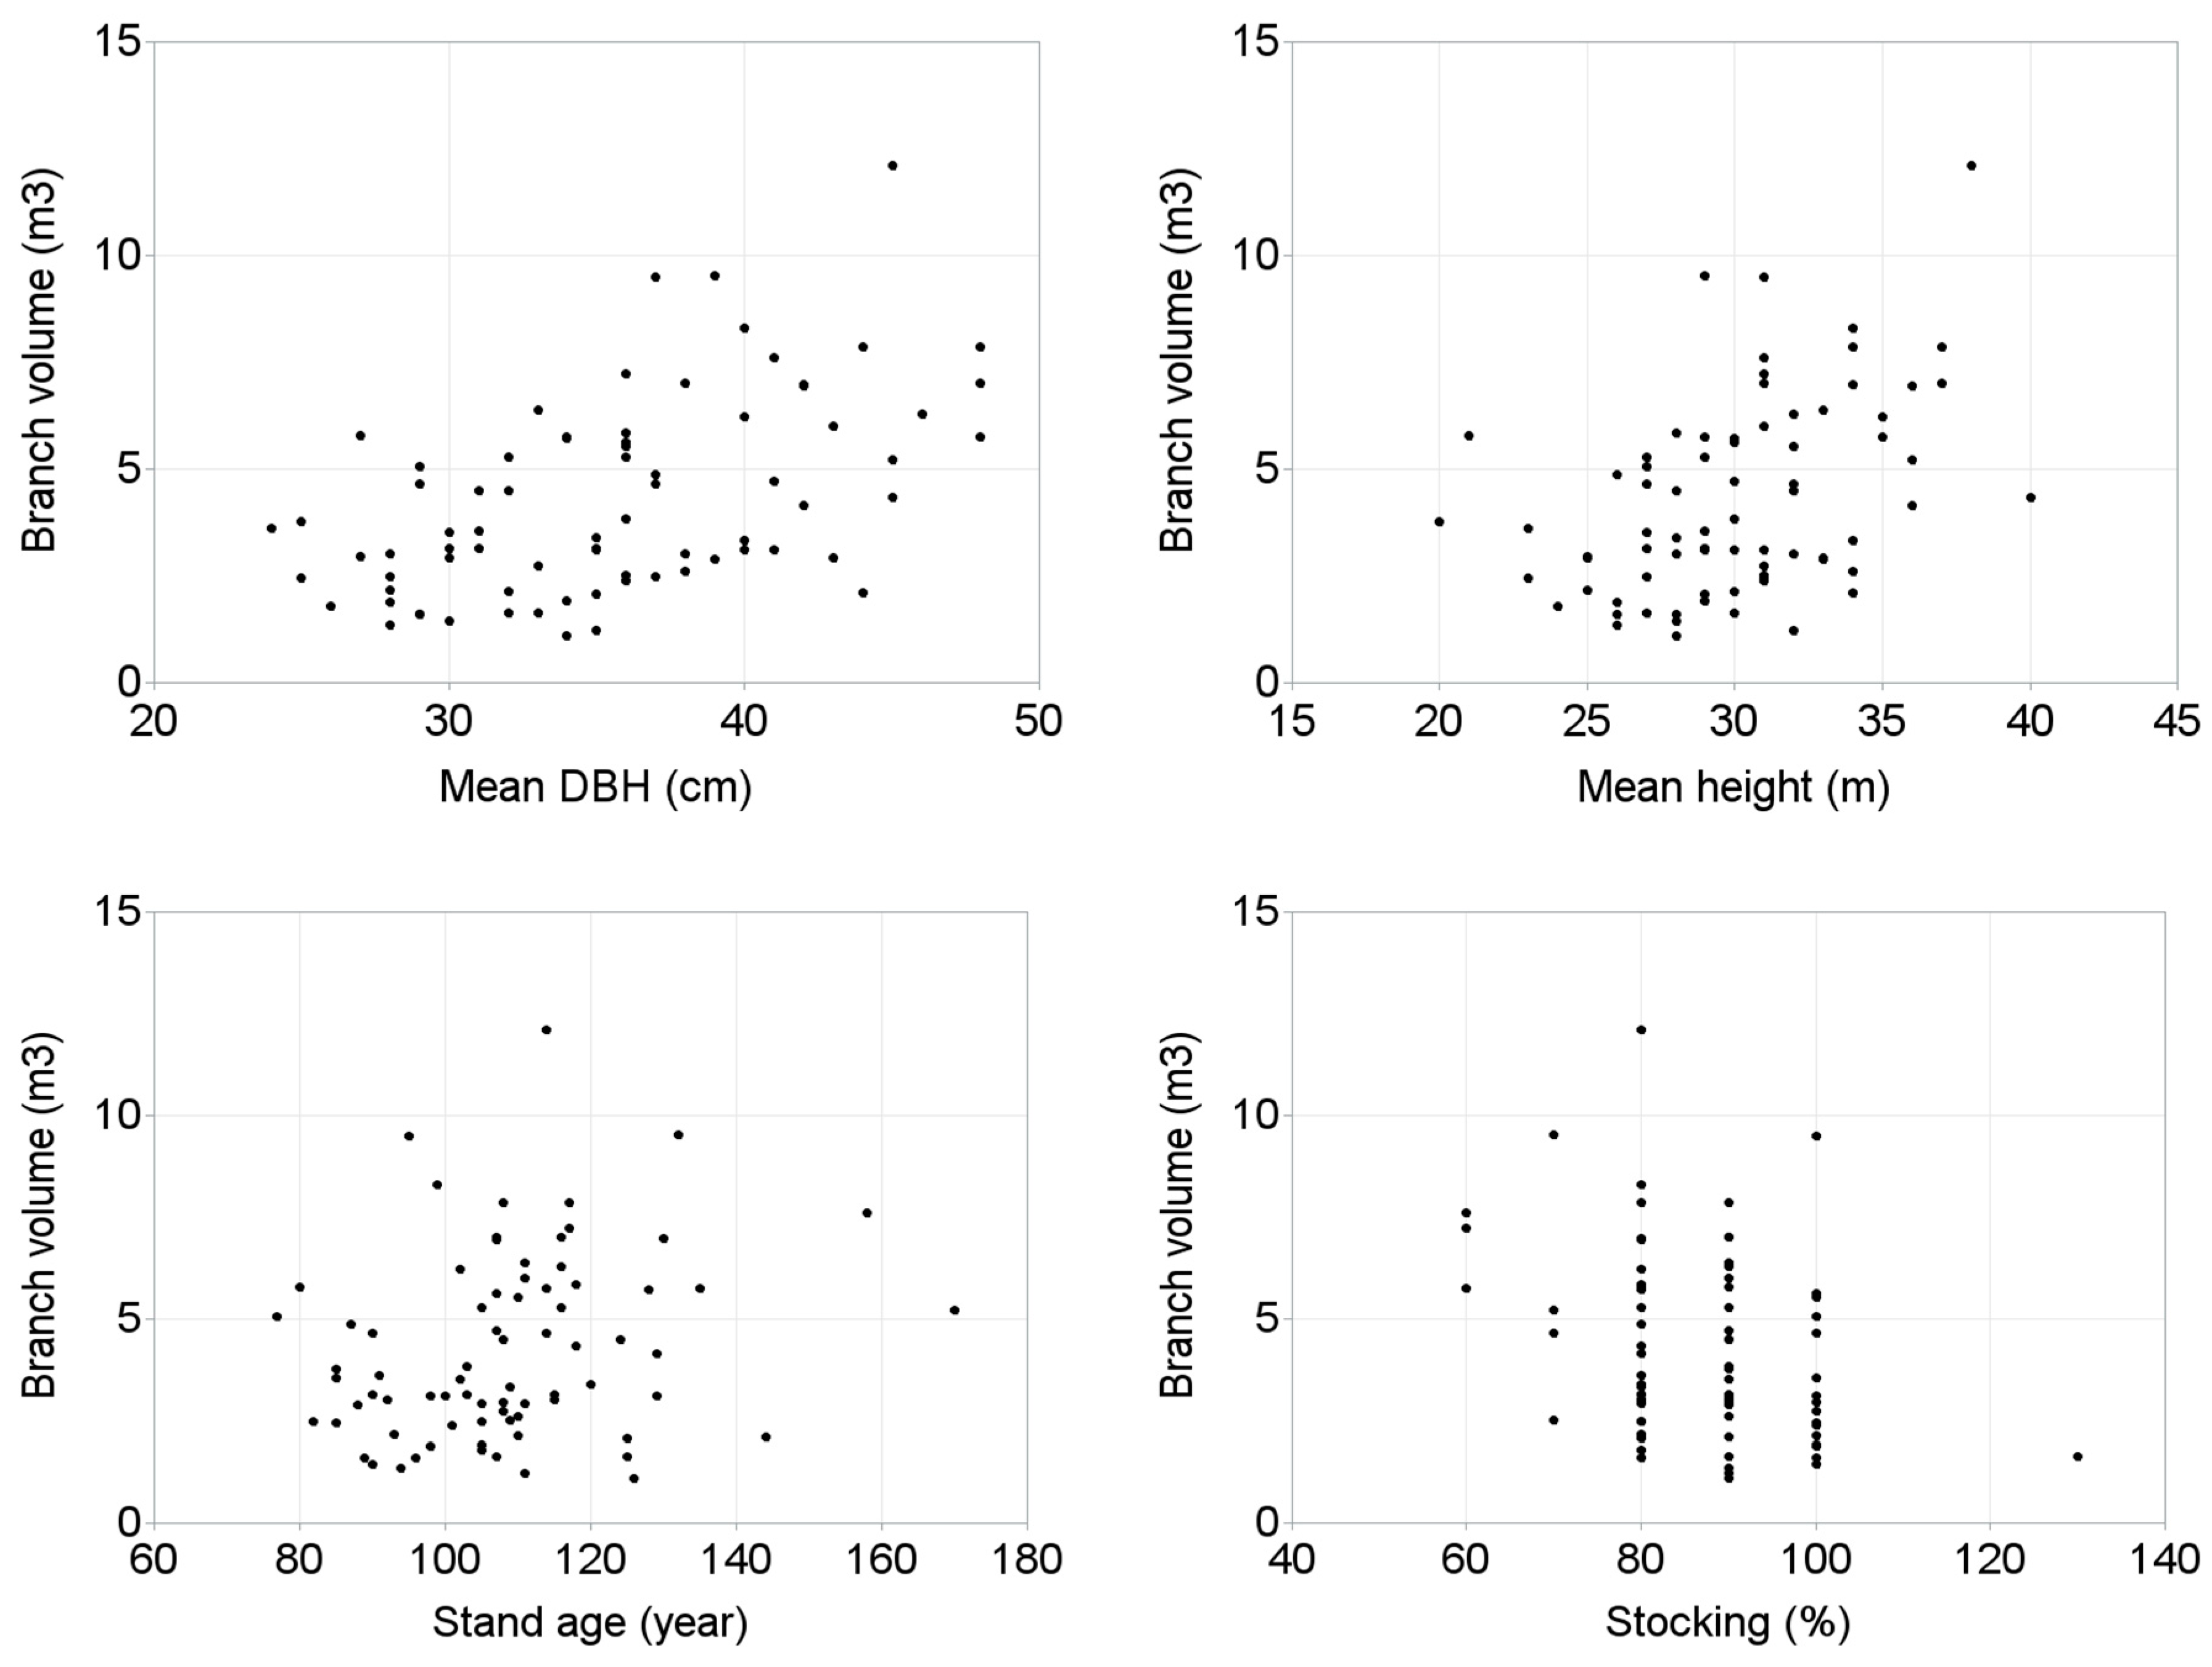
  • What stand and site characteristics are correlated with branch volume?
  • What is the ratio of timber volume to branch volume and how it is related to stand and site characteristics?
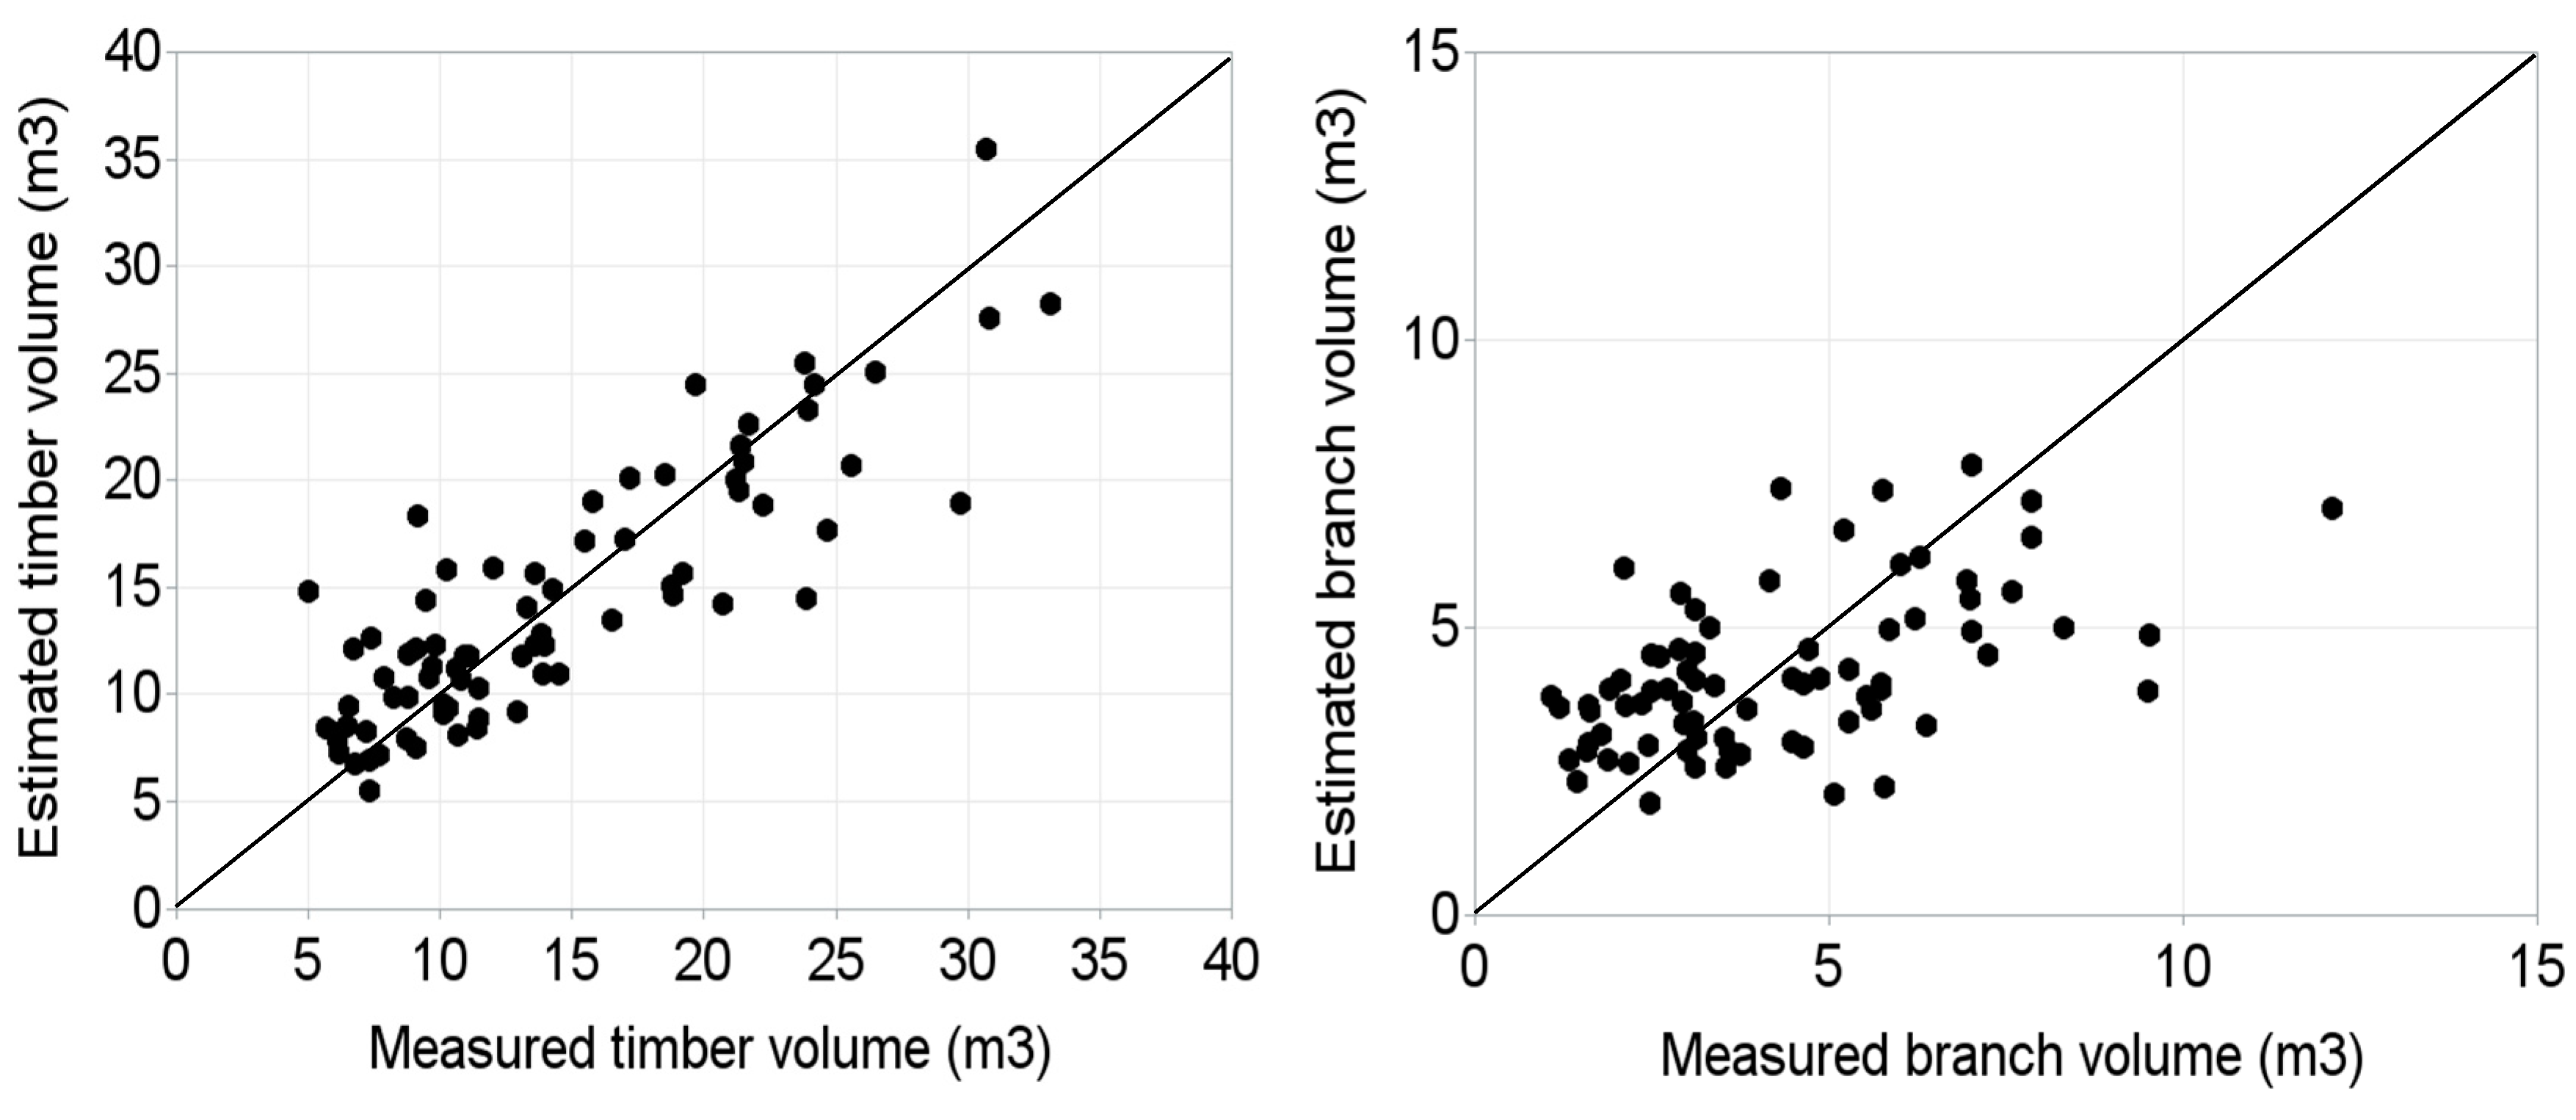
  • Is it possible to predict the timber and branch volumes from dendrometric measurements and site characteristics?

2. Materials and Methods

Study Area

This study is based on the dendrometric data from 76 sample plots (specific stands) that were located on the Norway spruce forest stands distributed in the nine out of 41 Natural Forest Area across the Czech Republic (Figure 1).
Sample plots were chosen to represent various stands of Norway spruce and site conditions. Elevation of the studied forests ranges from 380 m to 1040 m above sea level and the majority of forests is mainly in the humid continental climate zone characterized by hot and humid summer and cold to severely cold winters according to Köppen climate classification [51]. The remaining part of the forest stands belongs to the temperate oceanic climate featured by cool summer and chilly winter, with relatively narrow range of the annual temperature and few temperature extremes. The mean annual temperature lies between 4 and 8 °C, and mean annual precipitation varies from 500 to 1100 mm. There is a large variation of the mean growing season length (90–160 days) and mean temperature during the growing season is ~11.5 °C, with precipitation amount of 580 mm. The slopes of sample plot vary from 1°to 46° and exposition includes four directions (N, S, E, and W). The bedrocks of sample plots are composed mostly of schists, gneisses, granites, and sandstones. Modal Cambisols and Cryptopodzols are the prevailing soil types [52].
Norway spruce dominates over other tree species in the stands (82–100% abundance), which was planned for clear-cut management, and to a small extent, for shelterwood management system. The remaining share of tree species composition belong to European beech (Fagus sylvatica L., 0%–18%). The proportion of sycamore maple (Acer pseudoplatanus L.), silver fir (Abies alba Mill.), birch (Betula pendula L.), rowan (Sorbus aucuparia L.), and Scots pine (Pinus sylvestris L.) is below 1%. The stand age ranged from 77 to 170 years with various standing volume (337–762 m3 ha−1), stocking (60%–130%), mean diameter at breast height (DBH 24–48 cm), and mean height (23–40 m) per sample plot. According to the phytosociology and forest ecosystem classification, 40 sample plots were established on the acidic (acidophilum) sites and 36 on the nutrition-rich (trophicum) sites. The most common forest site types are Piceeto-Fagetum acidophilum (Acidic Spruce-Beech), Abieto-Fagetum acidophilum (Acidic Fir-Beech), Fageto-Piceetum acidophilum (Acidic Beech-Spruce), Piceeto-Fagetum mesotrophicum (Nutrient-medium Spruce-Beech), Piceeto-Fagetum eutrophicum (Nutrient-rich Spruce-Beech) and Piceeto-Fagetum lapidosum acidophilum (Stony-acidic Spruce-Beech) according to Czech forest ecosystem classification [53]. The herb layer is composed of the species of spruce-fir-beech stands belonging mostly to the alliance of Piceion abietis Pawłowski et al. 1928, Luzulo-Fagion sylvaticae Lohmeyer et Tüxen in Tüxen 1954 and Fagion sylvaticae Luquet 1926.

3. Sampling and Measurements

On each sample plot, 10 sample trees were randomly chosen and marked for logging. However, trees with remarkable abnormalities, such as broken stem, two terminals, border trees, dead, and wolf trees were excluded from being sampled. All sample trees were measured and logged using the standard logging methods (harvester and motor chain saw). The stem was divided into shorter logs and volume of each log was calculated using Huber’s equation as below.
V = π D 2 L 4
where D is the stem diameter (cm) in the middle and L is the length of a log (m); π = 3.1416 .
The stem volume was calculated without bark using common tables and polynomial equations that were developed in the past [54]. All small woods (below 7 cm diameter) were chipped using forest chippers, which were operated with 100 kW energy, and then woody chips were loaded into a truck. The weight of chips was derived from weight difference of the empty and full truck. From each pile of the chips, 10 samples—three from the left side, three from the right side, and four from the top—were chosen. The sample size of the residues was determined in accordance with the BioNorm II [55]. The dustpan of size 20 cm × 18 cm was used for sample collection after weighing the whole pile, and all samples were immediately put into the plastic bags and tightened with a fastener. The bags were labeled and transported to the laboratory. The residue samples were taken out from the bags, put into the iron bowls, then into the dryer, and allowed for drying. Drying was done continuously at 103 °C until wood moisture reached 0%. However, weight was first checked after 24 h, and then after weight was subsequently noted in every three hours. Kern PBS 4200 digital scales with a precision of 0.01g, were used for measuring the dry weight. The sample was considered completely dried when the change of its weight was not more than 0.02 g. The total volume of small wood (entire pile) was calculated using the wood density of Norway spruce, which was determined as 392 kg m−3 [56]. Measurements of the stand characteristics were obtained during field inventories that was provided by relascope technology Haglof Factor Gauge (Haglöf Sweden AB, Långsele, Sweden) for determine of the basal area, stand density, tree species composition, mean height and DBH of a tree. Field inventories was provided according to standard methods of the Forest Management Institute (FMI, www.uhul.cz). Stand heights and DBH were measured using the hypsometer Vertex Laser (Haglöf Sweden AB) and metal caliper Mantax Blue (Haglöf Sweden AB), respectively. The information of other stand and site characteristics were extracted from forest management plans (update stand age, species composition, site quality class, forest site type). Site quality class was calculated from yield tables using mean stand height, age and forest site type from Czech forest ecosystem classification [53,54]. Tree and stand specific measures, such as canopy, tree coordinates, crown width and height to live/dead crown base were not measured because of the simplicity and the commonly used of derived model. General users and foresters would be able to calculate the dendromass volume only based on the information extracted from forest management plan. To determine the slope and exposure, the EU-DEM digital surface model v1.0 [57] was used with horizontal raster resolution of 25 m. From this database, slope and aspect gradients were determined using the slope and aspect functions in ArcMap (Esri). The aspect was reclassified into eight directions. Data are summarized in Table 1 and relationships between variables that significantly affected timber volume, branch volume, and timber-to-branch volume ratio are presented in Figure 2, Figure 3 and Figure 4, respectively.

4. Data Analysis

We evaluated several variables that could have a potential contribution to the variations of timber and branch volumes. They are elevation, slope, aspect, stand age, mean DBH, mean height, and a few categorical variables, such as site quality class (rich, medium, or poor) and stand stocking class (dense or sparse). Following the principles of modeling categorical variables [58,59,60], we formulated the dummy variables to account for the effects of these variables on the timber and branch volumes. For example, three site quality classes were coded with two dummy variables as below.
Site Quality ClassSQC1SQC2
Rich00
Medium 10
Poor 01
We used only those variables, which had significant contribution to the variations of timber and branch volumes, to develop prediction models for timber and branch volumes. The backward elimination procedure, which excludes the nonsignificant variables for a given criterion (5% level of significance, in our case), was applied to select significantly contributing variables to the models. The Pearson’s correlation coefficients and variance influence factor were used to check the dependency among the predictor variables [61]. We expressed timber volume as a function of selected predictors as below.
T V i = b 1 + b 2 X i + ε i
b 1 = q 1 B V i + q 2 S L P i , X i = D i 2 H i
where TV = timber volume (m3), BV = branch volume (m3), D = mean diameter at breast height of spruce trees per sample plot (cm), H = mean height of spruce trees per sample plot (m), and SLP = slope of locality (degree); b1, b2, q1, and q2 are parameters to be estimated, and ε is the error term, which was assumed to be normally distributed with zero mean and constant variance, i is an index of the location. For this model application, BV could be obtained from other predictor variables used in BV prediction equation (Equation (2)), which will avoid the inventory works required to quantify branch volume.
Developing a model for predicting timber-to-branch volume ratio was not possible as none of the potential predictors significantly contributed to the variations of the ratio. The BV is relatively more difficult to measure compared to the timber volume as former may need more intensive work, which is costlier and time-consuming. Spruce BV could be predicted from the following BV prediction model (Equation (2)).
B V i = b 1 + b 2 X i + ε i
b 1 = q 1 S Q C 1 + q 2 S Q C 2 ,   X i = D i 2 H i
where BV = branch volume (m3) SQCk (k =1,2) is dummy variable, all other abbreviations and symbols are the same as in Equation (1).
The parameters in Equations (1) and (2) were estimated using PROC MODEL in SAS [62]. The estimated models were evaluated using various statistical measures such as significance of parameter estimates, root mean square error (RMSE), and adjusted coefficient of determination (R2adj). Graphs of the residuals and simulated curves overlaid on the measured data were evaluated for the predictive performance of the models. We used 5% level of significance for all analyses. Even though validation of the fitted models may increase its credibility and confidence, we were not able to use this procedure. Our dataset was neither adequate for splitting nor did we have an external independent dataset to validate our models.
The relationships among dendromass, various site variables and stand characteristics were shown by the principle component analysis (PCA) using the Canoco 5 program [63]. The data were log-transformed, centered, and standardized before PCA. The results of PCA were visualized in the form of an ordination diagram.

5. Results

Except the aspect, elevation, and timber-to-branch ratio (TBR), all other variables were significantly correlated with timber volume (Table 2). The timber volume was most strongly correlated to branch volume (r = 0.79, p = 0.0001) followed by mean DBH (r = 0.62, p = 0.0001), mean height (r = 0.58, p = 0.0001), slope of location (r = 0.39, p = 0.0005), stand age (r = 0.28, p = 0.0124), and stocking r = 0.23, p = 0.0424). Similarly, branch volume was mostly correlated with mean DBH (r = 0.52, p = 0.0001) followed by TBR (r = 0.44, p = 0.0001), mean height (r = 0.52, p = 0.0001), stocking (r = 0.33, p = 0.0032), and stand age (r = 0.24, p = 0.0403). Except for mean DBH, elevation was not significantly correlated with other variables including timber and branch volumes, whereas slope was significantly correlated to all variables, except stand age. Both slope and aspect showed very small effect on timber volume (p < 0.09), but aspect did not show any significant effect on the timber volume, branch volumes, and TBR. Except branch volume, elevation, and slope, all other variables did not show significant effects on TBR.
The timber volume prediction model with estimated parameter values is given in Equation (3).
T V i = b 1 + 0.000109 X i + ε i
b 1 = 1.880413 B V i + 0.123368 S L P i ,   X i = D i 2 H i    ( RMSE = 3.6176 ;   R 2 adj = 0.7310 )
Similarly, the branch volume prediction model with estimated parameter values is given in Equation (4).
B V i = b 1 + 0.000092 X i + ε i
b 1 = 0.833985 S C 1 + 1.639027 S C 2 ,   X i = D i 2 H i   ( RMSE   =   1.928 ;   R 2 adj = 0.2517 )
where all symbols and abbreviations in Equations (3) and (4) are the same as in Equations (1) and (2), respectively.
Compared to the branch volume model (Equation (4)), the timber volume model (Equation (3)) described larger parts of the variations. All parameter estimates of Equations (3) and (4) were highly significant (p < 0.0001), and they are biologically plausible and interpretable. No significant heteroscedasticity was observed in the residuals plotted against each of the significant predictors of Equations (3) and (4) and estimated timber and branch volumes (Figure 5 and Figure 6).
The scattered plots of the estimated volumes versus measured volumes independently and closely distributed around the reference line having zero intercept and slope one (Figure 7).
Timber volume for a given D2H and site quality class significantly varied with branch volume and slope of the sample plot site location (Figure 8). A wider spacing of the curves in this figure indicated that the branch volume contributed mostly to the timber volume variations. Timber volume significantly increased with increasing branch volume and degree of slope. However, magnitudes of the effects of these variables for each site quality class largely differed. Similarly, branch volume significantly varied with site quality class and branch volume increased with decreasing site quality class (Figure 9).
Figure 10 shows the results of the PCA in the form of ordination diagrams, where the first ordination axis described 40.7%, the first two 57.1%, and the first four axes together described 77.4% of the variability in our data. The x-axis represents the timber volume, stand age and mean DBH whereas y-axis represents TBR. The timber volume, mean DBH, mean height, and stand age were positively correlated with each other, while these variables were negatively correlated with site quality class. The branch volume was negatively correlated with stand stocking and mean DBH-mean height ratio (HDR). The TBR was positively correlated with elevation and slope, and contributions of slope and stand age were relatively smaller. It seemed that the growth of trees, especially branch volume, was influenced by edaphic factors. Generally, trees on the nutrient-rich sites were characterized by higher branch volume, while TBR was higher on the acid sites.

6. Discussion

Norway spruce is the most economically important tree species in central Europe [64] and it has spread from the foot-hills to the upper forest boundary on the mountainous region of the continent. Even though the climate change effect has caused a decrease of the proportion of spruce forests, we can expect that higher amount of spruce timber could increase in coming years, as management would be changed in favor of silvicultural tending and selection felling. Several studies were carried out for assessment of the growth and timber production of spruce forests in relation to stand and site characteristics in various countries, for example, forests in southwest and eastern Germany [65,66,67], the northern Alps [68,69,70], Bavarian Forest [71,72], northern part of the Babia Góra Mountains [73,74], the Tatras [75,76], the Eastern Carpathians [77,78], the Krkonoše Mountains (Giant Mountains), the Jeseníky Mountains and the Babia Góra Mountains [79], and the Krkonoše Mountains alone [80]. These studies show remarkably decreased growth and timber production with the increased elevation. Our study also shows a trend that tree growth is slowing and total dendromass production is lower with rising elevation, where we expect a decreased mean annual temperature and precipitation. Our results show a significantly increased TBR with increasing elevation (Table 2) even though timber (p = 0.21), and especially branch volumes (p = 0.89), are not significantly affected by elevation. The elevation of the site may influence stem biomass of spruce, but no influence is seen on the branches [81]. As timber volume increases with increasing elevation and branch volume decreases with increasing elevation, this may cause the increased TBR with increasing elevation.
Our results show that both timber and branch volumes are affected significantly by individual trees and stand characteristics. The effects of these characteristics may be different for different ecotones. The highest decrease of the radial and height growth occurs in the ecotone of the upper forest boundary [79,80], where crown size relative to tree height is considerably higher [82] and height of the green crown base is lower [83]. In the mature spruce stands, stem taper would considerably increase with increasing elevation, especially within the ecotone of the upper forest boundary. This has been proved on the dendrometric data acquired from the primal forest stands of the Krkonoše Mountains in the Czech Republic, where a negative correlation was found ranging from −0.83 to −0.97 [80]. However, our study shows that timber volume increases and branch volume decreases with increasing elevation (Table 2). Global warming may, however, decrease spruce production even in the lowlands because of more intense drought compared to the mountains, where we expect increased growth and higher production due to the higher temperature and enough precipitation [3,4,84]. The results from these studies are also connected with elevation range in our study area, where it includes only optimal spruce production with declining tendencies to the left site at the lower part of the distribution range [85], but sites closer to the timber line were not included in the studies. The negative or positive influence on the production of forest stands may differ on the local and regional scale, especially regarding to edaphic, humidity, and climatic conditions of the given habitats [65,86]. Therefore, reconstruction of forest production dynamics in relation to the global climate change can be as such estimated from the former growth trends [87,88,89].
In our case, timber volume is highly correlated with the volume of branches, mean DBH, and stand age. This result corroborates with that of other studies [26,27]. The mature trees have the largest tree dendromass and stem mass, while changes of the mass of needles and branches usually do not differ between mature and middle-aged stands. The largest needle and branch masses relative to stem volume was found in younger stands. Stem weight inside the crown was linearly correlated with a mean height of the crown, tree stem basal area, and wood density. As in our study, Konôpka et al. [43] show that the stem volume of spruce relative to total dendromass amounts including needle mass and root mass increases with increasing size of the trees. However, we did not consider the needles and roots in our analysis.
Čihák and Vejpustková [90] reported that the total above ground dendromass or dendromass of the individual parts of Norway spruce in the Czech Republic highly depends on the DBH. The percentage of stem volume rapidly increases with age up to 40 years, and then fluctuates around 80%. In younger stands, the proportion of stem dendromass may have higher variability, which gradually decreases with stand age and stabilizes at a constant value. A portion of the crown dendromass decreases with age and it oscillates after 40 years ~17%. The percentage of needle dendromass exhibits a decreasing tendency, and in the mature stage, it is ~5%. Ilomäki et al. [91] state that the crown shape and branch volume are relatively conservative for the trees of different ages, cenotypic hierarchy status, and soil quality, and this could explain remarkable differences in the dendromass of trees of different stage, age, cenotypic hierarchy status, and soil quality. The trees of higher age, leveled, or emergent and of better quality have larger volumes of the dendromass. In our study, soil quality appeared as an important factor. The timber volume on the rich-nutrient sites was higher than on the acidic sites. In addition to site quality class, timber and branch volumes are highly correlated with the individual tree characteristics, such as DBH, height, crown depth and width, and stem taper [16,27]. However, due to the unavailability of data, we were not able to evaluate the effects of individual tree variables on the timber and branch volumes in our study.
Given the data limitations (fewer sample plots, lack of crown dimension measurements, and other individual tree information), we developed the timber volume model (Equation (3)) and the branch volume model (Equation (4)), whereby former model exhibits the remarkable prediction performance and latter model shows relatively poorer performance. The timber volume prediction can be made using the input information of the slope of the terrains of spruce stands, branch volume (information of which can be derived from Equation (4)), mean DBH, and mean height of the trees per sample plot. Similarly, the branch volume prediction can be made from measurements of the dendrometric variables (mean DBH and mean height) and site quality classes. The timber volume increases with increasing branch volumes and slope of the terrain (Figure 8), because on the sloping stands, growing space available for trees is larger than on the flatter land and total tree volume may be higher. On steeper slopes, trees reach larger crown projections and there can be increased light for crowns that positively affect the growth of central bole of the spruce [81,92]. In contrary to the broadleaved tree species, a higher proportion of biomass in the formation of horizontal branches is formed due to high crown plasticity [93,94]. Generally, the crown shape is related to the productivity of forest stands [60,95,96]. The branch volume also increases with decreasing site quality class (Figure 9) because of the nutrient deficit in the low quality site classes, which may result in more intensive growth of branches. For the application of the branch volume model, dummy variables accounting for effects of the site quality classes should be formed in the same way as depicted in the data analysis section. Compared to the timber volume model, the branch volume model can predict significantly poorly, as branch volume would be more corrected to tree-level variables, for example, crown dimensions (crown width, crown ratio, and crown depth) that were not available in our data. As has been mentioned in the previous paragraphs, the amounts of timber and branch volumes are significantly affected differently by site and stand characteristics. This is the reason that the terrain slope, which significantly contributes to the timber volume variations, appears nonsignificant in the branch volume model (Equation (4)). Similarly, the site quality class, which significantly affects the branch volume variations, does not significantly affect the timber volume variations. Most importantly, for application of the timber volume (Equation (3)), input information of branch volume can be obtained from the prediction equation of the branch volume (Equation (2)), which will avoid the inventory works necessary for quantifying branch volume in the field and laboratory.

7. Conclusions

The main conclusions are summarized as follows.
  • Models for prediction of timber and branch volumes of Norway spruce were developed.
  • Model described larger proportion of timber volume than branch volume.
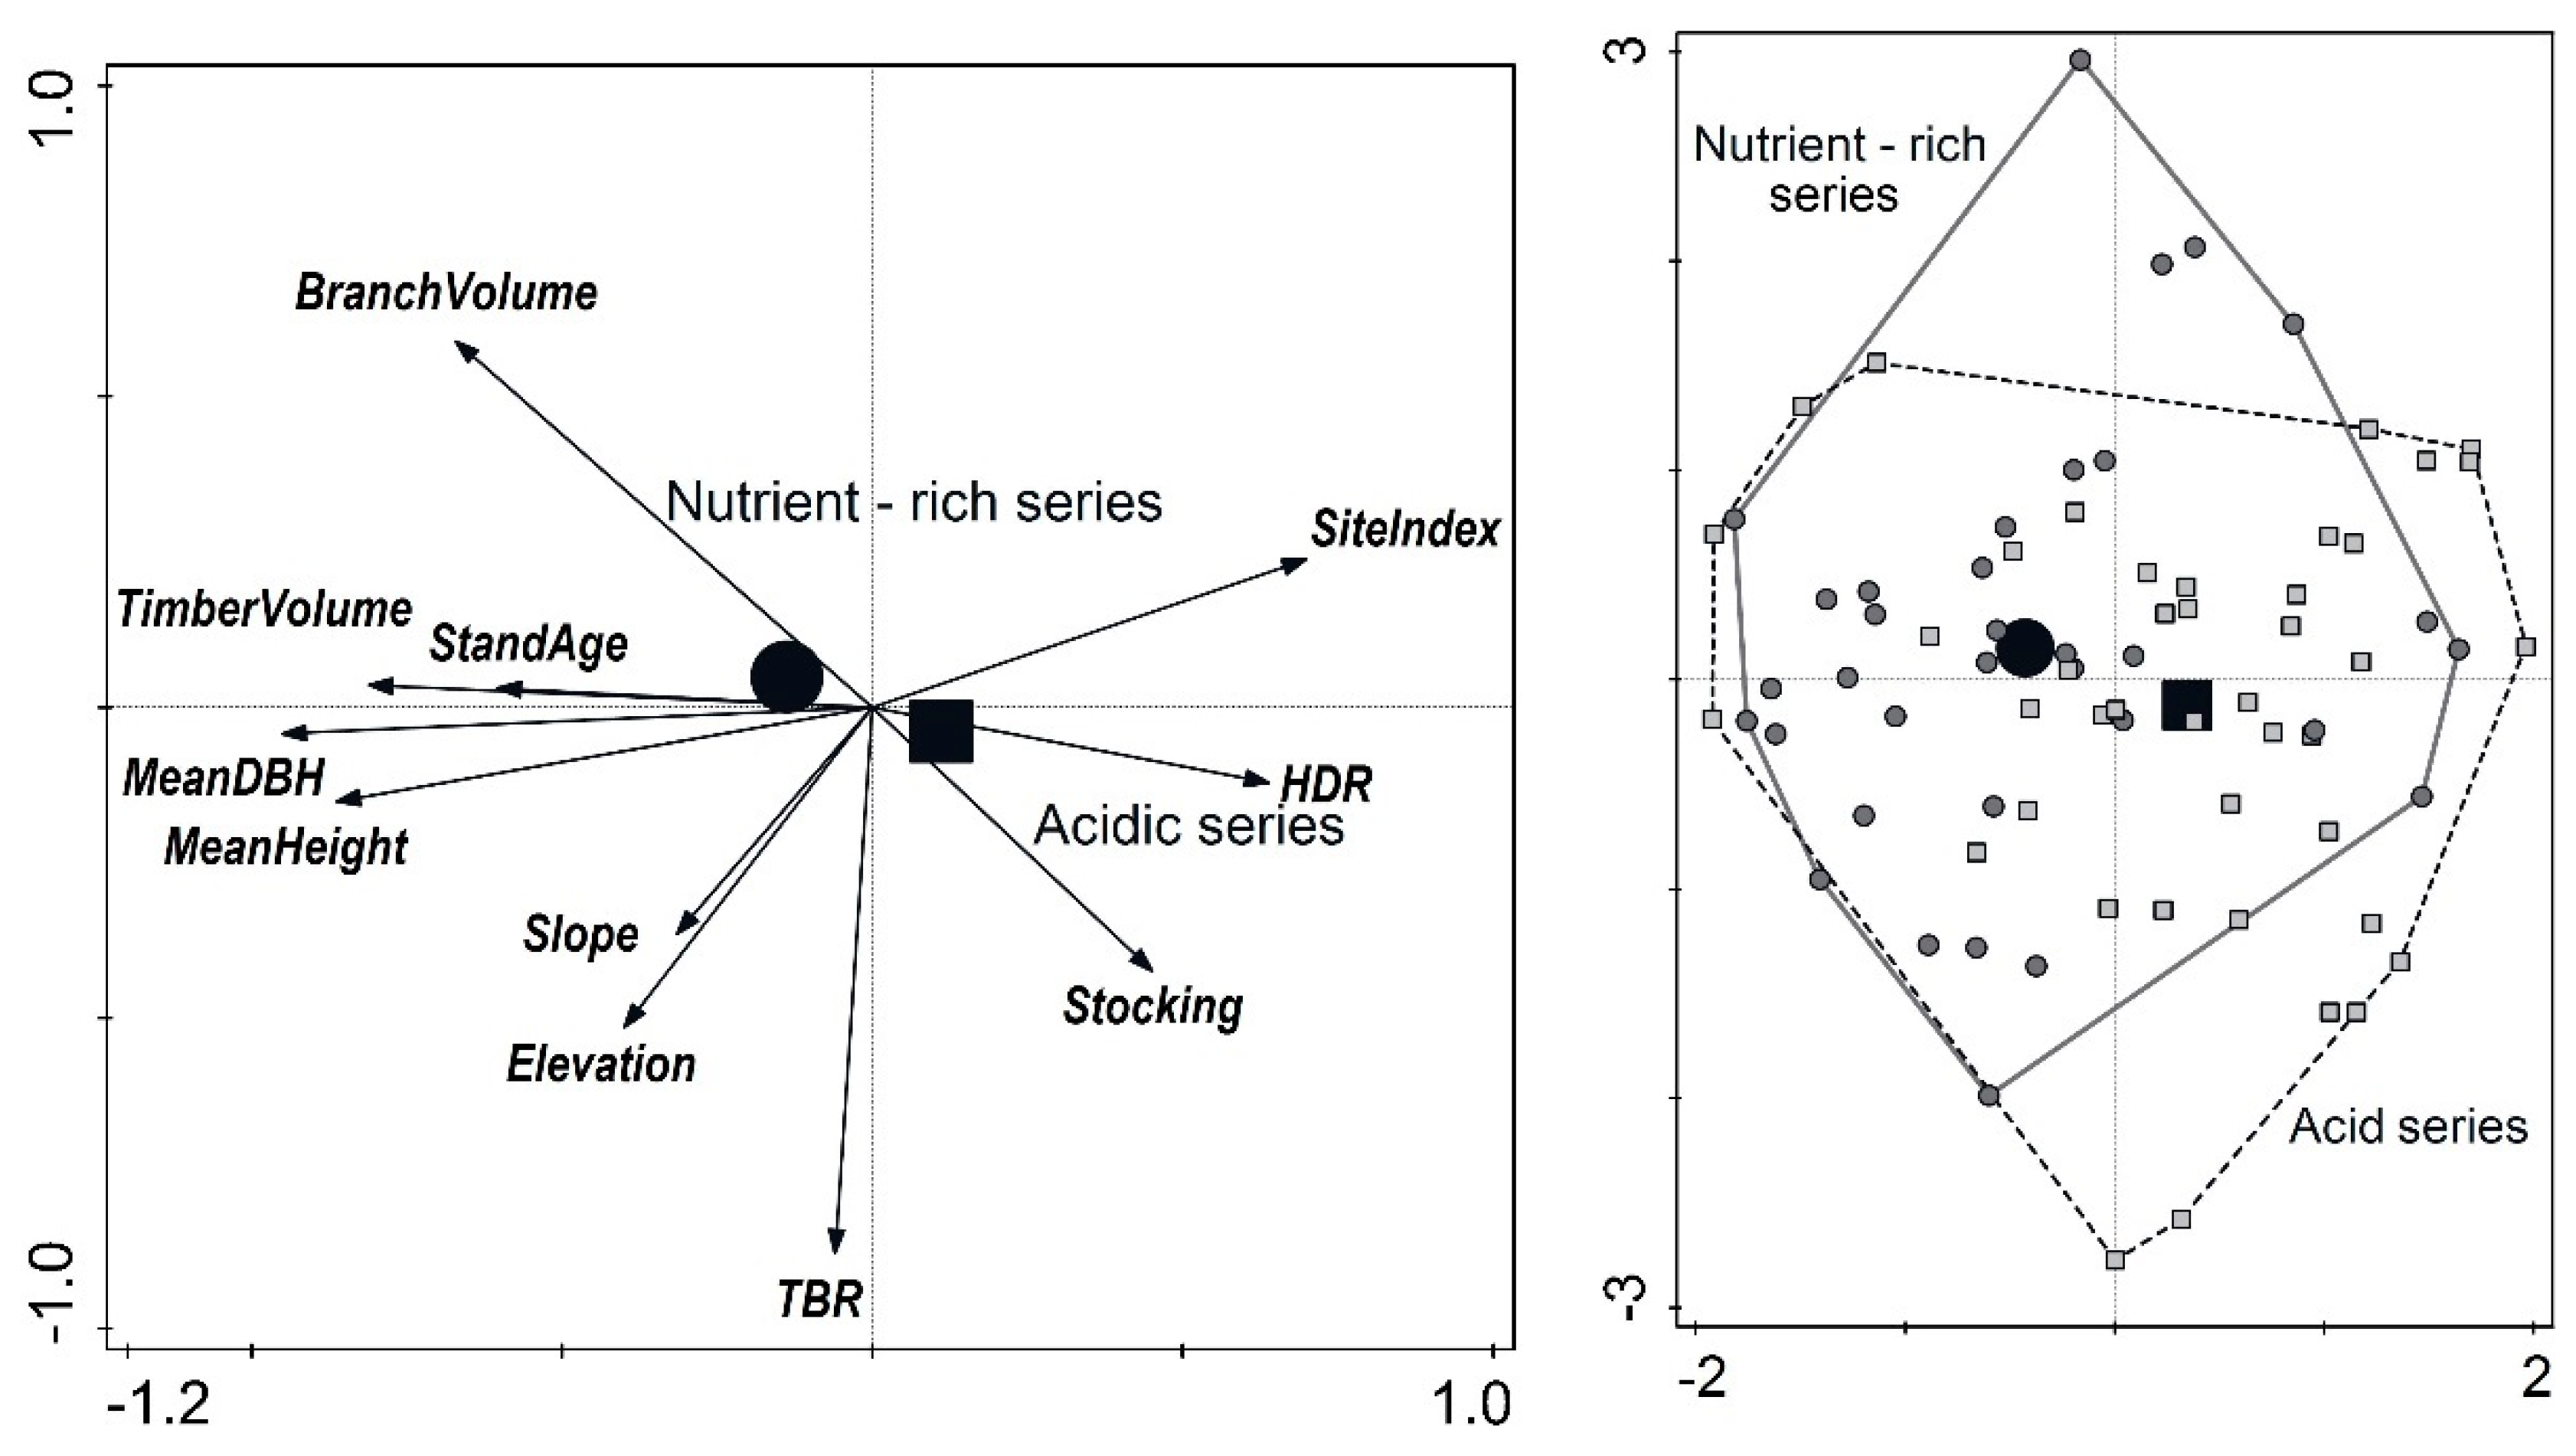
  • Factors affecting the timber-to-branch volume ratio (TBR) were analyzed and TBR was found significantly correlated with elevation and branch biomass.
  • Timber volume increased with increasing slope and TBR increased with increasing elevation.
  • Branch volume increased with decreasing site quality class and stand stocking.
The presented models can be an important basis for further investigations on the relationships among site and stand characteristics, stem volume, branch volume, and dendromass of Norway spruce. The proposed volume models can be used to predict the timber and branch biomass for Norway spruce in the same stand conditions, which were used as the basis of this study. The correlation statistics (Table 2) and models presented in the article (Equations (3) and (4)) can be useful in decision making for Norway spruce forest management.

Author Contributions

Conceptualization, V.Š. and R.P.S.; Data Curation, O.N.; Formal Analysis, R.P.S.; Funding Acquisition, V.Š.; Investigation, V.Š., Z.V., and O.N.; Methodology, V.Š., R.P.S., and Z.V.; Resources, V.Š., Z.V., S.V., and O.N.; Software, R.P.S.; Supervision, V.Š.; Validation, V.Š.; Writing—Original Draft, V.Š., Z.V., R.P.S., S.V., and O.N.; Writing—Review & Editing, V.Š., R.P.S., S.V., and O.N.

Funding

This study was supported by the Ministry of Agriculture of the Czech Republic (Project No. QJ1520042) and Faculty of Forestry and Wood Sciences, Czech University of Life Sciences Prague (Excellent output 2018).

Conflicts of Interest

The authors declare no conflicts of interest.

References

  1. Dymond, C.C.; Titus, B.D.; Stinson, G.; Kurz, W.A. Future quantities and spatial distribution of harvesting residue and dead wood from natural disturbances in Canada. For. Ecol. Manag. 2010, 260, 181–192. [Google Scholar] [CrossRef]
  2. Zhang, F.; Johnson, D.M.; Sutherland, J.W. A GIS-based method for identifying the optimal location for a facility to convert forest biomass to biofuel. Biomass Bioenergy 2011. [Google Scholar] [CrossRef]
  3. Hanewinkel, M.; Cullmann, D.A.; Schelhaas, M.-J.; Nabuurs, G.-J.; Zimmermann, N.E. Climate change may cause severe loss in the economic value of European forest land. Nat. Clim. Chang. 2013, 3, 203–207. [Google Scholar] [CrossRef]
  4. Babst, F.; Poulter, B.; Trouet, V.; Tan, K.; Neuwirth, B.; Wilson, R.; Carrer, M.; Grabner, M.; Tegel, W.; Levanic, T.; et al. Site- and species-specific responses of forest growth to climate across the European continent. Glob. Ecol. Biogeogr. 2013, 22, 706–717. [Google Scholar] [CrossRef]
  5. Spalding-Fecher, R.; Winkler, H.; Mwakasonda, S. Energy and the World Summit on Sustainable Development: What next? Energy Policy 2005, 33, 99–112. [Google Scholar] [CrossRef]
  6. Al-Mansour, F.; Zuwala, J. An evaluation of biomass co-firing in Europe. Biomass Bioenergy 2010, 34, 620–629. [Google Scholar] [CrossRef]
  7. Chudikova, P.; Tausova, M.; Erdelyiova, K.; Taus, P. Potential of dendromass in the Slovak Republic and its actual exploitation in thermic economy. Acta Montan. Slovaca 2010, 15, 139–145. [Google Scholar]
  8. Schulte, A. Dendromass: Raw material of the future-trends and interdependencies. Forstarchiv 2007, 78, 59–64. [Google Scholar]
  9. Welfle, A.; Gilbert, P.; Thornley, P. Increasing biomass resource availability through supply chain analysis. Biomass Bioenergy 2014, 70, 249–266. [Google Scholar] [CrossRef]
  10. Murach, D.; Kindermann, C.; Hirschl, B.; Aretz, A.; Schneider, B.U.; Grünewald, H.; Schultze, B.; Quinkenstein, A.; Bilke, G.; Muchin, A.; et al. Dendromass, raw material of the future—background and first results of the research project DENDROM. Forstarchiv 2007, 78, 88–94. [Google Scholar]
  11. Bond-Lamberty, B.; Wang, C.; Gower, S.T. Net primary production and net ecosystem production of a boreal black spruce wildfire chronosequence. Glob. Chang. Biol. 2004, 10, 473–487. [Google Scholar] [CrossRef]
  12. Pregitzer, K.S.; Euskirchen, E.S. Carbon cycling and storage in world forests: Biome patterns related to forest age. Glob. Chang. Biol. 2004, 10, 2052–2077. [Google Scholar] [CrossRef]
  13. Konôpka, B.; Pajtík, J.; Marušák, R. Canopy closure altered biomass allocation in young spruce stand. J. For. Sci. 2016, 61, 62–71. [Google Scholar]
  14. Johansson, T. Biomass Production of Norway Spruce (Picea abies (L.) Karst.) Growing on Abandoned Farmland. Silva Fenn. 1999, 33. [Google Scholar] [CrossRef]
  15. West, P.W. Tree and Forest Measurement; Springer: Berlin/Heidelberg, Germany, 2009; ISBN 978-3-540-95965-6. [Google Scholar]
  16. Repola, J. Biomass Equations for Scots Pine and Norway Spruce in Finland. Silva Fenn. 2009, 43. [Google Scholar] [CrossRef]
  17. Skovsgaard, J.P.; Bald, C.; Nord-Larsen, T. Functions for biomass and basic density of stem, crown and root system of Norway spruce (Picea abies (L.) Karst.) in Denmark. Scand. J. For. Res. 2011, 26, 3–20. [Google Scholar] [CrossRef]
  18. Williams, H.; Messier, C.; Kneeshaw, D.D. Effects of light availability and sapling size on the growth and crown morphology of understory Douglas-fir and lodgepole pine. Can. J. For. Res. 1999, 29, 222–231. [Google Scholar] [CrossRef]
  19. King, J.S.; Giardina, C.P.; Pregitzer, K.S.; Friend, A.L. Biomass partitioning in red pine (Pinus resinosa) along a chronosequence in the Upper Peninsula of Michigan. Can. J. For. Res. 2007, 37, 93–102. [Google Scholar] [CrossRef]
  20. Schall, P.; Lödige, C.; Beck, M.; Ammer, C. Biomass allocation to roots and shoots is more sensitive to shade and drought in European beech than in Norway spruce seedlings. For. Ecol. Manag. 2012, 266, 246–253. [Google Scholar] [CrossRef]
  21. Dowell, R.C.; Gibbins, D.; Rhoads, J.L.; Pallardy, S. Biomass production physiology and soil carbon dynamics in short-rotation-grown Populus deltoides and P. deltoides\times P. nigra hybrids. For. Ecol. Manag. 2009, 257, 134–142. [Google Scholar] [CrossRef]
  22. Luo, Y.; Wang, X.; Zhang, X.; Booth, T.; Lu, F. Root:shoot ratios across China’s forests: Forest type and climatic effects. For. Ecol. Manag. 2012, 269, 19–25. [Google Scholar] [CrossRef]
  23. Gower, S.T.; Reich, P.B.; Son, Y. Canopy dynamics and aboveground production of five tree species with different leaf longevities. Tree Physiol. 1993, 12, 327–345. [Google Scholar] [CrossRef] [PubMed]
  24. Poorter, H.; Nagel, O. The role of biomass allocation in the growth response of plants to different levels of light, CO2, nutrients and water: A quantitative review. Funct. Plant Biol. 2000, 27, 1191. [Google Scholar] [CrossRef]
  25. Kantola, A.; Mäkelä, A. Development of biomass proportions in Norway spruce (Picea abies [L.] Karst.). Trees Struct. Funct. 2006, 20, 111–121. [Google Scholar] [CrossRef]
  26. Kantola, A.; Mäkelä, A. Crown development in Norway spruce [ Picea abies (L.) Karst.]. Trees 2004, 18. [Google Scholar] [CrossRef]
  27. Laasasenaho, J. Taper curve and volume functions for pine, spruce and birch [Pinus sylvestris, Picea abies, Betula pendula, Betula pubescens]. Commun. Instituti For. Fenn. 1982. [Google Scholar]
  28. Hakkila, P. Wood density survey and dry weight tables for pine, spruce and birch stems in Finland. Metsäntutkimuslaitoksen Julk. 1979, 96, 59. [Google Scholar]
  29. Helmisaari, H.-S.; Makkonen, K.; Kellomäki, S.; Valtonen, E.; Mälkönen, E. Below- and above-ground biomass, production and nitrogen use in Scots pine stands in eastern Finland. For. Ecol. Manag. 2002, 165, 317–326. [Google Scholar] [CrossRef]
  30. Yuste, J.C.; Konopka, B.; Janssens, I.A.; Coenen, K.; Xiao, C.W.; Ceulemans, R. Contrasting net primary productivity and carbon distribution between neighboring stands of Quercus robur and Pinus sylvestris. Tree Physiol. 2005, 25, 701–712. [Google Scholar] [CrossRef]
  31. Wirth, C.; Schumacher, J.; Schulze, E.-D. Generic biomass functions for Norway spruce in Central Europe--a meta-analysis approach toward prediction and uncertainty estimation. Tree Physiol. 2004, 24, 121–139. [Google Scholar] [CrossRef]
  32. Avery, T.E.; Burkhart, H.E. Forest Measurements, Fifth ed.; Waveland Press: Long Grove, IL, USA, 2015; ISBN 9781478629740. [Google Scholar]
  33. Benson, R.E.; Johnston, C.M. Logging Residues under Different Stand and Harvesting Conditions, Rocky Mountains; Intermountain Forest and Range Experiment Station, Forest Service, U.S. Department of Agriculture: Ogden, UT, USA, 1976.
  34. Sačkov, I.; Natov, P.; Messingerová, V. On-line Calculator of Volume and Price extraction of above the Ground Dendromass from Forest Stand. Lesn. Časopis 2008, 54, 75–85. [Google Scholar]
  35. Benson, R.E.; Schlieter, J.A. Logging Residues in Principal Forest Types of the Northern Rocky Mountains; Intermountain Forest and Range Experihent Station, U.S. Department of Agriculture Forest Service: Ogden, UT, USA, 1980.
  36. Schmidt-Vogt, H. The Spruce [Picea]. In Geographical Distribution, Morphology, Ecology, and Forest Communities; Paul Parey: Hamburg, Germany, 1977. [Google Scholar]
  37. Litton, C.M.; Raich, J.W.; Ryan, M.G. Carbon allocation in forest ecosystems. Glob. Chang. Biol. 2007, 13, 2089–2109. [Google Scholar] [CrossRef]
  38. Brunner, I.; Bakker, M.R.; Björk, R.G.; Hirano, Y.; Lukac, M.; Aranda, X.; Børja, I.; Eldhuset, T.D.; Helmisaari, H.S.; Jourdan, C.; et al. Fine-root turnover rates of European forests revisited: An analysis of data from sequential coring and ingrowth cores. Plant Soil 2013, 362, 357–372. [Google Scholar] [CrossRef]
  39. Cienciala, E.; Černý, M.; Tatarinov, F.; Apltauer, J.; Exnerová, Z. Biomass functions applicable to Scots pine. Trees 2006, 20, 483–495. [Google Scholar] [CrossRef]
  40. Seidl, R.; Rammer, W.; Bellos, P.; Hochbichler, E.; Lexer, M.J. Testing generalized allometries in allocation modeling within an individual-based simulation framework. Trees 2010, 24, 139–150. [Google Scholar] [CrossRef]
  41. Pajtík, J.; Konôpka, B.; Lukac, M. Biomass functions and expansion factors in young Norway spruce (Picea abies [L.] Karst) trees. For. Ecol. Manag. 2008, 256, 1096–1103. [Google Scholar] [CrossRef]
  42. Dutca, I.; Abrudan, I.; Stancioiu, P.; Viorel, B. Biomass conversion and expansion factors for young Norway spruce (Picea abies (L.) Karst.) trees planted on non-forest lands in Eastern Carpathians. Not. Bot. Horti Agrobot. Cluj-Napoca 2010, 38. [Google Scholar]
  43. Konôpka, B.; Pajtík, J.; Moravčík, M.; Lukac, M. Biomass partitioning and growth efficiency in four naturally regenerated forest tree species. Basic Appl. Ecol. 2010, 11, 234–243. [Google Scholar] [CrossRef]
  44. Marklund, L.G. Biomass Functions for Norway Spruce (Picea abies (L.) Karst.) in Sweden [Biomass Determination, Dry Weight]; Department of Forest Survey, Swedish University of Agricultural Sciences: Umeå, Sweden, 1987. [Google Scholar]
  45. Marklund, L.G. Biomass Functions for Pine, Norway Spruce, and Birch in Sweden; Department for Forest Survey Report 45; Swedish University of Agricultural Sciences: Umeå, Sweden, 1988. [Google Scholar]
  46. Petráš, R.; Pajtík, J. Sústava česko-slovenských objemových tabuliek drevín [Volume equations for tree species in Czechoslovakia]. Lesn. časopis 1991, 37, 49–56. [Google Scholar]
  47. Ter-Mikaelian, M.T.; Korzukhin, M.D. Biomass equations for sixty-five North American tree species. For. Ecol. Manag. 1997, 97, 1–24. [Google Scholar] [CrossRef]
  48. Lehtonen, A.; Cienciala, E.; Tatarinov, F.; Mäkipää, R. Uncertainty estimation of biomass expansion factors for Norway spruce in the Czech Republic Uncertainty estimation of biomass expansion factors for Norway spruce in the Uncertainty estimation of biomass expansion factors for Norway spruce in the Czech Republic. Ann. For. Sci 2007, 64, 133–140. [Google Scholar]
  49. Saidur, R.; Abdelaziz, E.A.; Demirbas, A.; Hossain, M.S.; Mekhilef, S. A review on biomass as a fuel for boilers. Renew. Sustain. Energy Rev. 2011, 15, 2262–2289. [Google Scholar] [CrossRef]
  50. Štorek, V.; Štícha, V.; Skoupý, A.; Kondělka, P.; Mikulenčák, J. Stanovování množství zbytkové dendromasy na konkrétní pracoviště—těžební prvek v porostní skupině: Certifikovaná metodika; Česká zemědělská univerzita v Praze (Determining the amount of residual dendromass in a specific logging place in the part of a stand); Foresta SF, a.s.: Vsetín, Czech Republic, 2017; ISBN 8074581047. [Google Scholar]
  51. Tolasz, R.; Míková, T.; Valeriánová, A.; Voženílek, V. Climate atlas of Czechia. Czech Hydrometeorological Institute; Czech Hydrometeorological Institute Prague: Olomouc, Czech Republic, 2007. [Google Scholar]
  52. Kozák, J.; Němeček, J. Atlas půd České Republiky; MZe ČR ve spolupráci s ČZU: Prague, Czech Republic, 2009; ISBN 9788021318823. [Google Scholar]
  53. Viewegh, K.; Kusbach, J.V.A.; Mikeska, M. Czech forest ecosystem classification. J. For. Sci. 2003, 49, 85–93. [Google Scholar] [CrossRef]
  54. Černý, M.; Pařez, J. Tabulky a polynomy pro výpočet objemu kulatiny bez kůry; Ministerstvo zemědělství ČR: Praha, Czech Republic, 1995.
  55. BioNorm II Prenormative Work on Sampling and Testing of Solid Biofuels for the Development of Quality Management; Publications Office of the European Union: Luxembourg, 2004.
  56. Požgaj, A.; Chovanec, D.; Kurjatko, S.; Babiak, M. Štruktúra a vlastnosti dreva; Príroda: Bratislava, Slovakia, 1993; ISBN 80-07-00600-1. [Google Scholar]
  57. Agency, E.E. EU-DEM v1.1. Available online: https://land.copernicus.eu/imagery-in-situ/eu-dem/eu-dem-v1.1?tab=mapview (accessed on 5 March 2018).
  58. Bates, D.; Watts, D. Nonlinear Regression. Analysis and its Applications; Wiley: New York, NY, USA, 1988. [Google Scholar]
  59. Sharma, R.P.; Brunner, A.; Eid, T. Site index prediction from site and climate variables for Norway spruce and Scots pine in Norway. Scand. J. For. Res. 2012, 27, 619–636. [Google Scholar] [CrossRef]
  60. Sharma, R.; Vacek, Z.; Vacek, S. Generalized Nonlinear Mixed-Effects Individual Tree Crown Ratio Models for Norway Spruce and European Beech. Forests 2018, 9, 555. [Google Scholar] [CrossRef]
  61. Montgomery, D.; Peck, E.A.; Vining, G. Introduction to Linear Regression Analysis; Wiley: New York, NY, USA, 2001. [Google Scholar]
  62. SAS Institute Inc. SAS/ETS1 9.1.3 User’s Guide; SAS Institute Inc.: Cary, NC, USA, 2012. [Google Scholar]
  63. Šmilauer, P.; Lepš, J. Multivariate Analysis of Ecological Data Using Canoco 5; Cambridge University Press: Cambridge, UK, 2014; ISBN 9781107694408. [Google Scholar]
  64. Spiecker, H. Growth Trends in European Forests Studies from 12 Countries; Springer Science & Business Media: Berlin, Germany, 1996; ISBN 978-3-540-61460-9. [Google Scholar]
  65. Mäkinen, H.; Nöjd, P.; Kahle, H.-P.; Neumann, U.; Tveite, B.; Mielikäinen, K.; Röhle, H.; Spiecker, H. Radial growth variation of Norway spruce (Picea abies (L.) Karst.) across latitudinal and altitudinal gradients in central and northern Europe. For. Ecol. Manag. 2002, 171, 243–259. [Google Scholar] [CrossRef]
  66. Mäkinen, H.; Nöjd, P.; Kahle, H.-P.; Neumann, U.; Tveite, B.; Mielikäinen, K.; Röhle, H.; Spiecker, H. Large-scale climatic variability and radial increment variation of Picea abies (L.) Karst. in central and northern Europe. Trees 2003, 17, 173–184. [Google Scholar]
  67. Dittmar, C.; Eißing, T.; Rothe, A. Elevation-specific tree-ring chronologies of Norway spruce and Silver fir in Southern Germany. Dendrochronologia 2012, 30, 73–83. [Google Scholar] [CrossRef]
  68. Leal, S.; Melvin, T.M.; Grabner, M.; Wimmer, R.; Briffa, K.R. Tree-ring growth variability in the Austrian Alps: The influence of site, altitude, tree species and climate. Boreas 2007, 36, 426–440. [Google Scholar] [CrossRef]
  69. Hartl, C.; Zang, C.; Dittmar, C.; Esper, J.; Göttlein, A.; Rothe, A. Vulnerability of Norway spruce to climate change in mountain forests of the European Alps. Clim. Res. 2014, 60, 119–132. [Google Scholar] [CrossRef]
  70. Hartl-Meier, C.; Dittmar, C.; Zang, C.; Rothe, A. Mountain forest growth response to climate change in the Northern Limestone Alps. Trees 2014, 28, 819–829. [Google Scholar] [CrossRef]
  71. Wilson, R.J.S.; Wilson, R.J.S.; Hopfmueller, M. Dendrochronological investigations of Norway spruce along an elevational transect in the Bavarian Forest, Germany. Dendrochronologia 2001, 1, 67–79. [Google Scholar]
  72. Čejková, A.; Kolář, T. Extreme radial growth reaction of norway spruce along an altitudinal gradient in the šumava mountains. Geochronometria 2009, 33, 41–47. [Google Scholar] [CrossRef]
  73. Bednarz, Z.; Jaroszeewicz, B.; Ptak, J.; Szwagrzyk, J. Dendrochronology of Norway Norway spruce (Picea abies (L. Karst) in the Babia Gora National Park, Poland. Dendrochronologia 1999, 16, 45–55. [Google Scholar]
  74. Kaczka, R.J.; Czajka, B.; Łajczak, A. The tree-ring growth responses to climate in the timberline ecotone of Babia Góra Mountain. Geogr. Pol. 2015, 88, 163–176. [Google Scholar] [CrossRef]
  75. Savva, Y.; Oleksyn, J.; Reich, P.; Tjoelker, M.; Vaganov, E.A.; Modrzynski, J. Interannual growth response of Norway spruce to climate along an altitudinal gradient in the Tatra Mountains, Poland. Trees 2006, 20, 735–746. [Google Scholar] [CrossRef]
  76. Büntgen, U.; Frank, D.C.; Kaczka, R.J.; Verstege, A.; Zwijacz-Kozica, T.; Esper, J. Growth responses to climate in a multi-species tree-ring network in the Western Carpathian Tatra Mountains, Poland and Slovakia. Tree Physiol. 2007, 27, 689–702. [Google Scholar] [CrossRef]
  77. Kaczka, R.J.; Büntgen, U. Spatial autocorrelation and growth/climate response of a high elevation norway spruce network along the Carpathian arc. TRACE 2006, 6, 103–112. [Google Scholar]
  78. Sidor, C.G.; Popa, I.; Vlad, R.; Cherubini, P. Different tree-ring responses of Norway spruce to air temperature across an altitudinal gradient in the Eastern Carpathians (Romania). Trees 2015, 29, 985–997. [Google Scholar] [CrossRef]
  79. Ponocná, T.; Spyt, B.; Kaczka, R.; Büntgen, U.; Treml, V. Growth trends and climate responses of Norway spruce along elevational gradients in East-Central Europe. Trees 2016, 30, 1633–1646. [Google Scholar] [CrossRef]
  80. Vacek, S.; Chroust, L.; Souček, J. Wood production analysis of autochthonous Norway norway spruce forest stand. Lesnictví 1994, 10, 457–469. [Google Scholar]
  81. Kuuluvainen, T. Relationships between crown projected area and components of above-ground biomass in Norway spruce trees in even-aged stands: Empirical results and their interpretation. For. Ecol. Manag. 1991, 40, 243–260. [Google Scholar] [CrossRef]
  82. Vacek, S.; Hejcmanová, P.; Hejcman, M. Vegetative reproduction of Picea abies by artificial layering at the ecotone of the alpine timberline in the Giant (Krkonoše) Mountains, Czech Republic. For. Ecol. Manag. 2012, 263, 199–207. [Google Scholar] [CrossRef]
  83. Vacek, S. Morfologická proměnlivost autochtonních smrkových populací v Krkonoších. (Morphological variability of autochthonous Norway norway spruce populations in the Krkonoše Mts). Lesnictví 1983, 29, 265–284. [Google Scholar]
  84. Schuster, R.; Oberhuber, W. Drought sensitivity of three co-occurring conifers within a dry inner Alpine environment. Trees (Berl. West) 2013, 27, 61–69. [Google Scholar] [CrossRef]
  85. Hlásny, T.; Barcza, Z.; Fabrika, M.; Balázs, B.; Churkina, G.; Pajtík, J.; Turčáni, M. Climate change impacts on growth and carbon balance of forests in Central Europe. Clim. Res. 2011, 47, 219–236. [Google Scholar] [CrossRef]
  86. King, G.M.; Gugerli, F.; Fonti, P.; Frank, D.C. Tree growth response along an elevational gradient: Climate or genetics? Oecologia 2013, 173, 1587–1600. [Google Scholar] [CrossRef]
  87. Biondi, F.; Qeadan, F. A Theory-Driven Approach to Tree-Ring Standardization: Defining the Biological Trend from Expected Basal Area Increment. Tree-Ring Res. 2008, 64, 81–96. [Google Scholar] [CrossRef]
  88. Büntgen, U.; Tegel, W.; Heussner, K.; Hofmann, J.; Kontic, R.; Kyncl, T.; Cook, E. Effects of sample size in dendroclimatology. Clim. Res. 2012, 53, 263–269. [Google Scholar] [CrossRef]
  89. Babst, F.; Bouriaud, O.; Alexander, R.; Trouet, V.; Frank, D. Toward consistent measurements of carbon accumulation: A multi-site assessment of biomass and basal area increment across Europe. Dendrochronologia 2014, 32, 153–161. [Google Scholar] [CrossRef]
  90. Čihák, T.; Vejpustková, M. Parametrování alometrických rovnic pro kvantifikaci nadzemní biomasy smrku smrkového (Picea abies (L.) H. Karst.) V České republice. J. For. Sci. 2018, 64, 108–117. [Google Scholar]
  91. Ilomäki, S.; Nikinmaa, E.; Mäkelä, A. Crown rise due to competition drives biomass allocation in silver birch. Can. J. For. Res. 2003, 33, 2395–2404. [Google Scholar] [CrossRef]
  92. Pretzsch, H.; Schütze, G. Crown allometry and growing space efficiency of Norway spruce (Picea abies [L.] Karst.) and European beech (Fagus sylvatica L.) in pure and mixed stands. Plant Biol. 2005, 7, 628–639. [Google Scholar] [CrossRef] [PubMed]
  93. Schröter, M.; Härdtle, W.; von Oheimb, G. Crown plasticity and neighborhood interactions of European beech (Fagus sylvatica L.) in an old-growth forest. Eur. J. For. Res. 2012, 131, 787–798. [Google Scholar] [CrossRef]
  94. Bulušek, D.; Vacek, Z.; Vacek, S.; Král, J.; Bílek, L.; Králíček, I. Spatial pattern of relict beech (Fagus sylvatica L.) forests in the Sudetes of the Czech Republic and Poland. J. For. Sci. 2016, 62, 293–305. [Google Scholar] [CrossRef]
  95. Assman, E. The Principles of Forest Yield Study; Pergamon Press: Oxford, UK, 1970. [Google Scholar]
  96. Sharma, R.P.; Vacek, Z.; Vacek, S. Individual tree crown width models for Norway spruce and European beech in Czech Republic. For. Ecol. Manag. 2016, 366, 208–220. [Google Scholar] [CrossRef]
Figure 1. Location of 76 research plots with Norway spruce forest stands (black dots); gray lines showing separating Natural Forest Areas and gray areas forest cover with dominating Norway spruce in the Czech Republic. The dominating spruce layer was created by classifying ESA Sentinel-2 satellite images by pixel sorting based on spectral spruce response during phenological vegetation phases using data collected during the National Forest inventory. The author of the tree species determination method was Dr. Filip Hájek, the author of the spruce layer was Ing. Markéta Kantorová, data source ÚHÚL Brandýs nad Labem, and software ArsGis (Esri).
Forests 10 00144 g001
Figure 2. Scattered plots of timber volume versus other variables.
Forests 10 00144 g002
Figure 3. Scattered plots of branch volume versus other variables.
Forests 10 00144 g003
Figure 4. Scattered plots of branch-to-timber volume ratio versus other variables.
Forests 10 00144 g004
Figure 5. Residuals against predictor variables and estimated timber volume with a timber prediction model (Equation (3)).
Forests 10 00144 g005
Figure 6. Residuals against predictor variables and estimated branch volume with a branch volume model (Equation (4)).
Forests 10 00144 g006
Figure 7. Estimated volumes by timber volume prediction model (Equation (3)) and branch volume prediction model (Equation (4)) against measured volumes with a diagonal 1:1 line passing through data points.
Forests 10 00144 g007
Figure 8. Effects of the branch volume (branchvol) and degree of slope on the timber volume prediction. Curves were produced using parameter estimates of the timber volume prediction model (Equation (3)) and the mean of each of the predictors; except the variable of interest in the figure, which was allowed varying from approximately minimum to maximum in the measured data (Table 1). Black dots represent the measured timber volumes.
Forests 10 00144 g008
Figure 9. Simulated effects of site quality class (SQC) on the branch volumes. The branch volume curves were produced using parameter estimates of the branch volume prediction model (Equation (4)). Black dots represent the measured branch volumes. SQC = 1: rich; SQC = 2: medium; SQC = 3: poor.
Forests 10 00144 g009
Figure 10. Ordination diagram showing the relationships of the PCA among dendromass characteristics (timber volume, branch volume, and timber-to-branch volume ratio-TBR), stand characteristics (mean height, mean diameter at breast height-DBH, stand age, height-to-breast height diameter ratio-HDR, and stocking), and sample plot characteristics (elevation, slope, and site quality class) on the left side and the classified diagram was differentiated according to edaphic factors (● nutrient–rich series, ■ acid series) on the right side; small dots and squares indicating 76 sample plots.
Forests 10 00144 g010
Table 1. Summary statistics of data.
VariableMeanStandard Deviation MinimumMaximum
Timber volume (m3)14.436.985.0333.11
Branch volume (m3)4.272.271.0812.09
Timber-to-branch volume ratio3.721.431.279.57
Branch weight (kg)2.751.530.678.70
Mean DBH (cm)35.496.0624.0048.00
Mean height (m)30.013.8820.0040.00
Elevation (m)726.8172.53801040
Slope (degree)16.1710.940.7245.69
Stand age (year)16.1710.940.7245.70
Stand stocking (%)8611.1960130
Table 2. Pearson’s correlations between various variables of the interest. Approximate p-value of each correlation is given in the parenthesis, and significant correlation is shown in bold.
Timber VolumeBranch VolumeMean DBHMean HeightElevationSlopeStand AgeAspectStocking
Branch volume0.792
(0.0001)
Mean DBH0.618
(0.0001)
0.5152
(0.0001)
Mean height0.579
(0.0001)
0.426
(0.0001)
0.8554
(0.0001)
Elevation 0.145
(0.2129)
−0.0158
(0.8922)
0.3459
(0.0022)
0.173
(0.1350)
Slope0.392
(0.0005)
0.1979
(0.0866)
0.2269
(0.0487)
0.2925
(0.0103)
0.2046
(0.0762)
Stand age0.285
(0.0124)
0.2357
(0.0403)
0.5765
(0.0001)
0.4931
(0.0001)
0.2691
(0.0188)
0.0187
(0.8724)
Aspect 0.172
(0.1382)
−0.193
(0.0948)
−0.0748
(0.5205)
−0.132
(0.2580)
0.199
(0.0844)
−0.025
(0.8275)
−0.018
(0.8761)
Stocking −0.23432
(0.0416)
−0.33419
(0.0032)
−0.35116
(0.0019)
−0.28117
(0.0139)
−0.00098
(0.9933)
−0.07151
(0.5393)
−0.45303
(<0.0001)
0.12383
(0.2865)
Timber-to-branch volume ratio (TBR)0.06686
(0.5661)
−0.44449
(0.0001)
0.04532
(0.6975)
0.14596
(0.2083)
0.29713
(0.0091)
0.21281
(0.0649)
0.11116
(0.3391)
−0.03423
(0.7691)
0.1709
(0.1398)

