Article

Effects of Planting Density on Soil Bulk Density, pH and Nutrients of Unthinned Chinese Fir Mature Stands in South Subtropical Region of China

1
Research Institute of Forestry, Chinese Academy of Forestry, Key Laboratory of Forest Silviculture of the State Forestry Administration, State Key Laboratory of Tree Genetics and Breeding, Beijing 100091, China
2
Collaborative Innovation Center of Sustainable Forestry in Southern China, Nanjing Forestry University, Nanjing 210037, China
3
Experiment Center of Tropical Forestry, Chinese Academy of Forestry, Pingxiang 532600, China
4
Experimental Center of Subtropical Forestry, Chinese Academy of Forestry, Fenyi 336600, China
*
Author to whom correspondence should be addressed.
Submission received: 7 April 2019 / Revised: 18 April 2019 / Accepted: 19 April 2019 / Published: 20 April 2019
(This article belongs to the Special Issue Forest Stand Management and Biomass Growth)

Abstract

:
Chinese fir (Cunninghamia lanceolata (Lamb.) Hook) is a fast-growing evergreen conifer with high-quality timber and is an important reforestation and commercial tree species in southern China. Planting density affects the productivity of Chinese fir plantations. To study the effect of five different planting densities and soil depth on soil nutrient contents of a mature C. lanceolata plantation, the soil nutrient contents (soil depths 0–100 cm) of 36-year-old mature Chinese fir plantations under five different planting densities denoted A (1667 trees·ha−1), B (3333 trees·ha−1), C (5000 trees·ha−1), D (6667 trees·ha−1), and E (10,000 trees·ha−1) were measured in Pingxiang county, Guangxi province, China. Samples were collected from the soil surface down to a one meter depth from each of 45 soil profiles, and soil samples were obtained at 10 different soil depths of 0–10, 10–20, 20–30, 30–40, 40–50, 50–60, 60–70, 70–80, 80–90, and 90–100 cm. Twelve soil physical and chemical indicators were analyzed. The results showed that: (1) as planting density increased, the organic matter, organic carbon, total N and P, available N, effective Fe, and bulk density decreased. Soil pH, total K, and effective K increased with increasing planting density. Planting density did not significantly influence the exchangeable Ca and Mg. (2) Soil organic matter; organic carbon; total N and P; effective N, P, and K; exchangeable Ca and Mg; effective Fe content; and bulk density decreased with increasing soil depth. This pattern was particularly evident in the top 30 cm of the soil. (3) Excessively high planting density is not beneficial to the long-term maintenance of soil fertility in Chinese fir plantations, and the planting density of Chinese fir plantations should be maintained below 3333 stems·ha−1 (density A or B) to maintain soil fertility while ensuring high yields.

1. Introduction

Chinese fir (Cunninghamia lanceolata (Lamb.) Hook) is a species characteristic of the subtropical zone and an important reforestation and commercial tree species, occurring throughout the whole southern subtropical zone in China. According to the eighth Chinese National Forest Inventory, Chinese fir plantations occupy almost 8.95 million ha, and they have a standing timber volume of 625 million m3 [1]. The total plantation area of Chinese fir has increased due to an increased demand for timber. However, the yield and productivity of pure Chinese fir plantations are extremely low due to poor soil fertility and unscientific management practices [2,3,4]. As Chinese fir litter has a low decomposition rate, nutrients are slow to return to the soil during a short rotation, which may lead to poor soil fertility [5,6]. Some reasonable silvicultural treatments, like harvest residue management [7], fertilization [8], and mixed forests [9], could improve the stand growth environment, and increase the vegetation development and litter decomposition rates in Chinese fir plantations [10], which would help maintain soil fertility.
The response of soil properties to silvicultural treatments [11], including thinning and harvesting regimes, underforest vegetation management, rotation [12,13,14], and site condition and climate status analysis, can be complex. For Chinese fir plantations, previous studies on the soil nutrients focused on successive planting [15,16], thinning intensity [17,18] and the changes in the soil nutrients in plantations during their different development stages [19,20] in mid-subtropical areas such as Jiangxi and Fujian [21,22,23,24]. Thinning is a common stand density management practice used to increase the quality and quantity of merchandisable timber [25]. Thinning can increase [26,27], decrease [28], or have little effect [29] on soil nutrition. However, most of these studies mainly focused on the short-term effects of thinning on soil properties, and long-term studies have generally shown that soil organic matter eventually returns to preharvest levels in most sites during the first rotation [14,30].
Planting density greatly affects plantation productivity [31]. Some studies on loblolly pine have shown that planting density affects biomass accumulation at the stand level [32] and the tree level [33]. We reported the effects of the planting density of Chinese fir stands on basal area growth, timber assortment structure, biomass, and self-thinning [31,34,35]. Due to action on population structure and the competitive situation in forest stands, density control can affect the formation of litter, the biomass, and species diversity of the undergrowth vegetation by affecting the distribution of factors such as light, temperature, and moisture in the forest community [36], which affect the soil nutrients in forests [5]. Planting density has been proven to significantly affect fibrous root reinforcement in soil [37], soil microflora [38,39], enzyme activity [40], and soil nutrient content [41]. However, most studies focused on the effects of planting density on aboveground yield responses and nutrient concentrations [42,43], so little is known about the effect of planting density on soil nutrients.
Guangxi Province is known as a Chinese fir production area in the south subtropics area in China [44], but no studies have been published on the effects of planting density on soil nutrients in these Chinese fir plantations. In view of this, the objective of our study was to quantify the long-term impacts of different planting densities on soil nutrients as well as to determine their distribution according to soil depths in the 36-year-old undisturbed Chinese fir stands under five planting densities in Pingxiang county, Guangxi province. Information on the soil nutrients status under different planting densities will assist forest managers to strategize future management practices and be beneficial for maintenance of the long-term productivity of regional Chinese fir plantations.

2. Materials and Methods

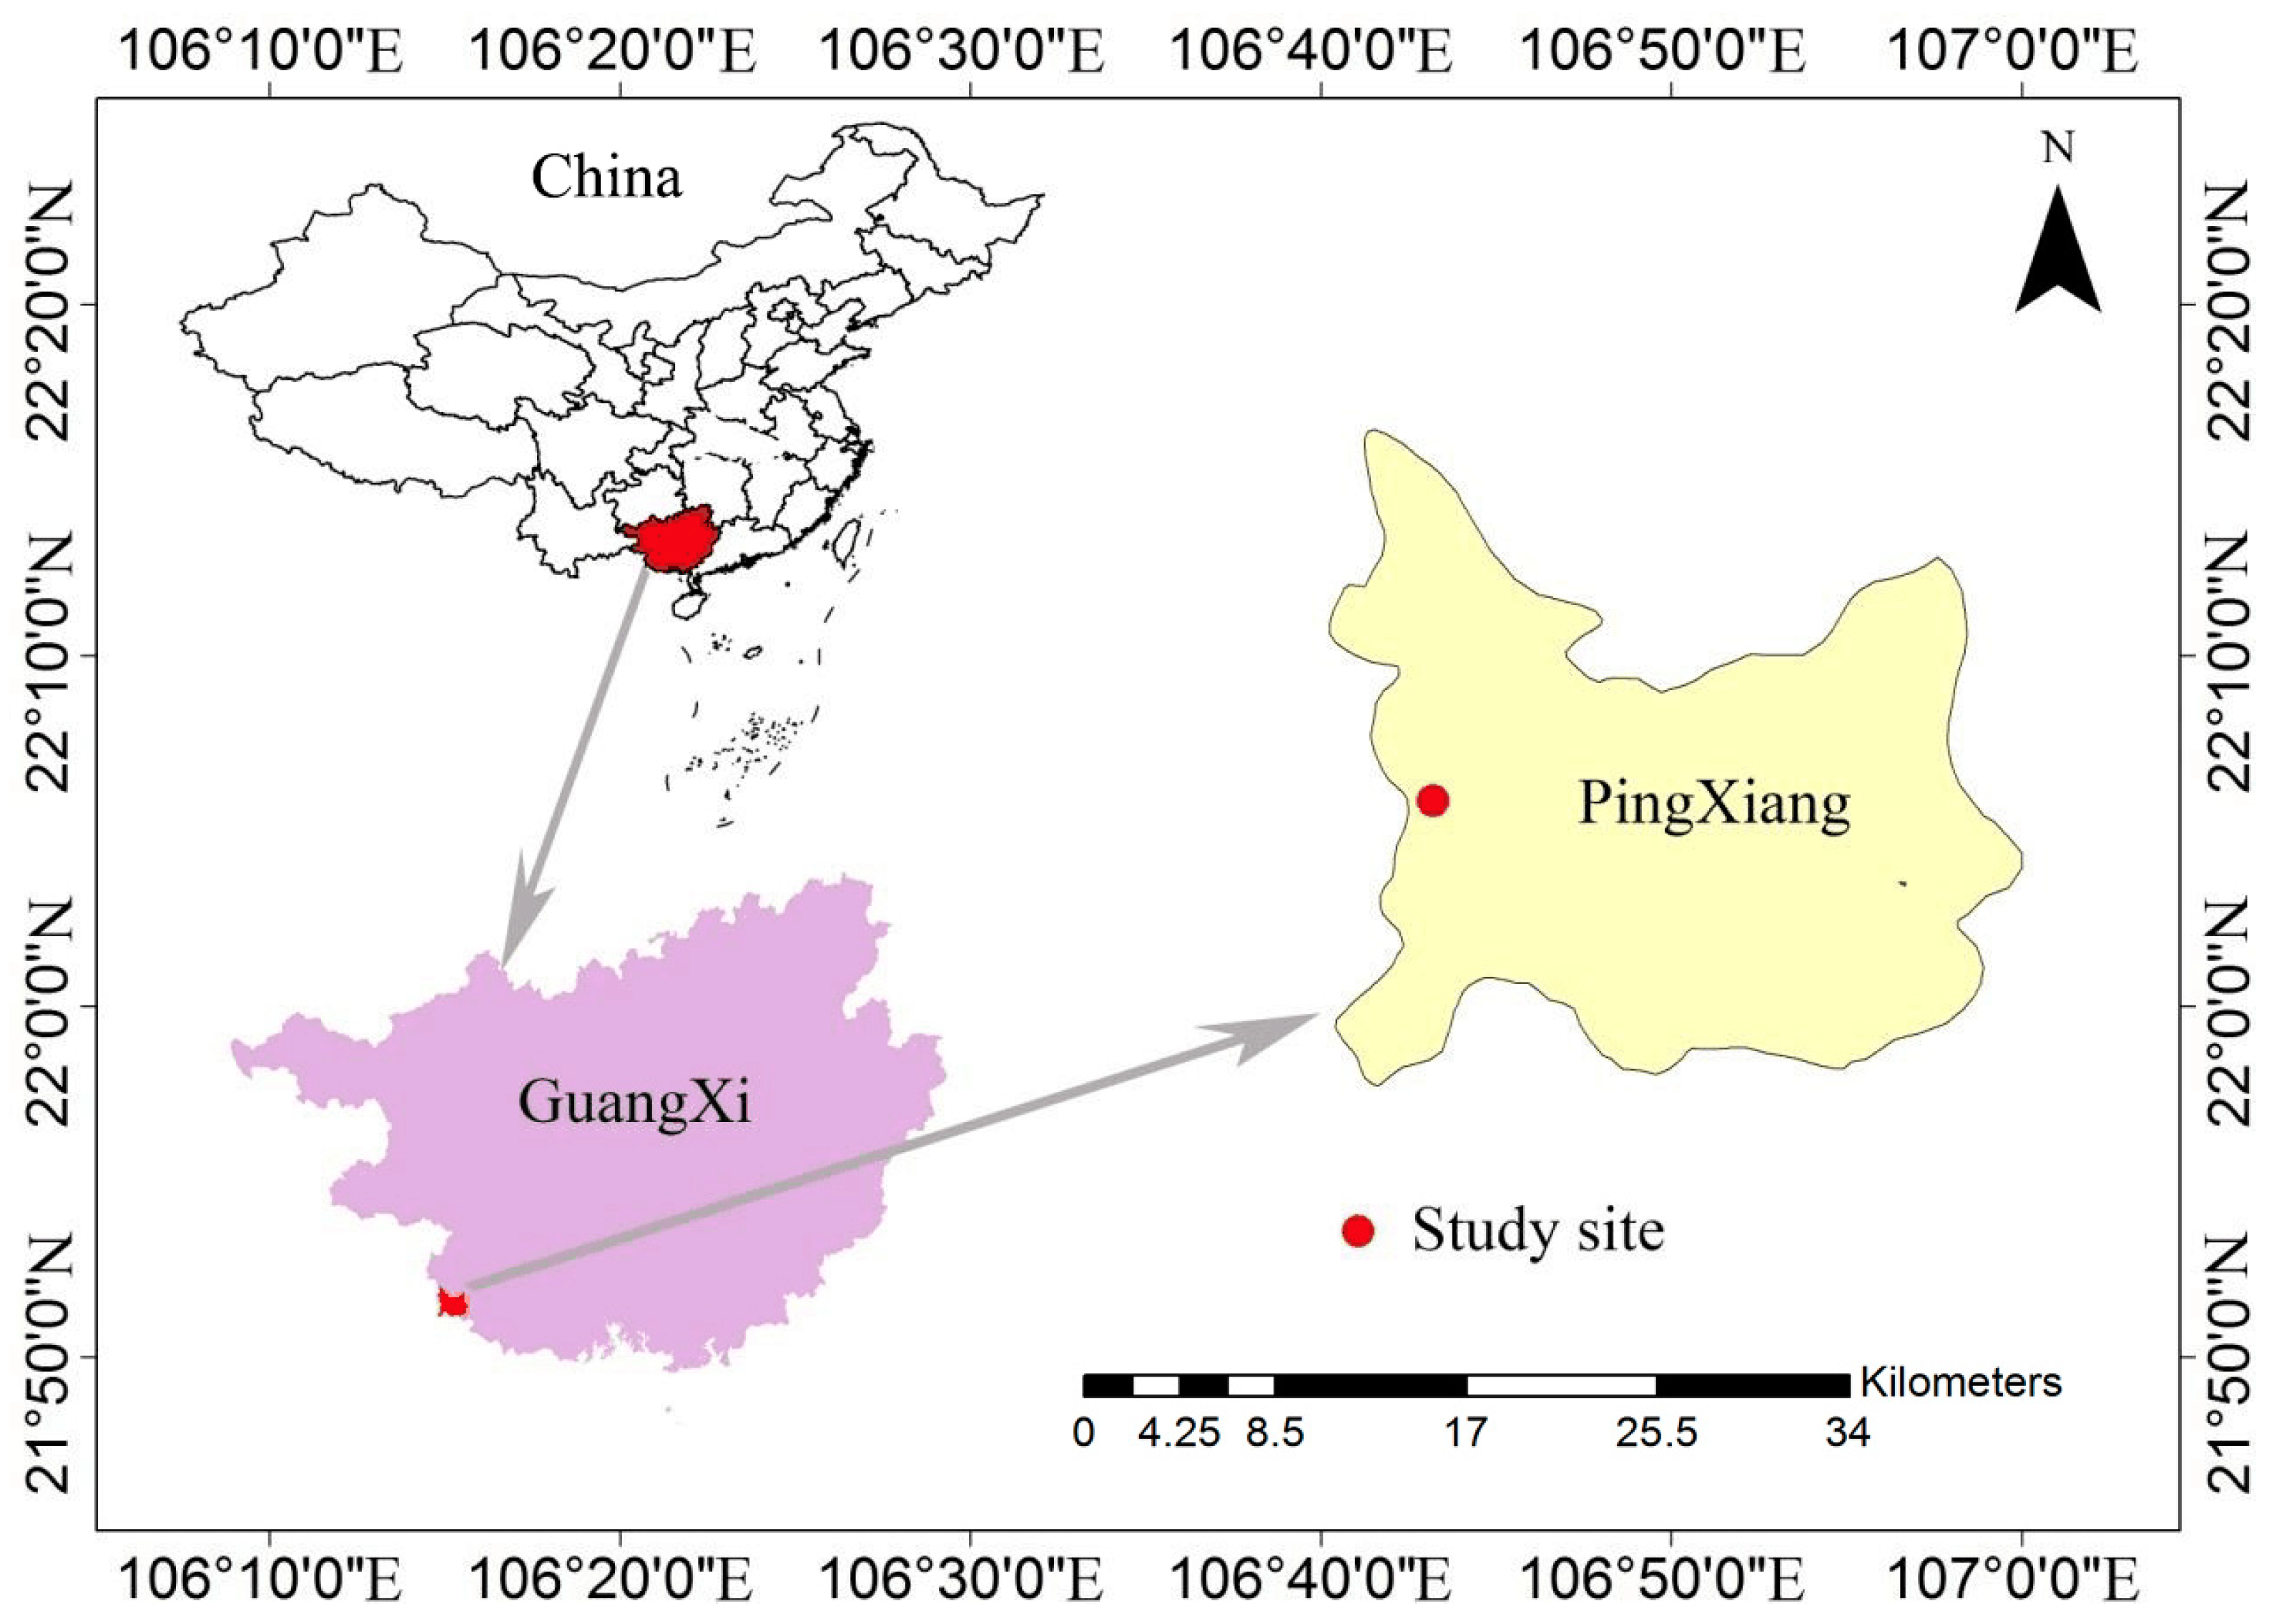
2.1. Experimental Site

The experimental materials were obtained from the Daqingshan Forest Farm (106°43′ E, 22°06′ N, mean altitude 500 m), located in Pingxiang county, Guangxi province, China (Figure 1). The area’s main ground feature is low mounts at slopes of 25–30°. This experimental site has a south tropical monsoon climate. The average annual temperature, precipitation, and evaporation in the study area were 19.9 °C, 1400 mm, and 1200 mm, respectively. The site’s sandy textured soil formed from granite, which is classified as red soil in Chinese soil classification. The soil thickness is greater than 1 m. Undergrowth vegetation, such as Aporosa chinensis (Champ.) Merr., Rhodomyrtus tomentosa (Ait.) Hassk., Cibotiumb arometz (L.) J. Sm., and Adiantum capillus-veneris L., grow on the site.

2.2. Experimental Design

The Chinese fir stand density experiment was planted with two-year-old seedlings in the spring of 1982. The five planting densities were 1667, 3333, 5000, 6667, and 10,000 trees ha−1 with distances between trees of 2 × 3, 2 × 1.5, 2 × 1, 1 × 1.5, and 1 × 1 m, recorded as A, B, C, D, and E, respectively. Plots were installed in a random block arrangement. Each spacing level was replicated three times for a total of 15 plots. Each plot was 20 × 30 m (0.06 ha), with a buffer zone of two rows of the same species density around each plot, and a fixed boundary of concrete piles. The basic information for the different densities of Chinese fir stands is provided in Table 1.

2.3. Collection and Analysis of Soil Samples

Three soil profiles were selected and diagonally distributed for each of the 15 plots. A total of 45 soil profiles were manually dug when the Chinese fir density experimental stand was 37 years old in the fall of 2016. Each soil profile was 1 m deep. Soil samples were collected at 10 soil depths of 0–10, 10–20, 20–30, 30–40, 40–50, 50–60, 60–70, 70–80, 80–90, and 90–100 cm, and approximately 500 g of soil at each depth was sampled. In each depth, we measured for the soil: bulk density, pH, organic matter content, total N, alkali-hydrolyzable N, total P, available P, total K, available K, exchangeable Ca, exchangeable Mg and available Fe. Bulk density was determined by inserting a steel cylinder of known volume, 5 cm high and with a 5.046 cm inner diameter, into each depth of the soil profile. A total of 1 350 samples were taken from 15 plots with 45 soil profiles. The dry weight, calculated with fresh weight and water content, divided by the volume of the cylinder is the bulk density expressed as g cm−3 [45]. At the same time, 500 g of each of 450 layers was stored in soil bags, transported to the laboratory, air-dried, ground, sieved, and analyzed for soil chemical properties. The soil pH was determined using the potentiometer method of analysis, using soil/saline solution suspensions (soil-KCl 1 mol) in a 1:2.5 proportion [46]. The organic matter was determined by the K2Cr2O7-H2SO4 oxidation method [45]. The total N and alkali-hydrolyzable N were determined by the Kjeldahl method using a 2300 Kjeltec Analyzer Unit (FOSS, Hilleroed, Denmark) and the alkaline hydrolysis method, respectively. The extraction method for total P and K, available P and K was conducted according to the soil physical and chemical analysis [45]. The exchangeable Ca, Mg, and Fe were determined using an atomic absorption spectrophotometer (Thermo Fisher Scientific, Rockford, IL, USA) [47].

2.4. Data Processing

Both one-way analysis of variance (ANOVA) and multiple comparisons were used to determine the difference in the soil nutrient contents in different planting densities and soil layers.

3. Results and Analysis

3.1. Effects of Planting Density on Bulk Density

Table 2 provides the determined values of the volume weight in the different soil layers for the five planting densities. Table 1 shows that in the 0–20 cm soil layer, the soil bulk density at lower planting densities (A and B) was lower than in D and E densities. In the 0–10 cm soil layer, the soil bulk density in D was significantly higher than in the other four planting densities. We observed a small difference in soil bulk density for the five densities in the soil layers below 20 cm.
Within the 0–30 cm soil layer, the bulk density for the five density stands sharply increased with increasing soil layer depth, presenting a significant progressive increase in four planting densities: A, B, C, and D. The bulk density changed little in the soil layers below 20 cm.

3.2. Effects of Planting Density on Soil pH

The soil pH in high-density stands is higher than in the low-density stands, and the five densities demonstrated a consistent change trend in soil pH in different soil layers, with the basic order of E > D > B > C > A. In the 0–10, 10–20, 20–30, 30–40, 40–50, 50–60, and 60–70 cm soil layers, a significant difference was found in the soil pH (p < 0.5) between A density and the other densities, but no significant difference was found between the other four densities, B, C, D, and E, in the different soil layers (Table 3).
The soil pH was 3.50–4.0 at 1 m deep in the soil profile, presenting a rising trend with the increase in soil depth. For different planting densities, a certain difference was observed in the effect of soil layer on soil pH. For the A planting density, a significant difference was found in the soil pH between the 0–60 cm soil layers and the soil layers below 60 cm. In B, C, and D densities, there was no significant difference in the soil pH in the 0–70 cm soil layers, but the soil pH above 70 cm is significantly different from that below 70 cm. In the E density, there was no significant difference in soil pH of the 0–80 soil layers, only the soil pH in the 0–10 cm soil layer had significant difference from the soil layers below 80 cm. High planting density can reduce the difference in the soil pH in different soil layers.

3.3. Effects of Planting Density on Nutrient Contents

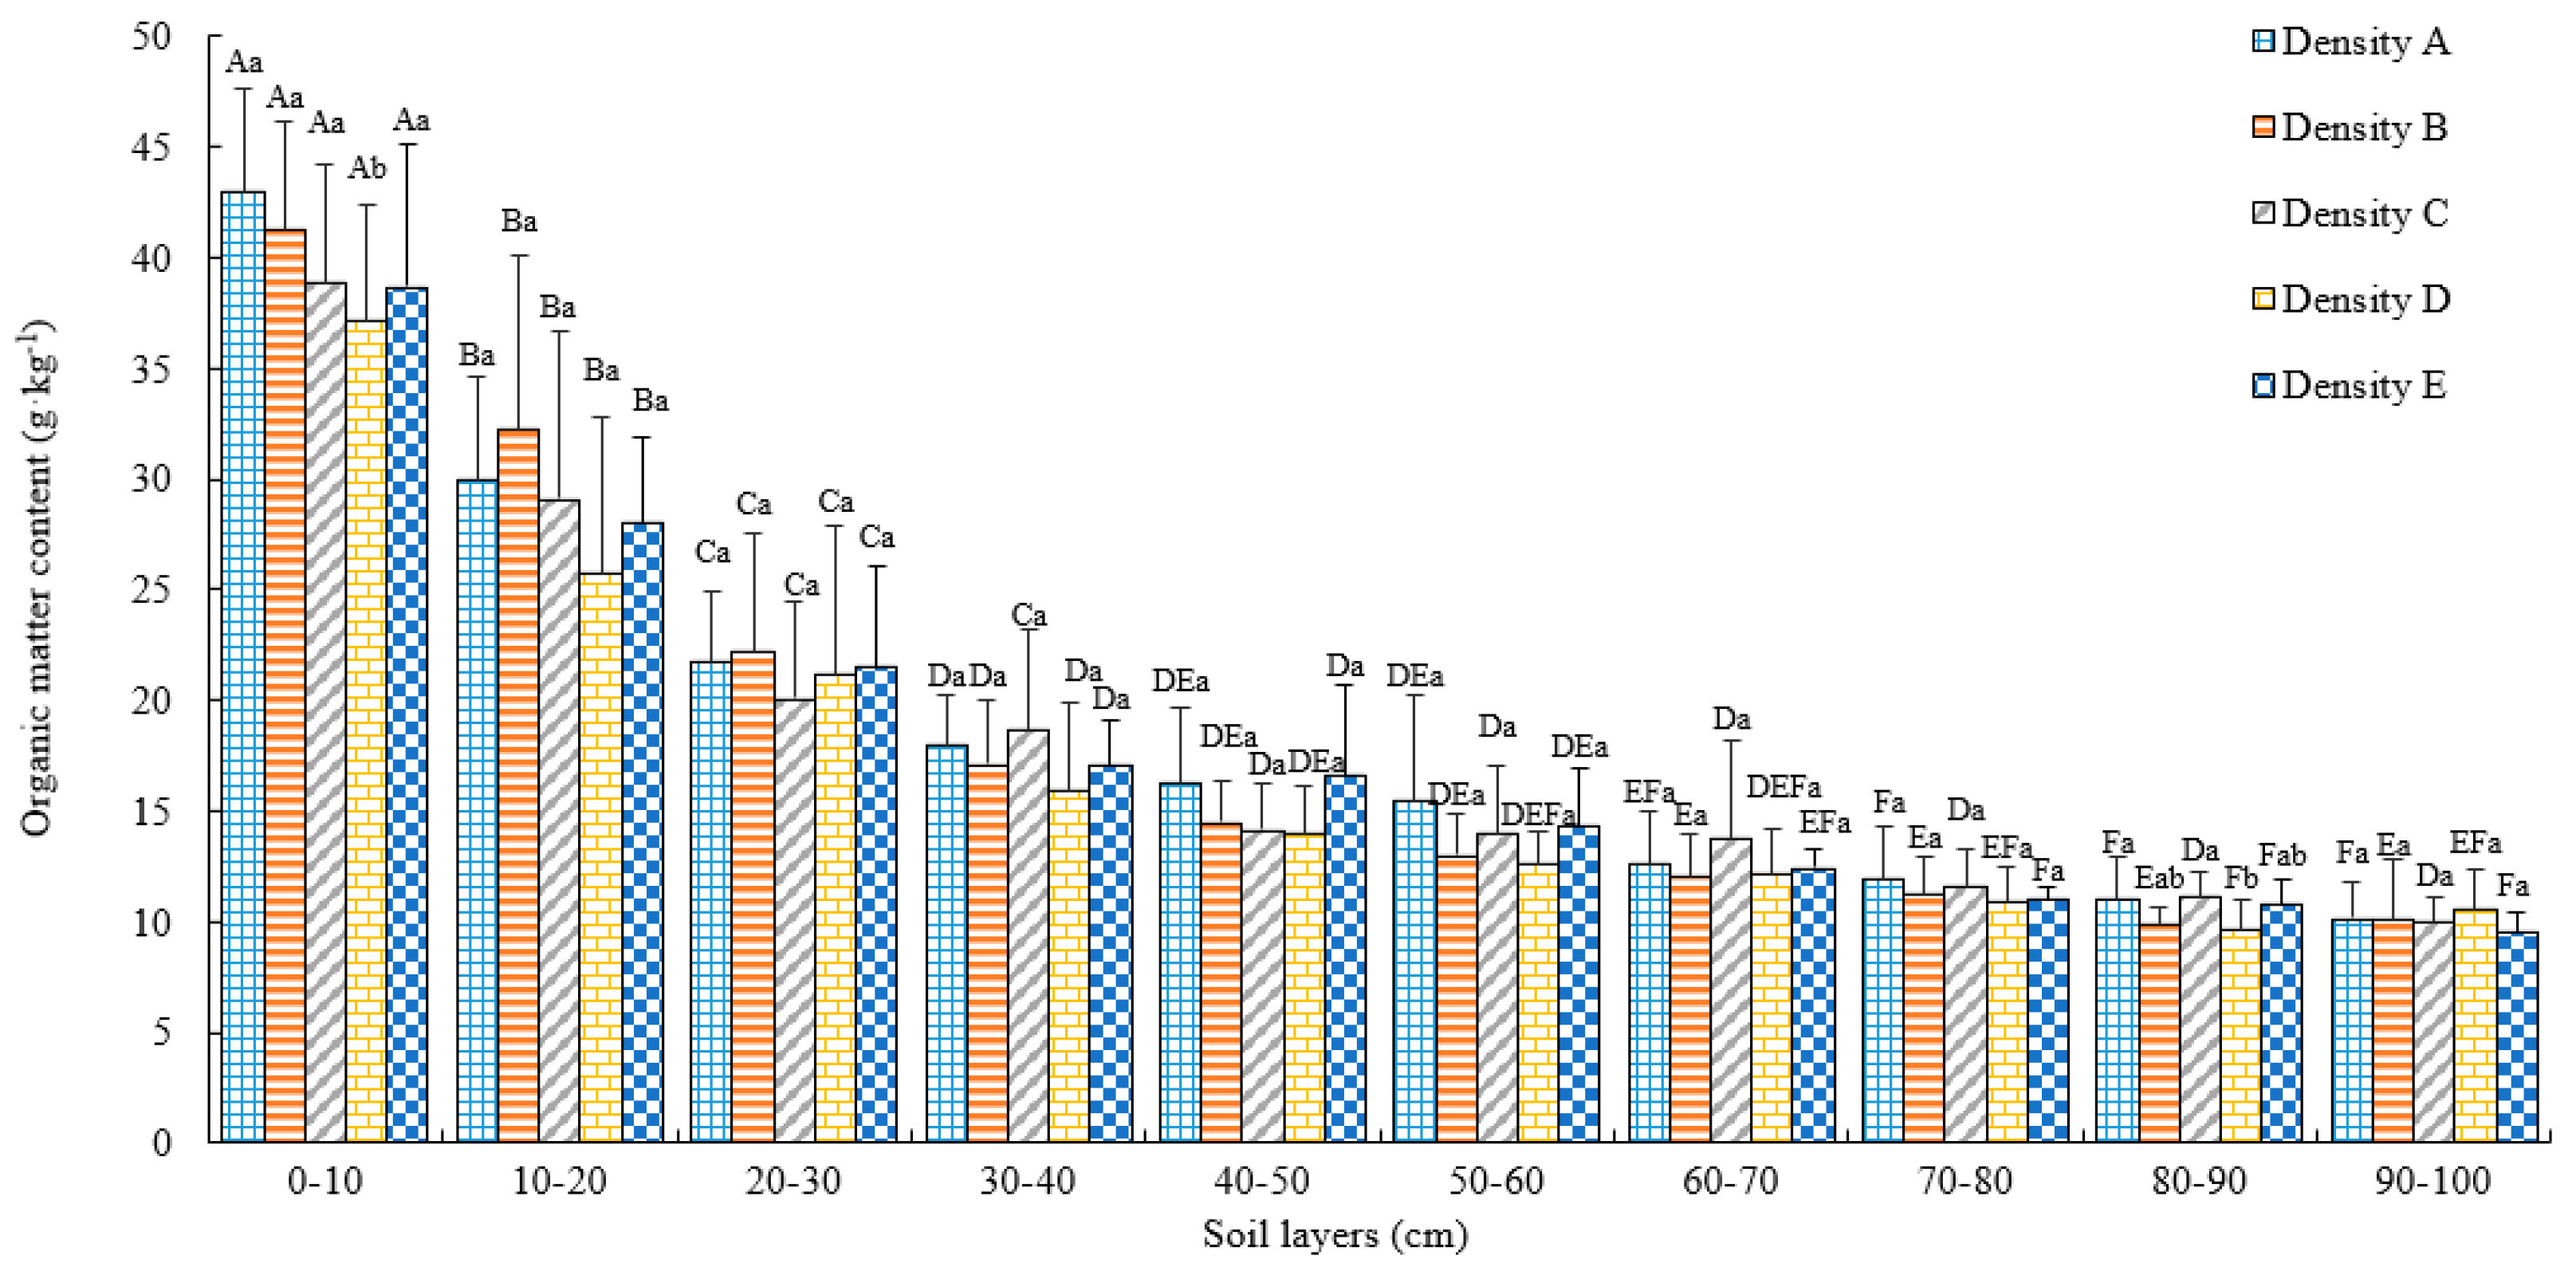
3.3.1. Organic Matter

Figure 2 shows that the planting density had an obvious effect on the organic matter in the soil layers, and the surface soil (0–30 cm) in both A and B densities had a higher organic matter content than the soil layers under the other densities. The 0–10 cm soil layer in the A density had more organic matter content than in the other planting densities, indicating that low density is good for the accumulation of soil organic matter. Comparatively, the soil in the D density had the lowest organic matter content, and its organic matter content was significantly less than in the other planting densities (p < 0.05).
Figure 2 shows that with the increase in soil depth, the organic matter content declines to different degrees, with different decreasing ranges. A fourfold decrease in organic matter content was recorded in 90–100 cm compared with the 0–10 cm soil layer. The organic matter content in 0–30 cm soil in all five density was higher than in the soil layers below 30 cm, decreasing significantly with the increase in soil depth. The organic matter content decreased less within the 30–60 cm soil layer, but was invariant within 60–100 cm soil layer.

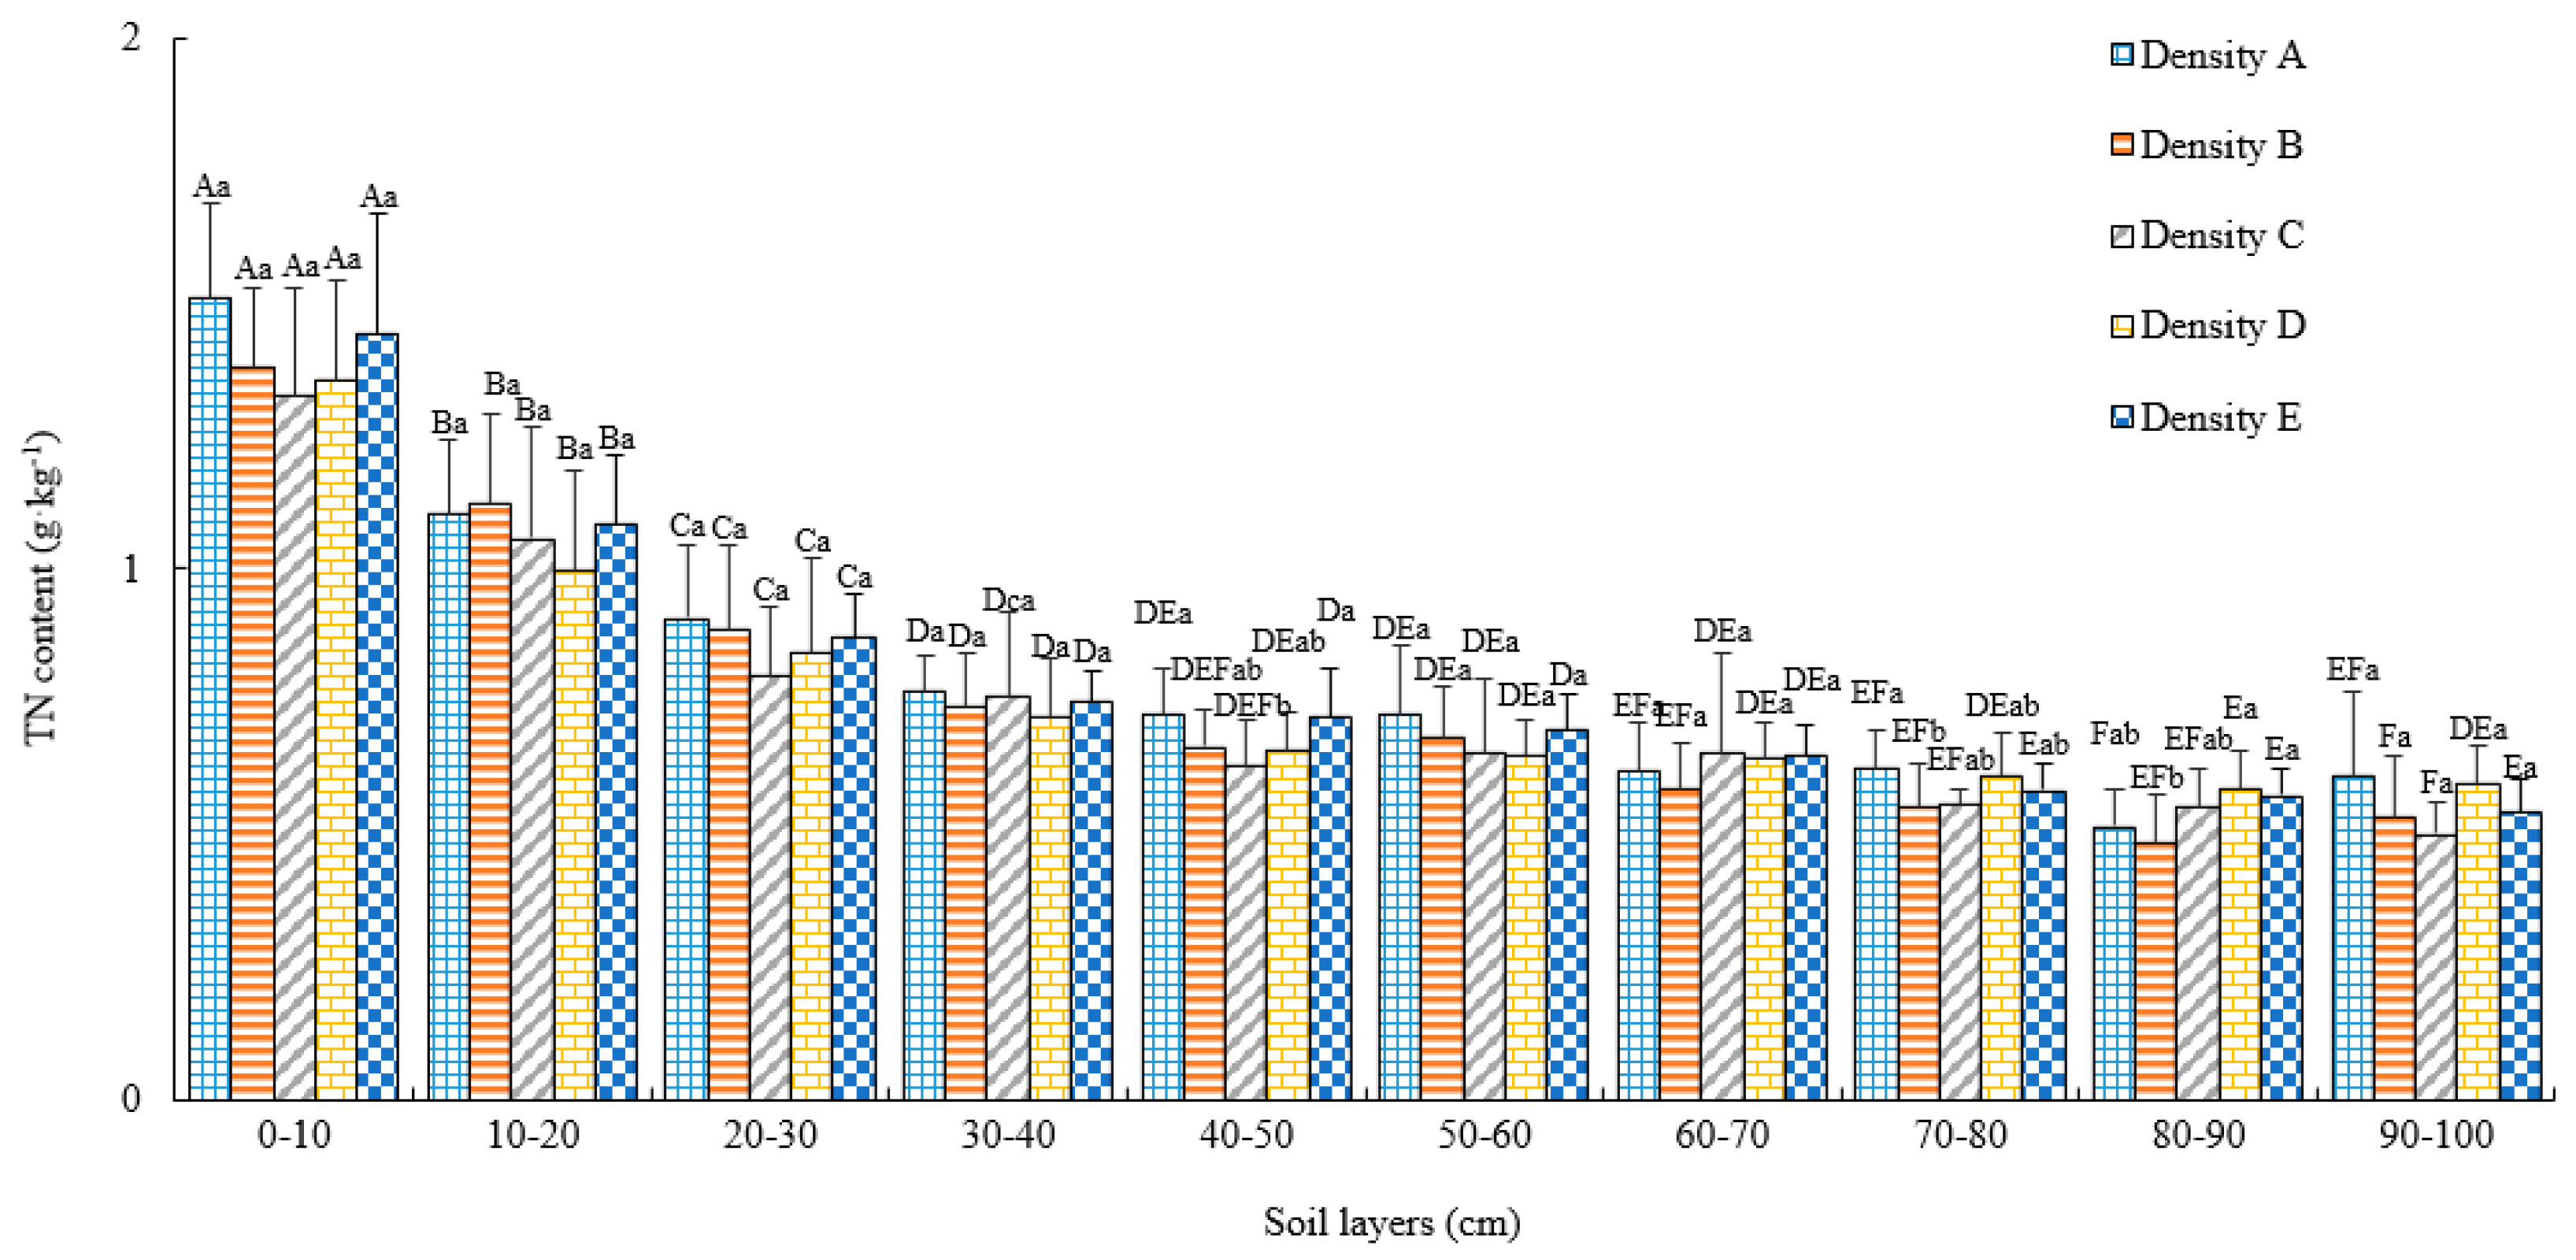
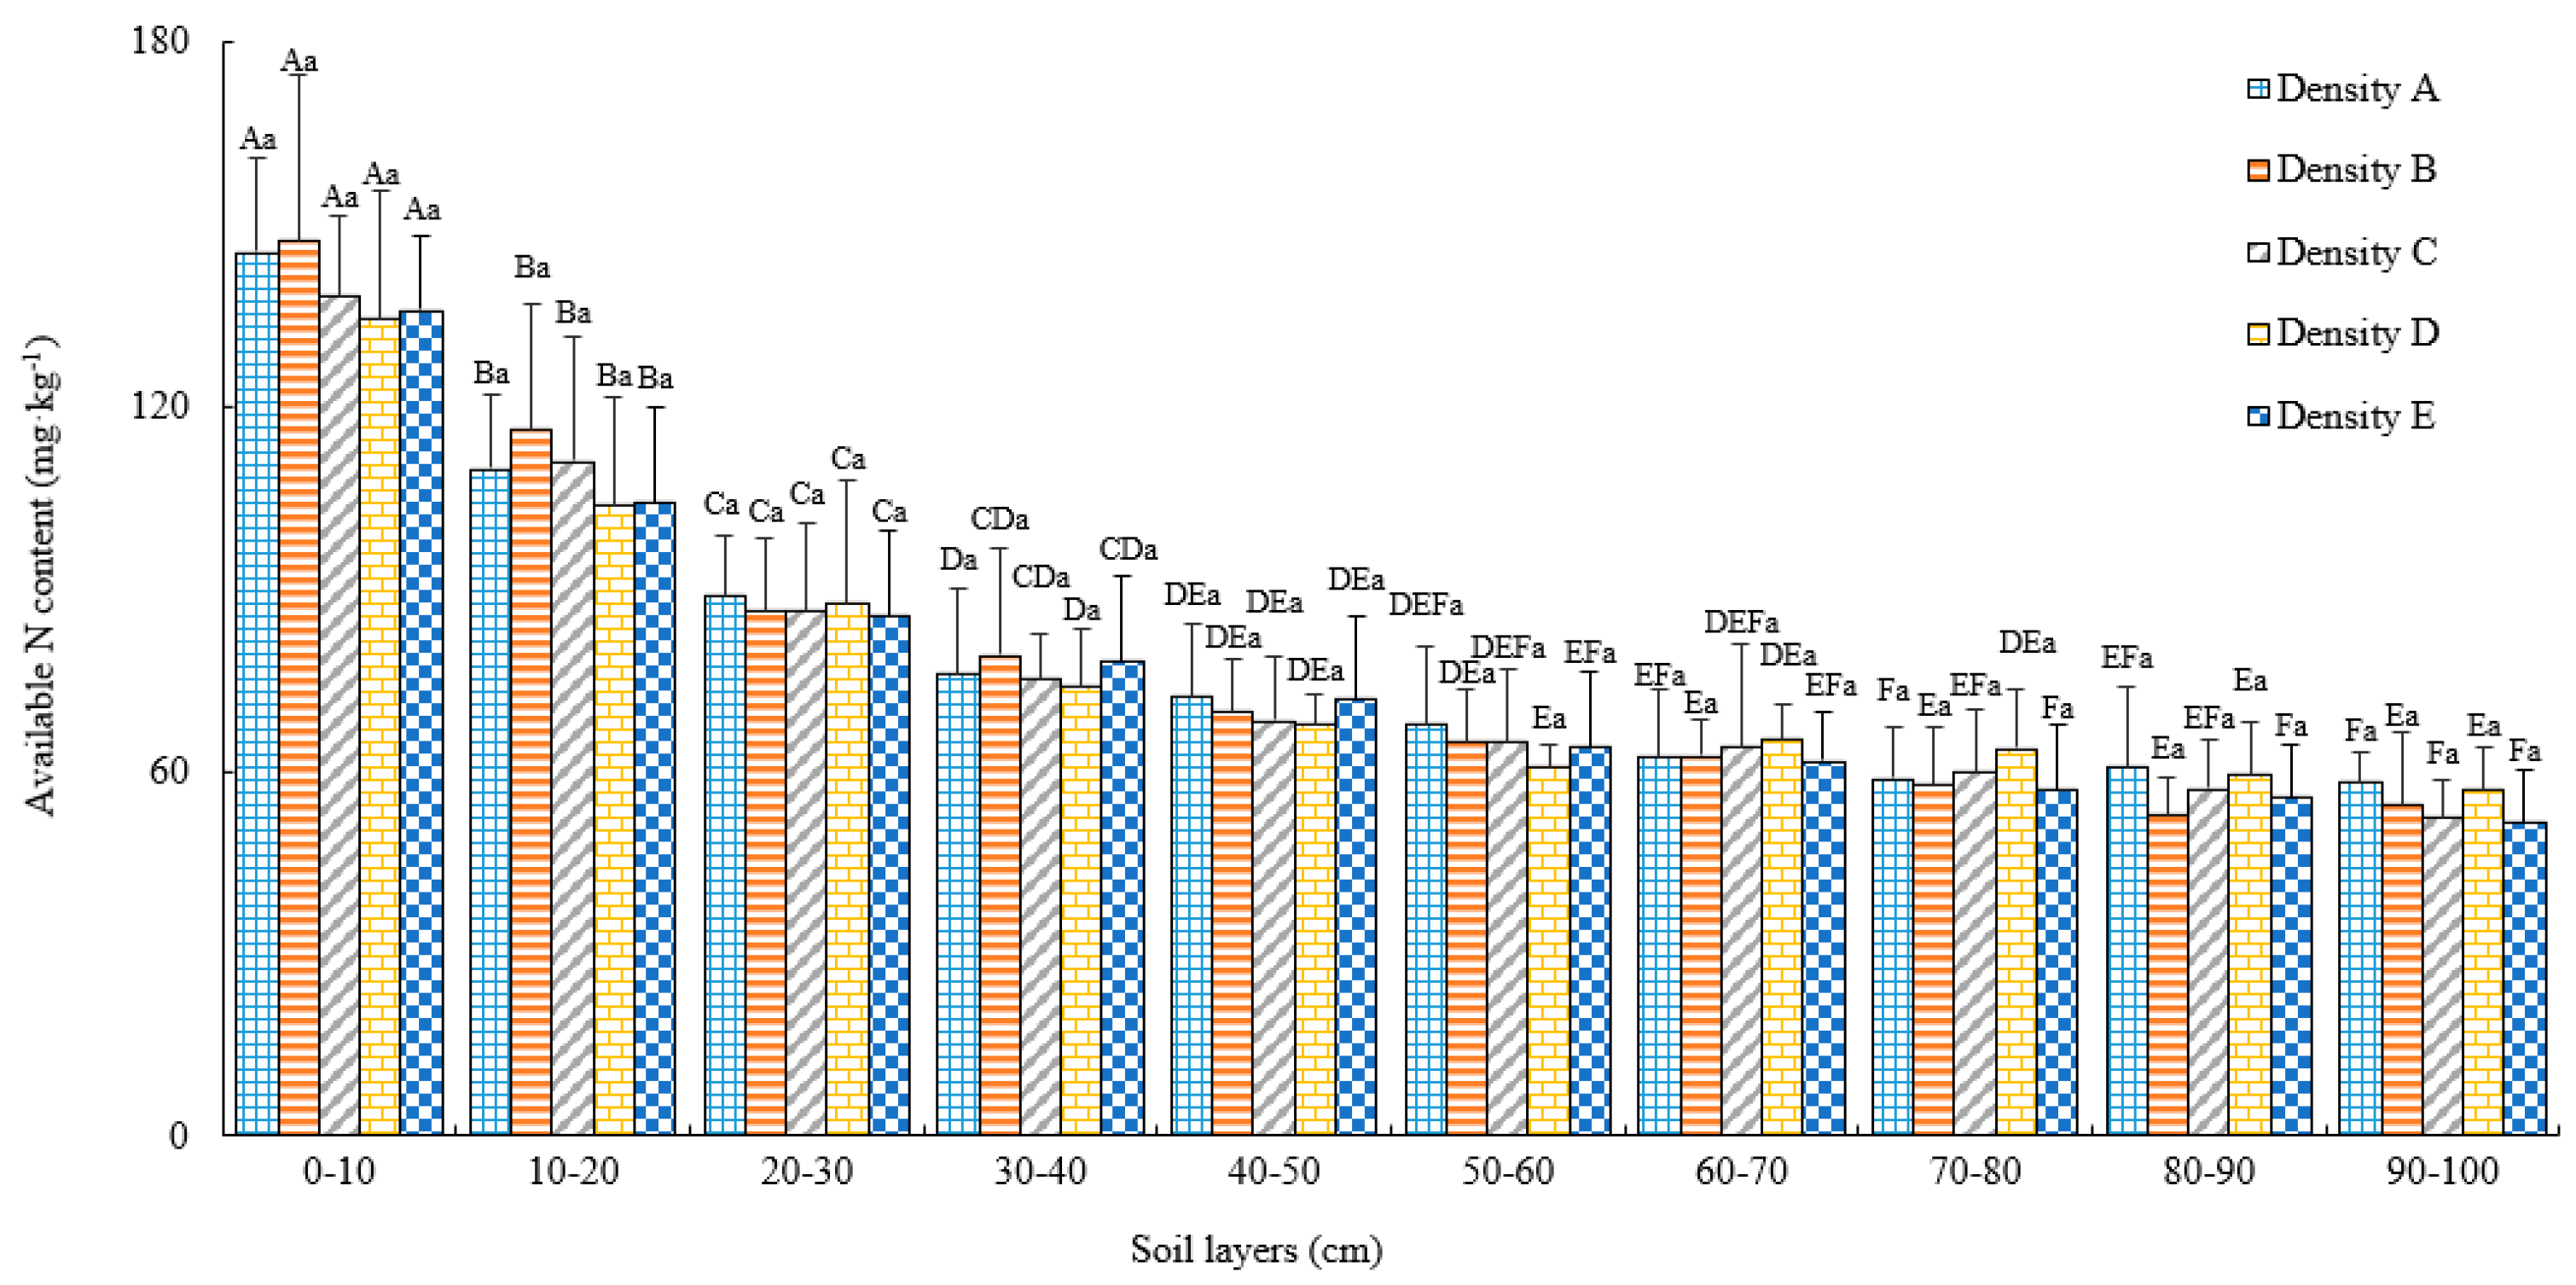
3.3.2. Total N and Alkali-Hydrolyzable N

The nitrogen (N) in soil exists in an organic state. The total N is the total content of nitrogen and N supply potential, and alkali-hydrolyzable N refers to the N content that can be absorbed for use by plants. Figure 3 and Figure 4 show that both the soil total N and the alkali-hydrolyzable N consistently changed with Chinese fir planting density. With the increase in density, the total and alkali-hydrolyzable N contents in all soil layers decreased a little as a whole. The total N content in the A density was generally higher than that in the other densities, but the density had no significant effect on the total and alkali-hydrolyzable N contents in the same soil layer.
The soil total and alkali-hydrolyzable N contents in the five density stands decreased with the increase in soil depth. The two contents in the 0–30 cm soil layer were significantly higher than that in the other soil layers (p < 0.05). The two contents decreased significantly within the 0–30 cm soil layer with the increase in soil depth, but in the soil layers below 30 cm, they decreased relatively slowly. The soil total and alkali-hydrolyzable N contents in the 30–40 cm soil layer in the lower density A and B stands were significantly higher than that in the soil layer below 60 cm. The two contents in the 30–40 cm soil layer in the relatively higher C-, D-, and E-density stands were significantly higher than those in the soil layers below 70 cm. Both the total and the alkali-hydrolyzable N contents presented no statistically significant difference in the soil layers below 40 cm in different density stands.

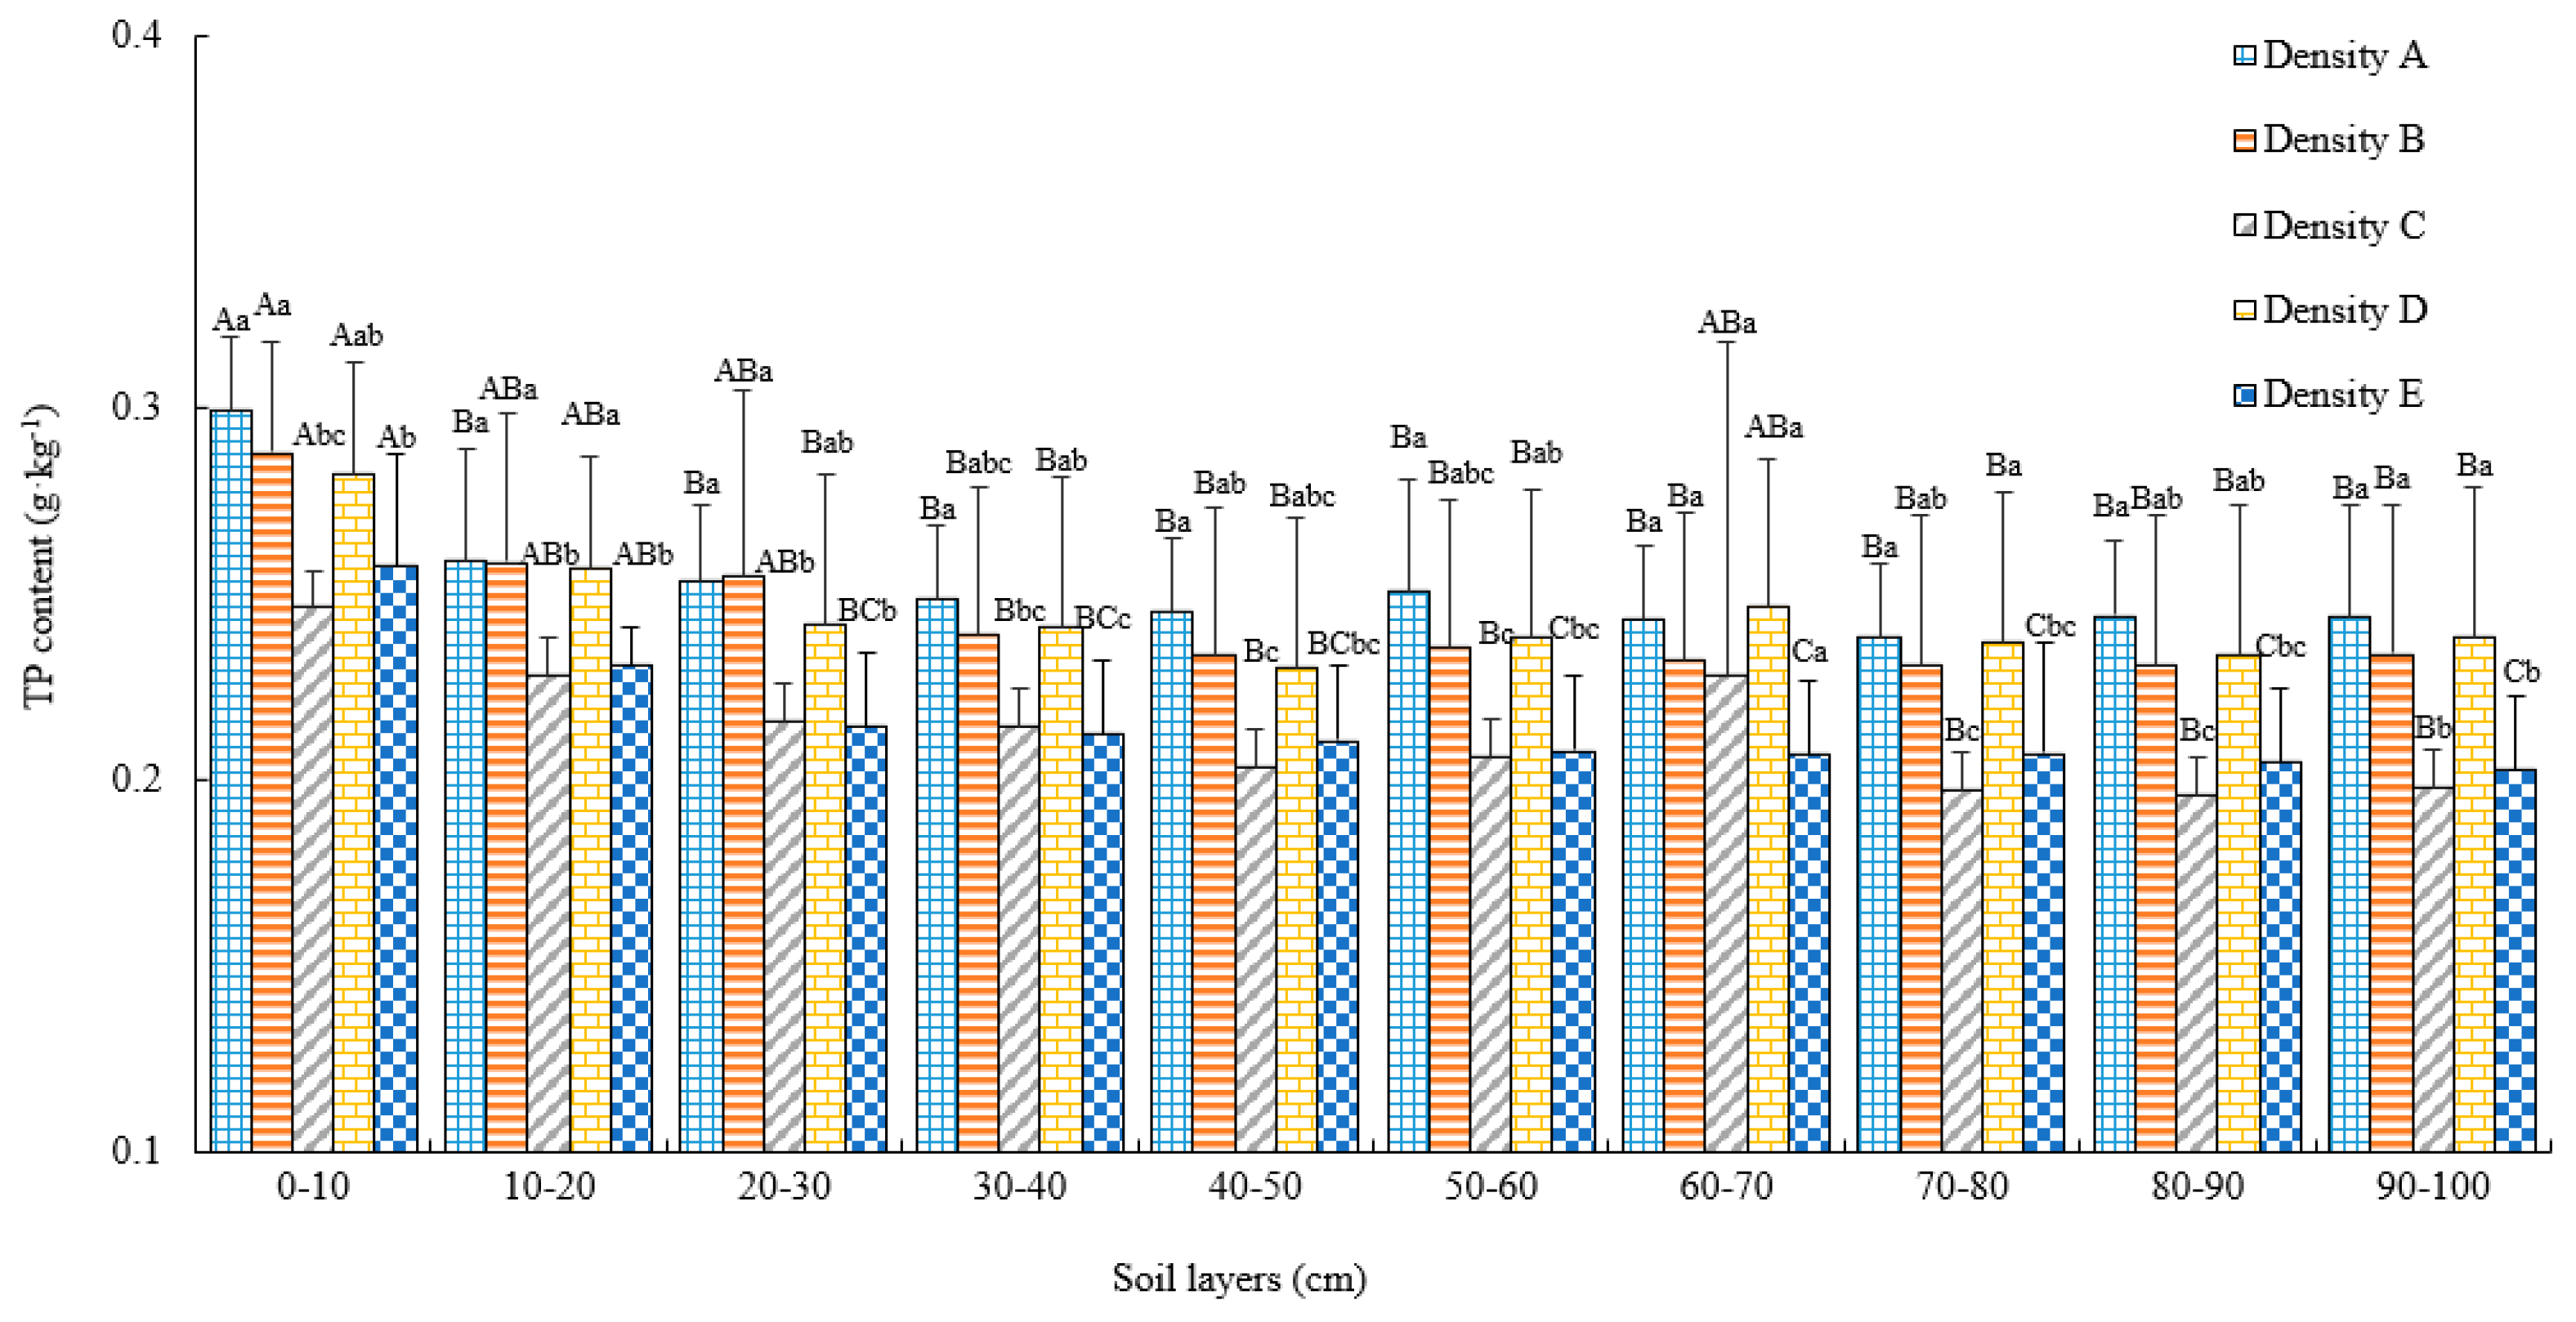
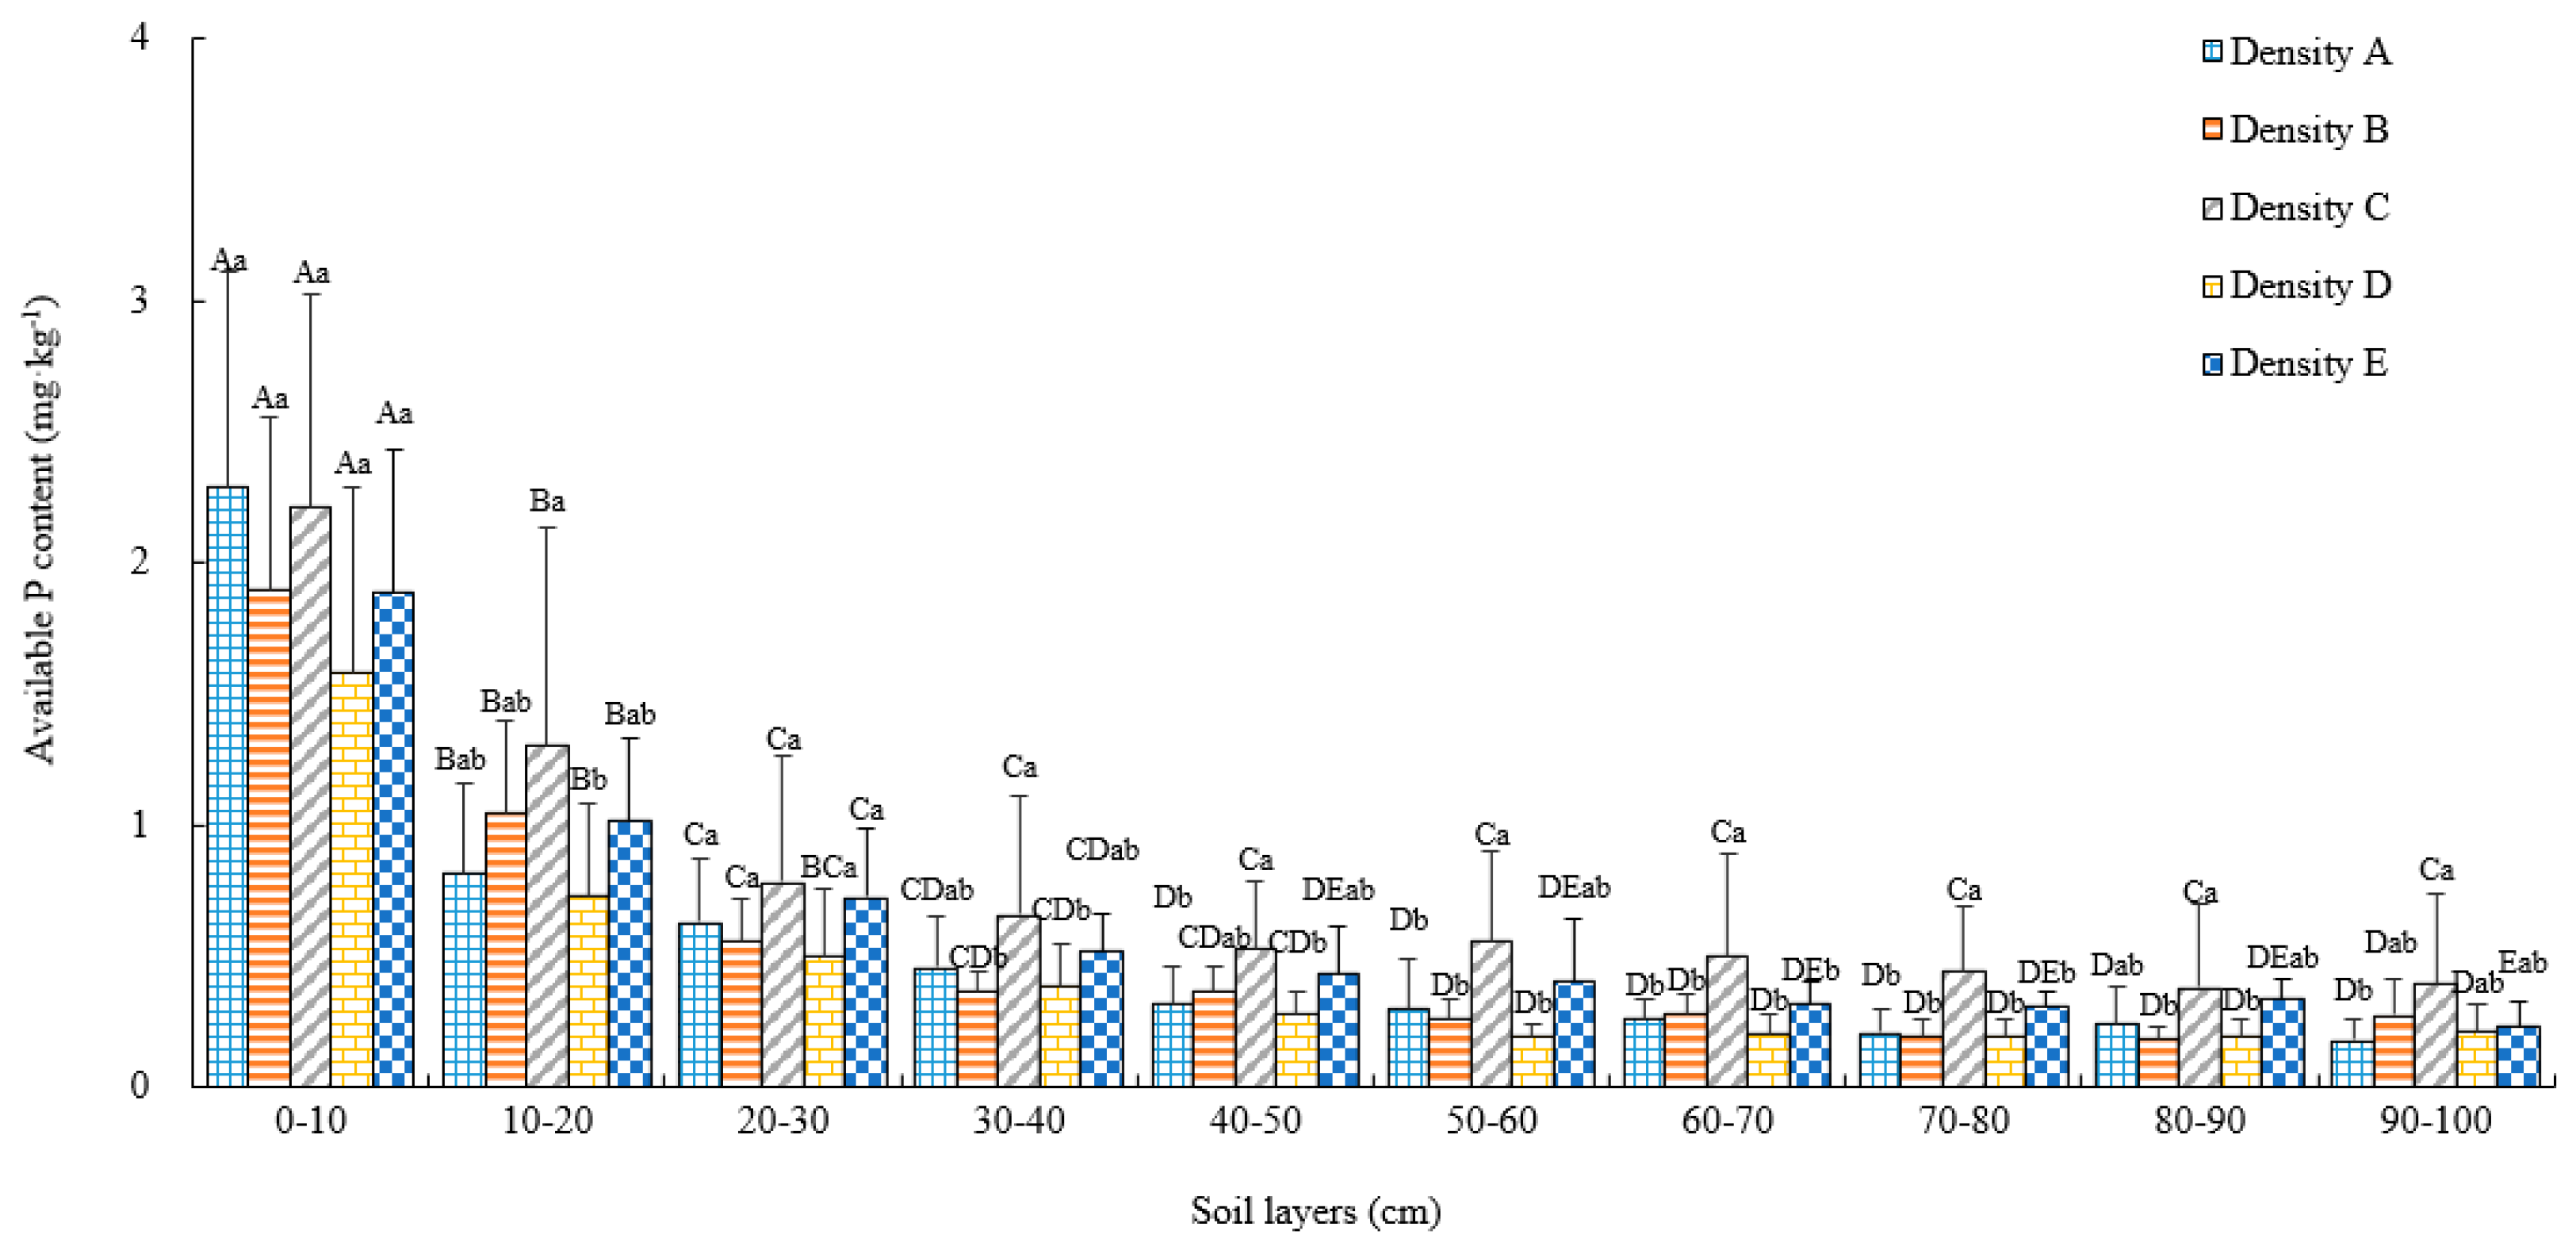
3.3.3. Total P and Available P

Figure 5 and Figure 6 shows that no significant difference between A and B density stands existed in the total P content in all soil layers, but their total P content was greater than that in the C, D, and E stands. Among C, D, and E stands, with a relatively higher density, the total P content in the D-density stand was higher than in C and E density stands, and the difference reached a significant level in 10–20 cm soil layer (p < 0.05). Different from total P content, the available P content in 10–100 cm soil layers in the C density stand was higher than in A, B, D, and E stands, and the content difference was at a significant level in some layers (p < 0.05). Instead, among C, D, and E stands with a relatively higher density, the available P content in D density stand was obviously lower than that in C and E stands.
The total P content decreases with the increase in soil depth. The total P content the in 0–10 cm soil layer was higher than in the soil layers below 10 cm in all five stands. The content became a significant level in A planting density (p < 0.05), and changed a little in the 10–100 cm soil layer, with an insignificant difference. In B, C, D, and E planting densities, the available P content in the 0–10 cm soil layer was significantly higher than in the soil layers below 30 cm (p < 0.05). In the 0–30 cm soil layer, the available P level was higher than that in the soil layers below 30 cm. The available P content decreased gradually with the increase in soil depth. This decreasing trend was even more remarkable against the total P level in the 0–30 cm top soil, and declined dramatically in 0–10 and 10–20 cm soil layers. The difference in available P contents in 0–10, 10–20, and 20–30 cm soil layers was significant in all five stands (p < 0.05). The available P content in the 30–40 cm soil layer and below did not reach a significant level.

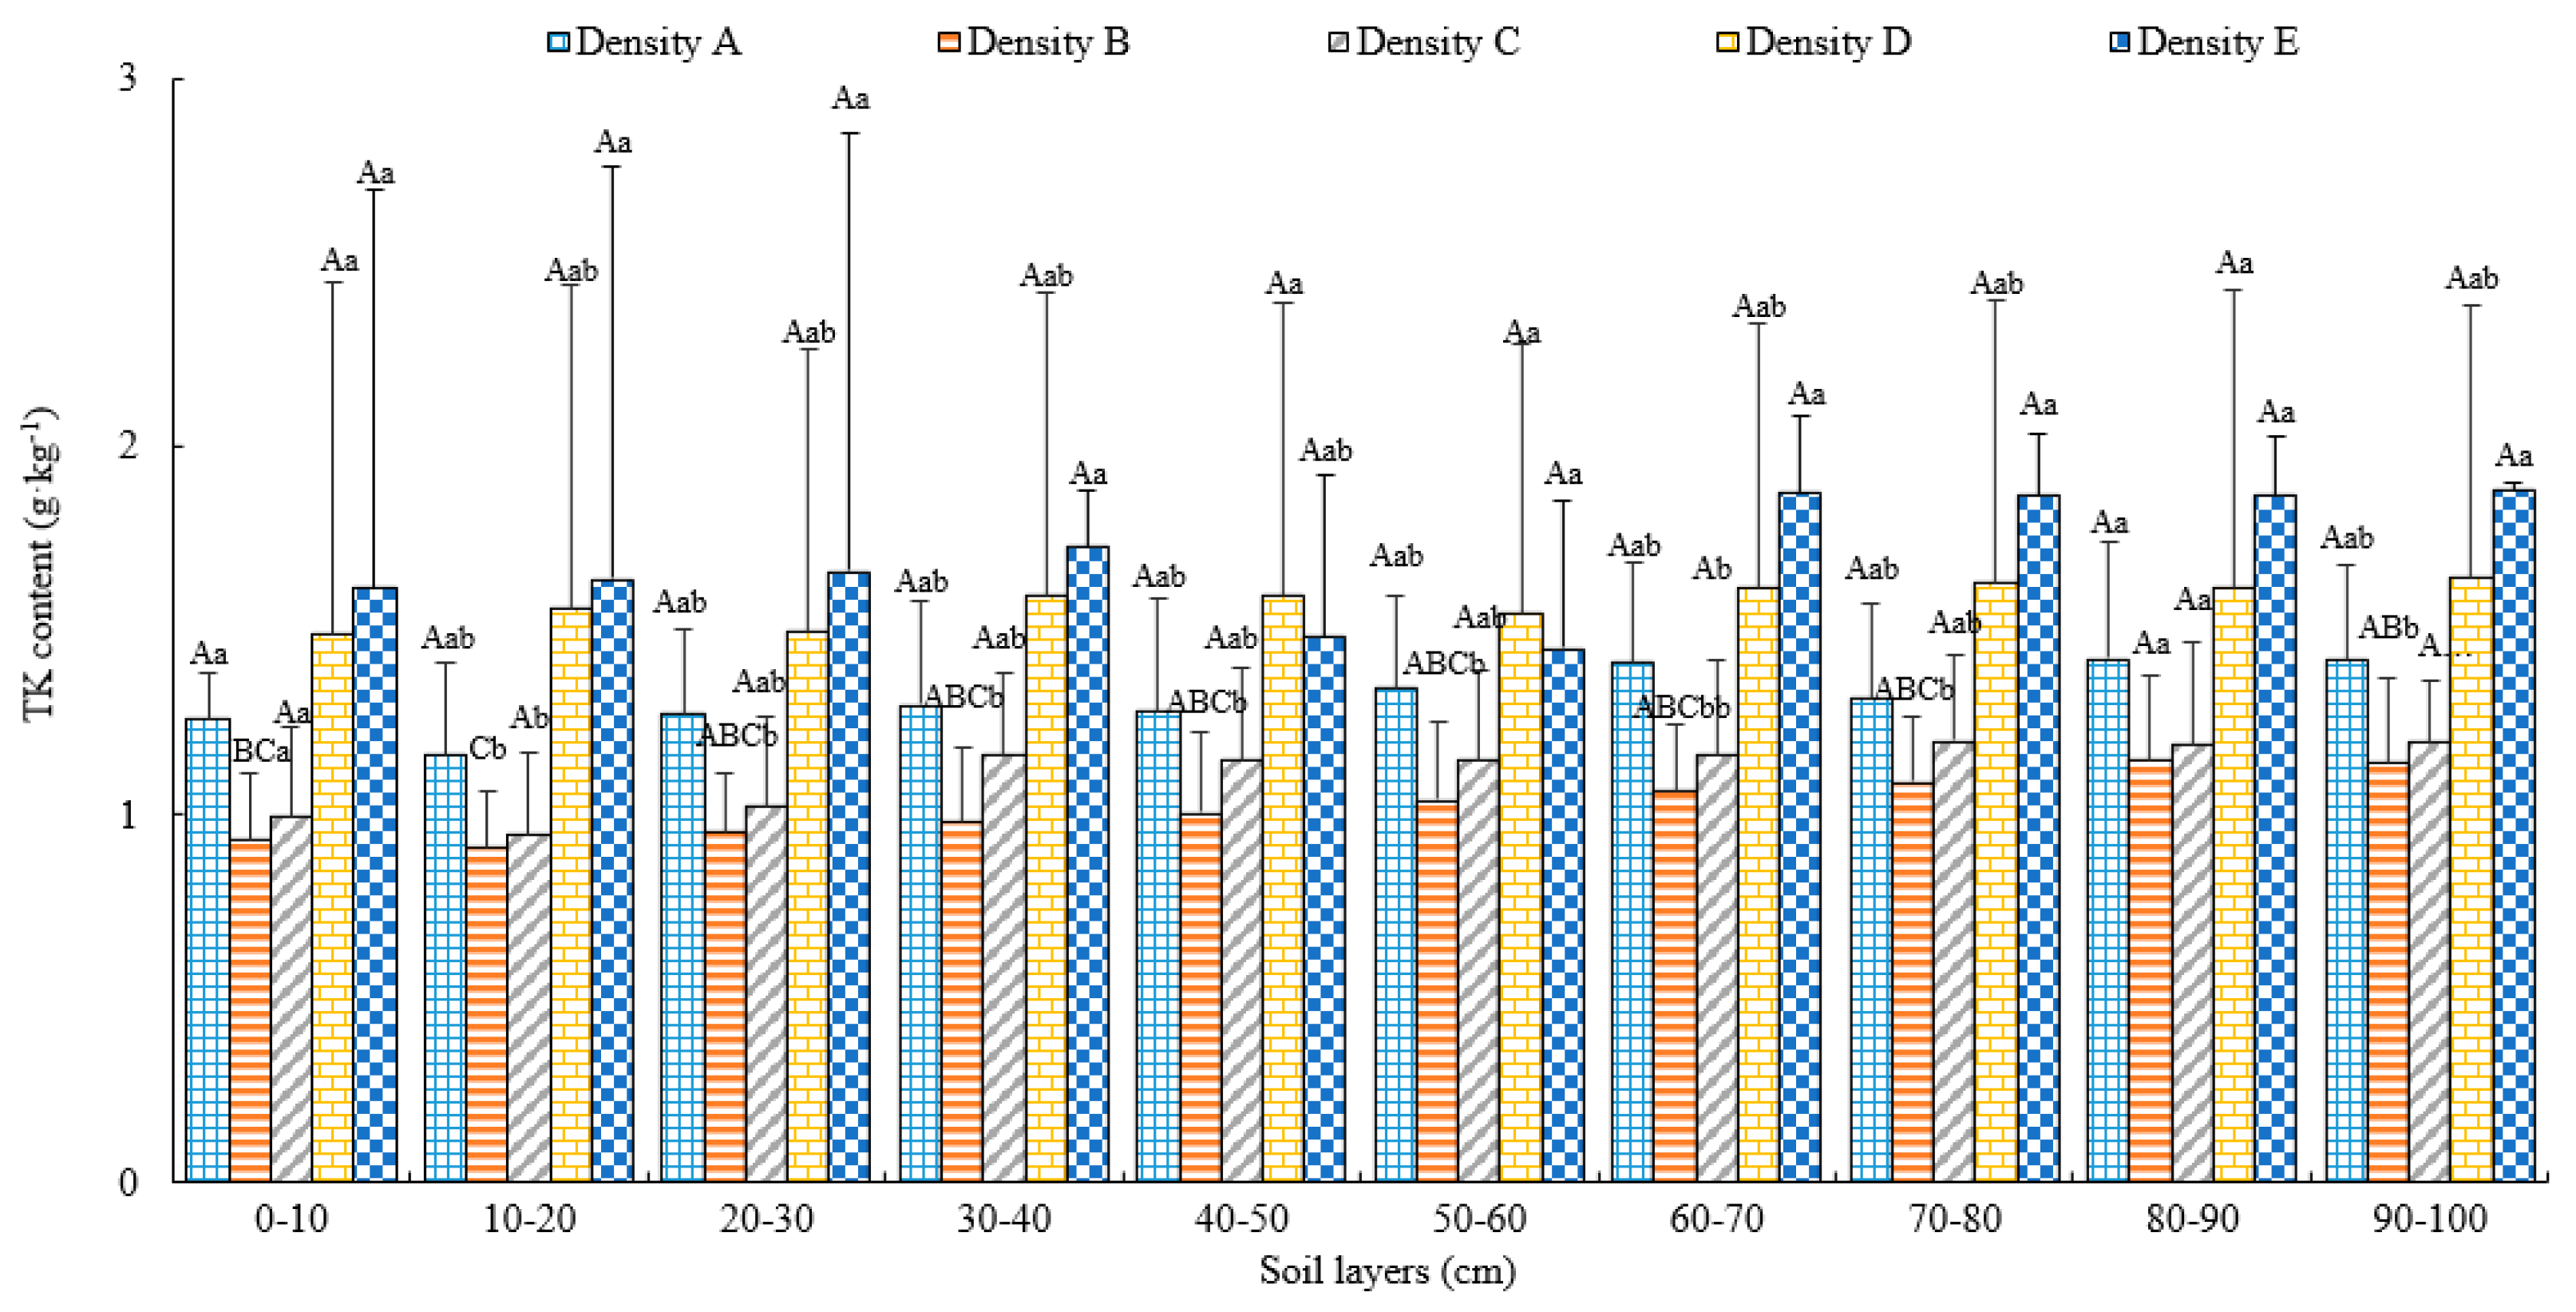
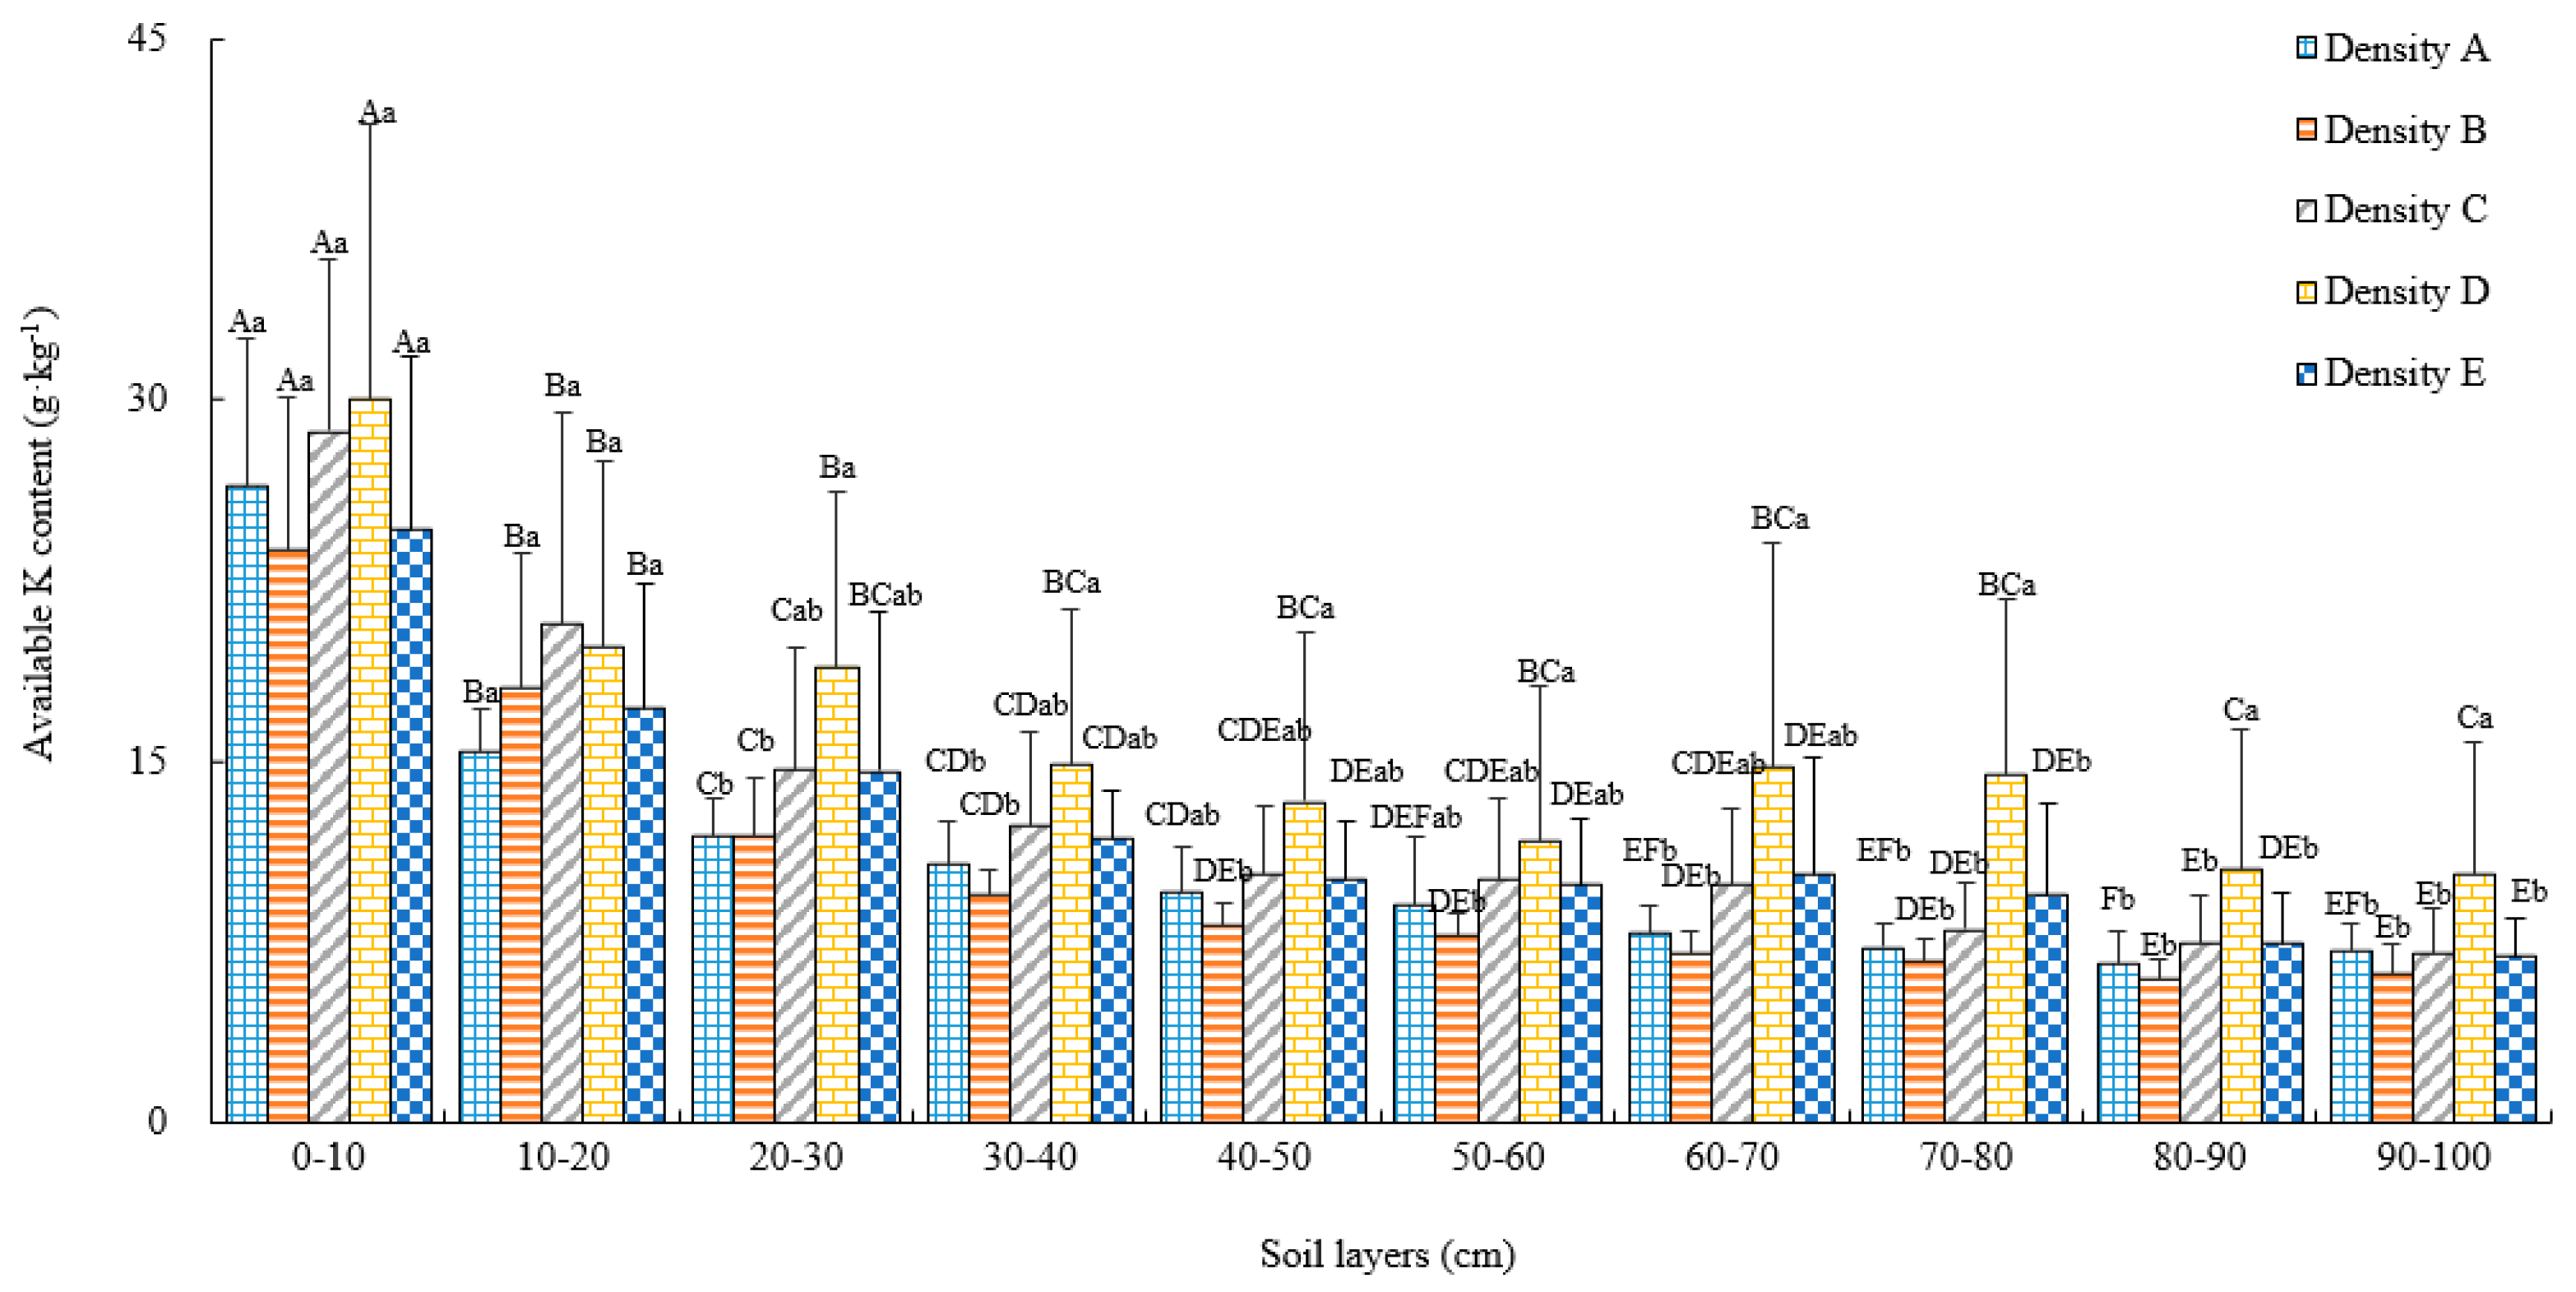
3.3.4. Total K and Available K

Figure 7 and Figure 8 show that, besides the 40–50 and 50–60 cm soil layers, the total K content in all soil layers tends to decrease first and then increase with the increase in. The total K content in D and E stands was higher than in the other density stands; the content in the B density stand was the lowest, and highest in the E stand. The total K content in the 10–20, 20–30, 30–40, 40–50, 60–70, 70–80, and 90–100 cm soil layers in the E stand was significantly higher than in the B stand (p < 0.05). This indicates that high-density stands are beneficial to the accumulation of soil total K.
The available K content in soil tended to increase first and then decrease with the increase in density. The D stand had the highest soil available K content, and the available K content in the 20–30 cm soil layer and below was significantly higher than in A or B stands (p < 0.05). In the 70–80 and 80–90 cm soil layers, the available K content in the D density stand was significantly higher than that in the other four stands (p < 0.05). Different than total K content, the available K content decreased obviously in the E stand compared with the D stand, but was still higher than that in the A and B stands.
The total K content in the five stands tended to increase slowly, but did not present a significant difference in the five different stands. The available K content tended to decrease obviously with the increase in soil depth, where the available K content in the 0–30 cm soil layer decreased faster, but decreasing sharply from the 0–10 and 10–20 cm soil layers. The variance analysis indicated that the available K content in the 0–10 cm soil layer was significantly higher than in the 10–20 cm soil layer in the five densities (p < 0.05). The available K content in the 10–20 cm soil layer in the A, B, and C density was significantly higher than in the 20–30 cm soil layer and below (p < 0.05).
The available K content varied differently with the soil depth in the different stands. There was no significant difference in available K content in the 50–100 cm soil layer in the A stand, which was also observed for the content in the 40–100 cm soil layer in the B and C stands. However, in the D and E stands, this phenomenon occurred within 30–100 cm, indicating the available K content was relatively stable in the relatively high planting density stand.

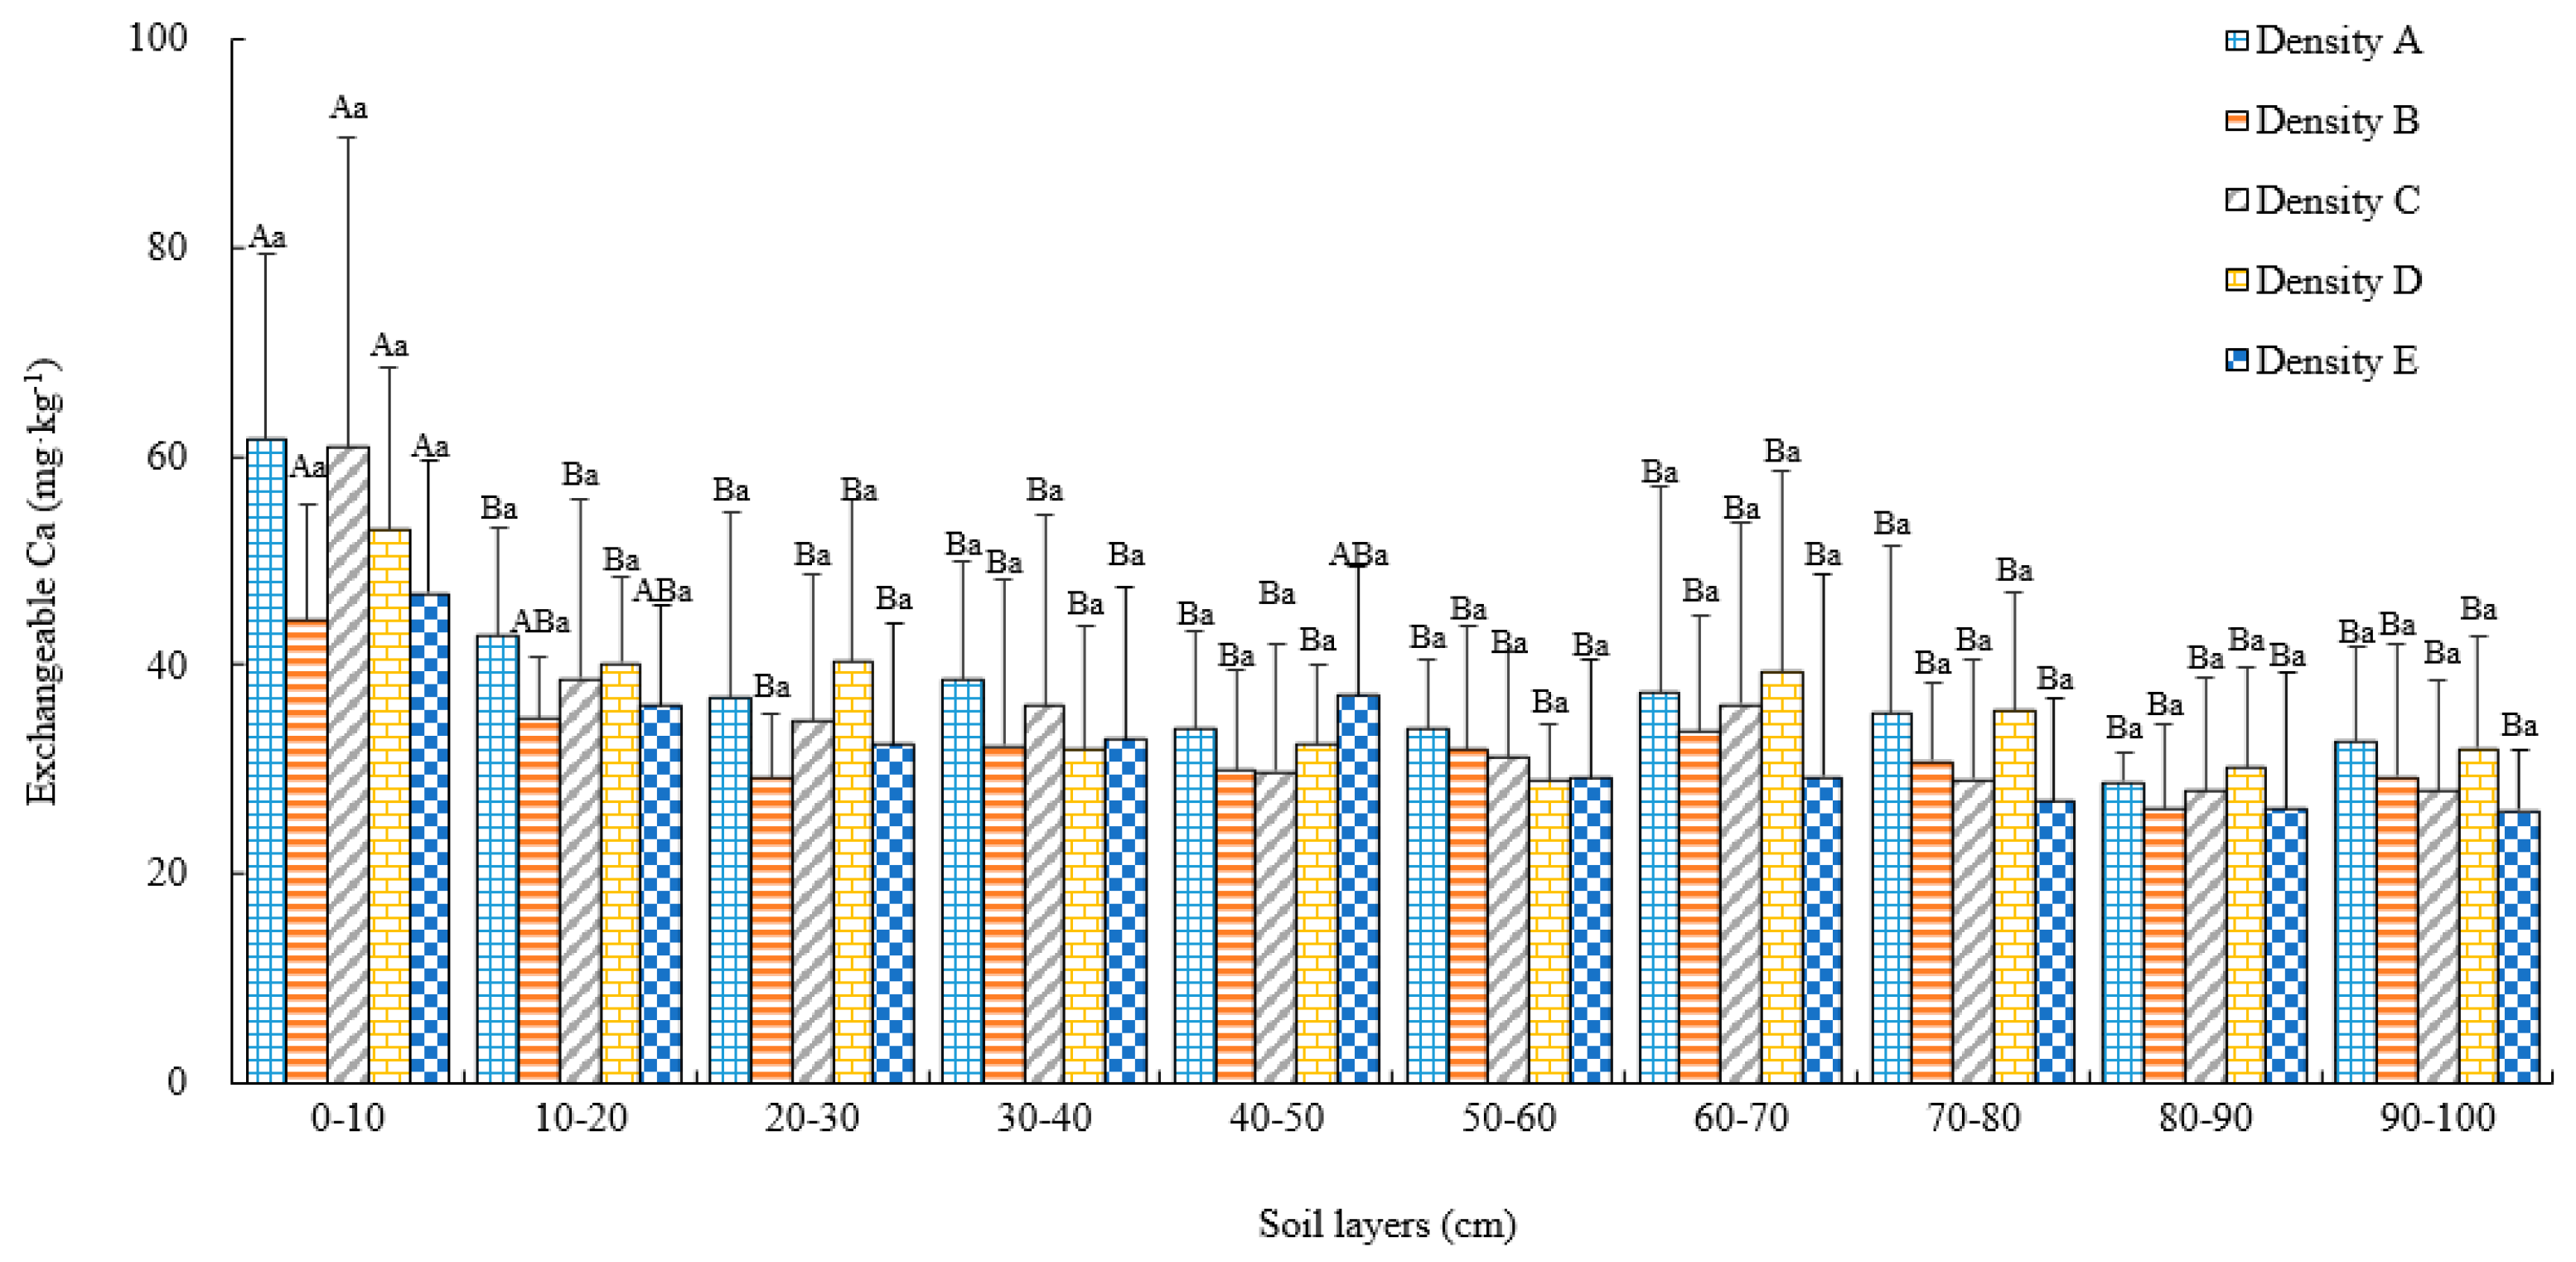
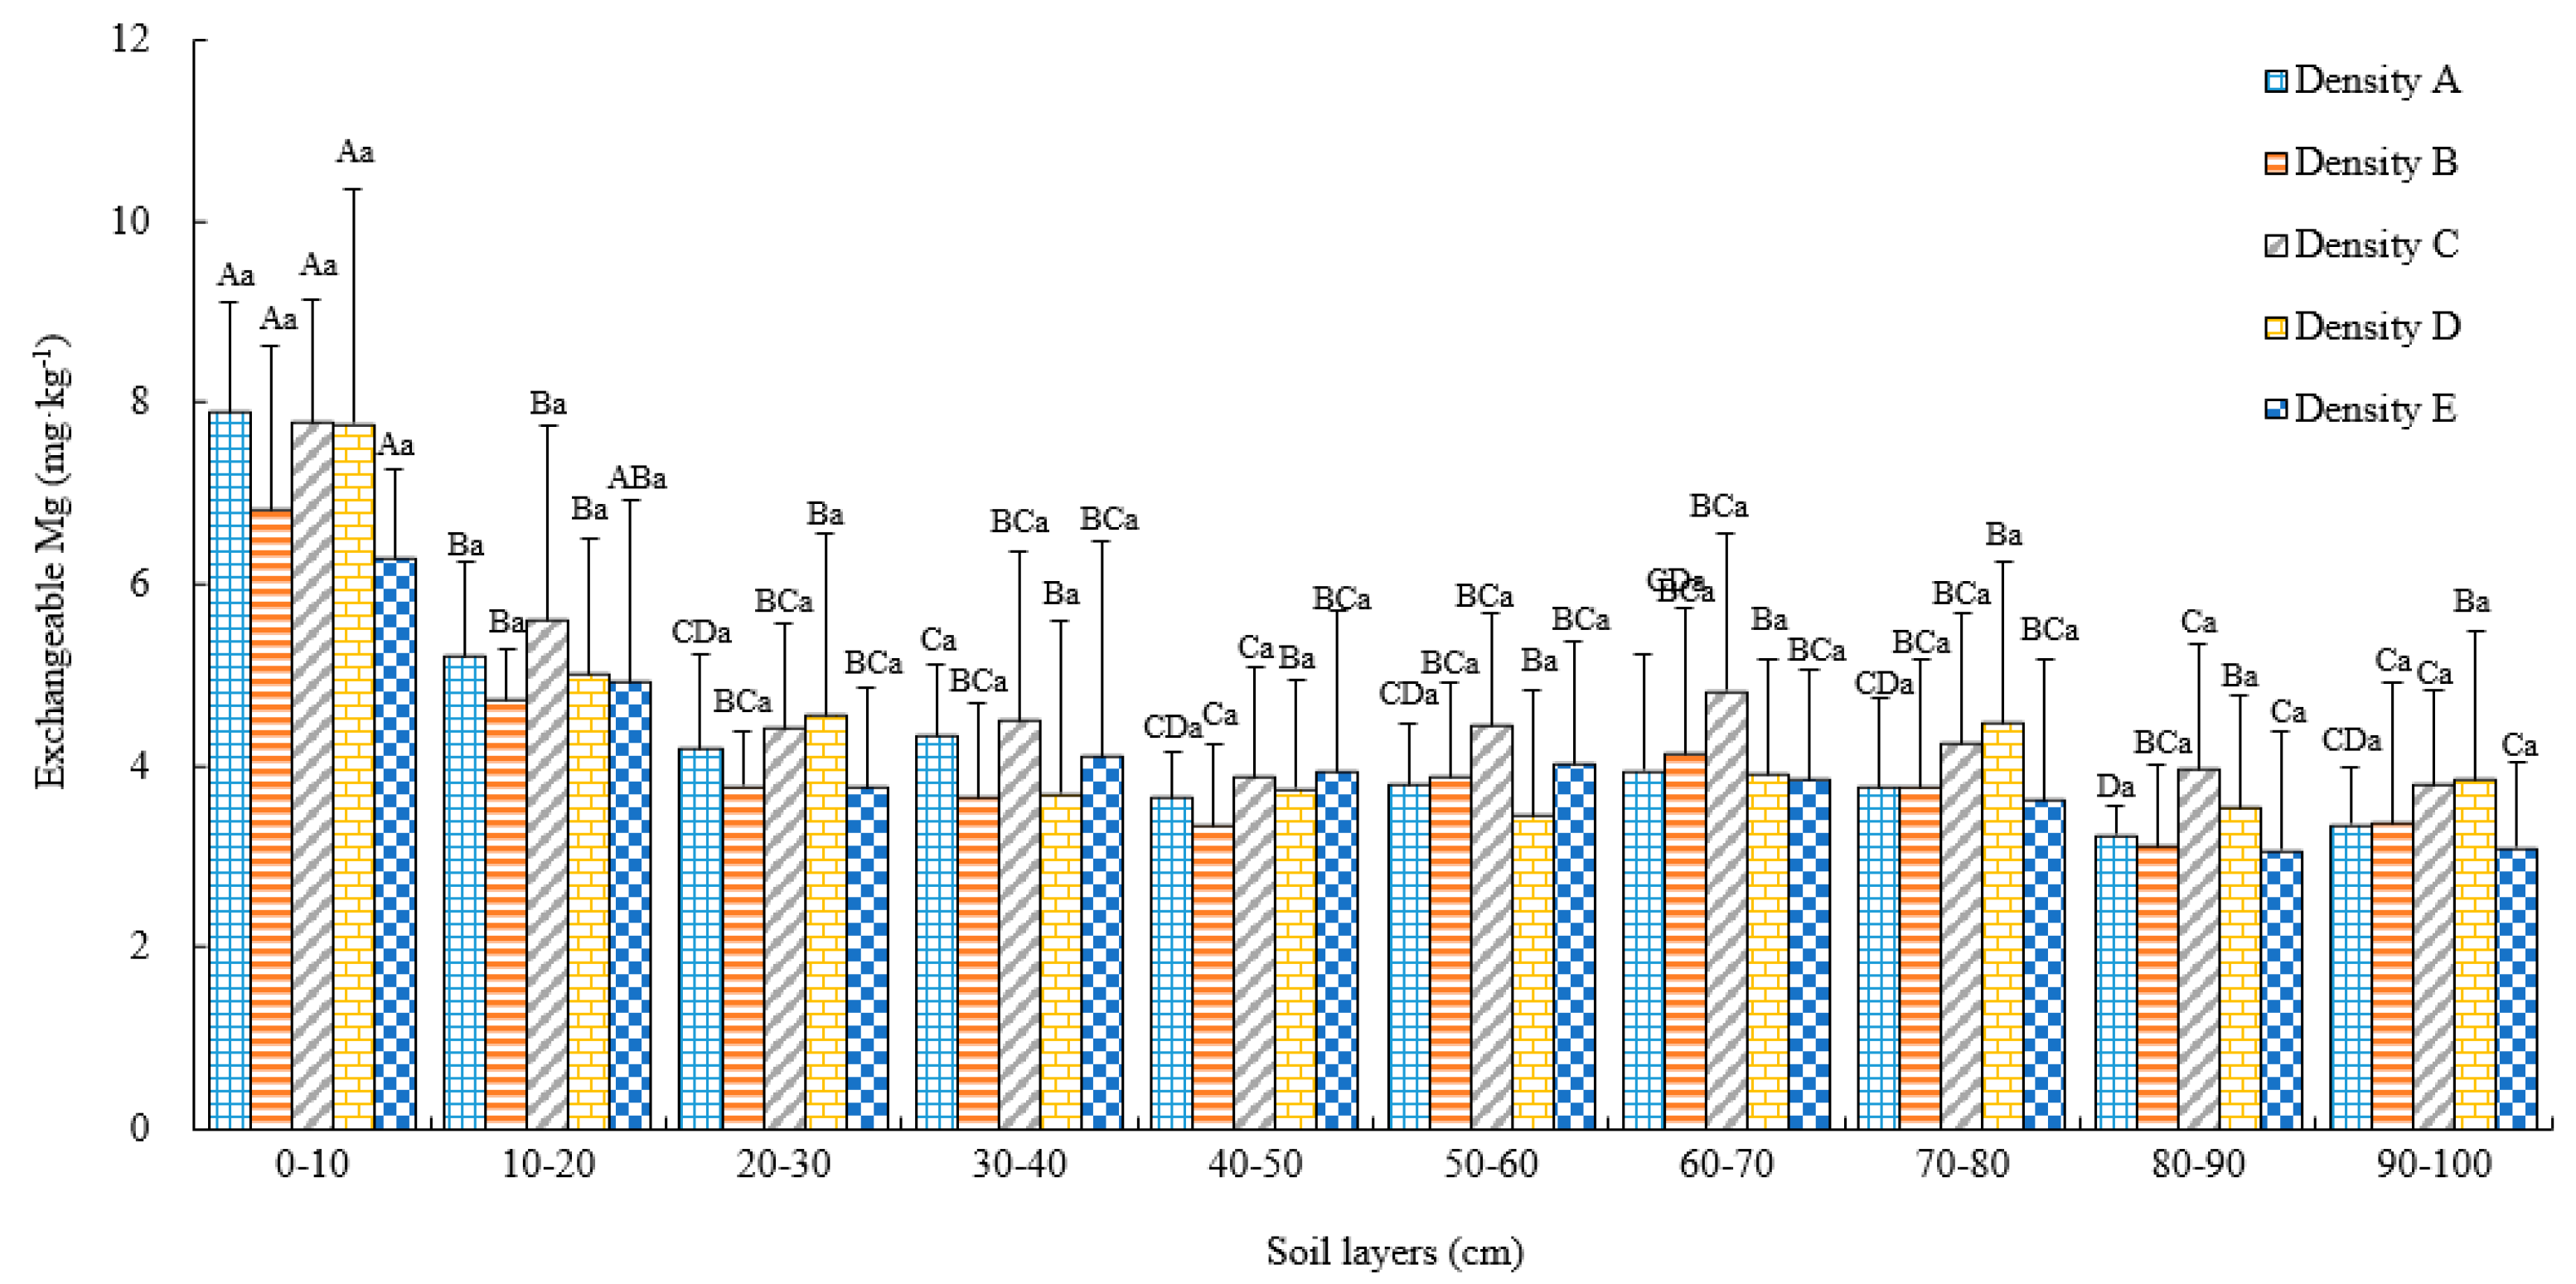
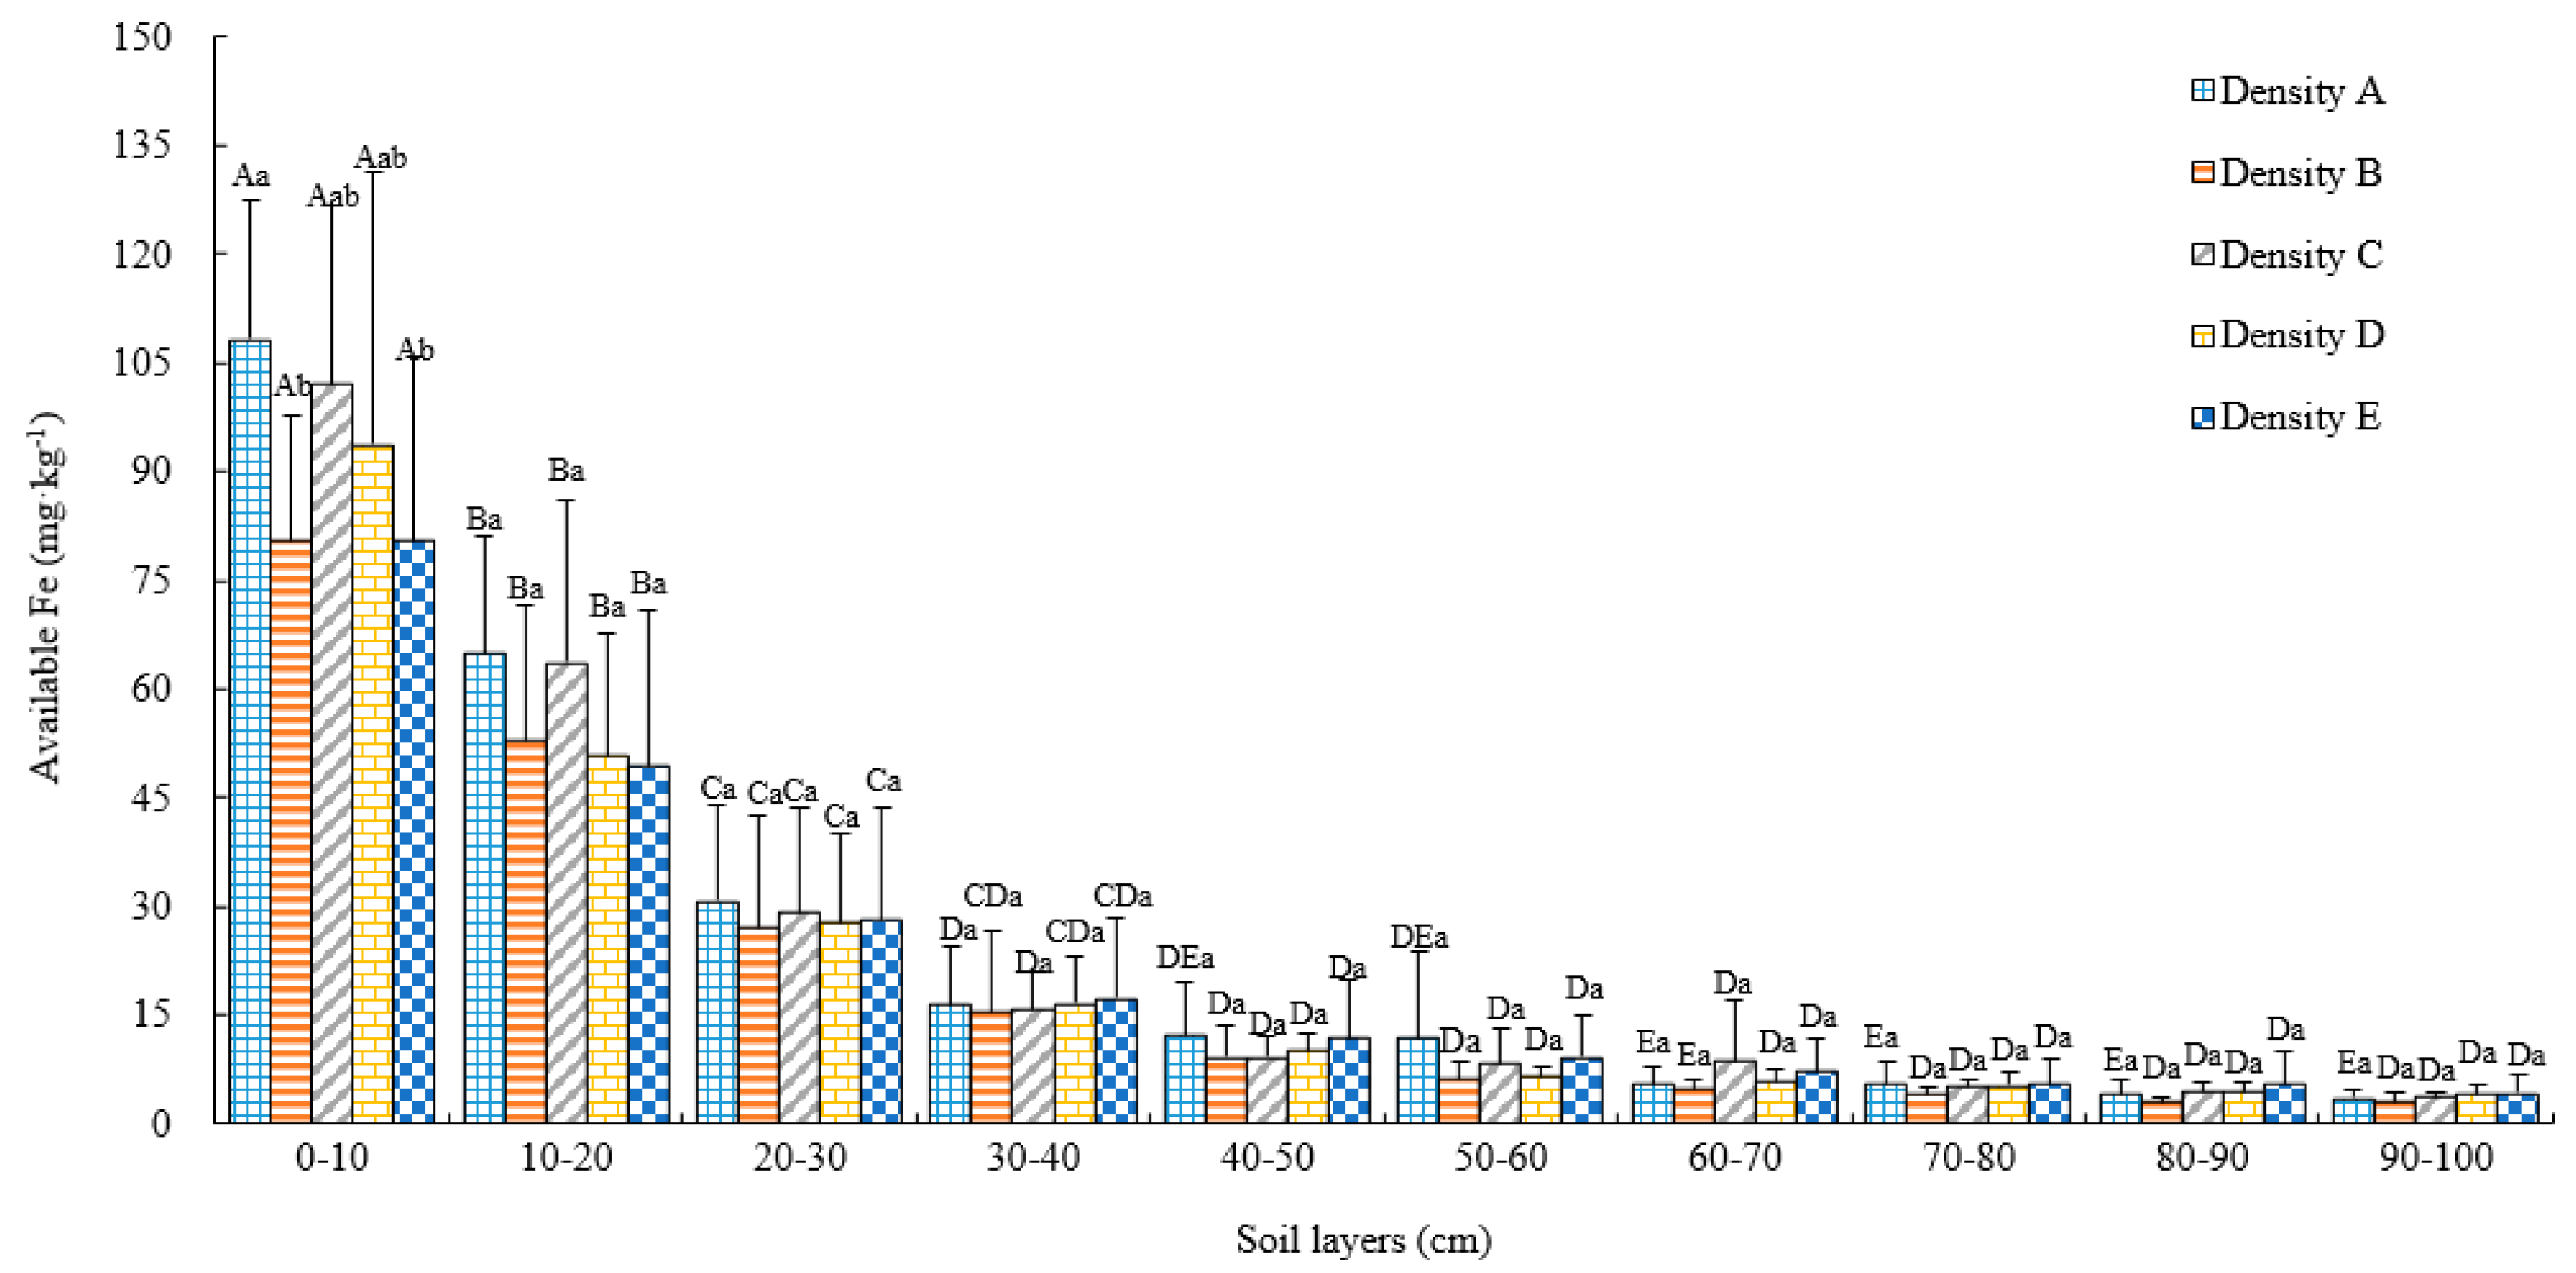
3.3.5. Ca, Mg, and Fe

Figure 9 and Figure 10 show that a certain difference was observed in exchangeable Ca and Mg content in soil layers for different stand densities. The variability in exchangeable Ca and Mg content among stand densities in the 0–10 cm soil layer was clearly higher than in the 10–20 cm soil layer and below, and the exchangeable Ca content in the 0–30 cm soil layer in the B stand was lower than in the other four stand densities. However, the variance analysis results showed the effect of density on all soil layers was not significant. Both exchangeable Ca and Mg contents decreased gradually with the increase in soil depth, but decreased sharply in the 0–10 and 10–20 cm soil layers. The exchangeable Ca and Mg contents in the 0–10 cm soil layer were significantly higher than in the 10–20 cm soil layer and below (p < 0.05). However, there was no significant difference in exchangeable Ca content in the 10–20 cm soil layer and below for different soil layer depths.
Figure 11 shows that the available Fe content in the 0–30 cm soil layer in A and C stand densities was higher than that in B, D, and E stands, and there was a significant difference in available Fe in the 0–10 cm soil layer in all five stands, but the difference in the available Fe was not significant in the 10–20 cm soil layer and below for different stand densities. Compared with exchangeable Ca and Mg, the available Fe coTABLEntent decreased more obviously with the increase in soil depth, and the content in the 0–40 cm soil layer decreased sharply in all five stand densities. The available Fe content decreased significantly in succession in the 0–10, 10–20 and 20–30 cm soil layers from top to bottom (p < 0.05), and the content within 0–30 cm was significantly higher than in the 30–40 cm soil layer and below in the A and C stands (p < 0.05). The difference in the available Fe content in the 40–50 cm soil layer and below was not significant in the five stands. In terms of the amount of decrease, the available Fe content in the 60–100 cm soil layer was 20 to 30 lower compared with the 0–10 cm soil layer.

3.4. Correlation Analysis Among Soil pH, Bulk Density, and Nutrients

Table 4 provides the correlation analysis results of soil bulk density, pH, and nutrient elements. Soil bulk density has a highly significantly positive correlation with soil pH, indicating that soil pH increases with soil bulk density. The soil bulk density has a highly significant negative correlation with organic matter, organic C, total N, alkali-hydrolyzable N, available P, exchangeable Ca, exchangeable Mg, and available Fe in soil, and also a highly significantly negative correlation with available K in soil, but no significant correlation with total K.
A highly significant positive correlation exists between any two of the nutrients, such as organic matter, total N, total P, alkali-hydrolyzable N, available P, exchangeable Ca and Mg, and available Fe in soil. The correlation coefficient was 0.7 or higher between organic matter and total N, alkali-hydrolyzable N, available N, available K and available Fe, larger than the correlation coefficient of organic matter with total P and exchangeable Ca and Mg. Total K has a highly significant negative correlation with organic matter, total N, alkali-hydrolyzable N, available P, and available Fe, but a significant positive correlation with total P, available K, and exchangeable Ca.

4. Discussion

Soil nutrients are important for the establishment of profitable timber plantation stands. Unfortunately, most tropical soils have low levels of nutrient reserves and low nutrient retention ability for some elements such as C, N, and P [48]. The southern subtropical region is one of the main timber production districts for Chinese fir. Good cultivation measures are needed to best maintain soil fertility while ensuring high yield.
The findings showed that soil bulk density in the 0–10 cm soil layer were influenced by stand planting density. The increase in soil bulk density, found in D and E stands in comparison with A, B and C stands (with the relatively low planting density), clearly suggest the direct effect of planting density on soil compaction. Some studies have found the silvicultural treatment and its disturbance strength could increase soil compaction [49,50]. The overall consequences of soil compaction, is a decrease of soil permeability, growth and nutrient supply of root systems.
The site soil of sandy texture is formed from granite, which is classified as red soil in Chinese soil classification. It is highly acidic at a soil pH of 3.5–4.0 (Table 2), which is lower than the most suitable soil pH for Chinese fir stands of 4.5–6.5 [44]. The pH increases with the increase in stand density and soil depth. This might be because the litter decomposes rapidly to produce plenty of acidic matter, gathering in the top soil at relatively low density with more suitable sunlight and temperature conditions [51].
Soil organic matter is the repository providing nutrients for the growth and development of plants. Its content is closely related to the soil fertility level and is one of important indices used to evaluate soil nutrients. The organic matter content is higher in A and B stands than the other stands in the topsoil. This increase in soil organic matter in the low-density stands can be linked to the fact that the organic matter content in forest soil mainly depends on and originated from aboveground litter and the biomass of the vegetation in the forest [36,44,46]. Based on our survey of understory vegetation in sample sites, abundant herbal and bush plants live in the low-density A and B stands, with an understory vegetation biomass of 9.76–13.56 t·hm−2 and good light-admission (Table 1). In a low-density environment, animal, microorganism, and enzyme activities in soil increase, and litter decomposes rapidly, which can significantly improve soil fertility, especially in surface soil [23].
The total N in soil is mostly sourced from organic matter, and it has the same changing trend as organic matter: they decrease with the increase in planting density. Alkali-hydrolyzable N, total P, and available P contents decrease with the increase in stand density in the 0–10 cm soil layer, which may be related to the kind and coverage of understory vegetation [44]. Studies on Chinese fir and Masson pine had showed that the amounts of these nutrients in low-density stands are greater than in middle- and high-density stands [52,53]. At a lower tree density, the concentrations of nitrate, sulphur, nitrogen and general carbon ions in the soil were found to be higher [54]. The P deficiency in acidic soil becomes a main factor restricting the growth of Chinese fir stands [44]. In this sense, low-density afforestation is important for phosphorus maintenance and phosphorus availability [40,48]. Both total K and available K contents change irregularly with the increase in stand density. The maximum value of the total K content was found in the E stand, whereas the maximum value of available K content was observed in the D stand. The total N, alkali-hydolyzable N, available P, and available K contents in soil decreased significantly with the increase in soil depth. However, the soil total K content changed differently, increasing with the increase in soil depth, which may be related to the soil parent rock. Our results are similar to the results of research on the soil layer effect of soil nutrients in artificial Eucalyptus grandis W. Hill ex Maiden forest of different ages [55]. The total P content remained unchanged in different soil depths because of the minimal phosphorus mobility after leaching down the soil profile [56].
Compared with the macro elements, information about the effects of forest management measures on Ca, Mg, and Fe is lacking [54]. Exchangeable Ca and available Fe in soil reached the highest level in the A stand density. The content of Ca, Mg, and Fe displayed an obvious decreasing trend with the increase in soil depth. As the nutrient elements after decomposition gather along the soil surface, the nutrient content in the 0–10 cm soil layer is significantly higher than in the other soil layers.
The planting density was confirmed to have a significant impact on the chemical composition, especially in the top soil layer. At a lower planting density, the concentrations of organic matter, total N, alkali-hydrolyzable N, total P, and available Fe in the soil were higher, and, by contrast, the pH value and bulk density were lower. A similar result was reported when studying the relationship between planting density and selected elements of the chemical composition of the top soil layer in a 30-year-old Scots pine stand [54]. The proper reduction of stand density by intermediate cuttings could maintain soil fertility [57] and improve the growing environment of the stands [58]. Too high a stand density might lead to decreased understory growth as well as a significant decrease in soil organic matter, total N, total P, hydrolyzable N, and available P [10,59]. Compared with the results from another planting density test forest of Chinese fir in Shaowu county [39], the contents of soil organic matter, total N, available N, available P, available K, and pH in this study (Pingxiang county) were all lower than corresponding indices in Shaowu county (Figure 12), which is consistent with the fact that the timber productivity of Chinese fir stands in Pingxiang county in the southern subtropical zone is lower than in Shaowu county in the mid-subtropical zone [60]. The positive correlation of pH, bulk density, and available K with planting densities of Chinese fir plantations in Pingxiang county is consistent with that in Shaowu county. Contrary to the positive correlation in Shaowu county, the relativities between available N, available P, available K, and planting densities are negative in Pingxiang county, which may be caused by the climate difference, and shows that the effects of planting density on soil nutrients are different under different climate conditions.

5. Conclusions

Planting density has a significant impact on the soil chemical composition, especially in the top soil layer. Chinese fir stands with a lower planting density have higher concentrations of organic matter, total N, alkali-hydrolyzable N, total P, and available Fe, and lower pH and bulk density after 36 years of natural growth. An excessively high planting density is not beneficial for the long-term maintenance of soil fertility in Chinese fir plantations. The planting density of Chinese fir plantations should be controlled below 3333 stems·ha−1 (A or B density) to maintain soil fertility while ensuring high-yield and high-quality stands, and a long rotation period must be considered to promote nutrient return. Because the contents of organic matter, total N, alkali-hydrolyzable N, total P, available P, available K, exchangeable Ca and Mg, and available Fe decrease significantly with the increase in soil depth in the 0–30 cm soil layer, a soil layer at least 40 cm thick should be studied to determine exactly the variation in soil nutrients along the soil profile in southern subtropical Chinese fir plantations. Our results suggest that the lower planting density in southern China will be beneficial to the improvement of soil physical property and minimize soil nutrients losses, which should help sustain the long-term productivity of forests in this region.

Author Contributions

Conceptualization, A.D. and J.Z.; Methodology, A.D; Software, A.D. and X.H.; Validation, A.D., J.L., and X.H.; Formal Analysis, A.D. and J.L.; Investigation, A.D., H.D., X.H., X.Z., J.S., and W.G.; Resources, A.D. and J.Z.; Data Curation, A.D.; Writing-Original Draft Preparation, A.D. and X.H.; Writing-Review & Editing, A.D.; Visualization, A.D.; Supervision, A.D.; Project Administration, A.D.; Funding Acquisition, J.Z.

Funding

This work was supported by the National Natural Science Foundation of China (No. 31570619); the National Scientific and Technological Task in China (No. 2015BAD09B0101, 2016YFD0600302); The special science and technology innovation in Jiangxi Province (No. 201702).

Acknowledgments

We thank H.H. Chen, J.L. Wei, and S.Z. Tong for their assistance with the experiments.

Conflicts of Interest

The authors declare no conflict of interest.

References

  1. SFA. Reports of Chinese Forestry Resource: The 8th National Forest Resource Inventory; Chinese Forestry Publishing House: Beijing, China, 2013; p. 16. [Google Scholar]
  2. Wang, S.L.; Zhang, W.D.; Sanchez, F. Relating net primary productivity to soil organic matter decomposition rates in pure and mixed Chinese fir plantations. Plant Soil 2010, 334, 501–510. [Google Scholar] [CrossRef]
  3. Tian, D.L.; Xiang, W.H.; Chen, X.Y.; Yan, W.D.; Fang, X.; Kang, W.X.; Dan, X.W.; Peng, C.H.; Peng, Y.Y. A long-term evaluation of biomass production in first and second rotations of Chinese fir plantations at the same site. Forestry 2011, 84, 411–418. [Google Scholar] [CrossRef] [Green Version]
  4. Zhang, W.D.; Wang, S.L. Effects of NH4+ and NO3 on litter and soil organic carbon decomposition in a Chinese fir plantation forest in South China. Soil Biol. Biochem. 2012, 47, 116–122. [Google Scholar] [CrossRef]
  5. Sheng, W.T.; Yang, C.D.; Fan, S.H. Variation of Soil Properties of Chinese Fir plantation. For. Res. 2003, 4, 4–12. [Google Scholar]
  6. Sheng, W.T.; Fan, S.H. Impact of Growth and Development Characters of Chinese Fir and Its Plantation on the Long Term Site Productivity. For. Res. 2002, 6, 629–636. [Google Scholar]
  7. Hu, Y.L.; Sun, X.Y.; Zhang, J.G. Changes of Soil Nutrients in Chinese Fir Plantations. J. Hebei For. Sci. Technol. 2007, 1, 9–11. [Google Scholar]
  8. Liao, L.P.; Gao, H.; Wang, S.L.; Ma, Y.Q.; Huang, Z.Q.; Yu, X.J. The Effect of nitrogen addition on soil nutrient leaching and the decomposition of Chinese fir leaf Litter. Acta Phytoecol. Sin. 2000, 1, 34–39. [Google Scholar]
  9. Wan, F.X.; Yang, D. Studies on trees growth and soil fertility characters of mixed stand of Chinese fir and Poplar. J. Nanjing For. Univ. 2006, 2, 43–46. [Google Scholar]
  10. Sheng, W.T. A Study on Stand Density Management and Long Term Productive of Chinese Fir (Cunninghamia lanceolata) Plantation. Sci. Silvae Sin. 2001, 5, 2–9. [Google Scholar]
  11. Yanai, R.D.; Currie, W.S.; Goodale, C.L. Soil carbon dynamics following forest harvest: An ecosystem paradigm reconsidered. Ecosystems 2003, 6, 197–212. [Google Scholar] [CrossRef]
  12. Knoepp, J.D.; Swank, W.T. Forest management effects on surface soil carbon and nitrogen. Soil Sci. Soc. Am. J. 1997, 61, 928–935. [Google Scholar] [CrossRef]
  13. Grigal, D.F. Effects of extensive forest management on soil productivity. For. Ecol. Manag. 2000, 138, 167–185. [Google Scholar] [CrossRef]
  14. Johnson, D.W.; Curtis, P.S. Effects of forest management on soil C and N storage: Meta analysis. For. Ecol. Manag. 2001, 140, 227–238. [Google Scholar] [CrossRef]
  15. Yu, Y.C.; Deng, X.H.; Sheng, W.T. Effects of Continuous Plantation of Chinese fir on Soil Physical Properties. J. Nanjing For. Univ. 2000, 6, 36–40. [Google Scholar]
  16. Lv, L.X. Reasons for the Decline of Soil Fertility in Chinese Fir Plantation and Ways to Maintain Soil Fertility. Guang Dong Sci. Technol. 2011, 24, 76–77. [Google Scholar]
  17. Wang, D.; Wang, Y.P.; Chen, X.L. Seasonal Dynamics of Soil Physical and Chemical Properties after Thinning for 7 Years in Chinese Fir Plantation. Res. Soil Water Conserv. 2015, 2, 69–73. [Google Scholar]
  18. Zhao, Z.H.; Fang, X.; Tian, D.L.; Xiang, W.H. Effects of thinning on biomass of under-story, soil physical and chemical properties in Cunninghamia lanceolata plantation. J. Cent. South. Univ. For. Technol. 2012, 32, 102–107. [Google Scholar]
  19. Guo, Q.; Wang, X.J.; Yi, X.D. Correlation of Understory Biomass and Soil under Cunninghamia lanceolate Pure Forest of Different Age. J. Northeast. For. Univ. 2014, 3, 85–88. [Google Scholar]
  20. Su, M.R.; Zhang, W.Q.; Xian, W.G.; Tang, H.; Yin, Z.; Chen, W.; Xiongjian, X.U.; Pan, L. Physical and Chemical Characteristics of Soil of Cunninghamia lanceolata Conifer-broadleaved Mixed Forest with Different Age. Guangdong For. Sci. Technol. 2014, 5, 43–47. [Google Scholar]
  21. Hu, Z.H.; He, Z.M.; Huang, Z.Q.; Fan, S.H.; Yu, Z.P.; Wang, M.H.; Zhou, X.H.; Fang, C.M. Effects of harvest residue management on soil carbon and nitrogen processes in a Chinese fir plantation. For. Ecol. Manag. 2014, 326, 163–170. [Google Scholar] [CrossRef]
  22. Fang, L.M. The Soil Nutrient Status of Chinese Fir Forest in Jiangle County, Fujian Province. J. Fujian For. Sci. Technol. 2016, 3, 138–143. [Google Scholar]
  23. Lin, K.M.; Yu, X.T.; Hong, W. Effects of Undergrowth Plant on Soil Fertility Chinese Fir Plantation. Sci. Silvae Sin. 2001, 37, 94–98. [Google Scholar]
  24. Wang, G. Index of Soil Fertility and Evacuation of Chinese Fir Plantation. Master’s Thesis, Nanjing Forestry University, Nanjing, China, June 2008. [Google Scholar]
  25. Powers, M.D.; Palik, B.J.; Bradford, J.B.; Fraver, S.; Webster, C.R. Thinning method and intensity influence long-term mortality trends in a red pine forest. For. Ecol. Manag. 2010, 260, 1138–1148. [Google Scholar] [CrossRef]
  26. Selig, M.F.; Seiler, J.R.; Tyree, M.C. Soil carbon and CO2 efflux as influenced by the thinning of loblolly pine (Pinus taeda L.) plantations on the Piedmont of Virginia. For. Sci. 2008, 54, 58–66. [Google Scholar]
  27. Chen, H.H. Effects of density regulation on undergrowth vegetation and soil fertility of Cunninghamia lanceolata plantation. Sci. Silvae Sin. 2017, 28, 88–90. [Google Scholar]
  28. Vesterdal, L.; Dalsgaard, M.; Felby, C.; Raulund-Rasmussen, K.; Jgrgensen, B.B. Effects of thinning and soil properties on accumulation of carbon, nitrogen and phosphorus in the forest floor of Norway spruce stands. For. Ecol. Manag. 1995, 77, 1–10. [Google Scholar] [CrossRef]
  29. Nilsen, P.; Strand, L.T. Thinning intensity effects on carbon and nitrogen stores and fluxes in a Norway spruce (Piceaabies (L.) Karst.) stand after 33 years. For. Ecol. Manag. 2008, 256, 201–208. [Google Scholar] [CrossRef]
  30. Nave, L.E.; Vance, E.D.; Swanston, C.W.; Curtis, P.S. Harvest impacts on soil carbon storage in temperate forests. For. Ecol. Manag. 2010, 259, 857–866. [Google Scholar] [CrossRef]
  31. Zhang, J.G.; Duan, A.G.; Sun, H.G.; Fu, L.H. Self-thinning and Growth Modelling for Even-aged Chinese Fir (Cunninghamia Lanceolata (Lamb.) Hook.) Stands; Science Press: Beijing, China, 2011. [Google Scholar]
  32. Zhao, R.D.; Fan, J.B.; He, Y.Q.; Song, C.L.; Tu, R.F.; Tan, B.C. Effects of stand density on soil nutrients and enzyme activity under Pinus massoniana forest. Soils 2012, 44, 297–301. [Google Scholar]
  33. Subedi, S.; Kane, M.; Zhao, D.; Borders, B.; Greene, D. Cultural intensity and planting density effects on aboveground biomass of 12-year-old loblolly pine trees in the Upper Coastal Plain and Piedmont of the southeastern United States. For. Ecol. Manag. 2012, 267, 157–162. [Google Scholar] [CrossRef]
  34. Sun, H.G.; Zhang, J.G.; Duan, A.G.; He, C.Y. Estimation of the self-thinning boundary line with ineven-aged Chinese fir (Cunninghamia lanceolata (Lamb.) Hook.) stands: Onset of self-thinning. For. Ecol. Manag. 2011, 261, 1010–1015. [Google Scholar] [CrossRef]
  35. Xiang, W.H.; Chai, H.X.; Tian, D.L.; Peng, C.H. Marginal effects of silvicultural treatments on soil nutrients following harvest in a Chinese fir plantation. Soil Sci. Plant Nutr. 2009, 55, 523–531. [Google Scholar] [CrossRef] [Green Version]
  36. Shao, Y.N.; Liu, Y.K.; Li, Y.H. Soil nutrient characteristics in Larix olgensisplantation with different stand densities. J. Cent. South. Univ. For. Technol. 2017, 37, 27–31. [Google Scholar]
  37. Loadesa, K.W.; Bengougha, A.C.; Bransbyb, M.F.; Hallett, P.D. Planting density influence on fibrous root reinforcement of soils. Ecol. Eng. 2010, 36, 276–284. [Google Scholar] [CrossRef]
  38. Goodfriend, W.L.; Olsen, M.W.; Frye, R.J. Soil microfloral and microfaunal response to Salicornia bigelovii planting density and soil residue amendment. Plant Soil 2000, 223, 23. [Google Scholar] [CrossRef]
  39. Wang, C.Q.; Xue, L.; Dong, Y.H.; Wei, Y.H.; Jiao, R.Z. Unravelling the Functional Diversity of the Soil Microbial Community of Chinese Fir Plantations of Different Densities. Forests 2018, 9, 532. [Google Scholar] [CrossRef]
  40. Lie, Z.Y.; Wang, Z.M.; Xue, L. Effect of density of Tephrosia candida stands on soil characteristics. Legume Res. 2017, 3, 551–555. [Google Scholar] [CrossRef]
  41. Yang, Y.; Liu, B.R.; Song, N.P. Effects of Artificial Caragana shrub density on spatial distribution of soil nutrients in desert steppe. Acta Prataculturae Sin. 2014, 5, 107–115. [Google Scholar]
  42. Powers, M.D.; Kolka, R.; Palik, B.; Tarpey, R.; Jurgensen, M. Long-term management impacts on carbon storage in Lake States forests. For. Ecol. Manag. 2011, 262, 424–431. [Google Scholar] [CrossRef]
  43. Akers, M.K.; Kane, M.; Zhao, D.; Teskey, R.O.; Daniels, R. Effects of planting density and cultural intensity on stand and crown attributes of mid-rotation loblolly pine plantations. For. Ecol. Manag. 2013, 310, 468–475. [Google Scholar] [CrossRef]
  44. Wu, Z.L. Chinese Fir; China Forestry Publishing House: Beijing, China, 1984. [Google Scholar]
  45. Nelson, D.W.; Sommers, L.E. Total carbon, organic carbon and organic matter. In Methods of Soil Analysis; Page, A.L., Miller, R.H., Keeney, D.R., Eds.; America Society of Agronomy: Madison, WI, USA, 1982; pp. 539–579. ISBN 0891188266. [Google Scholar]
  46. Venanzi, R.; Picchio, R.; Piovesan, G. Silvicultural and logging impact on soil characteristics in Chestnut (Castanea sativa Mill.) Mediterranean coppice. Ecol. Eng. 2016, 92, 82–89. [Google Scholar] [CrossRef]
  47. Bao, S.D. Soil Agrochemical Analysis, 3rd ed.; China Agriculture Press: Beijing, China, 2000; pp. 25–114. [Google Scholar]
  48. Tiarks, A.E.; Haywood, J.D. Site preparation and fertiliaation effects on growth of slash pine for two rotations. Soil Sci. Sot. Am. J. 1996, 60, 1654–1663. [Google Scholar] [CrossRef]
  49. Cambi, M.; Hoshika, Y.; Mariotti, B.; Paoletti, E.; Picchio, R.; Venanzi, R.; Marchi, E. Compaction by a forest machine affects soil quality and Quercus robur L. seedling performance in an experimental field. For. Ecol. Manag. 2017, 384, 406–414. [Google Scholar] [CrossRef]
  50. Cambi, M.; Paffetti, D.; Vettori, C.; Picchio, R.; Venanzi, R.; Marchi, E. Assessment of the impact of forest harvesting operations on the physical parameters and microbiological components on a Mediterranean sandy soil in an Italian stone pine stand. Eur. J. For. Res. 2017, 136, 205–215. [Google Scholar] [CrossRef]
  51. Wang, Y.; Wang, H.Y.; Xu, L.I.; Yang, X.J.; Liu, L. Soil physical and chemical characteristics of different depths in semi-natural mixed larch-spruce-fir at different stand densities. Pratacultural Sci. 2014, 8, 1424–1429. [Google Scholar]
  52. Huang, X.R.; Huang, C.B.; Qin, Q.Y.; Huang, X.; Cao, J.; Huang, C.; Farm, L.F.; County, T.; University, G. Difference in Soil Fertility of Pinus massoniana Plantations with Different Stand Densities. Guizhou Agric. Sci. 2015, 1, 135–139. [Google Scholar]
  53. Liu, Y.; Li, G.L.; Li, R.S.; Guo, B.; Xu, Y. Effected of Tree Density on Soil Fertility in Pinus tabulae formis Plantations. J. Northwest. For. Univ. 2008, 6, 18–23. [Google Scholar]
  54. Gil, W. The effect of planting density on chemical properties of the top soil layer in a 30-year-old pine stand. Leoene Prace Badawcze 2009, 70, 297–302. [Google Scholar] [CrossRef] [Green Version]
  55. Wang, J.J.; Wang, B.N.; Li, B.F.; Yu, Y.C. Soil Nutrient Dynamics in Eucalyptus urophylla × Eucalyptus grandis Plantation at Different Ages. J. Fujian Coll. For. 2016, 1, 8–14. [Google Scholar]
  56. Shi, J.P.; Zhang, D.F.; Lin, B. Effects of Long-term Application of NPK Fertilizers and Organic Fertilizers on Soil Nitrogen, Phosphorus and Potassium Nutrients. Soils Fertil. 1998, 1, 7–10. [Google Scholar]
  57. Cheng, X.R.; Yu, M.K.; Wang, G. Effects of thinning on soil organic carbon fractions and soil properties in Cunninghamia lanceolata stands in eastern China. Forests 2017, 8, 198. [Google Scholar] [CrossRef]
  58. Sun, D.Q.; Farm, B. Effects of Different Thinning Intensities on Physical and Chemical Properties of Soil in Quercus mongolica Plantation and Spinney in Eastern Liaoning Province. Prot. For. Sci. Technol. 2016, 1, 46–49. [Google Scholar]
  59. Huang, Y.C. The Effects of Density on Undergrowth Plant and Soil Fertility of Cunninghamia laceolata Hook Plantation. Anhui Agric. Sci. Bull. 2007, 11, 94–95. [Google Scholar]
  60. Tong, S.Z.; Sheng, W.T.; Zhang, J.G. Studies on the density effects of Chinese fir stands. For. Res. 2002, 15, 66–75. [Google Scholar]
Figure 1. The geographical map of the study site.
Forests 10 00351 g001
Figure 2. Soil organic matter in different layers under different stand densities (g·kg−1). Note: Different lowercase letters indicate significant differences among different densities at the 0.05 level, and different capital letters for the same density indicate significant differences among different soil layers at the 0.05 level.
Forests 10 00351 g002
Figure 3. Soil total N in different layers under different stand densities (g·kg−1). Note: different lowercase letters indicate significant differences among different densities at the 0.05 level, and different capital letters for the same density indicate significant differences among different soil layers at the 0.05 level.
Forests 10 00351 g003
Figure 4. Soil alkali-hydrolyzable N in different layers under different stand densities (mg·kg−1). Note: different lowercase letters indicate significant differences among different densities at the 0.05 level, and different capital letters for the same density indicate significant differences among different soil layers at the 0.05 level.
Forests 10 00351 g004
Figure 5. Soil total P in different layers under different stand densities (g·kg−1). Note: different lowercase letters indicate significant differences among different densities at the 0.05 level, and different capital letters of the same density indicate significant differences among different soil layers at the 0.05 level.
Forests 10 00351 g005
Figure 6. Soil available P in different layers under different stand enmities’ (mg·kg−1). Note: different lowercase letters indicate significant differences among different densities at the 0.05 level, and different capital letters of the same density indicate significant differences among different soil layers at the 0.05 level.
Forests 10 00351 g006
Figure 7. Soil total K in different layers under different stand densities (g·kg−1). Note: different lowercase letters indicate significant differences among different densities at the 0.05 level, and different capital letters of the same density indicate significant differences among different soil layers at the 0.05 level.
Forests 10 00351 g007
Figure 8. Soil available K in different layers under different stand densities (mg·kg−1). Note: different lowercase letters indicate significant differences among different densities at the 0.05 level, and different capital letters of the same density indicate significant differences among different soil layers at the 0.05 level.
Forests 10 00351 g008
Figure 9. Soil exchangeable Ca in different layers under different stand densities (mg·kg−1). Note: different lowercase letters indicate significant differences among different densities at the 0.05 level, and different capital letters of the same density indicate significant differences among different soil layers at the 0.05 level.
Forests 10 00351 g009
Figure 10. Soil exchangeable Mg in different layers under different stand densities (g·kg−1). Note: different lowercase letters indicate significant differences among different densities at the 0.05 level, and different capital letters of the same density indicate significant differences among different soil layers at the 0.05 level.
Forests 10 00351 g010
Figure 11. Soil available Fe in different layers under different stand densities (mg·kg−1). Note: Different lowercase letters indicate significant differences among different densities at the 0.05 level, and different capital letters of the same density indicate significant differences among different soil layers at the 0.05 level.
Forests 10 00351 g011
Figure 12. The comparison of (a) soil pH, (b) bulk density, (c) organic matter, (d) total N, (e) available N, (f) available P, (g) available K in the 0–20 cm soil layer between two sites (Pingxiang county and Shaowu county) under five different stand densities.
Forests 10 00351 g012
Table 1. The arithmetic mean diameter at breast height (DBH), mean height (H), dominant height (Hd), and understory biomass of stands with different planting densities.
Planting Density
(trees ha−1)
Stand Density (trees ha−1)Stand Age (years)DBH (cm)H (m)Hd (m)Understory Biomass
(t·ha−1)
A: 166710443619.7618.8215.709.76
B: 333314283617.2618.0815.0913.56
C: 500015333616.2816.9514.169.71
D: 666715113617.6118.9316.018.11
E: 1000013563615.6716.6914.568.05
Table 2. Soil bulk density in different layers under different stand densities (g·cm−3).
Soil Depth
(cm)
Planting Density (trees·ha−1)
A (1667)B (3333)C (5000)D (6667)E (10,000)
0–101.24 ± 0.07 Aa1.27 ± 0.10 Aa1.29 ± 0.08 Aa1.38 ± 0.05 Ab1.29 ± 0.09 Aa
10–201.41 ± 0.14 Ba1.45 ± 0.11 Ba1.46 ± 0.12 Ba1.51 ± 0.06 Ba1.48 ± 0.04 Ba
20–301.58 ± 0.04 Ca1.58 ± 0.06 Ca1.56 ± 0.07 Ca1.58 ± 0.04 Ca1.54 ± 0.07 Ba
30–401.59 ± 0.05 Ca1.59 ± 0.04 Ca1.57 ± 0.09 Ca1.59 ± 0.04 Ca1.55 ± 0.03 Ba
40–501.58 ± 0.05 Ca1.59 ± 0.04 Ca1.58 ± 0.07 Ca1.59 ± 0.04 Ca1.53 ± 0.09 Ba
50–601.55 ± 0.06 Ca1.57 ± 0.05 Ca1.55 ± 0.09 BCa1.58 ± 0.10 Ca1.51 ± 0.09 Ba
60–701.57 ± 0.02 Ca1.58 ± 0.04 Ca1.53 ± 0.08 BCa1.57 ± 0.07 Ca1.54 ± 0.06 Ba
70–801.54 ± 0.07 Cab1.59 ± 0.05 Ca1.55 ± 0.07 BCab1.56 ± 0.03 Cab1.53 ± 0.05 Bb
80–901.56 ± 0.07 Ca1.60 ± 0.09 Ca1.57 ± 0.09 Ca1.58 ± 0.06 Ca1.54 ± 0.09 Ba
90–1001.60 ± 0.09 Ca1.59 ± 0.08 Ca1.57 ± 0.09 Ca1.57 ± 0.04 Ca1.55 ± 0.07 Ba
Notes: The data in the table are average ± standard deviarion (SD). Different lowercase letters in the same line indicate significant differences among different densities at the 0.05 level, and different capital letters for the same density in the same column indicate significant differences among different soil layers at the 0.05 level.
Table 3. Soil pH in different layers under different stand densities.
Soil Depth
(cm)
Planting Density (trees·ha−1)
A (1667)B (3333)C (5000)D (6667)E (10,000)
0–103.54 ± 0.19 Db3.77 ± 0.13 Ca3.74 ± 0.11 Ca3.80 ± 0.07 Da3.86 ± 0.06 Ca
10–203.58 ± 0.17 CDc3.79 ± 0.10 Cab3.75 ± 0.11 Cb3.85 ± 0.06 CDab3.87 ± 0.05 BCa
20–303.60 ± 0.16 CDc3.77 ± 0.10 Cb3.77 ± 0.10 Cb3.86 ± 0.09 CDab3.89 ± 0.07 ABCa
30–403.62 ± 0.17 CDc3.79 ± 0.10 Cab3.76 ± 0.10 Cb3.85 ± 0.08 CDab3.89 ± 0.08 ABCa
40–503.63 ± 0.18 CDb3.79 ± 0.09 Ca3.79 ± 0.10 BCa3.85 ± 0.10 CDa3.90 ± 0.09 ABCa
50–603.66 ± 0.17 CDb3.83 ± 0.07 Ca3.80 ± 0.11 BCa3.86 ± 0.10 CDa3.91 ± 0.12 ABCa
60–703.73 ± 0.15 ABb3.87 ± 0.07 ABCa3.85 ± 0.11 BCa3.92 ± 0.13 ABCDa3.93 ± 0.12 ABCa
70–803.81 ± 0.14 ABb3.92 ± 0.06 ABab3.89 ± 0.10 ABab3.96 ± 0.14 ABCa3.95 ± 0.12 ABCa
80–903.84 ± 0.17 Ab3.94 ± 0.08 ABab3.91 ± 0.10 Aab3.97 ± 0.15 ABa3.97 ± 0.11 ABa
90–1003.82 ± 0.15 ABb3.94 ± 0.09 Aab3.92 ± 0.09 Aab3.99 ± 0.16 Aa3.99 ± 0.12 Aa
Notes: The data in the table are average ± standard deviation. Different lowercase letters in the same line indicate significant differences among different densities at the 0.05 level, and different capital letters for the same density in the same column indicate significant differences among different soil layers at the 0.05 level.
Table 4. The correlation analysis of soil nutrition and stand factors.
pHOrganic MatterTotal
N
Total
P
Total
K
Alkali-
hydrolyzable N
Available
P
Available
K
Exchangeable
Ca
Exchangeable
Mg
Available
Fe
pH1
Organic
matter
−0.356 **1
Total N−0.315 **0.96 **1
Total P−0.266 **0.403 **0.423 **1
Total K0.349 **−0.171 **−0.125 **0.148 **1
Alkali-hydrolyzable N0.308 **0.935 **0.913 **0.375 **0.118 **1
Available P0.211 **0.86 **0.839 **0.291 **0.183 **0.823 **1
Available K0.0880.726 **0.735 **0.439 **0.151 **0.768 **0.66 **1
Exchangeable Ca0.196 **0.396 **0.378 **0.289 **0.108 *0.484 **0.316 **0.528 **1
Exchangeable Mg0.131 **0.593 **0.589 **0.195 **0.0280.616 **0.564 **0.591 **0.697 **1
Available Fe0.378 **0.916 **0.879 **0.36 **0.155 **0.899 **0.829 **0.7 **0.45 **0.572 **1
Bulk density0.213 **0.726 **0.714 **0.434 **0.0840.69 **0.699 **0.565 **0.323 **0.456 **0.715 **
Note: * and ** in the table stand for 0.05 and 0.01 significance level, respectively.

