Laminated Veneer Lumber with Non-Wood Components and the Effects of Selected Factors on Its Bendability


Department of Wood Processing and Biomaterials, Faculty of Forestry and Wood Sciences, Czech University of Life Sciences in Prague, Kamýcká 1176, 16521 Prague-Suchdol, Czech Republic
*
Author to whom correspondence should be addressed.
Forests 2019, 10(6), 470; https://0-doi-org.brum.beds.ac.uk/10.3390/f10060470
Submission received: 23 April 2019
/
Revised: 26 May 2019
/
Accepted: 27 May 2019
/
Published: 30 May 2019
(This article belongs to the Special Issue Wood Properties and Processing)
Abstract
:Knowledge of the coefficients of wood bendability (KbendC and KbendB) and of the effects of selected factors on the listed characteristics in bending stress has both scientific and practical significance. It forms a foundation for designing tools for bending and determines the stress that products and their parts can be exposed to during use. This study analyzes the effects of selected factors on the selected characteristics, such as the coefficients of wood bendability (KbendC and KbendB). The selected factors of this study were wood species (WS) (Fagus sylvatica L. and Populus tremula L.), non-wood component (carbon fiber and glass fiber), position of the non-wood component in the laminated material (top and bottom), material thickness (T) (6 mm, 10 mm, and 18 mm), and adhesive (polyvinyl acetate and polyurethane), as well as their combined interaction on the monitored characteristics described above. The results contribute to the advancement of knowledge necessary for the study and development of new materials with specific properties for their intended use. The measured values of laminated structures can be compared with the values measured on the samples from the wood. The results can improve the innovative potential of wood processing companies and increase their performance and competitiveness in the market.
1. Introduction
The effective use of wood and its by-products has gained increased attention in recent years due to limited natural resources [1,2]. It is in society’s general interest to efficiently utilize our limited forest resources and improve recycling [2].
Because composite material production uses materials of varying characteristics, it is necessary to verify their quality to ensure good product performance and market competitiveness. Composite production is a complex process [3]; it requires immediate consideration of various parameters (cutting geometry, production volume, matrix types, machine requirements, market economy, etc.). One of the main aspects limiting the structural use of high-strength composites is their weak interlaminar resistance [4]. Several strategies for enhancing the resistance of composites have been proposed [4,5,6], such as using a harder resin for hybrid composites, harder adhesive layers, and others.
Material stratification is very important in industrial practice, both in construction and in the manufacturing industry [7,8]. In the woodworking industry, homogeneity leads to better performance, thereby reducing the possible negative properties of wood that could lead to material failures. In environmental modification of wood, a number of studies have focused on thermal modification [9,10,11,12,13,14,15]. Densification of wood is also one of the ways to modify the basic properties of wood. It is a process whereby wood is pressed, for example, by rolling or by the action of various presses, thereby reducing its volume and increasing density. Such wood is then harder, firmer, and darker to look at. Densification of wood reduces the porosity and moisture content of the wood [16]. Gaff et al. [17] examined the effect of densification on bond strength. They found that the effect of the densification on bond strength is statistically very significant.
Another way to modify the properties of wood elements is through the use of non-wood reinforcing materials to form wood-based composite materials [18]. Such reinforcing materials include carbon, aramid, basalt, and glass fibers [19,20,21]. The application of non-wood components in a wood-based laminated veneer lumber material is usually intended to strengthen the material, increase its resistance to stress, and reduce bending values [22,23]. Such materials are characterized by different specific properties for their intended uses [24,25,26,27]. The intended use is a determining factor of the desired characteristics in a given material [22,28,29,30]. In some cases, emphasis is placed on materials with high strength values, while other cases see the creation of materials with high elasticity values [23] or high bendability values [22].
Bendability is a characteristic that has recently attracted great interest. The effect of the placement of a non-wood component in such a material has not yet been given much attention, and the interactions of different types of materials with other factors influencing this characteristic have also not been studied. A mathematical interpretation of the bending coefficient [17] was only recently established for the correct description of bendability.
The bending coefficient (Kbend) is a quantitative characteristic that is defined as the ratio of the thickness (h) of the bent material to the minimum bend radius (R) (Figure 1). For most types of wood, the limit ratio is h:R = 1:35 to 1:45. The critical area for bending wood is the tensile zone. The maximum tensile deformation of wood in its original unmodified state is 0.75% to 1%. This can be increased with plasticization to 1.5% to 2%. By contrast, the compressibility of wood is greater at optimum humidity and temperature; if its porosity allows it, it reaches up to 40% [31].
There is very little scientific knowledge about the minimum bend radius and bending coefficient. The aim of our work is therefore to deepen the knowledge of the bending coefficient of wood (KbendC and KbendB), namely beech and aspen, under three-point bending. Gaff et al. [32] showed that as the material thickness increases, the value of the bending coefficient decreases, and the force needed for bending increases. Gaff et al. [17] created a model for analyzing bendability, with which it is possible to define the correct relations for determining the minimum bend radius (Rmin), which can then be used to calculate the bending coefficient (Kbend).
2. Materials and Methods
2.1. Material
The wooden lamellas used in this experiment were made of beech wood (Fagus sylvatica L.) and aspen wood (Populus tremula L.) with thicknesses of 3 mm, 5 mm, and 9 mm, widths of 35 mm, and lengths of 600 mm. The beech and aspen wood came from Polana, Slovakia. Polyvinyl acetate (PVAc) and polyurethane (PUR) adhesives were used to produce laminated wood using the above lamellas. Carbon fibers (SikaWrap-150 C/30, 155 g/m2 ± 5 g/m2) and glass fibers (Kittfort, 355 g/m2) were used as the reinforcing materials, which were first glued on the convex sides and then on the concave sides with respect to the direction of loading. Categorization of the test specimens is shown in Figure 2.
After all test specimens were created, they were climatized in a climatic chamber (ED, APT Line II, Binder, Tuttlingen, Germany) to 12% moisture content at 65% relative humidity and 20 °C.
2.2. Methods
2.2.1. Determining Selected Characteristics
Testing was performed with three-point bending (Figure 3), with the bottom support span set to 20 times the total thickness of the test specimen. The top support crossbeam was set in a center position relative to the distance of the bottom support crossbeam. Testing was performed according to EN 310 (1993) [33] using a universal testing machine (FPZ 100, TIRA, Schalkau, Germany). Testing took place in the tangential direction relative to the fiber direction. The feed rate of the top support was set to 3 mm/min due to the duration of the test. An ALMEMO 2690-8 datalogger (AhlbornGmbH, Braunschweig, Germany) was used to record all the forces during the test.
Before the measurement was performed, the densities and humidities of the used wooden components were measured according to ISO 13061-1 (2014) [34] and ISO 13061-2 (2014) [35]. After the tests were completed, all test specimens were dried to 0% moisture content, as necessary to calculate the moisture content at the time of the test.
2.2.2. Evaluation and Calculation of Kbend and Rmin
Based on data obtained from the stress–strain diagram, exact identification of the boundary points between the linear and non-linear parts of the diagram was used to determine forces at the limit of proportionality (FE) and at the yield point (FP), along with the deflections at the limit of proportionality (YE) and at the yield point (YP). These characteristics were identified using the MATESS program, which is currently being developed by the Czech University of Life Sciences in Prague.
In the next step, the bendability of the tested material was evaluated based on the minimum bend radius (RminB and RminC) and the bending coefficient (KbendB and KbendC). Two approaches were used to evaluate the bendability. The first approach was based on bending geometry (Equations (1) and (2)), while the second approach was based on the simple bending equations (Equations (3) and (4)), which were used in the work of Gaff et al. [17]:
where RminB is the minimum bend radius based on bending geometry (mm), RminC is the minimum bend radius based on the simple bending equations (mm), KbendB is the bending coefficient based on bending geometry, KbendC is the bending coefficient based on the simple bending equations, YP is the deflection at the yield point (mm), l0 is the bottom support span (mm), and h is the total material thickness (mm).
The results were statistically evaluated with an analysis of variance (ANOVA), specifically Fisher’s F-test, with STATISTICA 12 software (Statsoft Inc., Tulsa, OK, USA). The results were evaluated using a 95% confidence interval, which represents a significance level of 0.05 (p < 0.05). Duncan’s test was also used for deeper analysis to compare all sets of test specimens.
3. Results and Discussion
Table 1 and Table 2 show the average values and coefficients of variation (in parentheses) of the monitored characteristics, the average density values measured in individual sets of test specimens, and the corresponding coefficients of variation. Table 1 shows the average values of KbendC, KbendB, RminC, and RminB measured in the aspen test specimens.
The highest average values of RminC (1616 mm) and RminB (2448 mm) were measured in the material with a thickness of 18 mm glued with PUR adhesive and reinforced with carbon fibers placed on the top side with respect to the direction of loading. The lowest average values of RminC (134 mm) and RminB (202 mm) were measured in the material with a thickness of 6 mm glued with PVAc adhesive and reinforced with glass fibers placed on the top side with respect to the direction of loading.
Higher average values for the bending coefficient were obtained in calculations based on the simple bending equation KbendC (0.01 to 0.04) than in calculations based on bending geometry KbendB (0.01 to 0.03), which corresponds with the results reported in the work of Gaff et al. [17], who also studied the bending coefficient of unmodified aspen wood.
Table 2 shows the average values of KbendC, KbendB, RminC, and RminB calculated in beech test specimens. The layered beech materials showed the same tendency of the bending coefficient as the laminated aspen materials. In the laminated beech materials, KbendC values (0.01 to 0.05) were greater than KbendB values (0.01 to 0.03). Comparing these results with those of Gaff et al. [17] confirms the trend of greater KbendC values.
The greatest average value of RminB (3391 mm) was measured in the material with a thickness of 18 mm glued with PUR adhesive and reinforced with glass fibers on the top side with respect to the direction of loading. The lowest value of RminB (162 mm) was measured in the material with a total thickness of 6 mm bonded with PUR adhesive and reinforced with glass fiber on the bottom side of the test specimen relative to the direction of loading. The greatest (2442 mm) and lowest (105 mm) average values of RminC were measured in the same materials as the greatest and lowest values of RminB.
All the measured data were statistically evaluated using a single-factor analysis in which the test specimen type was chosen as the default factor. The evaluation was based on the significance level p, which was less than 0.005. Table 3, Table 4, Table 5 and Table 6 show the statistical evaluation of the effect of the test specimen type on the bending coefficient based on the simple bending equations (KbendC) in laminated aspen and beech materials with the non-wood component placed on the top or bottom side with respect to the direction of loading.
Table 7, Table 8, Table 9 and Table 10 show the statistical evaluation of the effect of the test specimen type on the bending coefficient based on bending geometry (KbendB) in laminated aspen and beech materials with the non-wood component placed on the top or bottom with respect to the direction of loading.
Table 11, Table 12, Table 13 and Table 14 show the statistical evaluation of the effect of the test specimen type on the minimum bend radius based on the simple bending equations (RminC) in laminated aspen and beech materials with the non-wood component placed on the top or bottom with respect to the direction of loading.
Table 15, Table 16, Table 17 and Table 18 show the statistical evaluation of the effect of the test specimen type on the minimum bend radius based on bending geometry (RminB) in laminated aspen and beech materials with the non-wood component placed on the top or bottom with respect to the direction of loading.
Duncan’s test was performed for a detailed comparison of the differences in the bending coefficients (KbendC and KbendB) among individual types of laminated aspen and beech materials, and the results are shown in Table 19, Table 20, Table 21, Table 22, Table 23, Table 24, Table 25 and Table 26.
As shown in Figure 4, the greatest KbendC values in the aspen samples were found in the samples with thicknesses of 6 mm and 10 mm with a carbon fiber non-wood component placed on the bottom of the laminated material. These lamellas were bonded with PVAc adhesive. By contrast, the lowest KbendC values were found in 18 mm thick lamellas, where the non-wood component was placed on the top of the laminated material. In the samples with a carbon fiber non-wood component, the effect of the adhesive used was also significant. The 6 mm thick and 10 mm thick samples with carbon fibers on the top of the material glued with PUR adhesive had significantly lower values (by more than 50%) than all the other samples.
The situation was similar with beech lamellas (Figure 5). The greatest KbendC values were found in the beech samples with a 6 mm thickness, but unlike the aspen lamellas, no significant differences were found when different types of non-wood components were used. As with aspen lamellas, the lowest KbendC values were measured in lamellas with a thickness of 18 mm. The lamella thickness affected the bending coefficient. In beech samples, there was one extreme in the case of lamellas with glass fibers bonded with PVAc adhesive. The values measured on these 6 mm thick and 18 mm thick samples were no different from those measured on the 10 mm thick samples.
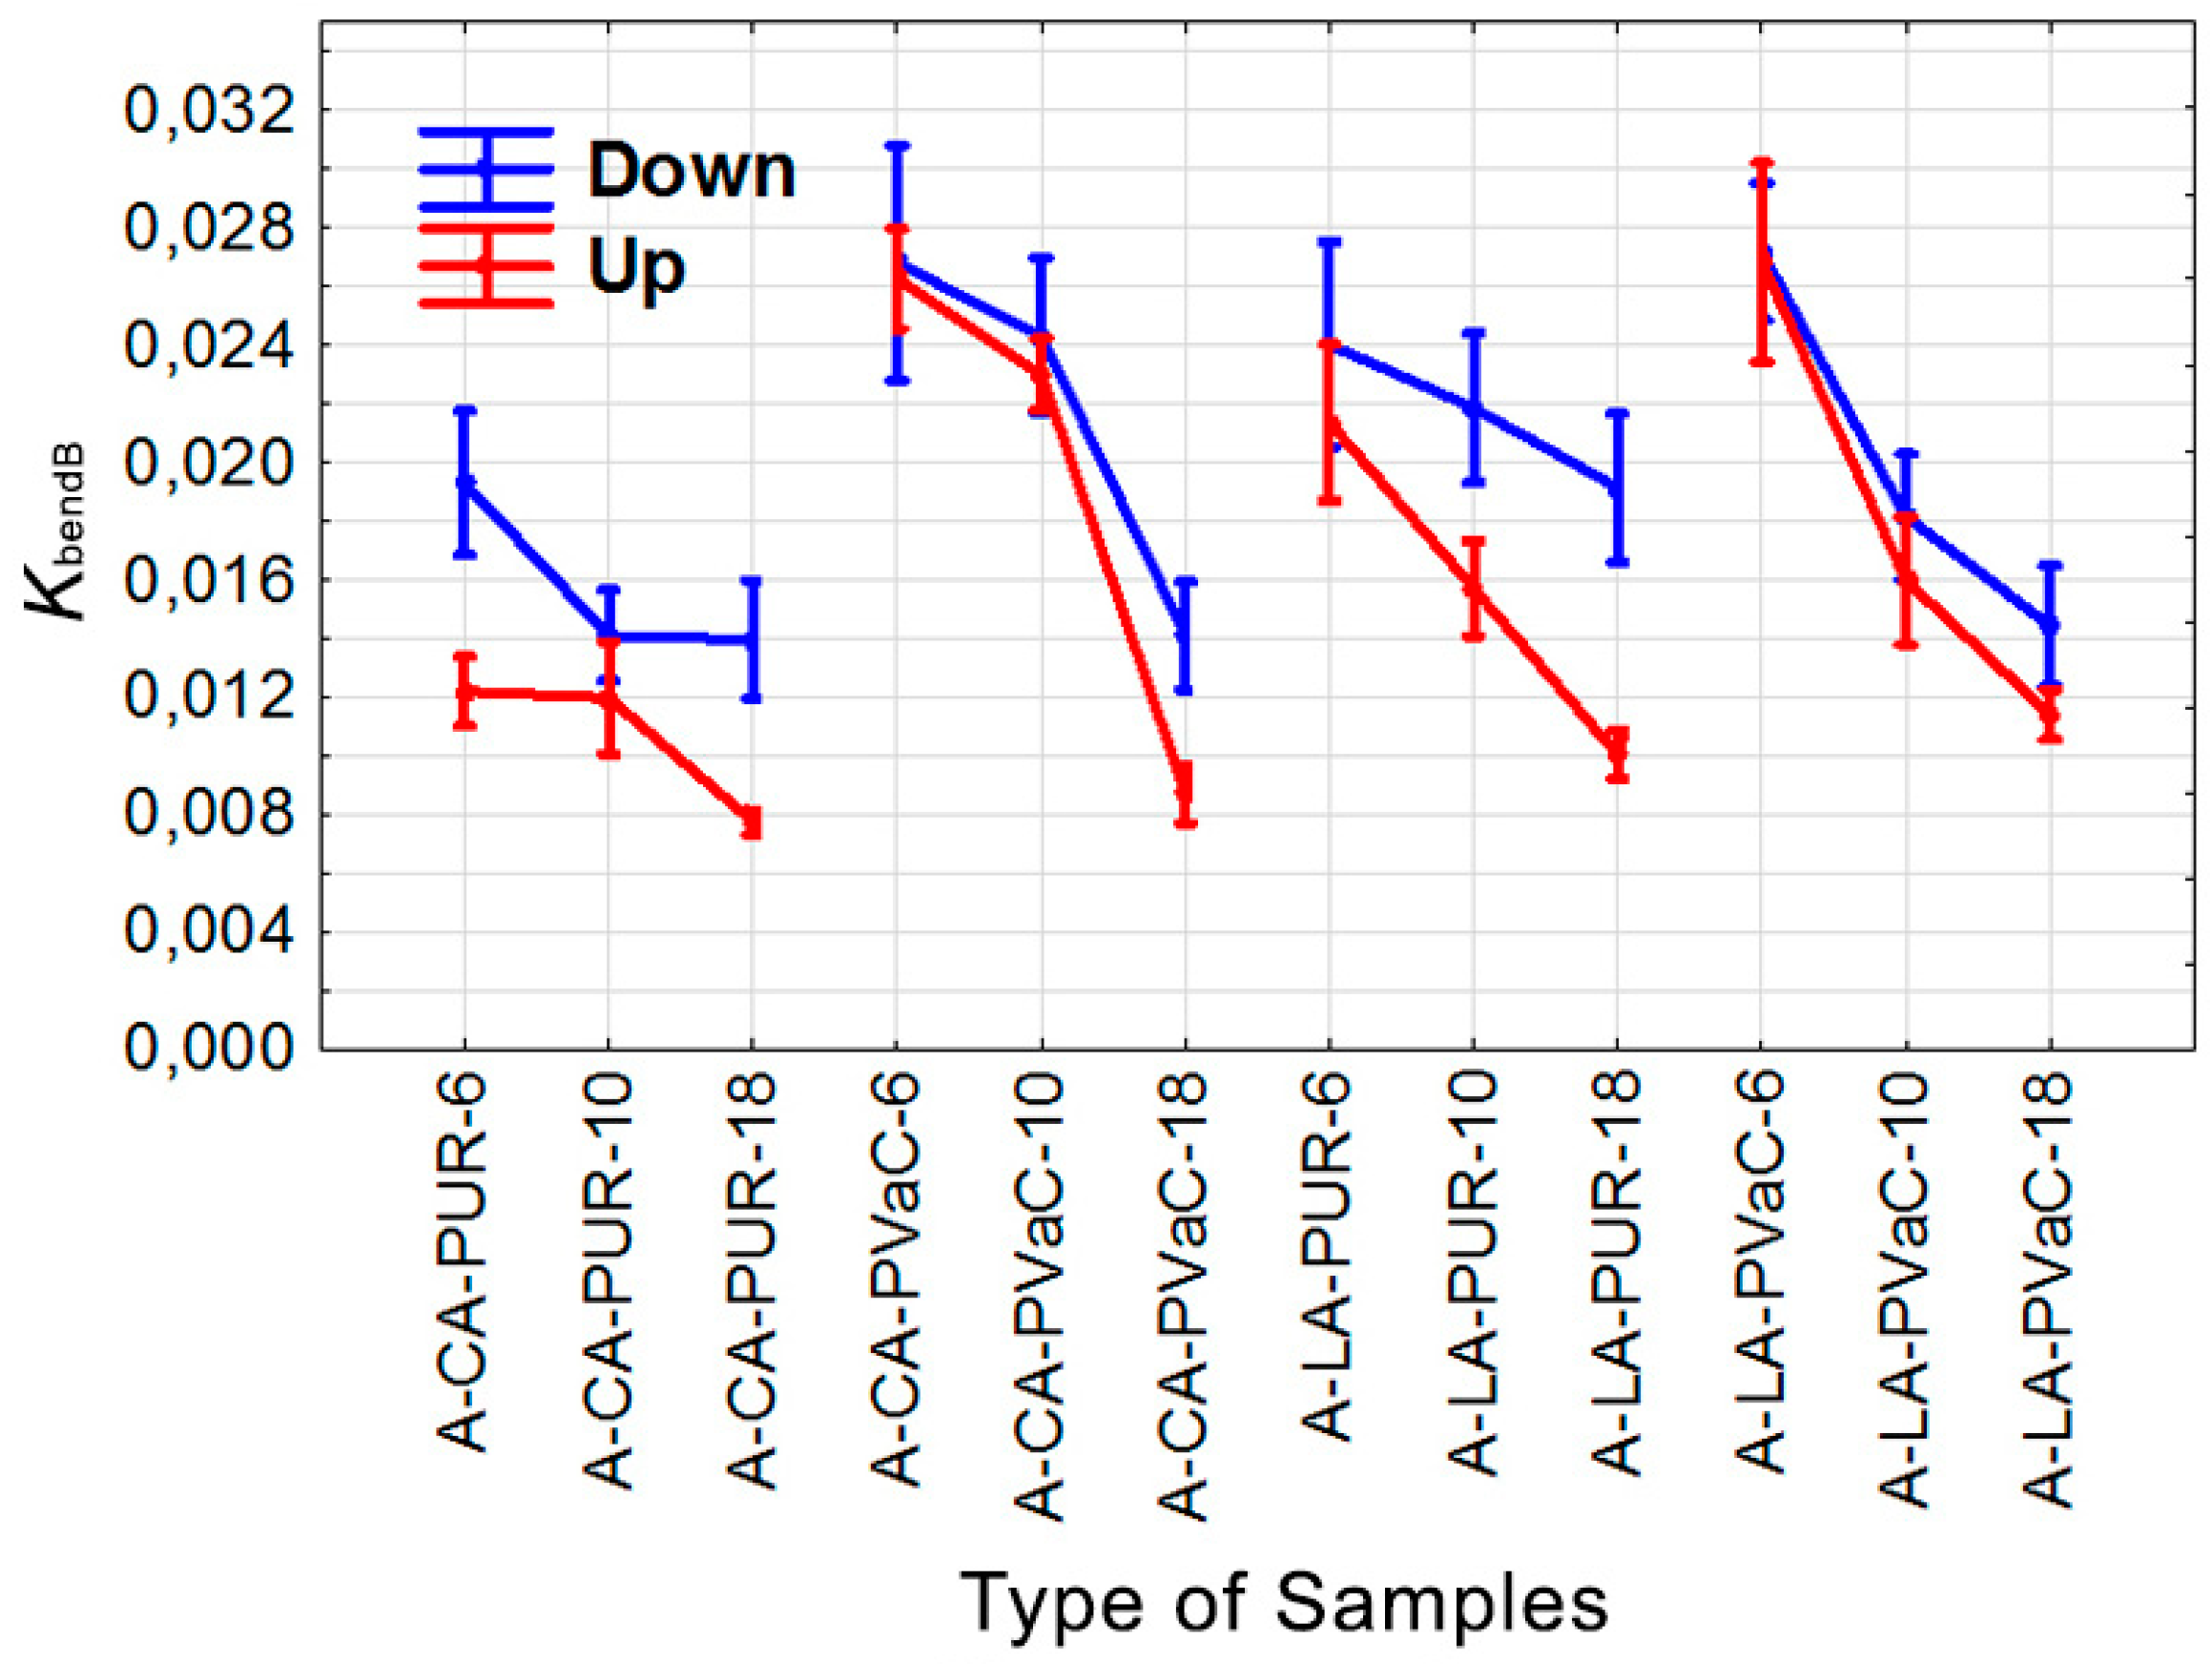
Figure 6 shows that the KbendB values were affected most by the material thickness. Materials with lower thicknesses had greater KbendB values. The greatest KbendB values in the aspen lamellas were reached in samples with a non-wood component on the bottom of the laminated material. These lamellas were bonded with PVAc adhesive, and the non-wood component had no influence on these values. By contrast, the lowest values were measured in the aspen lamellas with carbon fibers on the top side of the material and bonded with PUR adhesive. The lowest KbendB values were also found in the samples with a carbon fiber non-wood component placed on the top of the material. In the 6 mm thick and 10 mm thick samples bonded with PUR adhesive with a non-wood carbon fiber component, the values were more than 50% lower than in the samples bonded with PVAc adhesive.
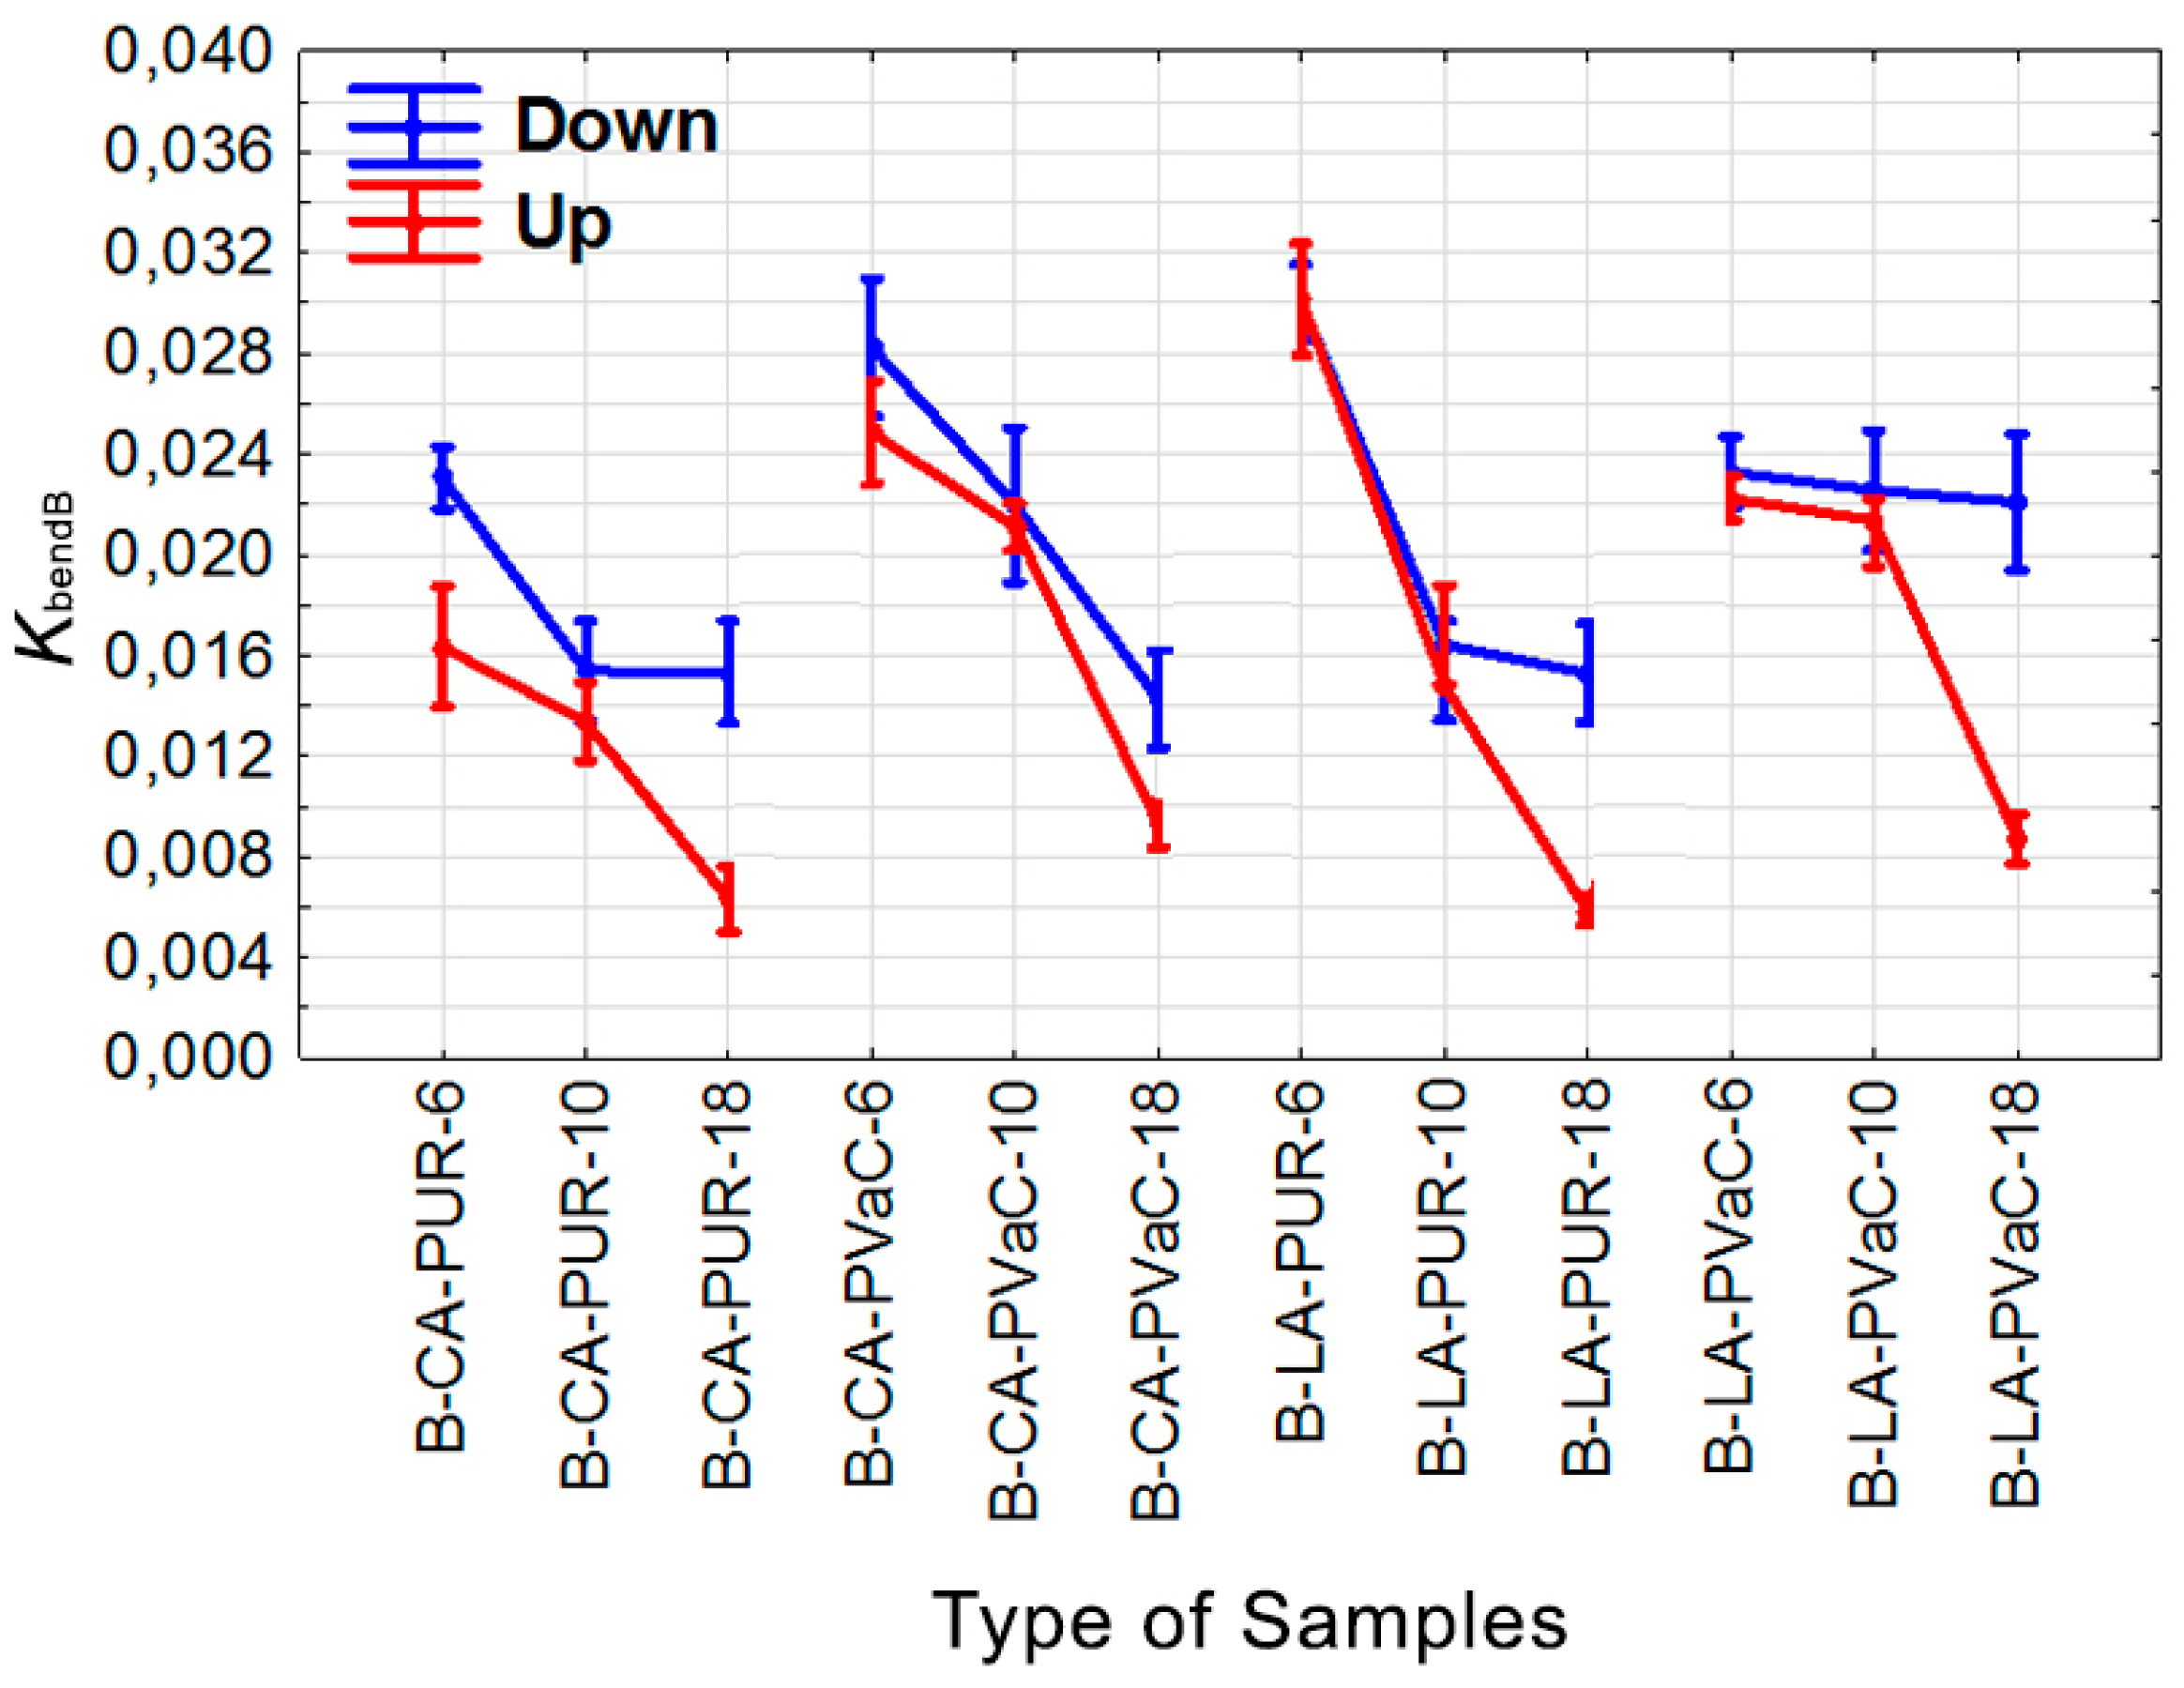
The lowest KbendB values in the beech samples were measured in the 18 mm thick samples bonded with PUR adhesive (Figure 7). In similar samples bonded with PVAc adhesive, the samples reached about 30% greater values. The highest KbendB values were measured in the 6 mm thick beech samples, but unlike aspen lamellas, no significant differences were found with the use of different types of non-wood components and adhesives. As in aspen lamellas, the lowest KbendB values were measured in the 18 mm thick lamellas. The lamella thickness affected the bending coefficient.
4. Conclusions
- The type and position of the non-wood component used in the laminated materials had a significant effect on all the observed characteristics: KbendC, KbendB, RminC, and RminB.
- Bending coefficient values based on the simple bending equation (KbendC) tended to be greater than bending coefficient values based on bending geometry (KbendB).
- The greatest values of the bending coefficient based on the simple bending equation (KbendC) and the bending coefficient based on bending geometry (KbendB) were generally found in materials of lower thickness.
- No rule was observed for the high or low measured values of the observed characteristics (KbendC, KbendB, RminC, and RminB) in relation to the wood species used.
Author Contributions
Data curation, A.S., V.Z. and Z.G.; Formal analysis, T.S.; Resources, A.S.; Supervision, T.S.; Visualization, T.S.; Writing—original draft, T.S.; Writing—review & editing, A.S.
Funding
The authors are grateful for the support of the Advanced Research Supporting the Forestry and Wood-processing Sector’s Adaptation to Global Change and the 4th Industrial Revolution (Project No. CZ.02.1.01/0.0/0.0/16_019/0000803), financed by OP RDE. The authors are also grateful for the support of the Internal Grant Agency (IGA) of the Faculty of Forestry and Wood Sciences (Project No. B 06/17).
Conflicts of Interest
The authors declare no conflict of interest.
References
- Pokharel, R.; Grala, R.K.; Grebner, D.L. Woody residue utilization for bioenergy by primary forest products manufacturers: An exploratory analysis. For. Policy Econ. 2017, 85, 161–171. [Google Scholar] [CrossRef]
- Long, Z.; Wu, J.; Xu, W.; Lin, W. Study of the coordination mechanism of a wood processing residue-based reverse supply chain. BioResources 2018, 13, 2562–2577. [Google Scholar] [CrossRef]
- Bhoominathan, R.; Divyabarathi, P.; Manimegalai, R.; Nithya, T.; Shanmugapriya, S. Infra-red thermography based inspection of hybrid composite laminates under flexure loading. IJVSS 2018, 10, 6–9. [Google Scholar] [CrossRef]
- Silva, F.G.A.; de Moura, M.F.S.F.; Magalhães, A.G. Lowvelo city impact behaviour of a hybrid carbon-epoxy/corklaminate. Strain 2017, 53. [Google Scholar] [CrossRef]
- Abrate, S. Impact on laminated composite materials. Appl. Mech. Rev. 1991, 44, 155–190. [Google Scholar] [CrossRef]
- Bigg, D.M. The impact behavior of thermoplastic sheet composites. J Reinf. Plast. Comp. 1994, 13, 339–354. [Google Scholar] [CrossRef]
- Glos, P.; Denzler, J.K.; Linsenmann, P. Strength and stiffness behaviour of beech laminations for high strength glulam. In Proceedings of the Meeting 37 CIB Working Commission W18-Timber Structures, Edinburgh, Scotland, UK, August 2004. [Google Scholar]
- Frese, M.; Blaß, H.J. Characteristic bending strength of beech glulam. Mater. Struct. 2007, 40, 3–13. [Google Scholar] [CrossRef]
- Hill, C.A.S. Wood Modification: Chemical, Thermal and Other Processes; John Wiley & Sons: Chichester, UK, 2006. [Google Scholar] [CrossRef]
- Kubovský, I.; Babiak, M. Color changes induced by CO2 laser irradiation of wood surface. Wood Res. 2009, 54, 61–66. [Google Scholar]
- Hrčka, R.; Babiak, M. Some non-traditional factors influencing thermal properties of wood. Wood Res. 2012, 57, 367–374. [Google Scholar]
- Gašparík, M.; Barcík, Š. Impact of plasticization by microwave heating on the total deformation of beech wood. BioResources 2013, 8, 6297–6308. [Google Scholar] [CrossRef]
- Gašparík, M.; Barcík, Š. Effect of plasticizing by microwave heating on bending characteristics of beech wood. BioResources 2014, 9, 4808–4820. [Google Scholar] [CrossRef]
- Svoboda, T.; Ruman, D.; Gaff, M.; Gašparík, M.; Miftieva, E.; Dundek, L. Bending characteristics of multilayered soft and hardwood materials. BioResources 2015, 10, 8461–8473. [Google Scholar] [CrossRef]
- Miftieva, E.; Gaff, M.; Svoboda, T.; Babiak, M.; Gašparík, M.; Ruman, D.; Suchopár, M. Effects of selected factors on bending characteristics of beech wood. BioResources 2016, 11, 599–611. [Google Scholar] [CrossRef]
- Fang, C.-H.; Mariotti, N.; Cloutier, A.; Koubaa, A.; Blanchet, P. Densification of wood veneers by compression combined with heat and steam. Eur. J. Wood Prod. 2012, 70, 155–163. [Google Scholar] [CrossRef]
- Gaff, M.; Vokatý, V.; Babiak, M.; Bal, B.C. Coefficient of wood bendability as a function of selected factors. Constr. Build Mater. 2016, 126, 632–640. [Google Scholar] [CrossRef]
- Blomberg, J.; Persson, B. Swelling pressure of semi-isostaticallydensified wood under different mechanical resraints. Wood Sci. Technol. 2007, 41, 401–415. [Google Scholar] [CrossRef]
- Plevris, N.; Triantafillou, T.C. CreepbehaviorofFRP-reinforcedwoodmembers. J. Struct. Eng. 1995, 121, 174–186. [Google Scholar] [CrossRef]
- Redon, C.; Li, V.C.; Wu, C.; Hoshiro, H.; Saito, T.; Ogawa, A. Measuring and modifying interface propertiesof PVA fibers in ECC matrix. J Mater. Civil Eng. 2001, 13, 399–406. [Google Scholar] [CrossRef]
- Sviták, M.; Ruman, D. Tensile-shear strength of layered wood reinforced by carbon materials. Wood Res. 2017, 62, 243–252. [Google Scholar]
- Gaff, M.; Babiak, M.; Vokatý, V.; Gašparík, M.; Ruman, D. Bending characteristics of hardwood lamellae in the elastic region. Compos. Part B-Eng. 2017, 116, 61–75. [Google Scholar] [CrossRef]
- Babiak, M.; Gaff, M.; Sikora, A.; Hysek, Š. Modulus of elasticity in three- and four-point bending of wood. Compos. Struct. 2018, 204, 454–465. [Google Scholar] [CrossRef]
- Gaff, M.; Gašparík, M.; Babiak, M.; Vokatý, V. Bendability characteristics of wood lamellae in plastic region. Compos. Struct. 2017, 163, 410–422. [Google Scholar] [CrossRef]
- Gaff, M.; Babiak, M. Methods for determining the plastic work in bending and impact of selected factors on its value. Compos. Struct. 2018, 202, 66–76. [Google Scholar] [CrossRef]
- Sikora, A.; Gaff, M.; Hysek, Š.; Babiak, M. The plasticity of composite material based on winter rapeseed as a function of selected factors. Compos. Struct. 2018, 202, 783–792. [Google Scholar] [CrossRef]
- Gaff, M.; Babiak, M. Tangent modulus as a function of selected factors. Compos. Struct. 2018, 202, 436–446. [Google Scholar] [CrossRef]
- Saracoglu, E. Finite-element Simulations of the Influence of Cracks on the Strength of Glulam Beams. Master’s Thesis, Blekinge Institute of Technology, Karlskrona, Sweden, 2011. [Google Scholar]
- Khorasan, S.R. Finite-element Simulations of Glulam Beams with Natural Cracks. Master’s Thesis, Blekinge Institute of Technology, Karlskrona, Sweden, 2012. [Google Scholar]
- Hýsek, Š.; Gaff, M.; Sikora, A.; Babiak, M. New composite material based on winter rapeseed and his elasticity properties as a function of selected factors. Compos. Part B-Eng. 2018, 153, 108–116. [Google Scholar] [CrossRef]
- Požgaj, A.; Chovanec, D.; Kurjatko, S.; Babiak, M. Štruktúra a Vlastnosti Dreva. In Structure and Properties of Wood; Príroda: Bratislava, Slovakia, 1997. [Google Scholar]
- Gaff, M.; Gašparík, M.; Borůvka, V.; Haviarová, E. Stress simulation in layered wood-based materials under mechanical loading. Mater. Des. 2015, 87, 1065–1071. [Google Scholar] [CrossRef]
- European Committee for Standardization, Wood-Based Panels. EN 310: Determination of Modulus of Elasticity in Bending and of Bending Strength; European Committee for Standardization: Brussels, Belgium, 1993. [Google Scholar]
- International Organization for Standardization. ISO 13061-1: Physical and Mechanical Properties of Wood—Test Methods for Small Clear Wood Specimens—Part 1: Determination of Moisture Content for Physical and Mechanical Tests; International Organization for Standardization: Geneva, Switzerland, 2014. [Google Scholar]
- International Organization for Standardization. ISO 13061-2: Physical and Mechanical Properties of Wood—Test Methods for Small Clear Wood Specimens—Part 2: Determination of Density for Physical and Mechanical Tests; International Organization for Standardization: Geneva, Switzerland, 2014. [Google Scholar]
Figure 1.
Bending geometry.

Figure 2.
Categorization of test specimens.

Figure 3.
Principle of the three-point bending test [33].
Figure 3.
Principle of the three-point bending test [33].

Figure 4.
KbendC in case of aspen.

Figure 5.
KbendC in case of beech.

Figure 6.
KbendB in case of aspen.

Figure 7.
KbendB in case of beech.


Table 1.
Values of bending characteristics and the coefficients of variance of layered aspen material.
Table 1.
Values of bending characteristics and the coefficients of variance of layered aspen material.
| WS | NWC | Location | Glue | T (mm) | Code of Test Sample | KbendC | KbendB | RminC (mm) | RminB (mm) |
|---|---|---|---|---|---|---|---|---|---|
| A | CA | U | PUR | 6 | A-CA-U-PUR-6 | 0.014 | 0.012 | 519.28 | 717.76 |
| (17.0) | (13.5) | (9.4) | (11.9) | ||||||
| A | CA | U | PUR | 10 | A-CA-U-PUR-10 | 0.024 | 0.015 | 526.38 | 693.13 |
| (13.3) | (16.8) | (14.9) | (20.4) | ||||||
| A | CA | U | PUR | 18 | A-CA-U-PUR-18 | 0.012 | 0.007 | 1616.03 | 2448.28 |
| (8.4) | (7.8) | (14.7) | (13.5) | ||||||
| A | CA | U | PVAc | 6 | A-CA-U-PVAc-6 | 0.039 | 0.026 | 150.72 | 227.08 |
| (4.1) | (4.1) | (3.3) | (3.3) | ||||||
| A | CA | U | PVAc | 10 | A-CA-U-PVAc-10 | 0.034 | 0.023 | 280.19 | 406.81 |
| (5.0) | (5.1) | (12.0) | (17.0) | ||||||
| A | CA | U | PVAc | 18 | A-CA-U-PVAc-18 | 0.013 | 0.008 | 1279.40 | 1651.62 |
| (14.0) | (13.6) | (15.5) | (11.4) | ||||||
| A | LA | U | PUR | 6 | A-LA-U-PUR-6 | 0.031 | 0.021 | 159.95 | 238.00 |
| (11.3) | (17.5) | (14.3) | (18.0) | ||||||
| A | LA | U | PUR | 10 | A-LA-U-PUR-10 | 0.024 | 0.015 | 511.83 | 671.01 |
| (16.0) | (14.4) | (18.5) | (16.6) | ||||||
| A | LA | U | PUR | 18 | A-LA-U-PUR-18 | 0.015 | 0.010 | 1233.71 | 1848.16 |
| (17.2) | (17.2) | (14.0) | (14.0) | ||||||
| A | LA | U | PVAc | 6 | A-LA-U-PVAc-6 | 0.043 | 0.028 | 134.11 | 202.81 |
| (14.7) | (14.1) | (11.4) | (11.0) | ||||||
| A | LA | U | PVAc | 10 | A-LA-U-PVAc-10 | 0.022 | 0.015 | 401.48 | 628.74 |
| (11.3) | (17.6) | (10.8) | (9.6) | ||||||
| A | LA | U | PVAc | 18 | A-LA-U-PVAc-18 | 0.016 | 0.011 | 1220.28 | 1688.32 |
| (10.3) | (8.9) | (10.8) | (13.4) | ||||||
| A | CA | D | PUR | 6 | A-CA-D-PUR-6 | 0.026 | 0.019 | 248.51 | 355.31 |
| (19.4) | (17.9) | (19.1) | (16.0) | ||||||
| A | CA | D | PUR | 10 | A-CA-D-PUR-10 | 0.022 | 0.014 | 379.73 | 570.20 |
| (17.9) | (15.4) | (18.4) | (18.3) | ||||||
| A | CA | D | PUR | 18 | A-CA-D-PUR-18 | 0.020 | 0.013 | 878.98 | 1365.45 |
| (19.6) | (20.4) | (13.2) | (18.2) | ||||||
| A | CA | D | PVAc | 6 | A-CA-D-PVAc-6 | 0.036 | 0.026 | 165.21 | 253.26 |
| (19.2) | (21.0) | (11.8) | (7.4) | ||||||
| A | CA | D | PVAc | 10 | A-CA-D-PVAc-10 | 0.037 | 0.024 | 280.82 | 427.67 |
| (15.7) | (15.3) | (16.4) | (15.8) | ||||||
| A | CA | D | PVAc | 18 | A-CA-D-PVAc-18 | 0.024 | 0.014 | 884.80 | 1454.81 |
| (17.2) | (18.3) | (12.0) | (11.9) | ||||||
| A | LA | D | PUR | 6 | A-LA-D-PUR-6 | 0.031 | 0.024 | 144.14 | 218.42 |
| (15.6) | (20.4) | (15.0) | (14.7) | ||||||
| A | LA | D | PUR | 10 | A-LA-D-PUR-10 | 0.032 | 0.021 | 330.58 | 495.74 |
| (16.5) | (16.3) | (16.3) | (16.2) | ||||||
| A | LA | D | PUR | 18 | A-LA-D-PUR-18 | 0.028 | 0.019 | 670.60 | 1004.97 |
| (18.7) | (18.5) | (21.4) | (21.3) | ||||||
| A | LA | D | PVAc | 6 | A-LA-D-PVAc-6 | 0.036 | 0.027 | 143.00 | 225.48 |
| (7.2) | (12.1) | (14.7) | (15.4) | ||||||
| A | LA | D | PVAc | 10 | A-LA-D-PVAc-10 | 0.027 | 0.018 | 402.30 | 602.38 |
| (16.6) | (16.5) | (18.6) | (18.5) | ||||||
| A | LA | D | PVAc | 18 | A-LA-D-PVAc-18 | 0.023 | 0.014 | 886.44 | 1322.03 |
| (19.2) | (19.9) | (17.9) | (18.0) |
WS—wood species; NWC—non-wood component; T—thickness; KbendC—bending coefficient based on simple bending equations; KbendB—bending coefficient based on bending geometry; RminC—minimum bend radius based on simple bending equations; RminB—minimum bend radius based on bending geometry; A—aspen; CA—carbon; LA—glass fiber; U—top; D—bottom.
Table 2.
Average values of bending characteristics and the coefficients of variance of layered beech material.
Table 2.
Average values of bending characteristics and the coefficients of variance of layered beech material.
| WS | NWC | Location | Glue | T (mm) | Code of Test Sample | KbendC | KbendB | RminC (mm) | RminB (mm) |
|---|---|---|---|---|---|---|---|---|---|
| B | CA | U | PUR | 6 | B-CA-U-PUR-6 | 0.024 | 0.016 | 231.20 | 340.25 |
| (17.6) | (17.6) | (12.9) | (8.4) | ||||||
| B | CA | U | PUR | 10 | B-CA-U-PUR-10 | 0.026 | 0.017 | 459.30 | 663.96 |
| (15.4) | (18.6) | (20.7) | (17.4) | ||||||
| B | CA | U | PUR | 18 | B-CA-U-PUR-18 | 0.011 | 0.006 | 2262.89 | 3288.95 |
| (6.0) | (19.4) | (18.2) | (16.4) | ||||||
| B | CA | U | PVAc | 6 | B-CA-U-PVAc-6 | 0.037 | 0.024 | 153.98 | 232.03 |
| (9.1) | (8.8) | (8.9) | (8.7) | ||||||
| B | CA | U | PVAc | 10 | B-CA-U-PVAc-10 | 0.031 | 0.021 | 354.65 | 531.16 |
| (9.6) | (9.6) | (9.5) | (9.5) | ||||||
| B | CA | U | PVAc | 18 | B-CA-U-PVAc-18 | 0.014 | 0.009 | 1416.71 | 1804.00 |
| (16.9) | (9.7) | (12.4) | (21.0) | ||||||
| B | LA | U | PUR | 6 | B-LA-U-PUR-6 | 0.044 | 0.030 | 134.43 | 169.19 |
| (5.1) | (0.8) | (11.2) | (8.5) | ||||||
| B | LA | U | PUR | 10 | B-LA-U-PUR-10 | 0.025 | 0.016 | 439.62 | 657.95 |
| (16.4) | (16.3) | (18.5) | (18.4) | ||||||
| B | LA | U | PUR | 18 | B-LA-U-PUR-18 | 0.008 | 0.005 | 2442.86 | 3391.53 |
| (19.3) | (17.2) | (20.3) | (14.3) | ||||||
| B | LA | U | PVAc | 6 | B-LA-U-PVAc-6 | 0.033 | 0.022 | 168.33 | 253.25 |
| (5.6) | (5.5) | (4.7) | (4.6) | ||||||
| B | LA | U | PVAc | 10 | B-LA-U-PVAc-10 | 0.032 | 0.022 | 317.76 | 476.68 |
| (11.8) | (10.8) | (16.7) | (16.4) | ||||||
| B | LA | U | PVAc | 18 | B-LA-U-PVAc-18 | 0.013 | 0.008 | 1451.32 | 2171.66 |
| (19.2) | (19.2) | (18.4) | (18.4) | ||||||
| B | CA | D | PUR | 6 | B-CA-D-PUR-6 | 0.034 | 0.023 | 166.27 | 250.18 |
| (7.7) | (7.6) | (8.6) | (8.4) | ||||||
| B | CA | D | PUR | 10 | B-CA-D-PUR-10 | 0.025 | 0.015 | 427.22 | 644.19 |
| (17.9) | (17.9) | (18.8) | (18.5) | ||||||
| B | CA | D | PUR | 18 | B-CA-D-PUR-18 | 0.015 | 0.015 | 1232.78 | 1488.03 |
| (12.3) | (18.5) | (15.1) | (17.2) | ||||||
| B | CA | D | PVAc | 6 | B-CA-D-PVAc-6 | 0.042 | 0.028 | 135.40 | 204.75 |
| (14.0) | (13.6) | (12.5) | (12.2) | ||||||
| B | CA | D | PVAc | 10 | B-CA-D-PVAc-10 | 0.030 | 0.021 | 296.37 | 489.47 |
| (14.9) | (19.5) | (16.9) | (19.4) | ||||||
| B | CA | D | PVAc | 18 | B-CA-D-PVAc-18 | 0.021 | 0.014 | 793.45 | 1248.23 |
| (18.9) | (18.8) | (18.4) | (11.0) | ||||||
| B | LA | D | PUR | 6 | B-LA-D-PUR-6 | 0.046 | 0.030 | 105.94 | 162.18 |
| (7.4) | (7.0) | (7.5) | (7.0) | ||||||
| B | LA | D | PUR | 10 | B-LA-D-PUR-10 | 0.024 | 0.015 | 426.66 | 683.36 |
| (13.0) | (17.9) | (13.0) | (19.0) | ||||||
| B | LA | D | PUR | 18 | B-LA-D-PUR-18 | 0.026 | 0.016 | 663.54 | 1209.10 |
| (18.4) | (16.7) | (18.5) | (14.0) | ||||||
| B | LA | D | PVAc | 6 | B-LA-D-PVAc-6 | 0.035 | 0.023 | 160.41 | 241.58 |
| (8.5) | (8.3) | (7.9) | (7.7) | ||||||
| B | LA | D | PVAc | 10 | B-LA-D-PVAc-10 | 0.034 | 0.024 | 296.34 | 459.85 |
| (19.3) | (13.5) | (19.6) | (13.9) | ||||||
| B | LA | D | PVAc | 18 | B-LA-D-PVAc-18 | 0.033 | 0.022 | 526.61 | 795.58 |
| (17.3) | (17.0) | (16.3) | (16.4) |
WS—wood species; NWC—non-wood component; T—thickness; KbendC—bending coefficient based on simple bending equations; KbendB—bending coefficient based on bending geometry; RminC—minimum bend radius based on simple bending equations; RminB—minimum bend radius based on bending geometry; B—beech; CA—carbon; LA—glass fiber; U—top; D—bottom.
Table 3.
Statistical evaluation of the effect of the factors and their interaction on the coefficient of wood bendability (KbendC) for aspen and non-wood component (NWC) on the bottom.
Table 3.
Statistical evaluation of the effect of the factors and their interaction on the coefficient of wood bendability (KbendC) for aspen and non-wood component (NWC) on the bottom.
| Monitored Factor | Sum of Squares | Degrees of Freedom | Variance | Fisher’s F-Test | Significance Level |
|---|---|---|---|---|---|
| Intercept | 0.101015 | 1 | 0.101015 | 4182.484 | *** |
| 1) Type of Sample | 0.003778 | 11 | 0.000343 | 14.220 | *** |
| Error | 0.002608 | 108 | 0.000024 |
NS—not significant, ***—significant at p < 0.005.
Table 4.
Statistical evaluation of the effect of the factors and their interaction on the coefficient of wood bendability (KbendC) for aspen and NWC on top.
Table 4.
Statistical evaluation of the effect of the factors and their interaction on the coefficient of wood bendability (KbendC) for aspen and NWC on top.
| Monitored Factor | Sum of Squares | Degrees of Freedom | Variance | Fisher’s F-Test | Significance Level |
|---|---|---|---|---|---|
| Intercept | 0.058817 | 1 | 0.058817 | 5814.366 | *** |
| 1) Type of Sample | 0.010364 | 11 | 0.000942 | 93.141 | *** |
| Error | 0.001022 | 101 | 0.000010 |
NS—not significant, ***—significant at p < 0.005.
Table 5.
Statistical evaluation of the effect of the factors and their interaction on the coefficient of wood bendability (KbendC) for beech and NWC on the bottom.
Table 5.
Statistical evaluation of the effect of the factors and their interaction on the coefficient of wood bendability (KbendC) for beech and NWC on the bottom.
| Monitored Factor | Sum of Squares | Degrees of Freedom | Variance | Fisher’s F-Test | Significance Level |
|---|---|---|---|---|---|
| Intercept | 0.114036 | 1 | 0.114036 | 5587.265 | *** |
| 1) Type of Sample | 0.008469 | 11 | 0.000770 | 37.724 | *** |
| Error | 0.002204 | 108 | 0.000020 |
NS—not significant, ***—significant at p < 0.005.
Table 6.
Statistical evaluation of the effect of the factors and their interaction on the coefficient of wood bendability (KbendC) for beech and NWC on top.
Table 6.
Statistical evaluation of the effect of the factors and their interaction on the coefficient of wood bendability (KbendC) for beech and NWC on top.
| Monitored Factor | Sum of Squares | Degrees of Freedom | Variance | Fisher’s F-Test | Significance Level |
|---|---|---|---|---|---|
| Intercept | 0.055837 | 1 | 0.055837 | 5566.564 | *** |
| 1) Type of Sample | 0.011935 | 11 | 0.001085 | 108.163 | *** |
| Error | 0.001144 | 114 | 0.000010 |
NS—not significant, ***—significant at p < 0.005.
Table 7.
Statistical evaluation of the effect of the factors and their interaction on the coefficient of wood bendability (KbendB) for aspen and NWC on the bottom.
Table 7.
Statistical evaluation of the effect of the factors and their interaction on the coefficient of wood bendability (KbendB) for aspen and NWC on the bottom.
| Monitored Factor | Sum of Squares | Degrees of Freedom | Variance | Fisher’s F-Test | Significance Level |
|---|---|---|---|---|---|
| Intercept | 0.046953 | 1 | 0.046953 | 3654.379 | *** |
| 1) Type of Sample | 0.002775 | 11 | 0.000252 | 19.633 | *** |
| Error | 0.001388 | 108 | 0.000013 |
NS—not significant, ***—significant at p < 0.005.
Table 8.
Statistical evaluation of the effect of the factors and their interaction on the coefficient of wood bendability (KbendB) for aspen and NWC on top.
Table 8.
Statistical evaluation of the effect of the factors and their interaction on the coefficient of wood bendability (KbendB) for aspen and NWC on top.
| Monitored Factor | Sum of Squares | Degrees of Freedom | Variance | Fisher’s F-Test | Significance Level |
|---|---|---|---|---|---|
| Intercept | 0.026766 | 1 | 0.026766 | 5122.907 | *** |
| 1) Type of Sample | 0.004369 | 11 | 0.000397 | 76.012 | *** |
| Error | 0.000528 | 101 | 0.000005 |
NS—not significant, ***—significant at p < 0.005.
Table 9.
Statistical evaluation of the effect of the factors and their interaction on the coefficient of wood bendability (KbendB) for beech and NWC on the bottom.
Table 9.
Statistical evaluation of the effect of the factors and their interaction on the coefficient of wood bendability (KbendB) for beech and NWC on the bottom.
| Monitored Factor | Sum of Squares | Degrees of Freedom | Variance | Fisher’s F-Test | Significance Level |
|---|---|---|---|---|---|
| Intercept | 0.052061 | 1 | 0.052061 | 5814.871 | *** |
| 1) Type of Sample | 0.003206 | 11 | 0.000291 | 32.553 | *** |
| Error | 0.000967 | 108 | 0.000009 |
NS—not significant, ***—significant at p < 0.005.
Table 10.
Statistical evaluation of the effect of the factors and their interaction on the coefficient of wood bendability (KbendB) for beech and NWC on top.
Table 10.
Statistical evaluation of the effect of the factors and their interaction on the coefficient of wood bendability (KbendB) for beech and NWC on top.
| Monitored Factor | Sum of Squares | Degrees of Freedom | Variance | Fisher’s F-Test | Significance Level |
|---|---|---|---|---|---|
| Intercept | 0.024553 | 1 | 0.024553 | 5158.266 | *** |
| 1) Type of Sample | 0.005388 | 11 | 0.000490 | 102.915 | *** |
| Error | 0.000543 | 114 | 0.000005 |
NS—not significant, ***—significant at p < 0.005.
Table 11.
Statistical evaluation of the effect of the factors and their interaction on the minimum bend radius at the yield point (RminC) for aspen and NWC on the bottom.
Table 11.
Statistical evaluation of the effect of the factors and their interaction on the minimum bend radius at the yield point (RminC) for aspen and NWC on the bottom.
| Monitored Factor | Sum of Squares | Degrees of Freedom | Variance | Fisher’s F-Test | Significance Level |
|---|---|---|---|---|---|
| Intercept | 24436158 | 1 | 24436158 | 3264.754 | *** |
| 1) Type of Sample | 9717956 | 11 | 883451 | 118.032 | *** |
| Error | 808363 | 108 | 7485 |
NS—not significant, ***—significant at p < 0.005.
Table 12.
Statistical evaluation of the effect of the factors and their interaction on the minimum bend radius at the yield point (RminC) for aspen and NWC on top.
Table 12.
Statistical evaluation of the effect of the factors and their interaction on the minimum bend radius at the yield point (RminC) for aspen and NWC on top.
| Monitored Factor | Sum of Squares | Degrees of Freedom | Variance | Fisher’s F-Test | Significance Level |
|---|---|---|---|---|---|
| Intercept | 44421882 | 1 | 44421882 | 2710.337 | *** |
| 1) Type of Sample | 28160468 | 11 | 2560043 | 156.197 | *** |
| Error | 1655370 | 101 | 16390 |
NS—not significant, ***—significant at p < 0.005.
Table 13.
Statistical evaluation of the effect of the factors and their interaction on the minimum bend radius at the yield point (RminC) for beech and NWC on the bottom.
Table 13.
Statistical evaluation of the effect of the factors and their interaction on the minimum bend radius at the yield point (RminC) for beech and NWC on the bottom.
| Monitored Factor | Sum of Squares | Degrees of Freedom | Variance | Fisher’s F-Test | Significance Level |
|---|---|---|---|---|---|
| Intercept | 22802737 | 1 | 22802737 | 2892.018 | *** |
| 1) Type of Sample | 12097814 | 11 | 1099801 | 139.485 | *** |
| Error | 851549 | 108 | 7885 |
NS—not significant, ***—significant at p < 0.005.
Table 14.
Statistical evaluation of the effect of the factors and their interaction on the minimum bend radius at the yield point (RminC) for beech and NWC on top.
Table 14.
Statistical evaluation of the effect of the factors and their interaction on the minimum bend radius at the yield point (RminC) for beech and NWC on top.
| Monitored Factor | Sum of Squares | Degrees of Freedom | Variance | Fisher’s F-Test | Significance Level |
|---|---|---|---|---|---|
| Intercept | 58491893 | 1 | 58491893 | 1178.097 | *** |
| 1) Type of Sample | 81191097 | 11 | 7381009 | 148.662 | *** |
| Error | 5660040 | 114 | 49649 |
NS—not significant, ***—significant at p < 0.005.
Table 15.
Statistical evaluation of the effect of the factors and their interaction on the minimum bend radius at the yield point (RminB) for aspen and NWC on the bottom.
Table 15.
Statistical evaluation of the effect of the factors and their interaction on the minimum bend radius at the yield point (RminB) for aspen and NWC on the bottom.
| Monitored Factor | Sum of Squares | Degrees of Freedom | Variance | Fisher’s F-Test | Significance Level |
|---|---|---|---|---|---|
| Intercept | 57349324 | 1 | 57349324 | 2933.356 | *** |
| 1) Type of Sample | 24093243 | 11 | 2190295 | 112.031 | *** |
| Error | 2111481 | 108 | 19551 |
NS—not significant, ***—significant at p < 0.005.
Table 16.
Statistical evaluation of the effect of the factors and their interaction on the minimum bend radius at the yield point (RminB) for aspen and NWC on top.
Table 16.
Statistical evaluation of the effect of the factors and their interaction on the minimum bend radius at the yield point (RminB) for aspen and NWC on top.
| Monitored Factor | Sum of Squares | Degrees of Freedom | Variance | Fisher’s F-Test | Significance Level |
|---|---|---|---|---|---|
| Intercept | 89797468 | 1 | 89797468 | 2744.915 | *** |
| 1) Type of Sample | 61286334 | 11 | 5571485 | 170.308 | *** |
| Error | 3304126 | 101 | 32714 |
NS—not significant, ***—significant at p < 0.005.
Table 17.
Statistical evaluation of the effect of the factors and their interaction on the minimum bend radius at the yield point (RminB) for beech and NWC on the bottom.
Table 17.
Statistical evaluation of the effect of the factors and their interaction on the minimum bend radius at the yield point (RminB) for beech and NWC on the bottom.
| Monitored Factor | Sum of Squares | Degrees of Freedom | Variance | Fisher’s F-Test | Significance Level |
|---|---|---|---|---|---|
| Intercept | 51699287 | 1 | 51699287 | 2759.401 | *** |
| 1) Type of Sample | 22194201 | 11 | 2017655 | 107.690 | *** |
| Error | 2023455 | 108 | 18736 |
NS—not significant, ***—significant at p < 0.005.
Table 18.
Statistical evaluation of the effect of the factors and their interaction on the minimum bend radius at the yield point (RminB) for beech and NWC on top.
Table 18.
Statistical evaluation of the effect of the factors and their interaction on the minimum bend radius at the yield point (RminB) for beech and NWC on top.
| Monitored Factor | Sum of Squares | Degrees of Freedom | Variance | Fisher’s F-Test | Significance Level |
|---|---|---|---|---|---|
| Intercept | 118241938 | 1 | 118241938 | 1681.398 | *** |
| 1) Type of Sample | 159214450 | 11 | 14474041 | 205.821 | *** |
| Error | 8016889 | 114 | 70324 |
NS—not significant, ***—significant at p < 0.005.
Table 19.
Comparison of the effects of individual factors using Duncan’s test on the coefficient of bendability (KbendC) for aspen and NWC on the bottom.
Table 19.
Comparison of the effects of individual factors using Duncan’s test on the coefficient of bendability (KbendC) for aspen and NWC on the bottom.
| No. | Type of Sample | (1) | (2) | (3) | (4) | (5) | (6) | (7) | (8) | (9) | (10) | (11) | (12) |
|---|---|---|---|---|---|---|---|---|---|---|---|---|---|
| 0.026 | 0.022 | 0.020 | 0.036 | 0.037 | 0.024 | 0.031 | 00.32 | 0.028 | 0.036 | 0.027 | 0.023 | ||
| 1. | A-CA-D-PUR-6 | ||||||||||||
| 2. | A-CA-D-PUR-10 | 0.048 | |||||||||||
| 3. | A-CA-D-PUR-18 | 0.007 | 0.414 | ||||||||||
| 4. | A-CA-D-PVAc-6 | 0.000 | 0.000 | 0.000 | |||||||||
| 5. | A-CA-D-PVAc-10 | 0.000 | 0.000 | 0.000 | 0.973 | ||||||||
| 6. | A-CA-D-PVAc-18 | 0.261 | 0.331 | 0.092 | 0.000 | 0.000 | |||||||
| 7. | A-LA-D-PUR-6 | 0.049 | 0.000 | 0.000 | 0.032 | 0.035 | 0.003 | ||||||
| 8. | A-LA-D-PUR-10 | 0.016 | 0.000 | 0.000 | 0.085 | 0.096 | 0.001 | 0.595 | |||||
| 9. | A-LA-D-PUR-18 | 0.445 | 0.008 | 0.001 | 0.001 | 0.001 | 0.077 | 0.182 | 0.078 | ||||
| 10. | A-LA-D-PVAc-6 | 0.000 | 0.000 | 0.000 | 0.943 | 0.965 | 0.000 | 0.036 | 0.100 | 0.001 | |||
| 11. | A-LA-D-PVAc-10 | 0.895 | 0.040 | 0.005 | 0.000 | 0.000 | 0.238 | 0.057 | 0.019 | 0.494 | 0.000 | ||
| 12. | A-LA-D-PVAc-18 | 0.213 | 0.403 | 0.120 | 0.000 | 0.000 | 0.840 | 0.002 | 0.000 | 0.056 | 0.000 | 0.187 |
Table 20.
Comparison of the effects of individual factors using Duncan’s test on the coefficient of bendability (KbendC) for aspen and NWC on top.
Table 20.
Comparison of the effects of individual factors using Duncan’s test on the coefficient of bendability (KbendC) for aspen and NWC on top.
| No. | Type of Sample | (1) | (2) | (3) | (4) | (5) | (6) | (7) | (8) | (9) | (10) | (11) | (12) |
|---|---|---|---|---|---|---|---|---|---|---|---|---|---|
| 0.014 | 0.024 | 0.012 | 0.039 | 0.034 | 0.013 | 0.031 | 0.024 | 0.015 | 0.043 | 0.022 | 0.016 | ||
| 1. | A-CA-U-PUR-6 | ||||||||||||
| 2. | A-CA-U-PUR-10 | 0.000 | |||||||||||
| 3. | A-CA-U-PUR-18 | 0.198 | 0.000 | ||||||||||
| 4. | A-CA-U-PVAc-6 | 0.000 | 0.000 | 0.000 | |||||||||
| 5. | A-CA-U-PVAc-10 | 0.000 | 0.000 | 0.000 | 0.002 | ||||||||
| 6. | A-CA-U-PVAc-18 | 0.886 | 0.000 | 0.221 | 0.000 | 0.000 | |||||||
| 7. | A-LA-U-PUR-6 | 0.000 | 0.000 | 0.000 | 0.000 | 0.075 | 0.000 | ||||||
| 8. | A-LA-U-PUR-10 | 0.000 | 0.935 | 0.000 | 0.000 | 0.000 | 0.000 | 0.000 | |||||
| 9. | A-LA-U-PUR-18 | 0.603 | 0.000 | 0.086 | 0.000 | 0.000 | 0.535 | 0.000 | 0.000 | ||||
| 10. | A-LA-U-PVAc-6 | 0.000 | 0.000 | 0.000 | 0.011 | 0.000 | 0.000 | 0.000 | 0.000 | 0.000 | |||
| 11. | A-LA-U-PVAc-10 | 0.000 | 0.242 | 0.000 | 0.000 | 0.000 | 0.000 | 0.000 | 0.240 | 0.000 | 0.000 | ||
| 12. | A-LA-U-PVAc-18 | 0.264 | 0.000 | 0.022 | 0.000 | 0.000 | 0.228 | 0.000 | 0.000 | 0.502 | 0.000 | 0.000 |
Table 21.
Comparison of the effects of individual factors using Duncan’s test on the coefficient of bendability (KbendC) for beech and NWC on the bottom.
Table 21.
Comparison of the effects of individual factors using Duncan’s test on the coefficient of bendability (KbendC) for beech and NWC on the bottom.
| No. | Type of Sample | (1) | (2) | (3) | (4) | (5) | (6) | (7) | (8) | (9) | (10) | (11) | (12) |
|---|---|---|---|---|---|---|---|---|---|---|---|---|---|
| 0.034 | 0.025 | 0.015 | 0.042 | 0.030 | 0.021 | 0.046 | 0.024 | 0.026 | 0.035 | 0.034 | 0.033 | ||
| 1. | B-CA-D-PUR-6 | ||||||||||||
| 2. | B-CA-D-PUR-10 | 0.000 | |||||||||||
| 3. | B-CA-D-PUR-18 | 0.000 | 0.000 | ||||||||||
| 4. | B-CA-D-PVAc-6 | 0.000 | 0.000 | 0.000 | |||||||||
| 5. | B-CA-D-PVAc-10 | 0.029 | 0.032 | 0.000 | 0.000 | ||||||||
| 6. | B-CA-D-PVAc-18 | 0.000 | 0.042 | 0.009 | 0.000 | 0.000 | |||||||
| 7. | B-LA-D-PUR-6 | 0.000 | 0.000 | 0.000 | 0.107 | 0.000 | 0.000 | ||||||
| 8. | B-LA-D-PUR-10 | 0.000 | 0.655 | 0.000 | 0.000 | 0.012 | 0.089 | 0.000 | |||||
| 9. | B-LA-D-PUR-18 | 0.000 | 0.702 | 0.000 | 0.000 | 0.061 | 0.020 | 0.000 | 0.438 | ||||
| 10. | B-LA-D-PVAc-6 | 0.861 | 0.000 | 0.000 | 0.000 | 0.025 | 0.000 | 0.000 | 0.000 | 0.000 | |||
| 11. | B-LA-D-PVAc-10 | 0.910 | 0.000 | 0.000 | 0.000 | 0.027 | 0.000 | 0.000 | 0.000 | 0.000 | 0.941 | ||
| 12. | B-LA-D-PVAc-18 | 0.592 | 0.000 | 0.000 | 0.000 | 0.078 | 0.000 | 0.000 | 0.000 | 0.001 | 0.516 | 0.544 |
Table 22.
Comparison of the effects of individual factors using Duncan’s test on the coefficient of bendability (KbendC) for beech and NWC on top.
Table 22.
Comparison of the effects of individual factors using Duncan’s test on the coefficient of bendability (KbendC) for beech and NWC on top.
| No. | Type of Sample | (1) | (2) | (3) | (4) | (5) | (6) | (7) | (8) | (9) | (10) | (11) | (12) |
|---|---|---|---|---|---|---|---|---|---|---|---|---|---|
| 0.024 | 0.026 | 0.011 | 0.037 | 0.031 | 0.014 | 0.044 | 0.025 | 0.008 | 0.033 | 0.032 | 0.013 | ||
| 1. | B-CA-U-PUR-6 | ||||||||||||
| 2. | B-CA-U-PUR-10 | 0.174 | |||||||||||
| 3. | B-CA-U-PUR-18 | 0.000 | 0.000 | ||||||||||
| 4. | B-CA-U-PVAc-6 | 0.000 | 0.000 | 0.000 | |||||||||
| 5. | B-CA-U-PVAc-10 | 0.000 | 0.006 | 0.000 | 0.001 | ||||||||
| 6. | B-CA-U-PVAc-18 | 0.000 | 0.000 | 0.062 | 0.000 | 0.000 | |||||||
| 7. | B-LA-U-PUR-6 | 0.000 | 0.000 | 0.000 | 0.000 | 0.000 | 0.000 | ||||||
| 8. | B-LA-U-PUR-10 | 0.689 | 0.296 | 0.000 | 0.000 | 0.000 | 0.000 | 0.000 | |||||
| 9. | B-LA-U-PUR-18 | 0.000 | 0.000 | 0.060 | 0.000 | 0.000 | 0.000 | 0.000 | 0.000 | ||||
| 10. | B-LA-U-PVAc-6 | 0.000 | 0.000 | 0.000 | 0.017 | 0.304 | 0.000 | 0.000 | 0.000 | 0.000 | |||
| 11. | B-LA-U-PVAc-10 | 0.000 | 0.001 | 0.000 | 0.005 | 0.581 | 0.000 | 0.000 | 0.000 | 0.000 | 0.585 | ||
| 12. | B-LA-U-PVAc-18 | 0.000 | 0.000 | 0.313 | 0.000 | 0.000 | 0.333 | 0.000 | 0.000 | 0.006 | 0.000 | 0.000 |
Table 23.
Comparison of the effects of individual factors using Duncan’s test on the coefficient of bendability (KbendB) for aspen and NWC on the bottom.
Table 23.
Comparison of the effects of individual factors using Duncan’s test on the coefficient of bendability (KbendB) for aspen and NWC on the bottom.
| No. | Type of Sample | (1) | (2) | (3) | (4) | (5) | (6) | (7) | (8) | (9) | (10) | (11) | (12) |
|---|---|---|---|---|---|---|---|---|---|---|---|---|---|
| 0.019 | 0.014 | 0.013 | 0.026 | 0.024 | 0.014 | 0.024 | 0.021 | 0.019 | 0.027 | 0.018 | 0.014 | ||
| 1. | A-CA-D-PUR-6 | ||||||||||||
| 2. | A-CA-D-PUR-10 | 0.004 | |||||||||||
| 3. | A-CA-D-PUR-18 | 0.003 | 0.936 | ||||||||||
| 4. | A-CA-D-PVAc-6 | 0.000 | 0.000 | 0.000 | |||||||||
| 5. | A-CA-D-PVAc-10 | 0.004 | 0.000 | 0.000 | 0.124 | ||||||||
| 6. | A-CA-D-PVAc-18 | 0.003 | 0.996 | 0.937 | 0.000 | 0.000 | |||||||
| 7. | A-LA-D-PUR-6 | 0.005 | 0.000 | 0.000 | 0.105 | 0.859 | 0.000 | ||||||
| 8. | A-LA-D-PUR-10 | 0.112 | 0.000 | 0.000 | 0.005 | 0.153 | 0.000 | 0.181 | |||||
| 9. | A-LA-D-PUR-18 | 0.918 | 0.005 | 0.004 | 0.000 | 0.003 | 0.004 | 0.005 | 0.110 | ||||
| 10. | A-LA-D-PVAc-6 | 0.000 | 0.000 | 0.000 | 0.808 | 0.093 | 0.000 | 0.074 | 0.003 | 0.000 | |||
| 11. | A-LA-D-PVAc-10 | 0.503 | 0.021 | 0.020 | 0.000 | 0.001 | 0.018 | 0.001 | 0.034 | 0.540 | 0.000 | ||
| 12. | A-LA-D-PVAc-18 | 0.005 | 0.844 | 0.795 | 0.000 | 0.000 | 0.837 | 0.000 | 0.000 | 0.006 | 0.000 | 0.022 |
Table 24.
Comparison of the effects of individual factors using Duncan’s test on the coefficient of bendability (KbendB) for aspen and NWC on top.
Table 24.
Comparison of the effects of individual factors using Duncan’s test on the coefficient of bendability (KbendB) for aspen and NWC on top.
| No. | Type of Sample | (1) | (2) | (3) | (4) | (5) | (6) | (7) | (8) | (9) | (10) | (11) | (12) |
|---|---|---|---|---|---|---|---|---|---|---|---|---|---|
| 0.012 | 0.015 | 0.007 | 0.026 | 0.023 | 0.008 | 0.021 | 0.015 | 0.010 | 0.028 | 0.015 | 0.011 | ||
| 1. | A-CA-U-PUR-6 | ||||||||||||
| 2. | A-CA-U-PUR-10 | 0.002 | |||||||||||
| 3. | A-CA-U-PUR-18 | 0.000 | 0.000 | ||||||||||
| 4. | A-CA-U-PVAc-6 | 0.000 | 0.000 | 0.000 | |||||||||
| 5. | A-CA-U-PVAc-10 | 0.000 | 0.000 | 0.000 | 0.005 | ||||||||
| 6. | A-CA-U-PVAc-18 | 0.004 | 0.000 | 0.393 | 0.000 | 0.000 | |||||||
| 7. | A-LA-U-PUR-6 | 0.000 | 0.000 | 0.000 | 0.000 | 0.153 | 0.000 | ||||||
| 8. | A-LA-U-PUR-10 | 0.003 | 0.820 | 0.000 | 0.000 | 0.000 | 0.000 | 0.000 | |||||
| 9. | A-LA-U-PUR-18 | 0.071 | 0.000 | 0.056 | 0.000 | 0.000 | 0.242 | 0.000 | 0.000 | ||||
| 10. | A-LA-U-PVAc-6 | 0.000 | 0.000 | 0.000 | 0.024 | 0.000 | 0.000 | 0.000 | 0.000 | 0.000 | |||
| 11. | A-LA-U-PVAc-10 | 0.002 | 0.997 | 0.000 | 0.000 | 0.000 | 0.000 | 0.000 | 0.810 | 0.000 | 0.000 | ||
| 12. | A-LA-U-PVAc-18 | 0.480 | 0.000 | 0.003 | 0.000 | 0.000 | 0.024 | 0.000 | 0.000 | 0.226 | 0.000 | 0.000 |
Table 25.
Comparison of the effects of individual factors using Duncan’s test on the coefficient of bendability (KbendB) for beech and NWC on the bottom.
Table 25.
Comparison of the effects of individual factors using Duncan’s test on the coefficient of bendability (KbendB) for beech and NWC on the bottom.
| No. | Type of Sample | (1) | (2) | (3) | (4) | (5) | (6) | (7) | (8) | (9) | (10) | (11) | (12) |
|---|---|---|---|---|---|---|---|---|---|---|---|---|---|
| 0.023 | 0.015 | 0.015 | 0.028 | 0.021 | 0.014 | 0.030 | 0.015 | 0.016 | 0.023 | 0.024 | 0.022 | ||
| 1. | B-CA-D-PUR-6 | ||||||||||||
| 2. | B-CA-D-PUR-10 | 0.000 | |||||||||||
| 3. | B-CA-D-PUR-18 | 0.000 | 0.973 | ||||||||||
| 4. | B-CA-D-PVAc-6 | 0.000 | 0.000 | 0.000 | |||||||||
| 5. | B-CA-D-PVAc-10 | 0.455 | 0.000 | 0.000 | 0.000 | ||||||||
| 6. | B-CA-D-PVAc-18 | 0.000 | 0.428 | 0.416 | 0.000 | 0.000 | |||||||
| 7. | B-LA-D-PUR-6 | 0.000 | 0.000 | 0.000 | 0.179 | 0.000 | 0.000 | ||||||
| 8. | B-LA-D-PUR-10 | 0.000 | 0.977 | 0.954 | 0.000 | 0.000 | 0.431 | 0.000 | |||||
| 9. | B-LA-D-PUR-18 | 0.000 | 0.524 | 0.521 | 0.000 | 0.000 | 0.178 | 0.000 | 0.514 | ||||
| 10. | B-LA-D-PVAc-6 | 0.863 | 0.000 | 0.000 | 0.001 | 0.382 | 0.000 | 0.000 | 0.000 | 0.000 | |||
| 11. | B-LA-D-PVAc-10 | 0.291 | 0.000 | 0.000 | 0.007 | 0.087 | 0.000 | 0.000 | 0.000 | 0.000 | 0.340 | ||
| 12. | B-LA-D-PVAc-18 | 0.473 | 0.000 | 0.000 | 0.000 | 0.935 | 0.000 | 0.000 | 0.000 | 0.000 | 0.405 | 0.094 |
Table 26.
Comparison of the effects of individual factors using Duncan’s test on the coefficient of bendability (KbendB) for beech and NWC on top.
Table 26.
Comparison of the effects of individual factors using Duncan’s test on the coefficient of bendability (KbendB) for beech and NWC on top.
| No. | Type of Sample | (1) | (2) | (3) | (4) | (5) | (6) | (7) | (8) | (9) | (10) | (11) | (12) |
|---|---|---|---|---|---|---|---|---|---|---|---|---|---|
| 0.016 | 0.017 | 0.006 | 0.024 | 0.021 | 0.009 | 0.030 | 0.016 | 0.005 | 0.022 | 0.022 | 0.008 | ||
| 1. | B-CA-U-PUR-6 | ||||||||||||
| 2. | B-CA-U-PUR-10 | 0.398 | |||||||||||
| 3. | B-CA-U-PUR-18 | 0.000 | 0.000 | ||||||||||
| 4. | B-CA-U-PVAc-6 | 0.000 | 0.000 | 0.000 | |||||||||
| 5. | B-CA-U-PVAc-10 | 0.000 | 0.002 | 0.000 | 0.003 | ||||||||
| 6. | B-CA-U-PVAc-18 | 0.000 | 0.000 | 0.014 | 0.000 | 0.000 | |||||||
| 7. | B-LA-U-PUR-6 | 0.000 | 0.000 | 0.000 | 0.000 | 0.000 | 0.000 | ||||||
| 8. | B-LA-U-PUR-10 | 0.682 | 0.621 | 0.000 | 0.000 | 0.000 | 0.000 | 0.000 | |||||
| 9. | B-LA-U-PUR-18 | 0.000 | 0.000 | 0.690 | 0.000 | 0.000 | 0.006 | 0.000 | 0.000 | ||||
| 10. | B-LA-U-PVAc-6 | 0.000 | 0.000 | 0.000 | 0.031 | 0.329 | 0.000 | 0.000 | 0.000 | 0.000 | |||
| 11. | B-LA-U-PVAc-10 | 0.000 | 0.000 | 0.000 | 0.032 | 0.303 | 0.000 | 0.000 | 0.000 | 0.000 | 0.902 | ||
| 12. | B-LA-U-PVAc-18 | 0.000 | 0.000 | 0.038 | 0.000 | 0.000 | 0.615 | 0.000 | 0.000 | 0.018 | 0.000 | 0.000 |
© 2019 by the authors. Licensee MDPI, Basel, Switzerland. This article is an open access article distributed under the terms and conditions of the Creative Commons Attribution (CC BY) license (http://creativecommons.org/licenses/by/4.0/).
Share and Cite
MDPI and ACS Style
Svoboda, T.; Sikora, A.; Záborský, V.; Gaffová, Z. Laminated Veneer Lumber with Non-Wood Components and the Effects of Selected Factors on Its Bendability. Forests 2019, 10, 470. https://0-doi-org.brum.beds.ac.uk/10.3390/f10060470
AMA Style
Svoboda T, Sikora A, Záborský V, Gaffová Z. Laminated Veneer Lumber with Non-Wood Components and the Effects of Selected Factors on Its Bendability. Forests. 2019; 10(6):470. https://0-doi-org.brum.beds.ac.uk/10.3390/f10060470
Chicago/Turabian StyleSvoboda, Tomáš, Adam Sikora, Vladimír Záborský, and Zuzana Gaffová. 2019. "Laminated Veneer Lumber with Non-Wood Components and the Effects of Selected Factors on Its Bendability" Forests 10, no. 6: 470. https://0-doi-org.brum.beds.ac.uk/10.3390/f10060470
Note that from the first issue of 2016, this journal uses article numbers instead of page numbers. See further details here.